Fault and test management Siemens MN1783EU11MN_0001 © 2005 Siemens AG 1 Contents 1 Fault and Test Management 3 2 Faults 5 2.1 Alarm, State and Status Change Handling 6 2.2 Monitoring Alarms 11 2.3 Alarm Acknowledgment 16 2.4 BSCE, BTSE and TRAUE Alarm Severity Settings 24 3 Alarm Filtering 26 3.1 BSC Settings 27 3.2 Event Forwarding Discriminator 28 3.3 Configurable Alarm Filtering 30 4 Quality of Service Alarm Handling 41 4.1 Basics 42 4.2 Implementation 44 4.3 RC Handling of QoS alarms 50 5 Test Procedure 61 5.1 Test Types 63 5.2 Testing of Hardware Modules 64 5.3 Automatic Recovery of Faulty Boards BSC-TRAU 68 6 Alarm Log File 75 7 Exercise 79 8 Solution 85 Fault and test management

05 Mn1783eu11mn 0001 Fault Test Management
Dec 01, 2015
Welcome message from author
This document is posted to help you gain knowledge. Please leave a comment to let me know what you think about it! Share it to your friends and learn new things together.
Transcript
Fault and test management Siemens
MN1783EU11MN_0001 © 2005 Siemens AG
1
Contents 1 Fault and Test Management 3 2 Faults 5 2.1 Alarm, State and Status Change Handling 6 2.2 Monitoring Alarms 11 2.3 Alarm Acknowledgment 16 2.4 BSCE, BTSE and TRAUE Alarm Severity Settings 24 3 Alarm Filtering 26 3.1 BSC Settings 27 3.2 Event Forwarding Discriminator 28 3.3 Configurable Alarm Filtering 30 4 Quality of Service Alarm Handling 41 4.1 Basics 42 4.2 Implementation 44 4.3 RC Handling of QoS alarms 50 5 Test Procedure 61 5.1 Test Types 63 5.2 Testing of Hardware Modules 64 5.3 Automatic Recovery of Faulty Boards BSC-TRAU 68 6 Alarm Log File 75 7 Exercise 79 8 Solution 85
Fault and test management

Siemens Fault and test management
MN1783EU11MN_0001© 2005 Siemens AG
2
Fault and test management Siemens
MN1783EU11MN_0001 © 2005 Siemens AG
3
1 Fault and Test Management
Fig. 1

Siemens Fault and test management
MN1783EU11MN_0001© 2005 Siemens AG
4
Fault and test management Siemens
MN1783EU11MN_0001 © 2005 Siemens AG
5
2 Faults
Siemens Fault and test management
MN1783EU11MN_0001© 2005 Siemens AG
6
Fault Management includes all the measures required to detect and repair faults in the mobile communications network. Hardware faults are usually isolated to a particular module and - if redundant units are present - operation is normally switched to another module, which takes over the function of the defective unit. The defective unit can be replaced later. The operator receives information about the probable cause of a problem. In addition, he has access to the online maintenance documentation, which provides further information on how to deal with the fault.
2.1 Alarm, State and Status Change Handling The RC handles alarms and changes of state (i.e. administrative, operational, usage) and status (e.g. stand-by and availability) directly. Alarms are logged in dedicated log tables and the operator can retrieve information about them at any time. Alarm log tables can be administered by the operator, they can be exported for further processing. State and status changes are displayed on the graphical workstation by graphical symbols, colors and animation. The display of the network state and its components is structured in different levels. The upper levels usually contain objects that summarize the state of the lower level objects: the operator is able to examine the state of the elementary objects going across the lower levels. The authorized operator has the possibility to acknowledge object state changes. It is possible to monitor acknowledged alarms and active or just ceased alarms not yet acknowledged. For the whole supervised network the global state of active alarms can be retrieved from the icon AlarmMonitoring in the main Application window.
Fault and test management Siemens
MN1783EU11MN_0001 © 2005 Siemens AG
7
2.1.1 Types of Alarms (Event Types) 1. Communications alarm A Communications alarm is principally associated with the procedures and/or processes required to convey information from one point to another. 2. Quality of service alarm A Quality of service alarm is principally associated with degradation in the quality of a service. 3. Processing error alarm A Processing error alarm is principally associated with software or processing fault. 4. Equipment alarm An Equipment alarm is principally associated with an equipment fault. 5. Environmental alarm An Environmental alarm is principally associated with a condition relating to an enclosure in which the equipment resides.
Siemens Fault and test management
MN1783EU11MN_0001© 2005 Siemens AG
8
2.1.2 Alarm Status The alarm status (ALS) correlates alarm and state information. The alarm status is used as a summary indicator, carrying the highest severity of all failure event reports (FER) emitted by a managed object. The status is shown by colors. Active Status: active minor (yellow) active major (orange) active critical (red) active indeterminate (white) may be active grey (if status unreliable because link is down) An alarm is classified as active if it is outstanding and has a perceived severity level of minor, major, critical or indeterminate (i.e. any severity level except cleared or warning). Cleared Status: cleared minor (yellow) * cleared major (orange) * cleared critical (red) * cleared indeterminate (white) The cleared minor, major and critical states can be green. This is configurable during installation of Radio Commander. Refer to ITMN, Installation and Test Manual.
Fault and test management Siemens
MN1783EU11MN_0001 © 2005 Siemens AG
9
2.1.3 Perceived Severity A Failure Event Report (FER) can be seen as one of the mechanisms to inform Radio Commander about a problem which happened in a network element. One of the most important fields contained in a FER is the perceived severity. This field provides an indication of how the affected network entity perceives that the capability of a managed object has been affected and so how urgent is a corrective action. This parameter defines six severity levels. Those severity levels, which represent service affecting conditions, ordered from most severe to least severe are critical, major, minor, warning and cleared. The severity is an attribute that can be assigned by the Radio Commander for all alarms of a specific managed object class or managed object instance within a network entity. It also has influence on the color of the alarm entries in the Alarm Monitoring List. The levels defined are Critical The critical severity level indicates that a service affecting condition has occurred and an immediate corrective action is required. Such a severity can be reported, for example, when a managed object becomes totally out of service and its capability must be restored. Major The major severity level indicates that a service affecting condition has been discovered and an urgent corrective action is required. Such a severity can be reported, for example, when there is a severe degradation in the capability of the managed object and its full capability must be restored. Minor The minor severity level indicates the existence of a non-service affecting fault condition and that corrective action should be taken in order to prevent a more serious (for example, service affecting) fault. Such a severity can be reported, for example, when the detected alarm condition is not currently degrading the capacity of the managed object.
Siemens Fault and test management
MN1783EU11MN_0001© 2005 Siemens AG
10
Warning The warning severity level indicates the detection of a potential or impending service-affecting fault, before any significant effects happened. Action should be taken to further diagnose (if necessary) and correct the problem in order to prevent it from becoming a more serious service-affecting fault. Cleared The cleared severity level indicates the clearing of one or more previously reported alarms. This alarm clears all alarms for this managed object that have the same Alarm type, Probable cause and Specific problems (if given). Indeterminate The indeterminate severity level indicates that the severity level cannot be determined. This level is not used in SBS.
Fault and test management Siemens
MN1783EU11MN_0001 © 2005 Siemens AG
11
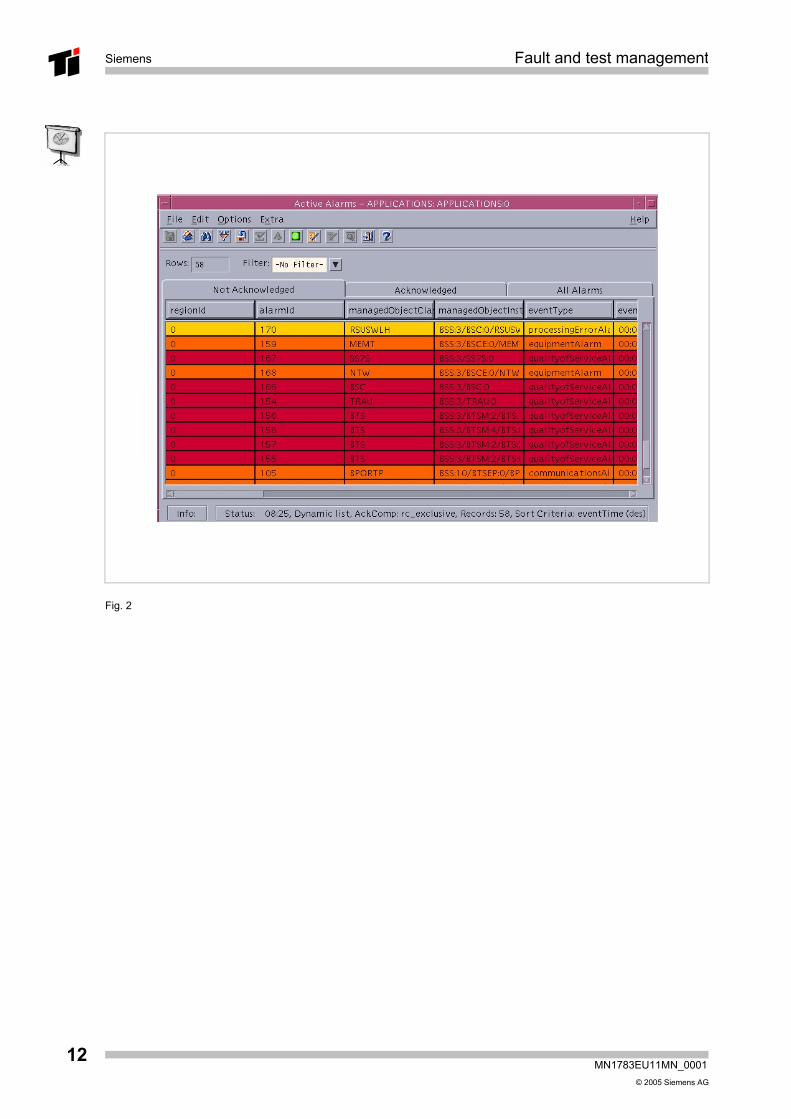
2.2 Monitoring Alarms This procedure shows how to get a view on all active or passive alarms respectively on the active alarm list. The Alarm Monitoring List can be opened in three ways: 1. Via Application Launcher 2. Via single managed object 3. Via summary object The alarm panel will always show active as well ceases alarms. If you select it through the Application Launcher, all alarms, BSS and RC will be logged. By going in to more detail, a single object can also be monitored by either selecting active or ceased alarm monitoring. A summary icon will log all objects in the lower levels. The status of any alarm can be either acknowledged or unacknowledged. By acknowledging an alarm, by the user, the entry is marked and can be seen by other users as an alarm already known. The Alarm list is a dynamic list so anytime a new alarm comes in, the panel will automatically show it. There are three tabs, 1. Not Acknowledge - all alarms, ceased and active 2. Acknowledge - all active acknowledged alarms 3. All - combination of the two mentioned above. You can only see active acknowledged alarms. As soon you acknowledge a ceased alarm, it is removed from the alarm list.
Siemens Fault and test management
MN1783EU11MN_0001© 2005 Siemens AG
12
Fig. 2

Fault and test management Siemens
MN1783EU11MN_0001 © 2005 Siemens AG
13
Fig. 3
Siemens Fault and test management
MN1783EU11MN_0001© 2005 Siemens AG
14
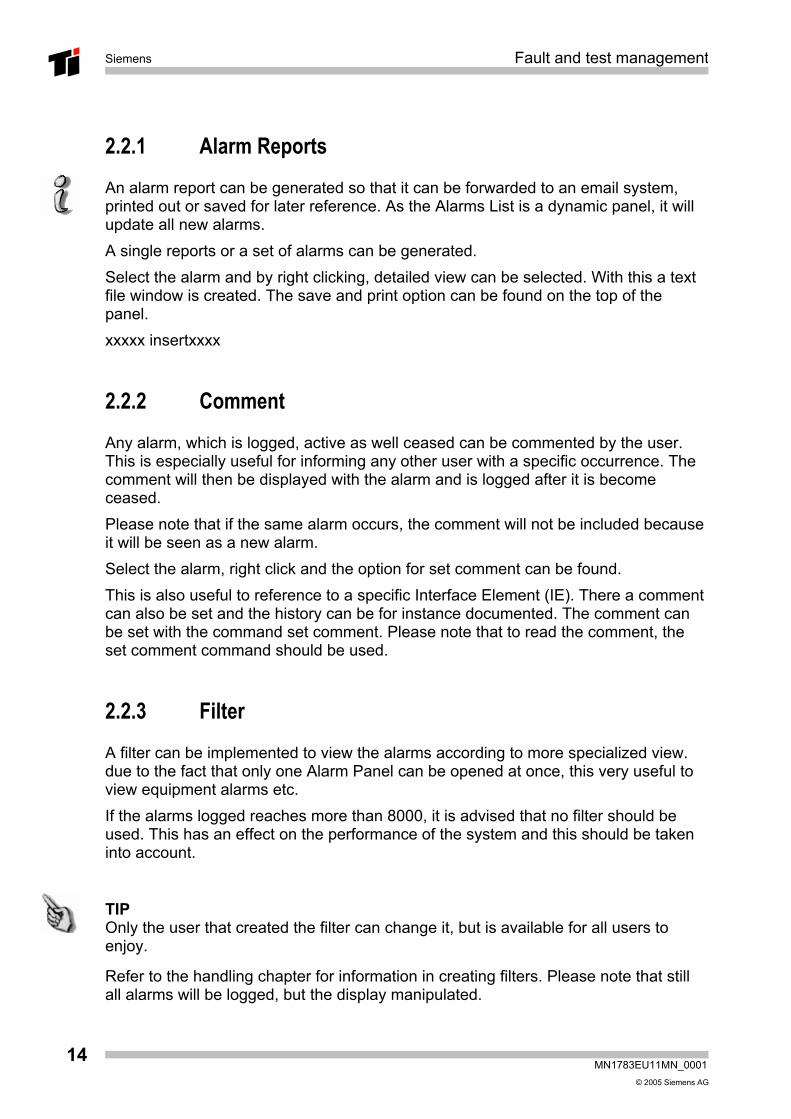
2.2.1 Alarm Reports An alarm report can be generated so that it can be forwarded to an email system, printed out or saved for later reference. As the Alarms List is a dynamic panel, it will update all new alarms. A single reports or a set of alarms can be generated. Select the alarm and by right clicking, detailed view can be selected. With this a text file window is created. The save and print option can be found on the top of the panel. xxxxx insertxxxx
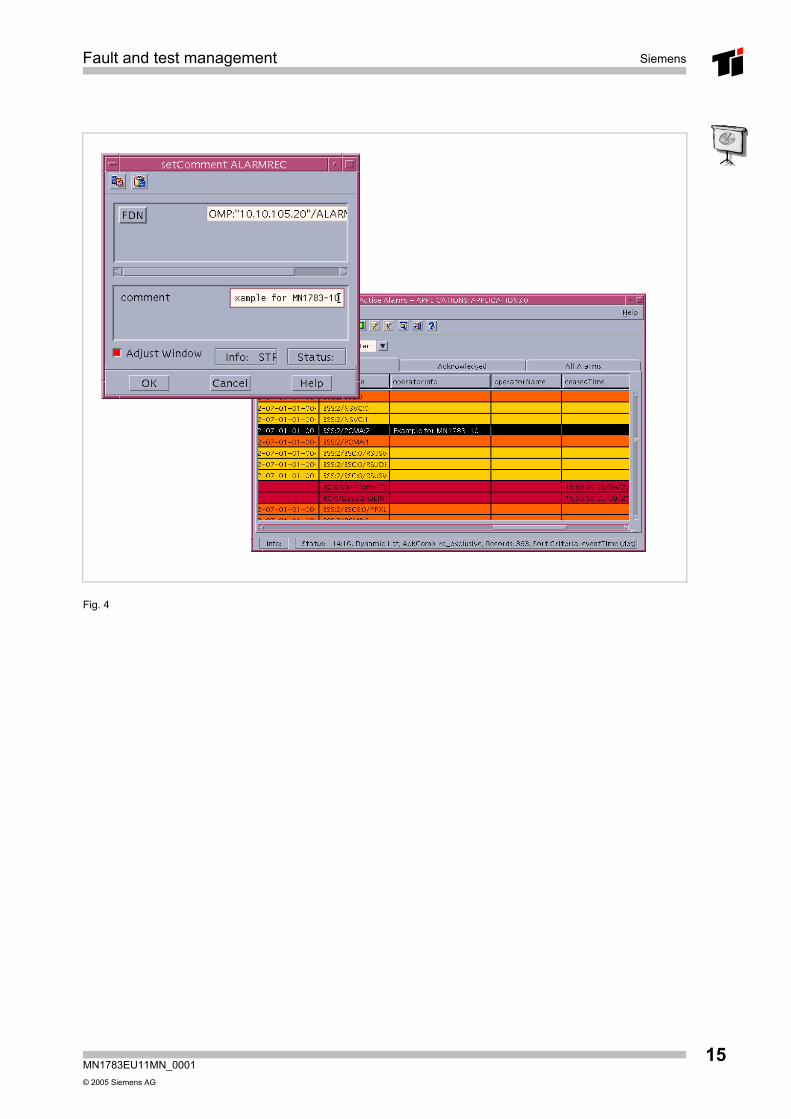
2.2.2 Comment Any alarm, which is logged, active as well ceased can be commented by the user. This is especially useful for informing any other user with a specific occurrence. The comment will then be displayed with the alarm and is logged after it is become ceased. Please note that if the same alarm occurs, the comment will not be included because it will be seen as a new alarm. Select the alarm, right click and the option for set comment can be found. This is also useful to reference to a specific Interface Element (IE). There a comment can also be set and the history can be for instance documented. The comment can be set with the command set comment. Please note that to read the comment, the set comment command should be used.
2.2.3 Filter A filter can be implemented to view the alarms according to more specialized view. due to the fact that only one Alarm Panel can be opened at once, this very useful to view equipment alarms etc. If the alarms logged reaches more than 8000, it is advised that no filter should be used. This has an effect on the performance of the system and this should be taken into account.
TIP Only the user that created the filter can change it, but is available for all users to enjoy.
Refer to the handling chapter for information in creating filters. Please note that still all alarms will be logged, but the display manipulated.
Fault and test management Siemens
MN1783EU11MN_0001 © 2005 Siemens AG
15
Fig. 4
Siemens Fault and test management
MN1783EU11MN_0001© 2005 Siemens AG
16
2.3 Alarm Acknowledgment A common feature in the management of alarms is the acknowledgement functionality. Acknowledgement is the confirmation of the occurrence of a new alarm and can be done by the user in charge of alarm handling, or automatically by the managing system (auto-acknowledgement).
TIP Alarm acknowledgement does not affect the Network Elements or any attached LMTs.
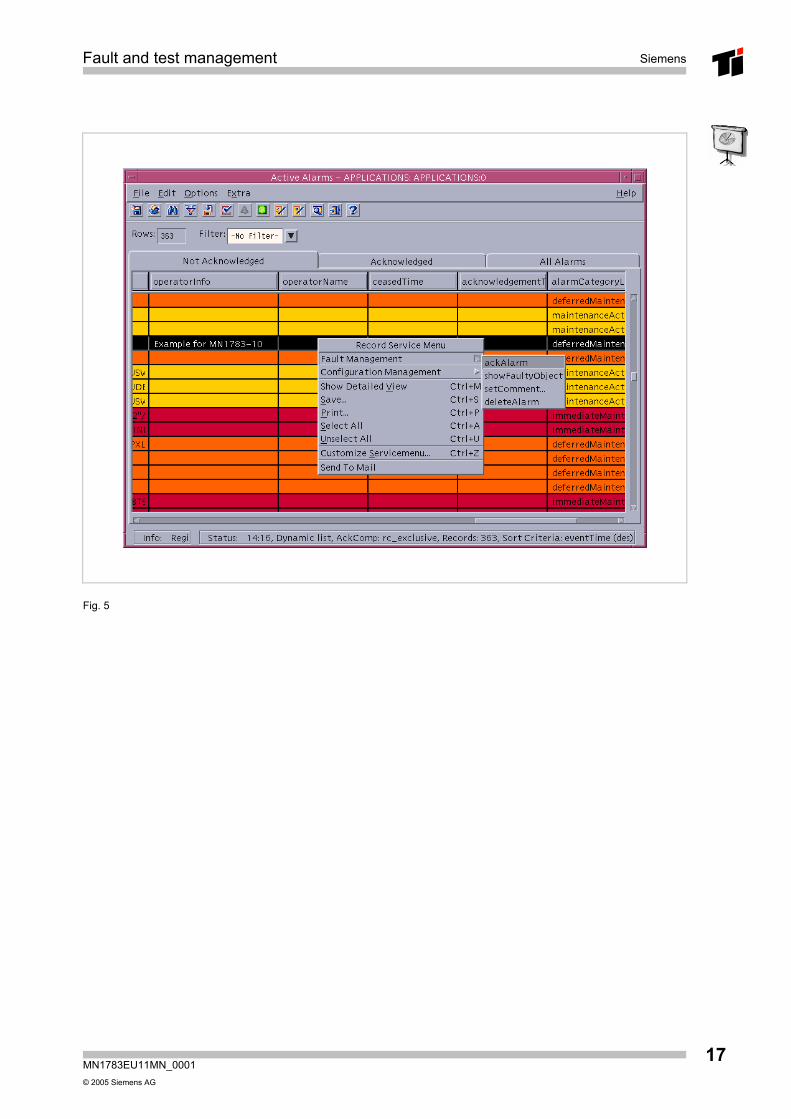
2.3.1 Manually Acknowledgement In the Not-Acknowledgement area of the Alarms Window, the user can select a specific alarm and by right click find the command acknowledge. This will then include the username and be moved to the acknowledged area. If this was a ceased alarm, it will be deleted from the list. This can also be done by clicking on the correction icon on top if the panel. Multiple alarms can also be acknowledged at once.
Fault and test management Siemens
MN1783EU11MN_0001 © 2005 Siemens AG
17
Fig. 5
Siemens Fault and test management
MN1783EU11MN_0001© 2005 Siemens AG
18
2.3.2 Manually Un-acknowledgement An alarm can be un-acknowledged within the Active/Related Alarms list. In the Active/Related Alarms list this service is only visible in the Acknowledged tab. It invokes the correct fault management command for un-acknowledging the selected alarms.
Prerequisites 1. The command is available only for already acknowledged alarms. 2. The un-acknowledgement is available only for alarms that are not cleared
already. 3. The un-acknowledgement is – analogously to the acknowledgement – only
possible, if the competence flag (NMC/RC) is set accordingly. If the alarm was acknowledged by an RC user, only an RC user can unacknowledge the alarm. If the alarm was acknowledged by an NMC user only an NMC user can unacknowledge the alarm.
Un-acknowledge an alarm 1. Open the Active Alarms list or the Related Alarms list. 2. Select one or several alarms. 3. Right-click to open the context menu or click on the Extra menu in the
Active/Related Alarms list. 4. Select Fault Management > unackAlarm.
The alarm is un-acknowledged. The operatorName field contains: unacknowledged by userxy.

Fault and test management Siemens
MN1783EU11MN_0001 © 2005 Siemens AG
19
Fig. 6

Siemens Fault and test management
MN1783EU11MN_0001© 2005 Siemens AG
20
2.3.3 Automatic acknowledgement The operator may define whether an alarm should be auto-acknowledged by the system, or manually acknowledged by the operator. You can configure the following criteria for the auto-acknowledgement: 1. whether the automatic acknowledgement is performed after the occurrence or
only after the clearance of alarms 2. whether after a definable time interval or after alarm occurrence/clearance the
alarm is auto-acknowledged or not 3. only alarms of defined severity and/or alarm category level are auto-
acknowledged 4. only alarms for an object with a given fully distinguished name are auto-
acknowledged 5. Auto-acknowledgement can be defined on base of the event type 6. Auto-acknowledgement can be based on the type of the technology 7. Auto-acknowledgement can be scheduled When auto-acknowledgement is activated it is still possible to acknowledge alarms manually.
TIP Manual acknowledgement and auto-acknowledgement are only allowed if also the competence flag is not set to nmc_exclusive.
TIP To limit the size of the Active/Related Alarms list, ceased alarms are automatically acknowledged by RC after 45000/x hours. (x = number of active and ceased+not acknowledged alarms)
Examples: If there are 1875 such alarms, ceased alarms are automatically acknowledged after 24 h. If there are 22500 such alarms, ceased alarms are automatically acknowledged after 2 h. This internal auto-acknowledgement cannot be switched off and is always active!
Fault and test management Siemens
MN1783EU11MN_0001 © 2005 Siemens AG
21
This procedure describes how to get the automatic acknowledgement configuration. Please take into consideration the General hints for the execution of procedures How to get acknowledgement configuration Click on the Administration menu-item on the Application Launcher to open the pull down menu or right-click on the icon representing a MOC to open the context menu. Choose Fault Management > getAckMode A new window opens, showing the acknowledgement mode settings. If necessary, click the expand button "+" to show the whole scope of the settings.
NOTE: Only the get command gives an output back, which is the current configuration as stored in the database of the OMP.
Siemens Fault and test management
MN1783EU11MN_0001© 2005 Siemens AG
22
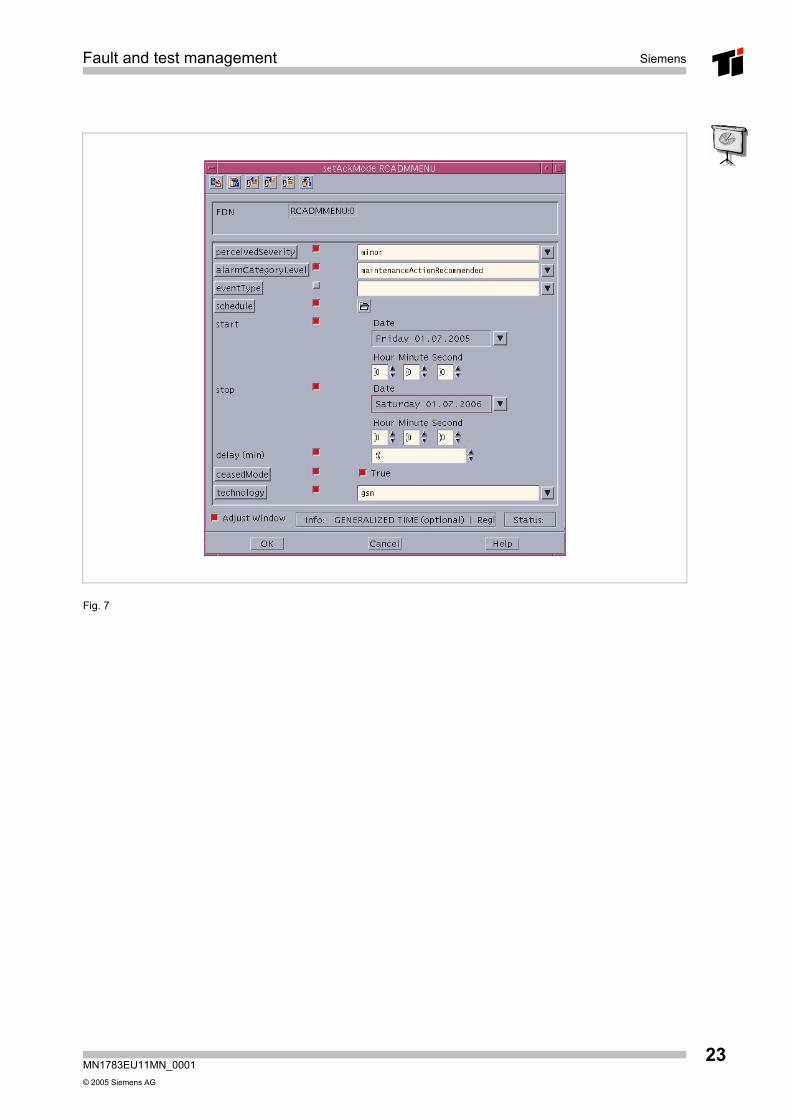
If you request the acknowledgement configuration via Application Launcher, you will get the settings of the whole system, otherwise if you request it through an icon, you will get the settings of the selected object. That means for a specific object, all alarms can be acknowledged. To set the auto acknowledgement, Click on the Administration menu-item on the Application Launcher to open the pull down menu or right-click on the icon representing a MOC to open the context menu. Choose Fault Management > setAckMode... to open the dialog window for the configuration settings. Click on "perceivedSeverity", "alarmCategoryLevel" and "eventType" in succession to open each a pull down list. Choose the respective values. Click on schedule to open the input fields for entering the start and stop time of the desired period for automatic acknowledgement configuration. For the date you can open a pull-down calendar, the time you can enter in the appropriate fields. If you scheduled your settings, a new input field will be offered: delay Enter the delay time in minutes. Delay means the time from arrival or ceasing of an alarm till the selected criteria of the configuration takes effect (assumed there is a correspondence between alarm and criteria). Set the Boolean ceasedMode (True / False). If ceasedMode is set (True), the counting starts after ceasing of the alarm (i.e. after reception of the notification with severity = cleared). If ceasedMode is not set (False) the counting starts after reception of the alarm. Examples: perceivedSeverity=minor; delay=30; ceasedMode=False => all alarms with perceived severity minor will be automatically acknowledged 30 minutes after reception. perceivedSeverity=major; delay=0; ceasedMode=True => all alarms with perceived severity major will be automatically acknowledged immediately after reception of the "cleared notification" which belongs to these alarms. If you set the acknowledgement configuration via Application Launcher, you will set the configuration of the whole system, otherwise if you set it through an icon, you will set the configuration on the specific scope of the selected object. Only the get command gives an output back that is the current configuration as stored in the database of the OMP.
Fault and test management Siemens
MN1783EU11MN_0001 © 2005 Siemens AG
23
Fig. 7
Siemens Fault and test management
MN1783EU11MN_0001© 2005 Siemens AG
24
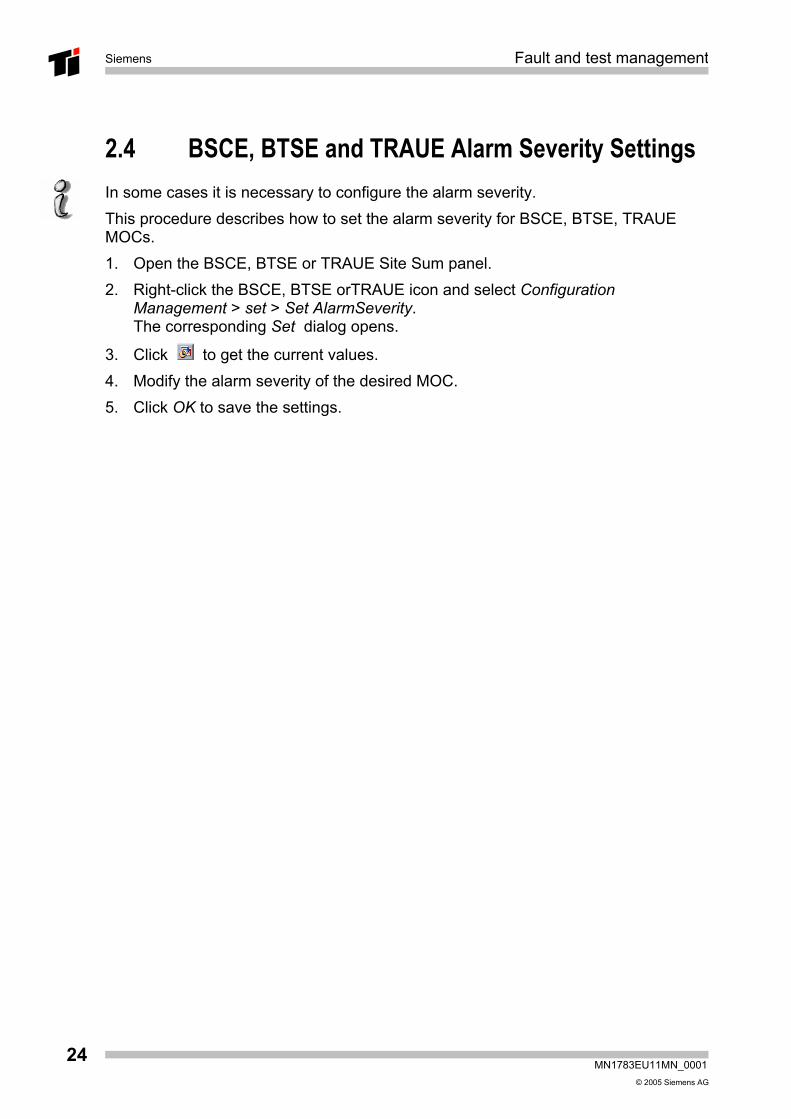
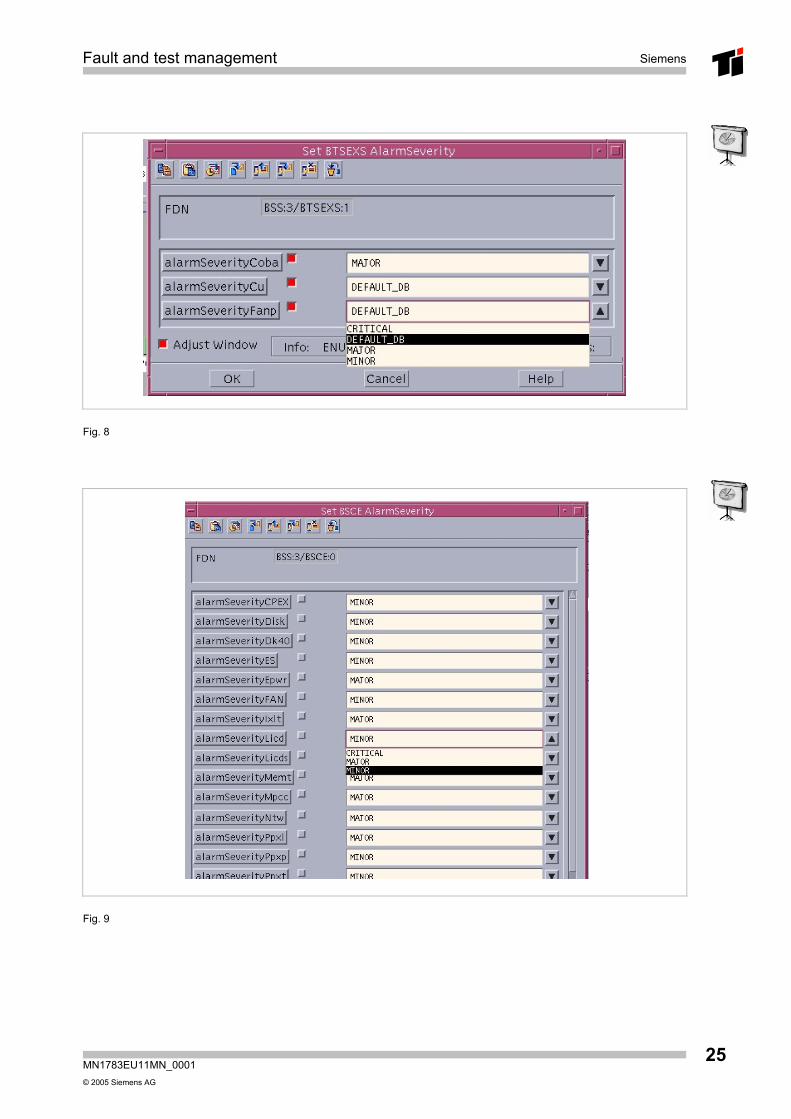
2.4 BSCE, BTSE and TRAUE Alarm Severity Settings In some cases it is necessary to configure the alarm severity. This procedure describes how to set the alarm severity for BSCE, BTSE, TRAUE MOCs. 1. Open the BSCE, BTSE or TRAUE Site Sum panel. 2. Right-click the BSCE, BTSE orTRAUE icon and select Configuration
Management > set > Set AlarmSeverity. The corresponding Set dialog opens.
3. Click to get the current values. 4. Modify the alarm severity of the desired MOC. 5. Click OK to save the settings.
Fault and test management Siemens
MN1783EU11MN_0001 © 2005 Siemens AG
25
Fig. 8
Fig. 9
Siemens Fault and test management
MN1783EU11MN_0001© 2005 Siemens AG
26
3 Alarm Filtering It is necessary to avoid multiple alarms and the corresponding floods of messages and this is resolved by an intelligent filtering. The list of active alarms is updated automatically. The history list of alarms stores the original message as well as the ceased message. Furthermore, a user-defined suppressing of alarms is possible in the following ways: 1. BSC settings 2. EFD 3. Propagation setting of objects
Fault and test management Siemens
MN1783EU11MN_0001 © 2005 Siemens AG
27
3.1 BSC Settings
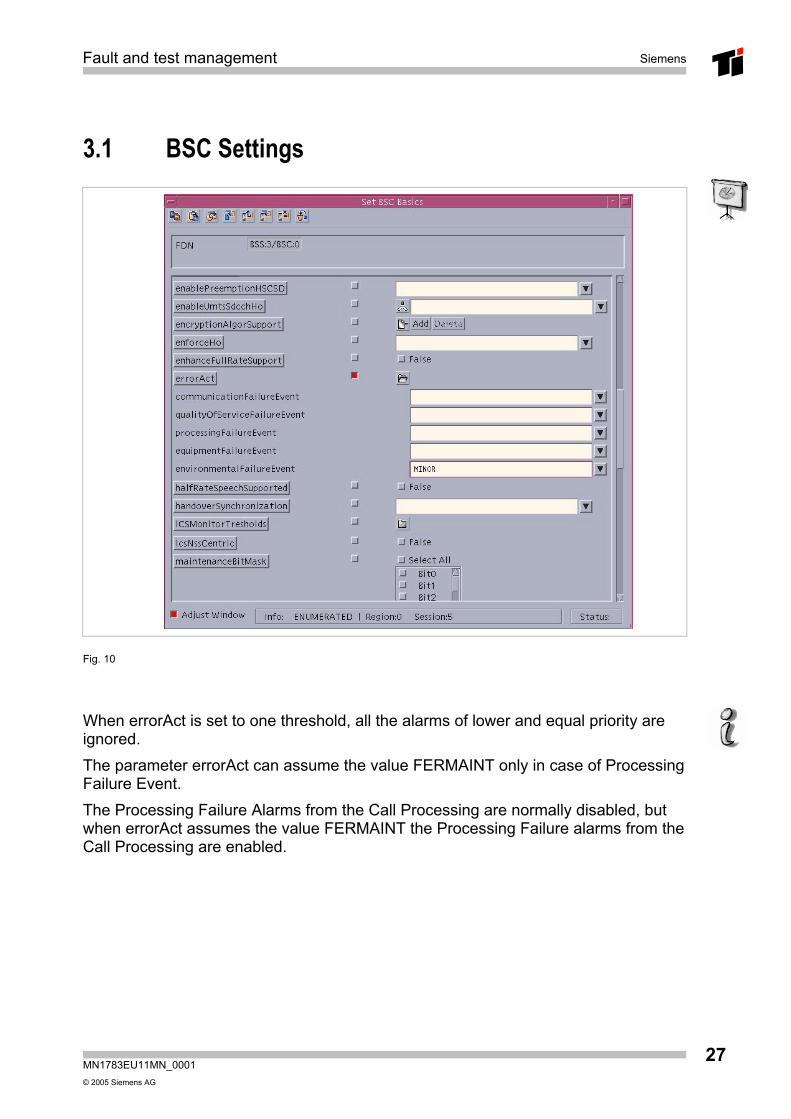
Fig. 10
When errorAct is set to one threshold, all the alarms of lower and equal priority are ignored. The parameter errorAct can assume the value FERMAINT only in case of Processing Failure Event. The Processing Failure Alarms from the Call Processing are normally disabled, but when errorAct assumes the value FERMAINT the Processing Failure alarms from the Call Processing are enabled.

Siemens Fault and test management
MN1783EU11MN_0001© 2005 Siemens AG
28
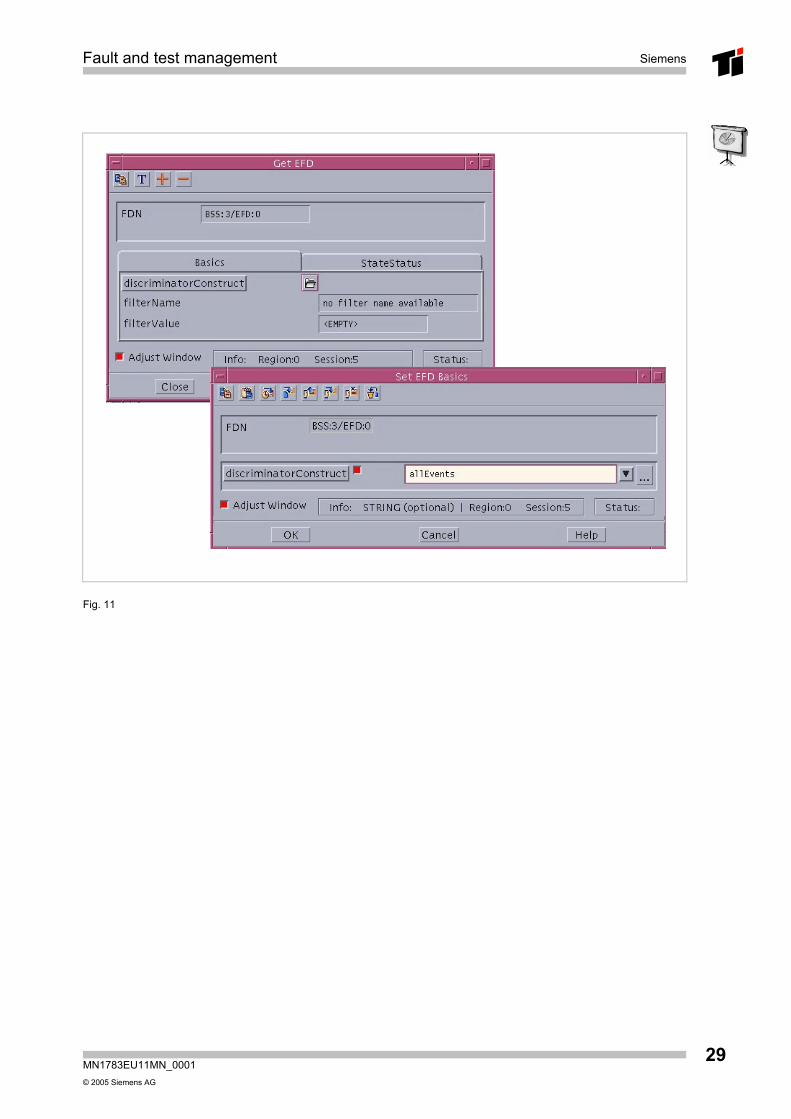
3.2 Event Forwarding Discriminator The Event Forwarding Discriminator (EFD) object is used to control the event flow between the BSC and the RC on the O-interface. Events are e.g. alarm reports, performance measurement reports, state change event reports, parameter value change event reports, etc. Only one EFD instance may exist per BSC and the EFD cannot be created or deleted by operator command. The EFD is subordinate to the BSS managed object and is created automatically by the RC during the first alignment between the BSC and the RC. The EFD is created with a configuration that does not impose any restrictions on the event flow between the BSC and the RC. To control the event flow on the O-interface you have the following possibilities: filter the events using the EFD discriminator Construct parameter lock/unlock the event forwarding via the EFD administrativeState parameter stop the event forwarding via the EFD stopTime parameter schedule the event forwarding via the EFD weekMask parameter. A set EFD filter is also active during an alignment. In order to avoid interferences between the alignment of a BSS and the modifications of the EFD parameters, the Set EFD command is rejected during an alignment. It is also not possible to start an alignment during the execution time (a few seconds) of a 'Set EFD' command.
Fault and test management Siemens
MN1783EU11MN_0001 © 2005 Siemens AG
29
Fig. 11
Siemens Fault and test management
MN1783EU11MN_0001© 2005 Siemens AG
30
3.3 Configurable Alarm Filtering
3.3.1 General remarks Alarm floods are a matter of concern for every Fault Management (FM) operator. Unimportant or secondary alarms divert his attention from more essential problems. In the past, Siemens already provided three categories of solutions within this area: 1. Basic filtering is performed in the Network Elements. 2. The "Event Forwarding Discriminator" (EFD) allows configuring a filter, which
considers the attribute values of the current event only, i.e. not in conjunction with other (correlated) events or with any conditions outside the event contents. EFD filters are evaluated in the network elements.
3. Display filters in the Radio Commander's Alarm Monitor allow suppressing alarms from being displayed depending on attribute conditions (as in the case of EFD).
As operating experience shows, the following scenarios make up a significant percentage of the alarm total: intermittent alarms, toggling alarms and alarms that are negligible as long as they do not appear "too frequently". Exactly these situations are addressed by the ‘Configurable Alarm Filtering’.
Filtering of Intermittent (transient) Alarms Two alarms are identified by the filter engine as "intermittent" if: 1. both alarms have the same managedObjectClass, managedObjectInstance,
eventType, probableCause, and specificProblems, and additionally the perceivedSeverity of the first alarm is not "cleared" and the perceivedSeverity of the second alarm is "cleared", and
2. a configurable attribute condition is fulfilled which refers to the attributes of the active (i.e. first) alarm, and
3. both alarms (the active and the clearing one) arrived within a configurable time interval.
To define a rule for suppressing this type of alarm, two configurable items, the explicit "attribute condition" and the "time interval", are necessary. If an alarm is received in the Radio Commander, the filter engine checks for valid rules according to the defined “attribute condition”. If the respective alarm is cleared within the “time interval”, the operator is not informed about the alarm – if not, the alarm is inserted into the alarm monitoring list. Example: To filter all intermittent alarms reporting an open rack door for less than 5 minutes, the parameters should be set to 1. attribute condition: specificProblems contains "door open" and 2. time interval: 5 min.
Fault and test management Siemens
MN1783EU11MN_0001 © 2005 Siemens AG
31
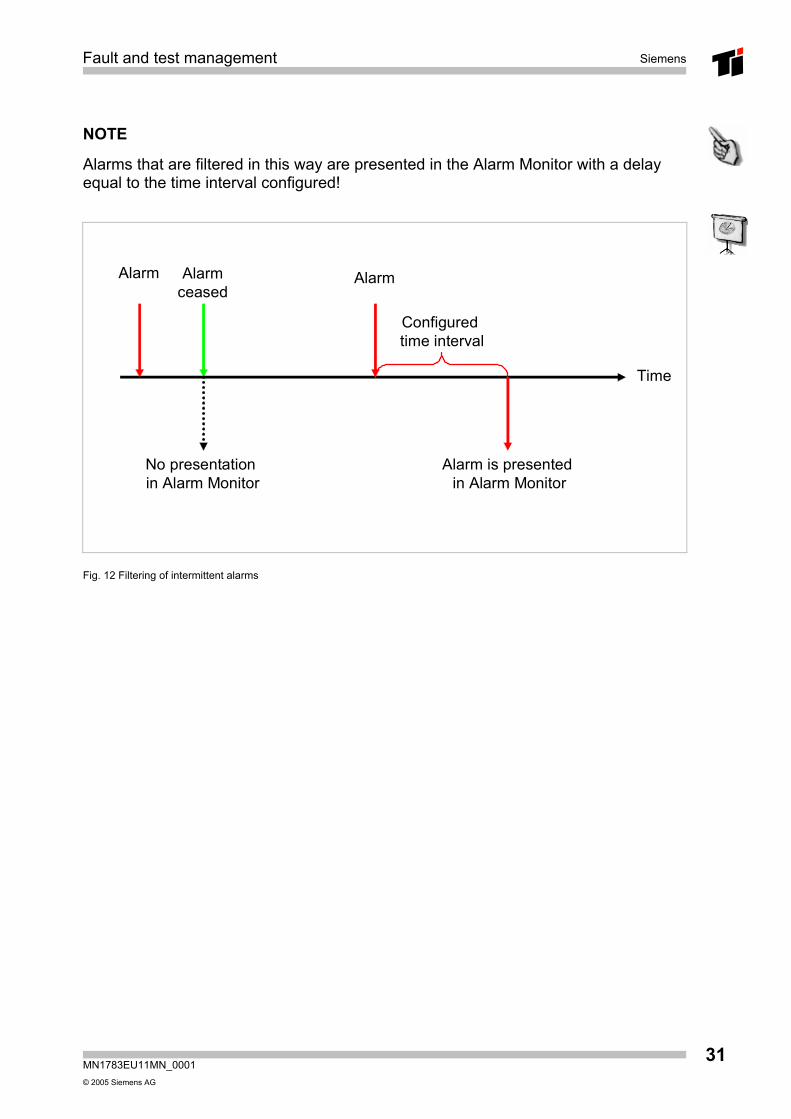
NOTE
Alarms that are filtered in this way are presented in the Alarm Monitor with a delay equal to the time interval configured!
Time
Alarm Alarmceased
Alarm
Alarm is presentedin Alarm Monitor
No presentationin Alarm Monitor
Configuredtime interval
Fig. 12 Filtering of intermittent alarms
Siemens Fault and test management
MN1783EU11MN_0001© 2005 Siemens AG
32
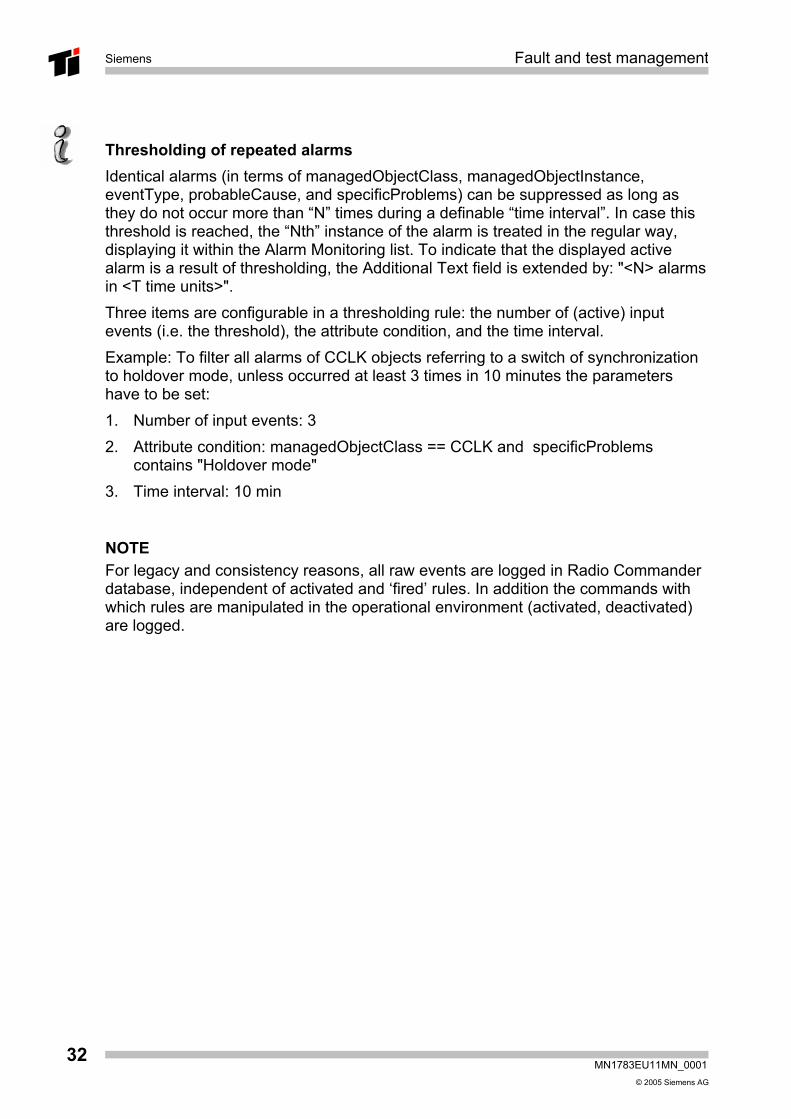
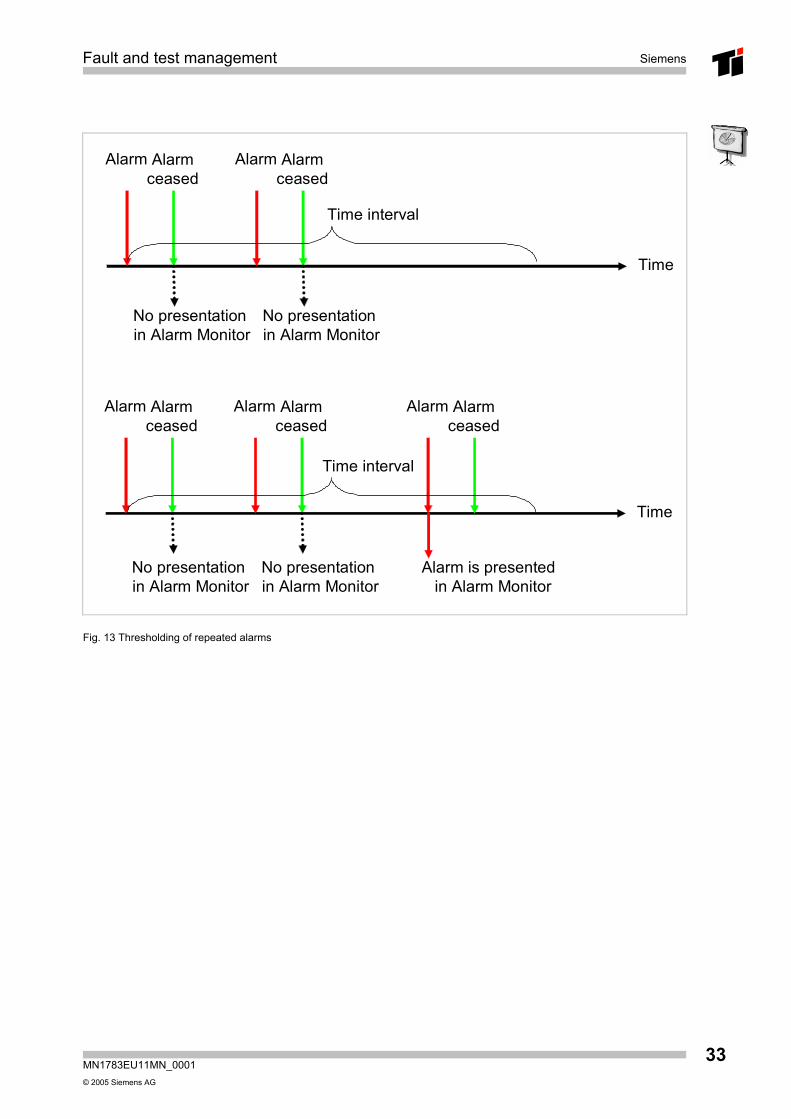
Thresholding of repeated alarms Identical alarms (in terms of managedObjectClass, managedObjectInstance, eventType, probableCause, and specificProblems) can be suppressed as long as they do not occur more than “N” times during a definable “time interval”. In case this threshold is reached, the “Nth” instance of the alarm is treated in the regular way, displaying it within the Alarm Monitoring list. To indicate that the displayed active alarm is a result of thresholding, the Additional Text field is extended by: "<N> alarms in <T time units>". Three items are configurable in a thresholding rule: the number of (active) input events (i.e. the threshold), the attribute condition, and the time interval. Example: To filter all alarms of CCLK objects referring to a switch of synchronization to holdover mode, unless occurred at least 3 times in 10 minutes the parameters have to be set: 1. Number of input events: 3 2. Attribute condition: managedObjectClass == CCLK and specificProblems
contains "Holdover mode" 3. Time interval: 10 min
NOTE For legacy and consistency reasons, all raw events are logged in Radio Commander database, independent of activated and ‘fired’ rules. In addition the commands with which rules are manipulated in the operational environment (activated, deactivated) are logged.
Fault and test management Siemens
MN1783EU11MN_0001 © 2005 Siemens AG
33
Time
Alarm Alarmceased
No presentationin Alarm Monitor
Alarm Alarmceased
No presentationin Alarm Monitor
Time
Alarm Alarmceased
No presentationin Alarm Monitor
Alarm Alarmceased
No presentationin Alarm Monitor
Alarm Alarmceased
Alarm is presentedin Alarm Monitor
Time interval
Time interval
Fig. 13 Thresholding of repeated alarms

Siemens Fault and test management
MN1783EU11MN_0001© 2005 Siemens AG
34
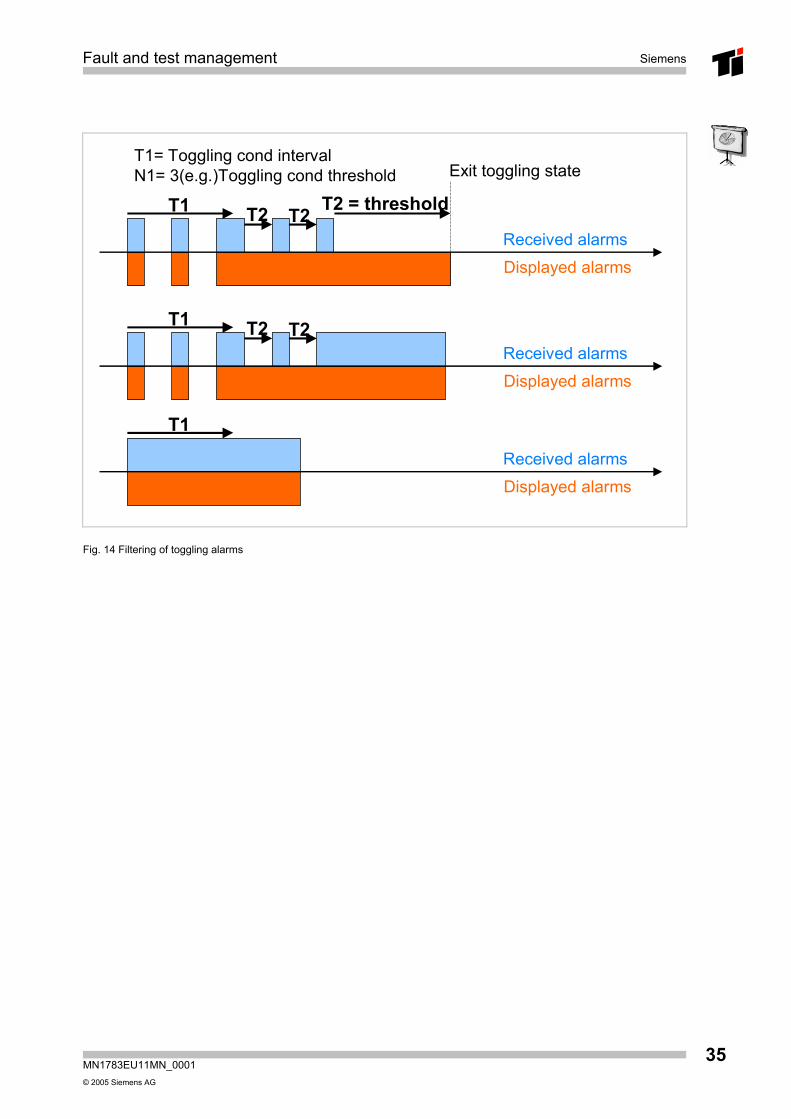
Toggling alarm The toggling of an alarm is another situation, which can be handled with the configurable alarm filtering. Assume that a specific alarm frequently uses to toggle, i.e. it is raised and cleared repeatedly. As the alarm may report a severe fault, its raising must be displayed immediately. However, in case the alarm toggles, the displayed alarm should remain active during toggling. Two incidents must be perceived by the filter: 1. that the alarm toggles, 2. that the alarm stopped toggling. To handle the first condition the system performs a check whether a configurable number of raisings happened in a time interval. If so, the alarm enters a "toggling state". As long as the alarm is in the toggling state, it is displayed as active, and each received repetition or clearance triggers the start of a "settling" timer. If no new alarm message (active or clearing) comes until the timer expires, the toggling state is exited on timer expiry. If the last alarm received before the timer expiry was a clearing alarm, the displayed alarm is cleared, otherwise it remains active. A "toggling alarm rule" therefore contains the configurable items: 1. Toggling condition interval (T1) 2. Toggling condition threshold (N1) 3. Settling condition interval (T2) 4. Attribute condition (as in the previous rule types) If N1 "equal" active alarms ("equal" in the same sense of the 5 equal attributes as in the previous rule types) arrive within the interval T1, the "alarm" is considered to enter the "toggling state" on arrival of the N+1th active alarm. Up to this point, all occurrences of the "equal" alarms and their clearing are passed by the rule. Once the alarm enters the toggling state, further occurrences of the alarm and clearing alarms are suppressed. The alarm exits the toggling state if in a period T2 after arrival of an active alarm (including the N+1th) or of a clearing alarm no new active or clearing alarm message arrived. If on exiting the toggling state the last alarm message is a clearing alarm, the rule forwards this (buffered) clearing alarm. The life-cycle of the rule instance ends when the toggling state is exited. To indicate the toggling state to the operator, when the N+1th active alarm is forwarded the alarm attribute additionalText shows a corresponding indication. The following figures illustrate three scenarios with N1 = 3. In the first, the toggling state is exited while the fault is cleared. In the second, the toggling state is exited while the fault is active. In the third, the toggling state is not entered at all.
Fault and test management Siemens
MN1783EU11MN_0001 © 2005 Siemens AG
35
Received alarms
Displayed alarms
T1 T2 = thresholdT2 T2
Received alarms
Displayed alarms
T1 T2 T2
Received alarms
Displayed alarms
T1
Exit toggling stateT1= Toggling cond interval N1= 3(e.g.)Toggling cond threshold
Fig. 14 Filtering of toggling alarms
Siemens Fault and test management
MN1783EU11MN_0001© 2005 Siemens AG
36
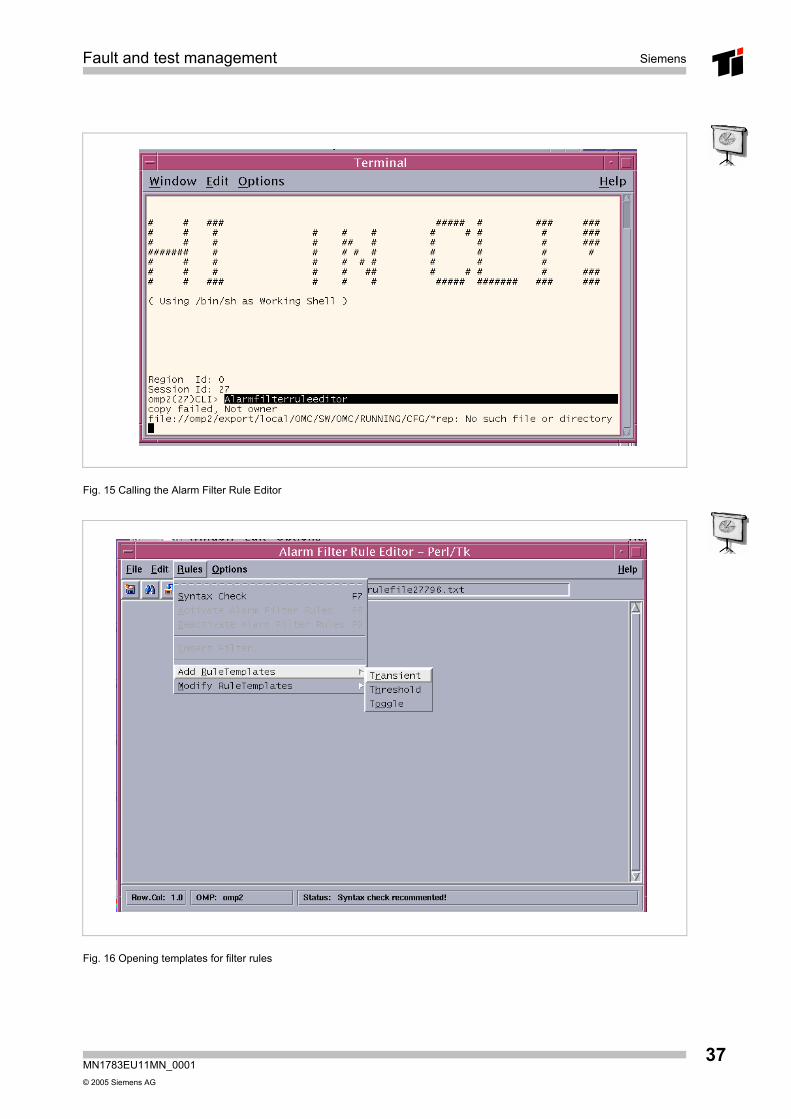
3.3.2 Handling at the Radio Commander At the Radio Commander the Alarm Filter Rule Editor is an additional application, which can be started from a UNIX terminal window or from the command line interface with the command: Alarmfilterruleeditor The Alarm Filter Rule Editor allows configuring rules according to a specific syntax. The user can use templates to enter all required parameters for all three types of filters: 1. Transient 2. Threshold 3. Toggle. It provides the possibilities to check the syntax of the filter rules and to store them as separate files. More than one filter rule can be defined in the same file.
Fault and test management Siemens
MN1783EU11MN_0001 © 2005 Siemens AG
37
Fig. 15 Calling the Alarm Filter Rule Editor
Fig. 16 Opening templates for filter rules
Siemens Fault and test management
MN1783EU11MN_0001© 2005 Siemens AG
38
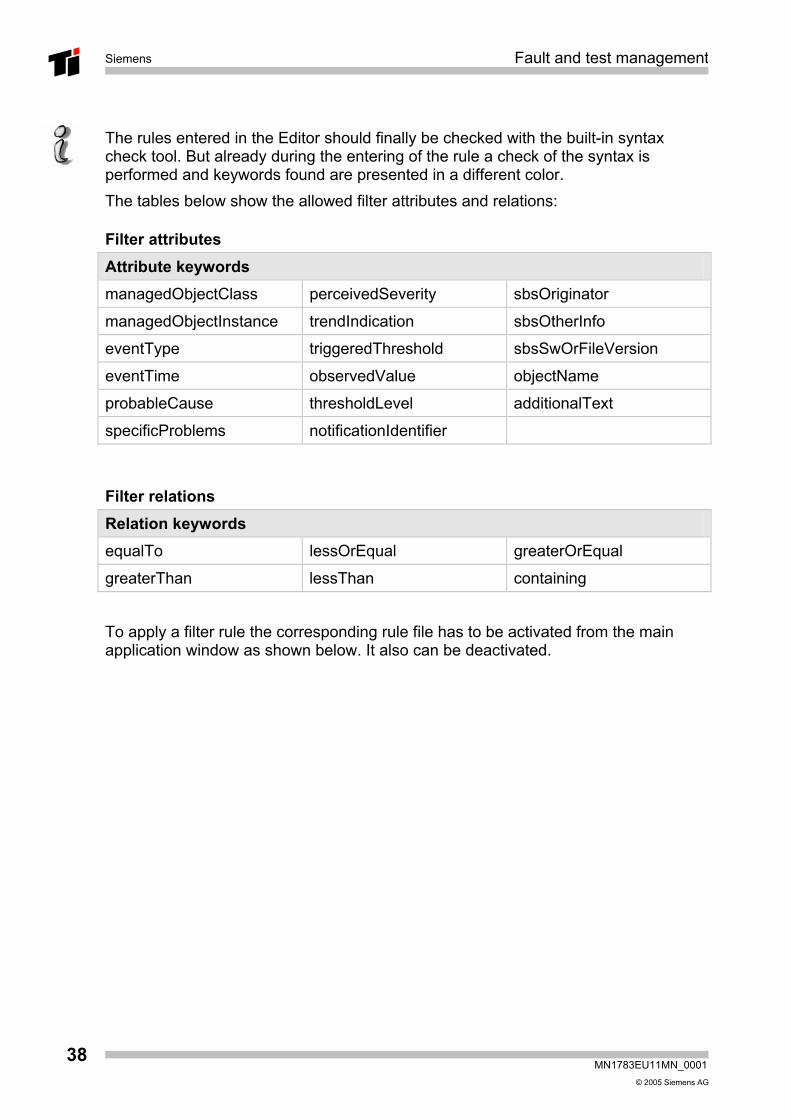
The rules entered in the Editor should finally be checked with the built-in syntax check tool. But already during the entering of the rule a check of the syntax is performed and keywords found are presented in a different color. The tables below show the allowed filter attributes and relations:
Filter attributes Attribute keywords managedObjectClass perceivedSeverity sbsOriginator
managedObjectInstance trendIndication sbsOtherInfo
eventType triggeredThreshold sbsSwOrFileVersion
eventTime observedValue objectName
probableCause thresholdLevel additionalText
specificProblems notificationIdentifier
Filter relations Relation keywords equalTo lessOrEqual greaterOrEqual
greaterThan lessThan containing
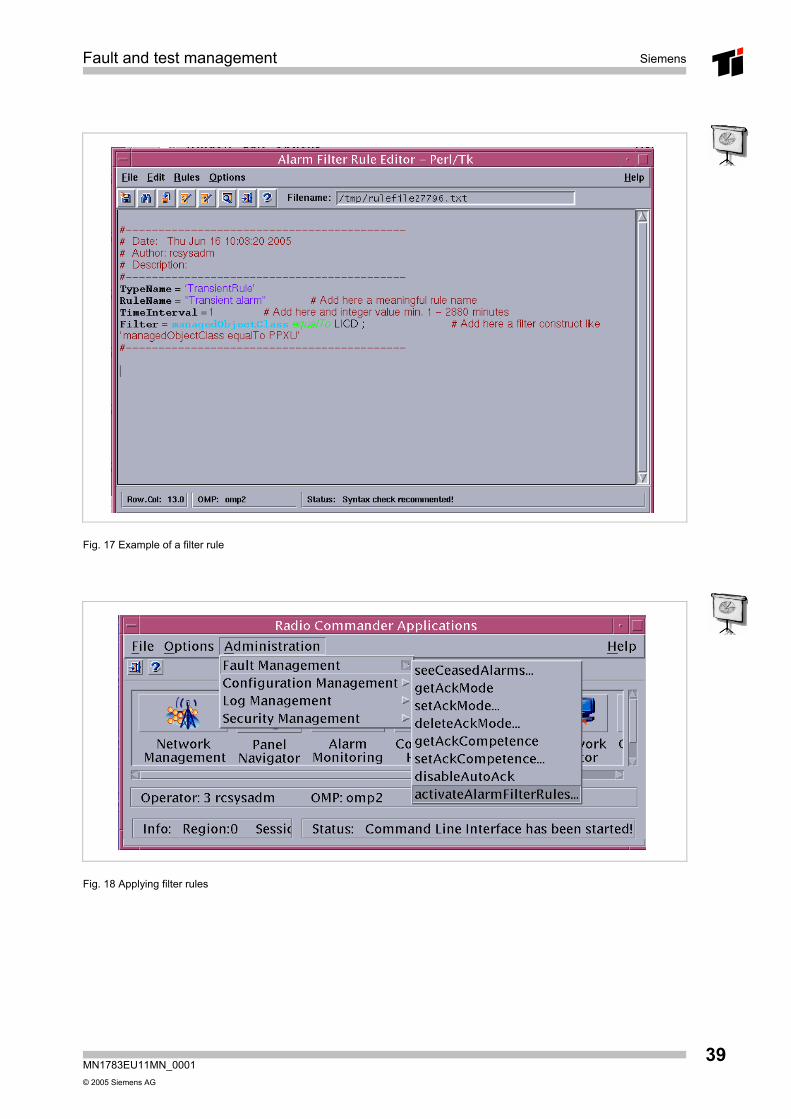
To apply a filter rule the corresponding rule file has to be activated from the main application window as shown below. It also can be deactivated.
Fault and test management Siemens
MN1783EU11MN_0001 © 2005 Siemens AG
39
Fig. 17 Example of a filter rule
Fig. 18 Applying filter rules

Siemens Fault and test management
MN1783EU11MN_0001© 2005 Siemens AG
40
Fault and test management Siemens
MN1783EU11MN_0001 © 2005 Siemens AG
41
4 Quality of Service Alarm Handling
Siemens Fault and test management
MN1783EU11MN_0001© 2005 Siemens AG
42
4.1 Basics While the effective monitoring of network elements becomes more and more self-evident, information on a higher, more abstract level, the level of “Service”, gains importance. The “Quality of Service Alarm Handling” offers fast indication of definable quality indicators without the need to transfer the raw data to connected post-processing systems and elaborate them offline. With the feature “Quality of Service Alarms” operators can: 1. recognize threshold crossings for counted and gauged performance values 2. get, set, activate, deactivate thresholds 3. get, set QoS alarm severities. Operators can see at once if and where performance or quality levels are not met. This indication is much faster than any evaluation of performance data via an offline tool. Due to this feature threshold criteria related to performance measurements can be configured, that help the operator to observe the service quality of his network. These QoS indicators are monitored and - if the configured threshold is exceeded - an alarm notification is generated. New object classes are introduced that represent those indicators. These QoS objects can on the one hand be configured individually on cell basis; on the other hand dynamic thresholds reduce the administration workload. These dynamic thresholds are introduced per BSC and they are dependent to the number of samples. A threshold value of “0” implies disabling of this alarm. If new cells are generated or cells are deleted, the relevant QoS objects are automatically adapted. For each object to be monitored two independent thresholds may be defined, so that a minor or major alarm is generated if the threshold value is reached, respectively. These alarms are characterized by the type “Quality of Service alarm”, so they can be easily identified or filtered out within the Radio Commander alarm monitoring list. The actual results of the QoS indicators can be requested by corresponding commands via GUI or CLI.
Fault and test management Siemens
MN1783EU11MN_0001 © 2005 Siemens AG
43
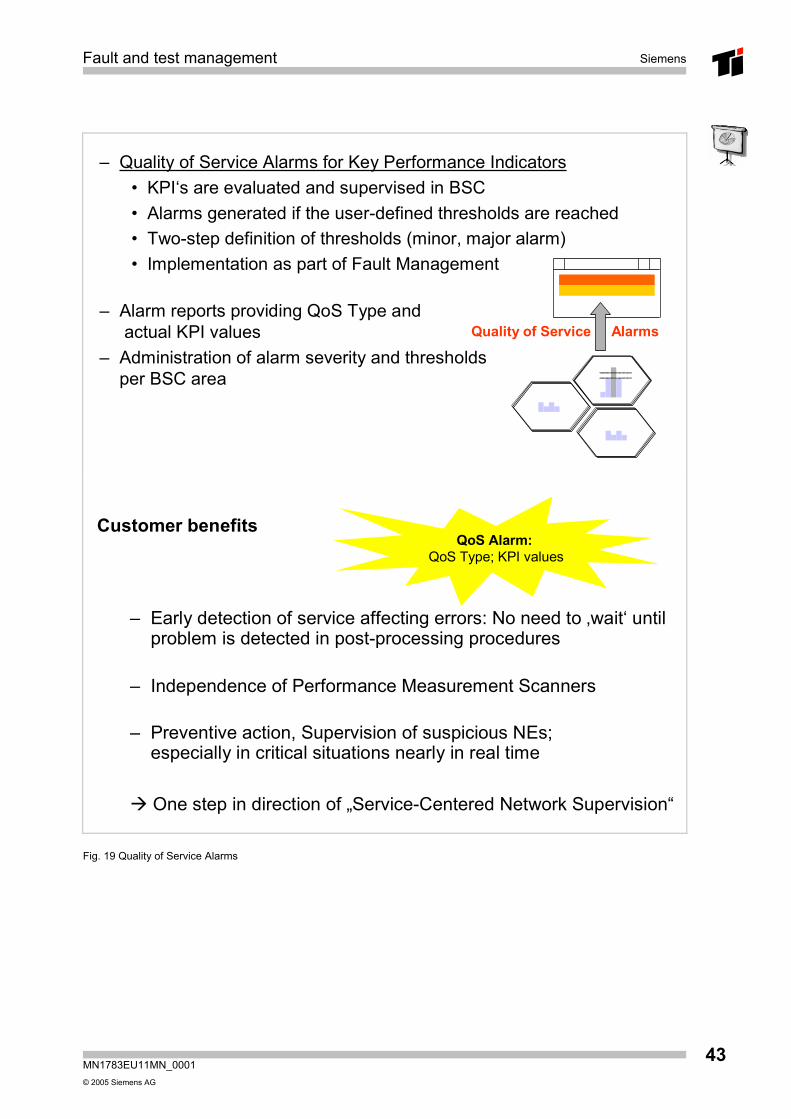
– Quality of Service Alarms for Key Performance Indicators• KPI‘s are evaluated and supervised in BSC• Alarms generated if the user-defined thresholds are reached • Two-step definition of thresholds (minor, major alarm)• Implementation as part of Fault Management
– Alarm reports providing QoS Type andactual KPI values
– Administration of alarm severity and thresholds per BSC area
Quality of Service Alarms
Customer benefits
– Early detection of service affecting errors: No need to ‚wait‘ until problem is detected in post-processing procedures
– Independence of Performance Measurement Scanners
– Preventive action, Supervision of suspicious NEs;especially in critical situations nearly in real time
One step in direction of „Service-Centered Network Supervision“
QoS Alarm:QoS Type; KPI values
Fig. 19 Quality of Service Alarms
Siemens Fault and test management
MN1783EU11MN_0001© 2005 Siemens AG
44
4.2 Implementation The feature 'Quality of Service Alarms' comprises the following sub-features: 1. Introduction and supervision of selectable QoS indicators with new object classes
(QoSMonitorBSC, QoSMonitorBTS, QoSMonitorGPRS). 2. Generation of two separate alarms (minor, major) per QoS indicators for a certain
object (e.g. cell), if a configured threshold is exceeded. 3. Filtering of QoS alarms at the RC for event type ‘Quality of Service Failure’. 4. Less effort for threshold administration with introduction of dynamic thresholds
and static thresholds per BSC. It is not necessary to administer thresholds per cell.
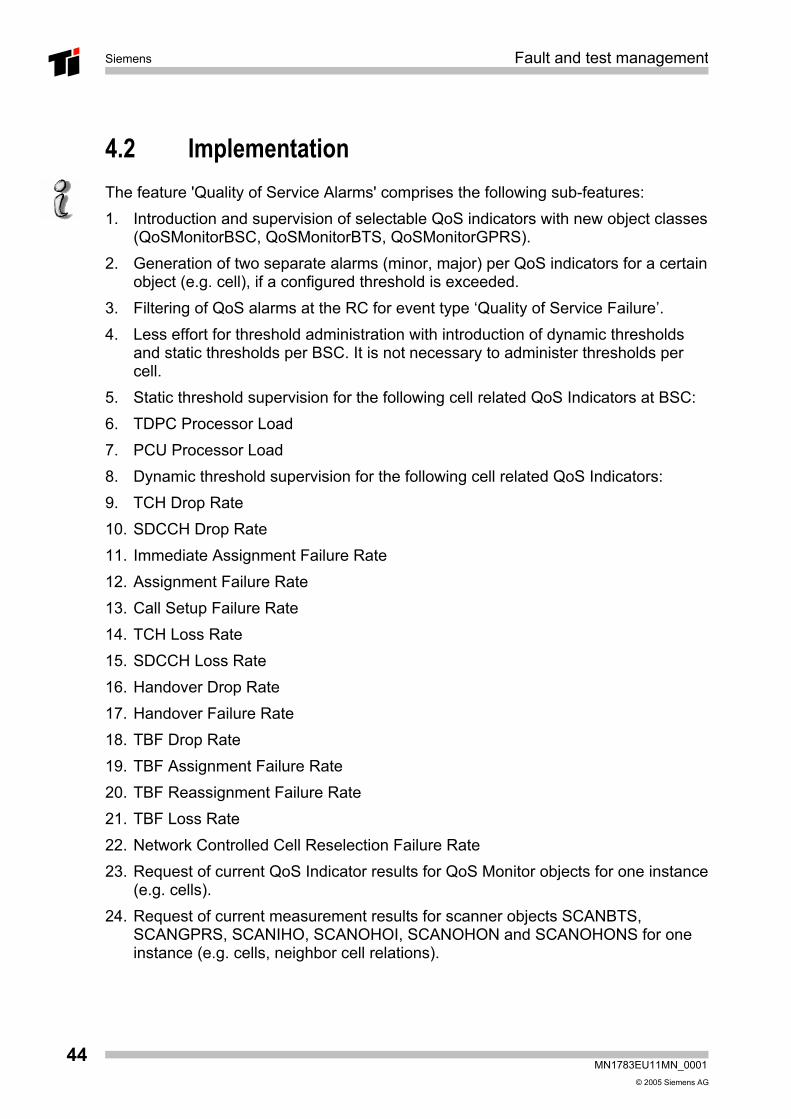
5. Static threshold supervision for the following cell related QoS Indicators at BSC: 6. TDPC Processor Load 7. PCU Processor Load 8. Dynamic threshold supervision for the following cell related QoS Indicators: 9. TCH Drop Rate 10. SDCCH Drop Rate 11. Immediate Assignment Failure Rate 12. Assignment Failure Rate 13. Call Setup Failure Rate 14. TCH Loss Rate 15. SDCCH Loss Rate 16. Handover Drop Rate 17. Handover Failure Rate 18. TBF Drop Rate 19. TBF Assignment Failure Rate 20. TBF Reassignment Failure Rate 21. TBF Loss Rate 22. Network Controlled Cell Reselection Failure Rate 23. Request of current QoS Indicator results for QoS Monitor objects for one instance
(e.g. cells). 24. Request of current measurement results for scanner objects SCANBTS,
SCANGPRS, SCANIHO, SCANOHOI, SCANOHON and SCANOHONS for one instance (e.g. cells, neighbor cell relations).
Fault and test management Siemens
MN1783EU11MN_0001 © 2005 Siemens AG
45
dynamic per CellNetwork Controlled Cell Reselection Failure Rate
dynamic per CellTBF Loss Rate
dynamic per CellTBF Reassignment Failure Rate
dynamic per CellTBF Drop Rate
dynamic per CellHandover Failure Rate
dynamic per CellHandover Drop Rate
dynamic per CellSDCCH Loss Rate
dynamic per CellTCH Loss Rate
dynamic per CellCall Setup Failure Rate
dynamic per CellAssignment Failure Rate
dynamic per CellImmediate Assignment Failure Rate
dynamic per CellSDCCH Drop Rate
dynamic per CellTCH Drop Rate
staticper BSCPCU Processor Load
staticper BSCTDPC Processor Load
ThresholdMeasurementDepth
QoS Indicator
Fig. 20 QoS indicators
Siemens Fault and test management
MN1783EU11MN_0001© 2005 Siemens AG
46
Static Threshold supervision For the threshold observation of one QoS indicator (i.e. the TDPC and PCU processor load) four internal counters are used: TshMajorHighCounter#’, TshMinorHighCounter#, TshMajorLowCounter#, TshMinorLowCounter#. They are related to corresponding threshold and counter settings: Threshold Major High, Threshold Major Low, Threshold Minor High, Threshold Minor Low, and Number of Periods At the end of each supervision period the BSC evaluates if any of these thresholds was exceeded. Depending on whether an alarm is pending or not and whether the performance is becoming better or worse it does the following:
Performance becoming worse 1. No alarm: If the observed result exceeds the Threshold Minor High, the
TshMinorHighCounter is incremented by one. If after that its value is equal to the ‘Number of Periods’ value a minor QoS alarm is generated. As soon as the observed result is equal or smaller than the Threshold Minor High the TshMinorHighCounter is reset.
2. Minor alarm: If the observed result exceeds the Threshold Major High, the TshMajorHighCounter is incremented by one. If after that its value is equal to the ‘Number of Periods’ value a major QoS alarm is generated and the minor alarm is cleared. As soon as the observed result is equal or smaller than the Threshold Major High the TshMajorHighCounter is reset.
Performance becoming better 1. Major alarm: If the observed result is equal or below the Threshold Major Low,
the TshMajorLowCounter is incremented by one. If the incremented counter is equal to ‘Number of Periods’ the major alarm is cleared. If the TshMinorLowCounter is not equal to ‘Number of Periods’ the minor alarm is generated again. As soon as the observed result exceeds the Threshold Major Low the counter is reset.
2. Minor alarm: If the observed result is equal or below the Threshold Minor Low, the TshMinorLowCounter is incremented by one. If the incremented counter is equal to ‘Number of Periods’ the minor alarm is cleared. As soon as the observed result exceeds the Threshold Minor Low the counter is reset.
In case an object (e.g. cell) goes out of service (LOCKED or DISABLED) no new QoS alarms are reported and existing QoS Alarms are cleared. In case an object (e.g. cell) goes in service (UNLOCKED and ENABLED) the internal counters for QoS indicators are reset and started to count at start of the next observation period.

Fault and test management Siemens
MN1783EU11MN_0001 © 2005 Siemens AG
47
321000000000000000000
000000765432100321000
654321000000000000000
000000003210000000000
Load
Time
TshMajorHigh
TshMinorHigh
TshMajorLow
TshMinorLow
Number of periods = 2
TshMajorHighCounter
TshMajorLowCounter
TshMinorHighCounter
TshMinorLowCounter
Supervision Period (e.g. 5, 10, 15 min.)
Fig. 21 Static threshold supervision
Siemens Fault and test management
MN1783EU11MN_0001© 2005 Siemens AG
48
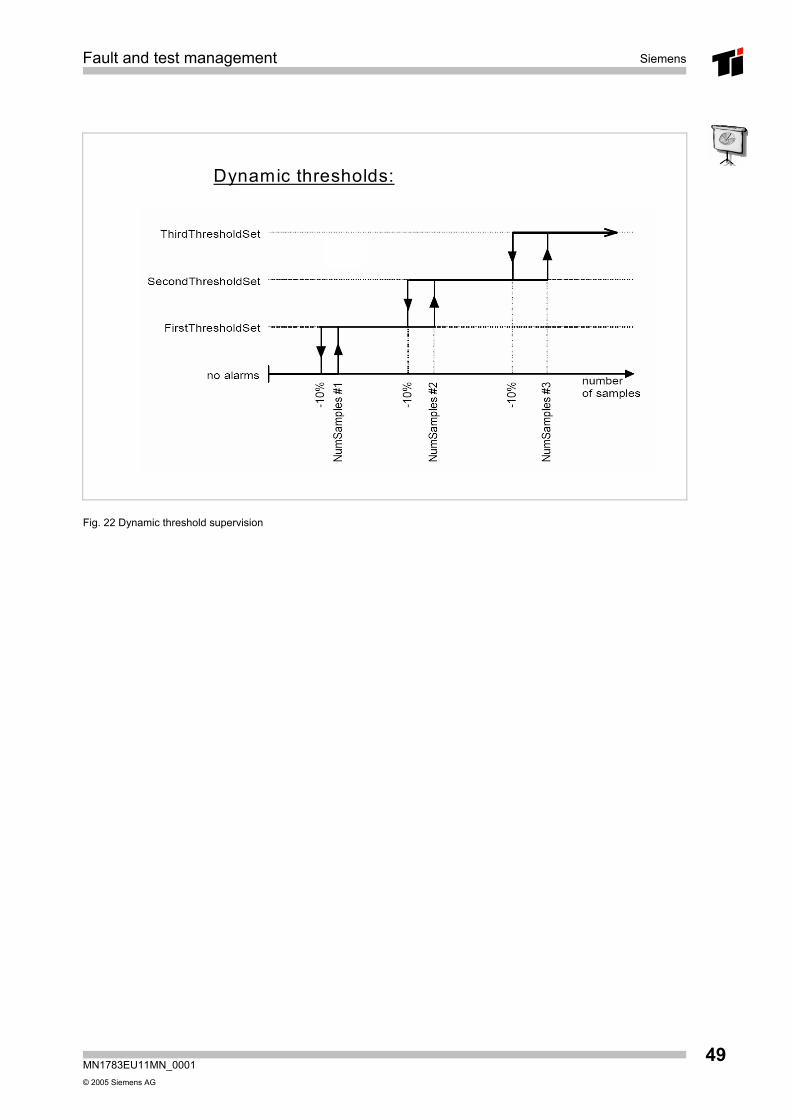
Dynamic Threshold supervision In general the functionality of dynamic threshold supervision is similar to the static threshold supervision, but three sets of thresholds are used to reduce the administration effort. The QoS indicators depend on the amount of traffic and therefore are given in %. Thresholds are observed dynamically, that means that the parameters for threshold supervision may change depending on the number of samples taken within the last supervision period. The figure below shows how different threshold parameter sets are related to the number of samples: Four sample ranges are defined: from no alarm up to the 3rd ThresholdSet. Below ‘NumSamples#1’ the counters are not increased anymore, but they may be decreased using the thresholds of the first threshold set. Thus no new alarms will be generated but pending ones will be cleared after some time. In the range between ‘FirstThresholdSet’ and ‘SecondThresholdSet’ the parameters of the first threshold set are applied for the threshold supervision, which is done in exactly the same way as the static threshold supervision is done. In this case a minor alarm is raised. The ranges between second and third threshold set and above the third threshold set are handled in the same way, for the latter one a ‘NumSamples #4’ is considered to be infinite. In the second and third range a major or a critical alarm are generated. To avoid too frequent changes of the used threshold parameter set a 10% hysteresis is applied to the ‘NumSamples’ borders as shown in the above figure. In any case the width of this hysteresis is at least one sample. In case an object (e.g. cell) goes out of service (LOCKED or DISABLED) no new QoS alarms are reported and the existing QoS Alarms are cleared. In case an object (e.g. cell) goes in service (UNLOCKED and ENABLED) the internal counters for QoS indicators are reset and start to count at the beginning of the next observation period.
Fault and test management Siemens
MN1783EU11MN_0001 © 2005 Siemens AG
49
Dynamic thresholds:
Fig. 22 Dynamic threshold supervision

Siemens Fault and test management
MN1783EU11MN_0001© 2005 Siemens AG
50
4.3 RC Handling of QoS alarms New objects for QoS alarms are 1. QSTHRS, the QoS Threshold settings, and the 2. QSMON classes:
QSMONBSC, QSMONBTS, and QSMONGPRS.
3. QoSAdmin 4. QoSMonBtsCo 5. QoSMonGprsCo
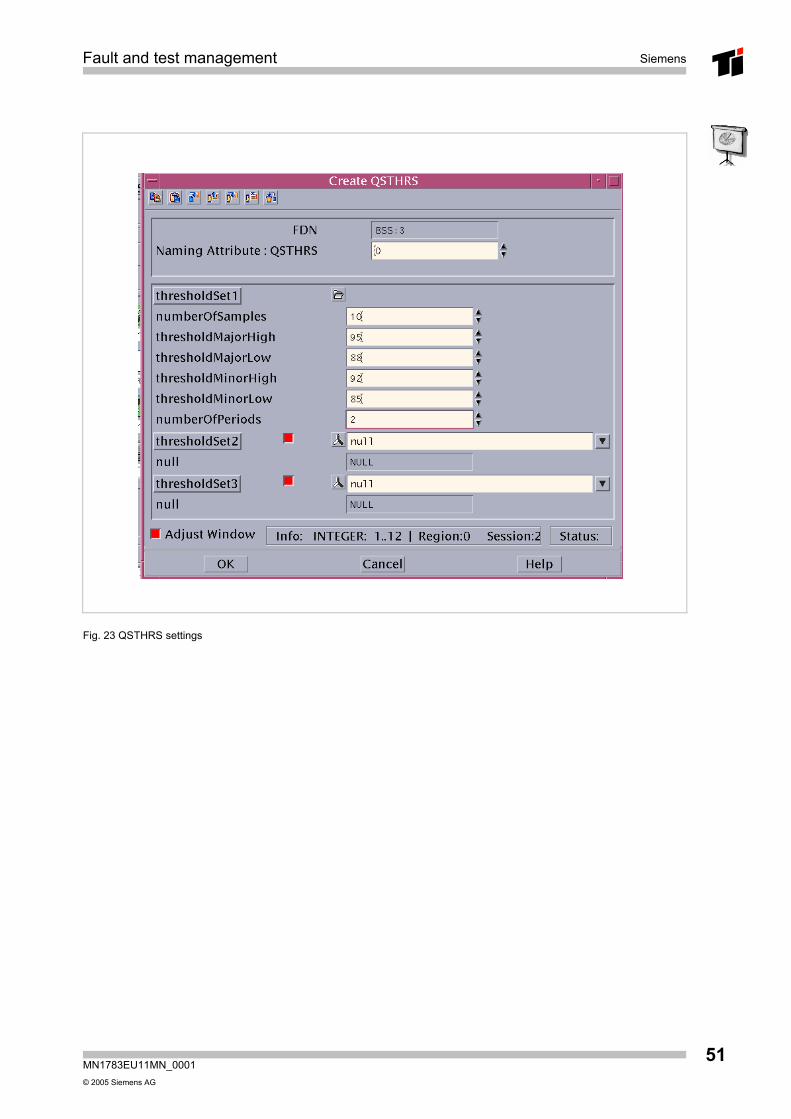
QSTHRS object For the QoS Threshold settings the following parameters can be set:
Parameter Meaning Threshold Set 1 Values for lower and upper threshold for minor and major
alarm as well as number of samples and number of periods for the first threshold.
Threshold Set 2 Values for lower and upper threshold for minor and major alarm as well as number of samples and number of periods for the second threshold.
Threshold Set 3 Values for lower and upper threshold for minor and major alarm as well as number of samples and number of periods for the third threshold.
Fault and test management Siemens
MN1783EU11MN_0001 © 2005 Siemens AG
51
Fig. 23 QSTHRS settings

Siemens Fault and test management
MN1783EU11MN_0001© 2005 Siemens AG
52
QSMonBSC command For the QoS Monitor object of the BSC the following parameters can be set:
Parameter Meaning PCU processor load The threshold set defined before, which will be used for
the alarming in case of high PCU processor load.
TDPC processor load The threshold set defined before, which will be used for the alarming in case of high TDPC processor load.
Supervision period The time interval used for the averaging of the load.

Fault and test management Siemens
MN1783EU11MN_0001 © 2005 Siemens AG
53
Fig. 24 Create QSMONBSC command
Fig. 25 QSMONBSC parameters
Siemens Fault and test management
MN1783EU11MN_0001© 2005 Siemens AG
54
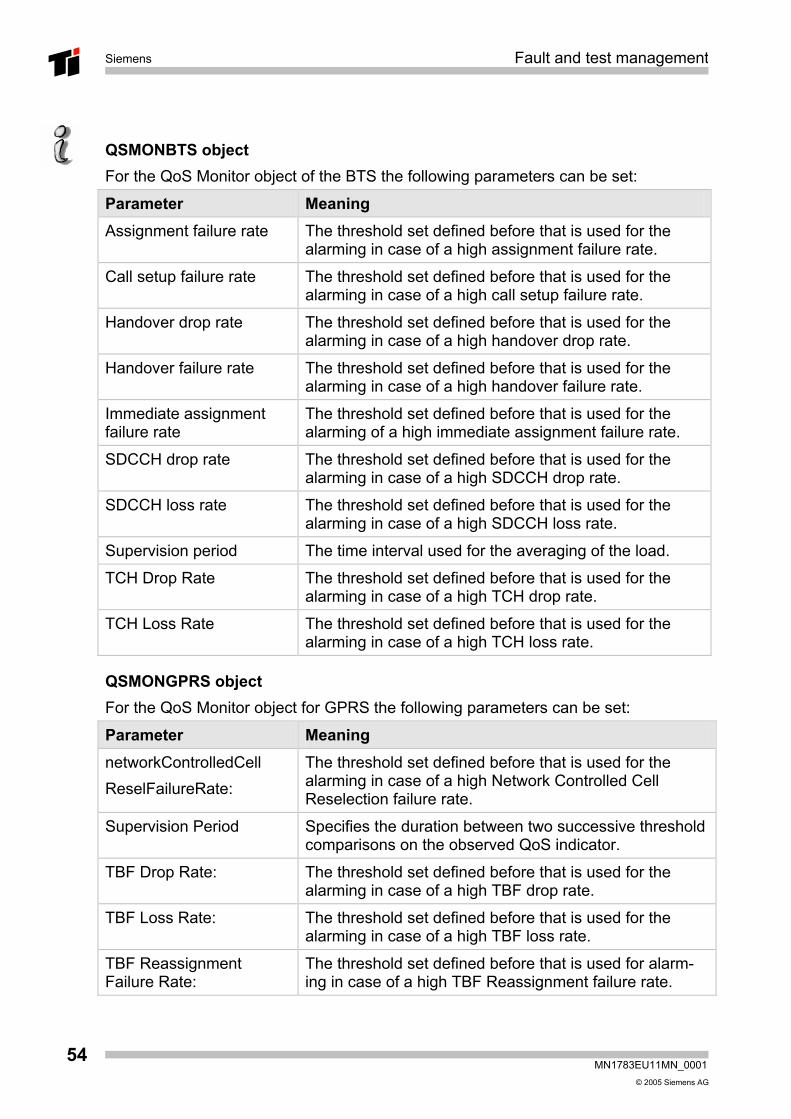
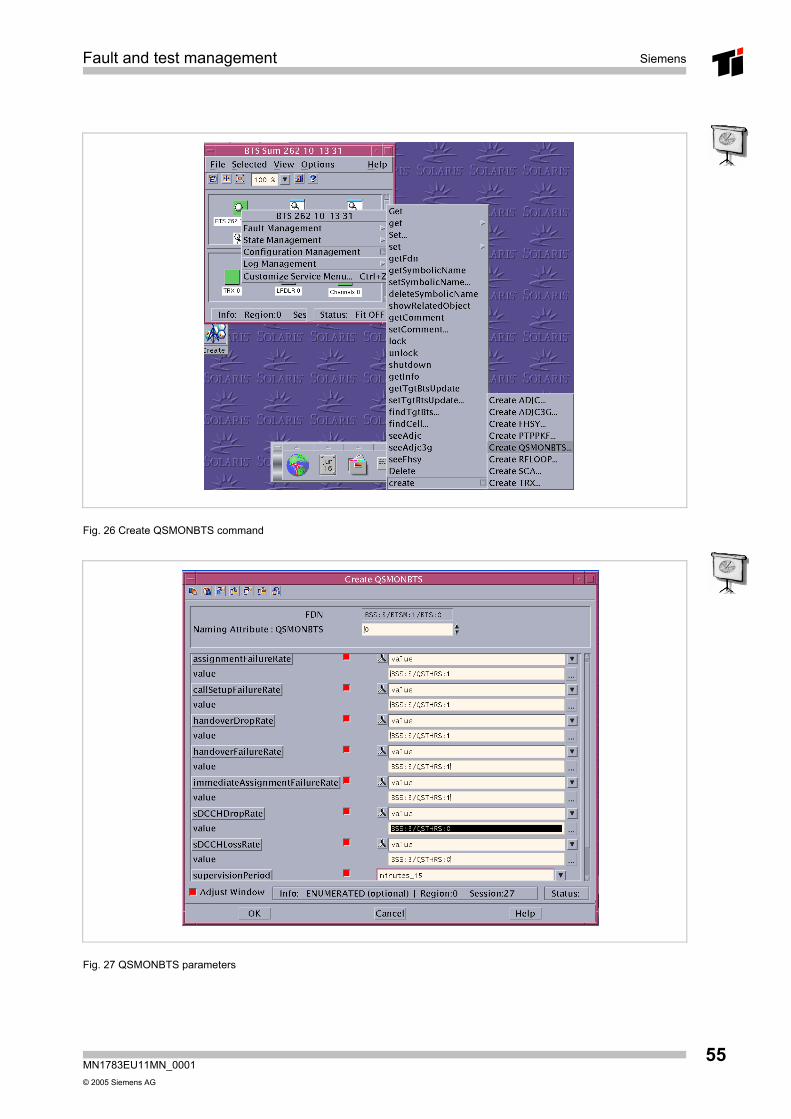
QSMONBTS object For the QoS Monitor object of the BTS the following parameters can be set:
Parameter Meaning Assignment failure rate The threshold set defined before that is used for the
alarming in case of a high assignment failure rate.
Call setup failure rate The threshold set defined before that is used for the alarming in case of a high call setup failure rate.
Handover drop rate The threshold set defined before that is used for the alarming in case of a high handover drop rate.
Handover failure rate The threshold set defined before that is used for the alarming in case of a high handover failure rate.
Immediate assignment failure rate
The threshold set defined before that is used for the alarming of a high immediate assignment failure rate.
SDCCH drop rate The threshold set defined before that is used for the alarming in case of a high SDCCH drop rate.
SDCCH loss rate The threshold set defined before that is used for the alarming in case of a high SDCCH loss rate.
Supervision period The time interval used for the averaging of the load.
TCH Drop Rate The threshold set defined before that is used for the alarming in case of a high TCH drop rate.
TCH Loss Rate The threshold set defined before that is used for the alarming in case of a high TCH loss rate.
QSMONGPRS object For the QoS Monitor object for GPRS the following parameters can be set:
Parameter Meaning networkControlledCell ReselFailureRate:
The threshold set defined before that is used for the alarming in case of a high Network Controlled Cell Reselection failure rate.
Supervision Period Specifies the duration between two successive threshold comparisons on the observed QoS indicator.
TBF Drop Rate: The threshold set defined before that is used for the alarming in case of a high TBF drop rate.
TBF Loss Rate: The threshold set defined before that is used for the alarming in case of a high TBF loss rate.
TBF Reassignment Failure Rate:
The threshold set defined before that is used for alarm-ing in case of a high TBF Reassignment failure rate.
Fault and test management Siemens
MN1783EU11MN_0001 © 2005 Siemens AG
55
Fig. 26 Create QSMONBTS command
Fig. 27 QSMONBTS parameters

Siemens Fault and test management
MN1783EU11MN_0001© 2005 Siemens AG
56
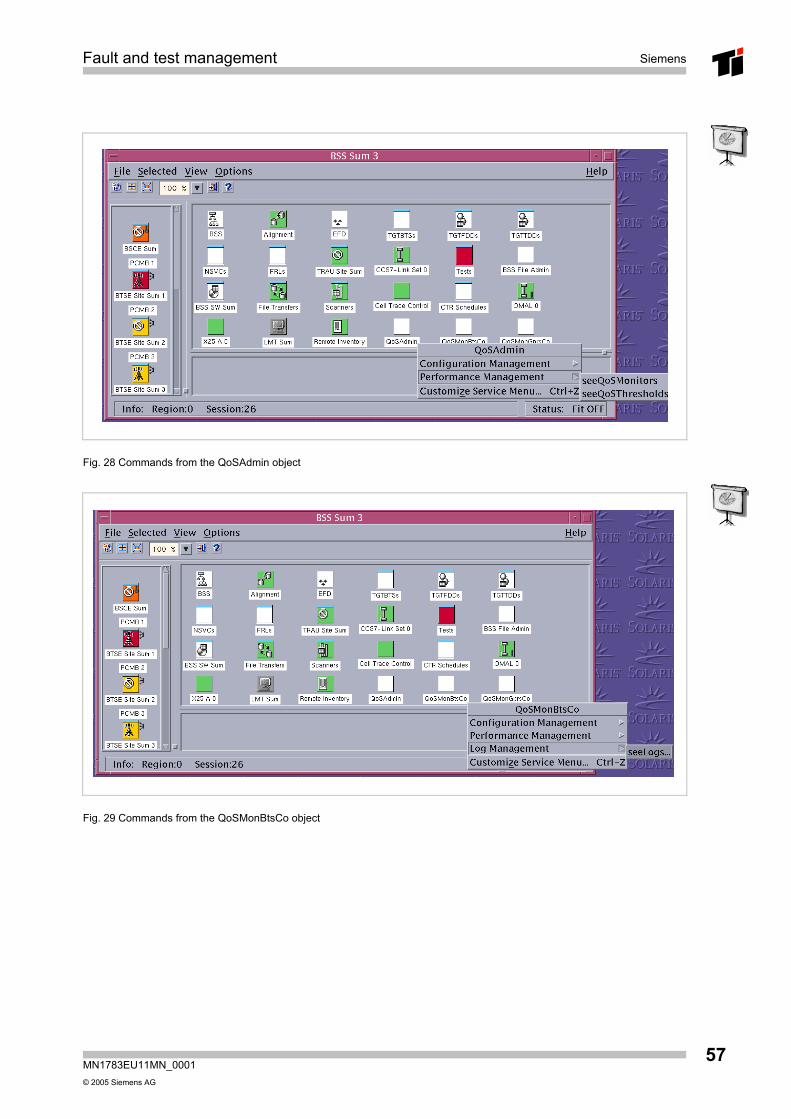
QoSAdmin object From the QoSAdmin object of the BSC the QoSMonitors and the QoSThresholds can be viewed. The results are listed in a table.
QoSMonBtsCo object From the QoS Monitor objects of the BTS and of GPRS the following commands are available:
Commands getComment
setComment
getInfo
seeLogs
Fault and test management Siemens
MN1783EU11MN_0001 © 2005 Siemens AG
57
Fig. 28 Commands from the QoSAdmin object
Fig. 29 Commands from the QoSMonBtsCo object

Siemens Fault and test management
MN1783EU11MN_0001© 2005 Siemens AG
58
4.3.1 Definition of the QoS indicators All QoS indicators are derived from counters used for the performance measurement data collection. 1. TDPC Processor load: from a counter in the PM scanner BSC processor load
(BSCPRCLD). 2. PCU processor load: from several counters in the PM scanner BSC processor
load (BSCPRCLD). 3. TCH Drop Rate: gives the percentage of all TCH drops related to all TCH
connections. It is calculated from the number of CLEAR REQUEST messages (NRCLRREQ) and the number of successful TCH assignments (SUCTCHSE).
4. SDCCH Drop Rate: gives the percentage of all drops of connections during a SDCCH connection. It is calculated from the number of CLEAR REQUEST messages (NRCLRREQ), the total number of assignment failures (TASSFAIL) and the number of successful assignments of signaling channels (NSUCCHPC).
5. Immediate Assignment Failure Rate: gives the ratio between the number of unsuccessful immediate assignments (NSUCCHPC) and the total number of attempted immediate assignments (ATIMASCA).
6. Assignment Failure Rate: gives the number of Assignment Failures divided through the number of Assignment Attempts. It is calculated from the total number of assignment failures (TASSFAIL), the number of CLEAR REQUEST messages (NRCLRREQ) and the total number of assignment attempts (TASSATT).
7. Call Setup Failure Rate: gives the number of call setup failures divided through the number of call setup attempts. It is calculated from the QoS indicators Immediate Assignment Failure Rate, the Assignment Failure Rate and the SDCCH Drop Rate.
8. TCH Loss Rate: gives the rate of TCH Seizure Attempts that could not be handled, because all traffic channels were occupied. It is calculated from the number of attempted TCH seizures meeting a TCH blocked state (ATCHSMBS), the total number of attempted TCH seizures and the number of messages discarded from the TCH queue (NMSGDISQ).
9. SDCCH Loss Rate: gives the rate of SDCCH Seizure Attempts that could not be handled, because all channels were occupied. It is calculated from the number of attempted SDCCH seizures meeting a blocked state (ATSDCMBS) and the total number of attempted SDCCH seizures (NATTSDPE).
10. Handover Drop Rate: gives the rate of unsuccessful handovers with a loss of the MS connection.
11. Handover Failure Rate: gives the rate of unsuccessful handovers without a loss of the MS connection because of reversion to the old cell.
Fault and test management Siemens
MN1783EU11MN_0001 © 2005 Siemens AG
59
12. TBF Drop Rate: gives the TBF Drop Rate (UL and DL combined) as number of unsuccessful terminated TBF (UNSTETBF) divided through the total number of established TBF (SULACCEL).
13. TBF Reassignment Failure Rate: gives the number of unsuccessful PDCH reassignments divided through the number of attempted PDCH reassignments. It is calculated from the number of successful packet resource reassignments (NSUPRRE) and the number of attempted packet resource reassignments (NATPRRE).
14. TBF Loss Rate: gives the rate how often new TBF Requests could not be handled, because e.g. no PDCHs were available. It is calculated from the number of rejected PDCH assignments and the number of attempted PDCH assignments.
15. Network Controlled Cell Reselection Failure Rate: gives the number of unsuccessful Network Controlled Cell Reselections divided through the number of attempted Network Controlled Cell Reselections. It is calculated from the number of unsuccessful network controlled cell reselections and the number of attempted internal network controlled cell reselections.

Siemens Fault and test management
MN1783EU11MN_0001© 2005 Siemens AG
60
Fault and test management Siemens
MN1783EU11MN_0001 © 2005 Siemens AG
61
5 Test Procedure
Siemens Fault and test management
MN1783EU11MN_0001© 2005 Siemens AG
62
Test Management builds up together with Fault Management one of the so-called “Management Functional Areas” as defined by the TMN principles and is an integral part of the operator’s maintenance workflow. Its main purpose is to supervise the functionality of the network or parts of it localizing precisely any malfunction of a device or functionality. Because Test Management constitutes such an important functionality, the Radio Commander offers a separate application for this purpose. The tasks of the Radio Commander Test Management function are to 1. apply and control tests 2. monitor test execution 3. log and present the final test results The primary functions of Test Management are: 1. location and verification of any faults detected in a specific hardware unit by the
hardware checkers 2. detection and location of any latent faults in hardware units by means of periodic
routine tests performed on less frequently used units, modules, or devices 3. checking of new hardware component functions. After a fault has been eliminated, for example by replacing a defective board, the repaired device is checked and the unit can only be restored to traffic if it checks out OK. Operator-controlled tests can be initiated locally from LMT or remotely from RC. After a test has finished, the test results are sent to RC and LMT/BSC and, depending on the tested object, to the local LMT connected to BTSE or TRAUE and may be displayed and logged there. Testing extends only to hardware. Being responsible for the whole Siemens Mobile Radio Network, the Radio Commander manages or initiates testing. The tests themselves are executed by the managed network entity. Tests can be performed either with or without operator control. The Radio Commander also allows routine tests to be scheduled by use of CLI script files. Tests can be activated for objects of the Network Entities or the Radio Commander itself. Test Management comprises operator-controlled tests to verify proper working of managed objects (MO) or to identify faulty components. For the Test Management a specific managed object called Test Object is created by receiving a test request and exists only during the execution of the test themselves. Test objects are created to control and monitor the execution of the test. The test termination can be controlled by the operator, by the stop test command or spontaneous by completion of the test or upon abnormal condition. The test results will be sent at the end of the test processing. Scheduling functionality is provided by Radio Commander only via CLI script files.
Fault and test management Siemens
MN1783EU11MN_0001 © 2005 Siemens AG
63
5.1 Test Types The following test types exist: 1. Initialization tests 2. Automatic tests 3. Routine tests 4. Diagnostic tests Initialization tests are executed automatically at initialization time in the boot phase, or when a board is returned to service. If a test has failed the object remains disabled and, if the faulty board is able to communicate, a failure event report is issued. Automatic tests are for some specific errors, where a mechanism is implemented in the network elements to autonomously execute the appropriate test on faulty units. Routine tests are executed by the operator in order to verify the network element or system functionality. Test results are stored and can be displayed by operator commands. Diagnostic tests can be activated remotely by the operator in order to get further information on a network element which may be useful for maintenance. The network elements provide in-service and/or out-of-service diagnostic routines that locate faults and identify the smallest replaceable / repairable unit of hardware.
Siemens Fault and test management
MN1783EU11MN_0001© 2005 Siemens AG
64
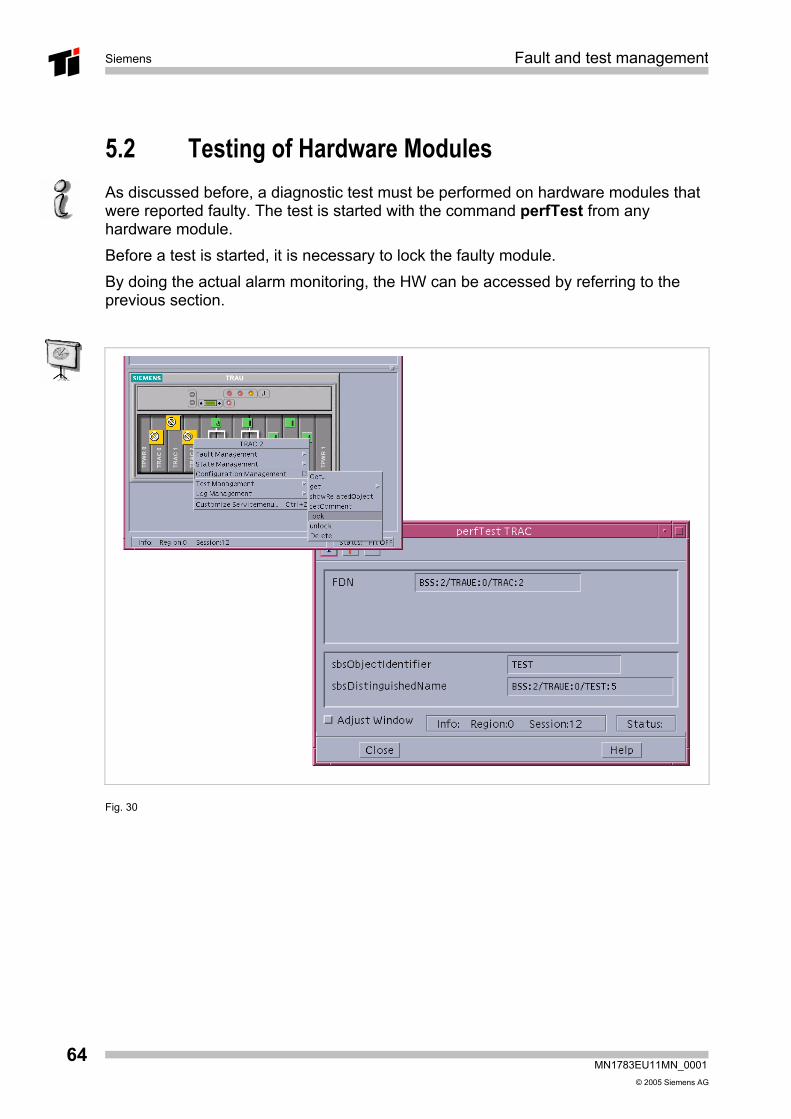
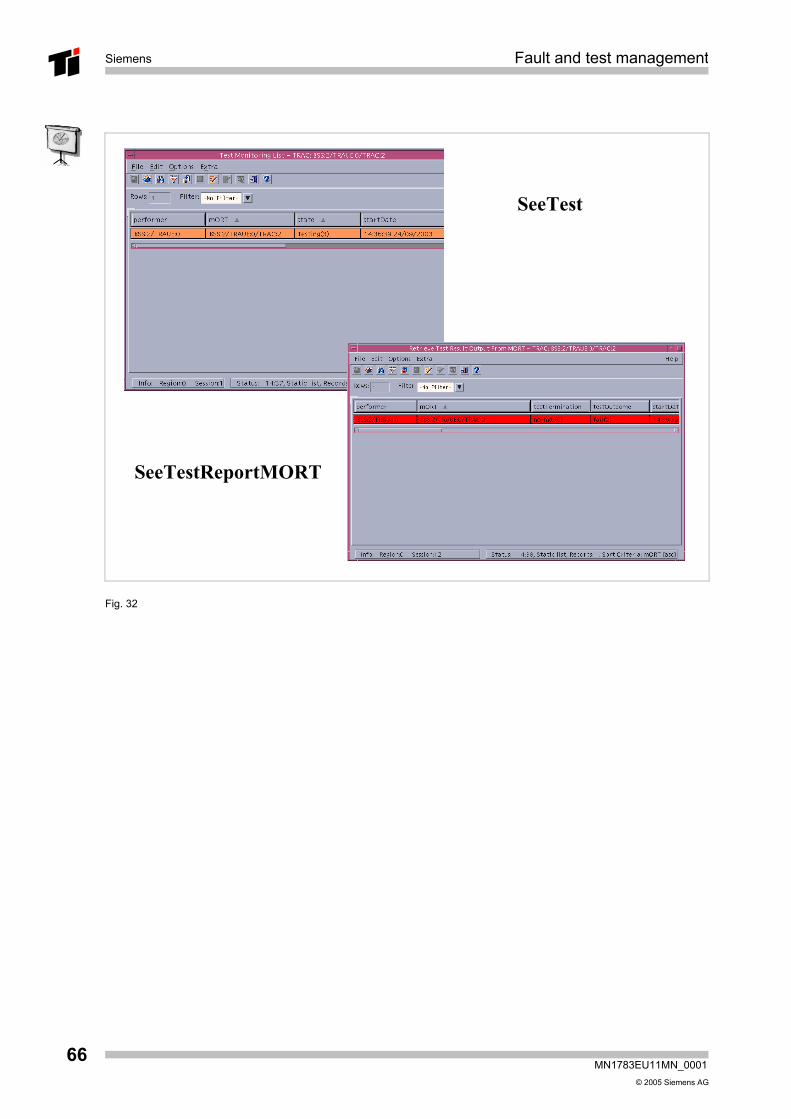
5.2 Testing of Hardware Modules As discussed before, a diagnostic test must be performed on hardware modules that were reported faulty. The test is started with the command perfTest from any hardware module. Before a test is started, it is necessary to lock the faulty module. By doing the actual alarm monitoring, the HW can be accessed by referring to the previous section.
Fig. 30
Fault and test management Siemens
MN1783EU11MN_0001 © 2005 Siemens AG
65
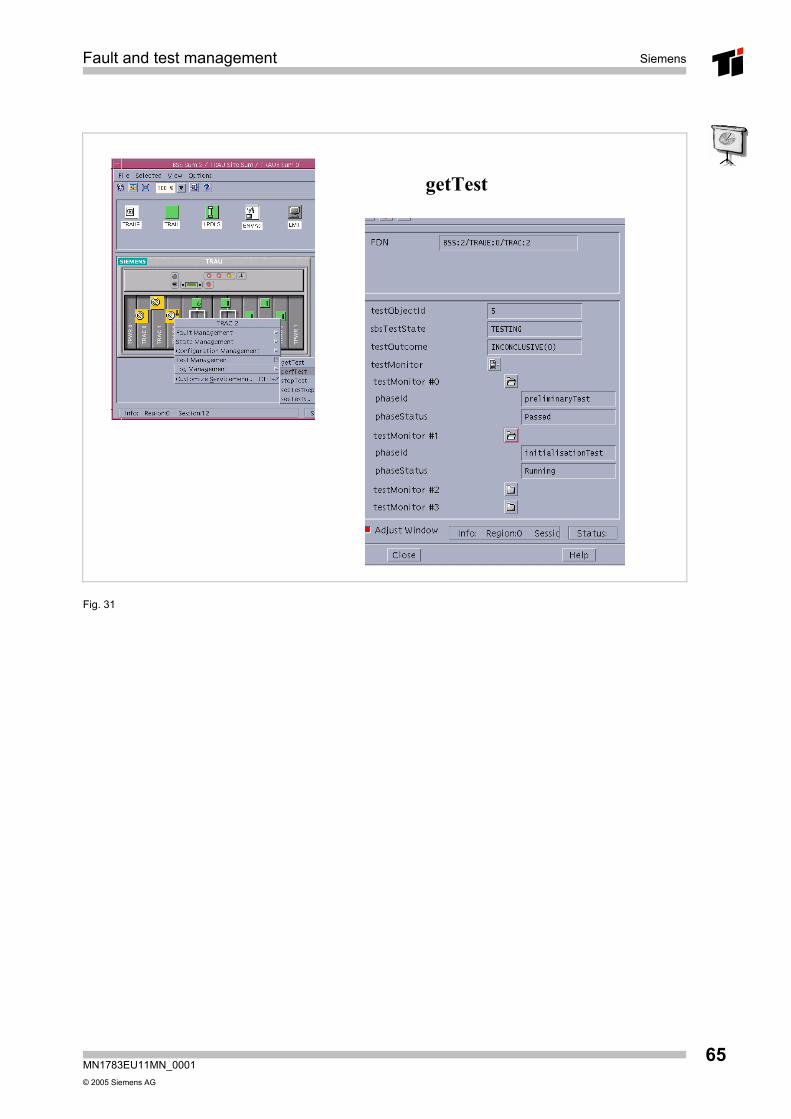
getTest
Fig. 31
Siemens Fault and test management
MN1783EU11MN_0001© 2005 Siemens AG
66
SeeTest
SeeTestReportMORT
Fig. 32
Fault and test management Siemens
MN1783EU11MN_0001 © 2005 Siemens AG
67
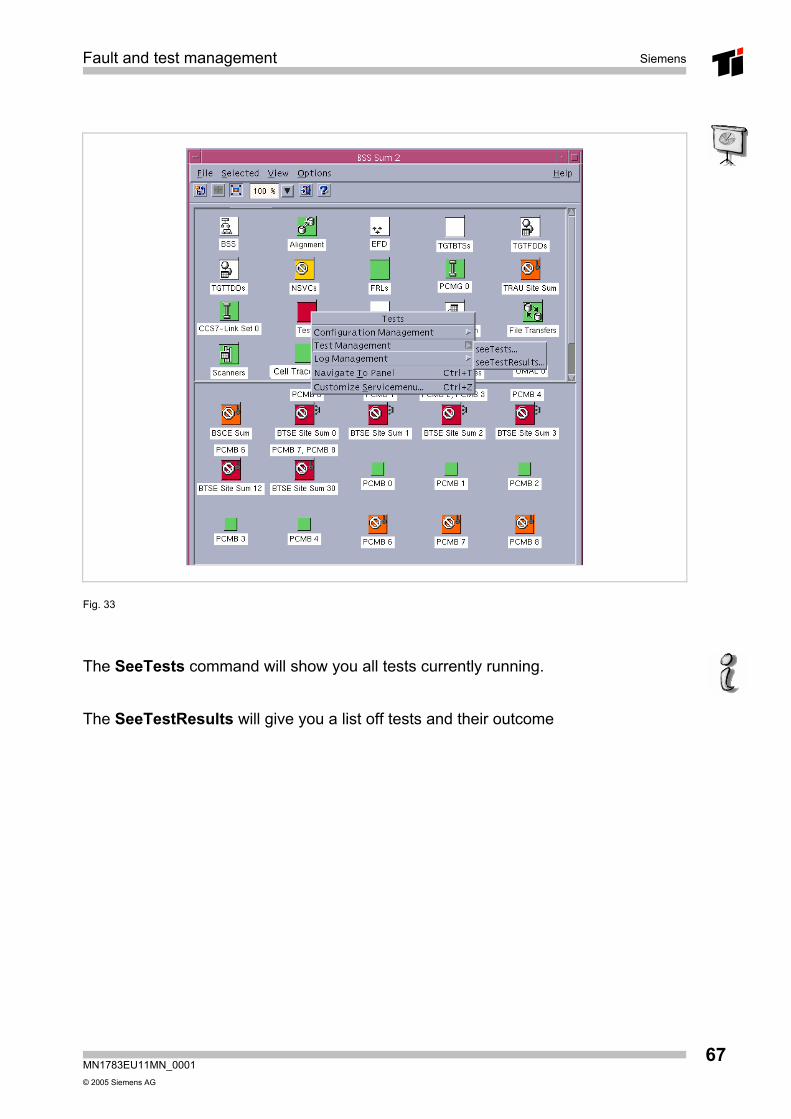
Fig. 33
The SeeTests command will show you all tests currently running. The SeeTestResults will give you a list off tests and their outcome
Siemens Fault and test management
MN1783EU11MN_0001© 2005 Siemens AG
68
5.3 Automatic Recovery of Faulty Boards BSC-TRAU
5.3.1 Overview The Siemens BSS provides the capability to recover faulty equipment objects automatically without the need of an operator-initiated action. This feature is similar to the automatic recovery procedure for BTSE equipment. The automatic recovery procedure is triggered if the reset cause is 'plug-in' and if the concerned BSC/TRAU equipment object is in the operational state Disabled, in the administrative state Unlocked and if its availability status is Failed. The capability of an HMO to perform an automatic recovery is indicated by attribute. 1. In case of a successful recovery attempt, the equipment object will become
Enabled again and also its functionality will be recovered. For instance, if this automatic procedure is performed successfully on an STLP (in a BSCE), which is in state Disabled and Failed the STLP becomes Enabled again and the associated PCM lines (e.g. PCMB) are put into the Enabled state, too.
2. In case of an unsuccessful recovery attempt, the object remains in the Disabled and Failed state and the operator is informed via related alarm and test result messages.
Fault and test management Siemens
MN1783EU11MN_0001 © 2005 Siemens AG
69
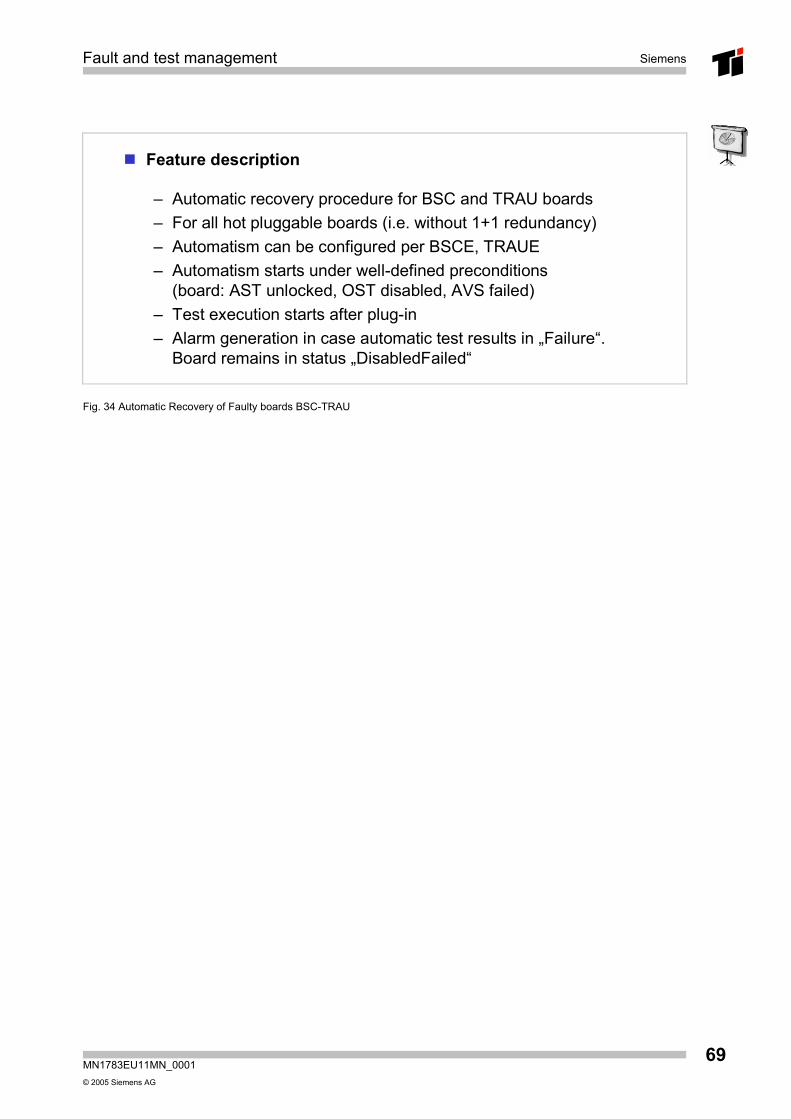
Feature description
– Automatic recovery procedure for BSC and TRAU boards– For all hot pluggable boards (i.e. without 1+1 redundancy) – Automatism can be configured per BSCE, TRAUE– Automatism starts under well-defined preconditions
(board: AST unlocked, OST disabled, AVS failed)– Test execution starts after plug-in– Alarm generation in case automatic test results in „Failure“.
Board remains in status „DisabledFailed“
Fig. 34 Automatic Recovery of Faulty boards BSC-TRAU
Siemens Fault and test management
MN1783EU11MN_0001© 2005 Siemens AG
70
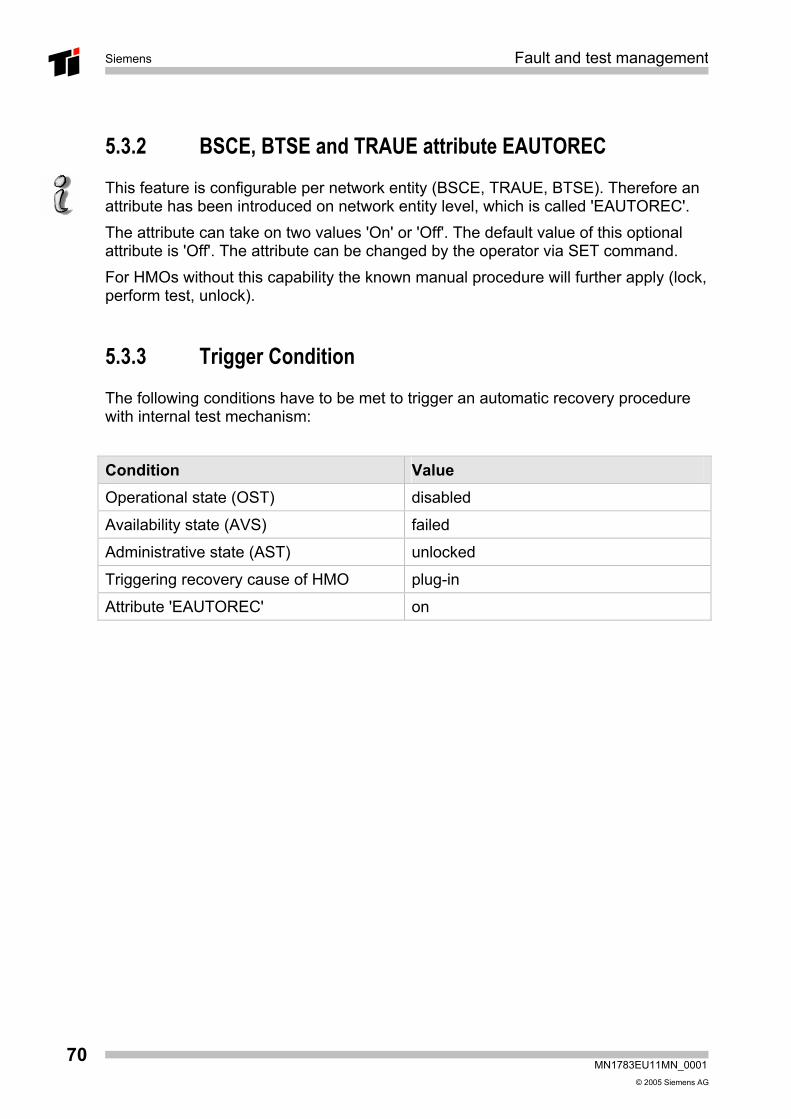
5.3.2 BSCE, BTSE and TRAUE attribute EAUTOREC This feature is configurable per network entity (BSCE, TRAUE, BTSE). Therefore an attribute has been introduced on network entity level, which is called 'EAUTOREC'. The attribute can take on two values 'On' or 'Off'. The default value of this optional attribute is 'Off'. The attribute can be changed by the operator via SET command. For HMOs without this capability the known manual procedure will further apply (lock, perform test, unlock).
5.3.3 Trigger Condition The following conditions have to be met to trigger an automatic recovery procedure with internal test mechanism:
Condition Value Operational state (OST) disabled
Availability state (AVS) failed
Administrative state (AST) unlocked
Triggering recovery cause of HMO plug-in
Attribute 'EAUTOREC' on
Fault and test management Siemens
MN1783EU11MN_0001 © 2005 Siemens AG
71
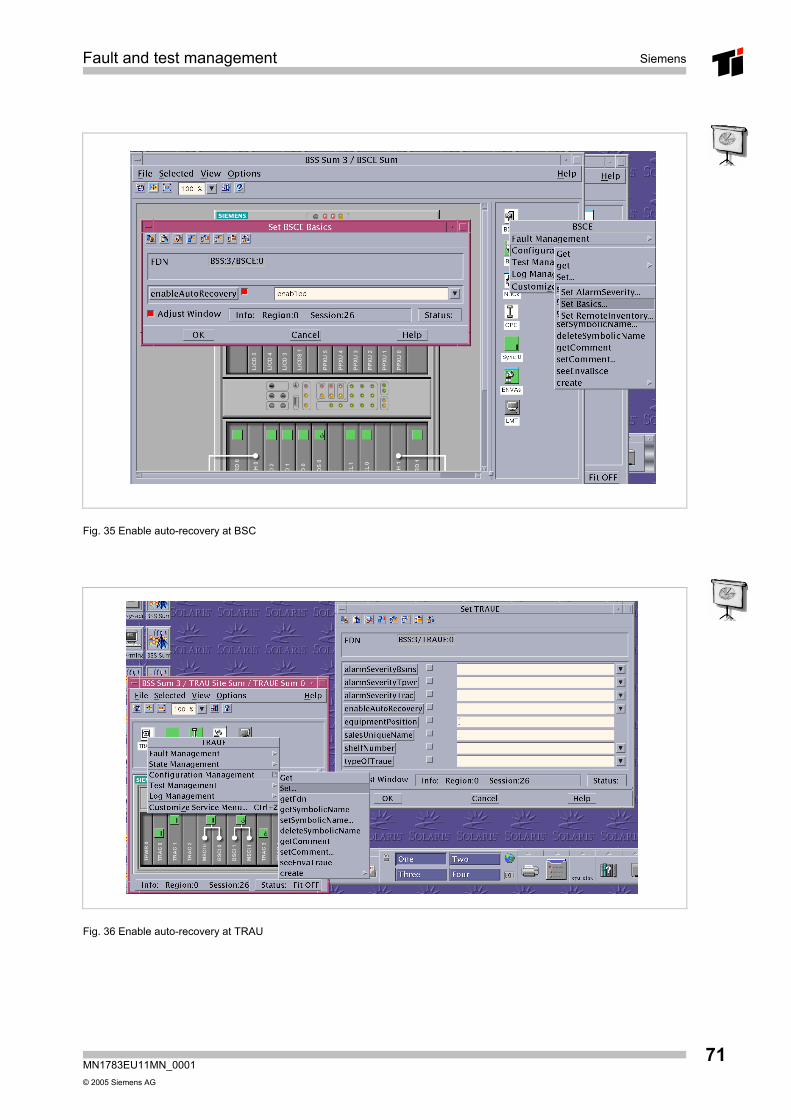
Fig. 35 Enable auto-recovery at BSC
Fig. 36 Enable auto-recovery at TRAU
Siemens Fault and test management
MN1783EU11MN_0001© 2005 Siemens AG
72
5.3.4 Test Execution and Test Reporting The triggered internal test procedure is identical to the normal “operator initiated” test procedure concerning sort, number and order of performed tests, except that the test procedure is not triggered by the operator and no locking and unlocking is needed. The lock command is obsolete since a faulty object is already in state Disabled and Failed and thus no functionality has to be taken out of service. Automatic recovery on locked objects is actually explicitly prohibited in order not to interfere with operator-initiated actions.
5.3.5 Alarm Handling It is essential for the operator to get informed about the outcome of a triggered recovery procedure. This is especially the case for remote and difficult to reach sites. Therefore the outstanding alarm will be ceased and a new alarm with the information "Test failed" will be generated in case the recovery procedure fails. This way the operator takes notice of any activities concerning the faulty board. The test result notification is not appropriate for this purpose since the test report is just logged on RC and does not prompt the operator for an action. If the recovery procedure succeeds the active alarm is ceased.
Fault and test management Siemens
MN1783EU11MN_0001 © 2005 Siemens AG
73
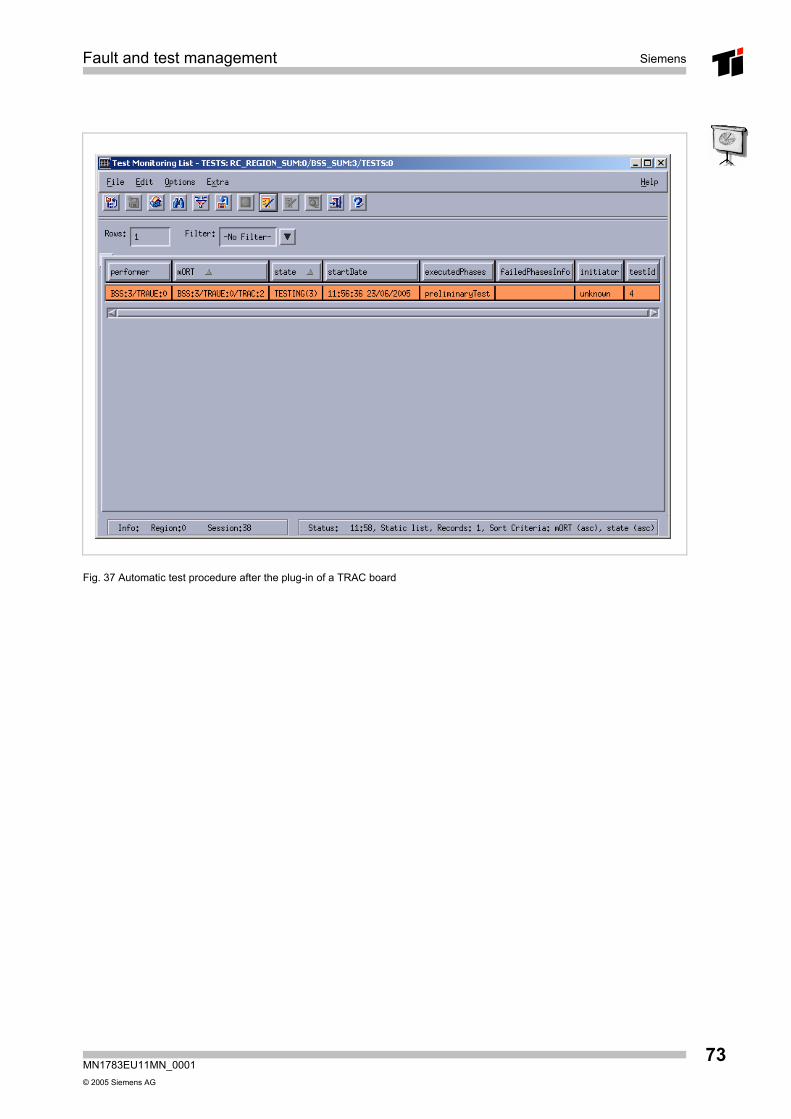
Fig. 37 Automatic test procedure after the plug-in of a TRAC board

Siemens Fault and test management
MN1783EU11MN_0001© 2005 Siemens AG
74

Fault and test management Siemens
MN1783EU11MN_0001 © 2005 Siemens AG
75
6 Alarm Log File
Siemens Fault and test management
MN1783EU11MN_0001© 2005 Siemens AG
76
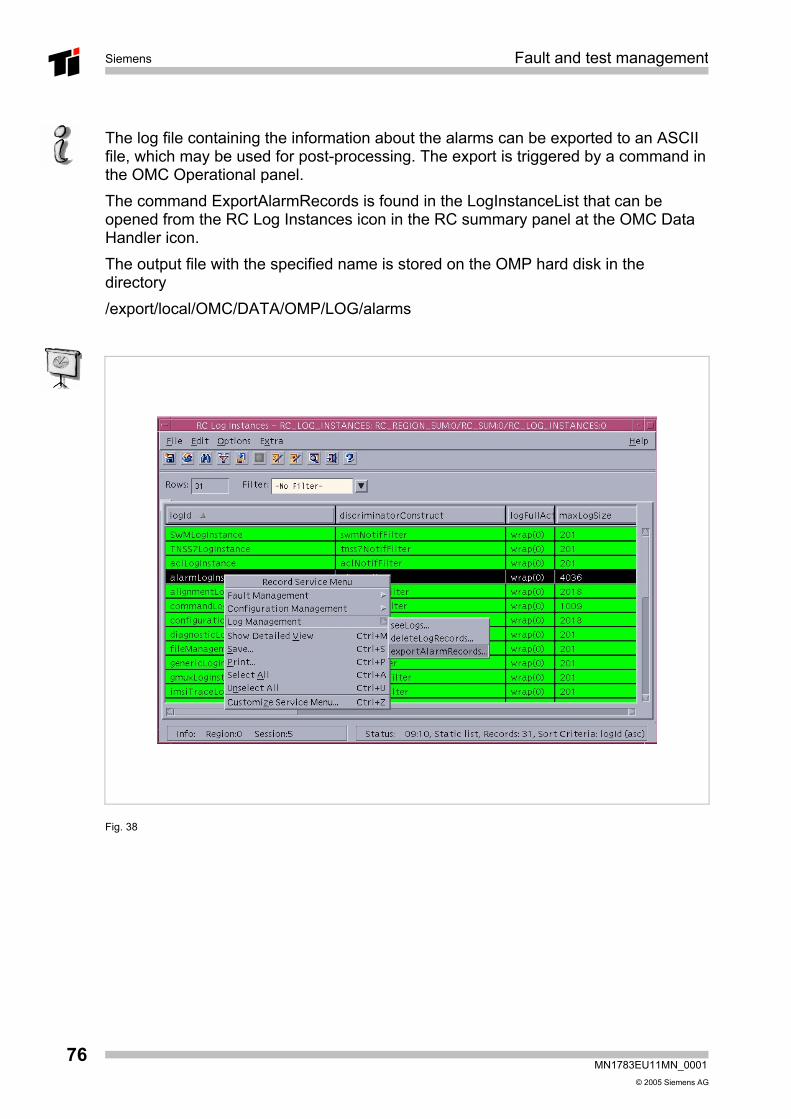
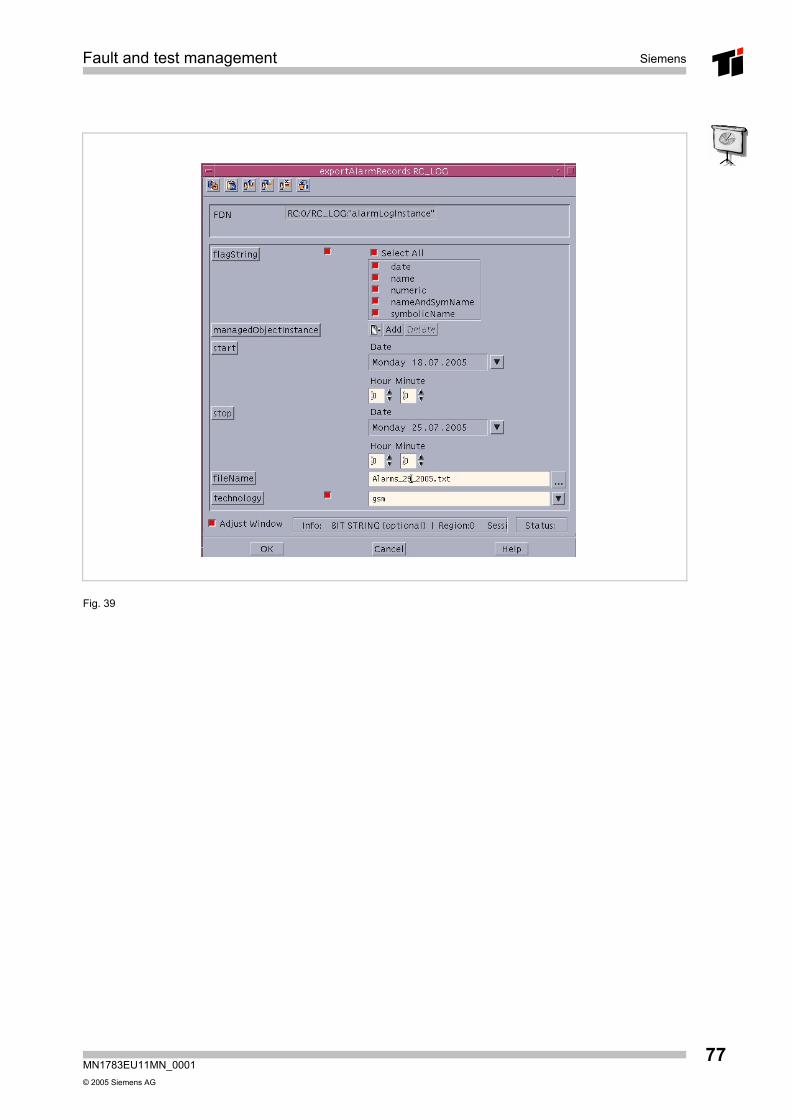
The log file containing the information about the alarms can be exported to an ASCII file, which may be used for post-processing. The export is triggered by a command in the OMC Operational panel. The command ExportAlarmRecords is found in the LogInstanceList that can be opened from the RC Log Instances icon in the RC summary panel at the OMC Data Handler icon. The output file with the specified name is stored on the OMP hard disk in the directory /export/local/OMC/DATA/OMP/LOG/alarms
Fig. 38
Fault and test management Siemens
MN1783EU11MN_0001 © 2005 Siemens AG
77
Fig. 39

Siemens Fault and test management
MN1783EU11MN_0001© 2005 Siemens AG
78
Fault and test management Siemens
MN1783EU11MN_0001 © 2005 Siemens AG
79
7 Exercise

Siemens Fault and test management
MN1783EU11MN_0001© 2005 Siemens AG
80
Fault and test management Siemens
MN1783EU11MN_0001 © 2005 Siemens AG
81
Exercise 1 Title: Fault handling of BTS Equipment
Objectives: Handling of BTS faults
Pre-requisite: (Simulated) HW fault in test system
Task
For a simulated fault of BTS hardware perform the fault and test procedures. First perform all steps with the BTSE attribute EAUTOREC set to false, then with EAUTOREC set to true.
Repeat the exercise for BSC and TRAU hardware faults.
Query
Where is the EAUTOREC attribute set?

Siemens Fault and test management
MN1783EU11MN_0001© 2005 Siemens AG
82
Fault and test management Siemens
MN1783EU11MN_0001 © 2005 Siemens AG
83
Exercise 2 Title: Correlation between CSER and FER
Objectives: Find the correlation between the changes of state and status attributes of an object to a failure events
Pre-requisite: All TRAU of test system shall be locked first, BSC must not have SYNE objects
Task
Prepare the system as described in Prerequisites.
Check the state of the BSC synchronization. It should be disabled/dependency.
Find the related fault which has caused the state change of the SYNC object.

Siemens Fault and test management
MN1783EU11MN_0001© 2005 Siemens AG
84
Fault and test management Siemens
MN1783EU11MN_0001 © 2005 Siemens AG
85
8 Solution

Siemens Fault and test management
MN1783EU11MN_0001© 2005 Siemens AG
86
Fault and test management Siemens
MN1783EU11MN_0001 © 2005 Siemens AG
87
Solution 1 Title: Fault handling of BTS Equipment
Objectives: Handling of BTS faults
Pre-requisite: (Simulated) HW fault in test system
Task
For a simulated fault of BTS hardware perform the fault and test procedures. First perform all steps with the BTSE attribute EAUTOREC set to false, then with EAUTOREC set to true.
Query
Where is the EAUTOREC attribute set?
The EAUTOREC attribute is set for the BTSE object as basic parameter.
Siemens Fault and test management
MN1783EU11MN_0001© 2005 Siemens AG
88
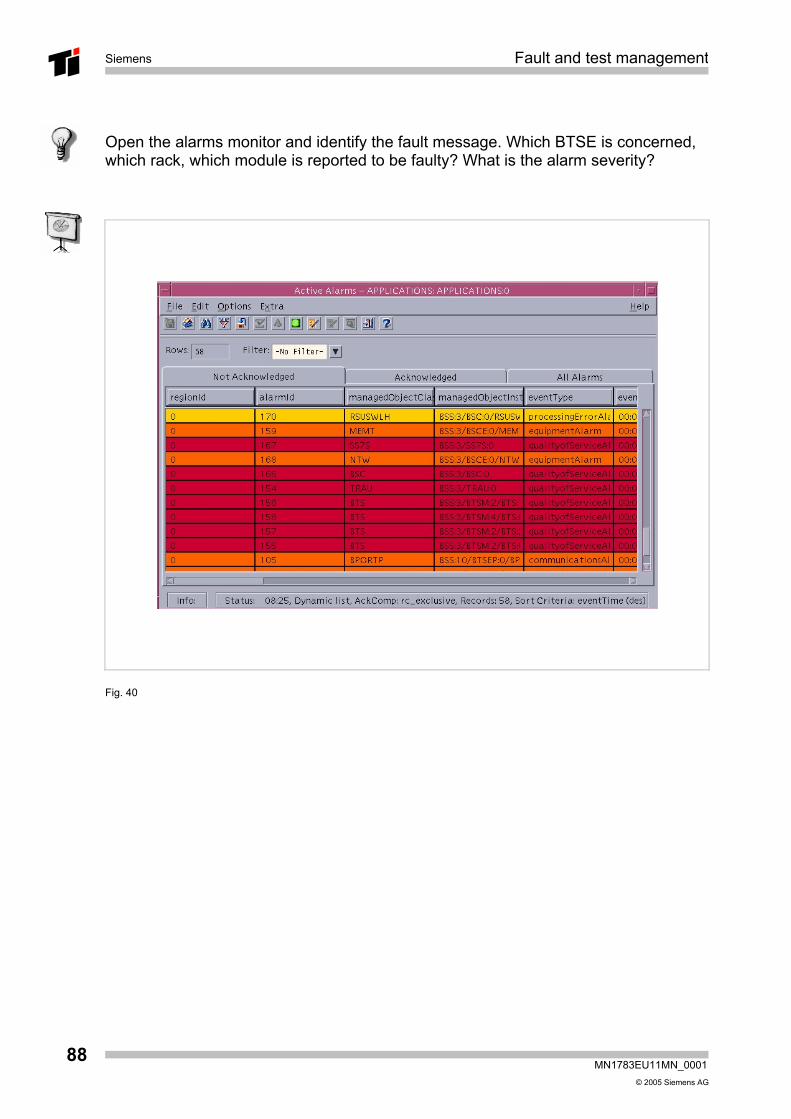
Open the alarms monitor and identify the fault message. Which BTSE is concerned, which rack, which module is reported to be faulty? What is the alarm severity?
Fig. 40
Fault and test management Siemens
MN1783EU11MN_0001 © 2005 Siemens AG
89
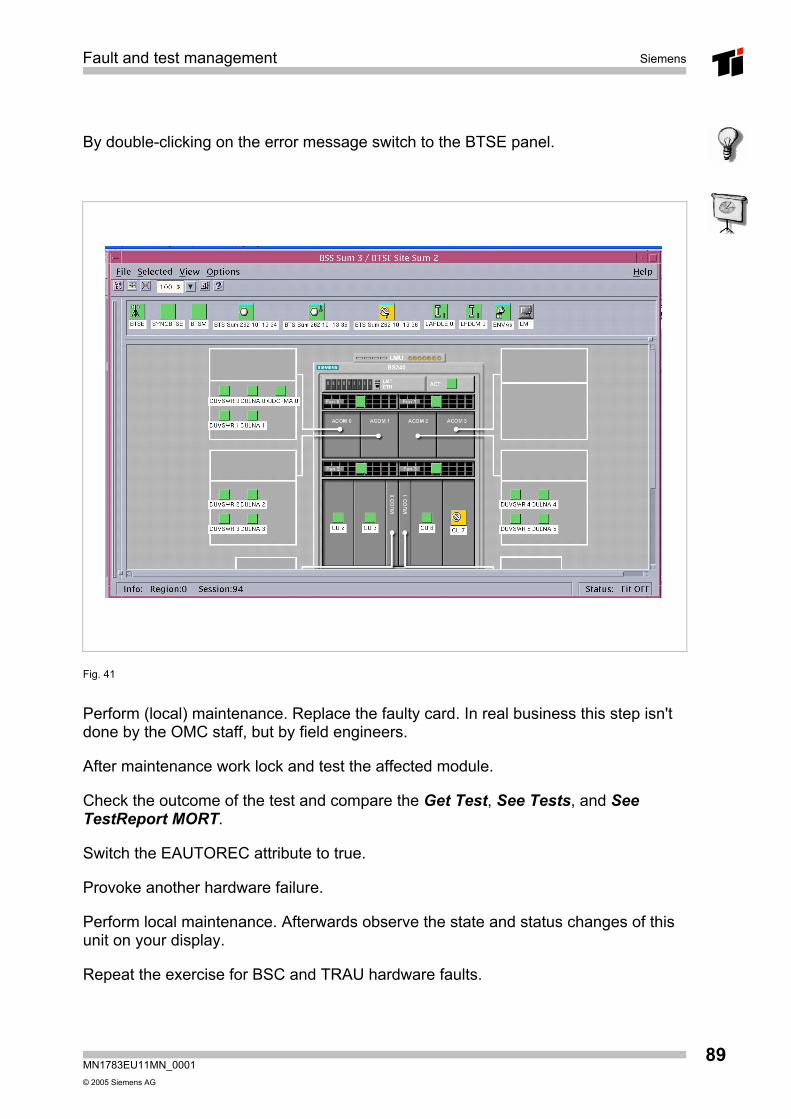
By double-clicking on the error message switch to the BTSE panel.
Fig. 41
Perform (local) maintenance. Replace the faulty card. In real business this step isn't done by the OMC staff, but by field engineers.
After maintenance work lock and test the affected module.
Check the outcome of the test and compare the Get Test, See Tests, and See TestReport MORT.
Switch the EAUTOREC attribute to true.
Provoke another hardware failure.
Perform local maintenance. Afterwards observe the state and status changes of this unit on your display.
Repeat the exercise for BSC and TRAU hardware faults.

Siemens Fault and test management
MN1783EU11MN_0001© 2005 Siemens AG
90
Fault and test management Siemens
MN1783EU11MN_0001 © 2005 Siemens AG
91
Solution 2 Title: Correlation between CSER and FER
Objectives: Find the correlation between the changes of state and status attributes of an object to a failure events
Pre-requisite: All TRAU of test system shall be locked first, BSC must not have SYNE objects
A CU has a HW problem
Task
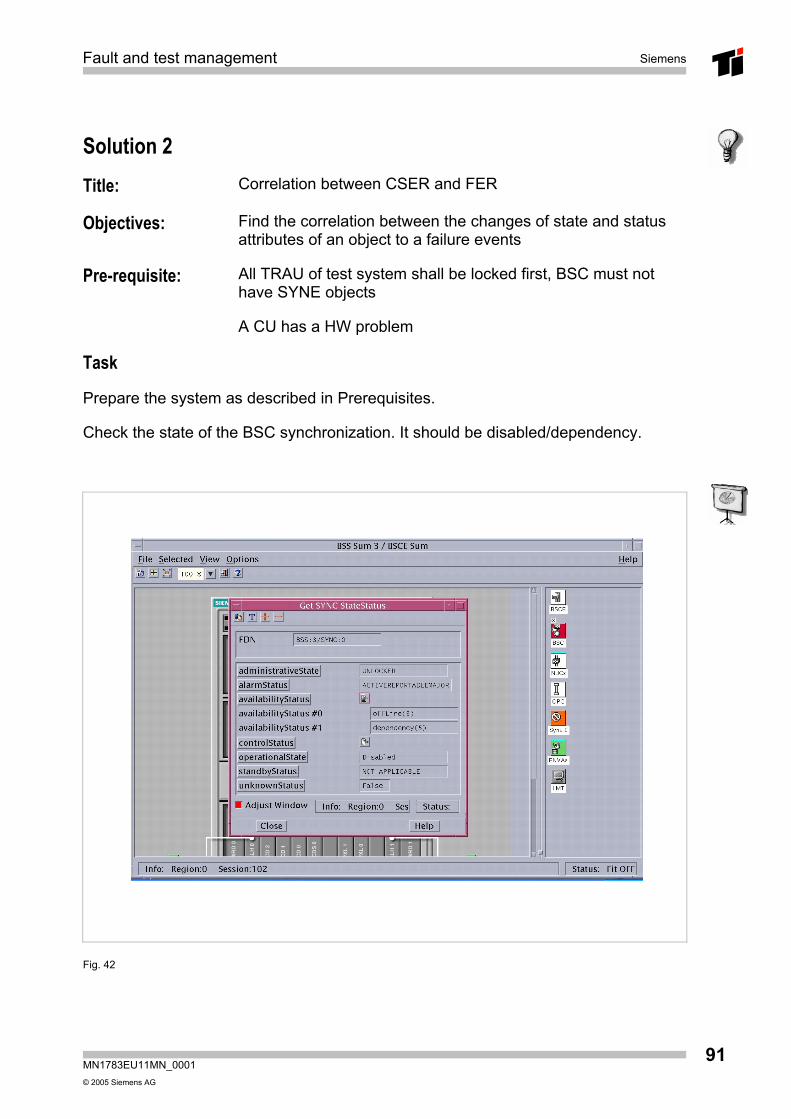
Prepare the system as described in Prerequisites.
Check the state of the BSC synchronization. It should be disabled/dependency.
Fig. 42
Siemens Fault and test management
MN1783EU11MN_0001© 2005 Siemens AG
92
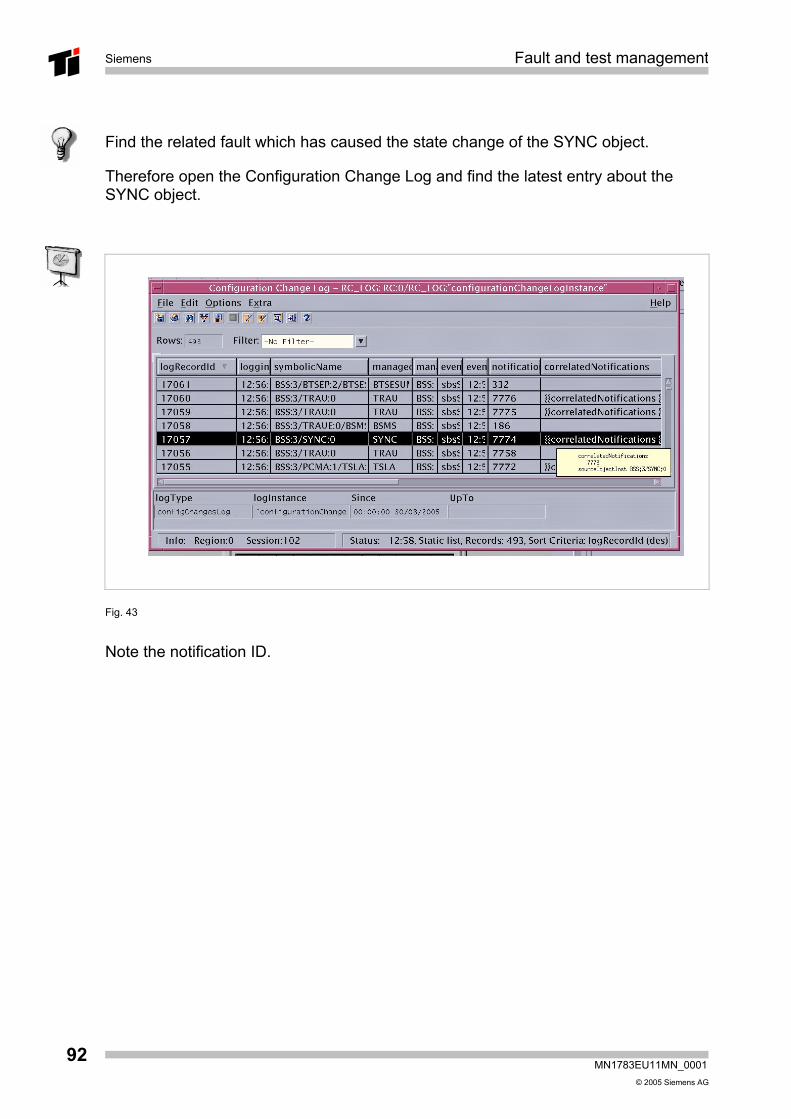
Find the related fault which has caused the state change of the SYNC object.
Therefore open the Configuration Change Log and find the latest entry about the SYNC object.
Fig. 43
Note the notification ID.
Fault and test management Siemens
MN1783EU11MN_0001 © 2005 Siemens AG
93
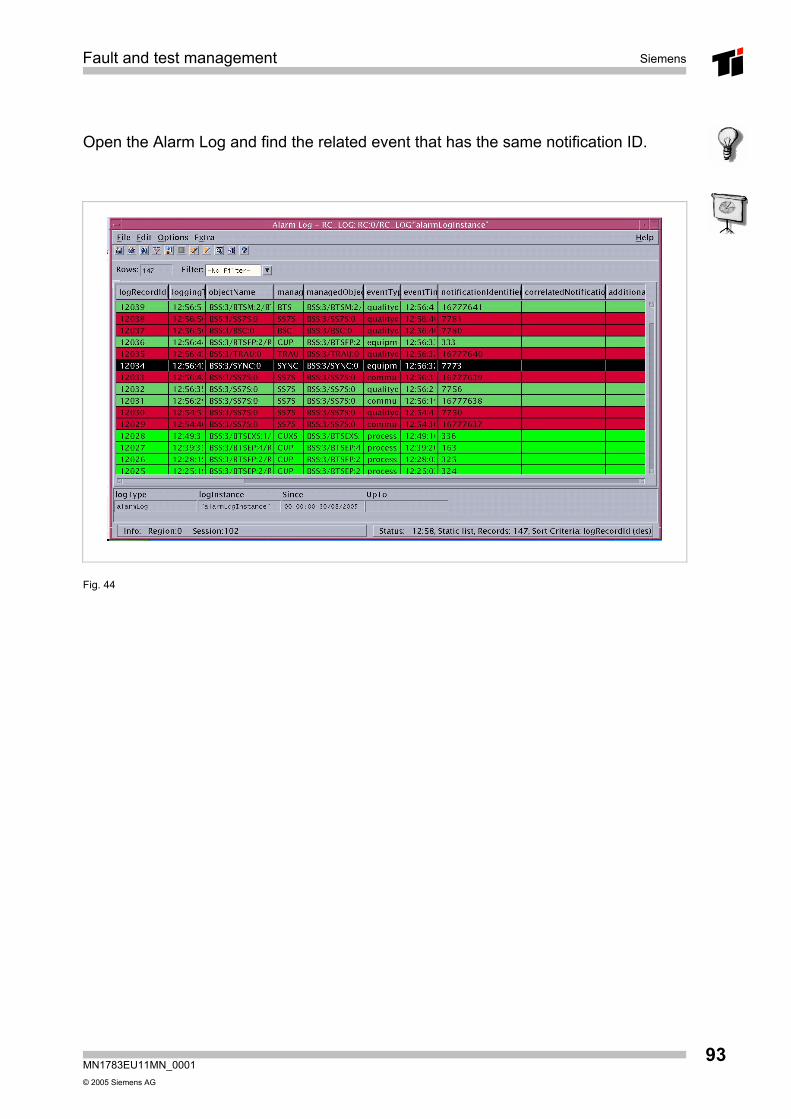
Open the Alarm Log and find the related event that has the same notification ID.
Fig. 44

Siemens Fault and test management
MN1783EU11MN_0001© 2005 Siemens AG
94
Related Documents