MSTRS MOVES Review Work group September 25, 2012 Andrew Eilbert, Ari Kahan Air Quality & Modeling Center Assessment and Standards Division U.S. EPA Office of Transportation & Air Quality Proposed Exhaust Emission Rates for Compressed Natural Gas Transit Buses in MOVES2013

05 Cng Buses
Dec 25, 2015
cng bus overview
Welcome message from author
This document is posted to help you gain knowledge. Please leave a comment to let me know what you think about it! Share it to your friends and learn new things together.
Transcript

MSTRS MOVES Review Work group September 25, 2012
Andrew Eilbert, Ari Kahan
Air Quality & Modeling Center Assessment and Standards Division
U.S. EPA Office of Transportation & Air Quality
Proposed Exhaust Emission Rates for
Compressed Natural Gas Transit Buses in MOVES2013

Overview Literature review MOVES2010b Analysis Creating Proposed MOVES2013 rates
Outline
2 http://www.flickr.com/photos/channaher/2973554252/
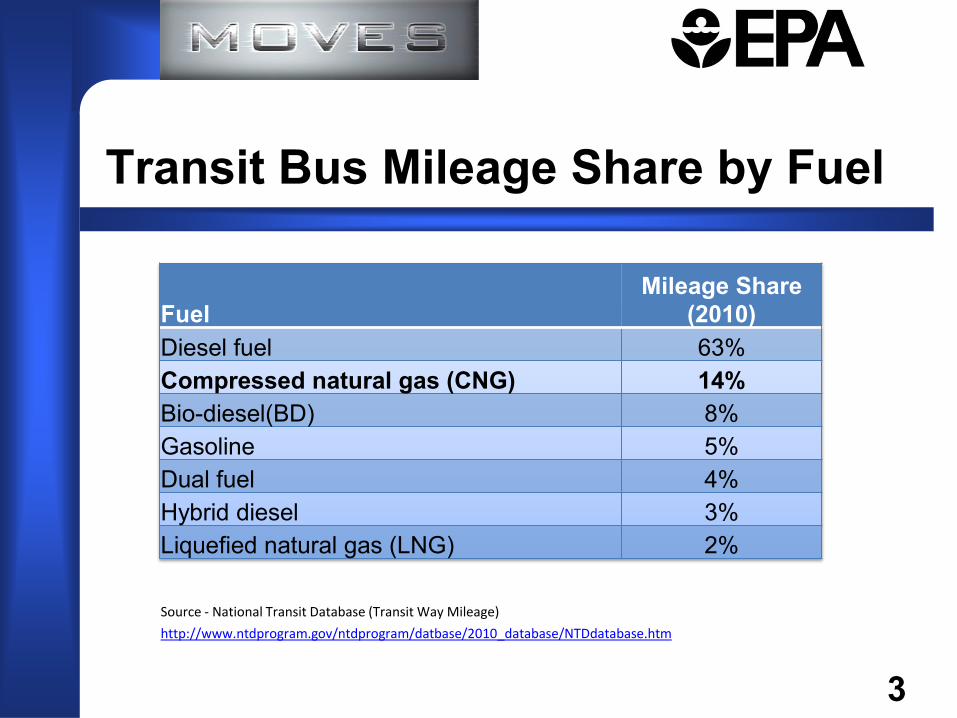
Source - National Transit Database (Transit Way Mileage)
http://www.ntdprogram.gov/ntdprogram/datbase/2010_database/NTDdatabase.htm
Transit Bus Mileage Share by Fuel
3
Fuel Mileage Share
(2010) Diesel fuel 63% Compressed natural gas (CNG) 14% Bio-diesel(BD) 8% Gasoline 5% Dual fuel 4% Hybrid diesel 3% Liquefied natural gas (LNG) 2%

Bus CNG Consumption
4 - Chart from EIA Alternative Fuels Database (http://www.eia.gov/renewable/afv/users.cfm)

Between 2003 and 2010, the number of CNG fueled buses and quantity of CNG consumed has approximately doubled
Buses consume about 75% of the CNG used in transportation
Considered by municipalities for a variety of reasons
– Price of fuel – Potential for central refueling infrastructures
Background
5

Motor gasoline, diesel, and CNG are the only fuels in the default vehicle population in MOVES2010b
– Other fuels (ex. electricity) are available to the user through the alternate vehicle and fuels importer (AVFT)
MOVES2010b CNG bus HC/CO/NOx/PM rates are the
MOVES2010b gasoline medium heavy duty (MHD) rates – Result of timing, priorities, and data limitations in MOVES2010 – Increasing prevalence of CNG buses increases relevance for
MOVES2013 MHD gasoline rates documented in “Development of Emission Rates
for Heavy-Duty Vehicles in the Motor Vehicle Emissions Simulator MOVES2010 (EPA-420-B-12-049)”
MHD is regulatory class 46, 19k - 33k pounds GVWR
CNG Buses in MOVES2010b
6

Conducted literature review – Modal data (1 hz) was not readily available – EPA maintains longer term interest in this data
Compared test cycle results from literature against simulated test cycles using MOVES
– “On-road” vehicles more representative than certification data – Test cycle simulation
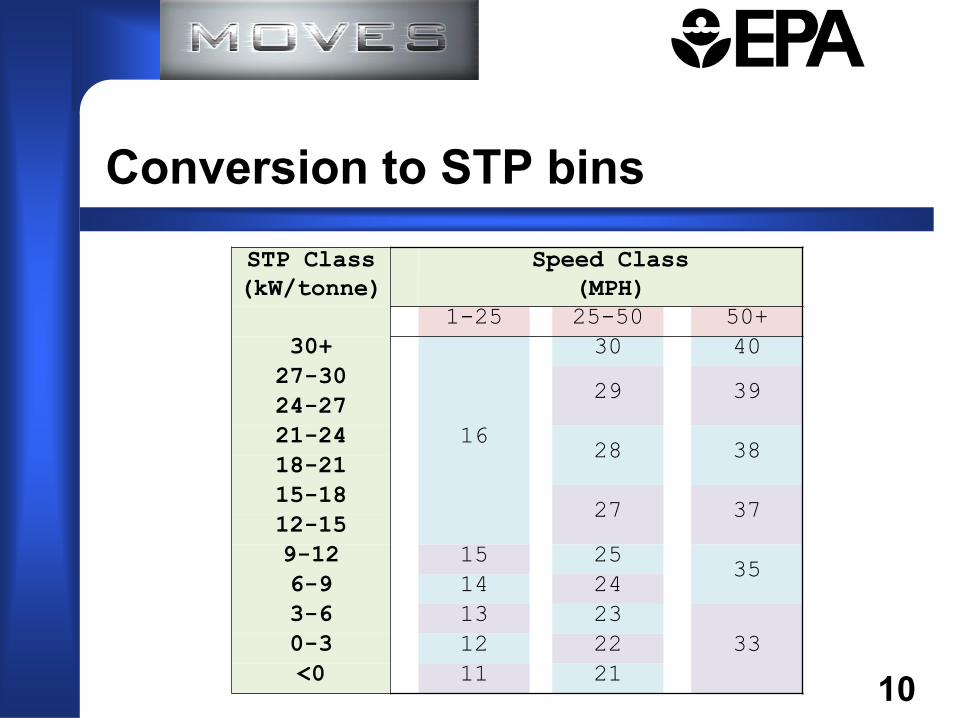
Configure and run MOVES with relevant drive cycle – Determine op mode distribution
Using op mode distribution, emission rates, and total cycle time, calculate emissions on test cycle
– Emission Ratecycle = ∑(Rateop mode * Timeop mode) / Distancecycle
Benchmarking MOVES2010b CNG Bus Emission Rates
7

HD Transit Bus Drive Traces
Drive trace images from DieselNet

HD Transit Bus Drive Traces
Drive trace images from DieselNet
STP Class
(kW/tonne)
Speed Class
(MPH)
1-25 25-50 50+
30+
16
30 40
27-30 29 39
24-27
21-24 28 38
18-21
15-18 27 37
12-15
9-12 15 25 35
6-9 14 24
3-6 13 23
33 0-3 12 22
<0 11 21
Conversion to STP bins
10

Corresponding Op Mode Distributions
0
100
200
300
400
500
600
700
0 11 13 15 21 23 25 28 30 35 38 40 Ti
me
(sec
) Op Mode
Heavy-Duty Urban Dynamometer Driving Schedule
0
100
200
300
400
500
600
700
800
900
0 12 15 22 25 29 35 39
Tim
e (s
ec)
Op Mode
Washington Metropolitan Area Transit Authority
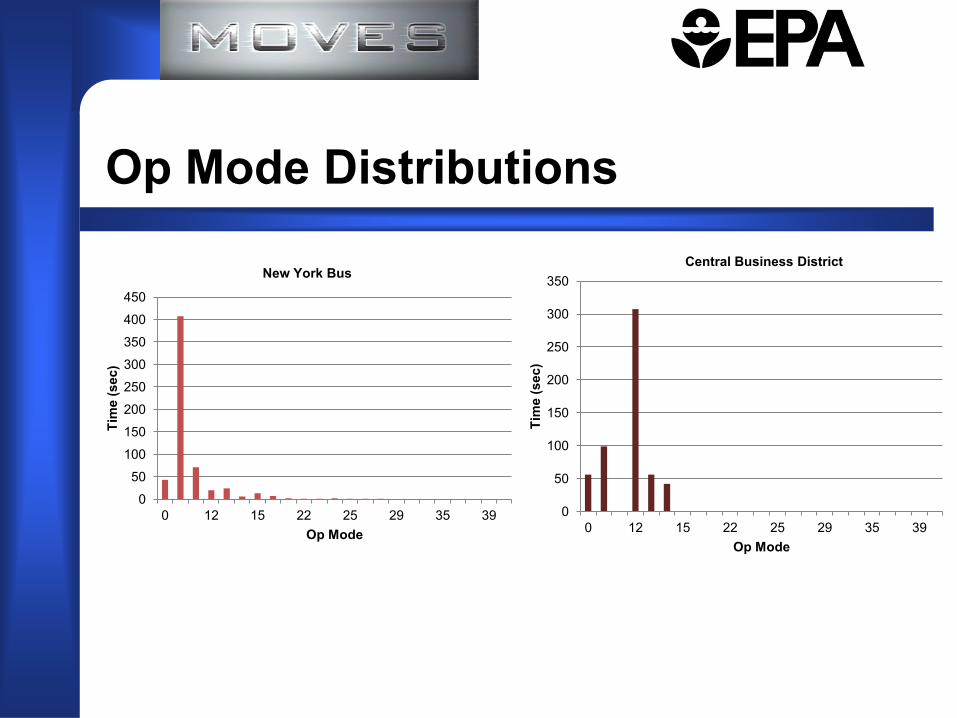
Op Mode Distributions
0
50
100
150
200
250
300
350
400
450
0 12 15 22 25 29 35 39
Tim
e (s
ec)
Op Mode
New York Bus
0
50
100
150
200
250
300
350
0 12 15 22 25 29 35 39 Ti
me
(sec
) Op Mode
Central Business District
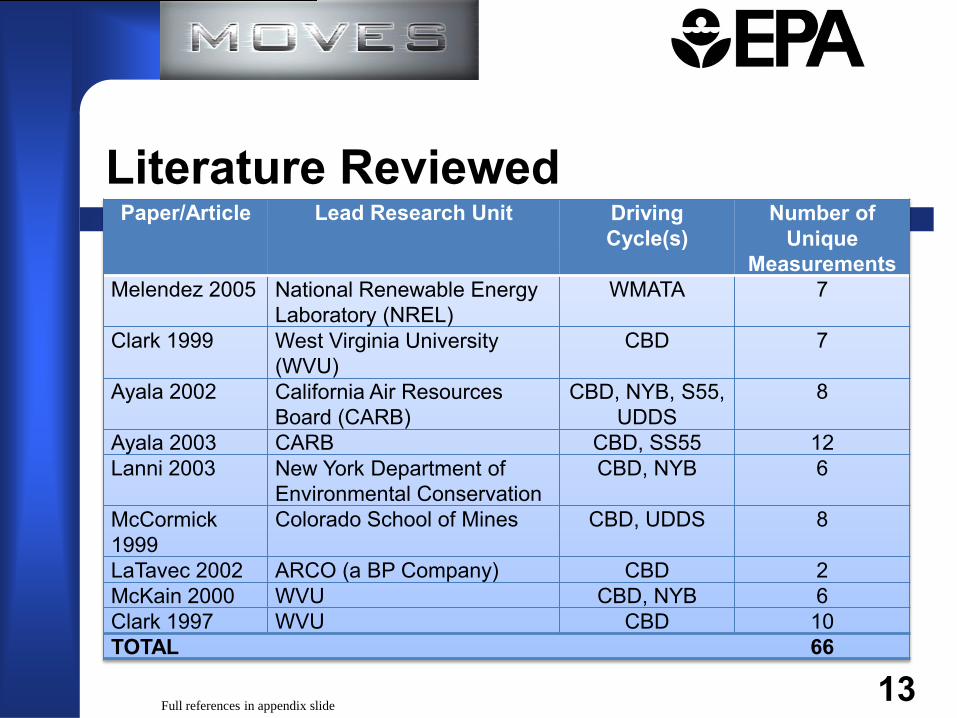
Paper/Article Lead Research Unit Driving Cycle(s)
Number of Unique
Measurements
Melendez 2005 National Renewable Energy Laboratory (NREL)
WMATA 7
Clark 1999 West Virginia University (WVU)
CBD 7
Ayala 2002 California Air Resources Board (CARB)
CBD, NYB, S55, UDDS
8
Ayala 2003 CARB CBD, SS55 12
Lanni 2003 New York Department of Environmental Conservation
CBD, NYB 6
McCormick 1999
Colorado School of Mines CBD, UDDS 8
LaTavec 2002 ARCO (a BP Company) CBD 2
McKain 2000 WVU CBD, NYB 6
Clark 1997 WVU CBD 10
TOTAL 66
Literature Reviewed
13
Full references in appendix slide

9 papers, 66 unique dynamometer measurements – A similar analysis on CNG and diesel buses was performed by
Navistar in 2007
Majority of vehicles are pre-2004, low age – 53 of 66 measurements are age 0-3, remainder were 4-5
Additional data is welcome – No published second by second data
38 measurements made on the CBD cycle – Focused on this analysis, but the other trends were generally
similar
Literature Analysis
14

Comparing MOVES Projections to Measurements
0
10
20
30
40
50
60
1993 1994 1995 1996 1997 1998 1999 2000 2001 2002
Gra
ms/
Mile
Model Year
CBD Cycle, NOx Emissions, Age Group ≤3
Measurements CNG
Measurements CNG (4-5 Age Group)
MOVES 2010b CNG
MOVES 2010b Diesel
Comparing MOVES Projections to Measurements
0
10
20
30
40
50
60
70
1993 1994 1995 1996 1997 1998 1999 2000 2001 2002
Gra
ms/
Mile
Model Year
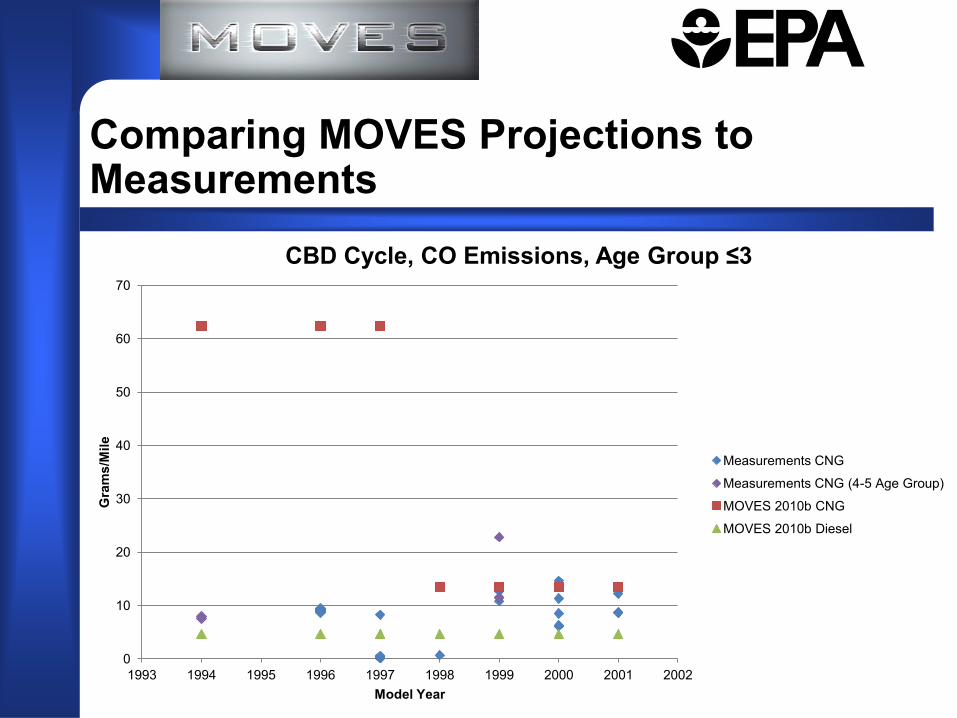
CBD Cycle, CO Emissions, Age Group ≤3
Measurements CNG
Measurements CNG (4-5 Age Group)
MOVES 2010b CNG
MOVES 2010b Diesel

Comparing MOVES Projections to Measurements
0
0.1
0.2
0.3
0.4
0.5
0.6
0.7
0.8
0.9
1
1993 1994 1995 1996 1997 1998 1999 2000 2001 2002
Gra
ms/
Mile
Model Year
CBD Cycle, PM Emissions, Age Group ≤3
Measurements CNG
Measurements CNG (4-5 Age Group)
MOVES 2010b CNG
MOVES 2010b Diesel

Comparing MOVES Projections to Measurements
0
5
10
15
20
25
1993 1994 1995 1996 1997 1998 1999 2000 2001 2002
Gra
ms/
Mile
Model Year
CBD Cycle, THC Emissions, Age Group ≤3
Measurements CNG
Measurements CNG (4-5 Age Group)
MOVES 2010b CNG
MOVES 2010b Diesel
Comparing MOVES Projections to Measurements
0
5
10
15
20
25
1993 1994 1995 1996 1997 1998 1999 2000 2001 2002
Gra
ms/
Mile
Model Year
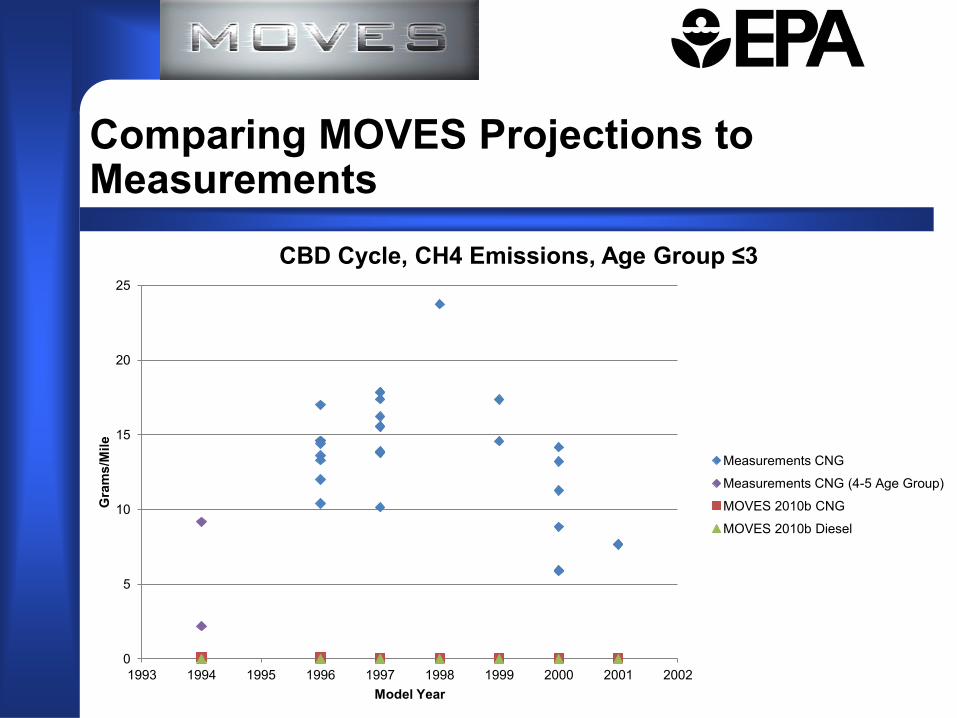
CBD Cycle, CH4 Emissions, Age Group ≤3
Measurements CNG
Measurements CNG (4-5 Age Group)
MOVES 2010b CNG
MOVES 2010b Diesel

Other Cycles – Consistent Trends
20
0
20
40
60
80
100
120
1997 1998 1999 2000 2001
Gra
ms/
Mile
Model Year
NYB Cycle, NOx Emissions, Age Group ≤3
NYB Measurements
NYB MOVES Predictions
0
5
10
15
20
1996 1997 1998 1999 2000 2001
Gra
ms/
Mile
Model Year
UDDS Cycle, NOx Emissions, Age Group ≤3
UDDS Measurements
UDDS MOVES Predictions
0
5
10
15
20
1999.5 2000 2000.5 2001 2001.5
Gra
ms/
Mile
Model Year
SS55 Cycle, NOx Emissions, Age Group ≤3
SS55 Measurements
SS55 MOVES Predictions
0 2 4 6 8
10 12 14
2000 2002 2004
Gra
ms/
Mile
Model Year
WMATA Cycle, NOx Emissions, Age Group ≤3
WMATA Measurements
WMATA MOVES Predictions
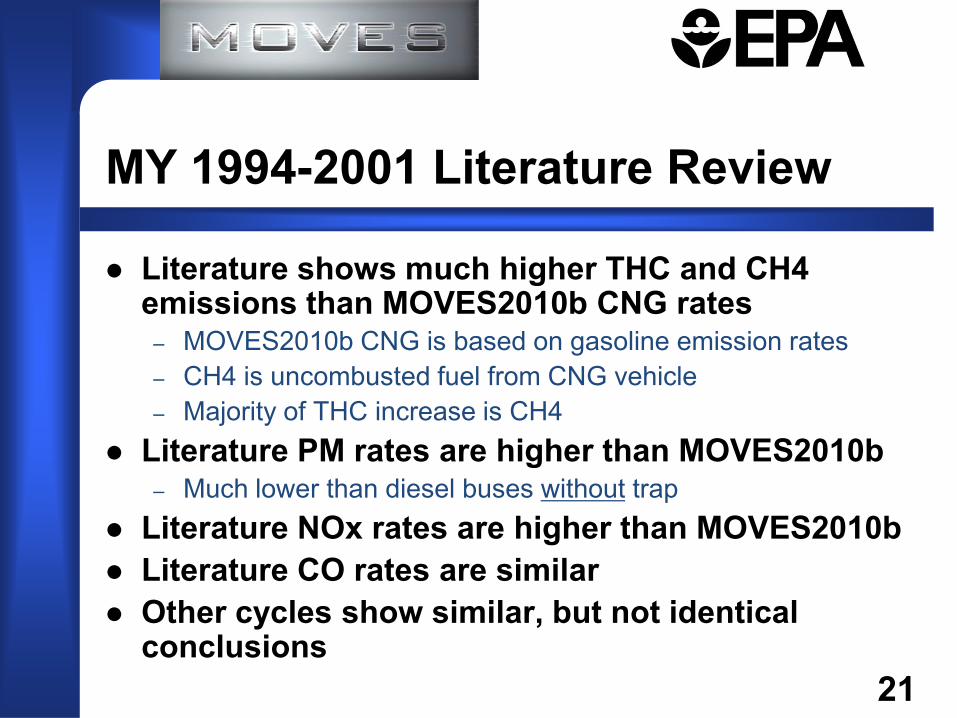
Literature shows much higher THC and CH4 emissions than MOVES2010b CNG rates
– MOVES2010b CNG is based on gasoline emission rates – CH4 is uncombusted fuel from CNG vehicle – Majority of THC increase is CH4
Literature PM rates are higher than MOVES2010b – Much lower than diesel buses without trap
Literature NOx rates are higher than MOVES2010b Literature CO rates are similar Other cycles show similar, but not identical
conclusions
MY 1994-2001 Literature Review
21

No modal data from papers – Potentially available from some authors – Significant additional time and financial investment
Acquisition costs Quality Assurance Analysis
– Potentially a future option Scaled MOVES2010b CNG rates so that simulated drive cycle
emissions are at appropriate level – Simulate drive cycle in MOVES – Match to equivalent data from paper – Develop scaling factor
Assuming same ratio applies to running and start emissions – Assume same age trends, except for CH4
CH4 is assumed to remain same proportion of THC
Developing Modal Rates
22

Categorized CNG buses into 3 model year groups – A: 1994-2001 (Most MYs contained in literature review) – B: 2002-2006 (Additional MYs – WMATA cycle) – C: 2007 and later
For group A & B, emission rates from literature For 2007 and later MYs, scaled group B emission
rates by ratio to sales-weighted certification data – Portions of certification data (ie, projected sales) are CBI.
Proposed MOVES2013 CNG bus rates
23

Current and Draft Proposed Rates
24
Current MOVES2010b CNG Rates (g/mile)
MY Age Group Cycle NOx CO PM_OC PM_EC THC CH4
1997 0-3 CBD 9.6 62.4 2.4E-03 1.8E-04 1.8 0.05
2004 and later 0-3 CBD 4.8 13.4 2.4E-03 1.7E-04 1.4 0.03
1997 0-3 WMATA 9.5 90.0 4.0E-03 2.9E-04 2.5 0.07
2004 and later 0-3 WMATA 5.5 19.0 3.5E-03 2.6E-04 1.4 0.03
Proposed MOVES2013 CNG Rates (g/mile - measured/estimated from analysis)
MY Age Group Cycle NOx CO PM_OC PM_EC THC CH4
1994-2001 0-3 CBD 18.1 7.6 3.3E-02 3.7E-03 14.3 13.1
2002-2006 0-3 WMATA 9.1 2.3 3.9E-03 4.3E-04 11.2 10.6
2007 and later 0-3 WMATA 2.2 20.0 1.6E-03 1.8E-04 4.3 4.1
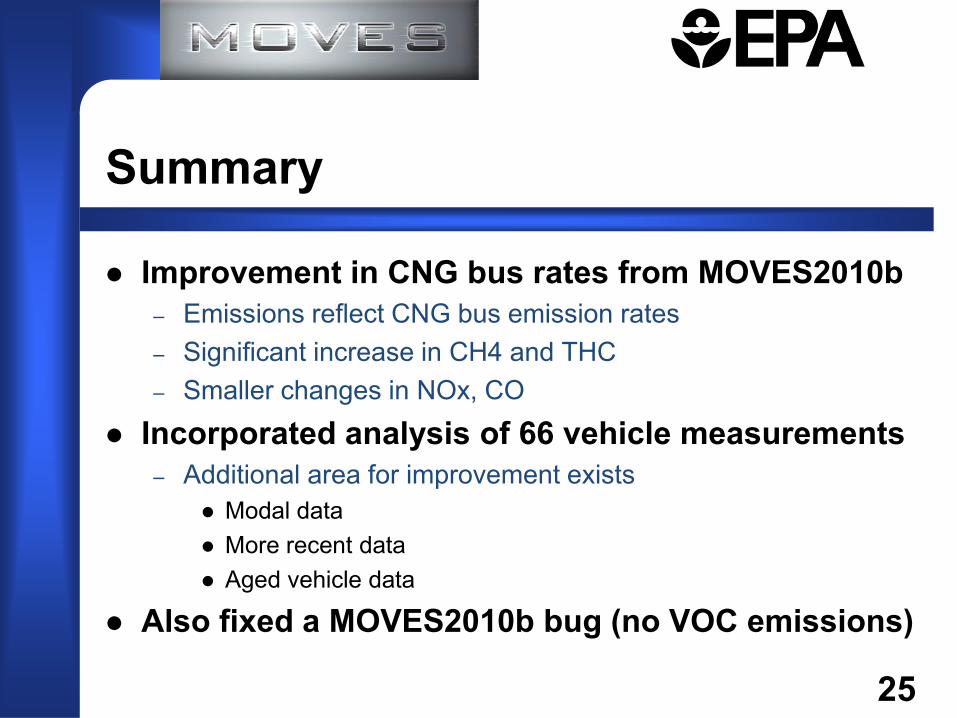
Improvement in CNG bus rates from MOVES2010b – Emissions reflect CNG bus emission rates – Significant increase in CH4 and THC – Smaller changes in NOx, CO
Incorporated analysis of 66 vehicle measurements – Additional area for improvement exists
Modal data More recent data Aged vehicle data
Also fixed a MOVES2010b bug (no VOC emissions)
Summary
25
Appendix: References
26
Clark, N., Gautam, M., Rapp, B., Lyons, D. et al., "Diesel and CNG Transit Bus Emissions Characterization by Two Chassis Dynamometer Laboratories: Results and Issues," Society of Automotive Engineers, SAE Technical Paper 1999-01-1469, 1999, (http://papers.sae.org/1999-01-1469).
Ayala, A., Kado, N., Okamoto, R., Holmén, B. et al., "Diesel and CNG Heavy-duty Transit Bus Emissions over Multiple Driving Schedules: Regulated Pollutants and Project Overview," Society of Automotive Engineers, SAE Technical Paper 2002-01-1722, 2002. (http://papers.sae.org/2002-01-1722).
Ayala, A., Gebel, M., Okamoto, R., Rieger, P. et al., "Oxidation Catalyst Effect on CNG Transit Bus Emissions," Society of Automotive Engineers, SAE Technical Paper 2003-01-1900, 2003. (http://papers.sae.org/2003-01-1900).
Lanni, T., Frank, B., Tang, S., Rosenblatt, D. et al., "Performance and Emissions Evaluation of Compressed Natural Gas and Clean Diesel Buses at New York City's Metropolitan Transit Authority," Society of Automotive Engineers., SAE Technical Paper 2003-01-0300, 2003. (http://papers.sae.org/2003-01-0300).
McCormick, R., Graboski, M., Alleman, T., Herring, A. et al., "In-Use Emissions from Natural Gas Fueled Heavy-Duty Vehicles," Society of Automotive Engineers, SAE Technical Paper 1999-01-1507, 1999. (http://papers.sae.org/1999-01-1507).
LeTavec, C., Uihlein, J., Vertin, K., Chatterjee, S. et al., "Year-Long Evaluation of Trucks and Buses Equipped with Passive Diesel Particulate Filters," Society of Automotive Engineers. SAE Technical Paper 2002-01-0433, 2002. (http://papers.sae.org/2002-01-0433).
McKain, D., Clark, N., Balon, T., Moynihan, P. et al., "Characterization of Emissions from Hybrid-Electric and Conventional Transit Buses," Society of Automotive Engineers, SAE Technical Paper 2000-01-2011, 2000. (http://papers.sae.org/2000-01-2011).
Clark, N., Gautam, M., Lyons, D., Bata, R. et al., "Natural Gas and Diesel Transit Bus Emissions: Review and Recent Data," Society of Automotive Engineers, SAE Technical Paper 973203, 1997. (http://papers.sae.org/973203).
Related Documents