1 INDONESIAN NATIONAL STRATEGY FOR FINANCIAL LITERACY Prepared by Financial Services Authority of the Republic of Indonesia (OJK) – 2013 Gedung Sumitro Djojohadikusumo JL. Lapangan Banteng Timur No. 2 – 4 Jakarta 10710 www.ojk.go.id

Welcome message from author
This document is posted to help you gain knowledge. Please leave a comment to let me know what you think about it! Share it to your friends and learn new things together.
Transcript

1
INDONESIAN NATIONAL STRATEGY
FOR FINANCIAL LITERACY
Prepared by
Financial Services Authority of the Republic of Indonesia
(OJK) – 2013
Gedung Sumitro Djojohadikusumo
JL. Lapangan Banteng Timur No. 2 – 4
Jakarta 10710
www.ojk.go.id
2
TABLE OF CONTENTS
Table of Contents CHAPTER I: THE INDONESIAN CONDITION TODAY ................................... 7
1.1. Indonesia’s Population Trends 1971 – 2010 .................................................... 7 1.2. Population and Economic Growth .................................................................... 9 1.3. The Need for A National Strategy for Financial Literacy ................................. 13
CHAPTER II: NATIONAL SURVEY ON FINANCIAL LITERACY ................. 15 2.1. Objectives of the Survey ................................................................................. 15 2.2. Implementation of the Survey ......................................................................... 15 2.3. Profile of Respondents ................................................................................... 16 2.4. Classification of Survey Results ..................................................................... 16 2.5. Financial Literacy Index and Financial Products and Services Utility Index ... 17
2.5.1. Banking .................................................................................................... 18 2.5.2. Insurance ................................................................................................. 19 2.5.3. Financing Institutions ............................................................................... 20 2.5.4. Pension Funds ......................................................................................... 21 2.5.5. Capital Market .......................................................................................... 22 2.5.6. Fiduciary Services ................................................................................... 23
2.6. The Financial Literacy Index According to Education Level, Income Expenditure, and Age Group ................................................................................. 23
2.6.1. Education Level ....................................................................................... 24 2.6.2. Income Expenditure ................................................................................. 24 2.6.3. Age Group ............................................................................................... 25
2.7. Financial Products and Services Utility Index based on Education Level, Income Expenditure, and Age Groups ................................................................... 26
2.7.1. Education Level ....................................................................................... 26 2.7.2. Income Expenditure ................................................................................. 27 2.7.3. Age Group ............................................................................................... 28
2.8. Relationship Between Financial Literacy Index with Financial Products and Services Utility Index ............................................................................................. 29 2.9. The Most Attractive Financial Products and Services .................................... 30
CHAPTER III: NATIONAL STRATEGY FOR FINANCIAL LITERACY ......... 32 3.1. DEFINITION OF FINANCIAL LITERACY ....................................................... 32 3.2. The Goals of Financial Literacy ...................................................................... 33 3.3. Benefits of Financial Literacy .......................................................................... 33
3.3.1. Benefits to the Public ............................................................................... 34 3.3.2. Benefits to the Financial Industry ............................................................. 34 3.3.3. Macroeconomic Benefits ......................................................................... 35
3.4. Vision, Missions, and Principles of Financial Literacy .................................... 35 3.4.1. Vision ....................................................................................................... 35 3.4.2. Mission ..................................................................................................... 35 3.4.3. Principles ................................................................................................. 36
3.5. National Strategy Basic Framework ............................................................... 36

3
3.5.1. Objectives of the Basic Framework for the Indonesian National Strategy for Financial Literacy .......................................................................................... 38 3.5.2. Strategic Programs and Initiative Programs of the National Strategy for Financial Literacy ............................................................................................... 39
CHAPTER IV: TOWARDS A SOCIETY OF WELL LITERATE INDONESIANS ............................................................................................... 45
4.1. Projected Increase of Literacy Index and Banking Products and Services Utility Index ............................................................................................................ 46 4.2. Efforts to Increase Insurance Literacy Index and Insurance Products and Services Utility Index ............................................................................................. 47 4.3. Projected Increase of Financing Institutions Literacy Index and Financing Products and Services Utility Index ....................................................................... 48 4.4. Projected Increase of Pension Funds Literacy Index and Pension Funds Products and Services Utility Index ....................................................................... 49 4.5. Efforts to Increase Capital Market Literacy Index and Capital Market Products and Services Utility ................................................................................................ 51 4.6. Projected Increase in Pawning and Fiduciary Services Literacy Index and Pawning and Fiduciary Products and Services Utility Index .................................. 52 4.7. Measuring the Success of Financial Literacy ................................................. 53
CHAPTER V: ACTION PLANS ...................................................................... 54 5.1. Pillar 1: National Financial Literacy Education and Campaign ....................... 54 5.2. Pillar 2: Strengthening Financial Literacy Infrastructure ................................. 58 5.3. Pillar 3: Development of Financial Products and Services ............................. 61

4
No table of figures entries found. In your document, select the words to include in the table of contents, and then on the Home tab, under Styles, click a heading style. Repeat for each heading that you want to include, and then insert the table of contents in your document. To manually create a table of contents, on the Document Elements tab, under Table of Contents, point to a style and then click the down arrow button. Click one of the styles under Manual Table of Contents, and then type the entries manually.

5
PREFACE In addition to improving the livelihood of the people, the ongoing economic
development is also aimed at creating intellectual and visionary Indonesians.
Therefore, economic development is not merely implemented through
physical infrastructures that are instantly tangible to the general public, but
also through developing the thinking capacity of the Indonesian people. One
effort to improve thinking capacity is by developing people’s capacity to better
manage their finances. Consequently, a Financial Literacy program is required
in order to improve the literacy of the Indonesian people in financial
management. In this regard, Indonesians are expected to possess a wide
range of knowledge on financial institutions as well as financial products and
services, the skills to assess risks and benefits of financial products and
services, and have confidence in financial institutions, products, and services.
Furthermore, the Financial Services Authority believes that Financial Literacy
should become a strategic nation-wide program. This is in line with one of the
objectives of Financial Services Authority as stipulated in the Financial
Services Authority Act No. 21 of 2011 on Financial Services Authority, which
is to implement consumer and public education and protection. Through a
directed and measured Financial Literacy program, the public is expected to
not only be well literate in financial matters, but also to leverage various
financial products and services in order to fulfill their financial needs.
Aware of the need to develop better-literate Indonesians, Financial Services
Authority decides to incorporate the Financial Literacy Program into a
Blueprint of National Strategy for Financial Literacy. The blueprint would also
act as a guideline for the financial services sector in implementing Financial
Literacy programs. Through this blueprint, it is expected that all Financial
Literacy programs be consolidated into a comprehensive and measurable
national instrument.
6
The formulation and development of the blueprint are conducted by involving
all stakeholders in the financial services sector. Collaboration between the
Financial Services Authority with financial services and the financial services
industry association has successfully resulted in the finalization of the
Blueprint of Indonesian National Strategy for Financial Literacy. In the future,
the blueprint is expected to transform Indonesians by improving their financial
management capacity towards prosperity.
Jakarta, November 19 2013

7
CHAPTER I: THE INDONESIAN CONDITION TODAY
1.1. Indonesia’s Population Trends 1971 – 2010 Within a period starting from the year 1971 to 2010, Indonesia’s population
has shown a relatively high growth, averaging annually at 1.78%, compared to
the global growth rate of 1.61%. In 2010, the total population has reached
237,64 million. With this high population growth, public demand for financial
products and services is expected to continue to increase year after year.
Graph 1
Population Growth in Indonesia
Source: BPS (Central Statistics Bureau)
In Graph 2, where population composition is illustrated, the number of people
at productive age (15 – 64 years old) reaches 66.04% of the population, or
157 million people. This population group is a potential market segment for
financial services to offer their products and services.
1971 1980 1990 1995 2000 2010
119.21 147.49
179.38 194.75 206.26
237.64 In Million

8
Graph 2
Population Composition Based on Age
Source: BPS (Central Statistics Bureau)
Of the total population of Indonesia, which reached 237.64 million in 2010,
approximately 119.32 million or 50.21% are living in rural areas. This
relatively equal distribution of populations living in rural and urban areas
shows that potential utility of financial products and services across both
areas are also equal. Therefore, financial services must come up with
innovations in their products and servies in order to cater to the needs of their
potential customers, especially those living in rural areas.
9.54% 9.79%
9.54% 8.79%
8.37% 8.97%
8.34% 7.79%
6.95% 5.91%
4.87% 3.56%
2.55% 1.98%
1.45% 0.83%
0.48% 0.18%
0.07% 0.04%
0% 2% 4% 6% 8% 10%
0-4 5-9
10-14 15-19 20-24 25-29 30-34 35-39 40-44 45-49 50-54 55-59 60-64 65-69 70-74 75-79 80-84 85-89 90-94
95+
Age

9
Graph 3
Composition of Urban and Rural Populations
Source: BPS (Central Statistics Bureau)
1.2. Population and Economic Growth
Economic growth has been relatively stable for the past decade, averaging at
5% annually. This contributes to a decline in poor population. It could also be
taken to mean that livelihood of the general public has been improving over
time. With livelihood being improved, public demand for financial products and
services is also expected to increase, both in volume and variety.
Rural Population
50.21%
Urban Population
49.79%

10
Graph 4
Composition of Poor and Rich Populations
Source: Central Statistics Bureau
The potential for Indonesians to utilize financial products and services in the
future is expected to continue to increase, considering that the Gross
Domestic Product per capita has grown from IDR 6.72 million in 2000 to IDR
33.34 million in 2012. This rise in per capita income also encouraged the
financial service sector to create and develop more variety in financial
products and services in order to accommodate the growing demand.
Poor Population 11.96%
Rich Population 88.04%

11
Graph 5
GDP per capita Income Growth in Million IDR
Source: BPS (Central Statistics Bureau)
The growth of GDP in Indonesia as illustrated above is due in large part to the
contribution and role of the country’s financial services sector through its
financial intermediary role. Table 1 below shows that up to December 2012,
disbursement of bank loans reached a total of IDR 2,926.55 in stock market
capitalization – IDR 4,127.00 Trillion in stock, IDR 179.21 trillion in corporate
bond capitalization, and capital disbursement by financing institutions totaling
IDR 302.05 trillion.
Table 1
The Role of Financial Industry in Indonesia
1 Dibursement of Bank Loans IDR 2,926.55 Trillion
2 Stock Market Capitalization IDR 4,127.00 Trillion
3 Issuance of Corporate Bonds IDR 179,21 Trillion
4 Disbursement of Financing by Financing Institutions IDR 302.05 Trillion
Source: OJK (Financial Services Authority)
5
10
15
20
25
30
35
2000 2001 2002 2003 2004 2005 2006 2007 2008 2009 2010 2011 2012
12
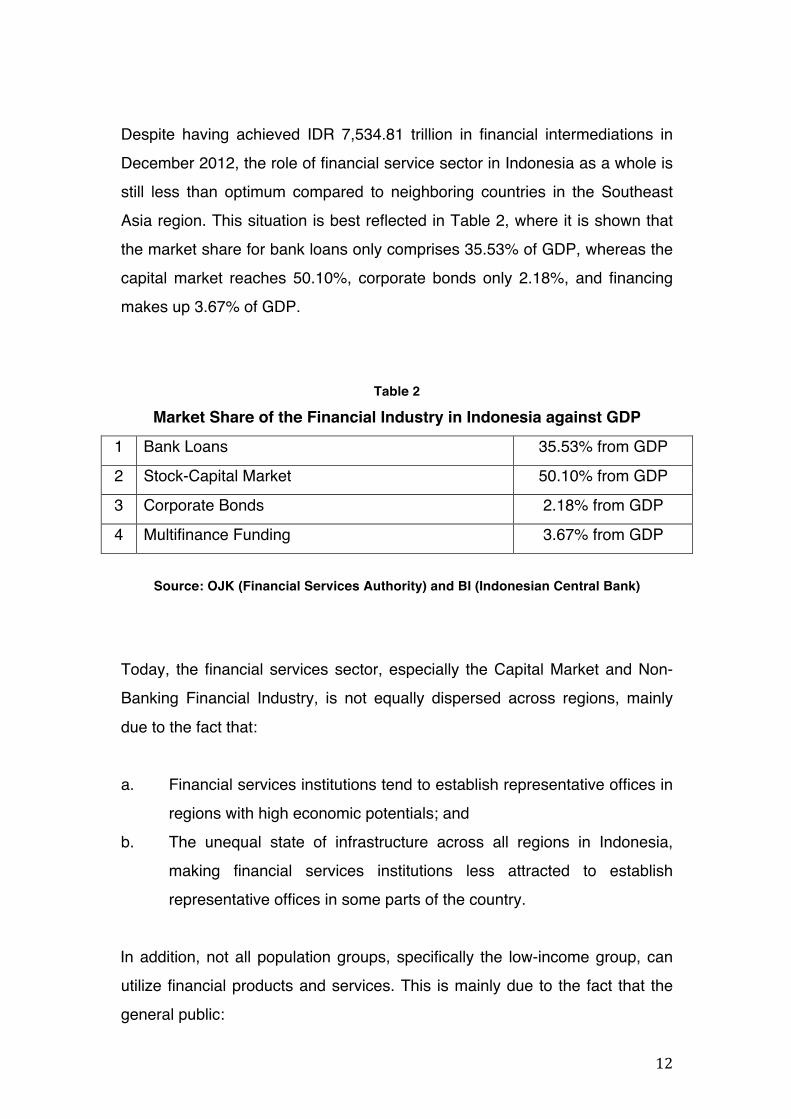
Despite having achieved IDR 7,534.81 trillion in financial intermediations in
December 2012, the role of financial service sector in Indonesia as a whole is
still less than optimum compared to neighboring countries in the Southeast
Asia region. This situation is best reflected in Table 2, where it is shown that
the market share for bank loans only comprises 35.53% of GDP, whereas the
capital market reaches 50.10%, corporate bonds only 2.18%, and financing
makes up 3.67% of GDP.
Table 2
Market Share of the Financial Industry in Indonesia against GDP
1 Bank Loans 35.53% from GDP
2 Stock-Capital Market 50.10% from GDP
3 Corporate Bonds 2.18% from GDP
4 Multifinance Funding 3.67% from GDP
Source: OJK (Financial Services Authority) and BI (Indonesian Central Bank)
Today, the financial services sector, especially the Capital Market and Non-
Banking Financial Industry, is not equally dispersed across regions, mainly
due to the fact that:
a. Financial services institutions tend to establish representative offices in
regions with high economic potentials; and
b. The unequal state of infrastructure across all regions in Indonesia,
making financial services institutions less attracted to establish
representative offices in some parts of the country.
In addition, not all population groups, specifically the low-income group, can
utilize financial products and services. This is mainly due to the fact that the
general public:
13
a. Still holds the perception that financial services providers impose
complicated requirements to obtain financial products and services;
b. Has lack of awareness on the benefits of financial products and
services due to their low education level;
c. Does not have the capacity to afford financial products and services,
especially for the lower income group; and
d. Has limited access to financial products and services due to limited
infrastructure and facilities.
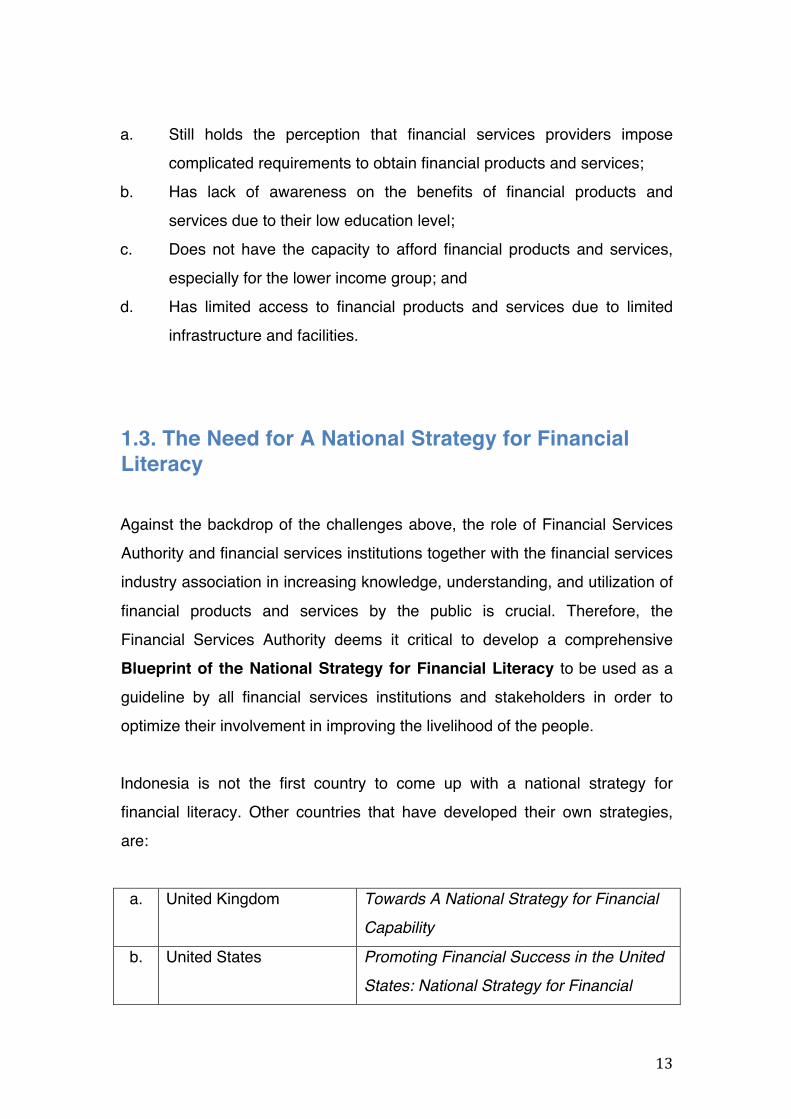
1.3. The Need for A National Strategy for Financial Literacy Against the backdrop of the challenges above, the role of Financial Services
Authority and financial services institutions together with the financial services
industry association in increasing knowledge, understanding, and utilization of
financial products and services by the public is crucial. Therefore, the
Financial Services Authority deems it critical to develop a comprehensive
Blueprint of the National Strategy for Financial Literacy to be used as a
guideline by all financial services institutions and stakeholders in order to
optimize their involvement in improving the livelihood of the people.
Indonesia is not the first country to come up with a national strategy for
financial literacy. Other countries that have developed their own strategies,
are:
a. United Kingdom Towards A National Strategy for Financial
Capability
b. United States Promoting Financial Success in the United
States: National Strategy for Financial

14
Literacy
c. Australia National Financial Literacy Strategy
d. New Zealand National Strategy for Financial Literacy
e. India National Strategy for Financial Education
f. Canada Canadians and Their Money: Building A
Brighter Financial Future
These countries consider Financial Literacy to be a strategic program that is
just as much a priority as any other national program, and therefore Financial
Literacy is a priority program for these countries and becomes a national long-
term program that involves various stakeholders in its implementation.
The objective of national strategy for financial literacy in these countries is to
expand and improve awareness and involvement of the public in utilizing
financial products and services. Financial Literacy in these countries is not
only important to increase public awareness, but also to change the people’s
mindset and behavior to better manage their finances.
Through Financial Literacy, the public is expected to gain understanding on
financial services and the products and services that they offer, including
features, benefits, and risks, as well as the rights and responsibilities of
stakeholders. In addition, the people is expected to gain more skills in utilizing
financial products and services. Furthermore, increased utilization of financial
products and services according to individual needs is expected. This
condition will in turn encourage and motivate the financial service sector to
educate and to develop financial products and services that are tailored to the
needs of the various population groups.
In 2013, Authority established Financial Literacy as one of its strategic
programs, which manifested in the Blueprint of Indonesian National Strategy
for Financial Literacy. In developing the blueprint, the Financial Services
Authority involved financial services institutions as well as the financial
15
services industry association. The involvement of these major actors is critical
to streamline literacy and education programs to become the goal of all actors
in the financial services industry.
CHAPTER II: NATIONAL SURVEY ON FINANCIAL LITERACY
2.1. Objectives of the Survey Prior to developing the Blueprint of Indonesian National Strategy for Financial
Literacy, the Financial Services Authority conducted a national survey on the
level of Financial Literacy of the Indonesian people. It is the first complete and
comprehensive nation-wide survey measuring the citizen’s financial literacy
rate.
The objectives of the National Survey on Financial Literacy are:
a. To map the latest literacy rate of all population groups in Indonesia;
b. To prepare materials for the Blueprint of Indonesian National Strategy
for Financial Literacy;
c. To measure the effectiveness of financial education programs aimed for
the Indonesian public; and
d. To encourage financial services institutions to develop products and
services that are catered to public needs.
2.2. Implementation of the Survey The National Survey on Financial Literacy was launched in the first semester
of 2013 across 20 provinces, by involving 8,000 respondents that were
chosen using the stratified random sampling method.

16
2.3. Profile of Respondents The respondents of the National Survey on Financial Literacy are categorized
based on the following criteria.
Figure 1 Profile of Respondents
2.4. Classification of Survey Results Based on the results of the National Survey on Financial Literacy, the financial
literacy rate of the public is classified into four levels:
a. Well Literate
Having the knowledge of and confidence in financial services and their
products and services, including the features, benefits and risks, as
well as the rights and responsibilities with regards to financial products
and services, and having the skills in utilizing financial products and
services.
b. Sufficient Literate

17
Having the knowledge of and confidence in financial services
institutions and their products and services, including the features,
benefits and risks, as well as the rights and responsibilities with
regards to financial products and services.
c. Less Literate
Only having knowledge of financial services institutions, as well as
some knowledge of financial products and services.
d. Not Literate
Not having the knowledge of and confidence in financial services
institutions and their products and services, as well as not having the
skills to utilize financial products and services.
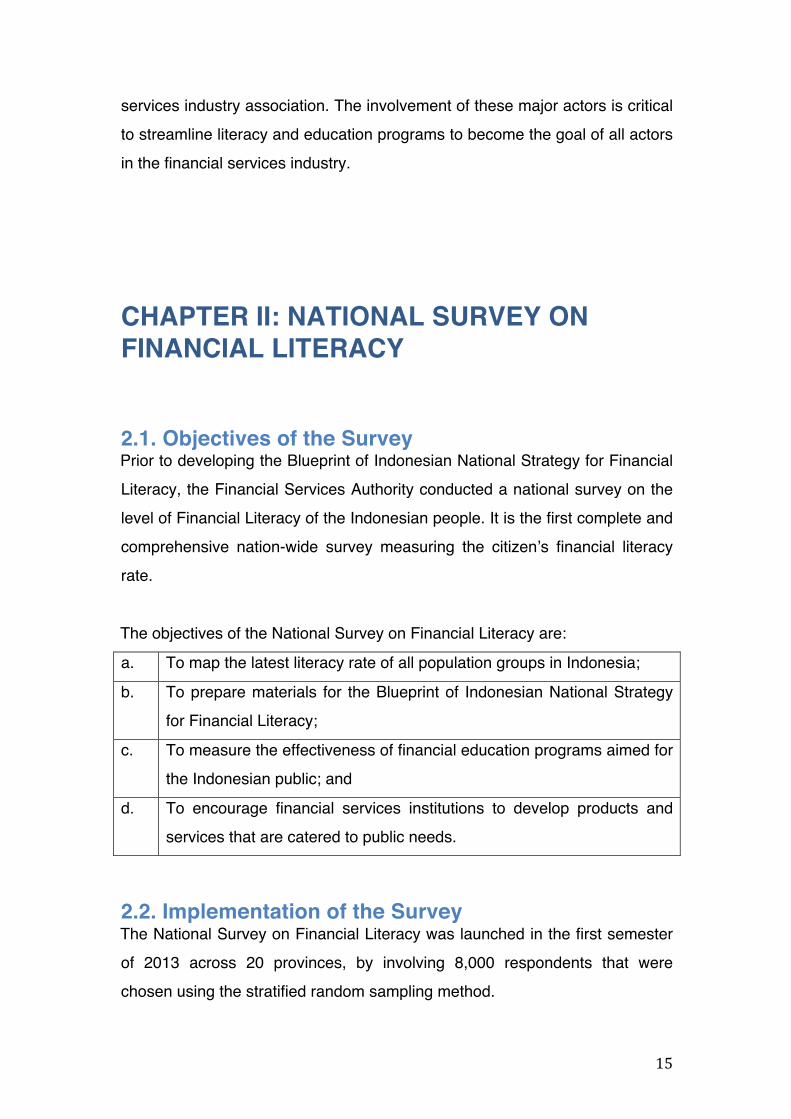
2.5. Financial Literacy Index and Financial Products and Services Utility Index The Financial Literacy Index is a parameter or indicator that shows the level of
knowledge, skills, and confidence of the public with regards to financial
services institutions and their products and services. Moreover, the Financial
Literacy Index also provides information on the level of public awareness on
features, benefits and risks, and their rights and responsibilities as users of
financial products and services. Based on the National Survey on Financial
Literacy which was administered to 8,000 respondents, it was revealed that
only 21.84% of Indonesian citizens were classified as Well Literate.
The Financial Products and Services Utility Index is a parameter or indicator
that is used to measure the extent of Indonesians utilizing financial products
and services. The National Survey on Financial Literacy shows that the
Financial Products and Services Utility Index in Indonesia was 59.74%.
However, the utility is not equal across all sectors in financial services.
18
Graph 6 Financial Literacy Index and Financial Products and Services Utility
Index in Indonesia
2.5.1. Banking Based on the National Survey on Financial Literacy, Indonesian citizens that
are classified as Well Literate on the Banking industry comprise 21.80% of the
population. This means that for every 100 people, 22 have the knowledge of
and confidence in banking institutions, banking products and services, as well
as having the skills in utilizing those products and services.
Comparing the Literacy Index with the Banking Products and Services Utility
Index reveals an interesting phenomenon, which is the fact that Banking
Products and Services Utility Index has reached 57.28%. This means that for
every 100 people, 58 of them have utilized banking products and services.
Sufficient Literate 75.69%
Less Literate 2.06%
Not Literate 0.41%
Well Literate 21.84%
LiteraryIndex
59.74 %
Utility Index

19
In other words, the survey suggests that most Indonesians utilize banking
products and services without having sufficient knowledge or understanding
on the subject.
Graph 7 Financial Literacy Index and Banking Products and Services Utility
Index
2.5.2. Insurance The Insurance Literacy Index shows that Indonesians who are well literate in
the insurance industry only accounts for 17.84% of the population. This
means that for every 100 people, only 18 people understand insurance.
The low Insurance Literacy rate contributes to low insurance products and
services utility, which is only 11.81%. This means that for every 100 people,
only 12 people utilize insurance products and services.
Sufficient Literate 75.43%
Less Literate 2.04%
Not Literate 0.73%
Well Literate 21.80%
LiteraryIndex
57.28%
Utility Index

20
Graph 8
Financial Literacy Index and Insurance Products and Services Utility Index
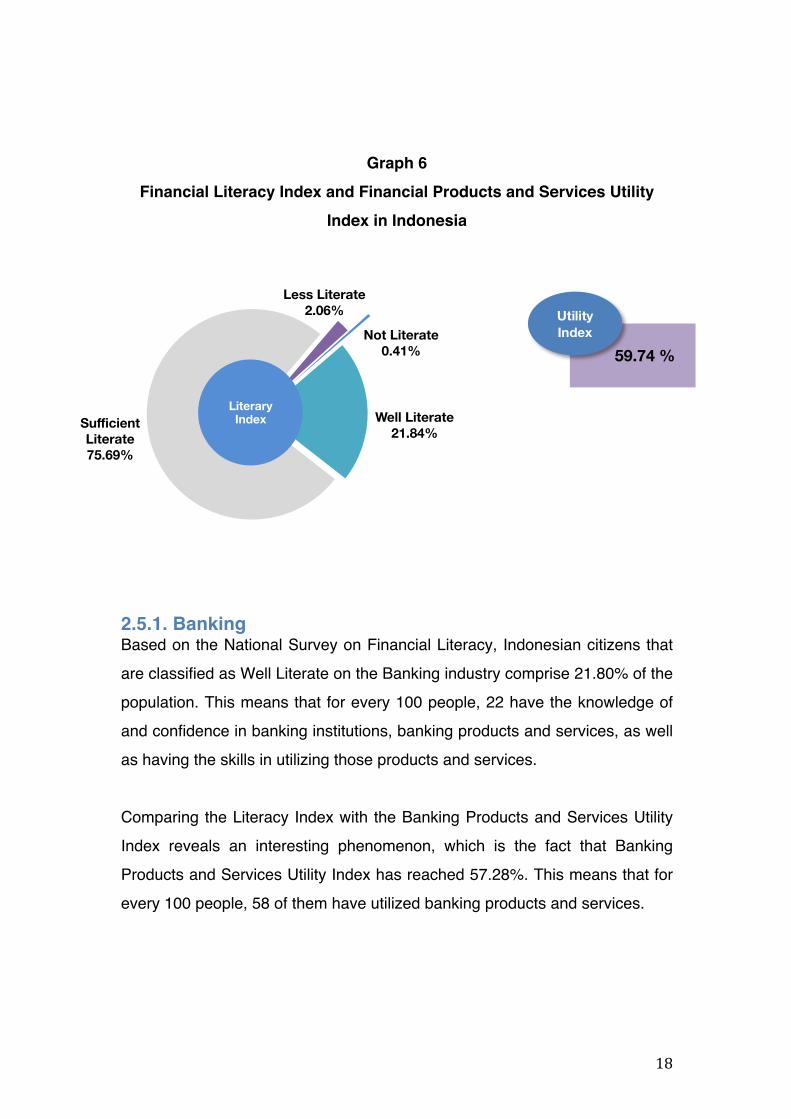
2.5.3. Financing Institutions The result of the National Survey on Financial Literacy suggests that many
Indonesians (72.10%) do not have the knowledge of the financing industry.
The survey also shows that only 9.80% are classified as well literate. This
means that for every 100 people, only 10 people have the knowledge of and
confidence in financing institutions, banking products and services, as well as
having the skills in utilizing those products and services.
The low Literacy Index contributes to low Utility Index, in which the public
does not maximize the utilization of financing products and services.
Financing Products and Services Utility Index is very low at 6.33%.
Sufficient Literate 41.69% Less Literate
0.68%
Not Literate 39.80%
Well Literate 17.84%
LiteraryIndex
11.81%
Utility Index
21
Graph 9
Financial Literacy Index and Financing Institutions Products and Services Utility Index
2.5.4. Pension Funds Most Indonesians are not familiar with pension funds, according to the
National Survey on Financial Literacy, which shows that for every 100 people,
81 of them do not know about pension funds (81.03%). Only a small portion of
the population, 7.13%, is well literate on the subject.
Furthermore, the Pension Funds Products and Services Utility Index is only
1.53%, which means that for every 100 people, only 2 people utilize pension
funds products and services.
Graph 10
Sufficient Literate 17.89%
Less Literate 0.21%
Not Literate 72.10%
Well Literate 9.80%
LiteraryIndex
6.33%
Utility Index

22
Financial Literacy Index and Pension Funds Products and Services Utility
2.5.5. Capital Market Despite currently being one of the most rapidly growing sectors in financial
services, the National Survey on Financial Literacy shows that only 3.79% of
Indonesians are well literate in the capital market. On the other hand, 93.79%
are classified as not literate, meaning that for every 100 people, 94 are not
familiar with the capital market.
This low literacy is also followed by low utility in capital market products and
services. Only 1 out of 1000 people utilizes the products and services of the
capital market.
Graph 11
Financial Literacy Index and the Capital Market Products and Services
Utility Index
Sufficient Literate 2.40%
Less Literate 0.03%
Not Literate 93.79%
Well Literate 3.79%
LiteraryIndex
0.11%
Utility Index

23
2.5.6. Fiduciary Services Fiduciary services have long been known and utilized by many Indonesians.
However, according to the National Survey on Financial Literacy, only 14.85%
Indonesians are well literate on the subject. This means that only 15 out of
100 people are familiar with and understand fiduciary services.
In terms of utility, the survey also shows that there is still very few people
utilize fiduciary services, which is recorded at 5 out of 1000.
Graph 12
Financial Literacy Index and Fiduciary Products and Services Utility
Index
2.6. The Financial Literacy Index According to Education Level, Income Expenditure, and Age Group
Sufficient Literate 38.89% Less Literate
0.83%
Not Literate 45.44%
Well Literate 14.85%
LiteraryIndex
5.04%
Utility Index

24
2.6.1. Education Level The National Survey on Financial Literacy suggests that the higher the level of
education that someone attains, the higher they will score on the Literacy
Index. Table 3 shows that a person with no formal schooling scores the lowest
in the Financial Literacy Index at 16.3%, compared to someone with
educational background. Those with a higher education degree score the
highest at 56.4%. This could be a challenge for the implementation of the
National Strategy for Financial Literacy to improve the financial literacy rate of
those with low education level.
Table 3 Financial Literacy Index based on Education Level
EDUCATION LEVEL FINANCIAL LITERACY INDEX
Higher Education 56.4%
Secondary Education 35.7%
Primary Education 24.6%
No Formal Education 16.3%
2.6.2. Income Expenditure Respondents of the National Survey on Financial Literacy are classified into 5
groups based on their monthly per capita income expenditure as illustrated in
Figure 2 below.
Figure 2 Classification Based on Income Expenditure

25
The survey suggests that the higher the income expenditure, the higher the
literacy. Table 4 shows that Group A, with the highest income expenditure,
also score highest on the Financial Literacy Index at 51.6%
Table 4 Financial Literacy Index Based on Income Expenditure
INCOME EXPENDITURE FINANCIAL LITERACY INDEX
A 51.6%
B 42.9%
C 36.7%
D 31.2%
E 28.4%
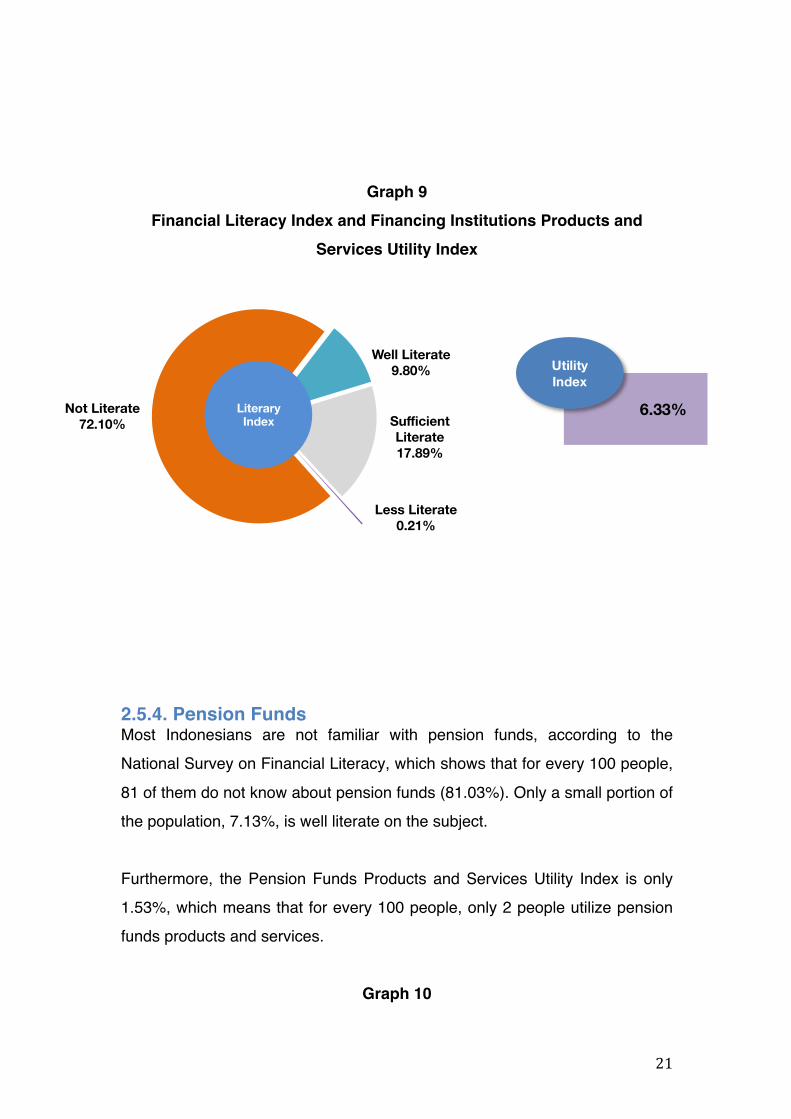
2.6.3. Age Group The National Survey on Financial Literacy also measures financial literacy
based on age group. Table 5 shows that literacy rate is relatively equal across
all age groups.
Table 5 Financial Literacy Index Based on Age Group
26
AGE GROUP FINANCIAL LITERACY INDEX
18-25 years old 35.5%
26-35 years old 37.4%
36-50 years old 36.0%
>50 years old 31.7%
2.7. Financial Products and Services Utility Index based on Education Level, Income Expenditure, and Age Groups
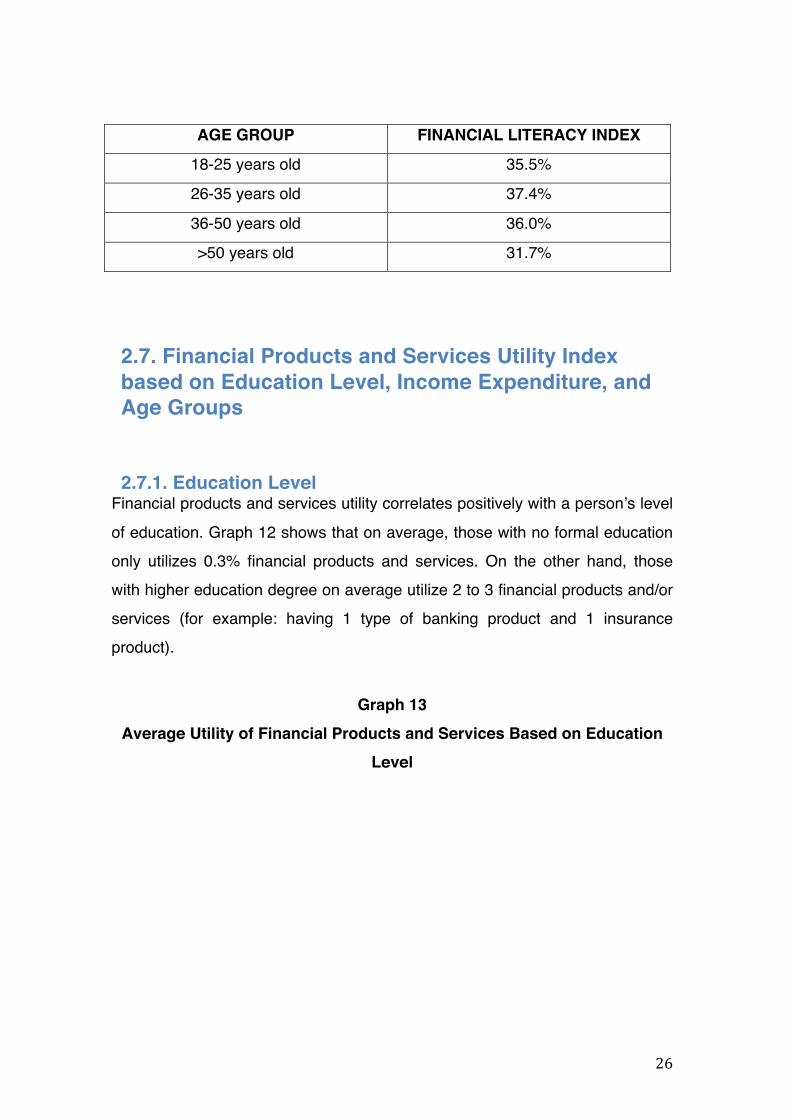
2.7.1. Education Level Financial products and services utility correlates positively with a person’s level
of education. Graph 12 shows that on average, those with no formal education
only utilizes 0.3% financial products and services. On the other hand, those
with higher education degree on average utilize 2 to 3 financial products and/or
services (for example: having 1 type of banking product and 1 insurance
product).
Graph 13 Average Utility of Financial Products and Services Based on Education
Level

27
2.7.2. Income Expenditure Income expenditure shows a positive correlation with financial products and
services utility as illustrated in Graph 14. On average, Social Group A utilizes
up to 3 types of financial products and services (for example, 1 banking
product, 1 insurance product, and 1 capital market product).
Graph 14
Average Utility of Financial Products and Services Based on Income
Expenditure
No Formal Education
Primary Education
Secondary Education
Higher Education
0.3
0.7
1.2
2.5
Average Utility!of Financial!
Products and Services!
Education!Level!
A B C D E
2.8
1.9
1.4
0.8
0.4
Average Utility!of Financial!
Products and Services!
Income!Expenditure!

28
2.7.3. Age Group According to the survey, financial products and services utility is essentially
equal across all age groups as shown in Graph 15. However, the 35-50 year-
old age group has a relatively higher level of financial products and services
utility compared to other age groups.
Graph 15
Financial Products and Services Utility Rate Based on Age Group
18-25 26-35 36-50 >50
0.9
1.3 1.4
1.1
Average Utility!of Financial!
Products and Services!
Age!

29
2.8. Relationship Between Financial Literacy Index with Financial Products and Services Utility Index
The level of financial literacy positively correlates with a person’s financial
products and services utility, which means that the higher someone scores on
literacy rate, the higher they would utilize financial products and services.
Graph 16 shows that someone who is classified as Well Literate on the survey
would use on average 2 financial products and services, whereas someone
who is Not Literate would not utilize any financial products and services at all.
Graph 16
Relationship Between Financial Literacy Index with Financial Products
and Services Utility
Well Literate Sufficient Literate
Less Literate Not Literate
2.1
1.0
0.4
0
Average Utility!of Financial!
Products and Services!
Literacy!Rate!
30
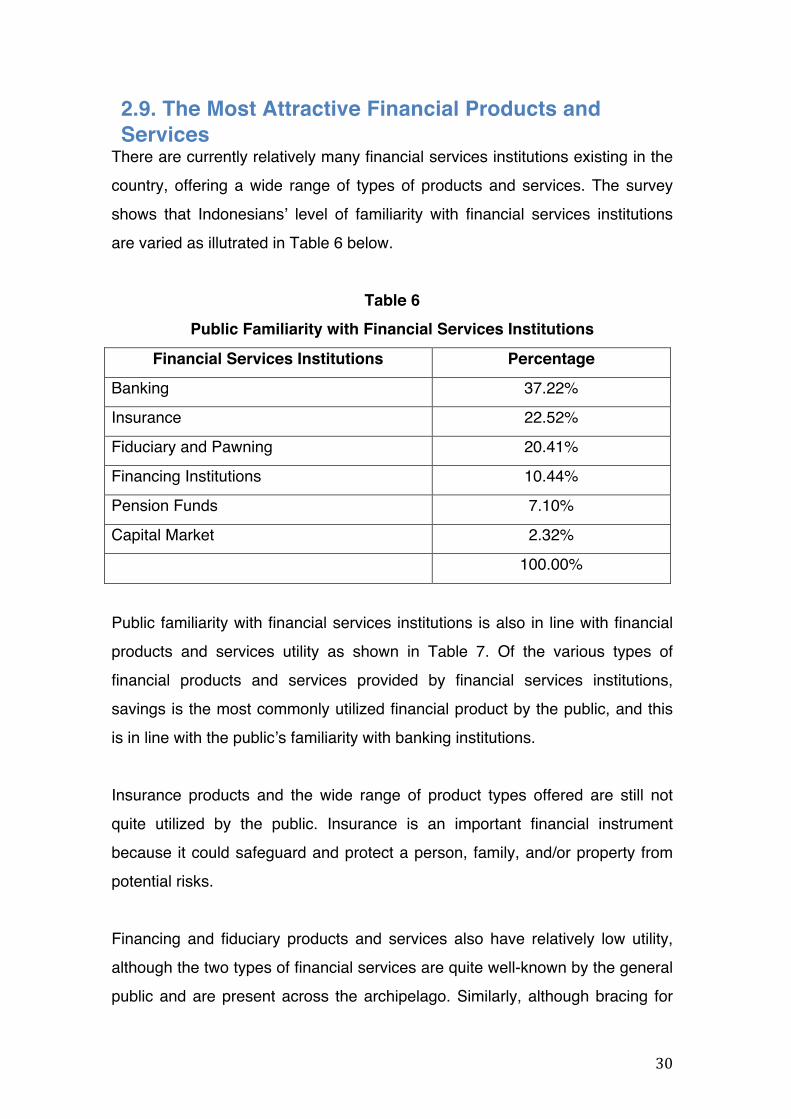
2.9. The Most Attractive Financial Products and Services
There are currently relatively many financial services institutions existing in the
country, offering a wide range of types of products and services. The survey
shows that Indonesians’ level of familiarity with financial services institutions
are varied as illutrated in Table 6 below.
Table 6 Public Familiarity with Financial Services Institutions
Financial Services Institutions Percentage
Banking 37.22%
Insurance 22.52%
Fiduciary and Pawning 20.41%
Financing Institutions 10.44%
Pension Funds 7.10%
Capital Market 2.32%
100.00%
Public familiarity with financial services institutions is also in line with financial
products and services utility as shown in Table 7. Of the various types of
financial products and services provided by financial services institutions,
savings is the most commonly utilized financial product by the public, and this
is in line with the public’s familiarity with banking institutions.
Insurance products and the wide range of product types offered are still not
quite utilized by the public. Insurance is an important financial instrument
because it could safeguard and protect a person, family, and/or property from
potential risks.
Financing and fiduciary products and services also have relatively low utility,
although the two types of financial services are quite well-known by the general
public and are present across the archipelago. Similarly, although bracing for

31
life after retirement requires early planning, very few people utilize products and
services in pension funds.
Capital market products are not highly utilized by the public. This is due to the
public perception that capital products have high risk and are relatively not
affordable, both in terms of availability and price, especially for the lower middle
income class. Therefore, there is a big opportunity to increase users of capital
market products and services, considering the ever increasing growth of the
Indonesian middle class.
Table 7 Financial Products and Services Utility
Financial Products and Services Percentage
BANKING 75.98%
Savings 45.27%
Transfer 21.21%
Bank Loan 8.44%
Deposit 0.92%
Giro 0.14%
INSURANCE 13.17%
Health Insurance 5.26%
Life Insurance 4.06%
Vehicle Insurance 1.87%
Education Insurance 1.87%
Property Insurance 0.04%
Unit Link 0.06%
FINANCING INSTITUTIONS 5.30%
Consumer Financing 3.65%
Leasing 1.65%
FIDUCIARY AND PAWNING SERVICES 4.18%
Fiduciary Services 4.15%

32
Pawning Services 0.03%
PENSION FUNDS 1.26%
Defined Benefit 1.02%
Defined Contribution 0.24%
CAPITAL MARKET 0.10%
Stock 0.09%
Mutual Funds 0.01%
100%
CHAPTER III: NATIONAL STRATEGY FOR FINANCIAL LITERACY
3.1. DEFINITION OF FINANCIAL LITERACY There is no standard or universal definition of Financial Literacy, as it is usually
defined by various literatures and expert opinions. However, one may identify
some common properties based on these various definitions, and therefore the
Financial Services Authority has concluded that Financial Literacy is defined
as:
“a series of processes or activities in order to improve:
Ø Knowledge;
Ø Confidence; and
Ø Skill;
of consumers and the general public in order to be able to better
manage their finances.”
This definition could be taken to mean that consumers of financial products
and services as well as the general public are expected to not only know and

33
understand financial services institutions and the products and services they
offer, but also to change their behavior in financial management in order to
improve their livelihood.
3.2. The Goals of Financial Literacy Financial Literacy has long-term goals for all elements of the society, and
they are:
a. To improve the level of literacy, such as from less literate or not literate
to well literate; and
b. To increase the number of users of financial products and services.
Financial Literacy is important for consumers and the general public to be
able to determine the financial products and services that are suitable to their
needs, to understand correctly the benefits and risks, rights and
responsibilities, as well as to have the confidence in the financial products and
services that they have chosen to improve their livelihood.
Nevertheless, the goals of Financial Literacy would not be achieveable without
the support of other external factors. The external factors that could potentially
affect the success of Financial Literacy include:
a. Economic growth;
b. Per capita income;
c. Income distribution;
d. Poverty rate;
e. Education level;
f. Productive age group of the population; and
g. Utilization of information technology.
3.3. Benefits of Financial Literacy Financial Literacy is a strategic program that is part of public and government
efforts implemented in many countries. Lessons learned from these countries

34
have proven that Financial Literacy is an essential national program to
improve the welfare and livelihood of the society due to the many benefits that
Financial Literacy brings.
3.3.1. Benefits to the Public Financial Literacy brings a huge benefit to the general public as a whole,
considering that with Financial Literacy, the public:
a. Would be able to determine and utilize financial products and services
that are suitable to their needs;
b. Would have the capacity to conduct better financial planning;
c. Would avoid shady and illegitimate investment activities and financial
instruments;
d. Would gain understanding on the benefits and risks of financial
products and services.
3.3.2. Benefits to the Financial Industry Considering that the public are users of financial products and services,
Financial Literacy also brings benefits to the financial services sector. There is
an interdependency between financial services institutions and the public, and
therefore the higher the public’s Financial Literacy, the more people would
utilize financial products and services. Consequently, financial services
institutions stand to gain more potential profit.
In addition, Financial Literacy also encourages financial services institutions to
continue to develop and create more varieties of financial products and
services and that are more affordable in order to cater to the needs of all
levels of the society. Financial services institutions would also be able to
identify and develop financial products and services that are commercially
viable while simultaneously providing benefits to certain groups within the
society that are currently unable to utilize and access financial products and
services.

35
3.3.3. Macroeconomic Benefits From a macroeconomic perspective, Financial Literacy can provide the
following benefits:
a. The more financially well literate the society is, the more people would
utilize financial products and services, which would in turn contribute to
welfare equality;
b. The more people save and invest, the more they would contribute to
financing the development process; and
c. The more people utilize the funds in financial services institutions,
intermediation in the financial sector would increase.
3.4. Vision, Missions, and Principles of Financial Literacy
3.4.1. Vision The Blueprint of the Indonesian National Strategy for Financial Literacy adopts
the following vision:
Establish an Indonesian society with high financial literacy (Well
Literate), such that Indonesians will have the capacity or confidence to
determine and utilize financial products and services in order to
improve their livelihood.
3.4.2. Mission The missions of the the Blueprint of the Indonesian National Strategy for
Financial Literacy are:
a. To educate the Indonesian people in financial matters in order to be
able to better manage their finances;

36
b. To improve access to information and utilization of financial products
and services by developing necessary infrastructure to support
financial literacy.
3.4.3. Principles In order to properly and effectively implement efforts to improve the public’s
Financial Literacy, any Financial Literacy Program must adopt the following
principles:
a. Inclusive
Financial Literacy Programs must be able to include and reach all
levels of society.
b. Systematic and Measurable
Financial Literacy Programs are delivered in a planned, systematic,
understandable, and simple manner, where achievements and
progress must be measurable.
c. Accessible
Any service and information regarding Financial Literacy must be
available and accessible across the archipelago.
d. Collaboration
Financial Literacy programs must involve the collaboration of all
stakeholders both in planning and implementation.
3.5. National Strategy Basic Framework The National Survey on Financial Literacy, which was conducted in the first
semester of 2013, shows that Indonesians score low on the Financial Literacy
Index, as illustrated in Table 8. Furthermore, in certain financial services
sector, the Financial Literacy Index shows that very few Indonesians are
classified as well literate.
Table 8 Financial Literacy Index Across All Sectors in Financial Services

37
Banking Insurance Financing Institutions
Pension Funds
Capital Market
Fiduciary
Well Literate 21.80% 17.84% 9.80% 7.13% 3.79% 14.85%
Sufficient Literate 75.44% 41.69% 17.89% 11.74% 2.40% 38.89%
Less Literate 2.04% 0.68% 0.21% 0.11% 0.03% 0.83%
Not Literate 0.73% 39.80% 72.10% 81.03% 93.79% 45.44%
The survey also shows that Indonesians’ low level of financial literacy is
followed by low utilization of financial products and services. This is illustrated
in Table 9, which shows that Financial Products and Services Utility in almost
all sectors in financial services is still relatively low, with the exception of
Banking Products and Services Utility Index which is comparatively higher
than other sectors.
Table 9
Products and Services Utility Index Across All Sectors in Financial
Services
Banking Insurance Financing Institutions
Pension Funds
Capital Market
Fiduciary
Utility 57.28% 11.81%% 6.33% 1.53% 0.11% 5.04%
With this condition in mind, it is acknowledged that in general, Financial
Literacy Index and Financial Products and Services Utility Index of the
Indonesian people are still low (Not/Less Literate). Therefore, comprehensive
and systematic efforts are required in order to improve Financial Literacy
Index as well as Financial Products and Services Utility Index. A basic
framework is needed that would support the implementation of the Indonesian
National Strategy for Financial Literacy, which would in turn help propel
Indonesians towards a higher level of Literacy Index (Well Literate) as
illustrated in Figure 3 below.
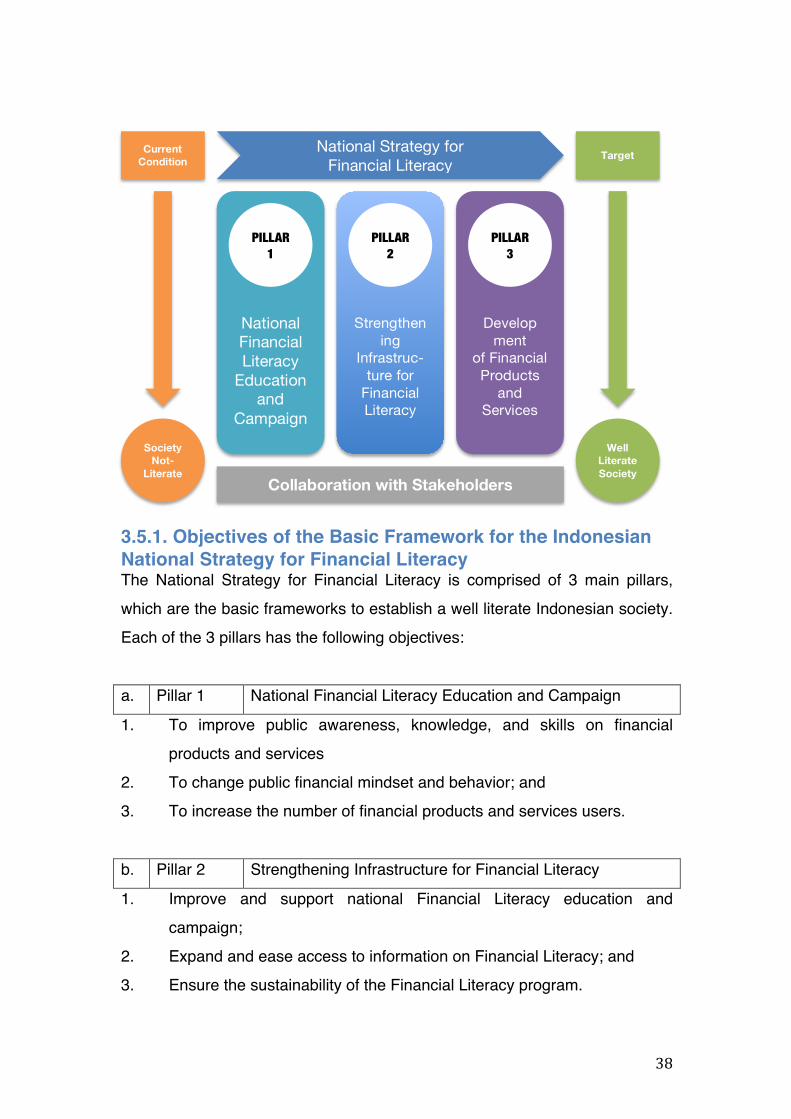
Figure 3
38
3.5.1. Objectives of the Basic Framework for the Indonesian National Strategy for Financial Literacy The National Strategy for Financial Literacy is comprised of 3 main pillars,
which are the basic frameworks to establish a well literate Indonesian society.
Each of the 3 pillars has the following objectives:
a. Pillar 1 National Financial Literacy Education and Campaign
1. To improve public awareness, knowledge, and skills on financial
products and services
2. To change public financial mindset and behavior; and
3. To increase the number of financial products and services users.
b. Pillar 2 Strengthening Infrastructure for Financial Literacy
1. Improve and support national Financial Literacy education and
campaign;
2. Expand and ease access to information on Financial Literacy; and
3. Ensure the sustainability of the Financial Literacy program.
Current Condition
National Strategy for Financial Literacy
Target
National Financial Literacy
Education and
Campaign
Strengthen ing
Infrastruc- ture for
Financial Literacy
Develop ment
of Financial Products
and Services
Society Not-
Literate
Well Literate Society
Collaboration with Stakeholders
PILLAR 1
PILLAR 2
PILLAR 3

39
c. Pillar 3 Development of Financial Products and Services
1. Encourage financial services institutions to develop financial products
and services that would cater to public needs;
2. Encourage financial services institutions to improve the quality of
financial products and services.
3. Encourage financial services and institutions to expand reach and
delivery coverage of financial services.
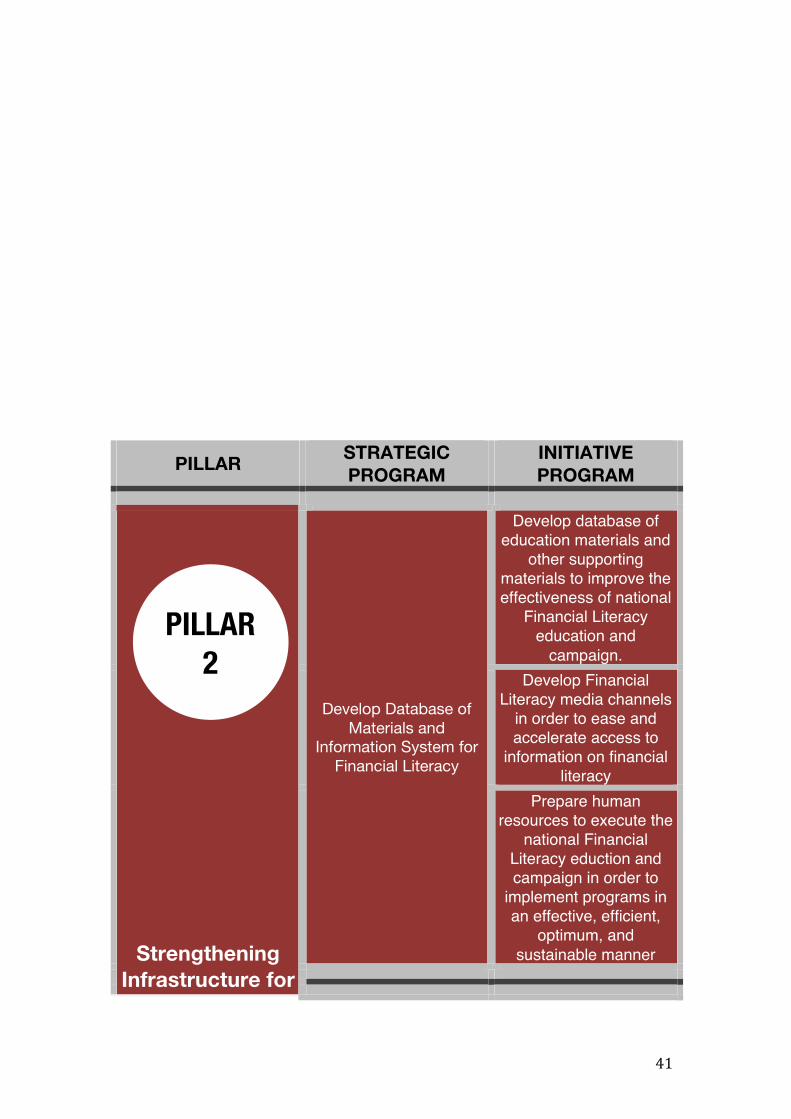
3.5.2. Strategic Programs and Initiative Programs of the National Strategy for Financial Literacy To assist in implementation, the three pillars mentioned above elaborated into
5 Strategic Programs. Each Strategic Program are then divided into 16
Initiative Programs as illustrated in Figure 4.
Figure 4 Basic Frameworks of Financial Literacy
PILLAR STRATEGIC PROGRAM
INITIATIVE PROGRAM
Develop the National Financial Literacy
Education and Campaign Program
Develop Financial Literacy materials covering the entire
financial services sector for all levels in formal education in order to
improve understanding on financial products and
services. Develop education
materials for the general public that are adjusted
to individual communities and professions in order
to improve public knowledge and
confidence on financial services institutions,
financial products and services, including
features, benefits and
PILLAR 1

40
National Financial Literacy
Education and Campaign
risks, rights and responsibilities, as well
as the necessary skills in utilizing financial
products and services
Develop the National Financial Literacy
campaign materials in order to improve financial
products and services utility.
Implement the National Financial Literacy
Education and Campaign Program
Conduct Financial Literacy education and campaign covering the entire financial services sector for all levels of
formal education across the regions in Indonesia.
Conduct Financial Literacy education and
campaign targeted at the general public in various
communities and professions in various regions in Indonesia
Deliver a national campaign on Financial
Literacy to improve financial products and
services utility in various regions in the country.
41
PILLAR STRATEGIC PROGRAM
INITIATIVE PROGRAM
Strengthening Infrastructure for
Develop Database of Materials and
Information System for Financial Literacy
Develop database of education materials and
other supporting materials to improve the effectiveness of national
Financial Literacy education and
campaign. Develop Financial
Literacy media channels in order to ease and accelerate access to
information on financial literacy
Prepare human resources to execute the
national Financial Literacy eduction and campaign in order to
implement programs in an effective, efficient,
optimum, and sustainable manner
PILLAR 2

42
Financial Literacy
Prepare Other Supporting
Infrastructures for Financial Literacy
Establish collaboration with other stakeholders in order to support the
implementation of Financial Literacy
education. Establish the organizational instruments to
implement Financial Literacy programs.
Encourage the establishment of
communities that are concerned about
Financial Literacy.
PILLAR STRATEGIC PROGRAM
INITIATIVE PROGRAM
Development of Financial Products
and Services
Develop and market
Financial Products and
Services that are
catered to public needs
in:
• Banking;
• Insurance;
• Financing
Institutions;
• Pension Funds;
• Capital Market;
and
• Pawning and
Fiduciary
Services. sgdkja jagdjkas asdh:
Encourage the financial services sector to create financial products and
services that are affordable to the general
public.
Encourage the financial services sector to create a bundling package of financial products and services (integrating
various financial products and services across the sector), in
order to improve financial products and
services utility.
Encourage and facilitate the financial services sector to expand the accessibility of their
products and services in
PILLAR 3

43
The Initiative Programs above are to be used by the Financial Services
Authority, financial services institutions, as well as the financial services
industry association as a reference for developing the action plan for Financial
Literacy. In other words, the Blueprint of the National Strategy for Financial
Literacy would become a guideline for Financial Literacy programs that will be
implemented by the Financial Services Authority or individual financial
services institutions or financial services industry association.
Overall, the implementation process of Financial Literacy, which begins in the
Blueprint of the National Strategy for Financial Literacy up to the evaluation
and development stage can be seen in Figure 5 below:
Figure 5 Implementation Process of Financial Literacy
order to be more reachable by the general public.
Encourage the financial services sector to
improve the quality of their services and
consumer protection policy.
DevelopmentandEvaluationMonitoringBusinessPlansofFinancialServicesInstitutionsActionPlans
InitiativePrograms(16)
StrategicPrograms(5)
FinancialLiteracyBlueprint

44
In order to consolidate the commitment in implementing Financial Literacy,
Article 14 of the Regulation of Financial Services Authority No. 1 / POJK.07 /
2013 on Consumer Protection in Financial Services Sector stipulates that
financial services institutions must conduct education activities to improve
Financial Literacy to Consumers and/or the general public. The planning of
education programs by financial services institutions must be incorporated
into an annual program which would be reported to the Financial Services
Authority.
In developing the Financial Literacy activities stipulated by Financial Services
Authority, financial services institutions must take into account the priorities of
targets and activities as seen in Table 10 below:
Table 10
Financial Literacy Targets and Activities Priorities
PRIORITIES 2014 2015 2016 2017 2018 TARGET Housewives Students Employees Housewives Students
SMEs College students Retirees SMEs College students Professionals Professionals
ACTIVITIES Conduct Financial Literacy education / campaign activities
Conduct Financial Literacy education / campaign activities
Conduct Financial Literacy education / campaign activities
Conduct Financial Literacy education / campaign activities
Conduct Financial Literacy education / campaign activities
POJKNo.1/POJK.07/2013

45
Strengthen Financial Literacy infrastructure
Build Education Infrastructure
Build Education Infrastructure
Conduct National Survey on Financial Literacy Conduct Evaluation of Financial Literacy Programs
CHAPTER IV: TOWARDS A SOCIETY OF WELL LITERATE INDONESIANS As elaborated in previous chapters, Indonesians still have relatively low
literacy rate across all sectors in financial literacy. In addition, very few
Indonesians utilize financial products and services accordingly.
Through the implementation of the Blueprint of the Indonesian National
Strategy for Financial Literacy, Financial Literacy Index and Financial
Products and Services Utility are expected to gradually increase in the long
term. The goal of achieving a society of financially well literate Indonesians
must be achieved through a sectorial approach, considering that the literacy
and utility rate of individual sectors in financial services vary from one another.

46
4.1. Projected Increase of Literacy Index and Banking Products and Services Utility Index In order to support the achievement of more well literate Indonesians in the
banking sector, various programs are needed to support the implementation
of the Blueprint of the Indonesian National Strategy for Financial Literacy. The
program is expected to support the achievement of the projected increase in
Banking Literacy Index and Banking Products and Services Utility Index as
illustrated in Graph 16.
Through various Financial Literacy programs implemented by the banking
industry, the Banking Literacy Index, which in 2013 is recorded at 21.80%, is
expected to grow to 24.64% in 2015. The Figures are projected to continue to
rise into 30.91% in 2017 and achieve 51.84% by 2023.
By developing more variety in banking products and services, as well as with
the expansion of banking services network, it is projected that Banking
Products and Services Utility Index would increase from 57.28% in 2013 to
61.36% by 2015. The Figures are projected to continue to rise in the coming
years such that by 2023, Banking Products and Services Utility Index would
be 80.01%.
Nevertheless, the increase in Literacy Index and Banking Products and
Services Utility must be balanced with efforts to improve knowledge of the
users of banking products and services such that they would have better
understanding of banking products and services, including features, benefits
and risks, rights and responsibilities, as well as having the skills in utilizing
banking products and services in a comprehensive manner.
Graph 17 Projection of Banking Literacy Index and Banking Products and
Services Utility Index

47
4.2. Efforts to Increase Insurance Literacy Index and Insurance Products and Services Utility Index Efforts to increase Insurance Literacy Index and Insurance Products and
Services Utility Index would be no easy feat, considering that only 18 of 100
Indonesians are well literate in insurance, and only 12 out of 100 utilize
insurance products and services.
In order to overcome the low literacy and utility rates, Financial Literacy
programs and activities are needed that would make people better understand
and utilize insurance products and services. Financial Services Authority
along with the insurance industry conduct various programs and activities that
are systematic, thoroughly planned, and sustainable, delivered to all levels of
society. One effort to increase Insurance Products and Services Utility is to
develop a scheme of insurance products that are affordable to low-income
groups, such as micro-insurance products.
With these efforts, it is expected that Insurance Literacy Index and Insurance
Products and Services Utility Index would gradually increase over the years.
2013 2015 2017 2023
21.80% 24.64% 30.91%
51.84% 57.28% 61.36%
67.00%
80.01%
Literacy Index Utility Index

48
4.3. Projected Increase of Financing Institutions Literacy Index and Financing Products and Services Utility Index Financing Institutions are not very well-known among Indonesians, as shown
in the survey that only 10 out of 100 people are well literate in the subject.
Moreover, only 6 out of 100 people utilize financing products and services.
The Financial Services Authority, along with financing institutions, will conduct
various Financial Literacy programs and activities to improve Literacy Index
and Financing Products and Services. It is expected that with these programs
and activities, Financing Institutions Literacy Index which in 2013 was rated
9.80% would increase to 12.51% by 2015 and would continue to increase into
33.27% by 2023. Meanwhile, Financing Products and Services Utility Index,
6.33% in 2013, is projected to grow to 8.08% in 2015 and 21.49% by 2023.
Graph 18
Projected Increase of Financing Institutions Literacy Index and
Financing Products and Services Utility Index

49
4.4. Projected Increase of Pension Funds Literacy Index and Pension Funds Products and Services Utility Index Although pension funds are an imporant financial instrument that would bring
benefits after retirement, apparently not many people are aware of and utilize
this instrument to prepare for life in old age. The low Literacy Index and
Pension Funds Products and Services Index are due to several factors,
including:
a. There is no compulsory regulation for companies or institutions to
provide Pension Funds for employees, therefore not many companies
and institutions have employee retirement programs.
b. Lack of proactive campaigns and promotions by Dana Pensiun
Lembaga Keuangan (Pension Funds by Financial Institutions)
c. Companies and institutions tend to not establish pension funds
programs or register their employees in Pension Funds by Financial
Institutions to avoid the burden of financial commitments, although
2013 2015 2017 2023
9.80% 12.51%
15.98%
33.27%
6.33% 8.08%
10.32%
21.49%
Literacy Index Utility Index

50
providing pension benefits can motivate employees and contribute to
their productivity; and
d. Public awareness, especially employees and independent workers, to
prepare early for life after retirement is still lacking. The public are not
proactively seeking information on financial planning for retirement.
Therefore, efforts are needed to increase Pension Funds Literacy Index and
Pension Funds Products and Services Utility through various programs, both
education and campaign, on the importance of having pension funds early on.
Therefore, Pension Funds Literacy Index and Pension Funds Products and
Services Utility Index are projected to increase from 7.13% and 1.53% in 2013
to 9% and 1.90% respectively by 2015. With the various programs
implemented and promoted by Pension Funds by Financial Institutions by
2015, Literacy Index and Pension Funds Products and Services Utility are
projected to grow into 12% and 3.80% by 2017 respectively, which would
gradually grow into 30% and 7% by 2023.
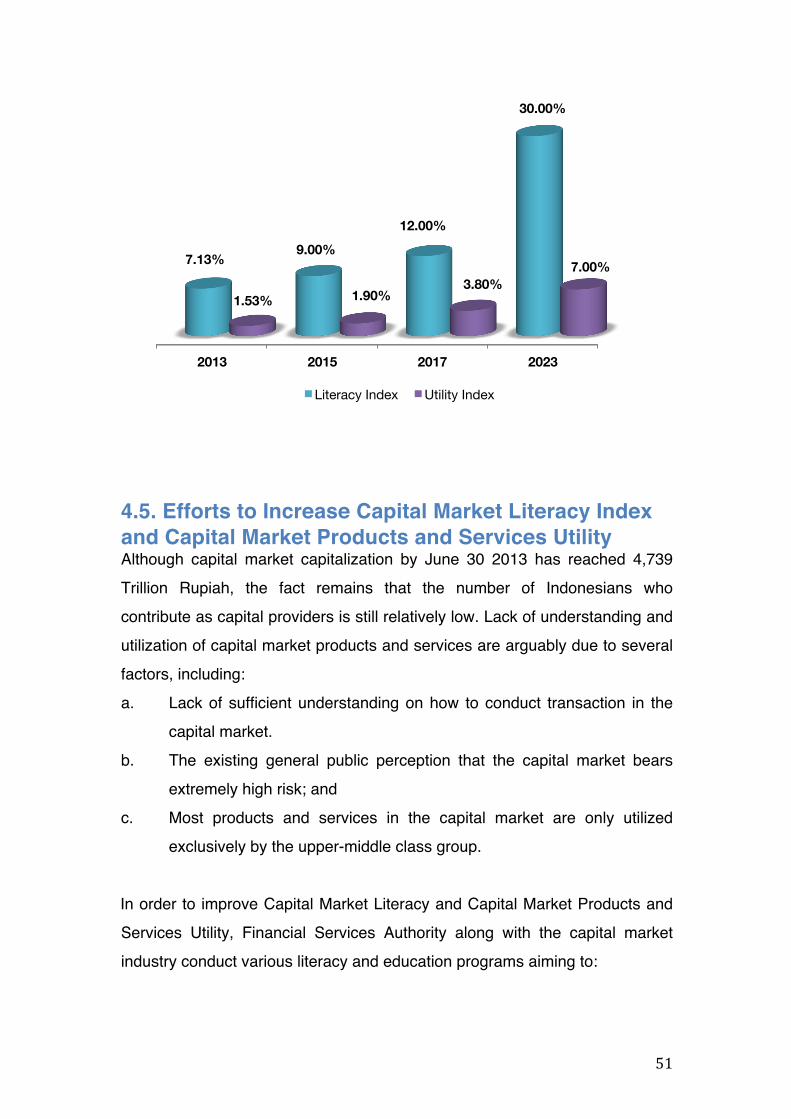
Graph 19
Pension Funds Literacy Index and Pension Funds Products and
Services Utility
51
4.5. Efforts to Increase Capital Market Literacy Index and Capital Market Products and Services Utility Although capital market capitalization by June 30 2013 has reached 4,739
Trillion Rupiah, the fact remains that the number of Indonesians who
contribute as capital providers is still relatively low. Lack of understanding and
utilization of capital market products and services are arguably due to several
factors, including:
a. Lack of sufficient understanding on how to conduct transaction in the
capital market.
b. The existing general public perception that the capital market bears
extremely high risk; and
c. Most products and services in the capital market are only utilized
exclusively by the upper-middle class group.
In order to improve Capital Market Literacy and Capital Market Products and
Services Utility, Financial Services Authority along with the capital market
industry conduct various literacy and education programs aiming to:
2013 2015 2017 2023
7.13% 9.00%
12.00%
30.00%
1.53% 1.90% 3.80%
7.00%
Literacy Index Utility Index

52
a. Promote the correct knowledge and perception to the general public on
the capital market;
b. Improve public and investor awareness and confidence on the capital
market industry, including its products and services, features, benefits
and risks, rights and responsibilities, as well as the required skills in
utilizing capital market products and services; and
c. Expand the market segment of capital market products and services.
In the long term, the capital market industry aims to provide and promote
capital market products and services that are affordable to all income groups
in an effort to increase capital market products and services utility.
4.6. Projected Increase in Pawning and Fiduciary Services Literacy Index and Pawning and Fiduciary Products and Services Utility Index In order to increase Pawning and Fiduciary Services Literacy Index and
Pawning and Fiduciary Products and Services Utility Index, various literacy
programs and activities are implemented with the objective of not only
improving public literacy rate on pawning and fiduciary services, but also
increasing utility in pawning and fiduciary products and services.
Consequently, efforts are concentrated into changing the public mindset on
pawning and fiduciary services providers that not only provide pawning and
fiduciary services, but also institutions that house other forms of financial
transactions, such as multipayment method, wire transfer services, and gold
investments.
With various comprehensive and sustainable financial literacy programs, it is
projected that Literacy Index and Fiduciary and Pawning Products and
Services would increase from 14.84% and 5.04% respectively in 2013 into
18% and 5.82% by 2015. The Figures are expected to continue to grow into
23% and 7.07% respectively by 2017, reaching 33% and 10.57% by 2023.

53
Graph 20 Projected Increase in Pawning and Fiduciary Literacy Index and
Pawning and Fiduciary Products and Services Literacy Index
4.7. Measuring the Success of Financial Literacy The success of Financial Literacy can be assessed using various
measurement methods. Financial Literacy Programs in Indonesia will be
measured through the National Survey on Financial Literacy administered
once every three years. The National Survey on Financial Literacy measures
Financial Literacy Index covering at least the Banking Industry, Insurance
Industry, Financing Institutions, Pension Funds, Capital Market, and Pawning
and Fiduciary Services. The survey measures not only the increase of the
number of Indonesians classified as Well Literate, but also those who have
upgraded from Not Literate to Less Literate, from Less Literate to Sufficient
Literate, as well as from Sufficient Literate to Well Literate.
In addition to measuring the Financial Literacy Index, the National Survey on
Financial Literacy also measures Financial Products and Services Utility in
2013 2015 2017 2023
14.84% 18.00%
23.00%
33.00%
5.04% 5.82% 7.07% 10.57%
Literacy Index Utility Index

54
order to identify people who have utilized financial productes and services.
Furthermore, one indicator of utility is the increase in the number of customer
accounts managed by financial services institutions.
CHAPTER V: ACTION PLANS For implementation purposes, each of the 3 Pillars in the Blueprint of the
National Strategy for Financial Literacy is elaborated into Strategic Programs.
Strategic Programs are then further elaborated into Initiative Programs, which
are the basis of reference for Financial Services Authority as well as financial
services institutions and financial services industry association to develop
action plans for the next 5 years.
5.1. Pillar 1: National Financial Literacy Education and Campaign Strategic Program 1.1. Develop the National Financial Literacy Education and Campaign Program.
Initiative Program 1.1.1. Develop Financial Literacy materials covering the entire financial services
sector for all levels in formal education in order to improve understanding on
financial products and services.
YEAR ACTION PLANS
2014 –
2015
Develop Financial Literacy materials covering the entire financial
services sector for all levels in formal education – primary
education, secondary education, and/or higher education.
2017 – Evaluate and improve Financial Literacy materials covering the

55
2018 entire financial services sector for all levels in formal education –
primary education, secondary education, and/or higher education.
Initiative Program 1.1.2. Develop education materials for the general public that are adjusted to
individual communities and professions in order to improve public knowledge
and confidence on financial services institutions, financial products and
services, including features, benefits and risks, rights and responsibilities, as
well as the necessary skills in utilizing financial products and services.
YEAR ACTION PLANS
2014 Develop Financial Literacy materials covering the entire financial
services sector, prioritizing housewives and Micro, Small, and
Medium Enterprises (MSMEs).
2015 Develop Financial Literacy materials covering the entire financial
services sector, prioritizing employees and retirees.
2016 Develop Financial Literacy materials covering the entire financial
services sector, prioritizing communities and professionals.
2017 –
2018
Evaluate and improve Financial Literacy materials covering the
entire financial services sector for certain community/professional
groups.
Initiative Program 1.1.3. Develop the National Financial Literacy campaign materials in order to
improve financial products and services utility.
YEAR ACTION PLAN
2014 –
2018
Develop and evaluate integrated Public Service Announcements
(PSAs) on the financial services sector covering the entire
financial services sector.
Strategic Program 1.2.

56
Conduct National Financial Literacy Education and Campaign Program.
Initiative Program 1.2.1. Conduct Financial Literacy education and campaign covering the entire
financial services sector for all levels of formal education across the regions in
Indonesia.
YEAR ACTION PLANS
2014 Conduct Financial Literacy education and campaign covering the
entire financial services sector targeting academic professionals in
at least 24 cities.
2015 –
2016
1. Launch the pilot project of Financial Literacy education covering
the entire financial services sector at all levels of formal education
– Primary Education, Secondary Education, and/or Higher
Education.
2. Deliver Financial Literacy materials covering the entire financial
services sector to all levels of formal education – Primary
Education, Secondary Education, and/or Higher Education.
3. Conduct Financial Literacy education and campaign covering
the entire financial services sector targeting academic
professionals in at least 24 cities.
2017 –
2018
Conduct Financial Literacy education and campaign covering the
entire financial services sector targeting academic professionals in
at least 30 cities.
Initiative Program 1.2.2. Conduct Financial Literacy education and campaign targeted at the general
public in various communities and professions in various regions in Indonesia.
YEAR ACTION PLANS
2014 1. Conduct Financial Literacy education and campaign covering
the entire financial services sector in at least 24 cities, targeting
housewives and MSMEs.
57
2. Conduct 2 outreach program activities for certain
communities/professions.
2015 1. Conduct Financial Literacy education and campaign covering
the entire financial services sector in at least 24 cities, targeting
certain communities/professions.
2. Conduct at least 4 outreach program activities for certain
communities/professions.
2016 1. Conduct Financial Literacy education and campaign covering
the entire financial services sector in at least 24 cities, targeting
employees and retirees.
2. Conduct at least 6 outreach program activities for certain
communities/professions.
2017 1. Conduct Financial Literacy education and campaign covering
the entire financial services sector in at least 24 cities, targeting
housewives and MSMEs.
2. Conduct at least 8 outreach program activities for certain
communities/professions.
2018 1. Conduct Financial Literacy education and campaign covering
the entire financial services sector in at least 30 cities, targeting
certain communities/professions.
2. Conduct at least 10 outreach program activities for certain
communities/professions.
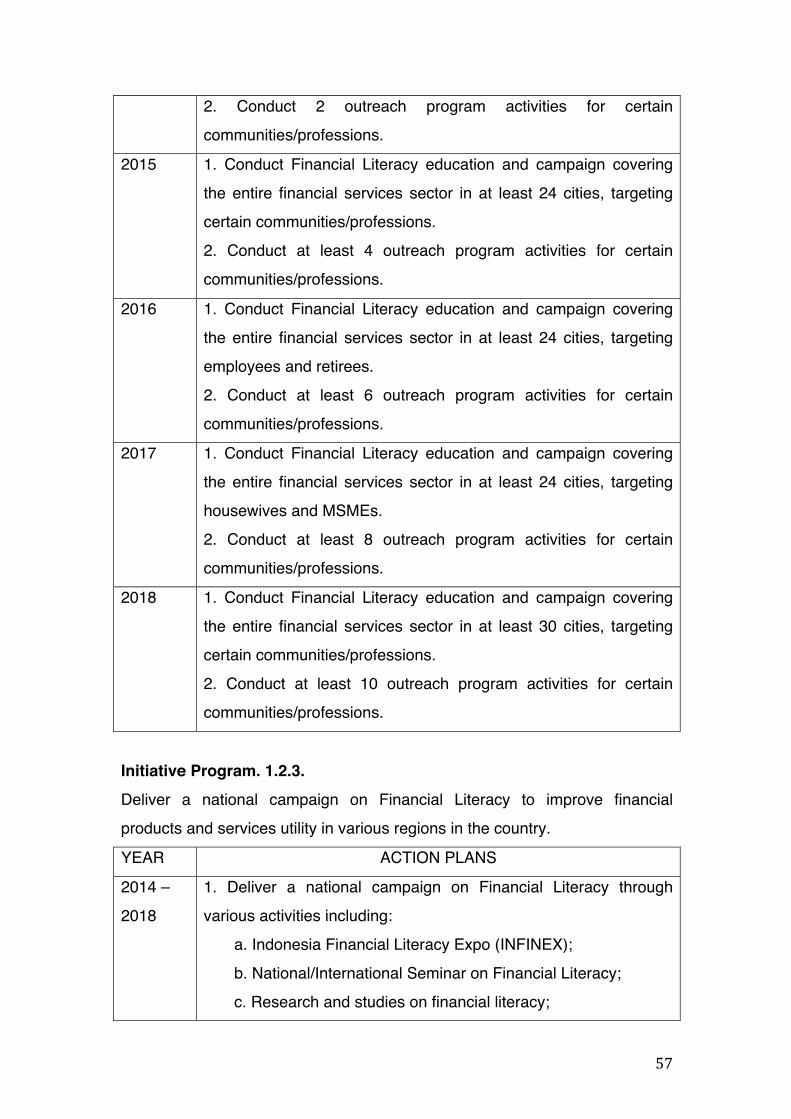
Initiative Program. 1.2.3. Deliver a national campaign on Financial Literacy to improve financial
products and services utility in various regions in the country.
YEAR ACTION PLANS
2014 –
2018
1. Deliver a national campaign on Financial Literacy through
various activities including:
a. Indonesia Financial Literacy Expo (INFINEX);
b. National/International Seminar on Financial Literacy;
c. Research and studies on financial literacy;

58
d. Academic paper competitions on financial literacy;
e. Speech/caricature/poster contests on expressing the voice
of the consumers.
2. Promote the utilization of affordable financial products and
services through MSMEs in at least 20 cities outside of the Capital
Province.
3. Support education and campaign activities on financial products
and services conducted by financial services industry association.
5.2. Pillar 2: Strengthening Financial Literacy Infrastructure Strategic Program 2.1. Develop Financial Literacy database of materials and information system.
Initiative Program 2.1.1.
Develop database of education materials and other supporting materials to
improve the effectiveness of national Financial Literacy education and
campaign.
YEAR ACTION PLANS
2014 Prepare and develop database system of Financial Literacy
materials and other supporting materials covering the entire
financial services sector.
2015 –
108
Provide and develop database system of Financial Literacy
materials and other supporting materials covering the entire
financial services sector.
Initiative Program 2.1.2.
Develop Financial Literacy media channels in order to ease and accelerate
access to information on financial literacy.

59
YEAR ACTION PLANS
2014 Develop Financial Literacy website containing financial information
and education materials.
2015 –
2016
Provide and develop Financial Literacy website containing financial
information and education materials.
2017 –
2018
Develop and evaluate Financial Literacy website containing
financial information and education materials.
Initiative Program 2.1.3. Prepare human resources to execute the national Financial Literacy eduction
and campaign in order to implement programs in an effective, efficient,
optimum, and sustainable manner.
YEAR ACTION PLANS
2014 –
2018
1. Conduct training of trainers for teachers and lecturers in all
stages of formal education – Primary Education, Secondary
Education, and/or Higher Education.
2. Conduct training of trainers for certain communities/professions.
Strategic Program 2.2 Prepare other supporting infrastructures for financial literacy.
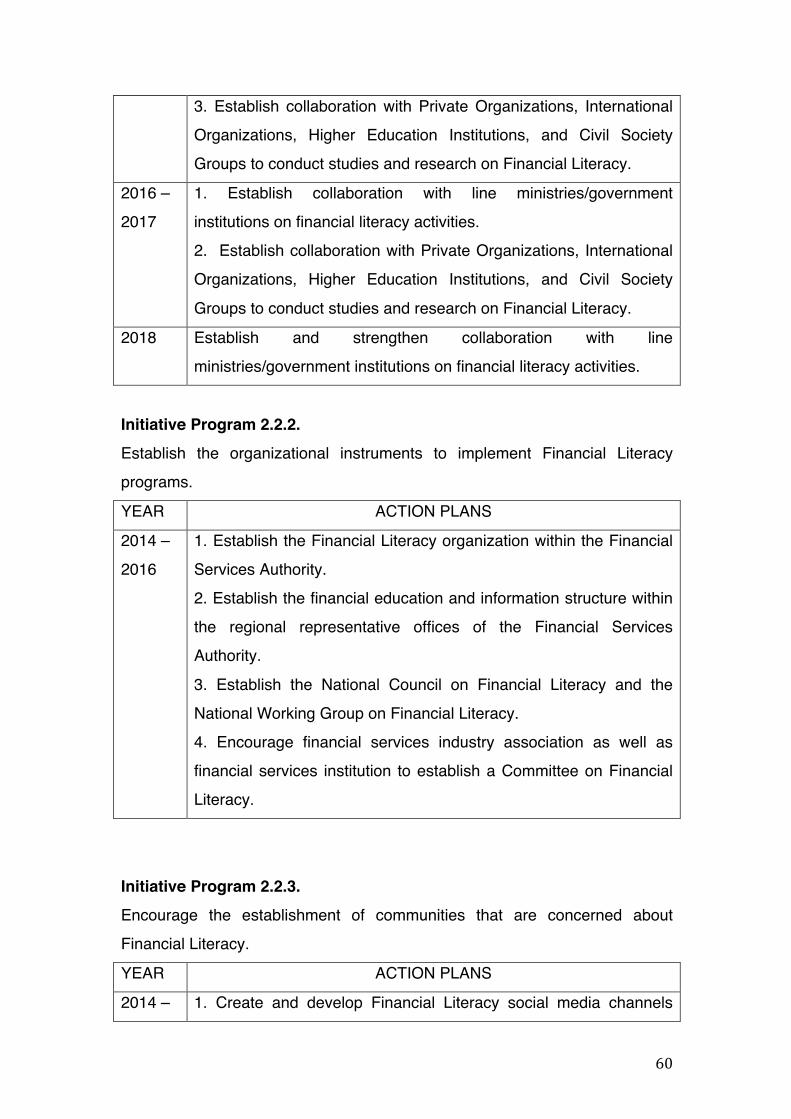
Initiative Program 2.2.1. Establish collaboration with other stakeholders in order to support the
implementation of Financial Literacy education.
YEAR ACTION PLANS
2014 –
2015
1. Establish collaboration with line ministries/government
institutions on financial literacy activities.
2. Establish collaboration with several education institutions to
prepare the pilot project of Financial Literacy education covering the
entire financial services sector for all stages of formal education –
Primary Education, Secondary Education, and/or Higher Education.
60
3. Establish collaboration with Private Organizations, International
Organizations, Higher Education Institutions, and Civil Society
Groups to conduct studies and research on Financial Literacy.
2016 –
2017
1. Establish collaboration with line ministries/government
institutions on financial literacy activities.
2. Establish collaboration with Private Organizations, International
Organizations, Higher Education Institutions, and Civil Society
Groups to conduct studies and research on Financial Literacy.
2018 Establish and strengthen collaboration with line
ministries/government institutions on financial literacy activities.
Initiative Program 2.2.2. Establish the organizational instruments to implement Financial Literacy
programs.
YEAR ACTION PLANS
2014 –
2016
1. Establish the Financial Literacy organization within the Financial
Services Authority.
2. Establish the financial education and information structure within
the regional representative offices of the Financial Services
Authority.
3. Establish the National Council on Financial Literacy and the
National Working Group on Financial Literacy.
4. Encourage financial services industry association as well as
financial services institution to establish a Committee on Financial
Literacy.
Initiative Program 2.2.3.
Encourage the establishment of communities that are concerned about
Financial Literacy.
YEAR ACTION PLANS
2014 – 1. Create and develop Financial Literacy social media channels

61
2018 (Twitter, Facebook, YouTube, Path, Instagram) which would
contain and promote information and communication to improve the
public’s financial literacy.
2. Encourage communities to establish organizations or
associations of citizens concerned with Financial Literacy.
5.3. Pillar 3: Development of Financial Products and Services Strategic Program 3.1. Develop and market Financial Products and Services that are catered to
public needs in:
• Banking;
• Insurance;
• Financing Institutions;
• Pension Funds;
• Capital Market; and
• Pawning and Fiduciary Services.
Initiative Program 3.1.1.
Encourage the financial services sector to create financial products and
services that are affordable to the general public.
YEAR ACTION PLANS
2014 –
2018
Encourage and facilitate the financial services sector to develop
financial products and services that are affordable to the general
public.
Initiative Program 3.1.2. Encourage the financial services sector to create a bundling package of
financial products and services (integrating various financial products and
services across the sector), in order to improve financial products and
services utility.

62
YEAR ACTION PLANS
2014 –
2018
Encourage the financial services sector to create a bundling
package of financial products and services (integrating various
financial products and services across the sector).
Initiative Program 3.1.3. Encourage and facilitate the financial services sector to expand the
accessibility of their products and services in order to be more reachable by
the general public.
YEAR ACTION PLANS
2014 –
2018
Encourage and facilitate the financial services sector to develop a
network of distribution (delivery channel) for their products and
services to be more easily accessible by the public.
Initiative Program 3.1.4.
Encourage the financial services sector to improve the quality of their services
and consumer protection policy.
YEAR ACTION PLANS
2014 –
2018
1. Encourage the financisl services sector to improve the quality of
their services and consumer protection policy.
2. Encourage the financial services sector to improve consumer
protection aspects in marketing their financial products and
services as well as in handling grievances and disputes.
Related Documents