04_Education_SteeringCommitteeDraft 0 3/29/2010 RWANDA NATIONAL LAND USE DEVELOPMENT MASTER PLAN-EDUCATION

Welcome message from author
This document is posted to help you gain knowledge. Please leave a comment to let me know what you think about it! Share it to your friends and learn new things together.
Transcript

04_Education_SteeringCommitteeDraft 0 3/29/2010
R W A N D A N A T I O N A L L A N D U S E D E V E L O P M E N T M A S T E R P L A N - E D U C A T I O N

R W A N D A N A T I O N A L L A N D U S E D E V E L O P M E N T M A S T E R P L A N - E D U C A T I O N
04_Education_SteeringCommitteeDraft 3/29/2010 1
CHAPTER 1.0: INTRODUCTION..............................................................................................3
CHAPTER 2.0: EDUCATION SYSTEM IN RWANDA............................................................5
CHAPTER 3.0: PRESENT SITUATION AND DEMAND........................................................7 3.1: AGE STRUCTURE...............................................................................................................7 3.2. ORGANIZATION ..................................................................................................................8 3.3: QUALITY...........................................................................................................................14 LACK OF DATA ....................................................................................................................14 3.4. ENROLMENT.....................................................................................................................17
3.4.1. Enrollment at all levels of education.....................................................................18 3.4.1.1 Enrolment at Primary level.............................................................................18 3.4.1.2: Enrolment at secondary level .......................................................................18 3.4.1.3: Enrolment in Tertiary education level...........................................................18
3.5. DEMAND FOR EDUCATION ...............................................................................................21 3.5.1. Population and Fertility rate projections...............................................................21
CHAPTER 4.0: CONNECTION EDUCATION AND LABOR MARKET .............................22
4.1: FEMALE PARTICIPATION IN LABOR MARKET....................................................................22 4.2: THE ROLE OF IT IN LABOR MARKET DEVELOPMENT.......................................................23 4.3: STRATEGIES FOR PROMOTION OF LABOR WORKFORCE AND MARKET ..........................23
CHAPTER 5.0: CHALLENGES AND STRATEGIES...........................................................24 5.1: TEACHER TRAINING AND CURRICULUM...........................................................................24 5.2: GOVERNANCE..................................................................................................................25
CHAPTER 6.0: DISTRICT PLANNING IMPLICATIONS .....................................................25 6.1: EDUCATION STANDARDS.................................................................................................25 6.2: PLANNING STANDARDS ...................................................................................................25 EXAMPLE ................................................................................................................................26
CHAPTER 7.0: GUIDELINES..................................................................................................30
REFERENCES..........................................................................................................................31
LIST OF TABLES .....................................................................................................................32
LIST OF FIGURES....................................................................................................................32
LIST OF BOXES .......................................................................................................................32
The National Land Use and Development Master Plan is referred to as the Plan in the Text.

04_Education_SteeringCommitteeDraft 2 3/29/2010

04_Education_SteeringCommitteeDraft 3 3/29/2010
R W A N D A N A T I O N A L L A N D U S E D E V E L O P M E N T M A S T E R P L A N - E D U C A T I O N
Chapter 1.0: Introduction Even though considerable improvements have been made in education, the relations and interactions between higher education plans and socio-economic development have been relatively poor in Rwanda. Planning for the education sector needs awareness of large-scale changing factors during the planning period stretching up to 2020. Among these changes we find the demographic structure of the population, the economic transition of the region and new requirements from the labor market as well as economic and social development.
Therefore, the educational system needs to develop relevant educational opportunities and research resources. Rwanda also needs to offer an infrastructure for physical investments, legislation, economy and social and environmental conditions to render it a place with good living conditions, attracting trade and industry.
Figure 1: Excella Private School building at Kimironko in Kigali.
The main vision for Rwanda is to offer its inhabitants a long term qualitative educational system. By 2020 Rwanda will have a modern and attractive educational system offering lifelong learning and providing the skills required for pushing the economy forward. Education supply needs to address technological changes and should support the goal of implementing an Information Society, see Chapter 4.2. The educational system will also be able to guarantee every citizen excellent and responsive curricula, high-quality teaching and a first-rate labor market connection.
In order to achieve these goals, it is imperative to set guidelines for the educational sector which create connections with the labor market and society’s future needs. According to the Rwandan constitution, education is a principal right for all citizens and offered for free. Education is compulsory until the end of basic education, i.e. nine years, and those continuing to higher education are free to select any field of study. The fact that the state has assumed the responsibility to provide education for all for free and also offers a high degree of individual freedom constitutes an important basis for individual development.
The implementation of the Nine Year Basic Education program demands for increased numbers of trained teachers, more learning materials and more classrooms. The challenge is to develop effective implementation strategies, improved quality, expanded capacity and managed growth (ESSP 2006 – 2010).
The global goal and mission of education sector of the Government of Rwanda is to reduce poverty and in turn to improve the well-being of its population. The aim of education within education context is to combat illiteracy and ignorance and to glom human resources useful for the socio-economic development of Rwanda through the education system (ESSP 2006 – 2010).1
There were no public schools in Rwanda until the 1950s, and secondary education was attainable only at a school founded in 1929 at Butare by Roman Catholic missionaries. With independence, Rwanda began a major expansion of its educational programs; in 1989, education accounted for 25.4% of total government expenditure. In the year 2000, projected
1 Education Sector Strategic Plan 2006-2010, page 7.

R W A N D A N A T I O N A L L A N D U S E D E V E L O P M E N T M A S T E R P L A N - E D U C A T I O N
04_Education_SteeringCommitteeDraft 3/29/2010 4
adult illiteracy rates stood at around 33.% i.e. (males, 26%; females, 39%). (http://www.nationsencyclopedia.com/Africa/RwandaEDUCATION.html)
Investment in education sector has not only attracted the government but also private and religious based originations, but many receive state subsidies. To date, education is free and compulsory for all children aged 7 to 13 that is primary education, followed by six years of secondary education. This meant more investment in public schools, and an increment in both the number of schools and enrollment has been registered. For example Rwanda experienced a great increase in primary pupil’s net enrolment 73.5% - 94.2% in 2000 and 2008 respectively (NISR 2009).
Throughout the Higher Education system some 100 PhDs are held, the number of them at NUR. Areas of research include agriculture, livestock and the training of farm managers. A system of ‘universités du soir’ (Night School University) has been established to widen access to university in both public and private Universities. An equal emphasis should therefore be put in to ensure the quality of courses and services being offered (MINEDUC-HEC.2)
2 MINEDUC-HEC un published report 2010
Figure 2: A Nursery School
High quality teaching, curricula and planning standards, good governance and vocational training in accordance with the labor market needs, are all issues of great importance for a sustainable educational development. The government of Rwanda through the Ministry of Education passed an order No 48/01 of 10/2009 establishing the quality standards in education for nursery, primary, and secondary schools (MINEDUC 2009). The government of Rwanda considers investing in people its major resources as one of the most valuable investments it can ever do. Ensuring quality education therefore is one of the channels towards sustainable development.
Development of human capital and offering equal opportunities in education will be crucial to the country in order to support economic reforms. The education sector thus is a key instrument for preventing structural unemployment and social inequality.

R W A N D A N A T I O N A L L A N D U S E D E V E L O P M E N T M A S T E R P L A N - E D U C A T I O N
04_Education_SteeringCommitteeDraft 3/29/2010 5
Chapter 2.0: Education system in Rwanda Rwandan students are required to begin school at age seven. Both primary and secondary school are six years in length. The academic year is centrally determined and lasts from September to July and entry into secondary school is by examination. Rwandan families are required to pay school fees and to purchase school materials to enroll their children, but the government routinely waives fees for orphans.
International organizations have been influential in Rwandan education since the Germans and Belgians colonized the area. Religious and private schools have been active since colonization and remain significant today. Since 1995, international aid agencies, foreign governments, and international financial institutions have been actively involved in reconstructing the education system.
Rwanda’s Education system is arranged as follows: Primary School level 6 years
Lower Secondary School level 3 years
Upper Secondary School level 3 years
Tertiary/ Bachelor’s degrees level 4 years
Table 1: School Going Age and Levels of Education in Rwanda.
Mandatory Voluntary
Primary Education Lower Sec Education
Upper Sec Education Tertiary Education
6 7 8 9 10 11 12 13 14 15 16 17 18 19 20 21 22
The government of Rwanda also introduced the nine year universal free education which is mandatory i.e. from primary level up to lower secondary level, in a bid to fight against illiteracy and ensure sustainable development as reflected in Rwanda vision 2020. For all the above levels, children have to do a national examination to qualify for the next level of education.
Figure 3: Being able to read, write and calculate is the gateway for business activities.

R W A N D A N A T I O N A L L A N D U S E D E V E L O P M E N T M A S T E R P L A N - E D U C A T I O N
04_Education_SteeringCommitteeDraft 3/29/2010 6
At the end of upper Secondary School, all students take the final national exam in their combination or subjects to qualify them for University/Tertiary education. These exams are given nationwide in November each year, but the results are available the following March.
Table 2: Grading System in Rwanda.
Percentage Grade Grade scale
Scale boundary Performance
marks 85-100 A 11 10.5 – 11 Excellent 80-84 A- 10 9.5 - 10.4 75-79 B+ 9 8.5 - 9.4 Very Good 70-74 B 8 7.5 - 8.4 65-69 B- 7 6.5 - 7.4 60-64 C+ 6 5.5 - 6.4 Merit 55-59 C 5 4.5 - 5.4 50-54 C- 4 3.5 – 4.4 40-49 D+,D,D- 3 and 2 1.5 – 2.5 Pass
Source: http://education.stateuniversity.com
Table 3: A Level/Upper Secondary Students' Performance in National Examination 2009 per District
District
Number of Candidates who sat for Exams
Passed Candidates
Total % of the passed candidates
Gisagara 600
592 98.7
Rwamagana 1,079
1,055 97.8
nyabihu 1,276
1,214 95.1
kayonza 729
693 95.1
kirehe 490
464 94.7
nyamagabe 1,364
1,288 94.4
karongi 1,243
1,167 93.9
Ruhango 1,844
1,727 93.7
Nyamasheke 1,098
1,027 93.5
Burera 891
833 93.5
Gicumbi 1,305
1,218 93.3
Ngoma 1,507
1,399 92.8
Nyanza 1,494
1,386 92.8
Muhanga 1,920
1,777 92.6

R W A N D A N A T I O N A L L A N D U S E D E V E L O P M E N T M A S T E R P L A N - E D U C A T I O N
04_Education_SteeringCommitteeDraft 3/29/2010 7
Rutsiro 701
643 91.7
Gatsibo 983
901 91.7
Nyaruguru 276
252 91.3
Rulindo 524
477 91
Huye 1,852
1,680 90.7
Ngororero 964
873 90.6
Gakenke 1,093
986 90.2
Rusizi 1,303
1,169 89.7
Kamonyi 830
733 88.3
Rubavu 2,121
1,870 88.2
Nyagatare 660
580 87.8
Musanze 2,180
1,871 85.8
Kicukiro 2,723
2,290 84.1
Bugesera 943
785 83.2
Gasabo 3,566
2,910 81.6
Nyarugenge 4,981
3,848 77.3
Chapter 3.0: Present Situation and Demand 3.1: Age Structure One factor influencing the demand for education is the age distribution of the population. In countries like Rwanda where the share of children and youngsters in the population is higher than the working age population, a greater demand arises for educational resources. This is due to 2 major factors i) high fertility rate and a pro- birth culture.
Figure 4: Population distribution -2008
POPULATION DISTRIBUTION BY AGE GROUP AND GENDER 2008
1200000 700000 200000 300000 800000
0 - 4
5 - 9
10 - 14
15 - 19
20 - 24
25 - 29
30 - 34
35 - 39
40 - 44
45 - 49
50 - 54
55 - 59
60 - 64
65 - 69
70 - 74
75 - 79
80 +
AG
E G
RO
UP
POPULATION
NO. OF MALES
NO. OF FEMALES
R W A N D A N A T I O N A L L A N D U S E D E V E L O P M E N T M A S T E R P L A N - E D U C A T I O N
04_Education_SteeringCommitteeDraft 3/29/2010 8
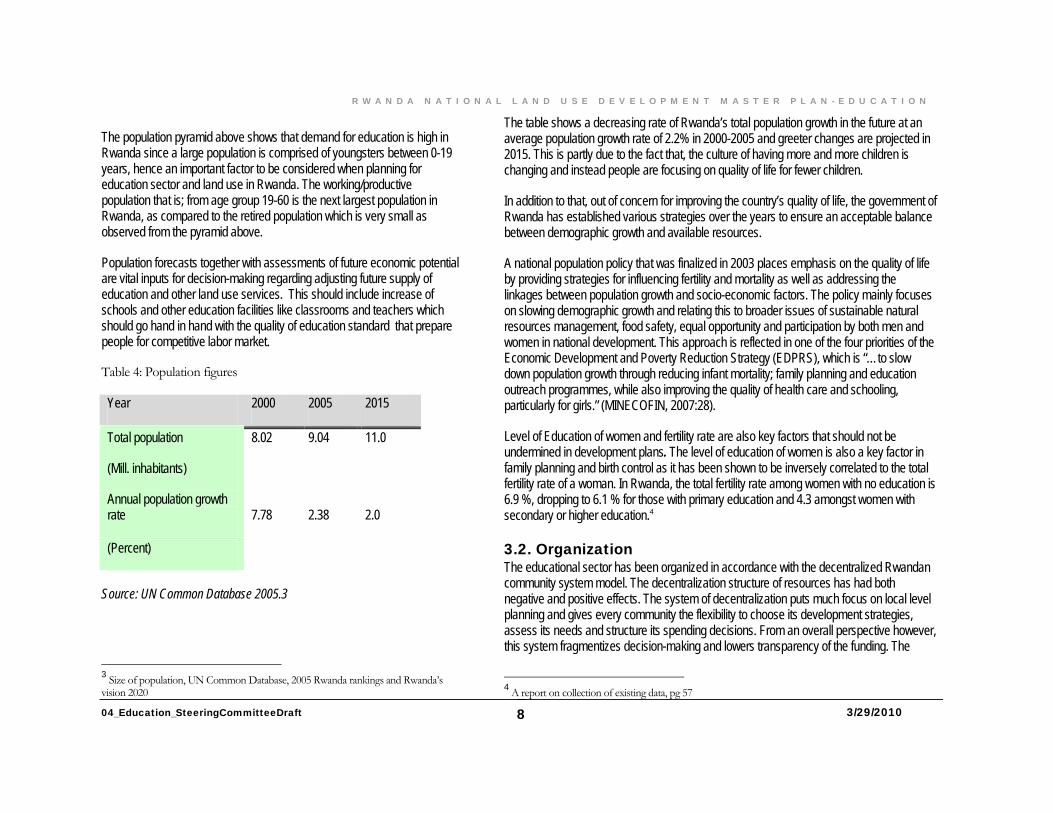
The population pyramid above shows that demand for education is high in Rwanda since a large population is comprised of youngsters between 0-19 years, hence an important factor to be considered when planning for education sector and land use in Rwanda. The working/productive population that is; from age group 19-60 is the next largest population in Rwanda, as compared to the retired population which is very small as observed from the pyramid above.
Population forecasts together with assessments of future economic potential are vital inputs for decision-making regarding adjusting future supply of education and other land use services. This should include increase of schools and other education facilities like classrooms and teachers which should go hand in hand with the quality of education standard that prepare people for competitive labor market.
Table 4: Population figures
Year 2000 2005 2015
Total population 8.02 9.04 11.0
(Mill. inhabitants)
Annual population growth rate 7.78 2.38 2.0
(Percent)
Source: UN Common Database 2005.3
3 Size of population, UN Common Database, 2005 Rwanda rankings and Rwanda’s vision 2020
The table shows a decreasing rate of Rwanda’s total population growth in the future at an average population growth rate of 2.2% in 2000-2005 and greeter changes are projected in 2015. This is partly due to the fact that, the culture of having more and more children is changing and instead people are focusing on quality of life for fewer children.
In addition to that, out of concern for improving the country’s quality of life, the government of Rwanda has established various strategies over the years to ensure an acceptable balance between demographic growth and available resources.
A national population policy that was finalized in 2003 places emphasis on the quality of life by providing strategies for influencing fertility and mortality as well as addressing the linkages between population growth and socio-economic factors. The policy mainly focuses on slowing demographic growth and relating this to broader issues of sustainable natural resources management, food safety, equal opportunity and participation by both men and women in national development. This approach is reflected in one of the four priorities of the Economic Development and Poverty Reduction Strategy (EDPRS), which is “…to slow down population growth through reducing infant mortality; family planning and education outreach programmes, while also improving the quality of health care and schooling, particularly for girls.” (MINECOFIN, 2007:28).
Level of Education of women and fertility rate are also key factors that should not be undermined in development plans. The level of education of women is also a key factor in family planning and birth control as it has been shown to be inversely correlated to the total fertility rate of a woman. In Rwanda, the total fertility rate among women with no education is 6.9 %, dropping to 6.1 % for those with primary education and 4.3 amongst women with secondary or higher education.4
3.2. Organization The educational sector has been organized in accordance with the decentralized Rwandan community system model. The decentralization structure of resources has had both negative and positive effects. The system of decentralization puts much focus on local level planning and gives every community the flexibility to choose its development strategies, assess its needs and structure its spending decisions. From an overall perspective however, this system fragmentizes decision-making and lowers transparency of the funding. The
4 A report on collection of existing data, pg 57

R W A N D A N A T I O N A L L A N D U S E D E V E L O P M E N T M A S T E R P L A N - E D U C A T I O N
04_Education_SteeringCommitteeDraft 3/29/2010 9
result of decentralized governance has lead to inefficient use of funds and a varying quality within the educational sector.
In a bid to curb the negative effects of decentralization structure in education sector and all other public sectors, the government established the accountability frameworks accompanied by performance contacts in all government based sectors. More and close monitoring is however needed to ensure effective and efficient management of government funds. An institution like Auditor general’s office was also established to oversee the effective use of public funds and stimulate advantages of decentralization.
The government affirms the importance of partnerships between government, parents, communities, donors, the private sector, NGOs, FBOs and civil society.
There will be regular participative consultations, negotiations and meetings coordinated by the Government. A horizontal co-ordination between different actors will be established, and through decentralization processes, there will be effective vertical links between central government, local government and grass roots groups (ESSP 2006- 2010).
Addressing the problems of fragmentation and low transparency of the old organization, The Education Sector Policy (2002) provides the basis for a strategic approach to sector development, including the monitoring, evaluation and reporting of sector performance. The educational planning has become centralized, especially concerning budget assets and spending. There is also a number of specialized agencies connected to Basic and Intermediate (Primary and secondary) Education, i.e. The responsibility of MINEDUC and its co-ministries (MINCOFIN, MIFOTRA and MINALOC), Provinces, Districts and schools is to establish, implement and oversee the monitoring and evaluation of sector performance in order to make the most efficient use of scarce resources, within clearly defined roles and constraints (ESSP 2006-2010)5
5Education Sector Strategic Plan 2006 – 2010 page 60.
In addition, a new educational reform was introduced in 2009 for primary/secondary education, containing a definition of duration (three years instead of four) and a limiting of the branches from 17 to only six. The new branches comprise basic sciences, biology, engineering, economics, social sciences and linguistics. The reform will lead to a decreasing demand of secondary school buildings, equipment and teachers. During the year 2007-2008 the reform also lead to a doubling of students who wish to enroll at the universities.

R W A N D A N A T I O N A L L A N D U S E D E V E L O P M E N T M A S T E R P L A N - E D U C A T I O N
04_Education_SteeringCommitteeDraft 3/29/2010 10
Table 5: Primary schools and number of needed classrooms per District
Districts Primary schools
Number of children (2008)
No of pupil per school
Pupils Classrooms ratio:2007 (70)
Pupils Classroom Ratio 2020 (46)
Classrooms needed (2020)
Bugesera 72 70,171 975 14 21 7 Burera 86 90,549 1,053 15 23 8 Gakenke 101 79,230 784 11 17 6 Gasabo 81 67,316 831 12 18 6 Gatsibo 81 86,161 1,064 15 23 8 Gicumbi 93 99,386 1,069 15 23 8 Gisagara 65 58,348 898 13 20 7 Huye 92 60,916 662 9 14 5 Kamonyi 84 70,753 842 12 18 6 Karongi 122 79,206 649 9 14 5 Kayonza 65 64,403 991 14 22 7 Kicukiro 53 40,595 766 11 17 6 Kirehe 54 67,400 1,248 18 27 9 Muhanga 105 70,896 675 10 15 5 Musanze 78 87,807 1,126 16 24 8 Ngoma 64 66,478 1,039 15 23 8 Ngororero 94 79,318 844 12 18 6 Nyabihu 82 82,186 1,002 14 22 7

R W A N D A N A T I O N A L L A N D U S E D E V E L O P M E N T M A S T E R P L A N - E D U C A T I O N
04_Education_SteeringCommitteeDraft 3/29/2010 11
Nyagatare 89 86,397 971 14 21 7
Nyamagabe 102 77,619 761 11 17 6 Nyamasheke 116 101,645 876 13 19 7 Nyanza 76 59,397 782 11 17 6 Nyarugenge 33 42,039 1,274 18 28 9 Nyaruguru 73 70,879 971 14 21 7 Rubavu 70 72,749 1,039 15 23 8 Rulindo 77 66,915 869 12 19 6 Ruhango 79 66,002 835 12 18 6
Rutsiro 87 78,012 897 13 19 7 Rusizi 105 90,589 863 12 19 6 Rwamagana 53 56,908 1,074 15 23 8
Total 2,432 2,190,270 27,729 396 603 207
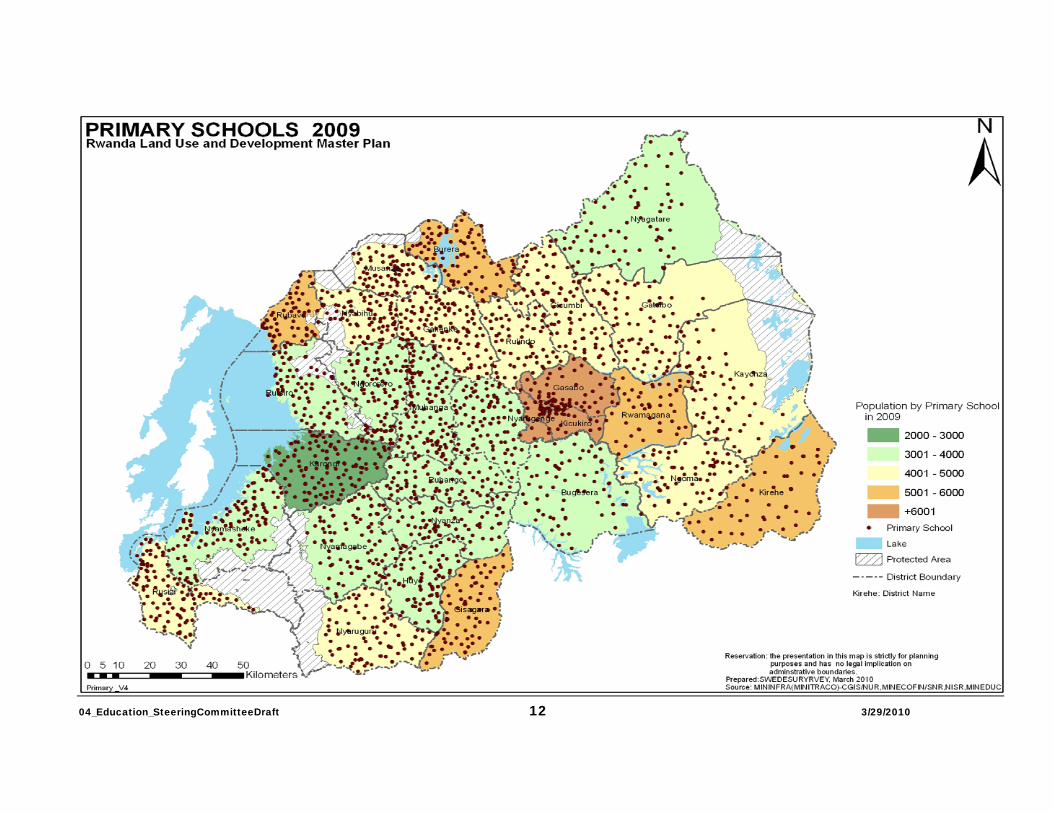
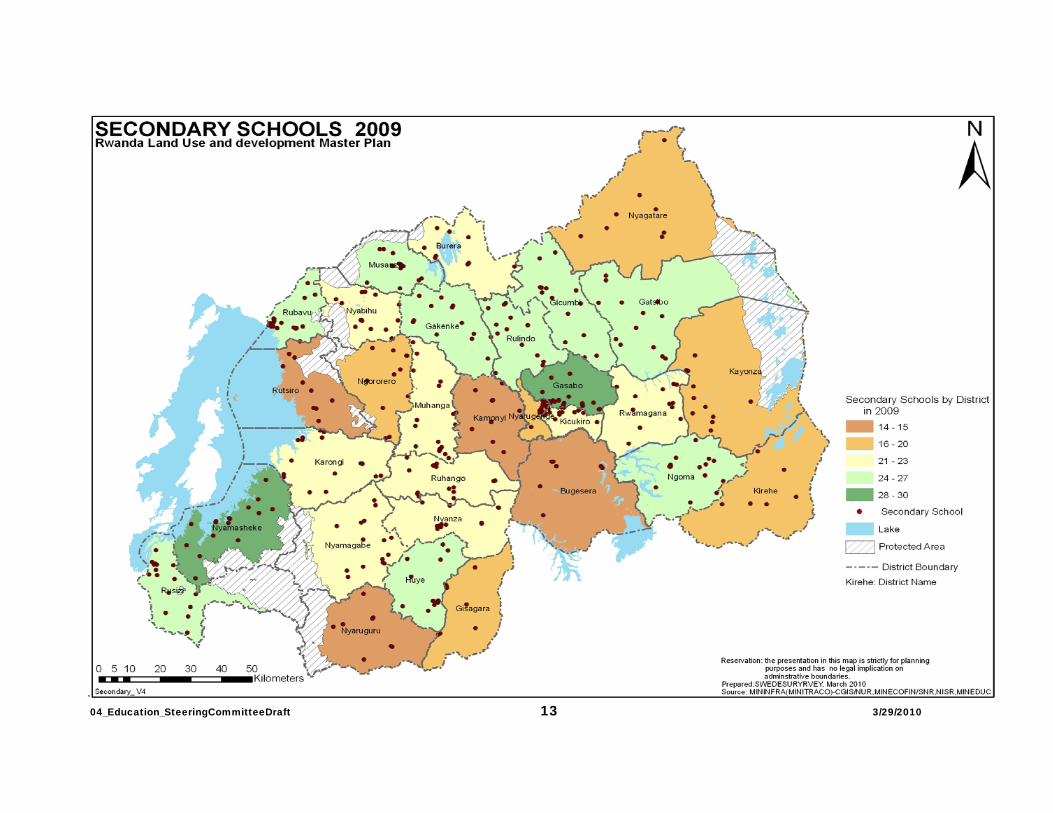
Figure 5: Primary Schools per District and
Figure 6: Secondary Schools per District (See next 2 pages)
04_Education_SteeringCommitteeDraft 12 3/29/2010
04_Education_SteeringCommitteeDraft 13 3/29/2010
04_Education_SteeringCommitteeDraft 14 3/29/2010
R W A N D A N A T I O N A L L A N D U S E D E V E L O P M E N T M A S T E R P L A N - E D U C A T I O N
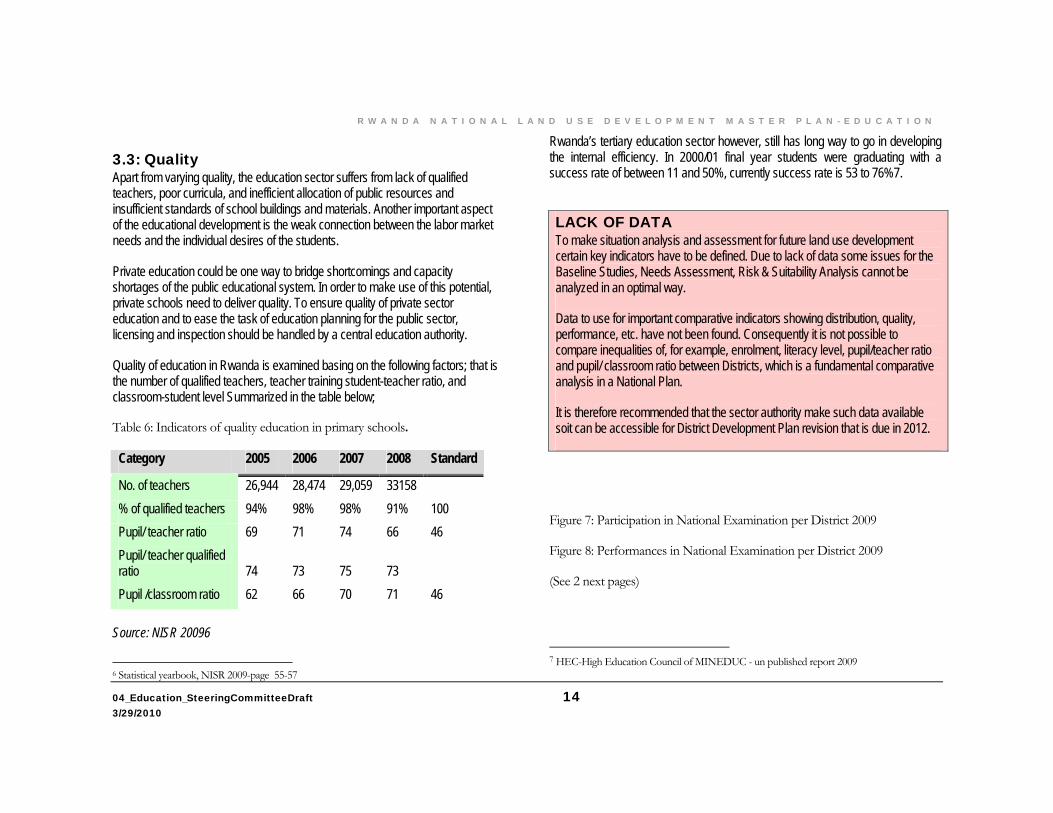
3.3: Quality Apart from varying quality, the education sector suffers from lack of qualified teachers, poor curricula, and inefficient allocation of public resources and insufficient standards of school buildings and materials. Another important aspect of the educational development is the weak connection between the labor market needs and the individual desires of the students.
Private education could be one way to bridge shortcomings and capacity shortages of the public educational system. In order to make use of this potential, private schools need to deliver quality. To ensure quality of private sector education and to ease the task of education planning for the public sector, licensing and inspection should be handled by a central education authority.
Quality of education in Rwanda is examined basing on the following factors; that is the number of qualified teachers, teacher training student-teacher ratio, and classroom-student level Summarized in the table below;
Table 6: Indicators of quality education in primary schools.
Category 2005 2006 2007 2008 Standard
No. of teachers 26,944 28,474 29,059 33158 % of qualified teachers 94% 98% 98% 91% 100 Pupil/ teacher ratio 69 71 74 66 46 Pupil/ teacher qualified ratio 74 73 75 73 Pupil /classroom ratio 62 66 70 71 46
Source: NISR 20096
6 Statistical yearbook, NISR 2009-page 55-57
Rwanda’s tertiary education sector however, still has long way to go in developing the internal efficiency. In 2000/01 final year students were graduating with a success rate of between 11 and 50%, currently success rate is 53 to 76%7.
Figure 7: Participation in National Examination per District 2009
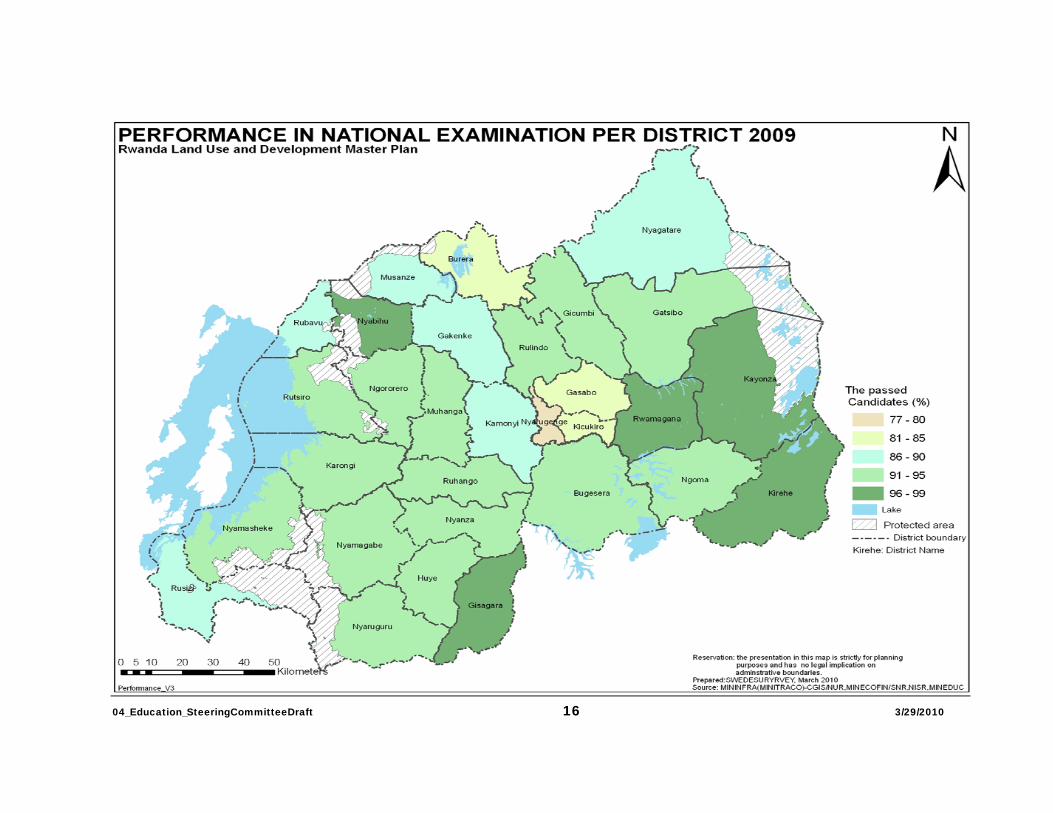
Figure 8: Performances in National Examination per District 2009
(See 2 next pages)
7 HEC-High Education Council of MINEDUC - un published report 2009
LACK OF DATA To make situation analysis and assessment for future land use development certain key indicators have to be defined. Due to lack of data some issues for the Baseline Studies, Needs Assessment, Risk & Suitability Analysis cannot be analyzed in an optimal way.
Data to use for important comparative indicators showing distribution, quality, performance, etc. have not been found. Consequently it is not possible to compare inequalities of, for example, enrolment, literacy level, pupil/teacher ratio and pupil/ classroom ratio between Districts, which is a fundamental comparative analysis in a National Plan.
It is therefore recommended that the sector authority make such data available soit can be accessible for District Development Plan revision that is due in 2012.

04_Education_SteeringCommitteeDraft 15 3/29/2010
04_Education_SteeringCommitteeDraft 16 3/29/2010

04_Education_SteeringCommitteeDraft 17 3/29/2010
R W A N D A N A T I O N A L L A N D U S E D E V E L O P M E N T M A S T E R P L A N - E D U C A T I O N
3.4. Enrolment By 2008 Net enrolment rate in primary education was close to 94.2% percent NISR 20098. As a result, the literacy level is decreasing when compared with other counties in the region. The literacy rate for population above 15 years of age is 65.3% percent at national level, constituting 71.5% male and 60.1% female.
Table 7: Reported Literacy Levels for Individuals Aged 15 and Above (%).
Location Male Female All
Kigali 89.5 83.6 86.5
Other urban 75.6 67.0 70.9
Rural 69.1 57.1 62.5
National 71.5 60.1 65.3
Source: NISR, 2006:16. There has been a rapid growth since the 1999 in students enrolling in higher education; a development which has resulted into a quick increase in the number of institutions of higher education. During the 1980’s there were only 2 University in Rwanda which were (National University of Rwanda and Université Adventiste d'Afrique Centrale). Today the country has 22 universities of which eight are located in Kigali city. MINEDUC-HEC9.
Box 1: Developing Skills for a Knowledge-based Society 8 Statistical year book of NISR 2009, page 56 9 MINEDUC-HEC( Higher Education council), un published report
In order for Rwanda to achieve the structural economic change implied by the targets of Vision 2020, the country must develop a wide range of skills among the labour force in a relatively short space of time. In primary education, the number of pupils per teacher and per class room is scheduled to fall from 70 to 54 between 2006 and 2012. This should improve the learning environment in primary schools which in turn will allow the completion rate to double from 52% in 2006 to 100% in 2012. Improving educational outcomes at the primary level is a high priority, so it is hoped that the proportion of pupils sitting the final year (year 6) exam who obtain marks above 50% will rise from 8.9% in 2006 to 20% in 2012.
At secondary level, the aim is to raise net enrolment from 10% to 40% between 2006 and 2012, while also ensuring that a higher proportion of those who enroll finish this cycle of their education. The completion rate for the tronc commun is due to double from 20% to 40%, while that for upper secondary is planned to rise from 11% to 16%.
The gross enrolment rate in higher education is due to increase from 3.2% to 4.5%, while quality will be enhanced by ensuring that the proportion of teachers in higher education with appropriate qualifications rises from less than 20% to 30%. These improvements in the coverage and quality of primary and secondary schooling should increase the employability of young people entering the labor market without any further educational qualifications.
However, expanding Technical and Vocational Education Training (TVET) is of strategic importance if Rwanda is to become the ICT hub of the region. The absorption rate of TVET graduates in industry should have risen from around 25% in 2006 to 75% by 201210.
10 GoR Economic Development and Poverty Reduction Strategy, 2008-2012 draft (090707) page 33-34

R W A N D A N A T I O N A L L A N D U S E D E V E L O P M E N T M A S T E R P L A N - E D U C A T I O N
04_Education_SteeringCommitteeDraft 3/29/2010 18
3.4.1. Enrollment at all levels of education 3 . 4 . 1 . 1 E N R O L M E N T A T P R I M A R Y L E V E L
Introduction of Universal Primary Education, primary schools Net enrolment rate has significantly increased over the years. That is from 74.5% in 2001/2002 to 94.2% in 2008. This shows that the government of Rwanda is on track to the realization of the millennium development Goal MDG of universal primary education by 2015.
3 . 4 . 1 . 2 : E N R O L M E N T A T S E C O N D A R Y L E V E L
Secondary education: 30 % enrolment by both girls and boys 2012. To improve enrolment at secondary school level, the government education plan has set gross enrolment targets of 30 % for boys and girls to be achieved by 2012, rising to 60 % by 2020, and also ensuring that a higher proportion of those who enroll finish this cycle of their education. The completion rate for the tronc commun is intended to double from 20 % to 40 %, and upper secondary planned to rise from 11 % to 16% (MINECOFIN, 2007).
3 . 4 . 1 . 3 : E N R O L M E N T I N T E R T I A R Y E D U C A T I O N L E V E L
Tertiary education has no decentralized structure of organization. National Higher Education Council (HEC) deals with tertiary education on national level.
In 2009, a total of 55,323 students enrolled in higher learning institutions. This shows a significant growth in relation to 2008 with a percentage increment of 16.4%. Currently students’ population in public institutions of higher learning is standing at 26, 304 (48%)11. the female constitutes 33% while male constitutes 67%non the other hand, the number of students in private institutions is 28,909 (52%)12 of which 47% is male and 53% is female. an increase by 9.3% student’s enrolment has been registered in private sector.
There are 24 tertiary education institutes (11 Public / 13 Private). The first university in Rwanda (National University of Rwanda - NUR) was opened by the 11 percentage of gross students enrolment in all public and private HLIs 12 percentage of gross students enrolment in all private and public HLI
government in 1963. 49 students enrolled initially at NUR, but by the 1999/2000 this had risen to 4550. Today this stands at 26,796, 39% of students are female.
Rwanda’s higher education sector has some long way to go in developing the internal efficiency. In 2000/01 final year students were graduating with a success rate of between 11 and 50%. Across all years this success rate is 53 to 76%.
Table 8: Tertiary Institutions in Rwanda.
Institution Acronym Province Public university/tertiary institutions
National University of Rwanda NUR South Kigali Institute of Science and Technology KIST Kigali city Kigali Health Institute KHI Kigali city Institut Supérieur d'Agriculture et ISAE North d'Elevage School of Finance and Banking SFB Kigali city Kigali Institute of Education KEI Kigali city Umutara Polytechnic UP East Private university/tertiary institutions Université Libre de Kigali ULK Kigali city Université Libre de Kigali-Gisenyi Branch ULK West Université Laïque Adventiste de Kigali UNILAK Kigali city Université Adventiste d'Afrique Centrale UAAC Kigali city Université d'Agriculture, de Technology et d'Education de Kibungo UNATEK East Institut d'Enseignement Supérieur de Ruhengeri INES North

R W A N D A N A T I O N A L L A N D U S E D E V E L O P M E N T M A S T E R P L A N - E D U C A T I O N
04_Education_SteeringCommitteeDraft 3/29/2010 19
Université Catholique de Kabgayi UCK South Kigali Institute of Management KIM Kigali city Institut Polytechnique de Byumba IPB North Grand Seminaire de Nyakibanda GSN South Faculté de Théologie Protestante de Butare FTPB South Institut des Sciences Pédagogiques de Gitwe ISPG South Private Colleges Kicukiro College of Technology KCT Kigali city Kavumu College of Technology KCT South Public collages Tumba College of Technology TCT North Nyagatare Institute of nursing and midwifery NINMW East Rwamagana Institute of nursing and midwifery RINMW East Rukara College of Technology RCT East
Source: NISR 200913
Figure 9: Tertiary Institutions in Rwanda (next page)
13 Statistical year book, NISR 2009, page 62

04_Education_SteeringCommitteeDraft 20 3/29/2010

04_Education_SteeringCommitteeDraft 21 3/29/2010
R W A N D A N A T I O N A L L A N D U S E D E V E L O P M E N T M A S T E R P L A N - E D U C A T I O N
Most Tertiary institutions are located in Kigali city as observed from the map above. un equal distribution of tertiary institutions partly explains why rural urban migration is rampant especially in Kigali city hence hyper increase of Kigali city population. there is therefore a strong need for equal distribute all needed services throughout the country in a bid to avoid imbalance development and straining of natural resources available in some parts of the country.
Tertiary education graduates have unemployment problems especially in the fields of humanities, arts, law, economy and political science, geology, biology, agriculture and pharmacology. The salaries are too low to cover the costs of living. Furthermore, the skills of some graduates are lower than those specified by the requirements on the labor market. This sometimes depends on the type of tertiary institutions they attended and their education background.
After completion of basic education, a larger number of young people continue to intermediate level education. The Ministry of Education established a policy for intermediate school for students to obtain basic education diploma in vocational training and in specialized secondary schools. However vocational training enrolment rate is still lower given the fact that such training centers are still few in Rwanda, coupled with the fact that most Rwandans are not aware of such vocational schools. Parents therefore end up not enrolling their children in vocational schools. Awareness rising in this regard is needed for families to encourage their children to join vocational trainings. Especially the medical and technical and engineering fields which are high demand. Private sector should also exploit the still virgin investment area that has a big potential in Rwanda.
3.5. Demand for Education The demographic structure of Rwanda is undergoing a rapid change due to decreasing birth rates. This should be taken into account when planning for education sector at all levels. Two population scenarios are presented, a high growth scenario and a low growth scenario. In Table 10, the two scenarios are presented in terms of the two age groups. That is; 6-15, and 16-19.The figures below imply that only in case
of high population growth an increase in educational resources will be needed within the scope of the planning period 2020. However, this is true only for the age group 6-15, i.e. compulsory school see table below.
Table 9: Population Scenarios, Age Groups 6-15 and 16-19 years in Rwanda.
2009 2009 2010 2010 2020 2020
Category of Education
Age
group Low High Low High Low High
Universal
Education/
Mandatory 6 - 15 2,158,103 2,158,103 2,208,447 2,208,447 2,937,923 3,186,068
Voluntary
Education 16 -19 875,840 875,840 878,498 878,498 1,040,146 1,040,146
Source: Rwanda National Population Projection 2007-202214
3.5.1. Population and Fertility rate projections The developmental vision of Rwanda, known as 2020 Vision, states a set of fertility targets to be achieved over the years till 2020. The targeted Total Fertility Rate (TFR) is 5.5, 4.1, and 3.9 for the years 2010, 2015 and 2020 respectively. Noticeably, the 2010 target (5.5) has already been achieved in 2007. Thus, only the remaining two fertility targets of 2015 and 2020 are taken into consideration in estimating future fertility. Linear interpolation is used to estimate annual TFR 14 Rwanda national population projection 2007-2022, pages 36,34,56
R W A N D A N A T I O N A L L A N D U S E D E V E L O P M E N T M A S T E R P L A N - E D U C A T I O N
04_Education_SteeringCommitteeDraft 3/29/2010 22
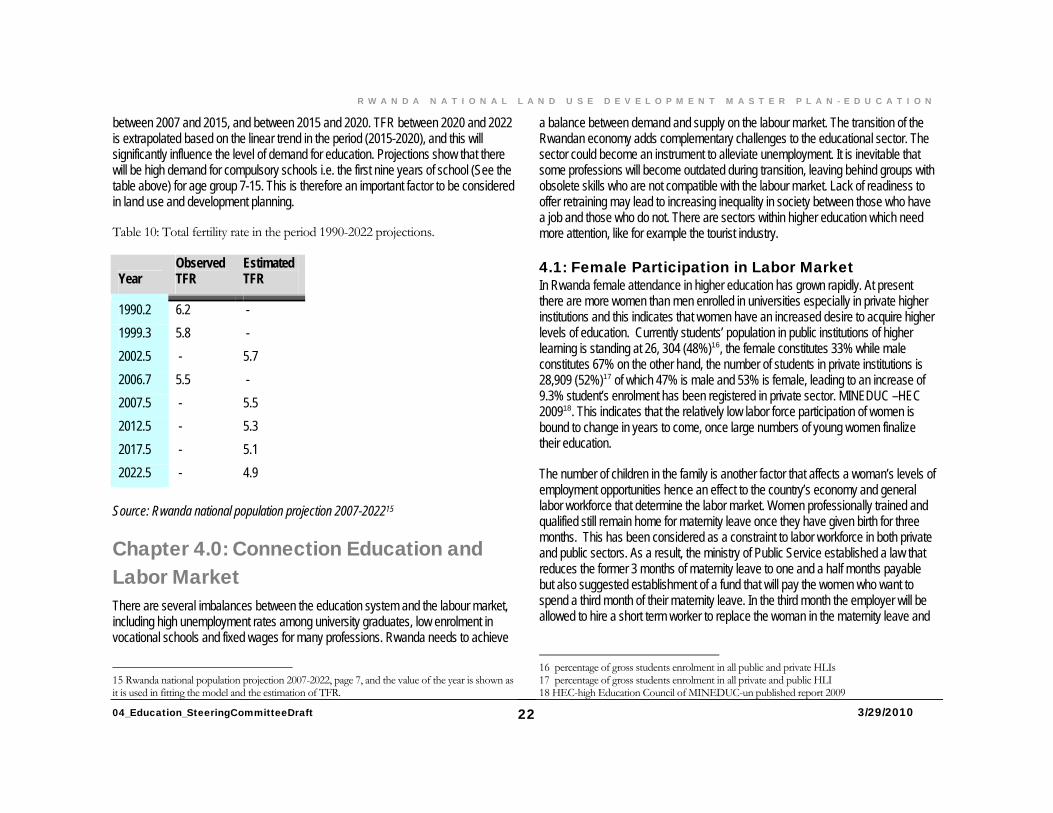
between 2007 and 2015, and between 2015 and 2020. TFR between 2020 and 2022 is extrapolated based on the linear trend in the period (2015-2020), and this will significantly influence the level of demand for education. Projections show that there will be high demand for compulsory schools i.e. the first nine years of school (See the table above) for age group 7-15. This is therefore an important factor to be considered in land use and development planning.
Table 10: Total fertility rate in the period 1990-2022 projections.
Year Observed TFR
Estimated TFR
1990.2 6.2 - 1999.3 5.8 - 2002.5 - 5.7 2006.7 5.5 - 2007.5 - 5.5 2012.5 - 5.3 2017.5 - 5.1 2022.5 - 4.9
Source: Rwanda national population projection 2007-202215
Chapter 4.0: Connection Education and Labor Market There are several imbalances between the education system and the labour market, including high unemployment rates among university graduates, low enrolment in vocational schools and fixed wages for many professions. Rwanda needs to achieve
15 Rwanda national population projection 2007-2022, page 7, and the value of the year is shown as it is used in fitting the model and the estimation of TFR.
a balance between demand and supply on the labour market. The transition of the Rwandan economy adds complementary challenges to the educational sector. The sector could become an instrument to alleviate unemployment. It is inevitable that some professions will become outdated during transition, leaving behind groups with obsolete skills who are not compatible with the labour market. Lack of readiness to offer retraining may lead to increasing inequality in society between those who have a job and those who do not. There are sectors within higher education which need more attention, like for example the tourist industry.
4.1: Female Participation in Labor Market In Rwanda female attendance in higher education has grown rapidly. At present there are more women than men enrolled in universities especially in private higher institutions and this indicates that women have an increased desire to acquire higher levels of education. Currently students’ population in public institutions of higher learning is standing at 26, 304 (48%)16, the female constitutes 33% while male constitutes 67% on the other hand, the number of students in private institutions is 28,909 (52%)17 of which 47% is male and 53% is female, leading to an increase of 9.3% student’s enrolment has been registered in private sector. MINEDUC –HEC 200918. This indicates that the relatively low labor force participation of women is bound to change in years to come, once large numbers of young women finalize their education.
The number of children in the family is another factor that affects a woman’s levels of employment opportunities hence an effect to the country’s economy and general labor workforce that determine the labor market. Women professionally trained and qualified still remain home for maternity leave once they have given birth for three months. This has been considered as a constraint to labor workforce in both private and public sectors. As a result, the ministry of Public Service established a law that reduces the former 3 months of maternity leave to one and a half months payable but also suggested establishment of a fund that will pay the women who want to spend a third month of their maternity leave. In the third month the employer will be allowed to hire a short term worker to replace the woman in the maternity leave and
16 percentage of gross students enrolment in all public and private HLIs 17 percentage of gross students enrolment in all private and public HLI 18 HEC-high Education Council of MINEDUC-un published report 2009
R W A N D A N A T I O N A L L A N D U S E D E V E L O P M E N T M A S T E R P L A N - E D U C A T I O N
04_Education_SteeringCommitteeDraft 3/29/2010 23
pay the woman in maternity leave only 20% of her salary. the fund would also pay the woman in maternity leave the remaining 80% of her salary.
Despite all that, it is reasonable to expect that female labor force participation will increase by 2020 due to other factors like family planning and general reduction total fertility rate projected (see table 11 above), a change which will profit and enrich the labor market.
4.2: The Role of IT in Labor Market Development In order to support economic reforms, the education sector needs to adjust and meet new requirements and cannot continue to teach primarily in accordance with social expectations, and not only the skills needed for public sector employment. Education systems should also be able to generate a skilled labour force compatible with future requirements for flexible, trainable workers who have problem-solving abilities and higher cognitive skills.
There is a need to develop vocational training in order to take labour market needs into consideration. Shortcomings of current vocational training should be identified and programmes adjusted accordingly. Priority should be given to two sectors in particular: that is; construction and tourism.
Education supply needs to address technological changes and should support the goal of implementing an Information Society. This will require introduction of information technology (IT) as a subject in schools at all levels. Students need to be provided with various skills that enable them to understand and use IT means such as computers to enhance their studies in searching, reporting, and documenting. To realize the above, 1 computer 1 student program was started as part of Rwanda’s vision of transforming Rwanda into a knowledge-based economy by the year 2020. The government of Rwanda has provided 6,212 XO laptops to nine public primary schools and 140 primary teachers. About 1,805 XO laptops were bought by private schools following the national campaign and vision. A total of 66,983 XO computers recently arrived in the country and are waiting for distribution.
One laptop per child program however faces a big challenge of lack of electricity supply and connection especially in rural areas where infrastructure is still very poor.
This program at the moment seems to be active in urban and town areas that are connected to electricity. MINEDUC 201019.
Some level of progress has been registered according to 1 laptop per child department. only 13 pre-primary schools are connected to Internet (MINEDUC 2008). To make IT education efficient, teacher training need to be provided to teachers who will teach the topics in schools and provide internet services to all schools. Higher educational institutes should have access to IT facilities and offer relevant topics to meet the labor market requirements.
It is hoped that the number of telecentres will be increased substantially and the cost of connecting to a telecommunications network will halve by 2011. It is hoped that the number of additional jobs created each year in the ICT sector will rise from 7,000 in 2008 to 20,000 in 2012(Skills audit 2009).
4.3: Strategies for Promotion of Labor Workforce and Market Also, retraining should be offered with the aim to help those unemployed become better prepared for the labor market. Responsibility for this kind of activities can be given to those institutions that currently offer rehabilitation and training courses. One of the kind – PSCS ( Public Sector Capacity Building Service) has been established to work hand in hand with WDA (workforce Development Authority) to foster capacity building in vocational and other entities for creation of more employment opportunities and ensure an increase in labor market participation. The future capacity of vocational training should therefore consider both the number of young people and the levels of unemployment. Furthermore, encouragement is needed for closer links between industries on the one hand and universities and higher education institutes on the other. This should be developed in conjunction with all other government institutions concerned. Providing meeting places between university researchers and business people will be crucial for creating an internationally competitive economy. Technology parks, created at universities e.g. Rwanda gateway at KIST and RITA (Rwanda Technology Authority), at national level are good examples of such meeting places.
19 MINEDUC 2010, un published report by one laptop per child department
R W A N D A N A T I O N A L L A N D U S E D E V E L O P M E N T M A S T E R P L A N - E D U C A T I O N
04_Education_SteeringCommitteeDraft 3/29/2010 24
Chapter 5.0: Challenges and Strategies Measures have been taken to solve a number of key challenges of the educational system. For example, new policies are being created concerning the curriculum at all levels of the educational system, re-training of teachers is in progress, vocational training for both dropout students and unemployed is being installed and new rules are being processed for the current Point Average system for entry to university. And all these efforts should aim at improving the quality of life of people in Rwanda and guarantee quality education preparing young Rwandans to a better integration into the world.
When striving for a long term sustainability regarding the various aspects of the educational sector, it is vital to keep upgrading the educational system, its governance and facilities, and to achieve a better match between the graduates and the labour market. In the future, the economic development will require both high and low skilled workers. For example, the ongoing privatization will require new competences in order to develop strong clusters in fields like tourism, commerce, construction and food industry. As discussed in the above chapters, a skilled human resource is a major and most available resource for Rwanda, yet low skilled personnel is considered to be one of the major challenges Rwanda is facing today.
Another problem is low motivation among public sector education teachers, depending on salary restrictions. Limited motivation and absence of a strong incentive to instill satisfaction in teachers makes them quit their profession or deliver poor quality service.
5.1: Teacher Training and Curriculum In order to improve the quality of teaching it will be important to re-train teachers and offer them complementary education. For this purpose it will be imperative to make an assessment of current competence gaps within the group of school personnel. There is currently no need to increase the number of teachers, but when new teachers enter the labour market, it is vital that they have a higher education. Responsibility for curriculum development should be given to a central authority. In this way curricula
can be developed and co-ordinate for different levels of education. It will also be important to find ways to assess labour market needs, both concerning different subjects and for defining standards. Special attention should be paid to involving teachers in curriculum development. Also other groups, including parents’ representatives, should be consulted for assessing current deficiencies, and new curricula should address current shortcomings.
Centralization of educational administration is a way to guarantee that the same level is valid for the whole country. Curricula should, therefore, be developed on the central level. The professional knowledge of teachers should be utilized in the work with improving curricula. Involving teachers in this work is a way to ensure that current challenges are analyzed from a practical perspective.
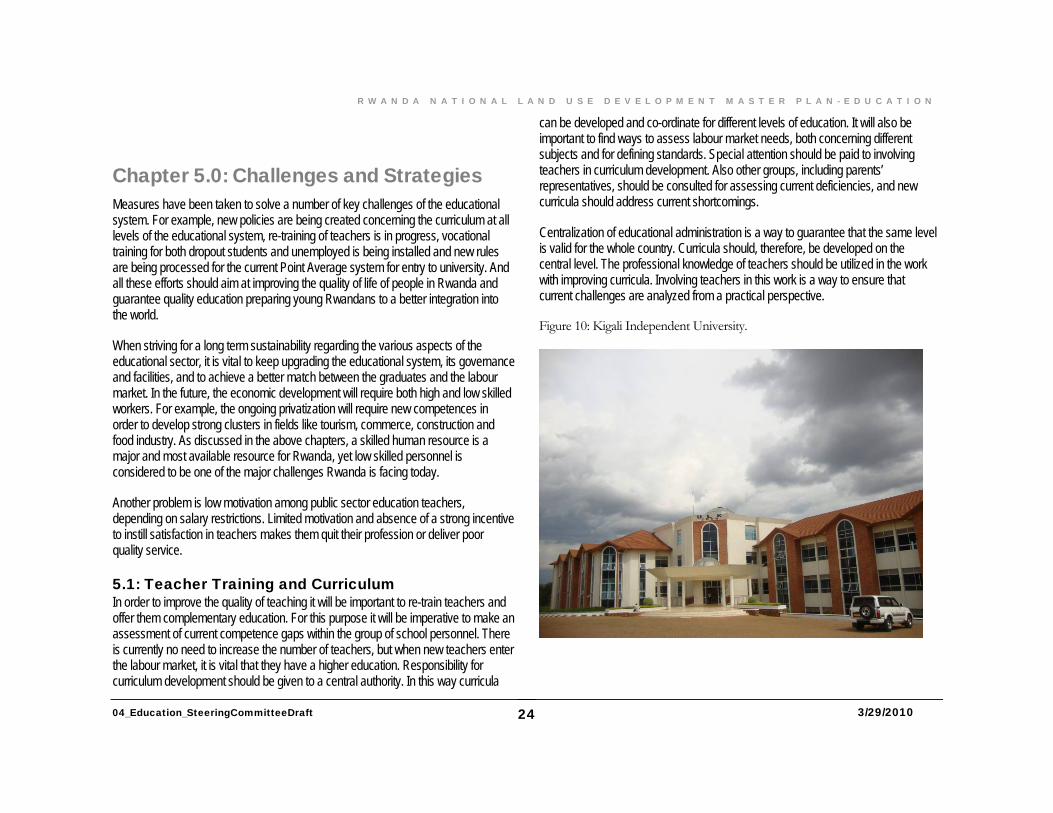
Figure 10: Kigali Independent University.

R W A N D A N A T I O N A L L A N D U S E D E V E L O P M E N T M A S T E R P L A N - E D U C A T I O N
04_Education_SteeringCommitteeDraft 3/29/2010 25
5.2: Governance The central body for higher education, the Higher Education Council (HEC) develops curricula for higher education that match the needs of the labor market.
Internationalization is another way to improve quality of education and research and HEC should consider developing curricula that prepare Rwandans according to the global standards. Quality improvements are needed, as well as international recognition of all Rwandan university diplomas; therefore, Rwanda should enter into active co-operation with universities abroad. For curriculum development purposes, co-operation is essential with other public service sectors such as health, traffic, environmental and seismologic institutions. The aim is to ensure a socio-economic development that is environmentally sustainable.
Co-ordination of overall planning, managing and synchronization of different levels of education and planning for future requirements is needed at the central administrative level. Lower level authorities have neither sufficient overview, nor the power for implementation. There is a need to continuously develop co-ordination between administrative levels, e.g. reviewing planning capabilities, developing the institutional and technical basis; and most importantly; improving budgetary allocation. Functional decentralization structures require a continuously planned utilization of human and financial resources, and policy stability at all levels. The decentralized structure is not necessarily in conflict with creating a central administration. In order to sustain different levels of administration, it is important to divide responsibilities in a distinct fashion.
Chapter 6.0: District Planning Implications Education order No 48/01 of 10/08/2009 of quality standards for nursery, primary and secondary schools in Rwanda stipulates the role of the local government regarding implementation of the order of quality standards in education. The district
6.1: Education Standards It should be clarified that improved standards in the educational sector leads to increases in individual and family incomes, and supports high economic growth rates, thereby providing job opportunities through higher productivity. There is a long term
synergy between economic and social objectives. Improving standards is one way to guarantee that compulsory school and university graduates have achieved a certain level of skills and knowledge. When designing standards, several aspects need to be considered. Standards that match the needs of the labor market will make the skills of compulsory school and university graduates more valuable to employers. If employers have an influence on salaries, this will show in the level of payment.
In other words, social, economic and other policies in both public and private sectors are so closely interrelated that proposed decisions in one sector may have an impact on the objectives of other sectors. In recognition of this, specifically legal and administrative rules, procedures and methods should assess the impact of policies, for example on the environment, employment, economic growth or competition, on cultural and social factors, or on gender factors (skills Audit 2009).
6.2: Planning Standards Number of classrooms/school: A primary school should have appropriate, sufficient and secure buildings; with at least six (6) classrooms. And at least three (3) classrooms for lower secondary.
Pupil/classroom ratio: A primary or secondary school class should have a capacity to accommodate 46 pupils with dimensions of 9m x 7m each to allow pupil. Pupils/classroom in primary schools is targeted to be 52 in 2012 as compared to 70 in 2007.
Pupil/teacher ratio: According to the quality standards by MINEDUC 2009, pupil/teacher ratio should be 1:46. The pupil to classroom ratio is currently 73: 1 in primary and 45: 1 in secondary (due to lower enrolment rate in secondary), therefore, enrolment in secondary needs to be improved. Pupil / teacher ratio is targeted by EDPRS to be 47 in 2012.
Computer/student ratio: A computer room with the capacity of accommodating 46 students is recommended as the quality standard of MINEDUC 2009
Maximum walking distance to Primary/secondary school: Five (5) kilometers are set by Ministry of Education to be the standard walking distance between

R W A N D A N A T I O N A L L A N D U S E D E V E L O P M E N T M A S T E R P L A N - E D U C A T I O N
04_Education_SteeringCommitteeDraft 3/29/2010 26
primary/Secondary schools and home. However, for planning purposes, two (2) kilometers are expected and proposed as ideal walking distance for a primary school pupil. For secondary school students three (3) kilometers are proposed.
Figure 11: What is the far distance between a primary school and the home of a 7year pupil? The existing standard of 5km might take two hours for such short legs.
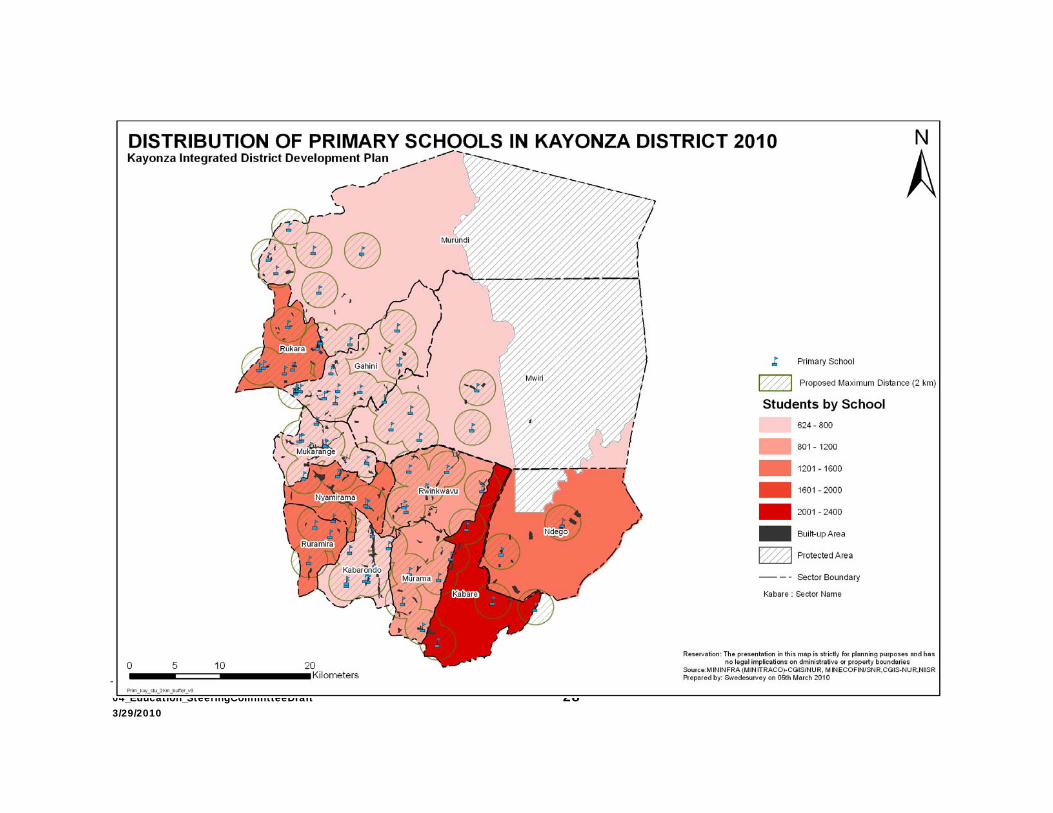
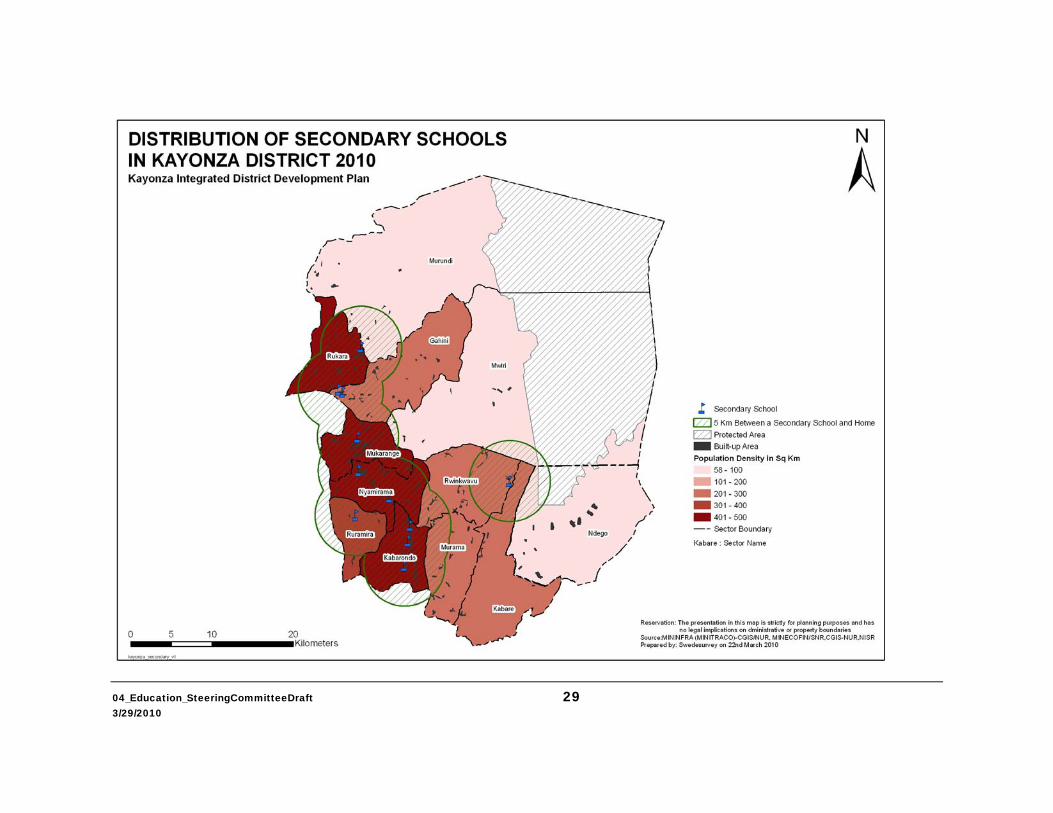
Example Two KayonZa District Plan Maps below with catchment radius are examples of land use planning. One showing 2 Km proposed distance for existing and proposed primary schools, and another one showing 3 Km proposed distance between existing and proposed secondary schools.
R W A N D A N A T I O N A L L A N D U S E D E V E L O P M E N T M A S T E R P L A N - E D U C A T I O N
04_Education_SteeringCommitteeDraft 3/29/2010 27
Figure 12: Distribution of Primary Schools in Kayonza District 2010
Figure 13: Distribution of Secondary School in Kayonza District 2010
04_Education_SteeringCommitteeDraft 28 3/29/2010
04_Education_SteeringCommitteeDraft 29 3/29/2010
04_Education_SteeringCommitteeDraft 30 3/29/2010
Chapter 7.0: Guidelines
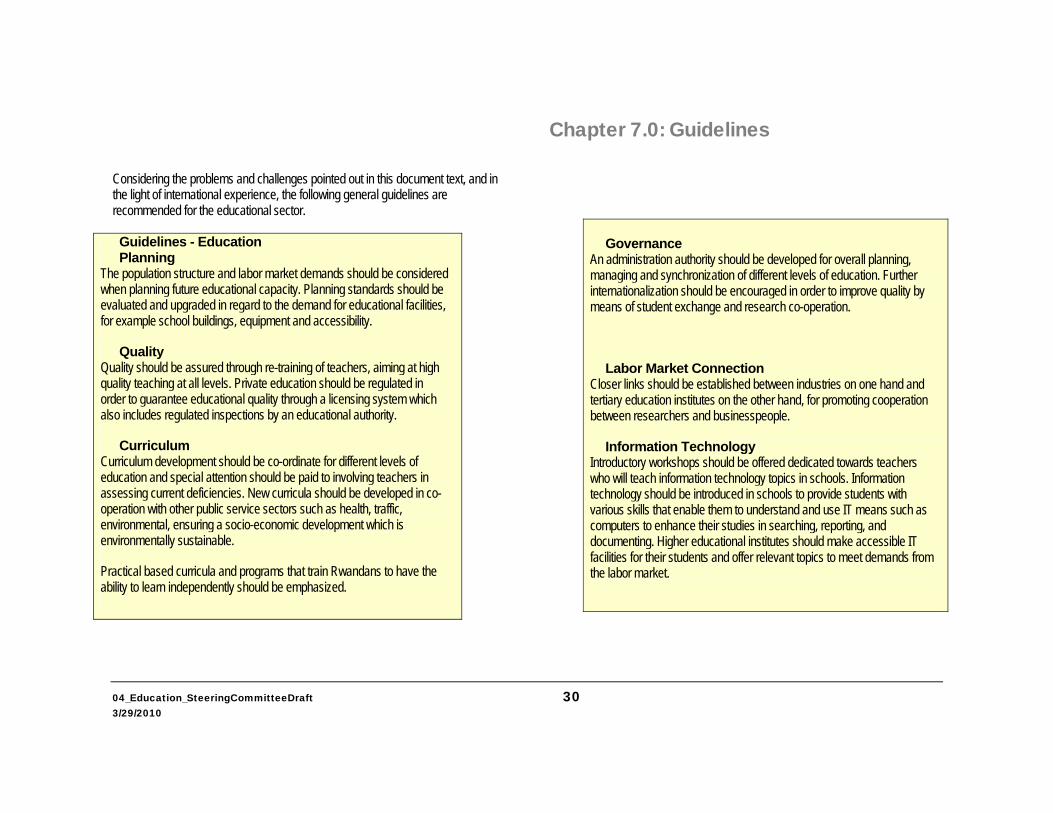
Considering the problems and challenges pointed out in this document text, and in the light of international experience, the following general guidelines are recommended for the educational sector.
Guidelines - Education Planning
The population structure and labor market demands should be considered when planning future educational capacity. Planning standards should be evaluated and upgraded in regard to the demand for educational facilities, for example school buildings, equipment and accessibility.
Quality Quality should be assured through re-training of teachers, aiming at high quality teaching at all levels. Private education should be regulated in order to guarantee educational quality through a licensing system which also includes regulated inspections by an educational authority.
Curriculum Curriculum development should be co-ordinate for different levels of education and special attention should be paid to involving teachers in assessing current deficiencies. New curricula should be developed in co-operation with other public service sectors such as health, traffic, environmental, ensuring a socio-economic development which is environmentally sustainable.
Practical based curricula and programs that train Rwandans to have the ability to learn independently should be emphasized.
Governance
An administration authority should be developed for overall planning, managing and synchronization of different levels of education. Further internationalization should be encouraged in order to improve quality by means of student exchange and research co-operation.
Labor Market Connection Closer links should be established between industries on one hand and tertiary education institutes on the other hand, for promoting cooperation between researchers and businesspeople.
Information Technology Introductory workshops should be offered dedicated towards teachers who will teach information technology topics in schools. Information technology should be introduced in schools to provide students with various skills that enable them to understand and use IT means such as computers to enhance their studies in searching, reporting, and documenting. Higher educational institutes should make accessible IT facilities for their students and offer relevant topics to meet demands from the labor market.
R W A N D A N A T I O N A L L A N D U S E D E V E L O P M E N T M A S T E R P L A N - E D U C A T I O N
04_Education_SteeringCommitteeDraft 3/29/2010 31
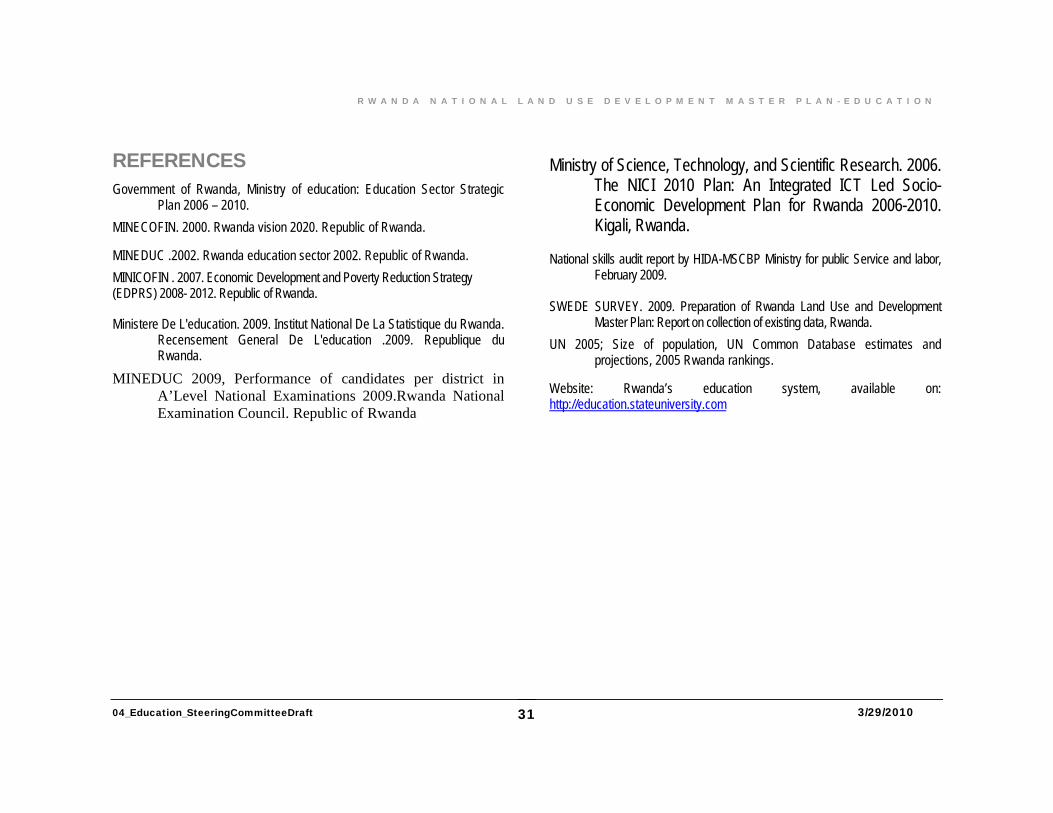
REFERENCES Government of Rwanda, Ministry of education: Education Sector Strategic
Plan 2006 – 2010. MINECOFIN. 2000. Rwanda vision 2020. Republic of Rwanda.
MINEDUC .2002. Rwanda education sector 2002. Republic of Rwanda. MINICOFIN . 2007. Economic Development and Poverty Reduction Strategy (EDPRS) 2008- 2012. Republic of Rwanda.
Ministere De L'education. 2009. Institut National De La Statistique du Rwanda. Recensement General De L'education .2009. Republique du Rwanda.
MINEDUC 2009, Performance of candidates per district in A’Level National Examinations 2009.Rwanda National Examination Council. Republic of Rwanda
Ministry of Science, Technology, and Scientific Research. 2006.
The NICI 2010 Plan: An Integrated ICT Led Socio-Economic Development Plan for Rwanda 2006-2010. Kigali, Rwanda.
National skills audit report by HIDA-MSCBP Ministry for public Service and labor,
February 2009. SWEDE SURVEY. 2009. Preparation of Rwanda Land Use and Development
Master Plan: Report on collection of existing data, Rwanda. UN 2005; Size of population, UN Common Database estimates and
projections, 2005 Rwanda rankings.
Website: Rwanda’s education system, available on: http://education.stateuniversity.com
R W A N D A N A T I O N A L L A N D U S E D E V E L O P M E N T M A S T E R P L A N - E D U C A T I O N
04_Education_SteeringCommitteeDraft 3/29/2010 32
List of Tables TABLE 1: SCHOOL GOING AGE AND LEVELS OF EDUCATION IN RWANDA........................5 TABLE 2: GRADING SYSTEM IN RWANDA..........................................................................6 TABLE 3: A LEVEL/UPPER SECONDARY STUDENTS' PERFORMANCE...............................6 TABLE 5: POPULATION FIGURES .......................................................................................8 TABLE 6: PRIMARY SCHOOLS AND NUMBER OF NEEDED CLASSROOMS PER DISTRICT ..10 TABLE 7: INDICATORS OF QUALITY EDUCATION IN PRIMARY SCHOOLS. ..........................14 TABLE 8: REPORTED LITERACY LEVELS FOR INDIVIDUALS AGED 15 AND ABOVE .........17 TABLE 9: TERTIARY INSTITUTIONS IN RWANDA...............................................................18 TABLE 10: POPULATION SCENARIOS, AGE GROUPS.....................................................21 TABLE 11: TOTAL FERTILITY RATE IN THE PERIOD 1........................................................22
List of Figures FIGURE 1: EXCELLA PRIVATE SCHOOL BUILDING AT KIMIRONKO IN KIGALI......................3 FIGURE 2: A NURSERY SCHOOL.......................................................................................4 FIGURE 3: BEING ABLE TO READ, WRITE AND CALCULATE . ..............................................5 FIGURE 4: POPULATION DISTRIBUTION -2008 ..................................................................7 FIGURE 5: PRIMARY SCHOOLS PER DISTRICT AND........................................................11 FIGURE 6: SECONDARY SCHOOLS PER DISTRICT .........................................................11 FIGURE 7: PARTICIPATION IN NATIONAL EXAMINATION PER DISTRICT 2009..................14 FIGURE 8: PERFORMANCES IN NATIONAL EXAMINATION PER DISTRICT 2009...............14 FIGURE 9: TERTIARY INSTITUTIONS IN RWANDA ............................................................19 FIGURE 10: KIGALI INDEPENDENT UNIVERSITY. .............................................................24 FIGURE 11: WHAT IS THE FAR DISTANCE BETWEEN A PRIMARY SCHOOL ......................26 FIGURE 12: DISTRIBUTION OF PRIMARY SCHOOLS IN KAYONZA DISTRICT 2010...........27 FIGURE 13: DISTRIBUTION OF SECONDARY SCHOOL IN KAYONZA DISTRICT 2010 .......27
List of Boxes BOX 1: DEVELOPING SKILLS FOR A KNOWLEDGE-BASED SOCIETY………………….……………17
Related Documents