Gustav R. Grob, Fellow of the Energy Institute F.EI Executive Secretary, International Sustainable Energy Organization ISEO Chairman of ISO/TC203/WG3 Technical Energy Systems Analyses President of the International Clean Energy Consortium ICEC

Welcome message from author
This document is posted to help you gain knowledge. Please leave a comment to let me know what you think about it! Share it to your friends and learn new things together.
Transcript
Gustav R. Grob, Fellow of the Energy Institute F.EIExecutive Secretary, International Sustainable Energy Organization ISEO
Chairman of ISO/TC203/WG3 Technical Energy Systems AnalysesPresident of the International Clean Energy Consortium ICEC

Energy SituationTotal world energy use ~140 PWh p.a. → 16’000 GW at 8600 h> 80 % from finite, unsustainable mineral energy resources 4’000 GW installed electric base load and fluctuating power capacity world-wide (ground solar and wind power production is fluctuating)
∑ Energy : ∑ Electricity = 4 : 1 to 5 : 1 ratio
994 GW USA → 3,30 kW per capita (2010)860 GW China → 0,66 kW per capita (2010) = world average160 GW India → 0,16 kW per capita (2010)China plans additional 80 GW power capacity annuallyWorld needs minimum 400 GW p.a. more for economic growth, better life styles, electric mobility and replacements of obsolete, unsustainable thermal coal, gas, oil and nuclear power plants
All mineral fuels coal, petroleum, gas and Uraniummust be replaced by clean energy in this century !

-1000 0 1000 2000 3000 4000 5000
SOLAR PV & THERMAL ENERGY DIRECT WIND POWERHYDRO POWER / TIDAL / WAVE POWEROCEAN & GEOTHERMAL ENERGYBIOMASS / BIOGAS ENERGYAMBIENT ENERGYMUSCLE POWER
SUSTAINABLE ENERGY SUPPLY
INEVITABLE CLIMAX OFMINERAL ENERGY
HAZARDOUS ANDDEPLETING ENERGY
CONSUMPTION(FOSSIL & FISSILE)
[YEARS]
200
100
ENERGY[PWh]
ENERGY HISTORY & FORECAST
t
E
RENEWABLE ENERGY CONSUMPTION
TOTAL USABLEENERGY ON EARTH
DEPLETION OF FINITE ENERGY RESOURCES
OPTION A
OPTION B
MAXIMUM
OPTION 0 (ZERO-SUBSTITUTION)
SOURCE : ISEO
SITUATION 2000
TOTAL ENERGY CONSUMPTION

Renewable Energies only 13,5 %
according to IEA-OECD
Mineral
Energies 86.5 %
(Combustion
Pollution, Depletion ! )
124 PWh
- over 20 % in reality
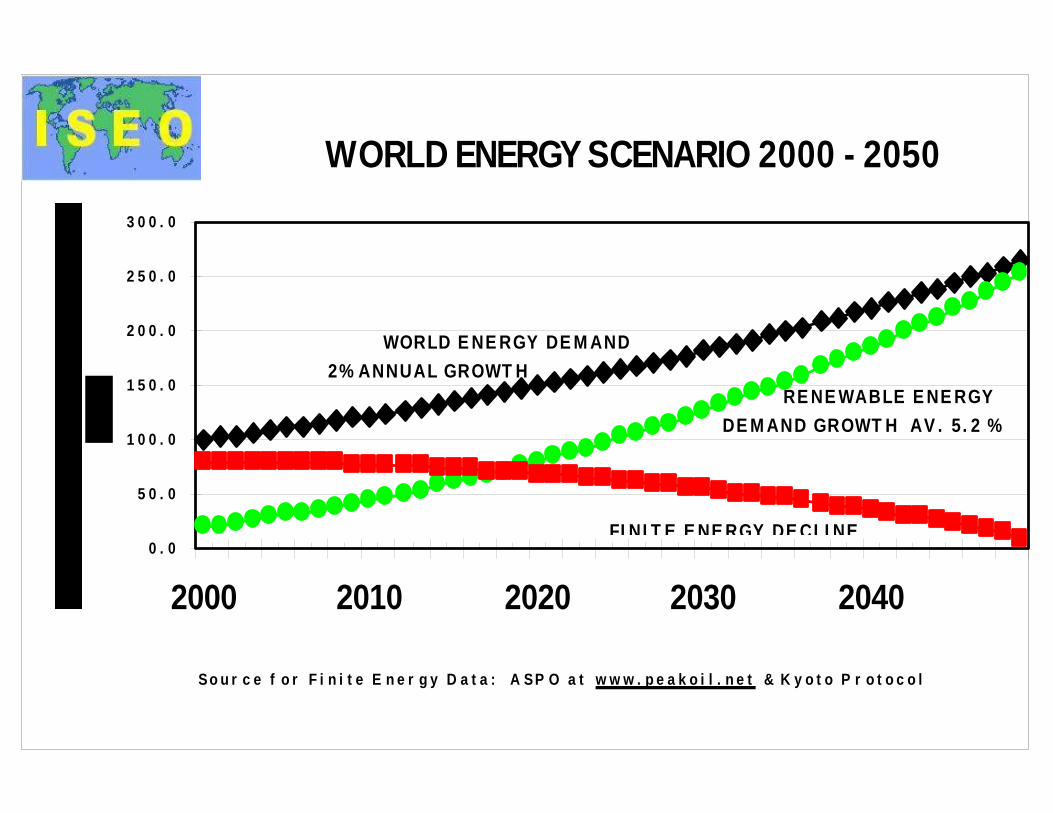
WORLD ENERGY SCENARIO 2000 - 2050
0 . 0
5 0 . 0
1 0 0 . 0
1 5 0 . 0
2 0 0 . 0
2 5 0 . 0
3 0 0 . 0
2000 2010 2020 2030 2040
So u r c e f o r F i n i t e E n e r g y D a t a : A SP O a t w w w . p e a k o i l . n e t & K y o t o P r o t o c o l
WORLD E NE RGY DE M AND 2% ANNUAL GROWT H
RE NE WABLE E NE RGY DE M AND GROWT H AV . 5. 2 %
FI NI T E E NE RGY DE CLI NE

Energy Option Immediately Feasible Theoretical Potential- Bio energy (competing with food !) (50) PWh/year (80)- Hydropower 8 15- Geothermal Electricity Conventional 2 ⎞- Geothermal Energy Hot Dry Rock 80 ⎬ 400- Geothermal Heat from aquifers 4 ⎠- Wind Power 53 160- Solar Power PV incl. SBSP 60 ⎞- Solar Thermal Power 40 ⎬ 435- Solar Direct Active Heat 20 ⎪- Solar Passive Heat 10 ⎠- Ocean Energy 15 200- Heat Pumps 10 50- Muscle Energy 1 10- Novel Energy Technologies (R&D) 50 200Total Renewable Energy Potential 350 PWh/year max. 1550 PWh/yearmore than twice the present world energy consumption
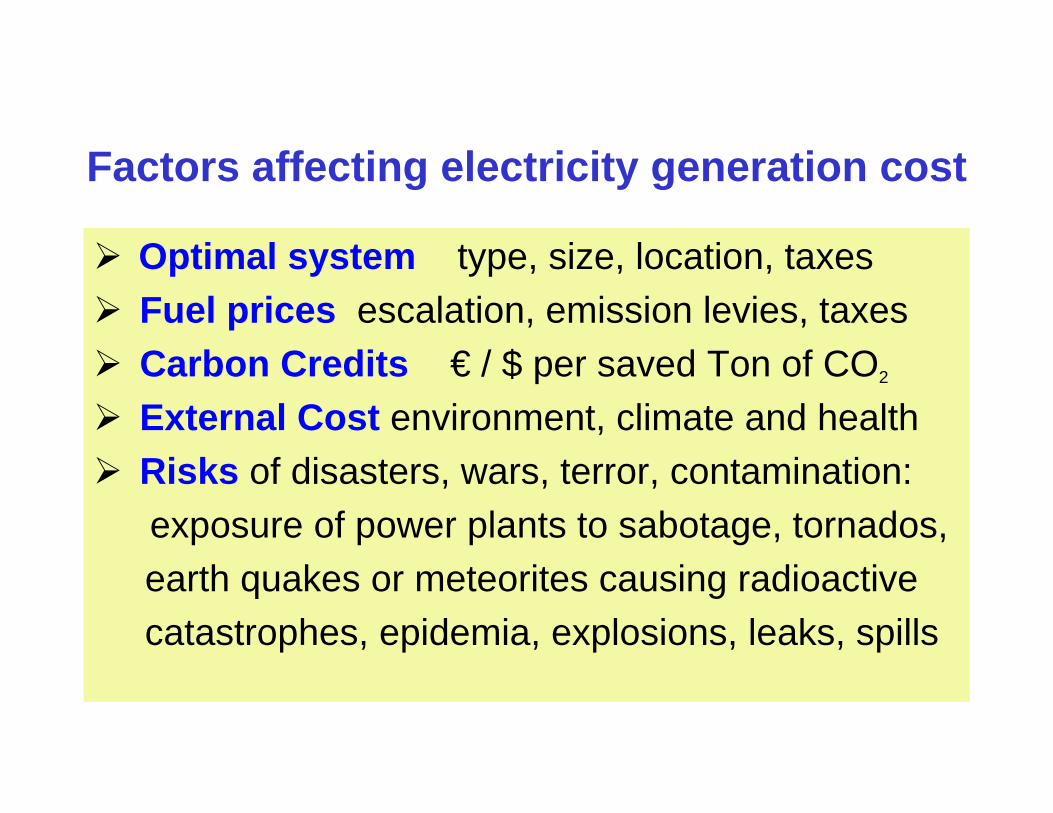
Factors affecting electricity generation cost
Optimal system type, size, location, taxesFuel prices escalation, emission levies, taxesCarbon Credits € / $ per saved Ton of CO2
External Cost environment, climate and healthRisks of disasters, wars, terror, contamination:exposure of power plants to sabotage, tornados,earth quakes or meteorites causing radioactivecatastrophes, epidemia, explosions, leaks, spills
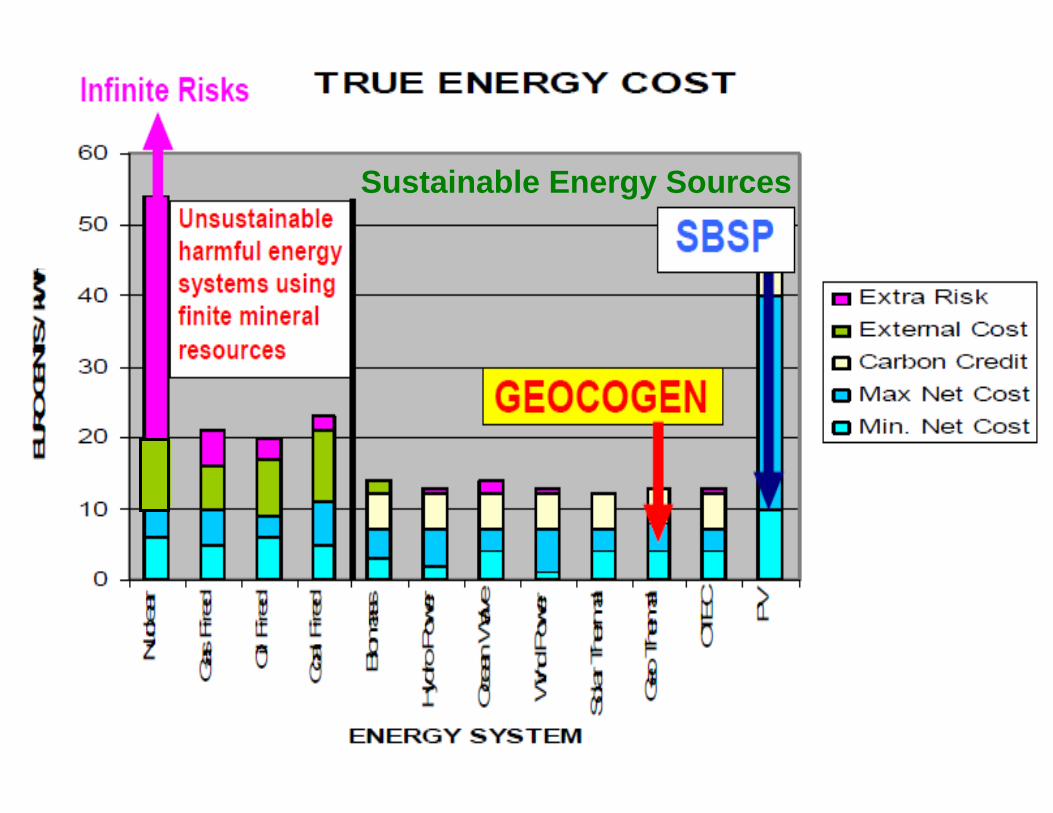
Sustainable Energy Sources

Deep Hot Rock Geothermal EnergyBorehole systems
a) Hydraulic fracturing by high pressure Hot-dry Rock system with safely controlledwith relatively small energy yields closed primary water cycle in insulated well
or andb) Boreholes to geothermal aquifers secondary steam turbine cycle with co-generation
in open systems with limited energy for district heating, AC, greenhouses, industry
Advantages:No yields by hazard ! Super performance (GW).No fuels or waste problems.Excavated materials re-used.Base load power plus heat
Energy cost: 2–4 €¢/kWh
Disadvantages:
a) Water is finding way of lowest resistance= limited Energy yield
b) Only in hydro geologic strata often far from consumers.Often high energy transport cost.Often limited to heat production only.
Energy cost: 5-10 €¢ /kWh

Advantages of geothermal deep well energy co-generation
Produces electricity and heat (suitable also for AirCon)Much lower net cost than any other energy sourceCan be built near agglomerations and substationsLess energy transmission line cost – hence alsoless transmission losses than other power plantsInvisible, no air or water pollution and no noiseIdeal power source for clean electric vehiclesNo radiation risks or other health hazardsCreates new clean sustainable jobsNo waste disposal problems !Long life !
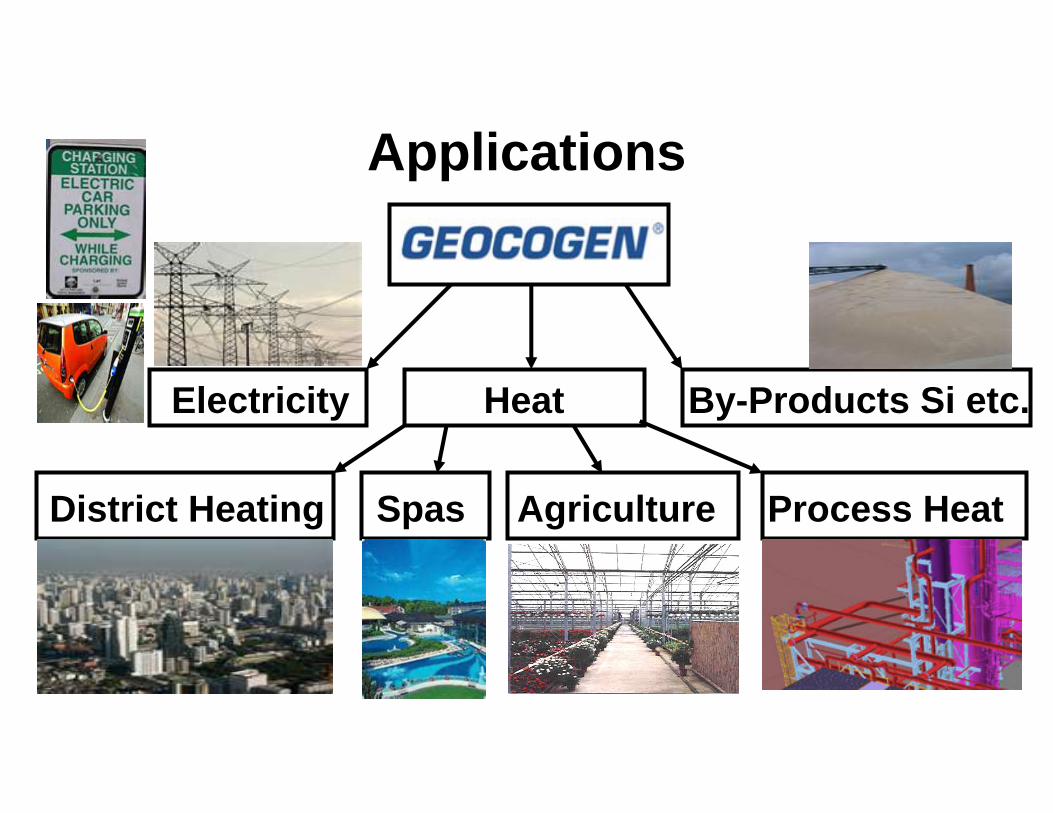
Applications
Electricity Heat By-Products Si etc.
District Heating Spas Agriculture Process Heat
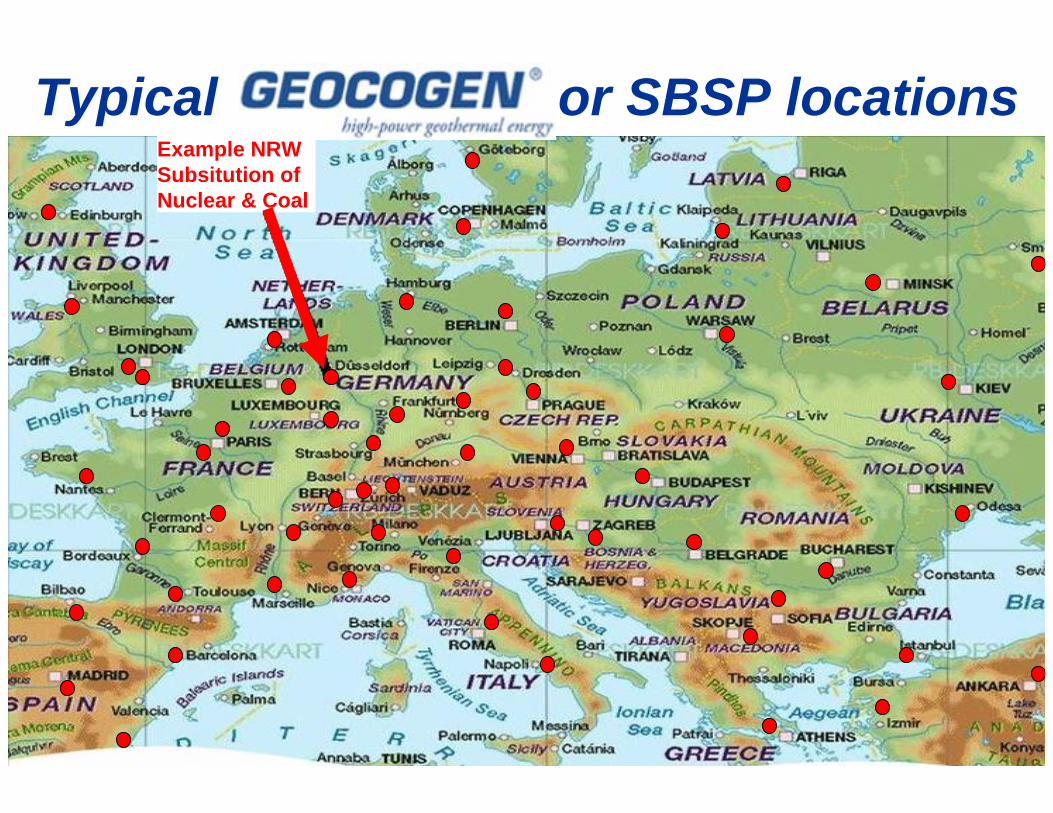
Typical or SBSP locationsExample NRW Subsitution of Nuclear & Coal

Finite Nuclear Power (to be replaced)

Radioactive contamination of Europe including Chernobyl fallout.
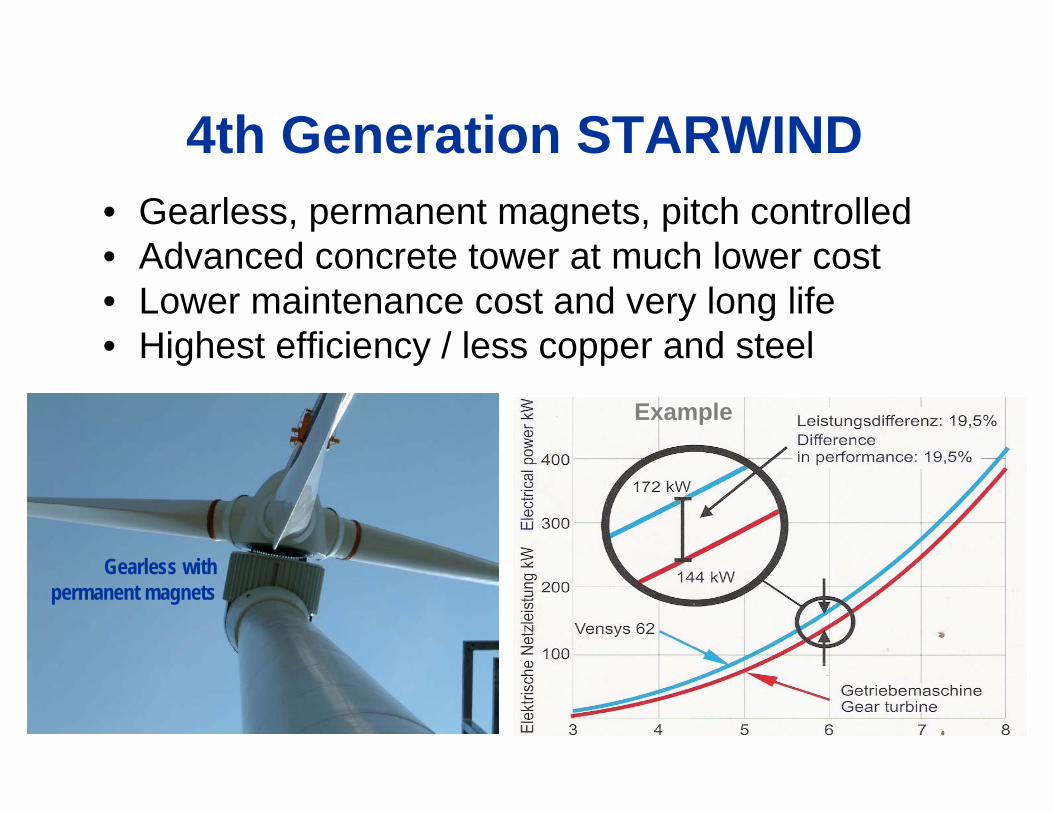
4th Generation STARWIND• Gearless, permanent magnets, pitch controlled• Advanced concrete tower at much lower cost• Lower maintenance cost and very long life• Highest efficiency / less copper and steel
Gearless with permanent magnets
Example
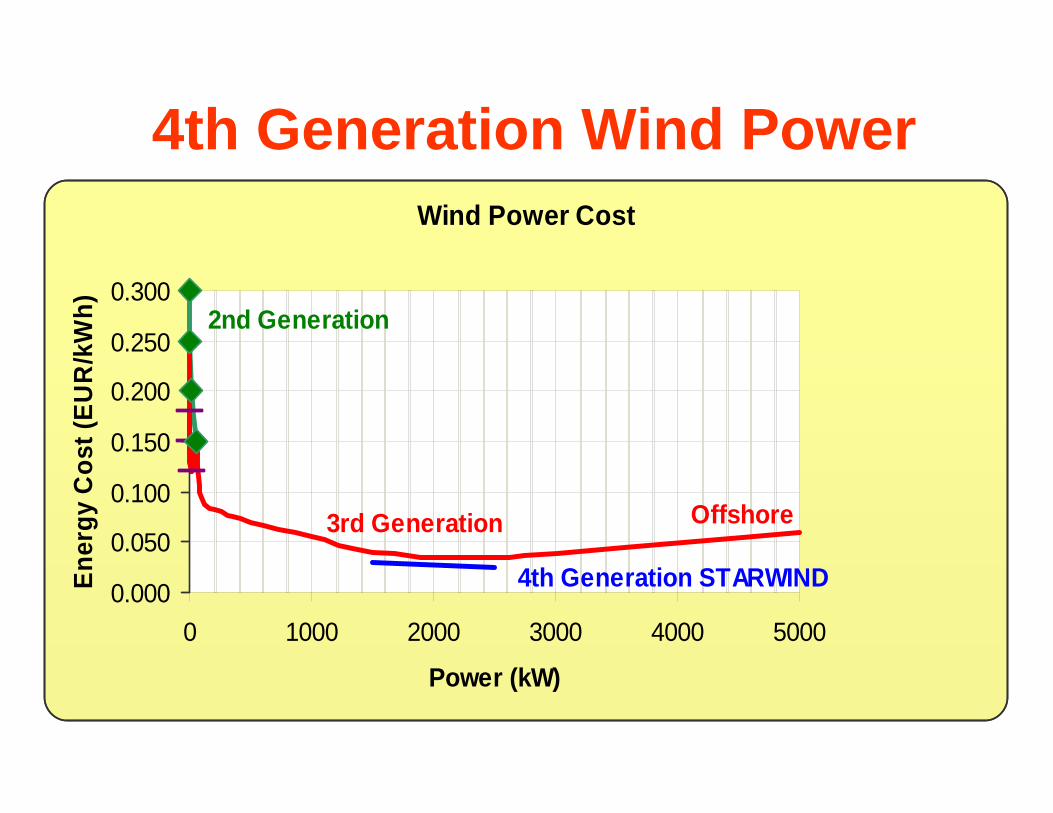
4th Generation Wind PowerWind Power Cost
0.000
0.050
0.100
0.150
0.200
0.250
0.300
0 1000 2000 3000 4000 5000
Power (kW)
Ener
gy C
ost (
EUR
/kW
h) 2nd Generation
3rd Generation
4th Generation STARWIND
Offshore

Ground PV vs Space PV Power
Tesla
Microwave
Transmission
PVPV array
PV array
Emitter
Receiver
PhotonsPhotons
Reflection
40 – 100 % Atmospheric Losses
0 - 950 W/m2
1367 W/m2

Advantages of Space-based Solar Power
Generates base load electricityHigher yield than terrestrial PV systemsCan be stationed anywhere above consumptionLess energy transmission line cost – hence alsoless transmission losses than other power plantsInvisible, no air or water pollution and no noiseIdeal power source for clean electric vehiclesNo radiation risks or other health hazardsCreates lots of new clean sustainable jobsNo waste disposal problems !Long life

Tools for Clean, Sustainable EnergyImplementation
ISO 13602-1 Energy Systems Analyses Standard
Joint ISO-IEC Standardization Committee JTC2
Global Energy Charter for Sustainable Development
International Carbon Credit Mechanisms (CDM, JI)
Polluters pay accounting principle (world-wide)
International Tax Reforms:more Taxes on Pollution – less on Productive Income
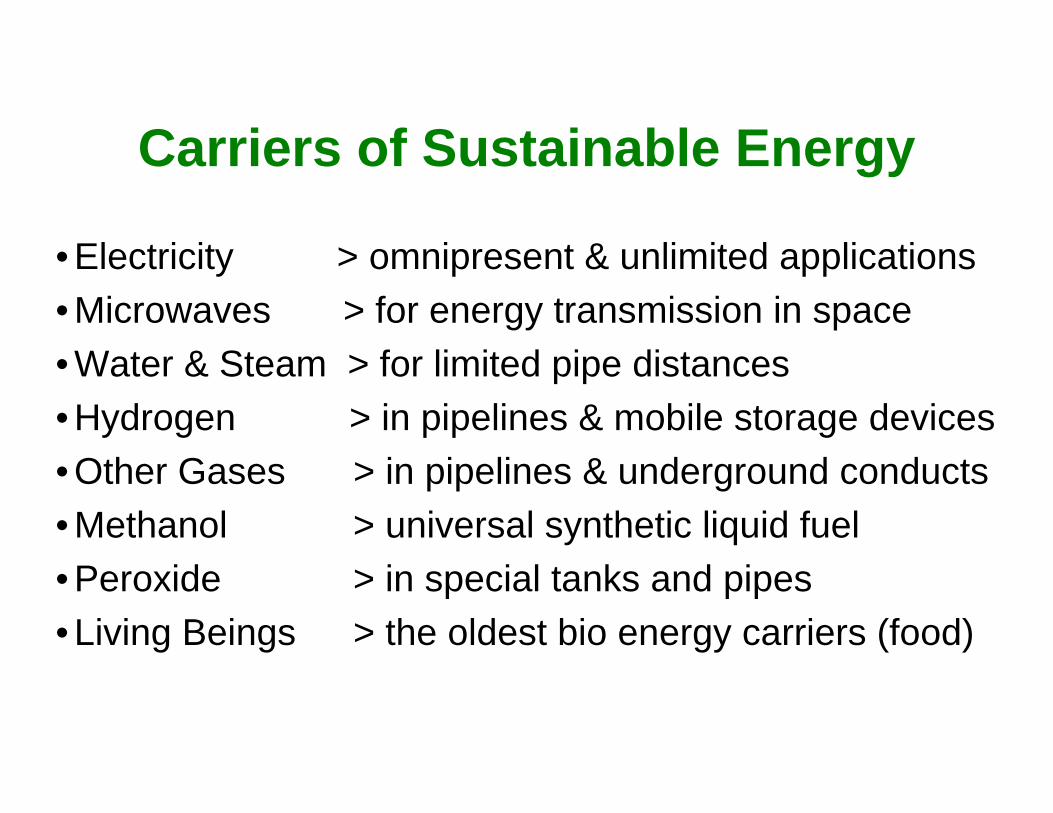
Carriers of Sustainable Energy
• Electricity > omnipresent & unlimited applications• Microwaves > for energy transmission in space• Water & Steam > for limited pipe distances• Hydrogen > in pipelines & mobile storage devices• Other Gases > in pipelines & underground conducts• Methanol > universal synthetic liquid fuel• Peroxide > in special tanks and pipes• Living Beings > the oldest bio energy carriers (food)

Specific International Standards onEnergy, Environment and Quality
ISO International System of Units (SI System)ISO 9000 series for Quality ManagementISO 14000 series for Environmental ManagementISO 13600 series for Technical Energy Systems (TC203)ISO Standards for Solar Thermal EnergyISO Standards for Hydrogen Technologies (TC197)ISO Standards for Internal Combustion EnginesISO Standards for Thermal InsulationISO Standards for Air and Water QualityISO Standards for Soil QualityISO Standards for Ship SafetyISO Standards for Gas CylindersISO Standards for Cryogenic VesselsISO Standards for Architecture
IEC Standards for Photovoltaics (PV Systems)IEC Standards for Fuel CellsIEC Standards for HydropowerIEC Standards for Wind Power GeneratorsIEC Standards for Electric Vehicles and BatteriesIEC Electric Safety & Environment ProtectionIEC Electric Installations in Buildings

Tasks of new joint ISO-IEC committee JTC2Energy is the largest economic sector, one of the key activities of ISO and the main reason for IEC.
Sustainable energy became the generic term for the entire scope from renewable energies, clean energy carriers, energy storage, energy efficiency and clean mobility supported by
• The United Nations Commission for Sustainable Development CSD and the UN-ECE commission for Sustainable Energy• The UN Environmental Program UNEP with the World Meteorological Organization WMO and their joint IPCC
for the framework convention on climate change UNFCCC and the World Health Organization WHO• The World Conservation Union IUCN, the International Sustainable Energy Organization ISEO
• The specialized NGOs on energy efficiency, renewable energy and energy carriers
Due to the global importance of energy and the key role it is playing in both IEC and ISO a joint ISO/IEC effort is needed to resolve interdisciplinary problems in international standardization, which are becoming more and more important also for the UN organizations
WTO, UNDP, UNIDO, UNCTAD, UNITAR and the World Bank Group.
Important subjects in both standardization domains are the clean energy carriers like Hydrogen which is split into ISO/TC197 & IEC/TC105, Metrology based on the SI system of ISO/TC12 & IEC/TC25, Solar energy also in the case of hybrid collectors and Space PV, Geothermalcogeneration with its steam turbines and generators, Bio energy also producing electricity, Wind turbines by IEC containing gears of ISO, electromechanical Ocean energy and the electric vehicles handled by ISO/TC22 & IEC/TC69. Some of these emerging technologies do not yet have ISO or IEC standards because of their interdisciplinary complexity with their mechanical, civil engineering, chemical process and electrical subsystems. They all need urgently a joint interdisciplinary standardization effort to enable the industry to produce such systems due to the rapid depletion of finite mineral energy resources with rising ecological and climatic concerns about global warming.
Hence a fully fledged JTC 2 on energy is needed under the title Sustainable energy technologies with
SC1 Terminology (replacing the JPC committee on energy efficiency and renewable energy)SC2 Technical energy systems (ISO/TC203 to be harmonized with other TCs and SC1) SC3 Energy statistics (ISO/DIS 13602-3 to be harmonized with SC1, UN, EU and IEA statistics)SC4 Energy carriers other than electricity (hydrogen at ISO/TC197, peroxide, methanol etc.)SC5 Geothermal energy (not yet existing in ISO or IEC - cooperation with CEN needed)SC6 Bioenergy (not yet existing in ISO or IEC - only in CEN for some solid biomass)SC7 Space energy (Space vehicles ISO/TC 20 & Photovoltaics IEC/TC 82)SC8 Marine energy with its mechanical and electric subsystems in cooperation with CENSC9 Electric road vehicles and tractors (ISO/TC22, ISO/TC23, IEC/TC21, IEC/TC69, IEC/TC105)
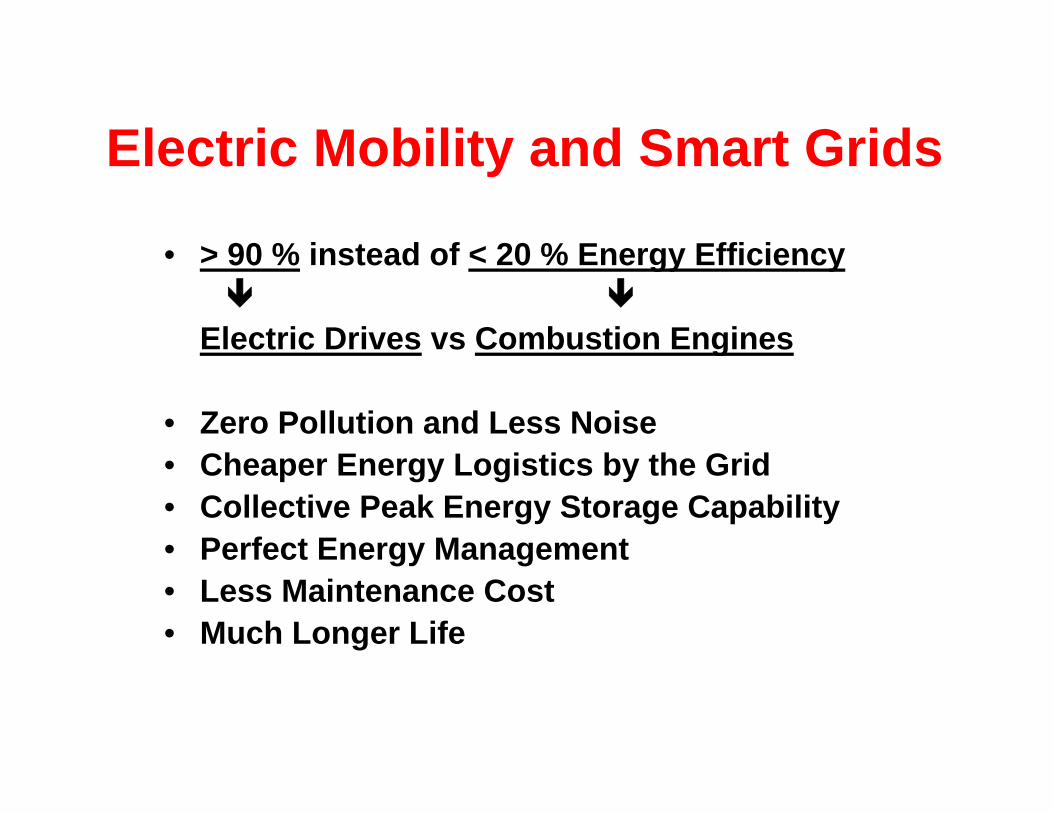
Electric Mobility and Smart Grids
• > 90 % instead of < 20 % Energy Efficiency
Electric Drives vs Combustion Engines
• Zero Pollution and Less Noise• Cheaper Energy Logistics by the Grid• Collective Peak Energy Storage Capability• Perfect Energy Management • Less Maintenance Cost• Much Longer Life
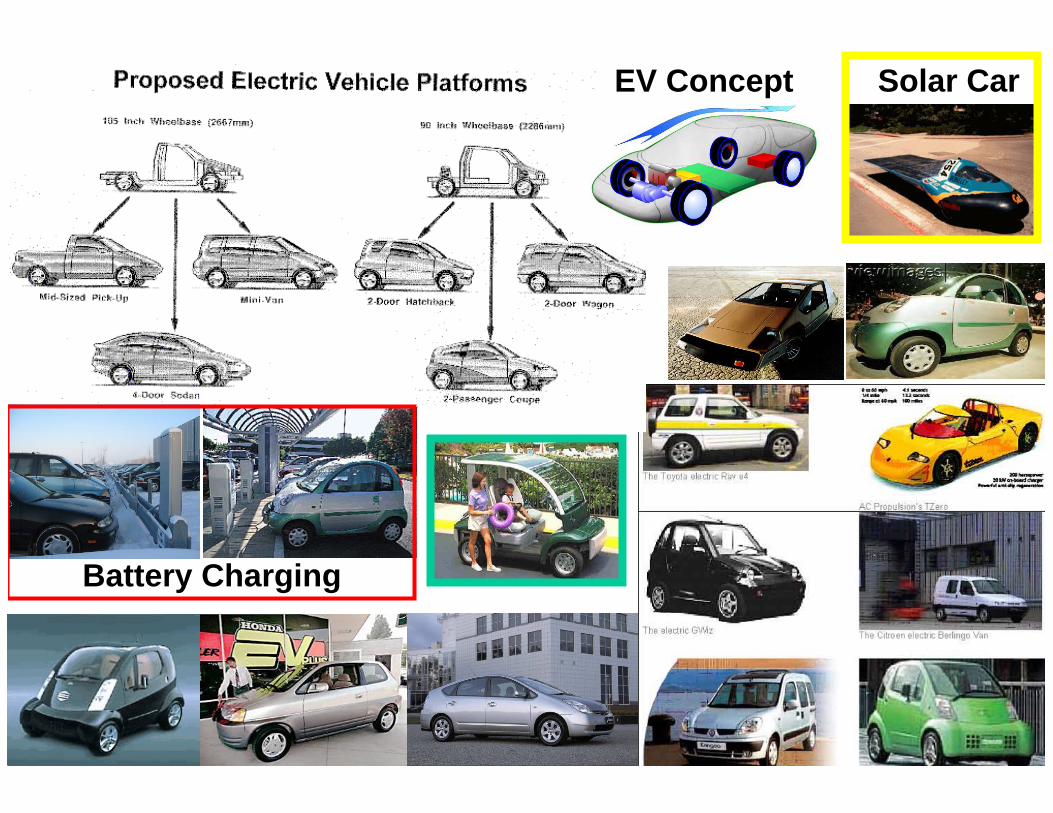
Battery Charging
Solar CarEV Concept
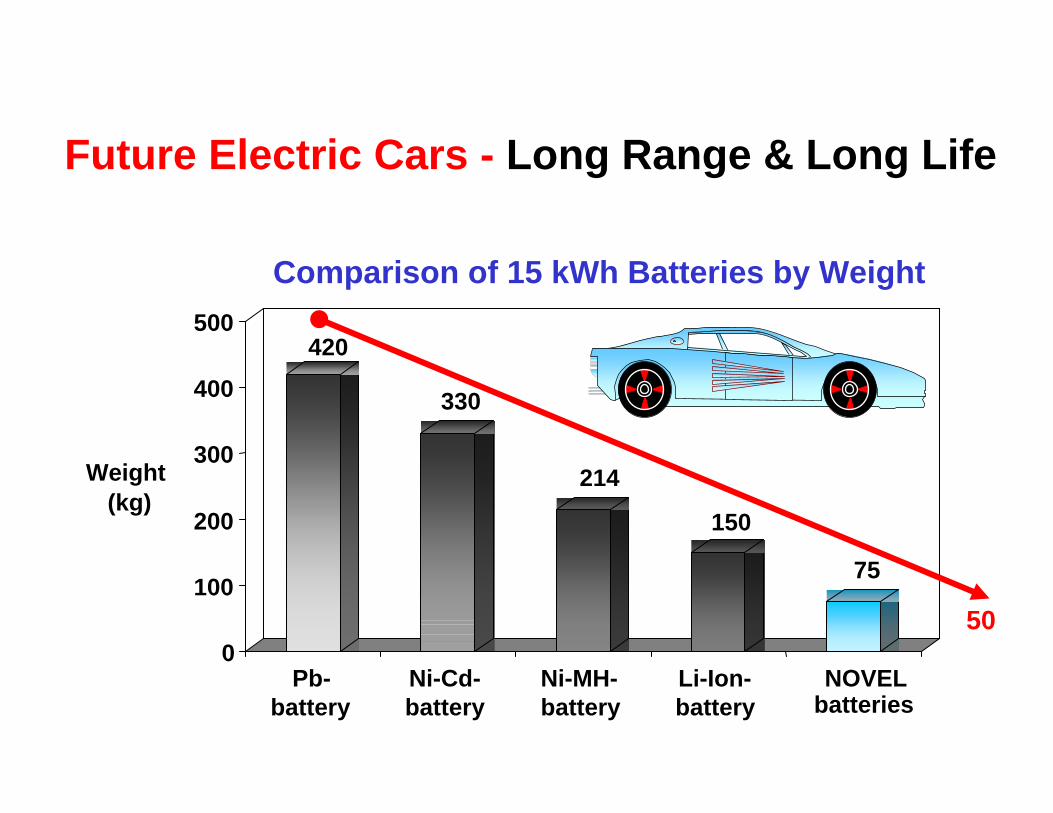
420
330
214
150
75
0
100
200
300
400
500
Weight(kg)
Pb-battery
Ni-Cd-battery
Ni-MH-battery
Li-Ion-battery
NOVELbatteries
Comparison of 15 kWh Batteries by Weight
Future Electric Cars - Long Range & Long Life
50

COMPARISON OF VEHICLE DRIVE TRAIN COST (40 kW; 240’000 km over 6 years) Drive Options Battery Hydrogen Hydrogen * Gasoline Remarks Criteria NOVEL Fuel Cell Combustion Combust. * a standard 4-cylinder combustion engine is used ** gasoline version: 1$/Liter, 10 Liters per 100 km
Li-ion or Amb. Temp. Cryogenic Gasoline *** AC/DC charger on board the electric car for easier battery charging ZEBRA Storage Storage ** Tank **** cryogenic H2 storage boil off loss depending on parking duration Relative Drive the same gear box assumed for all options Investment $/W 0,75 2,35 1,35 < 0.20 including energy management, storage and power train Energy Cost $/km 0,03 0,07 0,16 0,15 > energy supply at 0,1 $/kWh or H2 at 1 $ per Litre gasoline equivalent Relative Weight kg 350 250 250 200 > average weight of energy management, storage and power train Average Range km 300 400 200 400 > with one tank filling or one full charge (plus extra charges at stops) Energy Efficiency % 0,75 0,32 0,13 0,13 > total efficiency over whole energy chain to gear box E + Cap. Cost $/km < 0,20 0,56 0,46 0,28 > at 6 % interest over 3 years and 240’000 km usage incl. service & spares (Total Vehicle Cost) E-Vehicle maintenance cost are the lowest BATTERY η 0.9 0.1 $/W BATTERY CHARGER ON BOARD *** η 0.9 0.5 $/W 400 kg PRESSURE CONTROL AC POWER SUPPLY AC η 0.9 0.1 $/W 50 kg DC DC η 0.95 0.05 $/W 50 kg FUEL CELL AC M HYDRIDE ELECTROLYZER η 0.9 0.1 $/W 200 kg η 0.6 1 $/W 100 kg SUPPLY AND η 0.92 50 kg ELECTROLIZER ELECTROLYZER NANOTUBE 0.1 $/W AC M (STATIONARY) η 0.9 0.1 $/W 100 kg η 0.75 1 $/W
?? CRYOGENIC COMBUSTION DIRECT RENEWABLE η 0.6 0.2 $/W 100 kg ENGINE GEAR HYDROGEN PRODUCTION η 0,3 0.1 $/W 150 kg WHEELS
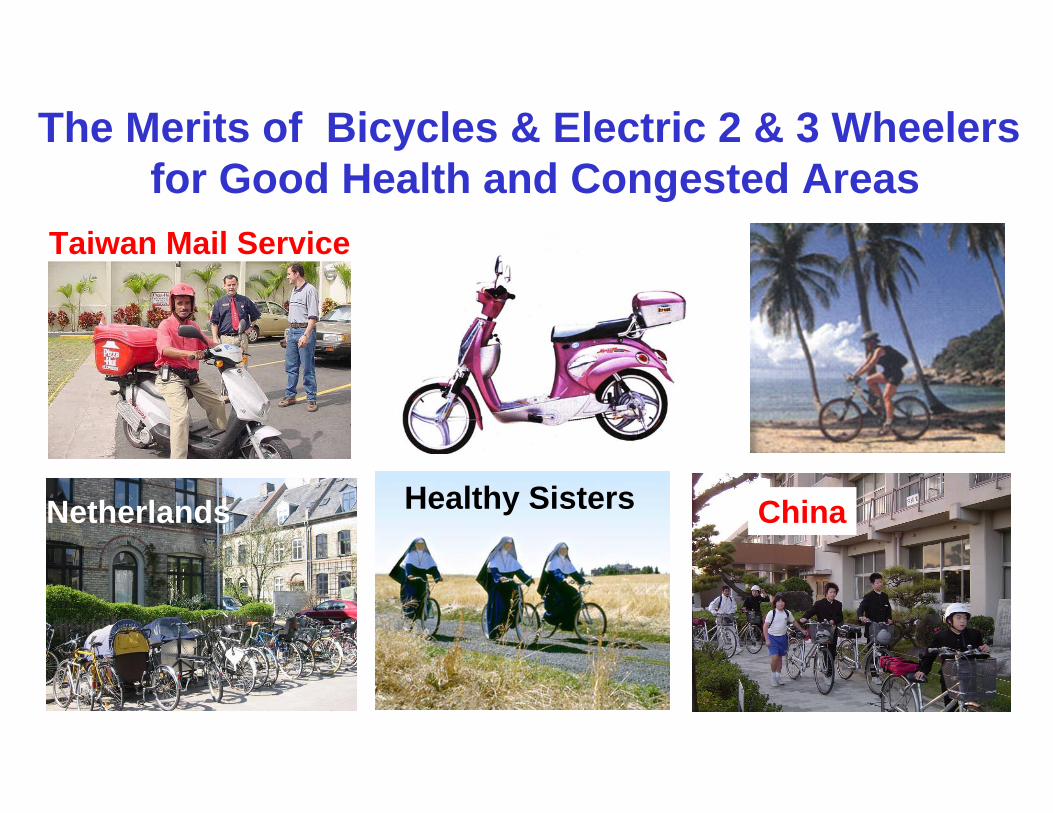
The Merits of Bicycles & Electric 2 & 3 Wheelersfor Good Health and Congested Areas
Taiwan Mail Service
Netherlands ChinaHealthy Sisters
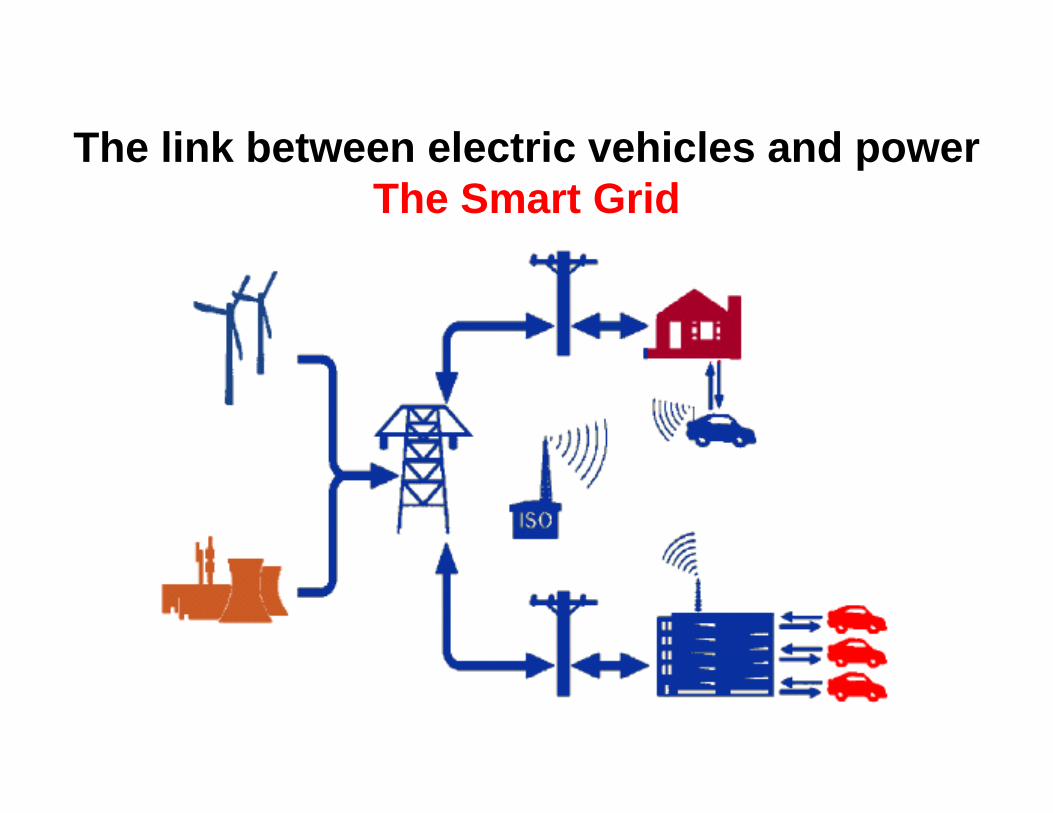
The link between electric vehicles and powerThe Smart Grid
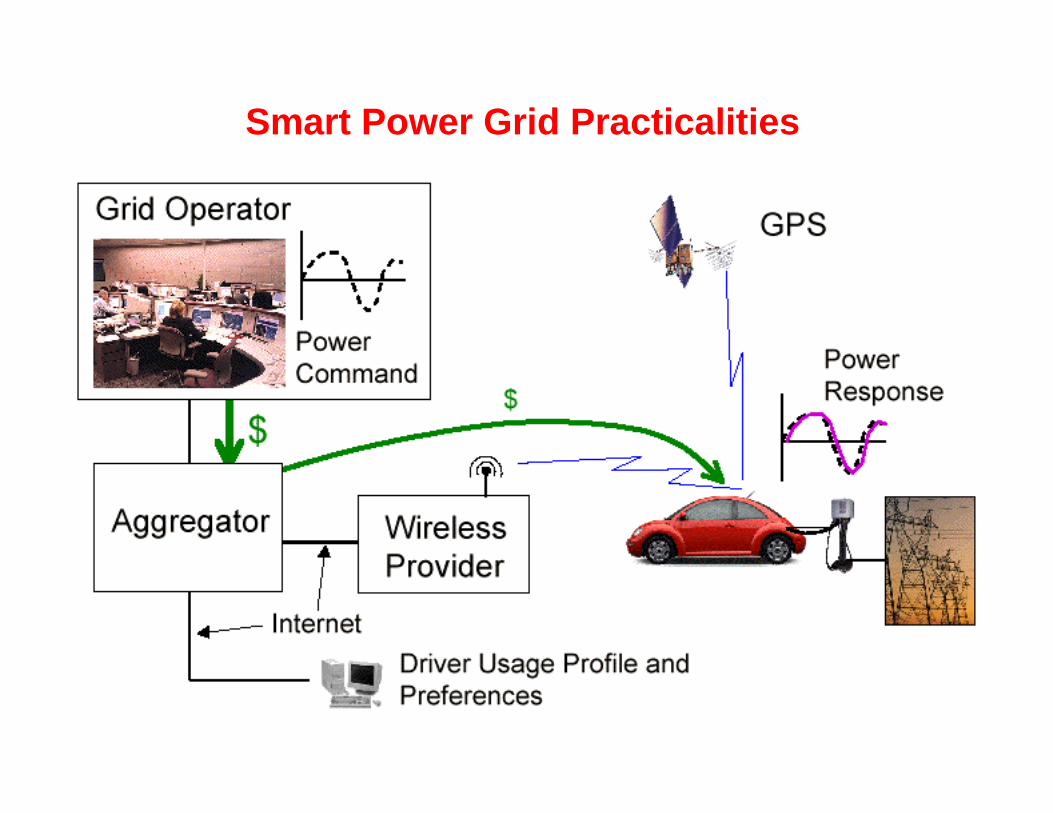
Smart Power Grid Practicalities

www.uniseo.org
Related Documents