ANNEXES 03 CSN Group 34 Mining 49 Steelmaking 65 Cement 78 Logistics 92 Corporate 1

Welcome message from author
This document is posted to help you gain knowledge. Please leave a comment to let me know what you think about it! Share it to your friends and learn new things together.
Transcript

AN
NE
XE
S 03 CSN Group
34 Mining
49 Steelmaking
65 Cement
78 Logistics
92 Corporate
1

About the Annexes
To make navigation through the content easier, this Integrated Report’s GRI Content Index shows the location of each indicator.
The Group companies not listed herein are included in this Annex only in the Company’s consolidated financial figures.
One of the purposes of this Integrated Report is to offer concise and relevant information to readers. To this end, in this section we present some of the numeric indicators, tables and graphs which are essential to the following frameworks1:
Global Reporting Initiative (GRI);
Sustainability Accounting Standards Board (SASB);
Worldsteel Association (WSA);
Global Cement and Concrete Association (GCCA);
International Council on Mining and Metals (ICMM); and
United Nations Conference on Trade and Development (UNCTAD).
In addition, CSN Group’s data and information are organized in the following structure and icons:
Grupo CSN – includes consolidated information of all CSN companies, for an overall view of our indicators;
Mining – Data and information from CSN Mineração (CMIN), Minérios Nacional and Estanho de Rondônia S.A (ERSA);
Steelmaking – Includes relevant consolidated indicators and results from: CSN - Presidente Vargas Steelworks (UPV); CSN - Porto Real; CSN - Paraná; Companhia Metalúrgica Prada – Packaging and Distribution Units;
Cement – Relevant consolidated indicators and results from: CSN Cimentos in Volta Redonda (RJ) and in Arcos (MG);
Logistics – Includes relevant indicators and results from: Ferrovia Transnordestina Logística S.A (FTL); Transnorsdetina Logística S.A. (TLSA)
1. Other data, particularly qualitative information, may be found throughout the Integrated Report.
and Sepetiba Tecon S.A. (Container Terminal); and
Corporate – Includes relevant results from indicators referring to CSN Group’s office units.
We would like to hear your feedback: Send comments and questions to [email protected]
Any dollar amounts throughout the report refer to US dollars (US$) and the exchange rate on 12/31/2020 was R$5.1967.
2 2020 CSN INTEGRATED REPORT | ANNEXES

CSNGROUP
3

102 - General Disclosures: Organizational profile
We have a total of 4,139 suppliers in the CSN Group, the national ones are located mostly in the following states, MG (31.94%), RJ (22.83%) and SP (10.79%). Our international suppliers represent 24.81%. Most of the CSN Group suppliers offer materials (70.21%) and services (29.79%). The most representative spend categories are, respectively: Reducers, Maritime Transport, Ores and Minerals, Road Transport and Fuels.
Grupo CSN (in millions) Consolidated
12/31/2020 12/31/2019 12/31/2018
Revenue
Goods, products and services sales 33,800 28,558 26,336
Other revenue/expenses 237 152 2,853
Allowance for /reversal of doubtful accounts
40 (8) (45)
34,077 28,702 29,144
Inputs Acquired from Third Parties
Cost of goods, products and services sold
(17,076) (15,274) (14,829)
Supplies, energy, outsourced services and other
(4,827) (4,631) (2,656)
Impairment/recovery of assets (89) (139) (136)
Others - - -
Impairment assets available for sale - - -
(21,992) (20,044) (17,621)
Gross added value 12,085 8,658 11,524
201-1 Direct economic value generated and distributed
102-9 Supply chain
201 Economic Performance
Grupo CSN (in millions) Consolidated
12/31/2020 12/31/2019 12/31/2018
Retentions
Depreciation. amortization and depletion (2,517) (1,519) (1,273)
Net value added produced 9,568 7,139 10,251
Value Added Received in Transfer
Equity pick-up 72 126 136
Financial revenue 1,803 379 1,311
Other and exchange gains 617 195 155
2,492 700 1,601
TOTAL VALUE ADDED TO DISTRIBUTE 12,060 7,839 11,851
Personnel and charges 2,211 2,660 2,297
Direct compensation 1,710 2,041 1,799
Benefits 403 498 416
F.G.T.S. (Employment Time Guarantee Fund) 98 121 83
Taxes. fees and contributions 2,329 212 1,384
Federals 1,881 (100) 1,027
State 414 288 332
Locals 34 24 25
Return on third-party capital 3,228 2,723 2,970
Interest 2,876 2,563 2,272
Rentals 12 17 25
Other and Passive Monetary and Exchange Variation
340 143 672
Return on equity capital 4,292 2,245 5,201
Interest on equity capital - - -
102-13 Membership of associations
Business area
Associations
CSN Group
Latin American Steel Association (ALACERO)National Institute of Metrology, Standardization and Industrial Quality (INMETRO)Business Institutes and Foundations Group (GIFE)
4 2020 CSN INTEGRATED REPORT | ANNEXES

Grupo CSN (in millions) Consolidated
12/31/2020 12/31/2019 12/31/2018
Dividends 901 425 898
Income for the year / retained earning 2,893 1,364 4,176
Minority interest 498 455 126
Others - - -
Result Discontinued Operations - - -
ADDED VALUE DISTRIBUTION 12,060 7,839 11,851
Theexplanatorynotesareanintegralpartofthefinancialstatements
201-3 Defined benefit plan obligations and other retirement plans
Grupo CSN (in millions) Consolidated
12/31/2020 12/31/2019 12/31/2018
Actuarial assets
Pensionplanbenefits (14) (14) (100)
Post-employmenthealthbenefits - - -
(14) (14) (100)
Actuarial liabilities
Pensionplanbenefits 80 20 8
Post-employmenthealthbenefits 679 892 897
758 912 905
Grupo CSN (in millions) Consolidated
12/31/2020 12/31/2019 12/31/2018
Actuarial assets
Presentvalueofdefinedbenefitobligations 3,646 3,581 3,087
Fair value of the plan’s assets (3,766) (3,894) (3,404)
Deficit/(Surplus) (120) (313) (316)
Restriction to actuarial assets due to limited recovery
186 319 225
Netliabilities/(assets) 66 6 (92)
Liabilities 80 20 8
Assets (14) (14) (100)
Netliabilities/(assets)recognized in the balance sheet
66 6 (92)
Present value of obligations at the beginning of the year
3,581 3,087 3,078
Cost of service 1 1 1
Cost of interest 237 283 304
Participants’ contributions in the period
2 2 -
Benefitspaid (279) (270) (280)
Actuarial loss/(gain) 104 477 (15)
Present value of obligations at the end of the year
3,646 3,581 3,087
Fair value of the plan’s assets at the beginning of the year
(3,894) (3,404) (3,305)
Interest revenue (258) (314) (328)
Benefitspaid 279 270 280
Participants’ contributions in the period
(2) (2) -
Return on the plan’s assets (excluding interest revenue)
109 (444) (51)
Fair value of the plan’s assets at the end of the year
(3,766) (3,894) (3,404)
201 Economic Performance 201-1 Direct economic value generated and distributed
5 2020 CSN INTEGRATED REPORT | ANNEXES

*TheGroupfiguresincludethebasicwagesofSteelmakingandLogistics
*TheGroupfiguresincludethebasicwagesofSteelmakingandLogistics
*TheGroupfiguresincludethebasicwagesofSteelmakingandLogistics
2020
Minimum basic wage
Entry level wage
Ratio with entry level wage
Line labels Average
basic wage Men
Number of people
Average basic wage
Women
Number of people
Men Women
CSN Group 1,000.89 31 998.00 42 1.00 1.00
2018
Minimum basic wage
Entry level wage
Ratio with entry level wage
Line labels Average
basic wage Men
Number of people
Average basic wage
Women
Number of people
Men Women
CSN Group 954.00 5 954.00 28 1.05 1.05
2019
Minimum basic wage
Entry level wage
Ratio with entry level wage
Line labels Average
basic wage Men
Number of people
Average basic wage
Women
Number of people
Men Women
CSN Group 1,000.89 86 998.00 35 1.00 1.00
202-1 Ratios of standard entry level wage by gender compared to local
minimum wage
202 Market presence
Proportion of spending on local suppliers
2018 2020
31%
37%
2019
38%
204 Procurement practices
204- 1 Proportion of spending on local suppliers
2018 2019 2020
CSN Group
% of local expense (consolidated)
31.1% 38.2% 37.2%
% spent with materials (Products)
27.9% 35.4% 31.9%
% of local expense with services
40.7% 44.9% 49.7%
6 2020 CSN INTEGRATED REPORT | ANNEXES

Business area
Description Unit 2018 2019 2020
Materials used
CSN Group
Iron ore dry metric ton 5,226,178.00 3,680,770.00
3,728,358.59
Metallurgical coal dry metric ton 1,630,265.21 1,160,553.24 990,021.09
Coal injection into the blast furnace
dry metric ton 482,275.00 231,802.00 468,581.16
Coke dry metric ton 1,136,344.90 933,747.20 915,354.15
Heavy oil t 2.69 1.94 -
Light oil t 6.24 1.04 -
Limestone dry metric ton 3,594,856.20 3,573,908.06 4,094,488.18
Crude dolomite dry metric ton 343,881.00 420,003.00 509,668.00
Pellets t 1,240,554.00 1,134,277.00 1,393,692.75
EAF Electrodes t 768.77 760.84 629.66
Pig iron t 32,637.00 32,255.00 9,165.00
Scraps t 573,331.00 378,994.00 913,054.00
Paint t 2,334.12 2,318.00 2,251.76
Zinc t 9,648.69 9,514.15 13,257.57
Solvent t 223.80 240.40 175.00
Seal t 81.70 89.02 63.51
Varnish t 404.48 246.21 164.31
Enamel t 74.12 20.32 3.50
Strain hardening fluid t 416.75 430.70 592.22
ANFO t 3,919.51 3,435.81 2,385.24
TNT t 676.98 558.74 558.94
Bulk emulsion t 2,279.72 2,391.81 3,740.02
301 - Materials
301-1 Materials used by weight or volume Business area
Description Unit 2018 2019 2020
Acetylene t 5.20 14.04 22.00
Diesel t 60,949.28 66,536.60 67,073.17
LPG dry metric ton 548.84 477.56 378.76
Natural gas t 355,891.22 363,134.42 345,118.24
Gasoline t 735.08 711.57 429.97
Ethanol t 0.17 0.49 0.84
Fuel oil t 2,714.31 - 2,922.58
Coal mill t 48,858.00 16,932.00 4,143.02
Clinker used t 1,861,286.00 2,067,593.00 2,302,630.00
Plaster t 65,234.00 95,850.05 110,027.34
Slag t 1,208,183.00 1,045,053.40 1,122,425.22
Total Materials t 17,885,564.97 15,222,621.60 17,001,375.81
Produced Products
Grupo CSN
BOF crude steel produced t 3,947,396.00 2,775,748.00 3,591,200.00
EAF crude steel produced t 204,788.00 230,193.00 224,890.00
Total crude steel produced t 4,152,184.00 3,005,941.00 3,816,090.00
Iron ore produced t 28,521,732.00 32,698,084.00 22,409,934.00
Cassiterite concentrate (cassiterite. columbite)
t 1,278.31 1,234.10 1,260.37
Equivalent cement production
t 3,469,360.00 3,546,466.00 3,924,179.00
Total Produced Products t 40,296,738.31 42,257,666.10 33,967,553.37
7 2020 CSN INTEGRATED REPORT | ANNEXES

Business area
Description Unit 2018 2019 2020
Materials used
CSN Group
Steelmaking UPV
Percentage of raw materials or recycled materials used in the manufacture of your main
% 4.9% 4.3% 9.2%
Total raw materials or recycled materials used
t 573,331.00 378,994.00 913,054.00
Scraps t 573,331.00 378,994.00 913,054.00
Total raw materials or materials used
t 11,814,729.19 8,904,638.62 9,908,031.23
Cement
Percentage of raw materials or recycled materials used in the manufacture of your main
% 35.5% 29.1% 28.5%
Total raw materials or recycled materials used t 1,208,183.00 1,045,053.40 1,122,425.00
Scraps t 1,208,183.00 1,045,053.40 1,122,425.00
Total raw materials or materials used
t 3,403,610.00 3,591,646.74 3,932,785.00
Clinker/cement factor % 57.7% 57.6% 58.5%
301-2 Recycled input materials used
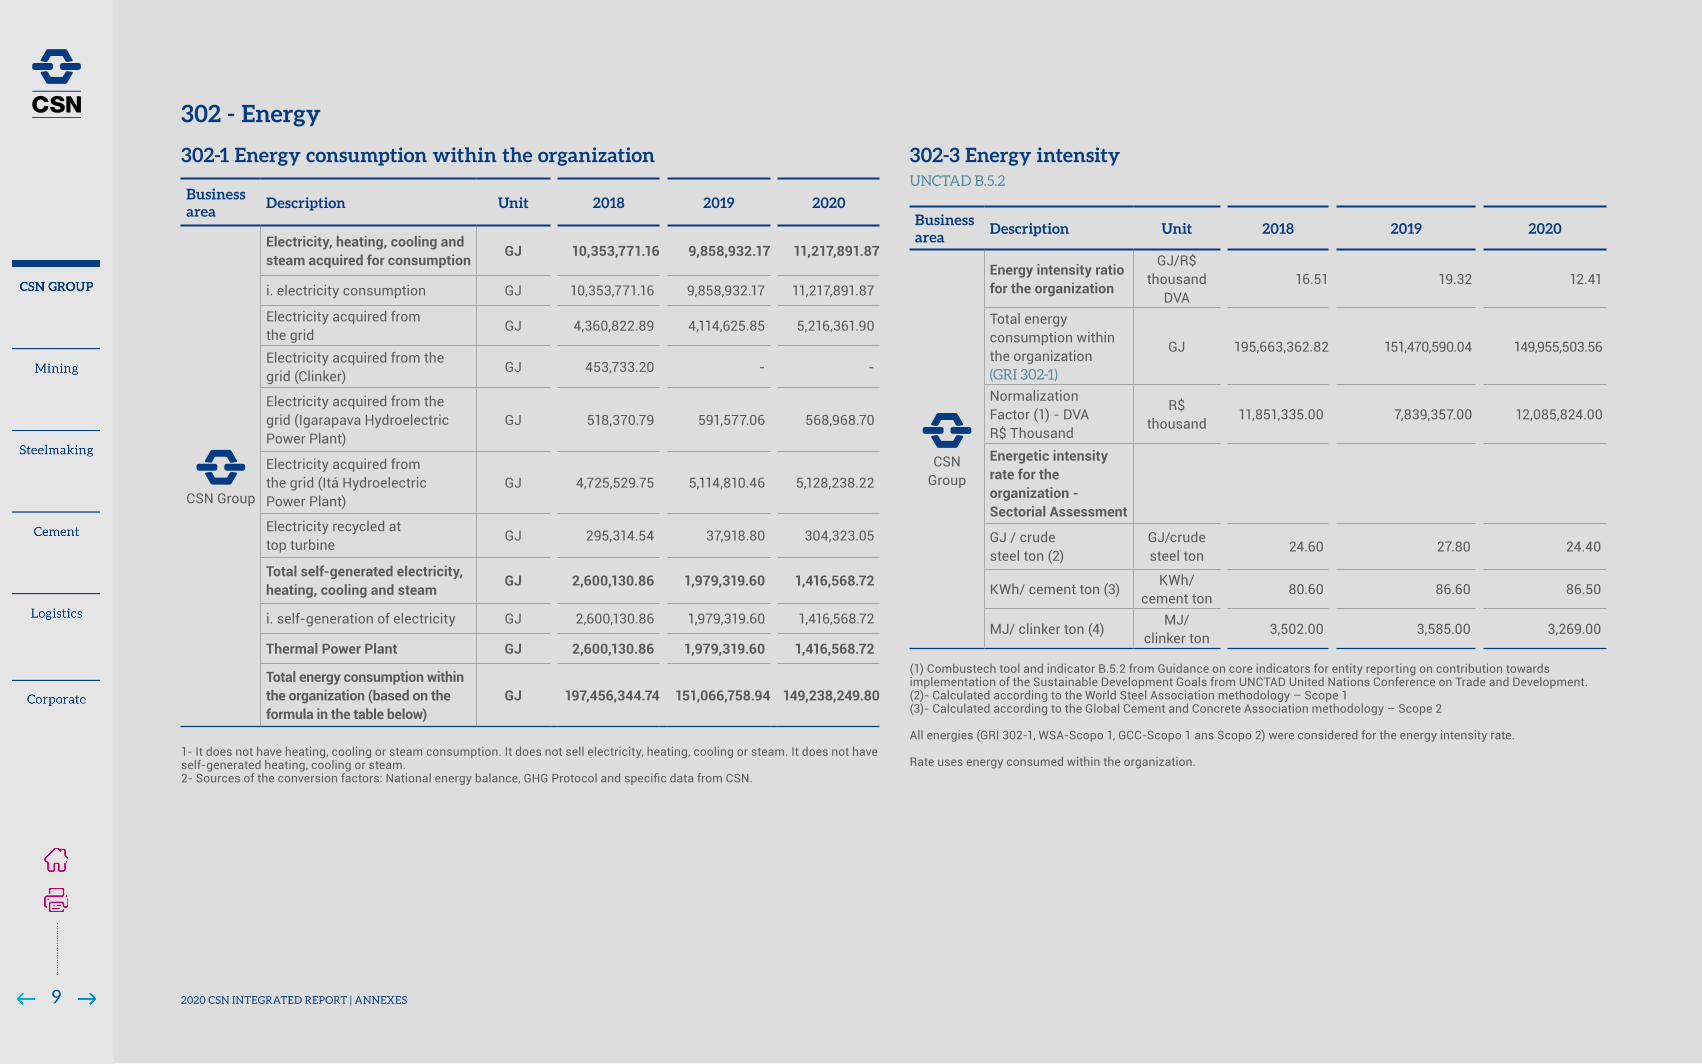
302-1 Energy consumption within the organization Business area
Description Unit 2018 2019 2020
CSN Group
Total non-renewable fuel consumption
GJ 187,102,569.06 141,207,813.90 138,020,338.87
Metallurgical coal / CSN GJ 65,451,435.11 35,956,644.14 26,374,161.70
Metallurgical coal PCI / CS GJ - 7,111,978.72 12,483,002.10
Sub-bituminous coal GJ 923,416.20 320,014.80 78,303.14
Coal coke/ CSN GJ 50,273,850.93 16,842,266.66 15,947,301.36
Coal coke / CSN bought GJ - 20,708,303.99 19,561,559.38
Coal coke / Mill / CS GJ 7,333,102.88 4,901,105.52 6,010,988.49
Coal coke / Small coke / CS GJ 6,352,515.70 4,099,378.01 5,180,384.56
Petroleum coke GJ 6,361,710.82 6,453,337.96 7,226,797.72
Diesel / Brazil GJ 2,716,537.69 2,964,609.36 2,946,538.12
Steel mill gas / CSN GJ 3,230,137.02 2,290,350.89 2,379,926.46
Blast furnace gas / CSN GJ 21,662,868.99 17,021,764.87 18,358,436.56
Coke gas / CSN GJ 8,122,977.01 6,077,544.52 6,218,506.44
Coke gas / Desulfurized / CSN GJ 112,731.21 197,047.98 123,351.85
LiquefiedPetroleumGas(LPG) GJ 28,220.19 24,852.84 21,923.40
Natural gas GJ 14,393,600.54 16,209,733.68 14,973,616.83
Gasoline / Brazil GJ 29,751.31 28,799.53 16,912.23
Fuel oil GJ 109,657.75 - 118,557.15
Flushing oil / CSN GJ 55.71 80.43 71.36
Total renewable fuel consumption
GJ 4.52 12.88 19.06
Hydrous ethanol GJ 4.52 12.88 19.06
301 - Materials 302 - Energia
8 2020 CSN INTEGRATED REPORT | ANNEXES
Business area
Description Unit 2018 2019 2020
CSN Group
Electricity, heating, cooling and steam acquired for consumption
GJ 10,353,771.16 9,858,932.17 11,217,891.87
i. electricity consumption GJ 10,353,771.16 9,858,932.17 11,217,891.87
Electricity acquired from the grid
GJ 4,360,822.89 4,114,625.85 5,216,361.90
Electricity acquired from the grid (Clinker)
GJ 453,733.20 - -
Electricity acquired from the grid (Igarapava Hydroelectric Power Plant)
GJ 518,370.79 591,577.06 568,968.70
Electricity acquired from the grid (Itá Hydroelectric Power Plant)
GJ 4,725,529.75 5,114,810.46 5,128,238.22
Electricity recycled at top turbine
GJ 295,314.54 37,918.80 304,323.05
Total self-generated electricity, heating, cooling and steam
GJ 2,600,130.86 1,979,319.60 1,416,568.72
i. self-generation of electricity GJ 2,600,130.86 1,979,319.60 1,416,568.72
Thermal Power Plant GJ 2,600,130.86 1,979,319.60 1,416,568.72
Total energy consumption within theorganization(basedontheformula in the table below)
GJ 197,456,344.74 151,066,758.94 149,238,249.80
1- It does not have heating, cooling or steam consumption. It does not sell electricity, heating, cooling or steam. It does not have self-generated heating, cooling or steam. 2-Sourcesoftheconversionfactors:Nationalenergybalance,GHGProtocolandspecificdatafromCSN.
302-1 Energy consumption within the organization
302-3 Energy intensity
Business area
Description Unit 2018 2019 2020
CSN Group
Energy intensity ratio fortheorganization
GJ/R$ thousand
DVA 16.51 19.32 12.41
Total energy consumption within the organization (GRI 302-1)
GJ 195,663,362.82 151,470,590.04 149,955,503.56
Normalization Factor (1) - DVA R$ Thousand
R$ thousand
11,851,335.00 7,839,357.00 12,085,824.00
Energetic intensity rate for the organization-Sectorial Assessment
GJ / crude steel ton (2)
GJ/crude steel ton
24.60 27.80 24.40
KWh/ cement ton (3)KWh/
cement ton 80.60 86.60 86.50
MJ/ clinker ton (4)MJ/
clinker ton 3,502.00 3,585.00 3,269.00
302 - Energy
UNCTAD B.5.2
(1) Combustech tool and indicator B.5.2 from Guidance on core indicators for entity reporting on contribution towards implementation of the Sustainable Development Goals from UNCTAD United Nations Conference on Trade and Development. (2)- Calculated according to the World Steel Association methodology – Scope 1 (3)- Calculated according to the Global Cement and Concrete Association methodology – Scope 2 All energies (GRI 302-1, WSA-Scopo 1, GCC-Scopo 1 ans Scopo 2) were considered for the energy intensity rate. Rate uses energy consumed within the organization.
9 2020 CSN INTEGRATED REPORT | ANNEXES

302-4 Reduction of energy consumption 302-5 Reductions in energy requirements of products and services
Business area
Description Unit 2018 2019 2020
CSN Group
Amount of reductions in energy consumption achieved as a direct result of conservation andefficiencyinitiatives
GJ (46,389,585.8) (48,218,094.9)
Types of energy included in the reductions: whether fuel, electricity, cooling, steam, or all
GJ
Fuel GJ - (45,894,746.8) (49,082,215.6)
Electricity GJ - (494,839.0) 864,120.7
Business area
Description UnitBase year
20182018 2019 2020
CSN Group
Reductions in energy requirements of sold products and services achieved during the reporting period
GJ/ crude steel ton (2)
24.6 24.6 27.8 24.4
% Reduction compared to
base year 20180.0% 13% -0.8%
kWh/cement ton (3)
80.6 80.6 86.6 85.4
% Reduction compared to
base year 20180% 7.4% 7.3%
MJ/ clinquer ton (4)
3502 3502 3585 3269
% Reduction compared to
base year 20180% 2.4% -6.7%
302 - Energy
Note: Base year 2018. Sourcesused:NationalEnergyBalance(BEN),GHGProtocolandspecificdatafromCSN.
1. Base year 2018. 2. According to World Steel Association (WSA) methodology - Scope 1 3. According to Global Cement and Concrete Association (GCCA) methodology - Scope 2 4. According to Global Cement and Concrete Association (GCCA) methodology - Scope 1
10 2020 CSN INTEGRATED REPORT | ANNEXES

2018 2019 2020
Business area
In megaliters ML Source All areasAreas with
water stressAll areas
Areas with water stress
All areasAreas with
water stress
CSNGroup
WATER WITHDRAWAL BY SOURCE
Surface water (total) 86,074.33 7,327.20 100,621.66 6,069.17 90,275.02 6,870.03
Surface water (general) with TotalDissolvedSolids≤1.000mg/L
80,073.56 1,326.43 95,505.89 953.4 83,612.69 207.696
Rain water with TotalDissolvedSolids≤1.000mg/L
6,000.77 6,000.77 5,115.77 5,115.77 6,662.33 6,662.33
Groundwater (total) with TotalDissolvedSolids≤1.000mg/L
7,872.89 7,548.65 7,340.54 7,046.18 8,633.11 8,313.36
Seawater (total) 0 0 0 0 0 0
Produced water (total) with TotalDissolvedSolids≤1.000mg/L
12.9 0 12.9 0 12.9 0
Third-party water (total) with TotalDissolvedSolids≤1.000mg/L
455.18 154.34 460.37 140.18 475.39 158.62
Total water withdrawal
Surface water (total) + groundwater (total) + seawater (total) + produced water (total) + third-party water (total)
94,415.31 15,030.19 108,435.47 13,255.53 99,396.42 15,342.01
303 Water and effluents
303-3 Water withdrawal
2018 2019 2020
CSNGroup
DVA In millions R$ 11,523.54 8,658.24 12,085.82
Withdrawal in ML all areas/ R$ millions DVA
ML/millions R$ DVA
8.19 12.52 8.22
Withdrawal in ML areas with water stress/ R$ millions DVA
ML/millions R$ DVA
1.30 1.53 1.27
CSN Group
(in megaliters)
202020192018
Total water withdrawal
Total water discharge
94,415.31
108,435.47
99,396.42
76,276.78
90,057.2584,559.17
11 2020 CSN INTEGRATED REPORT | ANNEXES
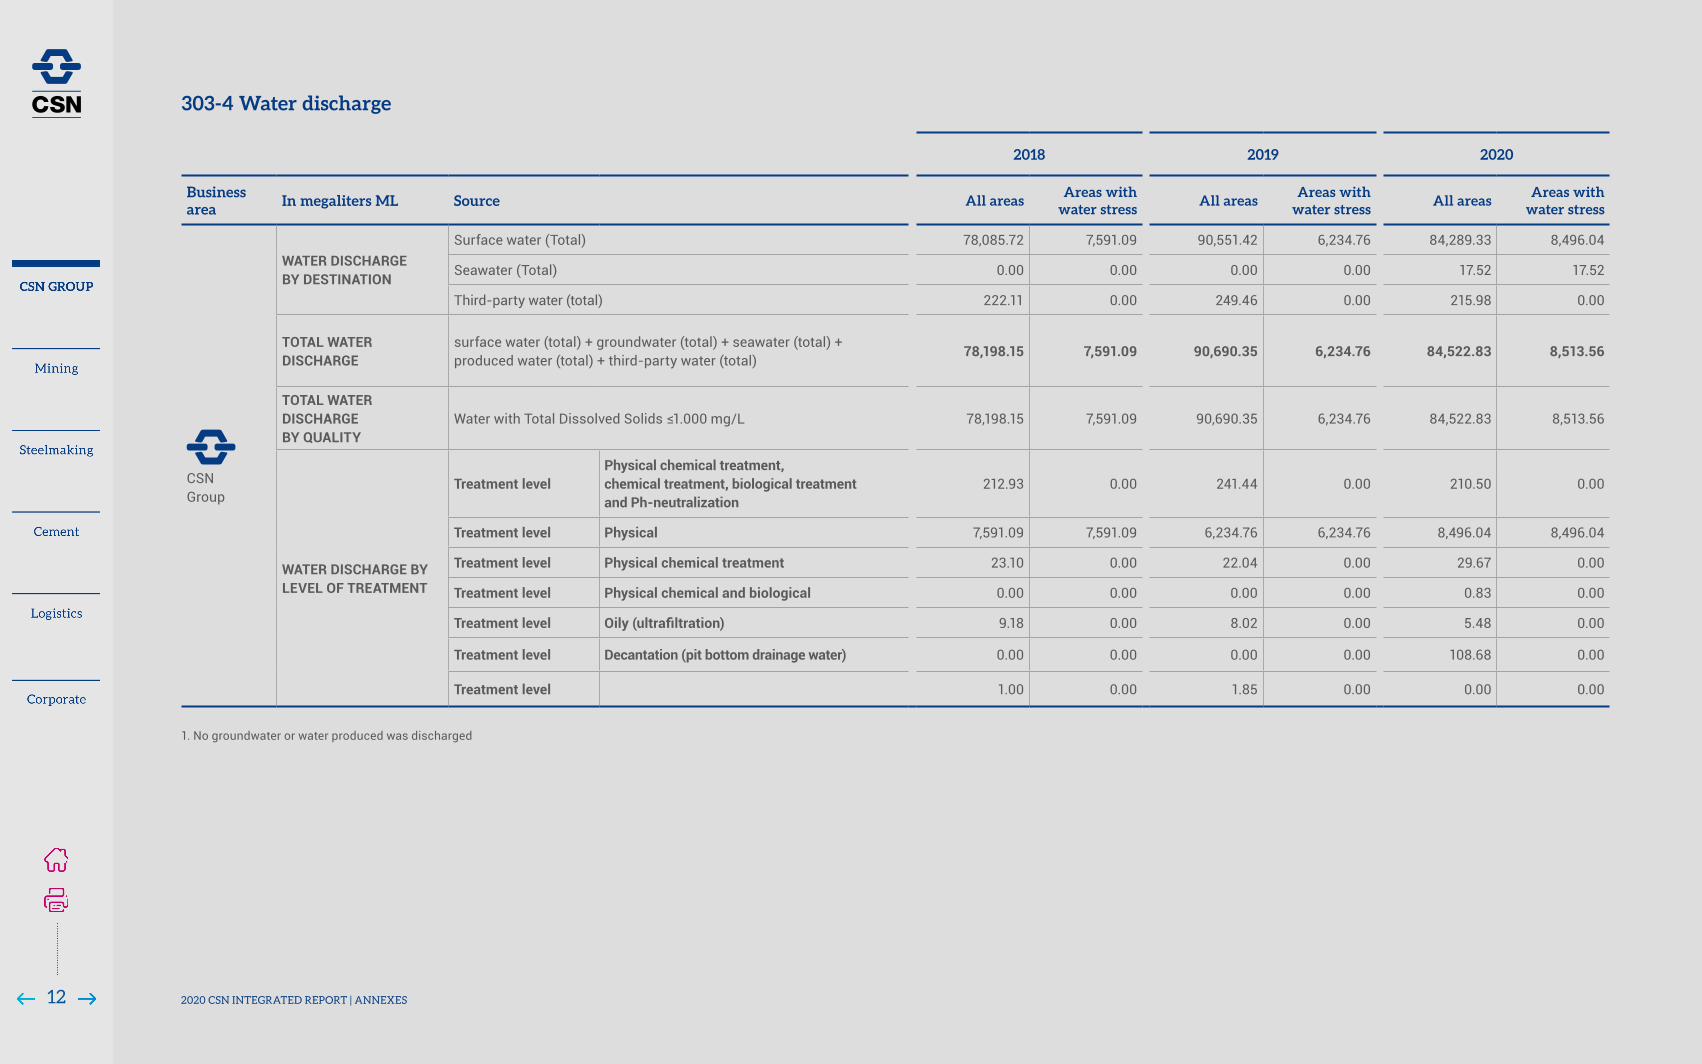
2018 2019 2020
Business area
In megaliters ML Source All areasAreas with
water stressAll areas
Areas with water stress
All areasAreas with
water stress
CSNGroup
WATER DISCHARGE BY DESTINATION
Surface water (Total) 78,085.72 7,591.09 90,551.42 6,234.76 84,289.33 8,496.04
Seawater (Total) 0.00 0.00 0.00 0.00 17.52 17.52
Third-party water (total) 222.11 0.00 249.46 0.00 215.98 0.00
TOTAL WATER DISCHARGE
surface water (total) + groundwater (total) + seawater (total) + produced water (total) + third-party water (total)
78,198.15 7,591.09 90,690.35 6,234.76 84,522.83 8,513.56
TOTAL WATER DISCHARGE BY QUALITY
WaterwithTotalDissolvedSolids≤1.000mg/L 78,198.15 7,591.09 90,690.35 6,234.76 84,522.83 8,513.56
WATER DISCHARGE BY LEVEL OF TREATMENT
Treatment levelPhysical chemical treatment, chemical treatment, biological treatment andPh-neutralization
212.93 0.00 241.44 0.00 210.50 0.00
Treatment level Physical 7,591.09 7,591.09 6,234.76 6,234.76 8,496.04 8,496.04
Treatment level Physical chemical treatment 23.10 0.00 22.04 0.00 29.67 0.00
Treatment level Physical chemical and biological 0.00 0.00 0.00 0.00 0.83 0.00
Treatment level Oily(ultrafiltration) 9.18 0.00 8.02 0.00 5.48 0.00
Treatment level Decantation (pit bottom drainage water) 0.00 0.00 0.00 0.00 108.68 0.00
Treatment level 1.00 0.00 1.85 0.00 0.00 0.00
303-4 Water discharge
1. No groundwater or water produced was discharged
12 2020 CSN INTEGRATED REPORT | ANNEXES

General Flora
Species (flora) CNCFlora
Accara elegans (DC.) Landrum EN
Anemopaegma arvense (Vell.) Stellfeld ex de Souza
EN
Anthurium megapetiolatum EN
Apuleia leiocarpa VU
Araucaria angustifolia EN
Arthrocereus glaziovii EN
Aspilia reticulata VU
Baccharis cf concinna G.M.Barroso VU
Calibrachoa elegans EN
Cedrela fissilis Vell. VU
Cedrela odorata VU
Cinnamomum erythropus EN
Cipocereus minensis (Werderm.) Ritter
VU
Comanthera elegans (Bong.) L.R.Parra & Giul.
EN
Dalbergia nigra VU
Eremanthus elaeagnus (Mart. ex DC.) Sch.Bip.
VU
Esterhazya nanuzae V.C.Souza EN
Euplassa incana VU
Euplassa semicostata EN
Euterpe edulis Mart. VU
Hoffmannseggella ghillanyi (Pabst) H.G.Jones
EN
Lepidaploa spixiana (Mart. ex DC.) H.Rob.
EN
Luxemburgia damazioana Beauverd VU
Lychnophora syncephala EN
Species (fauna)IUCN
CategoryGroup
Coryphaspiza melanotis VU Avifauna
Culicivora caudacuta VU Avifauna
Jacamaralcyon tridactyla VU Avifauna
Microspingus cinereus VU Avifauna
Scytalopus iraiensis EN Avifauna
Spizaetus tyrannus - Avifauna
Hydromedusa maximiliani VU Herpetofauna
Pithecopus ayeaye CR Herpetofauna
Alouatta guariba LC Mastofauna
Chrysocyon brachyurus NT Mastofauna
Herpailurus yagouaroundi LC Mastofauna
Leopardus guttulus VU Mastofauna
Leopardus wiedii NT Mastofauna
Myrmecophaga tridactyla VU Mastofauna
Puma concolor LC Mastofauna
304 - Biodiversity
FLORA GERAL
Species (flora) CNCFlora
Lychnophora tomentosa (Mart. ex DC.) Sch.Bip.
VU
Lychnophora villosissima Mart. EN Melanoxylon brauna VUMikania argyreiae VUMikania glauca ENMikania neurocaula DC. EN Minaria cf. refractifolia VUMinasia alpestris (Gardner) H.Rob. ENOcotea odorifera ENParalychnophora glaziouana Loeuille EN
Pilosocereus aurisetus (Werderm.) Byles & G.D.Rowley
EN
Plinia nana Sobral VU Richterago arenaria (Baker) Roque VURichterago polyphylla (Baker) Ferreyra EN Rudgea jasminoides (Cham.) Müll.Arg. VUSetaria sp.1 P. Beauv. CR Sinningia rupicola ENSmilax lutescens ENSyagrus glaucescens Glaz. ex Becc. VU Symplocos glaberrima Gontsch. EN Uebelmannia pectinifera Buining EN Vellozia cf tillandsioides Mello-Silva CR Vellozia glabra J.C.Mikan EN Vellozia tillandsioides Mello-Silva CRVriesea minarum ENWunderlichia senae Glaz. ex Maguire & G.M.Barroso
EN
Xyris paradisiaca Wand. EN
Zeyheria tuberculosa VU
304-4: IUCN Red List species and national conservation listspecies with habitats in areas affected by operations
Caption (CNCFlora, IUCN and Group):CR - Critically Endangered | EN - Endangered | VU - Vulnerable | NT - Nearly threatened | LC - Safe or Least Concern
13 2020 CSN INTEGRATED REPORT | ANNEXES

Business Area GHG emission intensity index for the organization 2018 2019 2020
CSN Group
DVA (in R$ thousand) R$4,175,804.00 R$1,364,164.00 R$2,893,150.00
tCO2/R$ DVA 0.00343 0.00743 0.00379
Note: For this data were accounted Steel, Other Mining, Cement and Logistics emissions
Note: 1. In 2018/2019’s report, the table on page 197 mentions the disclosure GRI 305-5 Reduction of GHG emissions. However, it refers to the indicators GRI 305-1 Direct (Scope 1) GHG emissions, GRI 305-2 Energy indirect (Scope 2) GHG emissions and GRI 305-3 Other indirect (Scope 3) GHG emissions. 2. The increase in Scope 3 emissions is related to the improvement on the accounting methodology and management of the company’s data.
Business Area Emissions by scope (tCO2e) 2018 2019 2020
CSN Group
Scope 1 14,152,160.14 10,095,344.67 10,880,903.96
Scope 2 170,303.67 47,074.90 73,963.53
Scope 3 721,890.89 1,037,484.42 40,771,035.58
305 - Emissions305-1 - Direct (Scope 1) GHG emissions 305-2 - Energy indirect (Scope 2) GHG emissions 305-3 - Other indirect (Scope 3) GHG emissions
305-4 - GHG emissions intensity
14 2020 CSN INTEGRATED REPORT | ANNEXES

Significant specific air emissions volume recorded by steelmaking and Cement plant at UPV
Specific emissions Category Source Unit 2018 2019 2020
CO 24 chimneys - isokinetic monitoring 03 chimneys - continuous monitoring
t/year - 521.46 790.21
NOX (excluding N2O)24 chimneys - isokinetic monitoring 03 chimneys - continuous monitoring Furnace I and II
t/year 4,460.00 4,796.99 5,797.05
SOX11 chimneys - isokinetic monitoring 03 chimneys - continuous monitoring Furnace I and II
t/year 6,279.17 4,416.50 5,394.32
Particulates (MP)
52 chimneys - isokinetic monitoring 38 chimneys - continuous monitoring Arcos Cements: Furnace 01 /Furnace 02/Cement Mill 01/Cement Mill 02/Petcoke Mill 1/Petcoke Mill 2 Volta Redonda Cements: Cement Mill 01/Cement Mill 02/Packing 01/Packing 02
t/year 2,954.07 3,162.77 4,051.78
Volatile Organic Compounds (VOCs)After 2019: 16 chimneys – isokinetic monitoring (THC) Up to 2018: 08 chimneys – isokinetic monitoring (BTEX) Furnace I and II
t/year 41.09 18.59 40.43
Polycyclic Aromatic Hydrocarbon (PAHs) Furnace I and II t/year 7.86 6.87 14.40
Note: Emission data for UPV, VR and Arcos.
305-7 - Nitrogen oxides (NOx), sulfur oxides (SOx), and other significant air emissions
15 2020 CSN INTEGRATED REPORT | ANNEXES

Total weight of waste by composition of the waste
Unit 2018 2019 2020
Hazardouswaste t 36,157 29,512 24,038
Slag t - - 517
Thin and powder t - - 3,013
Sludge t - - 3,809
Other waste t 10,536 4,526 16,699
Non-hazardouswaste t 3,656,801 2,908,186 3,742,232
Slag t - - 2,080,481
Thin and powders t - - 759,440
Metal scrap t - - 432,366
Sludge t - - 145,987
Mill scale t - - 69,010
Petroleum sludge t - - 1,987
Other waste t 47,242 83,368 252,961
Total waste t 3,692,958 2,937,698 3,766,270
DVA In million R$ 11,524 8,658 12,086
Hazardouswaste(t)/R$millionDVA t/millionR$DVA 3.14 3.41 1.99
Non-Hazardouswaste(t)/ R$ million DVA
t/millionR$DVA 317 336 310
Totalwaste(t)/R$millionDVA t/millionR$DVA 320 339 312
Miningwaste(t)/R$millionDVA t/millionR$DVA 1,329 3,913 2,350
306 Waste
306-3 Waste generated
CompanyNotice of Infraction
Date of Issue
Restated fine amount
Root cause Status
Notice Of Infraction with Fine ≥1mm Notices + Embargoes
CMIN 1095/2019 11/02/19 R$ 2,464,973.29Non-compliance with requirements
Infraction notice canceled by the Municipal Environment Department of Congonhas/MG
CMIN 1131/2019 24/04/19 R$ 2,190,000.00Non-compliance with requirements
Awaiting administrative defense analysis
CMIN 1220/2019 26/09/19 R$ 1,095,000.00 Water pollutionAwaiting administrative defense analysis
CMIN 1361/2020 17/07/20 R$ 2,190,000.00 Air pollutionAwaiting administrative defense analysis
MIPE 132789/2019 18/04/19Activities related to B2A Damn were suspended
Dam without Stability Condition Statement (DCE)
Structure is non-operational, Activities exclusively aimed at decharacterization of the structure are being performed in the site. Information forwarded to the environmental agency
PRADA 11093912 03/07/19 WarningNon-compliance with the permit
Awaiting administrative defense analysis
SEPETIBA TECON
CILAMNOT 01108304
26/06/19Embargoes to the activities
Non-compliance with the permit
Discussion in court
307 Environmental Compliance 307-1 Non-compliance with environmental laws and regulations
16 2020 CSN INTEGRATED REPORT | ANNEXES

2018 2019 2020
Business area
Age range compiled Women Men Women Men Women Men
CSNGroup
<30 years old 320 1,151 434 1,629 122 637
> 50 years old 5 88 12 130 9 31
30 to 50 years old 260 1,178 447 1,691 115 584
401 - Employment 401: New employee hires and employee turnover
a. Total number and rate of new employee hires during the reporting period, by age group, gender and region
TURNOVER
2018 2019 2020
Business area
RegionAge range compiled Women Men Women Men Women Men
CSNGroup
Midwest <30 years old 0.00% 200.00% 0.00% 70.83% 0.00% 0.00%
Midwest >50 years old 0.00% 0.00% 0.00% 66.67% 0.00% 0.00%
Midwest30 to 50 years old 50.00% 88.46% 62.50% 41.67% 0.00% 0.00%
Northeast <30 years old 21.11% 49.34% 41.46% 40.73% 46.57% 31.70%
Northeast >50 years old 16.67% 6.25% 5.56% 8.21% 18.75% 26.35%
Northeast30 to 50 years old 22.40% 19.45% 29.62% 29.04% 118.18% 38.20%
North <30 years old 35.71% 17.86% 27.78% 26.79% 62.50% 16.15%
North >50 years old 0.00% 7.78% 0.00% 4.17% 0.00% 8.89%
North30 to 50 years old 20.00% 15.25% 12.50% 14.10% 22.73% 17.25%
Southeast <30 years old 106.32% 101.23% 104.21% 106.55% 65.44% 76.48%
Southeast >50 years old 34.69% 53.98% 56.28% 67.12% 61.20% 53.67%
Southeast30 to 50 years old 14.80% 57.24% 89.78% 67.28% 59.83% 52.17%
South <30 years old 21.43% 17.69% 15.91% 66.90% 8.33% 12.29%
South >50 years old 0.00% 10.42% 20.00% 15.38% 8.33% 6.00%
South30 to 50 years old 8.24% 11.97% 12.66% 11.29% 9.74% 6.10%
b. Total number and rate of employee turnover during the reporting period, by age group, gender and region
17 2020 CSN INTEGRATED REPORT | ANNEXES
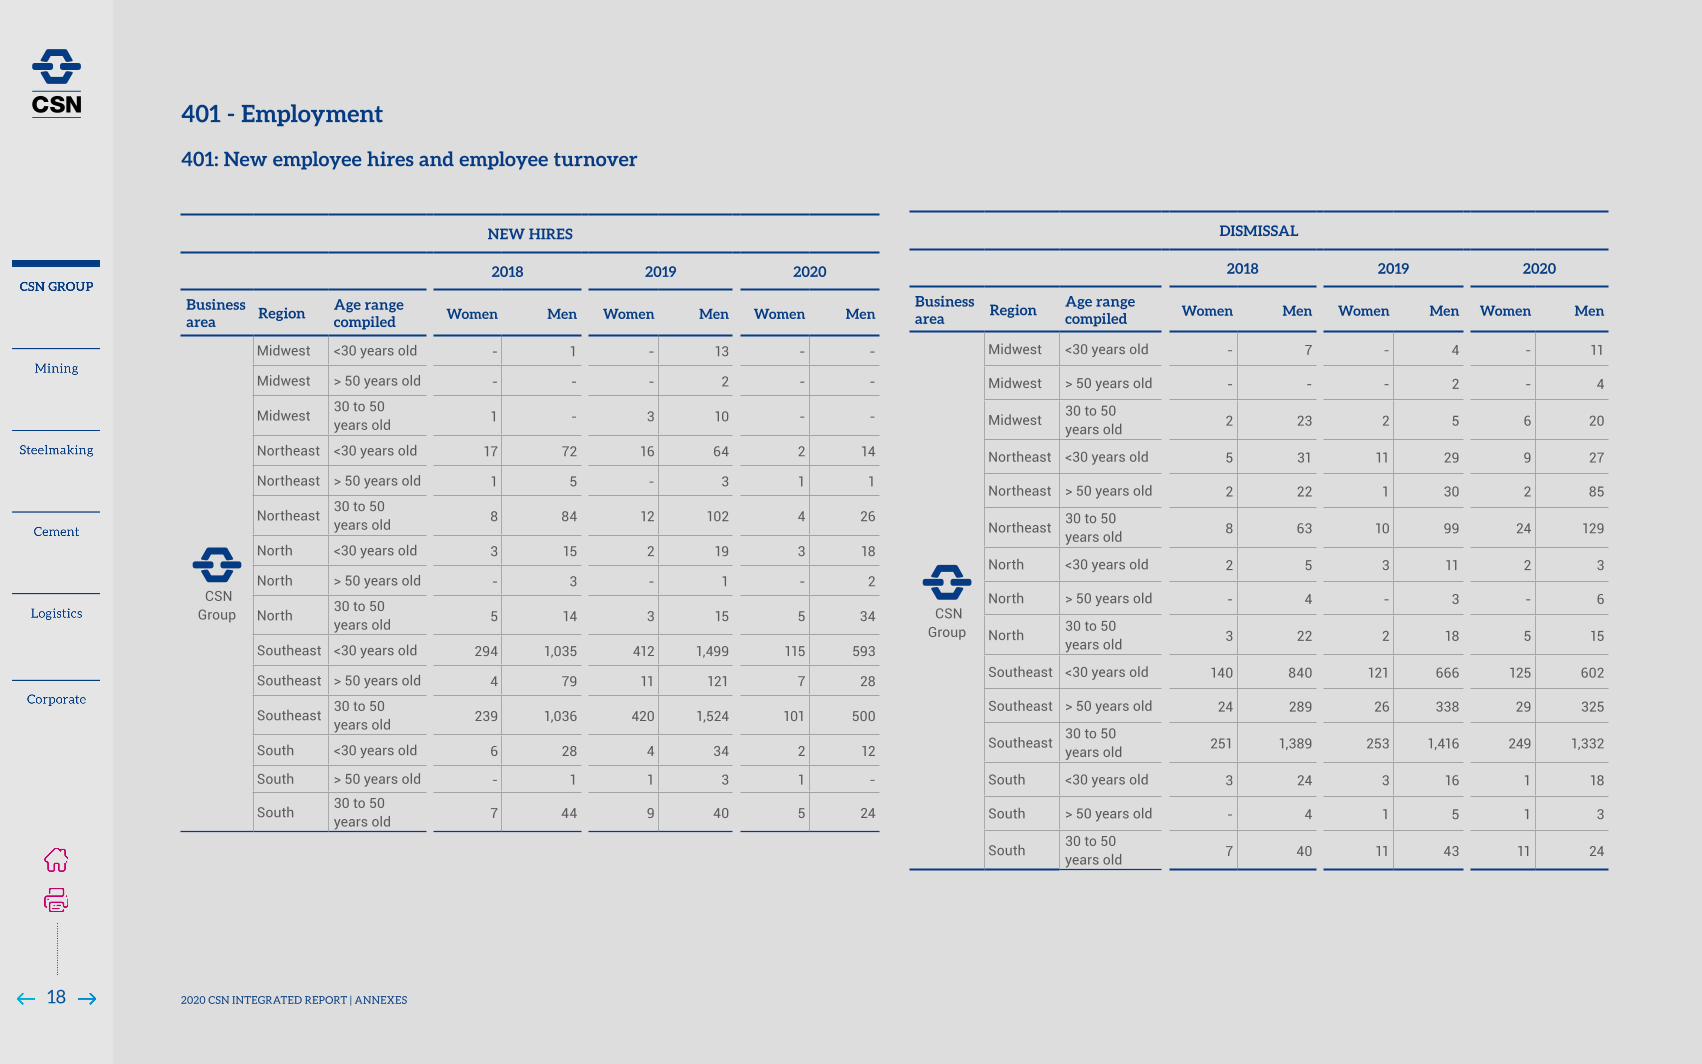
NEW HIRES
2018 2019 2020
Business area
RegionAge range compiled Women Men Women Men Women Men
CSNGroup
Midwest <30 years old - 1 - 13 - -
Midwest > 50 years old - - - 2 - -
Midwest30 to 50 years old 1 - 3 10 - -
Northeast <30 years old 17 72 16 64 2 14
Northeast > 50 years old 1 5 - 3 1 1
Northeast30 to 50 years old 8 84 12 102 4 26
North <30 years old 3 15 2 19 3 18
North > 50 years old - 3 - 1 - 2
North30 to 50 years old 5 14 3 15 5 34
Southeast <30 years old 294 1,035 412 1,499 115 593
Southeast > 50 years old 4 79 11 121 7 28
Southeast30 to 50 years old 239 1,036 420 1,524 101 500
South <30 years old 6 28 4 34 2 12
South > 50 years old - 1 1 3 1 -
South30 to 50 years old 7 44 9 40 5 24
DISMISSAL
2018 2019 2020
Business area
RegionAge range compiled Women Men Women Men Women Men
CSNGroup
Midwest <30 years old - 7 - 4 - 11
Midwest > 50 years old - - - 2 - 4
Midwest30 to 50 years old 2 23 2 5 6 20
Northeast <30 years old 5 31 11 29 9 27
Northeast > 50 years old 2 22 1 30 2 85
Northeast30 to 50 years old 8 63 10 99 24 129
North <30 years old 2 5 3 11 2 3
North > 50 years old - 4 - 3 - 6
North30 to 50 years old 3 22 2 18 5 15
Southeast <30 years old 140 840 121 666 125 602
Southeast > 50 years old 24 289 26 338 29 325
Southeast30 to 50 years old 251 1,389 253 1,416 249 1,332
South <30 years old 3 24 3 16 1 18
South > 50 years old - 4 1 5 1 3
South30 to 50 years old 7 40 11 43 11 24
401 - Employment 401: New employee hires and employee turnover
18 2020 CSN INTEGRATED REPORT | ANNEXES

TOTAL WORKFORCE
2018 2019 2020
Business area
RegionAge range compiled Women Men Women Men Women Men
CSNGroup
Midwest <30 years old - 2 - 12 - -
Midwest > 50 years old - 2 - 3 - -
Midwest30 to 50 years old 3 13 4 18 - -
Northeast <30 years old 50 211 53 217 37 170
Northeast > 50 years old 9 208 9 209 8 153
Northeast30 to 50 years old 71 700 75 716 59 612
North <30 years old 7 56 9 56 4 65
North > 50 years old - 45 1 48 2 45
North30 to 50 years old 20 118 20 117 22 142
Southeast <30 years old 1,001 5,488 1,194 5,598 1,020 4,838
Southeast > 50 years old 97 1,643 101 1,780 117 1,791
Southeast30 to 50 years old 1,609 11,687 1,854 12,110 1,813 11,643
South <30 years old 22 149 22 144 20 120
South > 50 years old 5 25 6 28 6 28
South30 to 50 years old 90 368 85 380 81 400
2018 2019 2020
Business area Women Men Women Men Women Men
CSN Group
3,369 21,190 2,884 16,076 3,889 22,078
2018 2019 2020
Business area Women Men Women Men Women Men
CSN Group
154 868 156 831 165 778
2018 2019 2020
Business area Women Men Women Men Women Men
CSN Group
116 760 112 752 157 731
401-3 Parental leave
401-3 a. Total number of employees that were entitled to parental leave, by gender
401-3 b. Total number of employees that took parental leave, by gender
401-3 c. Total number of employees that returned to work in the reporting period after parental leave ended, by gender
401 - Employment 401: New employee hires and employee turnover
19 2020 CSN INTEGRATED REPORT | ANNEXES
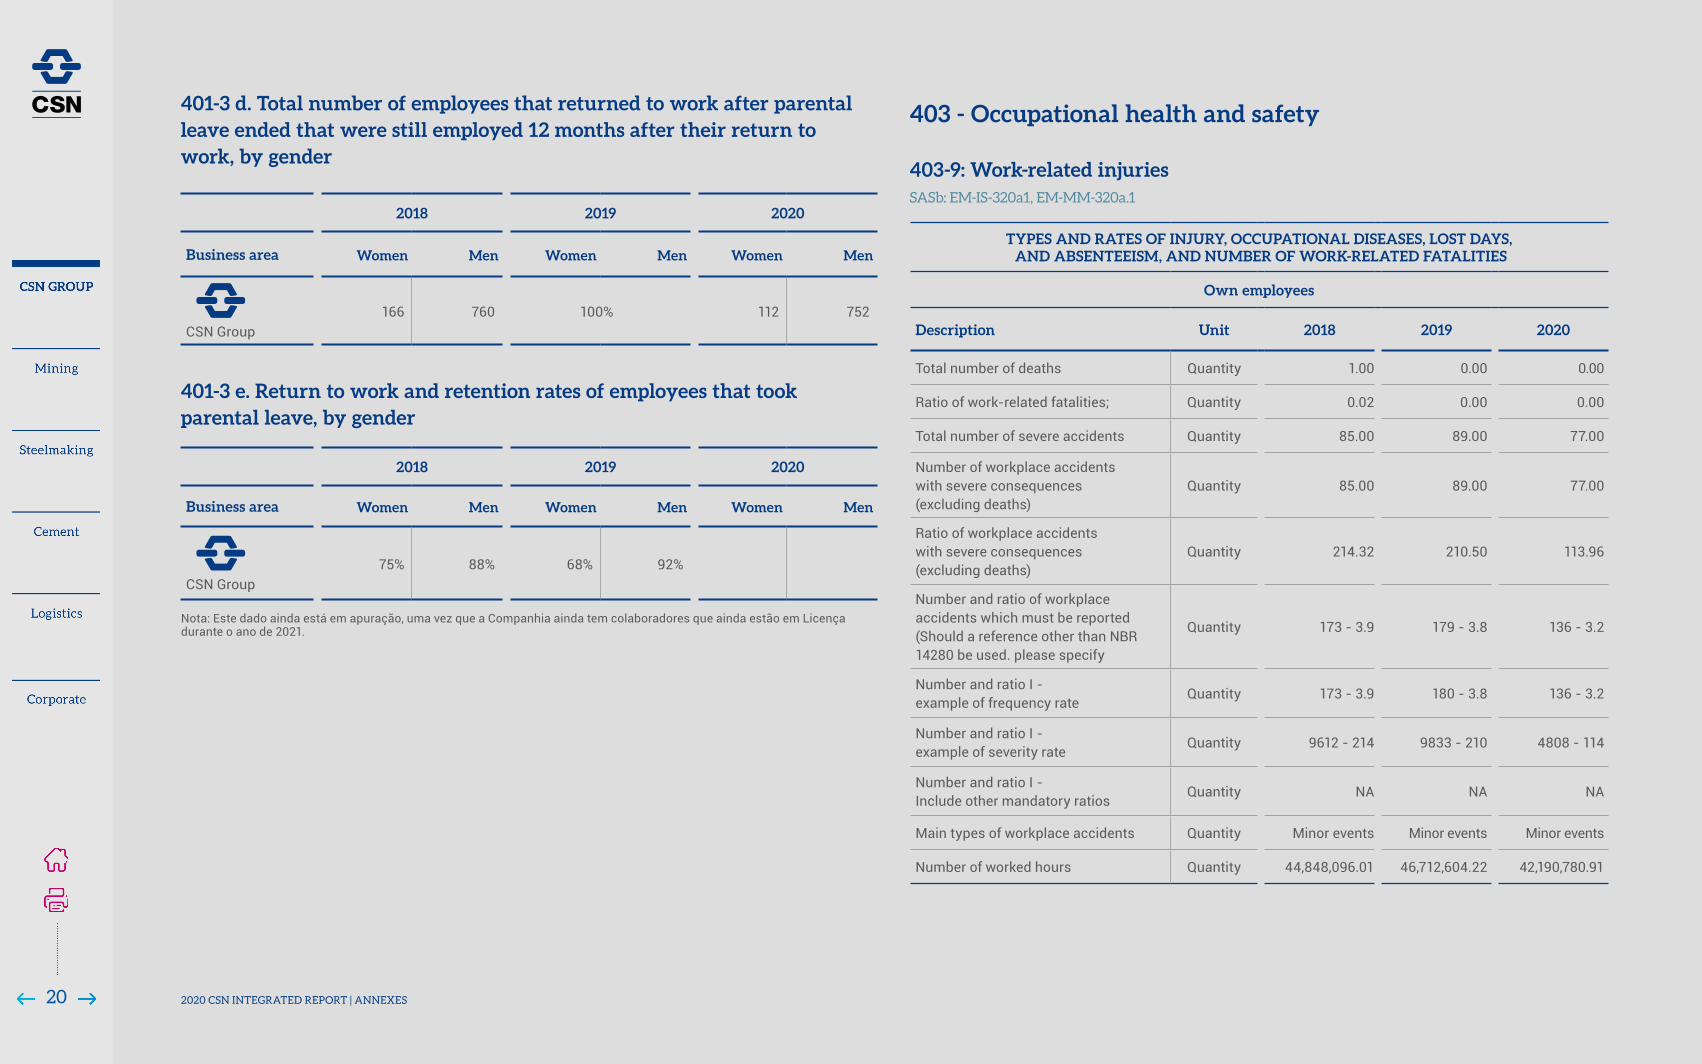
2018 2019 2020
Business area Women Men Women Men Women Men
CSN Group
166 760 100% 112 752
2018 2019 2020
Business area Women Men Women Men Women Men
CSN Group
75% 88% 68% 92%
401-3 d. Total number of employees that returned to work after parental leave ended that were still employed 12 months after their return to work, by gender
401-3 e. Return to work and retention rates of employees that took parental leave, by gender
Nota: Este dado ainda está em apuração, uma vez que a Companhia ainda tem colaboradores que ainda estão em Licença durante o ano de 2021.
TYPES AND RATES OF INJURY, OCCUPATIONAL DISEASES, LOST DAYS, AND ABSENTEEISM, AND NUMBER OF WORK-RELATED FATALITIES
Own employees
Description Unit 2018 2019 2020
Total number of deaths Quantity 1.00 0.00 0.00
Ratio of work-related fatalities; Quantity 0.02 0.00 0.00
Total number of severe accidents Quantity 85.00 89.00 77.00
Number of workplace accidents with severe consequences (excluding deaths)
Quantity 85.00 89.00 77.00
Ratio of workplace accidents with severe consequences (excluding deaths)
Quantity 214.32 210.50 113.96
Number and ratio of workplace accidents which must be reported (Should a reference other than NBR 14280 be used. please specify
Quantity 173 - 3.9 179 - 3.8 136 - 3.2
Number and ratio I - example of frequency rate
Quantity 173 - 3.9 180 - 3.8 136 - 3.2
Number and ratio I - example of severity rate
Quantity 9612 - 214 9833 - 210 4808 - 114
Number and ratio I - Include other mandatory ratios
Quantity NA NA NA
Main types of workplace accidents Quantity Minor events Minor events Minor events
Number of worked hours Quantity 44,848,096.01 46,712,604.22 42,190,780.91
403 - Occupational health and safety 403-9: Work-related injuries SASb: EM-IS-320a1, EM-MM-320a.1
20 2020 CSN INTEGRATED REPORT | ANNEXES

TYPES AND RATES OF INJURY, OCCUPATIONAL DISEASES, LOST DAYS, AND ABSENTEEISM, AND NUMBER OF WORK-RELATED FATALITIES
Workers who are not employees but whose work and/or workplace is controlled by the organization
Description Unit 2018 2019 2020
Total number of deaths Quantity 0 0 1
Ratio of work-related fatalities; Quantity 0 0 0.04
Total number of severe accidents Quantity 18 28.00 21.00
Number of workplace accidents with severe consequences (excluding deaths)
Quantity 18 28.00 21.00
Ratio of workplace accidents with severe consequences (excluding deaths)
Quantity 0.76 0.88 0.74
Number and ratio of workplace accidents which must be reported (Should a reference other than NBR 14280 be used. please specify
Quantity 35 - 1.5 52 - 1.6 36 - 1.3
Number and ratio I - example of frequency rate Quantity 35 - 1.5 52 - 1.6 36 - 1.3
Number and ratio I - example of severity rate Quantity 562 - 24 1538 - 49 6650 - 236
Number and ratio I - Include other mandatory ratios Quantity NA NA NA
Main types of workplace accidents Quantity Minor events Minor events Minor events
Number of worked hours Quantity 23,635,792.57 31,666,197.30 28,191,914.57
403 - Occupational health and safety 403-9: Work-related injuries SASb: EM-IS-320a1, EM-MM-320a.1
21 2020 CSN INTEGRATED REPORT | ANNEXES
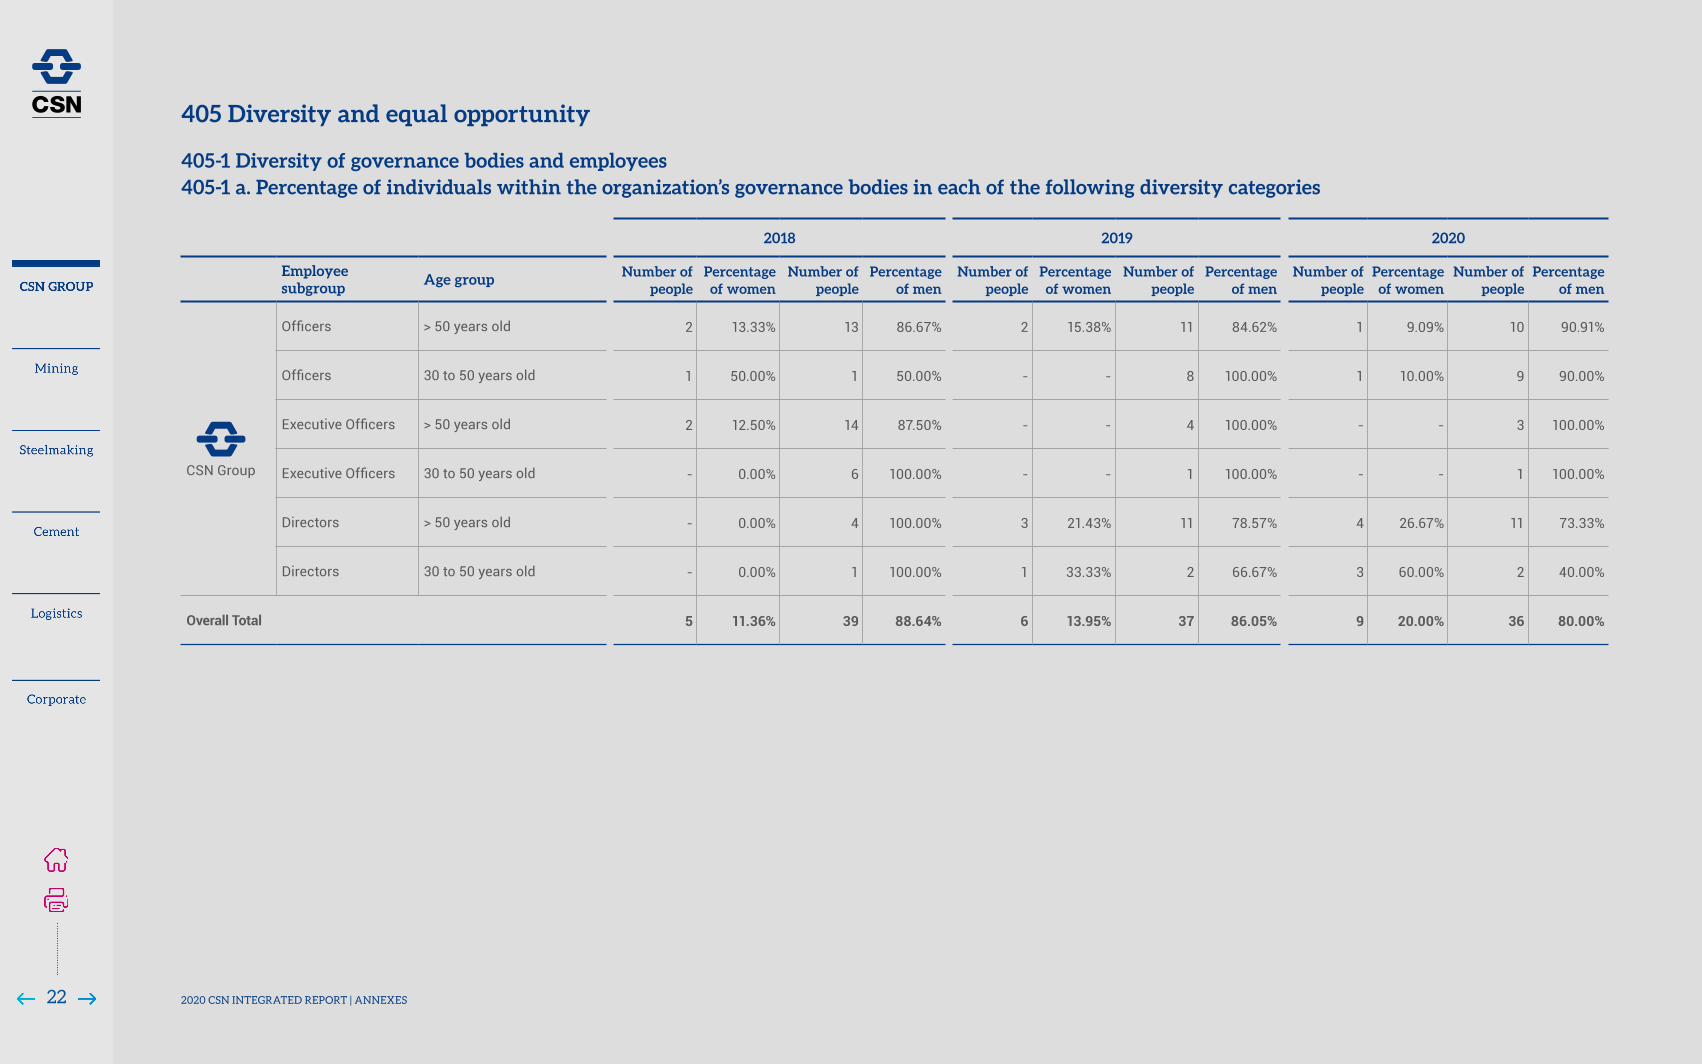
405 Diversity and equal opportunity
405-1 Diversity of governance bodies and employees 405-1 a. Percentage of individuals within the organization’s governance bodies in each of the following diversity categories 2018 2019 2020
Employee subgroup
Age group Number of people
Percentage of women
Number of people
Percentage of men
Number of people
Percentage of women
Number of people
Percentage of men
Number of people
Percentage of women
Number of people
Percentage of men
CSN Group
Officers > 50 years old 2 13.33% 13 86.67% 2 15.38% 11 84.62% 1 9.09% 10 90.91%
Officers 30 to 50 years old 1 50.00% 1 50.00% - - 8 100.00% 1 10.00% 9 90.00%
ExecutiveOfficers > 50 years old 2 12.50% 14 87.50% - - 4 100.00% - - 3 100.00%
ExecutiveOfficers 30 to 50 years old - 0.00% 6 100.00% - - 1 100.00% - - 1 100.00%
Directors > 50 years old - 0.00% 4 100.00% 3 21.43% 11 78.57% 4 26.67% 11 73.33%
Directors 30 to 50 years old - 0.00% 1 100.00% 1 33.33% 2 66.67% 3 60.00% 2 40.00%
Overall Total 5 11.36% 39 88.64% 6 13.95% 37 86.05% 9 20.00% 36 80.00%
22 2020 CSN INTEGRATED REPORT | ANNEXES

405-1 b. Percentage of employees per employee category in each of the following diversity categories
2018 2019 2020
Employee subgroup
Age group Number of people
Percentage of women
Number of people
Percentage of men
Number of people
Percentage of women
Number of people
Percentage of men
Number of people
Percentage of women
Number of people
Percentage of men
CSN Group
Administrative
<30 years old 142 62.83% 84 37.17% 172 59.31% 118 40.69% 131 55.98% 103 44.02%
> 50 years old 10 25.00% 30 75.00% 15 30.00% 35 70.00% 16 31.37% 35 68.63%
30 to 50 years old 152 57.14% 114 42.86% 178 53.29% 156 46.71% 158 50.64% 154 49.36%
Senior management
<30 years old - - - - - - - - - - - -
> 50 years old 2 6.90% 27 93.10% 1 3.70% 26 96.30% 1 3.70% 26 96.30%
30 to 50 years old 4 9.76% 37 90.24% 4 9.52% 38 90.48% 4 10.26% 35 89.74%
Apprentices from Capacitar
<30 years old 75 43.35% 98 56.65% 42 46.67% 48 53.33% 11 57.89% 8 42.11%
> 50 years old - - - - - - - - - - - -
30 to 50 years old 40 67.80% 19 32.20% 51 83.61% 10 16.39% 21 95.45% 1 4.55%
Coordinators
<30 years old 1 33.33% 2 66.67% 1 33.33% 2 66.67% - - 1 100.00%
> 50 years old 2 4.76% 40 95.24% 2 4.88% 39 95.12% 2 5.88% 32 94.12%
30 to 50 years old 42 22.11% 148 77.89% 47 24.48% 145 75.52% 51 26.84% 139 73.16%
CEO
<30 years old - - - - - - - - - - - -
> 50 years old - 0% 1 100.00% - - 1 100.00% - - 1 100.00%
30 to 50 years old - - - - - - - - - - - -
Officers
<30 years old - - - - - - - - - - - -
> 50 years old 1 7.69% 12 92.31% 2 15.38% 11 84.62% 1 9.09% 10 90.91%
30 to 50 years old 1 11.11% 8 88.89% - - 8 100.00% 1 10.00% 9 90.00%
ExecutiveOfficers
<30 years old - - 2 - - - - - - - - -
> 50 years old - - 3 - - - 4 100.00% - - 3 100.00%
30 to 50 years old - - - - - - 1 100.00% - - 1 100.00%
Engineering specialists
<30 years old - - 2 - 1 50.00% 1 50.00% - - - -
> 50 years old 2 4.76% 40 95.24% 3 6.25% 45 93.75% 4 8.00% 46 92.00%
30 to 50 years old 16 10.46% 137 89.54% 16 11.03% 129 88.97% 20 14.60% 117 85.40%
23 2020 CSN INTEGRATED REPORT | ANNEXES
2018 2019 2020
Employee subgroup
Age group Number of people
Percentage of women
Number of people
Percentage of men
Number of people
Percentage of women
Number of people
Percentage of men
Number of people
Percentage of women
Number of people
Percentage of men
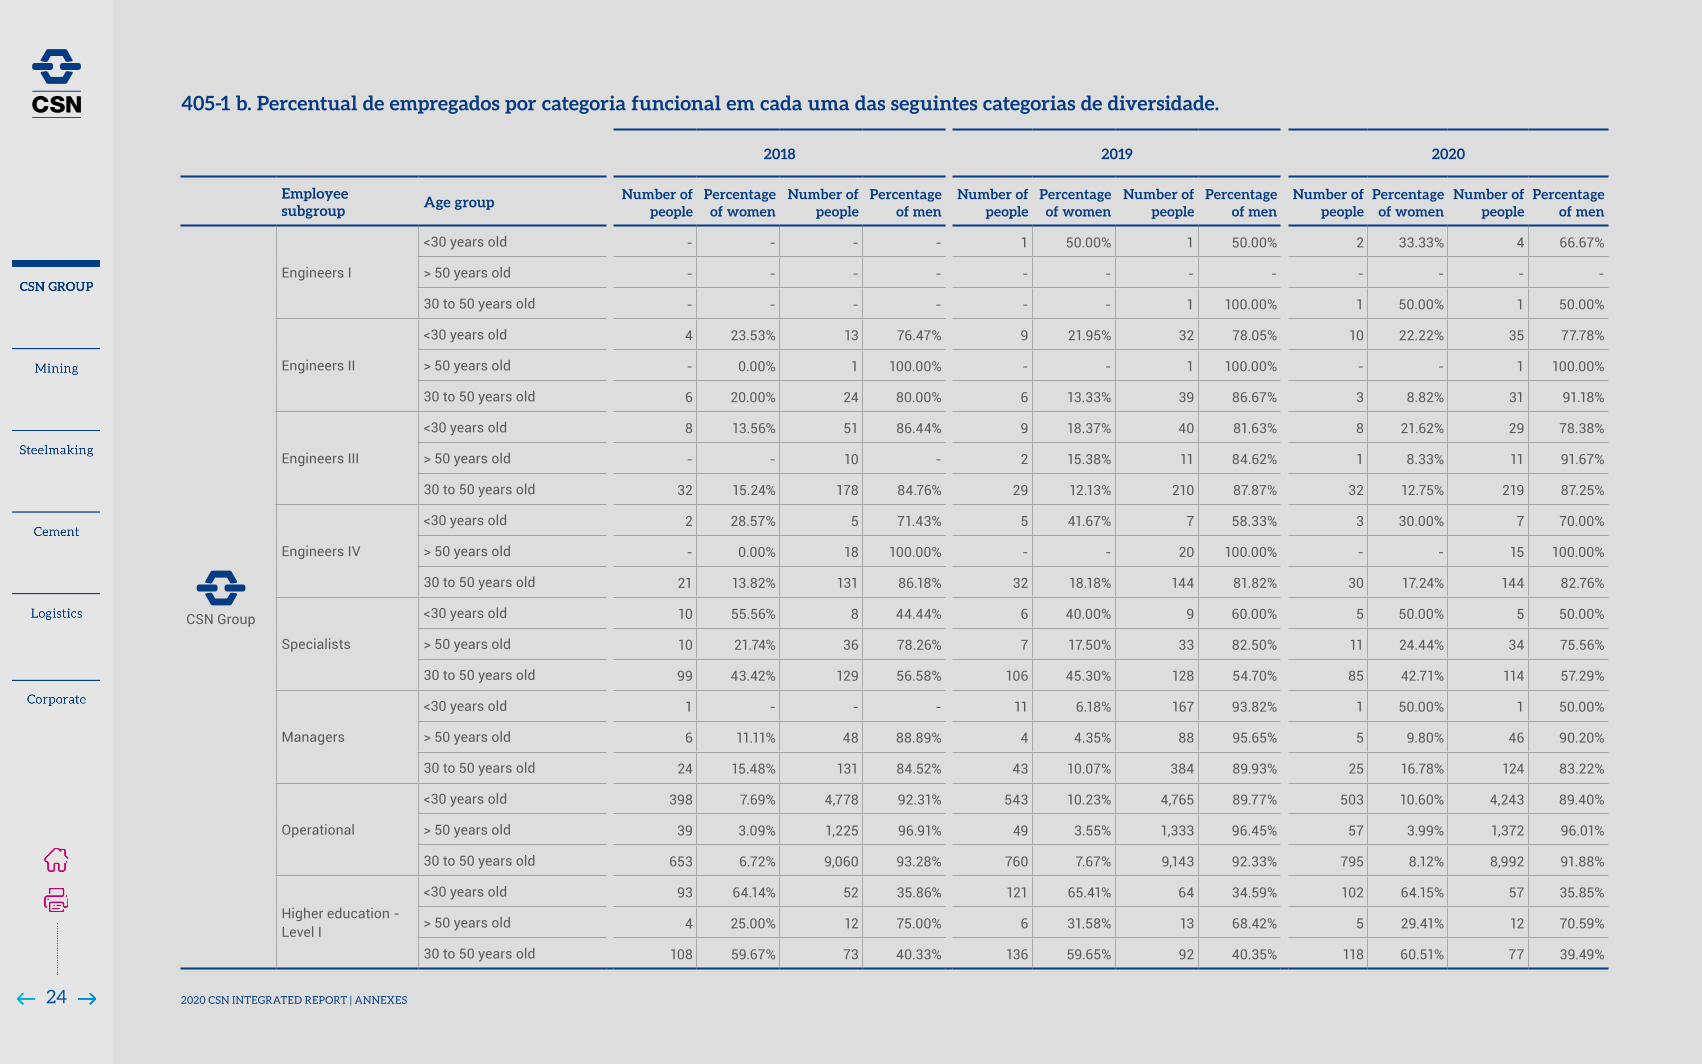
CSN Group
Engineers I
<30 years old - - - - 1 50.00% 1 50.00% 2 33.33% 4 66.67%
> 50 years old - - - - - - - - - - - -
30 to 50 years old - - - - - - 1 100.00% 1 50.00% 1 50.00%
Engineers II
<30 years old 4 23.53% 13 76.47% 9 21.95% 32 78.05% 10 22.22% 35 77.78%
> 50 years old - 0.00% 1 100.00% - - 1 100.00% - - 1 100.00%
30 to 50 years old 6 20.00% 24 80.00% 6 13.33% 39 86.67% 3 8.82% 31 91.18%
Engineers III
<30 years old 8 13.56% 51 86.44% 9 18.37% 40 81.63% 8 21.62% 29 78.38%
> 50 years old - - 10 - 2 15.38% 11 84.62% 1 8.33% 11 91.67%
30 to 50 years old 32 15.24% 178 84.76% 29 12.13% 210 87.87% 32 12.75% 219 87.25%
Engineers IV
<30 years old 2 28.57% 5 71.43% 5 41.67% 7 58.33% 3 30.00% 7 70.00%
> 50 years old - 0.00% 18 100.00% - - 20 100.00% - - 15 100.00%
30 to 50 years old 21 13.82% 131 86.18% 32 18.18% 144 81.82% 30 17.24% 144 82.76%
Specialists
<30 years old 10 55.56% 8 44.44% 6 40.00% 9 60.00% 5 50.00% 5 50.00%
> 50 years old 10 21.74% 36 78.26% 7 17.50% 33 82.50% 11 24.44% 34 75.56%
30 to 50 years old 99 43.42% 129 56.58% 106 45.30% 128 54.70% 85 42.71% 114 57.29%
Managers
<30 years old 1 - - - 11 6.18% 167 93.82% 1 50.00% 1 50.00%
> 50 years old 6 11.11% 48 88.89% 4 4.35% 88 95.65% 5 9.80% 46 90.20%
30 to 50 years old 24 15.48% 131 84.52% 43 10.07% 384 89.93% 25 16.78% 124 83.22%
Operational
<30 years old 398 7.69% 4,778 92.31% 543 10.23% 4,765 89.77% 503 10.60% 4,243 89.40%
> 50 years old 39 3.09% 1,225 96.91% 49 3.55% 1,333 96.45% 57 3.99% 1,372 96.01%
30 to 50 years old 653 6.72% 9,060 93.28% 760 7.67% 9,143 92.33% 795 8.12% 8,992 91.88%
Higher education - Level I
<30 years old 93 64.14% 52 35.86% 121 65.41% 64 34.59% 102 64.15% 57 35.85%
> 50 years old 4 25.00% 12 75.00% 6 31.58% 13 68.42% 5 29.41% 12 70.59%
30 to 50 years old 108 59.67% 73 40.33% 136 59.65% 92 40.35% 118 60.51% 77 39.49%
405-1 b. Percentual de empregados por categoria funcional em cada uma das seguintes categorias de diversidade.
24 2020 CSN INTEGRATED REPORT | ANNEXES

2018 2019 2020
Employee subgroup
Age group Number of people
Percentage of women
Number of people
Percentage of men
Number of people
Percentage of women
Number of people
Percentage of men
Number of people
Percentage of women
Number of people
Percentage of men
CSN Group
Higher education - Level II
<30 years old 35 46.67% 40 53.33% 43 56.58% 33 43.42% 48 60.76% 31 39.24%
> 50 years old 7 31.82% 15 68.18% 7 24.14% 22 75.86% 5 31.25% 11 68.75%
30 to 50 years old 93 50.54% 91 49.46% 97 46.41% 112 53.59% 128 51.41% 121 48.59%
Higher education - Level III
<30 years old 28 59.57% 19 40.43% 29 61.70% 18 38.30% 13 54.17% 11 45.83%
> 50 years old 10 25.00% 30 75.00% 10 27.03% 27 72.97% 10 28.57% 25 71.43%
30 to 50 years old 114 48.31% 122 51.69% 116 50.22% 115 49.78% 63 42.00% 87 58.00%
Higher education - Level IV
<30 years old 10 37.04% 17 62.96% 12 42.86% 16 57.14% 14 53.85% 12 46.15%
> 50 years old 4 18.18% 18 81.82% 3 17.65% 14 82.35% 3 20.00% 12 80.00%
30 to 50 years old 92 41.82% 128 58.18% 93 38.11% 151 61.89% 94 47.00% 106 53.00%
Supervisors
<30 years old 9 20.00% 36 0.8 11 25.58% 32 74.42% 9 25.71% 26 74.29%
> 50 years old 3 3.13% 93 96.88% 2 2.15% 91 97.85% 2 2.30% 85 97.70%
30 to 50 years old 19 3.77% 485 96.23% 19 3.77% 485 96.23% 21 4.15% 485 95.85%
Technicians
<30 years old 264 27.36% 701 72.64% 254 27.55% 668 72.45% 219 26.10% 620 73.90%
> 50 years old 11 4.01% 263 95.99% 8 3.09% 251 96.91% 10 4.00% 240 96.00%
30 to 50 years old 277 12.90% 1,870 87.10% 311 14.19% 1,881 85.81% 325 15.01% 1,840 84.99%
Trainees
<30 years old - - - - 5 62.50% 3 37.50% 2 100.00% - -
> 50 years old - - - - - - - - - - - -
30 to 50 years old - - - - - - - - - - - -
405-1 b. Percentual de empregados por categoria funcional em cada uma das seguintes categorias de diversidade.
25 2020 CSN INTEGRATED REPORT | ANNEXES

Energy efficiency (GJ/normalization factor)
2018 2019 2020
GJ/crude steel ton (1) 26.70 28.00 23.02
KWh/cement ton (2) 80.64 86.61 85.96
Mj/clinker ton (3) 3,502.09 3,584.72 3,269.42
Notes: 1. Calculated according to the World Steel Association methodology – Scope 1 2. Calculated according to the Global Cement and Concrete Association methodology – Scope 2 3. Calculated according to the Global Cement and Concrete Association methodology – Scope 1 4. Calculated according to Combustech system’s thermal energy consumption methodology
UNCTAD Performance Assessment
2018 2019 2020
B,1 – Sustainable water use
B,1,1 – Water reuse and recycling UPV 94.00% 92.90% 93.60%
B,1,1 – Water reuse and recycling CSN Mineração 78.6% 84.9% 86.6%
B,1,2–Wateruseefficiency(Megaliters)CSN’stotalcatchment 89,057 102,713 99,396
B,1,2–Wateruseefficiency(Megaliters/DVAR$)CSNTotal 0.00751 0.0131 0.00822
B,1,2–Wateruseefficiency(Megaliters/tonofproducedsteel)UPV
0.01979 0.02565 0.02214
B,1,2–Wateruseefficiency(Megaliters/tonofproducedironore) CSN Mineração
0.000311 0.000202 0.000690
B,1,2–Wateruseefficiency(Megaliters/tonofproducedcement) CSN Cimentos (Arcos and Volta Redonda)
0.000261 0.000224 0.000063
26 2020 CSN INTEGRATED REPORT | ANNEXES
MINING

2020
Minimum basic wage
Entry level wage
Ratio with entry level wage
Line labels Average
basic wage Men
Number of people
Average basic wage
Women
Number of people
Men Women
MINING 1,126.29 8 1,048.60 19 1.08 1.00
2019
Minimum basic wage
Entry level wage
Ratio with entry level wage
Line labels Average
basic wage Men
Number of people
Average basic wage
Women
Number of people
Men Women
MINING 1,126.29 8 1,048.60 19 1.13 1.05
102 - General Disclosures: Organizational profile
202 Market presence
204 Procurement practices
We have a total of 1,378 Mining suppliers, the national ones are located mostly in the following states, MG (63.84%), RJ (9.33%) and SP (5.07%). Our international suppliers represent 20.29%. Most Mining suppliers offer materials (59.96%) and services (40.04%). The most representative spend categories are, respectively: Maritime Transport, Rail Transport, Vehicles, Facilities and Fuels.
202-1 Ratios of standard entry level wage by gender compared to local minimum wage
204- 1 Proportion of spending on local suppliers
2018 2019 2020
% of local expense (consolidated)
MINING
31.3% 37.1% 38.7%
% spent with materials (Products)
37.7% 42.2% 39.6%
% of local expense with services
24.2% 31.8% 37.2%
Proportion of spending on local suppliers
202020192018
39%
31%
37%
102-9 Supply chain
102-13 Membership of associations
2018
Minimum basic wage
Entry level wage
Ratio with entry level wage
Line labels Average
basic wage Men
Number of people
Average basic wage
Women
Number of people
Men Women
MINING 954.00 3 954.00 8 1.00 1.00
Business area
Associations
MINING
Brazilian Institute of Mining (IBRAM)Paraopeba River Basin CommitteeTechnical Board for Procedure Integration and Granting and Regulating Actions (CTIOAR)Full members of the Mining Sector of the Advisory Council of the Jamari National ForestFederation of Industries of the State of Minas Gerais (FIEMG)Brazilian Association of Port Terminals (ABTP)Brazilian Metallurgy, Materials and Mining Association (ABM)
2020 CSN INTEGRATED REPORT | ANNEXES28

301 - Materials 301-1: Materials used by weight or volume
Business area
Description Unit 2018 2019 2020
Materials used
MINING
ANFO t 3,919.51 3,435.81 2,385.24
TNT t 93.73 33.21 36.50
Bulk emulsion t 2,279.72 2,391.81 3,740.02
Acetylene t 0.41 13.32 15.42
Diesel t 47,125.46 54,591.23 51,519.17
LPG dry metric ton 57.13 52.04 51.42
Gasoline t 168.44 372.82 195.74
Total Materials t 53,644.41 60,890.24 57,943.50
Produced Products
Iron ore produced t 27,874,933.00 32,089,837.00 21,726,858.00
Total Produced Products t 27,874,933.00 32,089,837.00 21,726,858.00
302 - Energy 302-1: Energy consumption within the organization Business area
Description Unit 2018 2019 2020
Total non-renewable fuel consumption GJ 2.150.613 2.475.585 2.331.548
MINING
Metallurgical coal / CSN GJ 5,769 6,359 4,605
Diesel / Brazil GJ 2,118,773 2,448,421 2,314,249
LiquefiedPetroleumGas(LPG) GJ 4,846 4,657 4,250
Gasoline / Brazil GJ 21,225 16,148 8,443
Total renewable fuel consumption GJ - - -
Electricity, heating, cooling and steam acquired for consumption
GJ 1.150.354 1.342.389 1.272.179
MINING
i. electricity consumption GJ 1,150,354 1,342,389 1,272,179
Electricity acquired from the grid GJ 1,150,354 1,342,389 1,272,179
Total energy consumption within theorganization
GJ 3,300,966 3,817,975 3,603,727
1. It does not have heating, cooling or steam consumption. It does not sell electricity, heating, cooling or steam. It does not have self-generated electricity, heating, cooling or steam. 2.Sourcesoftheconversionfactors:Nationalenergybalance,GHGProtocolandspecificdatafromCSN.
1. Base year: 2018 2.Sourcesoftheconversionfactors:Nationalenergybalance,GHGProtocolandspecificdatafromCSN
302-4 Reduction of energy consumption
Business area
Description Unit 2018 2019 2020
MINING
Amount of reductions in energy consumption achieved as a direct result of conservation and efficiencyinitiatives
GJ 517,008.19 302,760.12
Types of energy included in the reductions: whether fuel, electricity, cooling, steam, or all
GJ
Fuel GJ - 324,972.41 180,934.62
Electricity GJ - 192,035.77 121,825.51
2020 CSN INTEGRATED REPORT | ANNEXES29
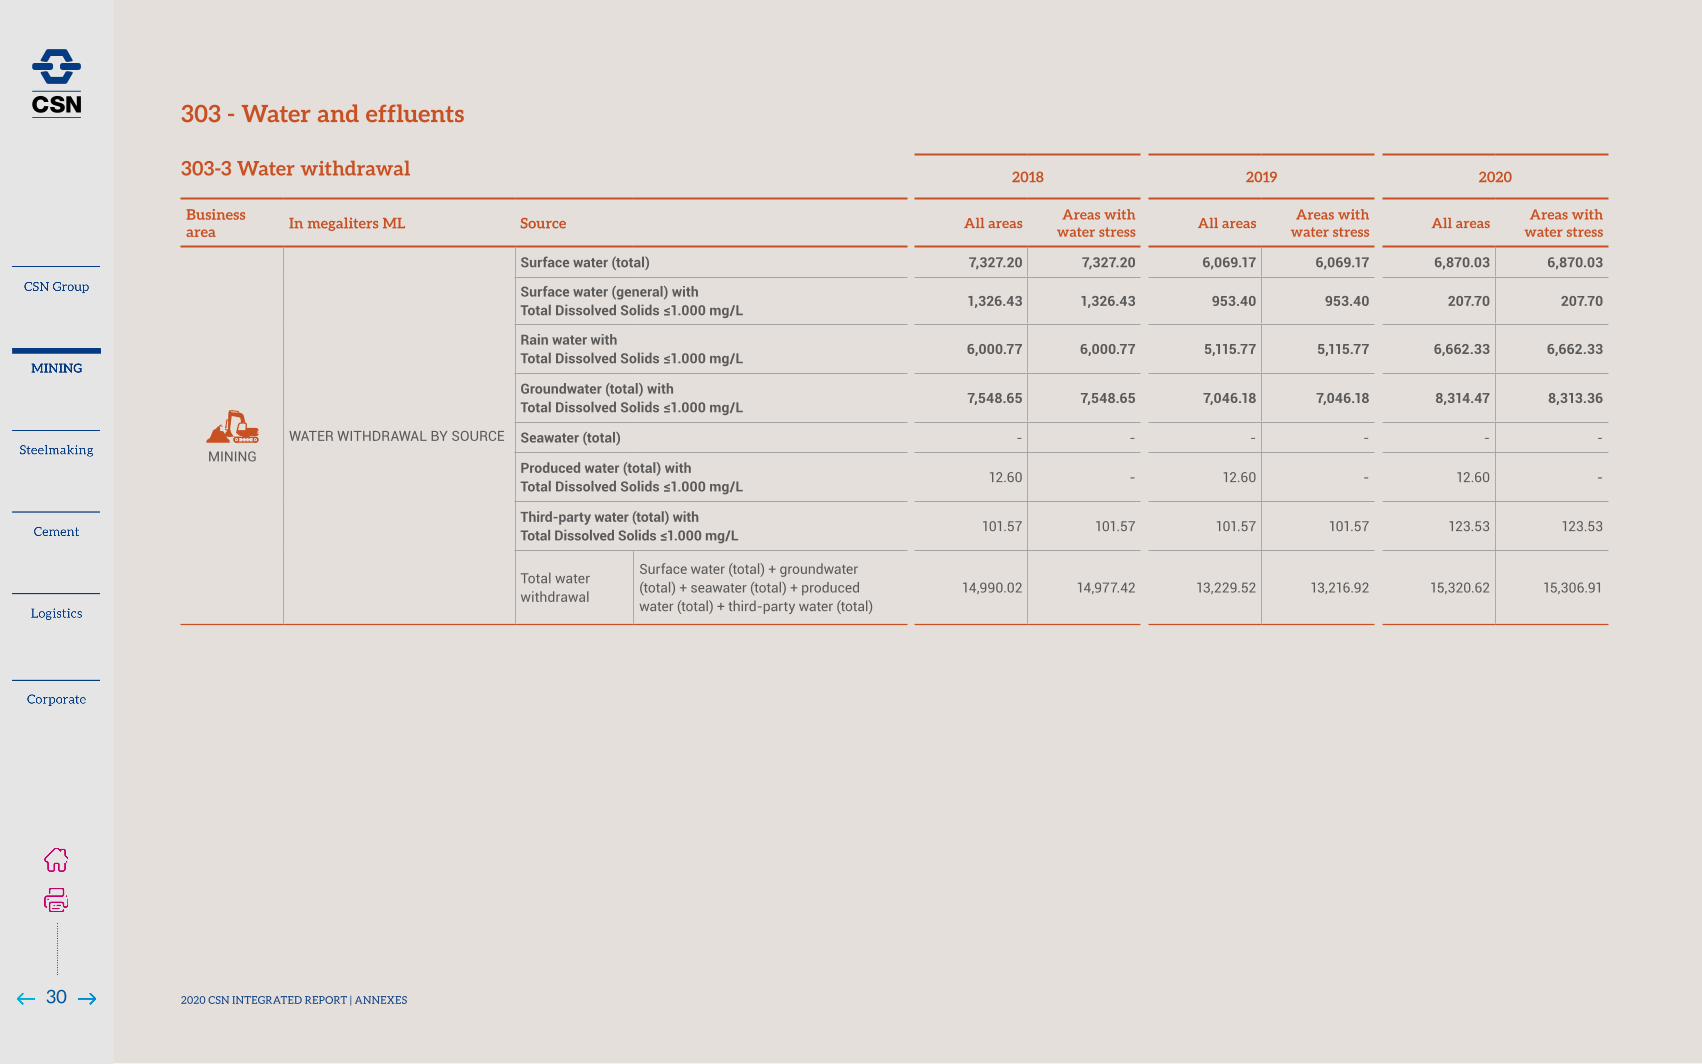
303-3 Water withdrawal 2018 2019 2020
Business area
In megaliters ML Source All areasAreas with
water stressAll areas
Areas with water stress
All areasAreas with
water stress
MININGWATER WITHDRAWAL BY SOURCE
Surface water (total) 7,327.20 7,327.20 6,069.17 6,069.17 6,870.03 6,870.03
Surface water (general) with TotalDissolvedSolids≤1.000mg/L
1,326.43 1,326.43 953.40 953.40 207.70 207.70
Rain water with TotalDissolvedSolids≤1.000mg/L
6,000.77 6,000.77 5,115.77 5,115.77 6,662.33 6,662.33
Groundwater (total) with TotalDissolvedSolids≤1.000mg/L
7,548.65 7,548.65 7,046.18 7,046.18 8,314.47 8,313.36
Seawater (total) - - - - - -
Produced water (total) with TotalDissolvedSolids≤1.000mg/L
12.60 - 12.60 - 12.60 -
Third-party water (total) with TotalDissolvedSolids≤1.000mg/L
101.57 101.57 101.57 101.57 123.53 123.53
Total water withdrawal
Surface water (total) + groundwater (total) + seawater (total) + produced water (total) + third-party water (total)
14,990.02 14,977.42 13,229.52 13,216.92 15,320.62 15,306.91
303 - Water and effluents
2020 CSN INTEGRATED REPORT | ANNEXES30

303-4 Water discharge
2018 2019 2020
Business area
In megaliters ML Source All areasAreas with
water stressAll areas
Areas with water stress
All areasAreas with
water stress
MINING
WATER DISCHARGE BY DESTINATION
Surface water (Total) 7,591.09 7,591.09 6,234.76 6,234.76 8,496.04 8,496.04
TOTAL WATER DISCHARGE suface water (total) + groundwater (total) + seawater (total) + produced water (total) + third-party water (total)
7,591.09 7,591.09 6,234.76 6,234.76 8,496.04 8,496.04
TOTAL WATER DISCHARGE BY QUALITY
Water with Total Dissolved Solids≤1.000mg/L
7,591.09 7,591.09 6,234.76 6,234.76 8,496.04 8,496.04
Water with Total Dissolved Solids≥1.000mg/L
0.00 0.00 0.00 0.00 0.00 0.00
WATER DISCHARGE BY LEVEL OF TREATMENT
Treatment level Physical 7,591.09 7,591.09 6,234.76 6,234.76 8,496.04 8,496.04
1. There was no discharge of groundwater, ocean water, local water and third party water.
2018 2019 2020
MINING
DVA In millions R$ 11,523.54 8,658.24 12,085.82
Withdrawal in ML all areas/ R$ millions DVA
ML/ millions R$ DVA
1.300817805 1.527969649 1.267652264
Withdrawal in ML areas with water stress / R$ millions DVA
ML/ millions R$ DVA
1.29972439 1.526514387 1.266518043
Produced iron ore CSN Mineração in t (only considered iron ore)
t produced iron ore CSN Mineração
28,521,726 33,674,586 22,409,934
Withdrawal ML CSN Mineração/ t produced iron ore
ML/t produced iron ore
0.000525565 0.000392864 0.000683653
CSN Mining
(in megaliters)
202020192018
Total water withdrawal Total water discharge
303-3 Water withdrawal
7.591,096.234,76
8.604,71
14.990,0213.229,52
15.320,62
2020 CSN INTEGRATED REPORT | ANNEXES31

303-5 Water consumption
305-1 Direct (Scope 1) GHG emissions 305-2 Energy indirect (Scope 2) GHG emissions 305-3 - Other indirect (Scope 3) GHG emissions
2018 2019 2020
Business area
In megaliters ML Source All areasAreas with
water stressAll areas
Areas with water stress
All areasAreas with
water stress
MINING
WATER CONSUMPTION
Total water consumption 8,639.79 9,194.45 7,000.58 7,502.02 6,546.70 6,639.32
Business Area
Emissions by scope (tCO2e) 2018 2019 2020
CMIN
Scope 1 155,618.47 175,078.74 156,114.76
Scope 2 18,338.43 21,773.85 0
Scope 3 344,567.79 349,650.28 40,269,239.73
Business Area
GHG emission intensity index for the organization
2018 2019 2020
CMIN
DVA (in R$ thousand) R$809,651.00 R$2,305,158.00 R$2,404,528.00
tCO2/ R$ DVA 0.000215 0.000085 0.00006
305 - Emissions
Note: The increase in Scope 3 emissions is related to the improvement on the accounting methodology and management of the company’s data
Note: For this data were accounted CSN Mining emissions, including TECAR
303 - Water and effluents
2020 CSN INTEGRATED REPORT | ANNEXES32

1. AQI (Air Quality Index): standard set forth by the Brazilian legislation to evaluate air quality as good, moderate, unhealthy, very unhealthy and hazardous. 2.Neighborhoodisinthefinaldemobilizationprocess.ItisincludedinthecurrentMasterPlanofthemunicipalityofCongonhasasanExpansionAreaofMineralActivity
Station Operation
2018 2019 2020
Annual average (µg/m³)
# 24-hour average > Domestic
Standard (240)
AQI¹Annual average
(µg/m³)
# 24-hour average > Domestic
Standard (240)
AQI¹Annual average
(µg/m³)
# 24-hour average > Domestic
Standard (240)
AQI¹
Plataforma - New
CSN Mining 38.7 0100% rated
as good44.34 0
Not applicable for the TSP parameter (CONAMA 491/2018)
42.4 0
Not applicable for the TSP parameter (CONAMA 491/2018)
Basílica CSN Mining 42.72 0100% rated
as good56.99 0
Not applicable for the TSP parameter (CONAMA 491/2018)
46.9 0
Not applicable for the TSP parameter (CONAMA 491/2018)
EMMA 1 - Plataforma Neighborhood2
CSN Mining 78 1 69 0
Not applicable for the TSP parameter (CONAMA 491/2018)
66 1
Not applicable for the TSP parameter (CONAMA 491/2018)
EMMA 2 - Casa de Pedra Neighborhood
CSN Mining 57 0 55 0
Not applicable for the TSP parameter (CONAMA 491/2018)
44 0
Not applicable for the TSP parameter (CONAMA 491/2018)
EMMA 3 - Cristo Rei Neighborhood
CSN Mining 40 0 43 0
Not applicable for the TSP parameter (CONAMA 491/2018)
42 0
Not applicable for the TSP parameter (CONAMA 491/2018)
EMMA 4 - Esmeril Neighborhood
CSN Mining 43 0 52 0
Not applicable for the TSP parameter (CONAMA 491/2018)
35 0
Not applicable for the TSP parameter (CONAMA 491/2018)
Air quality - Total Suspended Particles (TSP) - 24-hour average
305-7 - Nitrogen oxides (NOx), sulfur oxides (SOx), and other significant air emissions
2020 CSN INTEGRATED REPORT | ANNEXES33

1. AQI (Air Quality Index): standard set forth by the Brazilian legislation to evaluate air quality as good, moderate, unhealthy, very unhealthy and hazardous. 4.Neighborhoodisinthefinaldemobilizationprocess.ItisincludedinthecurrentMasterPlanofthemunicipalityofCongonhasasanExpansionAreaofMineralActivity
Station Operation
2018 2019 2020
Annual average (µg/m³)
# 24-hour average > Domestic
Standard (120)
AQI¹Annual average (µg/m³)
# 24-hour average > Domestic
Standard (120)
AQI¹Annual average (µg/m³)
# 24-hour average > Domestic
Standard (120)
AQI¹
Plataforma-New CSN Mining 30.75 095.07% rated as good and 4.93% rated as moderate
31.06 089.59% rated as
good and 10.41% rated as moderate
26.3 091.26% rated as good and
8.74% rated as moderate
Basílica CSN Mining 27.01 096.71% rated as good and 3.29% rated as moderate
27.8 093.15% rated as good and 6.85%
rated as moderate26.3 0
92.90% rated as good and 7.10% rated as moderate
EMMA 1- Plataforma Neighborhood4
CSN Mining 44 2 40 0 35 079% rated as good and 21% rated as moderate
EMMA 2- Casa de Pedra Neighborhood
CSN Mining 30 0 31 0 25 095% rated as good and 5% rated as moderate
EMMA 3- Cristo Rei Neighborhood
CSN Mining 25 0 28 0 27 093% rated as good and 7% rated as moderate
EMMA 4- Esmeril Neighborhood
CSN Mining 31 0 35 0 24 097% rated as good and 3% rated as moderate
Air quality - Inhalable Particles (PM10) - 24-hour average
305-7 - Nitrogen oxides (NOx), sulfur oxides (SOx), and other significant air emissions
2020 CSN INTEGRATED REPORT | ANNEXES34

1. AQI (Air Quality Index): standard set forth by the Brazilian legislation to evaluate air quality as good, moderate, unhealthy, very unhealthy and hazardous. 2. 8/19 BAM MP2.5 was installed and monitoring began for this parameter 3. 6/5/2019 19 BAM MP2.5 was installed and monitoring began for this parameter. 4.Neighborhoodisinthefinaldemobilizationprocess.ItisincludedinthecurrentMasterPlanofthemunicipalityofCongonhasasanExpansionAreaofMineralActivity
Station Operation
2018 2019 2020
Annual average (µg/m³)
# 24-hour average > Domestic
Standard (60)
AQI¹Annual average (µg/m³)
# 24-hour average > Domestic
Standard (60)
AQI¹Annual average (µg/m³)
# 24-hour average > Domestic
Standard (60)
AQI¹
Plataforma- New2 CSN Mining - - - 8.62 0
97.26% rated as good and 2.74% rated
as moderate7.6 0
97.54% rated as good and 2.46% rated as moderate
Basílica3 CSN Mining - - - 16.62 194.52% rated as
good and 5.21% rated as moderate
11.1 097.81% rated as good and 2.19% rated as moderate
EMMA 1- Plataforma Neighborhood4
CSN Mining - - - 30 17 - 19 072% rated as good and 28% rated as moderate
EMMA 2- Casa de Pedra Neighborhood
CSN Mining - - - 19 7 - 13 093% rated as good and 7% rated as moderate
EMMA 3- Cristo Rei Neighborhood
CSN Mining - - - 22 11 - 15 092% rated as good and 8% rated as moderate
EMMA 4- Esmeril Neighborhood
CSN Mining - - - 24 14 - 14 093% rated as good and 7% rated as moderate
Air quality - Inhalable Particles (PM2.5) - 24-hour average
305-7 - Nitrogen oxides (NOx), sulfur oxides (SOx), and other significant air emissions
2020 CSN INTEGRATED REPORT | ANNEXES35
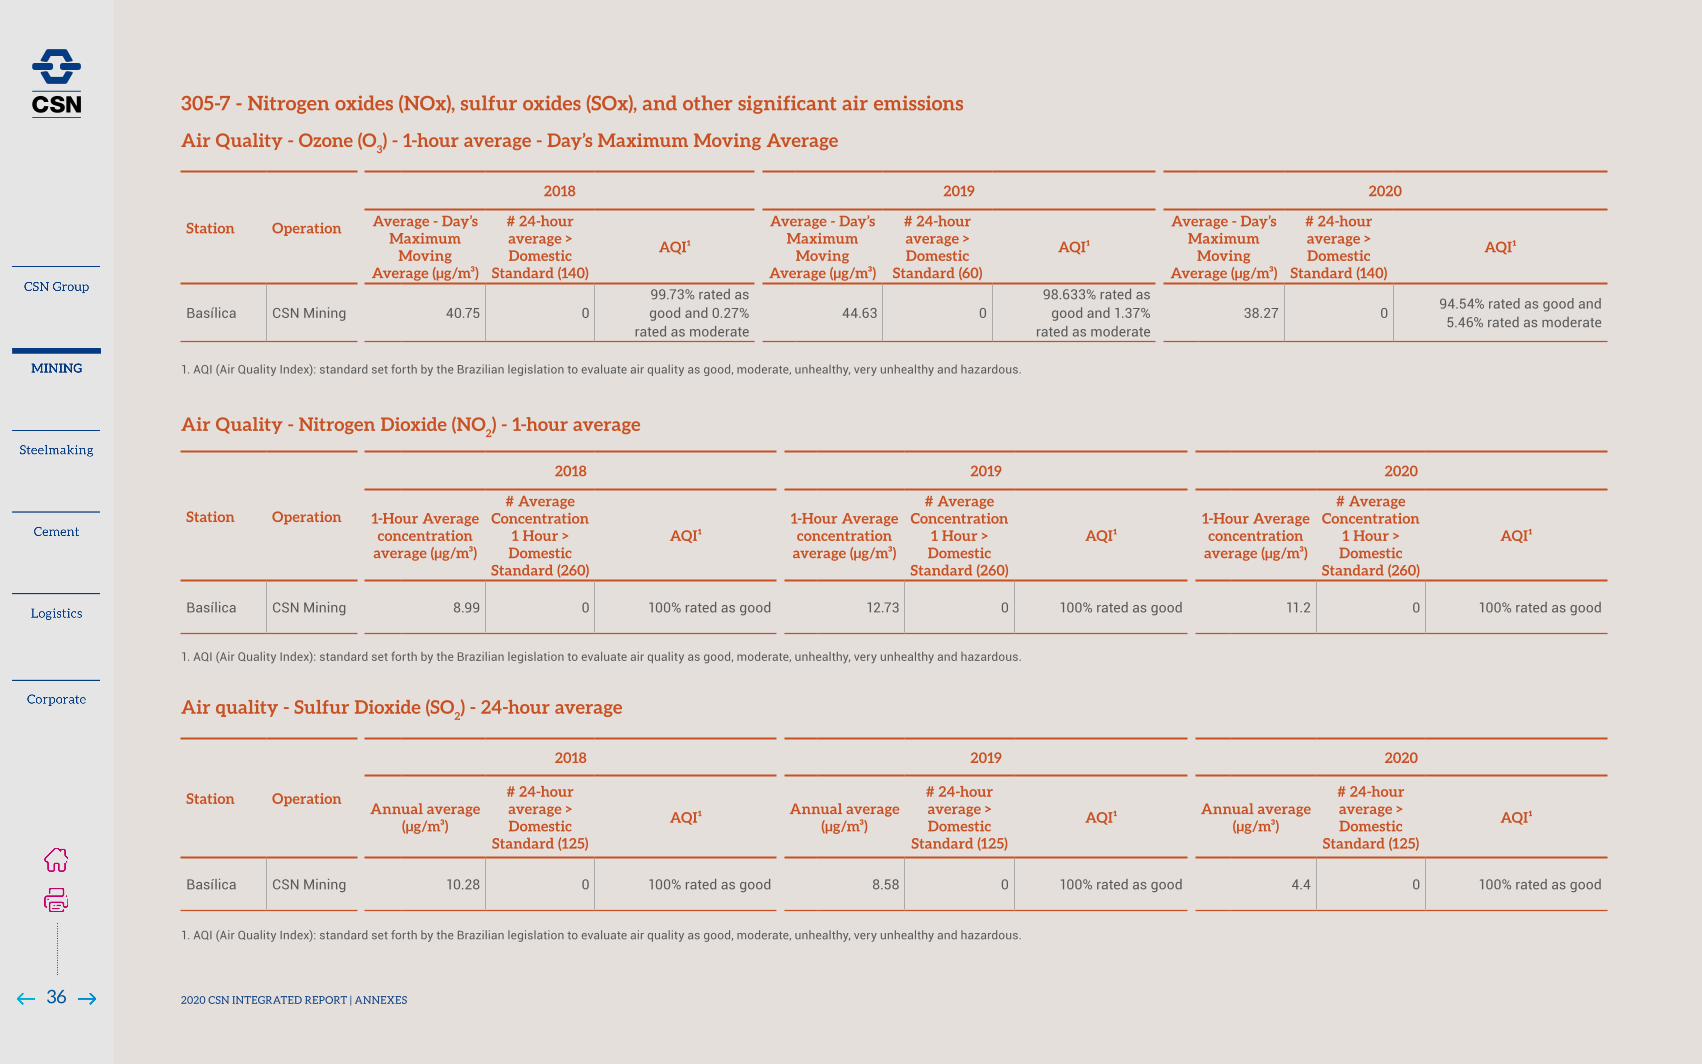
Station Operation
2018 2019 2020
Average - Day’s Maximum
Moving Average (µg/m³)
# 24-hour average > Domestic
Standard (140)
AQI¹
Average - Day’s Maximum
Moving Average (µg/m³)
# 24-hour average > Domestic
Standard (60)
AQI¹
Average - Day’s Maximum
Moving Average (µg/m³)
# 24-hour average > Domestic
Standard (140)
AQI¹
Basílica CSN Mining 40.75 099.73% rated as good and 0.27%
rated as moderate44.63 0
98.633% rated as good and 1.37%
rated as moderate38.27 0
94.54% rated as good and 5.46% rated as moderate
Station Operation
2018 2019 2020
1-Hour Average concentration
average (µg/m³)
# Average Concentration
1 Hour > Domestic
Standard (260)
AQI¹1-Hour Average concentration
average (µg/m³)
# Average Concentration
1 Hour > Domestic
Standard (260)
AQI¹1-Hour Average concentration
average (µg/m³)
# Average Concentration
1 Hour > Domestic
Standard (260)
AQI¹
Basílica CSN Mining 8.99 0 100% rated as good 12.73 0 100% rated as good 11.2 0 100% rated as good
Station Operation
2018 2019 2020
Annual average (µg/m³)
# 24-hour average > Domestic
Standard (125)
AQI¹Annual average
(µg/m³)
# 24-hour average > Domestic
Standard (125)
AQI¹Annual average
(µg/m³)
# 24-hour average > Domestic
Standard (125)
AQI¹
Basílica CSN Mining 10.28 0 100% rated as good 8.58 0 100% rated as good 4.4 0 100% rated as good
Air Quality - Ozone (O3) - 1-hour average - Day’s Maximum Moving Average
Air Quality - Nitrogen Dioxide (NO2) - 1-hour average
Air quality - Sulfur Dioxide (SO2) - 24-hour average
1. AQI (Air Quality Index): standard set forth by the Brazilian legislation to evaluate air quality as good, moderate, unhealthy, very unhealthy and hazardous.
1. AQI (Air Quality Index): standard set forth by the Brazilian legislation to evaluate air quality as good, moderate, unhealthy, very unhealthy and hazardous.
1. AQI (Air Quality Index): standard set forth by the Brazilian legislation to evaluate air quality as good, moderate, unhealthy, very unhealthy and hazardous.
305-7 - Nitrogen oxides (NOx), sulfur oxides (SOx), and other significant air emissions
2020 CSN INTEGRATED REPORT | ANNEXES36

Mining CompanyNotice of Infraction
Date of Issue
Restated fine amount Root cause Status
Notice Of Infraction with Fine≥1mm Notices + Embargoes
CMIN 1095/2019 11/02/19 R$ 2,464,973.29Non-compliance with requirements
Notice of Infraction canceled by the Municipal Environment Department of Congonhas/MG
CMIN 1131/2019 24/04/19 R$ 2,190,000.00Non-compliance with requirements
Awaiting administrative defense analysis
CMIN 1220/2019 26/09/19 R$ 1,095,000.00 Water pollution Awaiting administrative defense analysis
CMIN 1361/2020 17/07/20 R$ 2,190,000.00 Air pollution Awaiting administrative defense analysis
MIPE 132789/2019 18/04/19Activities related to B2A Damn were suspended
Dam without Stability Condition Statement (DCE)
Structure is non-operational, Activities exclusively aimed at decharacterization of the structure are being performed in the site, Information forwarded to the environmental agency,
307 Environmental Compliance 307-1 Non-compliance with environmental laws and regulations
2020 CSN INTEGRATED REPORT | ANNEXES37
Total waste weight by waste composition Unit 2018 2019 2020
Hazardouswaste t 1,711 2,503 1,983
Non-hazardouswaste t 27,600 28,836 19,715
Total waste t 29,311 31,339 21,698
Waste rock from Mining - - 22,532,916
Tailings generated by Mining - - 5,870,789
Total waste from Mining 15,314,200 33,877,703 28,403,705
306 Waste
306-3 Wasted generated

2018 2019 2020
Business area
Age range compiled Women Men Women Men Women Men
MINING
<30 years old 76 326 107 629 47 229
>50 years old - 20 1 70 5 12
30 to 50 years old 41 320 95 642 41 225
401 - Employment
401-1: New employee hires and employee turnover
a. Total number and rate of new employee hires during the reporting period, by age group, gender and region
TURNOVER
2018 2019 2020
Business area
RegionAge range compiled Women Men Women Men Women Men
MINING
North
<30 years old 35.71% 17.86% 27.78% 26.79% 62.50% 16.15%
>50 years old - 7.78% - 4.17% - 8.89%
30 to 50 years old 20.00% 15.25% 12.50% 14.10% 22.73% 17.25%
Southeast
<30 years old 17.17% 16.28% 18.99% 20.94% 10.12% 12.24%
>50 years old 7.69% 7.73% 19.23% 13.98% 15.91% 5.36%
30 to 50 years old 11.54% 11.31% 13.97% 15.16% 8.60% 9.85%
b. Total number and rate of employee turnover during the reporting period, by age group, gender and region
NEW HIRES
2018 2019 2020
Business area
RegionAge range compiled Women Men Women Men Women Men
MINING
North
<30 years old 3 15 2 19 3 18
>50 years old - 3 - 1 - 2
<30 years old 5 14 3 15 5 34
Southeast
<30 anos 73 311 105 610 44 211
>50 years old - 17 1 69 5 10
30 to 50 years old 36 306 92 627 36 191
DISMISSAL
2018 2019 2020
Business area
RegionAge range compiled Women Men Women Men Women Men
MINING
North
<30 years old 2 5 3 11 2 3
>50 years old - 4 - 3 - 6
30 to 50 years old 3 22 2 18 5 15
Southeast
<30 years old 41 249 34 189 23 194
>50 years old 2 47 4 70 2 48
30 to 50 years old 75 467 62 496 62 508
401-1: New employee hires and employee turnover
b. Total number and rate of employee turnover during the reporting period, by age group, gender and region
2020 CSN INTEGRATED REPORT | ANNEXES38
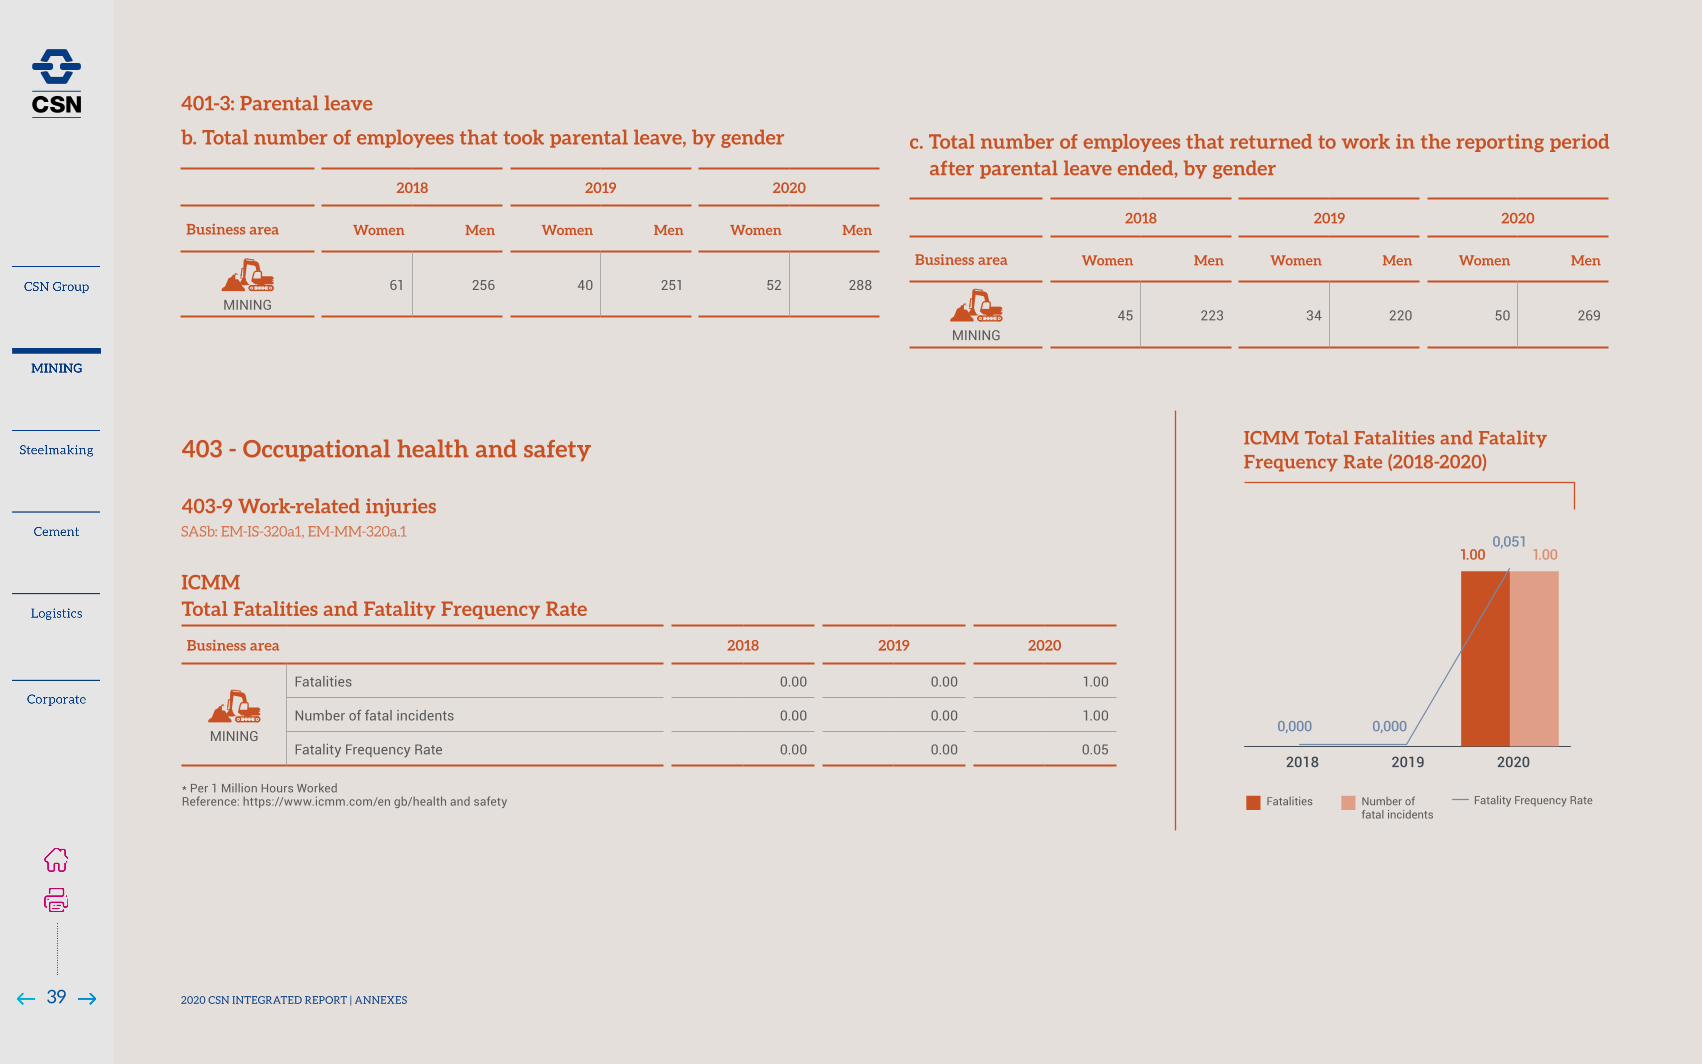
2018 2019 2020
Business area Women Men Women Men Women Men
MINING61 256 40 251 52 288
401-3: Parental leave
b. Total number of employees that took parental leave, by gender
2018 2019 2020
Business area Women Men Women Men Women Men
MINING45 223 34 220 50 269
c. Total number of employees that returned to work in the reporting period after parental leave ended, by gender
Business area 2018 2019 2020
MINING
Fatalities 0.00 0.00 1.00
Number of fatal incidents 0.00 0.00 1.00
Fatality Frequency Rate 0.00 0.00 0.05
ICMM Total Fatalities and Fatality Frequency Rate
403 - Occupational health and safety
403-9 Work-related injuries
* Per 1 Million Hours Worked Reference: https://www.icmm.com/en gb/health and safety
SASb: EM-IS-320a1, EM-MM-320a.1
ICMM Total Fatalities and Fatality Frequency Rate (2018-2020)
Fatalities Number of fatal incidents
Fatality Frequency Rate
2018 2019 2020
1.00
0,000 0,000
0,0511.00
2020 CSN INTEGRATED REPORT | ANNEXES39

Business area 2018 2019 2020
MINING
Total Recordable Fatalities (TRF) 0 0 1
Falality Frequency Rate* 0 0 0.05
Total Recordable Injuries (TRI) 40 47 31
TRI Frequency Rate 2.06 2.28 1.58
Total Hours Worked 19,463,337.23 20,571,443.96 19,630,951.17
Safety Performance Data
Business area 2018 2019 2020
MINING
Total Recordable Injuries (TRI) 40 47 31
Total Recordable Injuries Frequency Rate 2.06 2.28 1.58
Total Recordable Injuries and Frequency Rate
*TRIFR Per 1 Million Hours Worked
Note: Tables based on ICMM principles methodology
403 - Occupational health and safety
403-9 Work-related injuries SASb: EM-IS-320a1, EM-MM-320a.1
ICMM Total de lesões registráveis e taxa de frequência (2018-2020)
Total Recordable Injuries (TRI)
Total Recordable Injuries Frequency Rate
2018
40
2019
47
2020
31
2.06
2.28
1.58
2020 CSN INTEGRATED REPORT | ANNEXES40
2018 2019 2020
Employee subgroup
Age group Number of people
Percentage of women
Number of people
Percentage of men
Number of people
Percentage of women
Number of people
Percentage of men
Number of people
Percentage of women
Number of people
Percentage of men
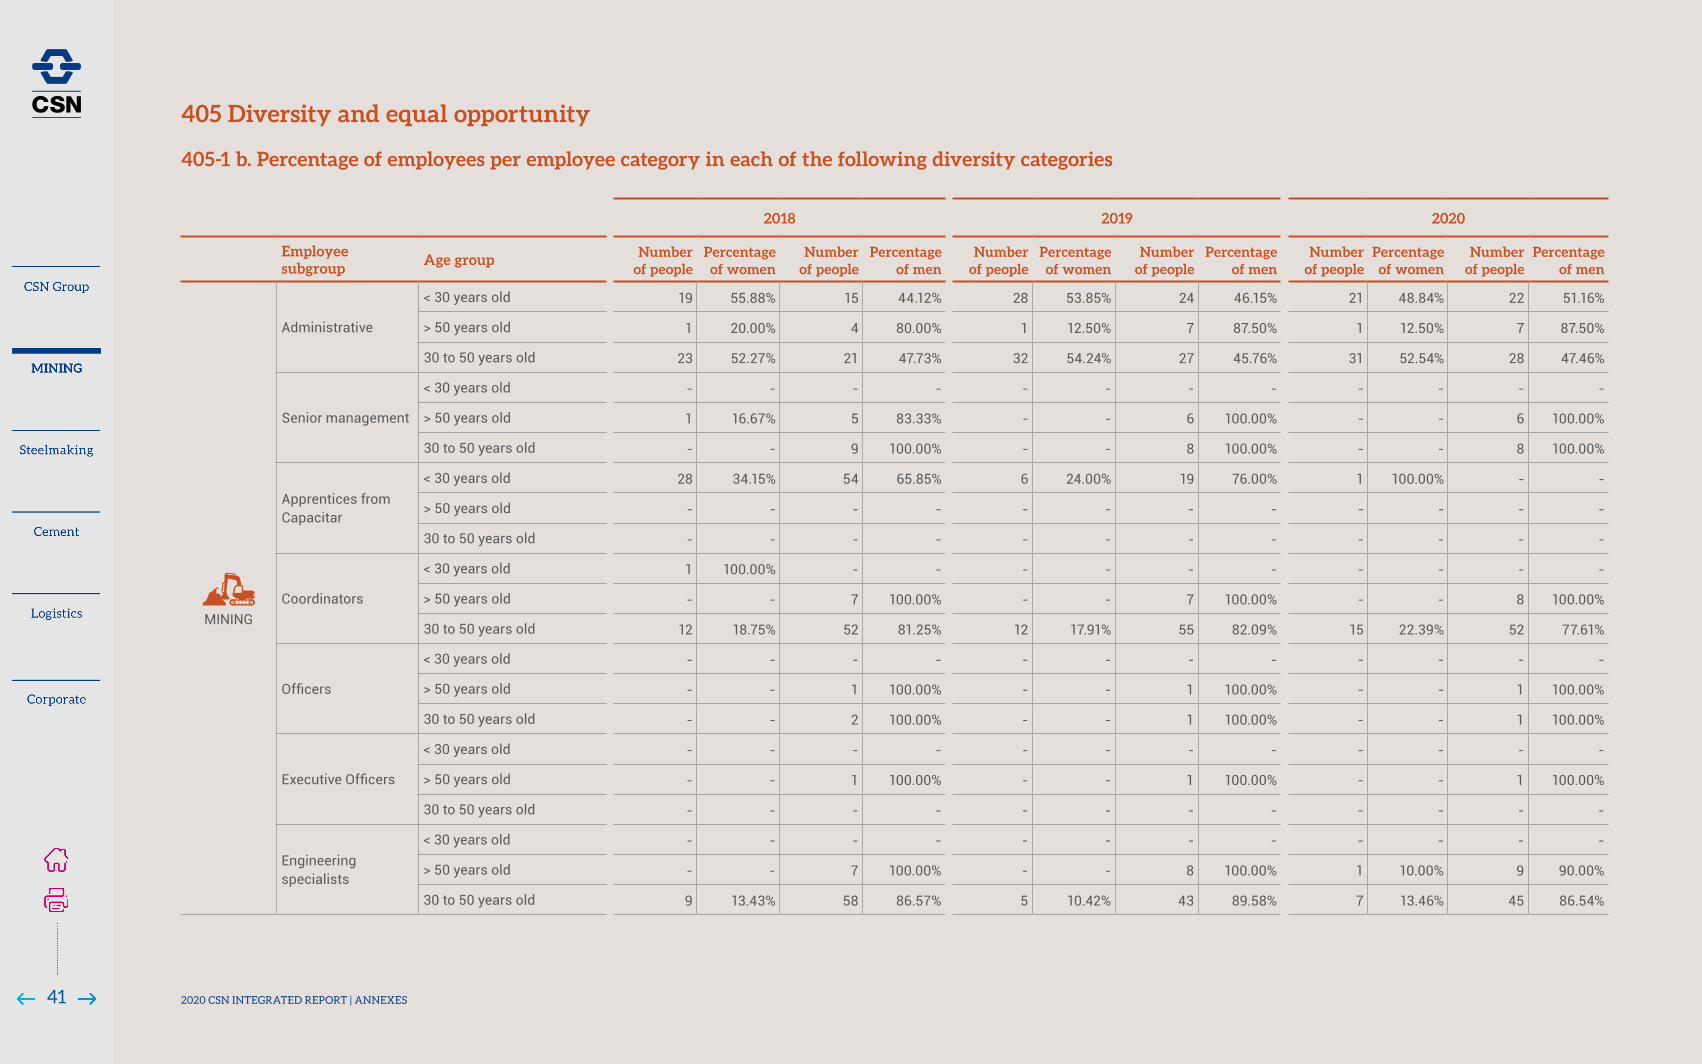
MINING
Administrative
< 30 years old 19 55.88% 15 44.12% 28 53.85% 24 46.15% 21 48.84% 22 51.16%
> 50 years old 1 20.00% 4 80.00% 1 12.50% 7 87.50% 1 12.50% 7 87.50%
30 to 50 years old 23 52.27% 21 47.73% 32 54.24% 27 45.76% 31 52.54% 28 47.46%
Senior management
< 30 years old - - - - - - - - - - - -
> 50 years old 1 16.67% 5 83.33% - - 6 100.00% - - 6 100.00%
30 to 50 years old - - 9 100.00% - - 8 100.00% - - 8 100.00%
Apprentices from Capacitar
< 30 years old 28 34.15% 54 65.85% 6 24.00% 19 76.00% 1 100.00% - -
> 50 years old - - - - - - - - - - - -
30 to 50 years old - - - - - - - - - - - -
Coordinators
< 30 years old 1 100.00% - - - - - - - - - -
> 50 years old - - 7 100.00% - - 7 100.00% - - 8 100.00%
30 to 50 years old 12 18.75% 52 81.25% 12 17.91% 55 82.09% 15 22.39% 52 77.61%
Officers
< 30 years old - - - - - - - - - - - -
> 50 years old - - 1 100.00% - - 1 100.00% - - 1 100.00%
30 to 50 years old - - 2 100.00% - - 1 100.00% - - 1 100.00%
ExecutiveOfficers
< 30 years old - - - - - - - - - - - -
> 50 years old - - 1 100.00% - - 1 100.00% - - 1 100.00%
30 to 50 years old - - - - - - - - - - - -
Engineering specialists
< 30 years old - - - - - - - - - - - -
> 50 years old - - 7 100.00% - - 8 100.00% 1 10.00% 9 90.00%
30 to 50 years old 9 13.43% 58 86.57% 5 10.42% 43 89.58% 7 13.46% 45 86.54%
405 Diversity and equal opportunity
405-1 b. Percentage of employees per employee category in each of the following diversity categories
2020 CSN INTEGRATED REPORT | ANNEXES41

2018 2019 2020
Employee subgroup
Age group Number of people
Percentage of women
Number of people
Percentage of men
Number of people
Percentage of women
Number of people
Percentage of men
Number of people
Percentage of women
Number of people
Percentage of men
MINING
Engineers I
< 30 years old - - - - 1 50.00% 1 50.00% 2 40.00% 3 60.00%
> 50 years old - - - - - - - - - - - -
30 to 50 years old - - - - - - 1 100.00% 1 50.00% 1 50.00%
Engineers II
< 30 years old 2 25.00% 6 75.00% 2 16.67% 10 83.33% 4 28.57% 10 71.43%
> 50 years old - - - - - - - - - - 1 100.00%
30 to 50 years old 5 22.73% 17 77.27% 2 11.11% 16 88.89% 1 11.11% 8 88.89%
Engineers III
< 30 years old - - 6 100.00% 1 10.00% 9 90.00% 2 15.38% 11 84.62%
> 50 years old - - - - - - - - - - 1 100.00%
30 to 50 years old 8 21.62% 29 78.38% 8 11.76% 60 88.24% 11 14.47% 65 85.53%
Engineers IV
< 30 years old 1 50.00% 1 50.00% 1 33.33% 2 66.67% - - 2 100.00%
> 50 years old - - 3 100.00% - - 6 100.00% - - 2 100.00%
30 to 50 years old 6 12.77% 41 87.23% 14 21.88% 50 78.13% 13 18.84% 56 81.16%
Specialists
< 30 years old 2 66.67% 1 33.33% 2 66.67% 1 33.33% 1 50.00% 1 50.00%
> 50 years old 1 50.00% 1 50.00% 1 25.00% 3 75.00% 2 28.57% 5 71.43%
30 to 50 years old 16 53.33% 14 46.67% 15 37.50% 25 62.50% 11 35.48% 20 64.52%
Managers
< 30 years old - - - - - - - - - - - -
> 50 years old - - 4 100.00% - - 11 100.00% 1 7.69% 12 92.31%
30 to 50 years old 2 7.41% 25 92.59% 3 12.50% 21 87.50% 2 10.00% 18 90.00%
Operational
< 30 years old 134 9.05% 1347 90.95% 171 9.86% 1564 90.14% 167 10.95% 1358 89.05%
> 50 years old 4 1.21% 327 98.79% 7 1.75% 393 98.25% 14 3.17% 427 96.83%
30 to 50 years old 209 8.25% 2323 91.75% 233 8.41% 2537 91.59% 225 8.59% 2393 91.41%
Higher education - Level I
< 30 years old 13 61.90% 8 38.10% 18 72.00% 7 28.00% 17 80.95% 4 19.05%
> 50 years old - - - - - - - - - - - -
30 to 50 years old 20 80.00% 5 20.00% 30 78.95% 8 21.05% 37 77.08% 11 22.92%
405 Diversity and equal opportunity
405-1 b. Percentage of employees per employee category in each of the following diversity categories
2020 CSN INTEGRATED REPORT | ANNEXES42

2018 2019 2020
Employee subgroup
Age group Number of people
Percentage of women
Number of people
Percentage of men
Number of people
Percentage of women
Number of people
Percentage of men
Number of people
Percentage of women
Number of people
Percentage of men
MINING
Higher education - Level II
< 30 years old 4 44.44% 5 55.56% 5 50.00% 5 50.00% 5 71.43% 2 28.57%
> 50 years old 1 25.00% 3 75.00% 1 25.00% 3 75.00% 1 33.33% 2 66.67%
30 to 50 years old 26 63.41% 15 36.59% 26 61.90% 16 38.10% 29 56.86% 22 43.14%
Higher education - Level III
< 30 years old 6 85.71% 1 14.29% 6 54.55% 5 45.45% 2 40.00% 3 60.00%
> 50 years old 3 30.00% 7 70.00% 3 33.33% 6 66.67% 3 33.33% 6 66.67%
30 to 50 years old 17 54.84% 14 45.16% 19 59.38% 13 40.63% 16 51.61% 15 48.39%
Higher education - Level IV
< 30 years old - - - - - - - - - - - -
> 50 years old 1 25.00% 3 75.00% - - 2 100.00% - - 2 100.00%
30 to 50 years old 11 32.35% 23 67.65% 13 38.24% 21 61.76% 16 48.48% 17 51.52%
Supervisors
< 30 years old - - 13 100.00% 3 30.00% 7 70.00% 2 22.22% 7 77.78%
> 50 years old - - 13 100.00% - - 18 100.00% - - 19 100.00%
30 to 50 years old 4 2.56% 152 97.44% 3 2.10% 140 97.90% 6 4.05% 142 95.95%
Technicians
< 30 years old 129 28.79% 319 71.21% 131 29.71% 310 70.29% 111 27.21% 297 72.79%
> 50 years old 1 1.35% 73 98.65% 1 1.35% 73 98.65% 1 1.28% 77 98.72%
30 to 50 years old 133 15.30% 736 84.70% 156 16.68% 779 83.32% 171 17.85% 787 82.15%
405 Diversity and equal opportunity
405-1 b. Percentual de empregados por categoria funcional em cada uma das seguintes categorias de diversidade.
2020 CSN INTEGRATED REPORT | ANNEXES43

STEELMAKING

We have a total of 2,369 suppliers in the Steelmaking, the national ones are located mostly in the following states, RJ (33.76%), SP (13.63%) and MG (11.43%). Our international suppliers represent 29.60%. Most steelmaking suppliers offer materials (81.52%) and services (18.48%). The most representative spend categories are, respectively: Reducers, Ores and Minerals, Fuels, Non-ferrous metal and Road Transport.
2020
Minimum basic wage
Entry level wage
Ratio with entry level wage
Line labelsAverage
basic wage Men
Number of people
Average basic wage
Women
Number of people
Men Women
STEELMAKING 1,000.89 86 1,000.89 32 0.96 0.96
2018
Minimum basic wage
Entry level wage
Ratio with entry level wage
Line labelsAverage
basic wage Men
Number of people
Average basic wage
Women
Number of people
Men Women
STEELMAKING 1,000.89 87 1,000.89 57 1.05 1.05
2019
Minimum basic wage
Entry level wage
Ratio with entry level wage
Line labelsAverage
basic wage Men
Number of people
Average basic wage
Women
Number of people
Men Women
STEELMAKING 1,000.89 86 1,000.89 32 1.00 1.00
202-1 Ratios of standard entry level wage by gender compared to local minimum wage
202 Market presence 102 - General Disclosures: Organizational profile102-9: Supply chain
102-13 - Membership of associations
Business area
Associations
STEELMAKING
National Institute of Steel Distributors (INDA)Steel Association of the Rio Grande do Sul (AARS)Technical Chambers of the Paraíba do Sul River Hydrographic Basin Integration Committee (CEIVAP)Technical Chambers of the Médio Paraíba do Sul River Hydrographic Basin Committee (CBH/MPS)Alto Tiete Environmental Professionals Group (GPMAI)Paraná Council of Corporate Citizenship (FIEP/CPCE)Association of Companies of the Industrial City of Araucária (ACIAR)Araucária Economic Development Council - Avança AraucáriaIntermunicipal Security and Business Intelligence Council (CISIE)Industrial Environment Professionals Group (GPMAI)Mutual Assistance Plan (PAM) - group of professionals for emergency situationsAdvisory Board of the APA for the Surroundings of the ARIE Cicuta Forest (BM)Advisory Board of ARIE Cicuta Forest - ICMBio:
Participation of working groups and technical chambers for activities developed at the UC; Participation in the preparation of the board's internal regulations; Participation in the preparation of the management plan.
Advisory Board of Médio Paraíba Wildlife Refuge (REVISMEP)Municipal Environmental Defense Council (COMDEMA)Deliberative Council of SAAE Volta RedondaNational Conferation of Industry (CNI)Latin American Steel Association (ALACERO)Industry Federation of the State of Rio de Janeiro FIRJAN - CIRJ)Industrial, Commercial and Agricultural Association of Volta Redonda (ACIAP)Foundation for Agribussiness Research Development (FUNDEPAG)Brazilian Association for Technical Standards (ABNT)Brazilian Metallurgy, Materials and Mining Association (ABM)National Coil Coating Association (NCCA)Zinc Aluminum Coaters Association (ZAC)PROLATA - Brazilian Association of Steel Packaging (ABEAÇO)
45 2020 CSN INTEGRATED REPORT | ANNEXES

Proportion of spending on local suppliers
202020192018
33%
45%
29%
204 - Procurement practices 204- 1 Proportion of spending on local suppliers
2018 2019 2020
STEELMAKING
% spent with materials (Products)
51.1% 36.3% 46.6%
% of local spent with services
71.6% 24.5% 45.2%
Business area
Description Unit 2018 2019 2020
Materials used
STEELMAKING
Iron ore dry metric ton 5,206,116.00 3,676,376.00 3,705,614.37
Metallurgical coal dry metric ton 1,630,079.00 1,160,348.00 989,848.21
Coal injection into the blast furnace
dry metric ton 482,275.00 231,802.00 468,581.16
Coke dry metric ton 940,600.00 735,183.00 692,991.14
Heavy oil t 2.69 1.94 -
Light oil t 6.24 1.04 -
Limestone dry metric ton 1,034,413.00 793,655.00 902,689.00
Crude dolomite dry metric ton 341,748.00 420,003.00 509,668.00
Pellets t 1,240,554.00 1,134,277.00 1,393,692.75
EAF Electrodes t 753.00 751.00 618.00
Pig iron t 32,637.00 32,255.00 9,165.00
Scraps t 573,331.00 378,994.00 913,054.00
Paint t 2,334.12 2,318.00 2,251.76
Zinc t 9,648.69 9,514.15 13,257.57
Solvent t 223.80 240.40 175.00
Seal t 81.70 89.02 63.51
Varnish t 404.48 246.21 164.31
Enamel t 74.12 20.32 3.50
Strain hardening fluid t 416.75 430.70 592.22
301 - Materials 301-1 Materials used by weight or volume
46 2020 CSN INTEGRATED REPORT | ANNEXES

Business area
Description Unit 2018 2019 2020
STEELMAKING
Acetylene t 0.37 0.29 0.23
Diesel t 54.70 35.75 54.04
LPG dry metric ton 242.42 209.06 154.41
Natural gas t 354,044.48 360,798.56 341,084.40
Gasoline t 0.22 4.18 2.57
Total Materials t 11,850,040.77 8,937,553.62 9,943,725.15
Produced Products
STEELMAKING
BOF crude steel produced
t 3,947,396.00 2,775,748.00 3,591,200.00
EAF crude steel produced
t 204,788.00 230,193.00 224,890.00
Total crude steel produced
t 4,152,184.00 3,005,941.00 3,816,090.00
Total Produced Products
t 4,152,184.00 3,005,941.00 3,816,090.00
Business area
Description Unit 2018 2019 2020
STEELMAKING
Total non-renewable fuel consumption
GJ 176,971,411 131,438,551 127,562,888
Metallurgical coal / CSN GJ 65,445,666 35,950,285 26,369,556
Metallurgical coal PCI / CS GJ - 7,111,979 12,483,002
Coal coke/ CSN GJ 50,273,851 16,842,267 15,947,301
Coal coke / CSN bought GJ - 20,708,304 19,561,559
Coal coke / Mill / CS GJ 7,333,103 4,901,106 6,010,988
Coal coke / Small coke / CS GJ 6,352,516 4,099,378 5,180,385
Diesel / Brazil GJ 118,814 128,509 137,604
Steel mill gas / CSN GJ 3,230,137 2,290,351 2,379,926
Blast furnace gas / CSN GJ 21,662,869 17,021,765 18,358,437
Coke gas / CSN GJ 8,122,977 6,077,545 6,218,506
Coke gas / Desulfurized / CSN GJ 112,731 197,048 123,352
LiquefiedPetroleumGas(LPG) GJ 13,727 12,153 11,312
Natural gas GJ 14,304,957 16,097,612 14,780,302
Gasoline / Brazil GJ 9 169 101
Fuel oil GJ - - 485
Flushing oil / CSN GJ 56 80 71
Total renewable fuel consumption GJ - - -
Electricity, heating, cooling and steam acquired for consumption
GJ 8,393,731 7,719,946 8,992,318
301 - Materials
302 - Energy 301-1 Materials used by weight or volume 302-1 Energy consumption within the organization
47 2020 CSN INTEGRATED REPORT | ANNEXES

Business area
Description Unit 2018 2019 2020
STEELMAKING
i. electricity consumption GJ 8,393,731 7,719,946 8,992,318
Electricity acquired from the grid GJ 2,854,731 2,549,536 3,597,210
Electricity acquired from the grid (Igarapava Hydroelectric Power Plant)
GJ 518,371 532,082 513,077
Electricity acquired from the grid (Itá Hydroelectric Power Plant)
GJ 4,725,530 4,600,410 4,577,708
Electricity recycled at top turbine GJ 295,315 37,919 304,323
Total sale of electricity, heating, cooling and steam
GJ 2,600,131 1,979,320 1,416,569
i. self-generation of electricity GJ 2,600,131 1,979,320 1,416,569
Thermal Power Plant GJ 2,600,131 1,979,320 1,416,569
Total energy consumption within theorganization
GJ 185,365,143 139,158,496 136,555,206
302 - Energy 302-1 Energy consumption within the organization
1. It does not have heating, cooling or steam consumption. It does not sell electricity, heating, cooling or steam. It does not have self-generated heating, cooling or steam. 2.Sourcesoftheconversionfactors:Nationalenergybalance,GHGProtocolandspecificdatafromCSN.
302-4 Reduction of energy consumption
Business area
Description Unit 2018 2019 2020
STEELMAKING
Amount of reductions in energy consumption achieved as a direct result of conservation and efficiencyinitiatives
GJ - (46,206,646.6) (48,809,936.9)
Types of energy included in the reductions: whether fuel, electricity, cooling, steam, or all
GJ - - -
Fuel GJ - (45,532,860.9) (49,408,523.2)
Electricity GJ - (673,785.7) 598,586.3
1. Base year 2018 2.Sourcesused:NationalEnergyBalance(BEN),GHGProtocolandspecificdatafromCSN.
48 2020 CSN INTEGRATED REPORT | ANNEXES
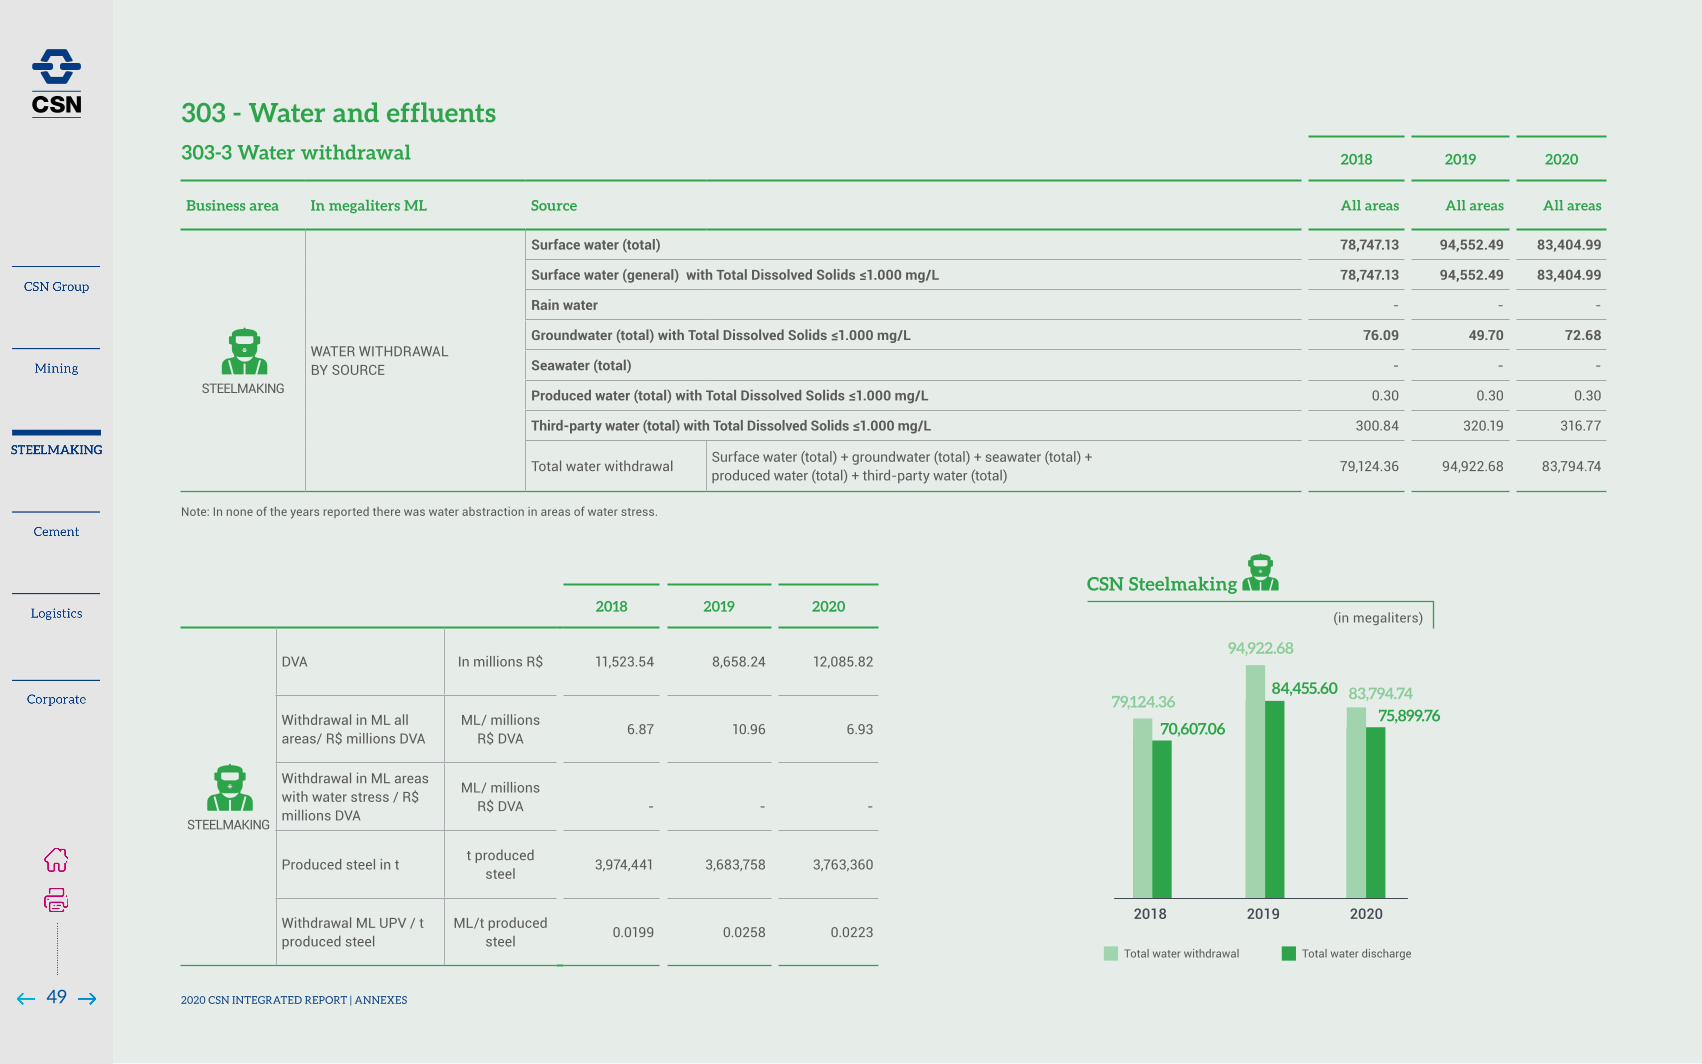
303 - Water and effluents
303-3 Water withdrawal 2018 2019 2020
Business area In megaliters ML Source All areas All areas All areas
STEELMAKING
WATER WITHDRAWAL BY SOURCE
Surface water (total) 78,747.13 94,552.49 83,404.99
Surfacewater(general)withTotalDissolvedSolids≤1.000mg/L 78,747.13 94,552.49 83,404.99
Rain water - - -
Groundwater(total)withTotalDissolvedSolids≤1.000mg/L 76.09 49.70 72.68
Seawater (total) - - -
Producedwater(total)withTotalDissolvedSolids≤1.000mg/L 0.30 0.30 0.30
Third-partywater(total)withTotalDissolvedSolids≤1.000mg/L 300.84 320.19 316.77
Total water withdrawalSurface water (total) + groundwater (total) + seawater (total) + produced water (total) + third-party water (total)
79,124.36 94,922.68 83,794.74
Note: In none of the years reported there was water abstraction in areas of water stress.
2018 2019 2020
STEELMAKING
DVA In millions R$ 11,523.54 8,658.24 12,085.82
Withdrawal in ML all areas/ R$ millions DVA
ML/ millions R$ DVA
6.87 10.96 6.93
Withdrawal in ML areas with water stress / R$ millions DVA
ML/ millions R$ DVA
-
-
-
Produced steel in tt produced
steel3,974,441 3,683,758 3,763,360
Withdrawal ML UPV / t produced steel
ML/t produced steel
0.0199 0.0258 0.0223
CSN Steelmaking
(in megaliters)
202020192018
Total water withdrawal Total water discharge
79,124.36
94,922.68
83,794.74
70,607.06
84,455.60
75,899.76
49 2020 CSN INTEGRATED REPORT | ANNEXES
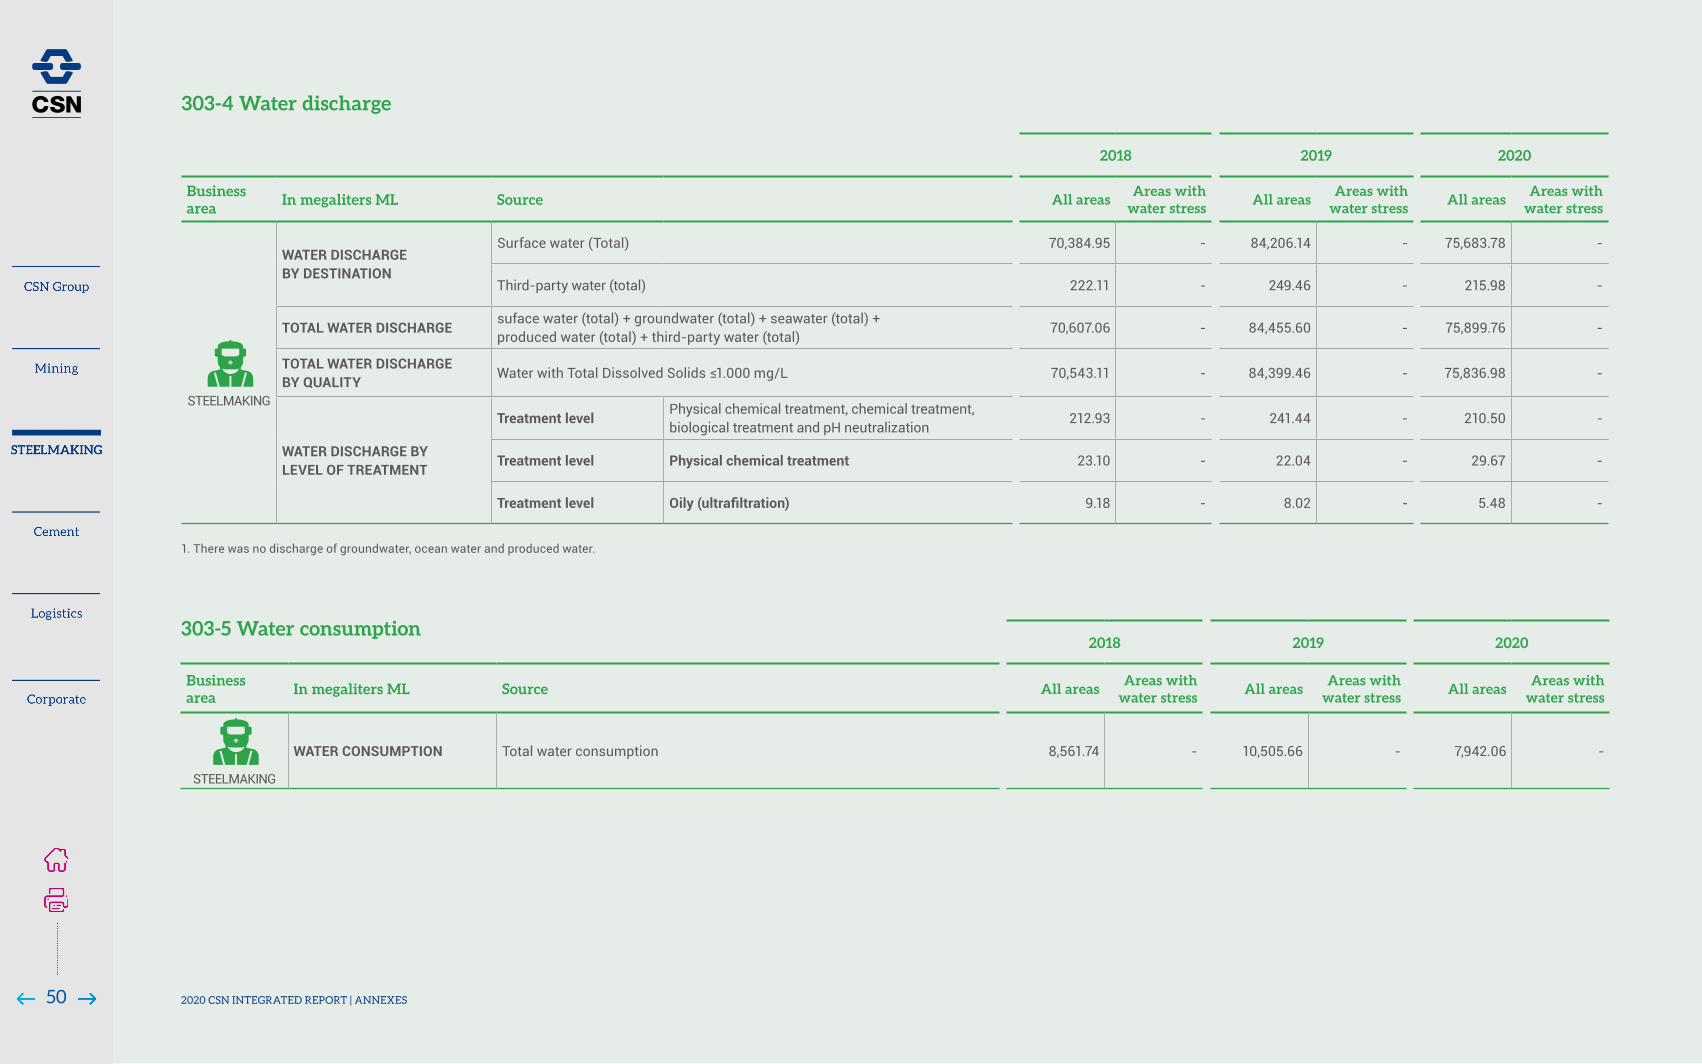
303-5 Water consumption2018 2019 2020
Business area
In megaliters ML Source All areasAreas with
water stressAll areas
Areas with water stress
All areasAreas with
water stress
STEELMAKING
WATER CONSUMPTION Total water consumption 8,561.74 - 10,505.66 - 7,942.06 -
2018 2019 2020
Business area
In megaliters ML Source All areasAreas with
water stressAll areas
Areas with water stress
All areasAreas with
water stress
STEELMAKING
WATER DISCHARGE BY DESTINATION
Surface water (Total) 70,384.95 - 84,206.14 - 75,683.78 -
Third-party water (total) 222.11 - 249.46 - 215.98 -
TOTAL WATER DISCHARGE suface water (total) + groundwater (total) + seawater (total) + produced water (total) + third-party water (total)
70,607.06 - 84,455.60 - 75,899.76 -
TOTAL WATER DISCHARGE BY QUALITY
WaterwithTotalDissolvedSolids≤1.000mg/L 70,543.11 - 84,399.46 - 75,836.98 -
WATER DISCHARGE BY LEVEL OF TREATMENT
Treatment level Physical chemical treatment, chemical treatment, biological treatment and pH neutralization
212.93 - 241.44 - 210.50 -
Treatment level Physical chemical treatment 23.10 - 22.04 - 29.67 -
Treatment level Oily(ultrafiltration) 9.18 - 8.02 - 5.48 -
303-4 Water discharge
1. There was no discharge of groundwater, ocean water and produced water.
50 2020 CSN INTEGRATED REPORT | ANNEXES

305-4: GHG emissions intensity
CategoriaEmissions (tCO
2 e/normalization factor)
2018 2019 2020
tCO2 eq/crude steel ton
2.42 2.68 2.26
Total weight of waste by composition of the waste Unit 2018 2019 2020
Hazardouswaste t 33,601 26,221 20,071
Slag t - - 517
Thin and powder t - - 3,013
Sludge t - - 3,809
Other waste t 7,980 1,236 12,732
Non-hazardouswaste t 3,623,133 2,874,298 3,718,327
Slag t - - 2,080,481
Thin and powder t - - 759,440
Metal scrap t - - 432,366
Sludge t - - 145,987
Mill scale t - - 69,010
Petroleum sludge t - - 1,987
Other waste t 13,574 49,480 229,056
Total waste t 3,656,734 2,900,519 3,738,398
306 Waste
306-3 Waste generated
1. According to the World Steel Association (WSA) methodology 2. This data includes the sum of scope 1+2 per ton of steel produced from Usina Presidente Vargas
305 - Emissions
Note: there is no emission of lead, manganese or polycyclic aromatic hydrocarbons.
Significant specific air emissions volume recorded by steelmaking and Cement plant at UPV
Specific emissions Category Source Unit 2018 2019 2020
CO 24 chimneys - isokinetic monitoring 03 chimneys - continuous monitoring
t/year - 521.46 790.21
NOX (excluding N2O)24 chimneys - isokinetic monitoring 03 chimneys - continuous monitoring
t/year 2,868.29 3,609.30 3,599.85
SOX11 chimneys - isokinetic monitoring 03 chimneys - continuous monitoring
t/ano 6,262.75 4,100.37 5,358.09
Particulates (MP)52 chimneys - isokinetic monitoring 38 chimneys - continuous monitoring
t/year 2,809.97 2,341.27 2,896.19
Volatile Organic Compounds (VOCs)
After 2019: 16 chimneys – isokinetic monitoring (THC) Up to 2018: 08 chimneys – isokinetic monitoring (BTEX)
t/year 36.50 11.49 21.96
305-7 - Nitrogen oxides (NOx), sulfur oxides (SOx), and other significant air emissions
51 2020 CSN INTEGRATED REPORT | ANNEXES

Steelmaking CompanyNotice of Infraction
Date of Issue
Restated fine amount
Root cause Status
Notice Of Infraction with Fine≥1mm Notices + Embargoes
PRADA 11093912 03/07/19 WarningNon-compliance with the permit
Awaiting administrative defense analysis
307 Environmental Compliance 307-1 Non-compliance with environmental laws and regulations
2018 2019 2020
Business area
Age range compiled Women Men Women Men Women Men
STEELMAKING
<30 years old 76 326 107 629 47 229
> 50 years old - 20 1 70 5 12
30 to 50 years old 41 320 95 642 41 225
401 Employment
401-1: New employee hires and employee turnover
a. Total number and rate of new employee hires during the reporting period, by age group, gender and region
401-1: New employee hires and employee turnover
b. Total number and rate of employee turnover during the reporting period, by age group, gender and region
TURNOVER
2018 2019 2020
Business area
RegionAge range compiled Women Men Women Men Women Men
STEELMAKING
Midwest
< 30 years old - 200.00% - 70.83% - -
> 50 years old - - - 66.67% - -
30 to 50 years old 50.00% 88.46% 62.50% 41.67% - -
Northeast
< 30 years old 20.00% 25.00% 14.29% 19.05% 33.33% 20.59%
> 50 years old - - - - - -
30 to 50 years old 11.11% 8.82% 15.00% 15.09% 100.00% 26.39%
Southeast
< 30 years old 24.01% 16.57% 24.07% 17.71% 33.33% 20.59%
> 50 years old 20.18% 12.61% 21.05% 12.23% - -
30 to 50 years old 18.25% 9.52% 20.55% 10.17% 100.00% 26.39%
South
< 30 years old 21.43% 17.69% 15.91% 16.90% 33.33% 20.59%
> 50 years old - 10.42% 20.00% 15.38% - -
30 to 50 years old 8.24% 11.97% 12.66% 11.29% 100.00% 26.39%
52 2020 CSN INTEGRATED REPORT | ANNEXES

NEW HIRES
2018 2019 2020
Business area
RegionAge range compiled Women Men Women Men Women Men
STEELMAKING
Midwest
<30 years old - 1 - 13 - -
> 50 years old - - - 2 - -
30 to 50 years old 1 - 3 10 - -
Northeast
<30 years old 2 8 2 5 - 3
> 50 years old - - - - - -
30 to 50 years old - 4 2 7 - 3
Southeast
<30 years old 158 537 209 731 43 333
> 50 years old 2 44 6 41 1 15
30 to 50 years old 157 557 232 734 43 260
South
<30 years old 6 28 4 33 2 11
> 50 years old - 1 1 3 1 -
30 to 50 years old 7 44 9 39 5 24
DISMISSAL
2018 2019 2020
Business area
RegionAge range compiled Women Men Women Men Women Men
STEELMAKING
Midwest
<30 years old - 7 - 4 - 11
> 50 years old - - - 2 - 4
30 to 50 years old 2 23 2 5 6 20
Northeast
<30 years old - 3 - 3 2 4
> 50 years old - 2 - - 8
30 to 50 years old 2 5 1 9 8 16
Southeast
<30 years old 61 496 62 358 52 295
> 50 years old 21 210 18 217 13 211
30 to 50 years old 123 763 126 709 92 582
South
<30 years old 3 24 3 15 1 18
> 50 years old - 4 1 5 - 3
30 to 50 years old 7 40 11 43 10 23
401-1: New employee hires and employee turnover
b. Total number and rate of employee turnover during the reporting period, by age group, gender and region
53 2020 CSN INTEGRATED REPORT | ANNEXES

TOTAL WORKFORCE
2018 2019 2020
Business area
RegionAge range compiled Women Men Women Men Women Men
STEELMAKING
Midwest
<30 years old - 2 - 12 - -
> 50 years old - 2 - 3 - -
30 to 50 years old 3 13 4 18 - -
Northeast
<30 years old 5 22 7 21 3 17
> 50 years old - 8 - 8 - 5
30 to 50 years old 9 51 10 53 4 36
Southeast
<30 years old 456 3,118 563 3,075 475 2,720
> 50 years old 57 1,007 57 1,055 68 1,062
30 to 50 years old 767 6,936 871 7,095 862 6,919
South
<30 years old 21 147 22 142 18 118
> 50 years old 4 24 5 26 6 25
30 to 50 years old 85 351 79 363 77 385
2018 2019 2020
Business area Women Men Women Men Women Men
STEELMAKING
56 514 67 468 75 401
2018 2019 2020
Business area Women Men Women Men Women Men
STEELMAKING
44 460 50 437 72 383
Business area 2018 2019 2020
STEELMAKING
Employee LTIFR 1.53 1.39 1.32
Contractor LTIFR 0.93 1.06 0.91
Combined LTIFR 1.32 1.25 1.17
401-3 Parental leave
b. Total number of employees that took parental leave, by gender
c. Total number of employees that returned to work in the reporting period after parental leave ended, by gender
WSA Lost Time Injury Frequency Rate
403 - Occupational health and safety
401-1: New employee hires and employee turnover
b. Total number and rate of employee turnover during the reporting period, by age group, gender and region
54 2020 CSN INTEGRATED REPORT | ANNEXES

2018 2019 2020
Employee subgroup
Age group Number of people
Percentage of women
Number of people
Percentage of men
Number of people
Percentage of women
Number of people
Percentage of men
Number of people
Percentage of women
Number of people
Percentage of men
STEELMAKING
Administrative
< 30 years old 61 61.00% 39 39.00% 58 57.43% 43 42.57% 48 56.47% 37 43.53%
> 50 years old 8 29.63% 19 70.37% 9 34.62% 17 65.38% 10 35.71% 18 64.29%
30 to 50 years old 79 56.83% 60 43.17% 76 56.72% 58 43.28% 63 50.81% 61 49.19%
Senior management
< 30 years old - - - - - - - - - - - -
> 50 years old - - 9 100.00% - - 9 100.00% - - 9 100.00%
30 to 50 years old 1 11.11% 8 88.89% 1 12.50% 7 87.50% 1 12.50% 7 87.50%
Apprentices from Capacitar
< 30 years old 47 51.65% 44 48.35% 36 55.38% 29 44.62% 10 55.56% 8 44.44%
> 50 years old - - - - - - - - - - - -
30 to 50 years old 40 67.80% 19 32.20% 51 83.61% 10 16.39% 21 95.45% 1 4.55%
Coordinators
< 30 years old - - - - - - - - - - - -
> 50 years old - - 17 100.00% - - 13 100.00% - - 10 100.00%
30 to 50 years old 8 20.51% 31 79.49% 11 23.40% 36 76.60% 11 25.58% 32 74.42%
Officers
< 30 years old - - - - - - - - - - - -
> 50 years old - - 2 100.00% - - 2 100.00% - - 2 100.00%
30 to 50 years old - - 1 100.00% - - 1 100.00% - - 1 100.00%
ExecutiveOfficers
< 30 years old - - - - - - - - - - - -
> 50 years old - - 1 100.00% - - 1 100.00% - - - -
30 to 50 years old - - - - - - - - - - - -
Engineering specialists
< 30 years old - - 1 100.00% 1 50.00% 1 50.00% - - - -
> 50 years old 2 5.88% 32 94.12% 3 7.89% 35 92.11% 3 7.89% 35 92.11%
30 to 50 years old 7 9.09% 70 90.91% 9 11.25% 71 88.75% 11 14.86% 63 85.14%
405 Diversity and equal opportunity405-1 Diversity of governance bodies and employees
405-1 b. Percentage of employees per employee category in each of the following diversity categories
55 2020 CSN INTEGRATED REPORT | ANNEXES
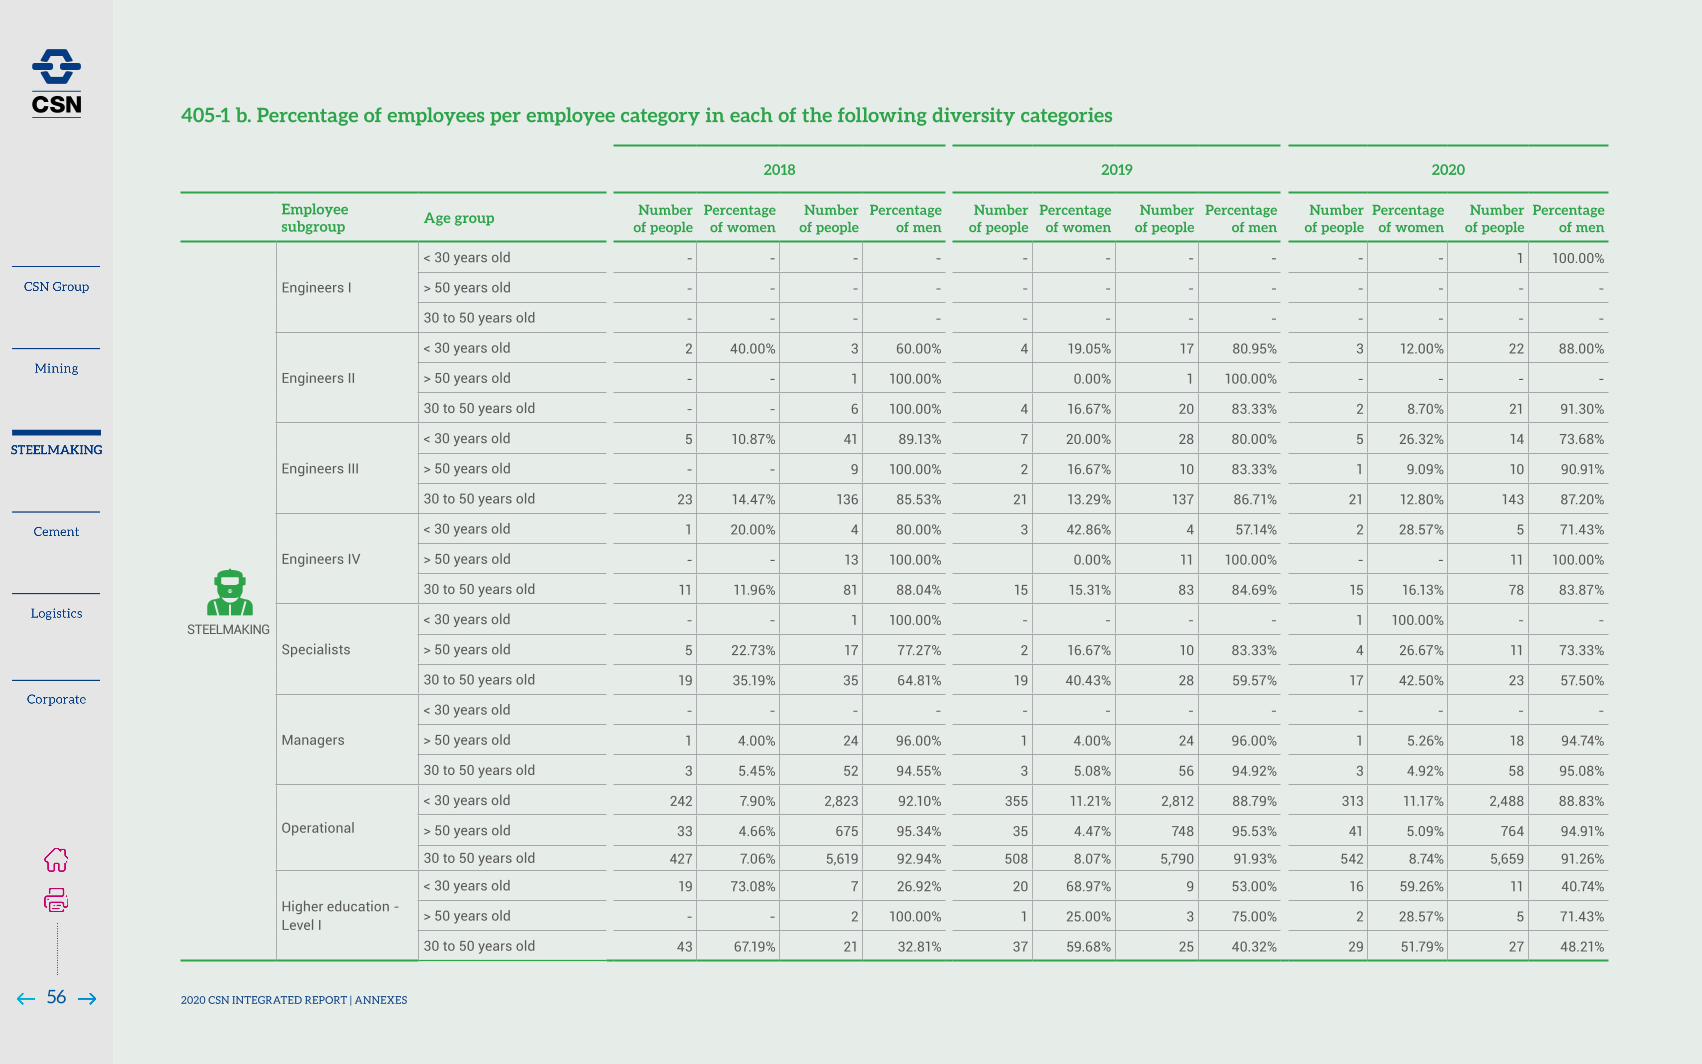
2018 2019 2020
Employee subgroup
Age group Number of people
Percentage of women
Number of people
Percentage of men
Number of people
Percentage of women
Number of people
Percentage of men
Number of people
Percentage of women
Number of people
Percentage of men
STEELMAKING
Engineers I
< 30 years old - - - - - - - - - - 1 100.00%
> 50 years old - - - - - - - - - - - -
30 to 50 years old - - - - - - - - - - - -
Engineers II
< 30 years old 2 40.00% 3 60.00% 4 19.05% 17 80.95% 3 12.00% 22 88.00%
> 50 years old - - 1 100.00% 0.00% 1 100.00% - - - -
30 to 50 years old - - 6 100.00% 4 16.67% 20 83.33% 2 8.70% 21 91.30%
Engineers III
< 30 years old 5 10.87% 41 89.13% 7 20.00% 28 80.00% 5 26.32% 14 73.68%
> 50 years old - - 9 100.00% 2 16.67% 10 83.33% 1 9.09% 10 90.91%
30 to 50 years old 23 14.47% 136 85.53% 21 13.29% 137 86.71% 21 12.80% 143 87.20%
Engineers IV
< 30 years old 1 20.00% 4 80.00% 3 42.86% 4 57.14% 2 28.57% 5 71.43%
> 50 years old - - 13 100.00% 0.00% 11 100.00% - - 11 100.00%
30 to 50 years old 11 11.96% 81 88.04% 15 15.31% 83 84.69% 15 16.13% 78 83.87%
Specialists
< 30 years old - - 1 100.00% - - - - 1 100.00% - -
> 50 years old 5 22.73% 17 77.27% 2 16.67% 10 83.33% 4 26.67% 11 73.33%
30 to 50 years old 19 35.19% 35 64.81% 19 40.43% 28 59.57% 17 42.50% 23 57.50%
Managers
< 30 years old - - - - - - - - - - - -
> 50 years old 1 4.00% 24 96.00% 1 4.00% 24 96.00% 1 5.26% 18 94.74%
30 to 50 years old 3 5.45% 52 94.55% 3 5.08% 56 94.92% 3 4.92% 58 95.08%
Operational
< 30 years old 242 7.90% 2,823 92.10% 355 11.21% 2,812 88.79% 313 11.17% 2,488 88.83%
> 50 years old 33 4.66% 675 95.34% 35 4.47% 748 95.53% 41 5.09% 764 94.91%
30 to 50 years old 427 7.06% 5,619 92.94% 508 8.07% 5,790 91.93% 542 8.74% 5,659 91.26%
Higher education - Level I
< 30 years old 19 73.08% 7 26.92% 20 68.97% 9 53.00% 16 59.26% 11 40.74%
> 50 years old - - 2 100.00% 1 25.00% 3 75.00% 2 28.57% 5 71.43%
30 to 50 years old 43 67.19% 21 32.81% 37 59.68% 25 40.32% 29 51.79% 27 48.21%
405-1 b. Percentage of employees per employee category in each of the following diversity categories
56 2020 CSN INTEGRATED REPORT | ANNEXES
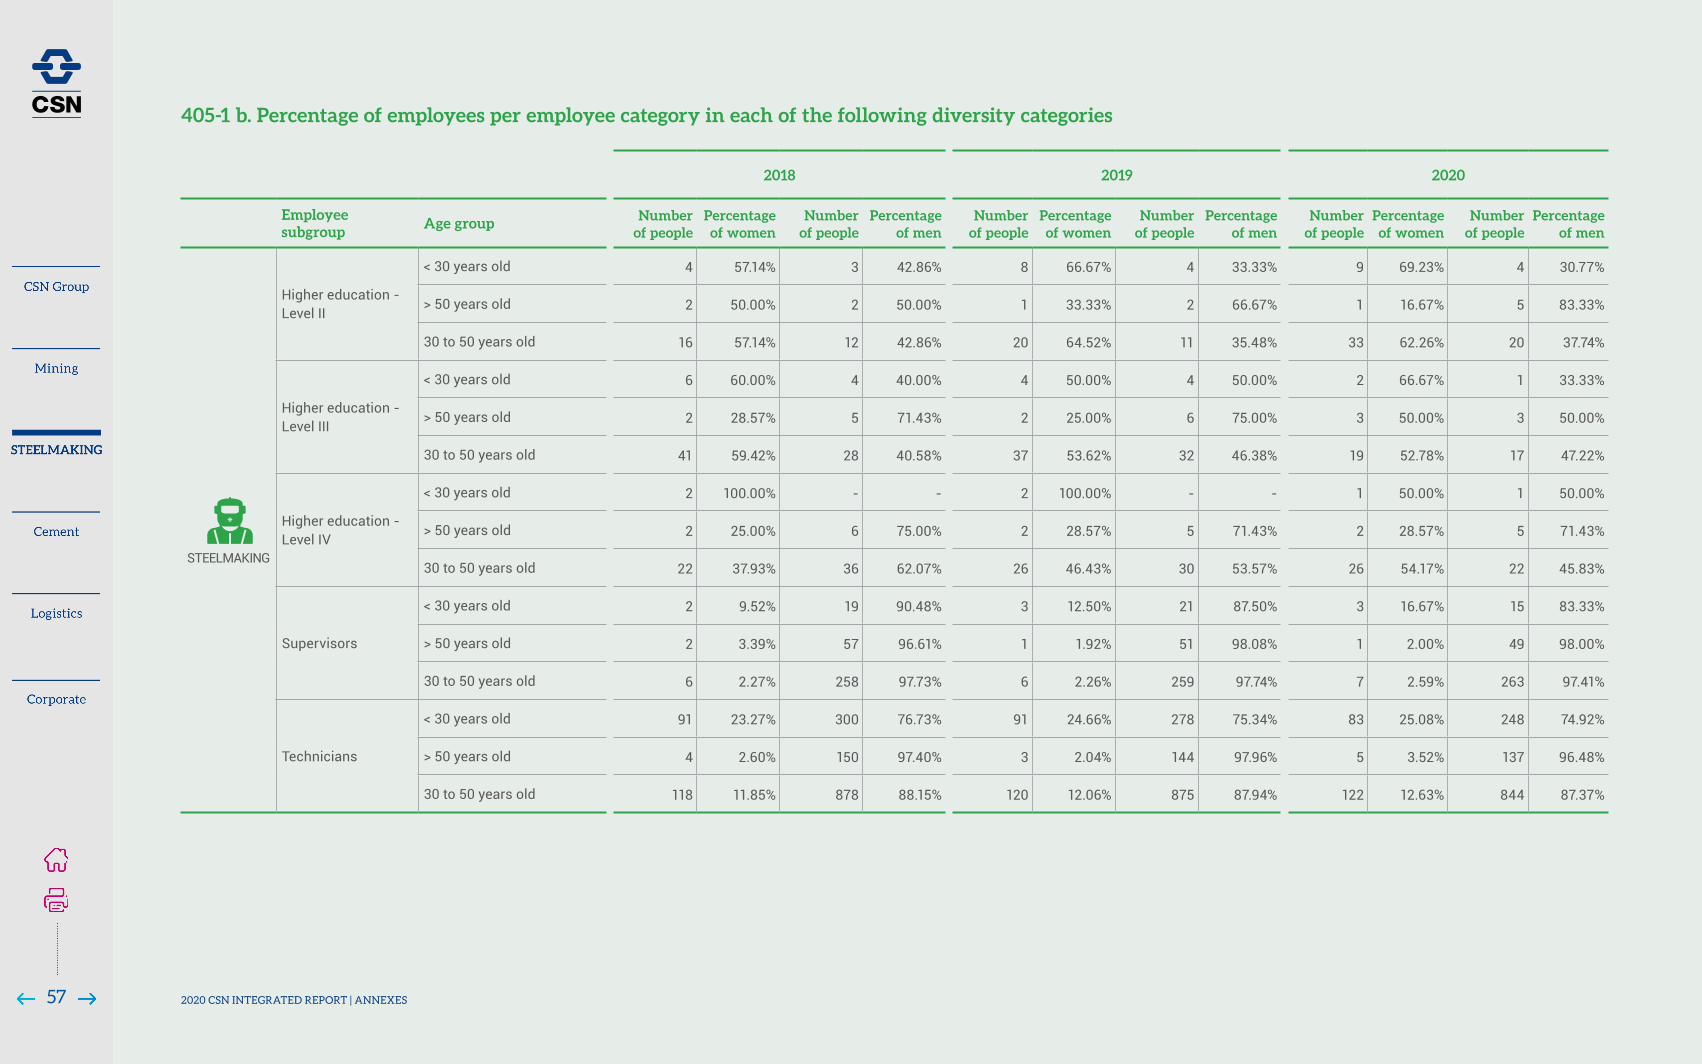
2018 2019 2020
Employee subgroup
Age group Number of people
Percentage of women
Number of people
Percentage of men
Number of people
Percentage of women
Number of people
Percentage of men
Number of people
Percentage of women
Number of people
Percentage of men
STEELMAKING
Higher education - Level II
< 30 years old 4 57.14% 3 42.86% 8 66.67% 4 33.33% 9 69.23% 4 30.77%
> 50 years old 2 50.00% 2 50.00% 1 33.33% 2 66.67% 1 16.67% 5 83.33%
30 to 50 years old 16 57.14% 12 42.86% 20 64.52% 11 35.48% 33 62.26% 20 37.74%
Higher education - Level III
< 30 years old 6 60.00% 4 40.00% 4 50.00% 4 50.00% 2 66.67% 1 33.33%
> 50 years old 2 28.57% 5 71.43% 2 25.00% 6 75.00% 3 50.00% 3 50.00%
30 to 50 years old 41 59.42% 28 40.58% 37 53.62% 32 46.38% 19 52.78% 17 47.22%
Higher education - Level IV
< 30 years old 2 100.00% - - 2 100.00% - - 1 50.00% 1 50.00%
> 50 years old 2 25.00% 6 75.00% 2 28.57% 5 71.43% 2 28.57% 5 71.43%
30 to 50 years old 22 37.93% 36 62.07% 26 46.43% 30 53.57% 26 54.17% 22 45.83%
Supervisors
< 30 years old 2 9.52% 19 90.48% 3 12.50% 21 87.50% 3 16.67% 15 83.33%
> 50 years old 2 3.39% 57 96.61% 1 1.92% 51 98.08% 1 2.00% 49 98.00%
30 to 50 years old 6 2.27% 258 97.73% 6 2.26% 259 97.74% 7 2.59% 263 97.41%
Technicians
< 30 years old 91 23.27% 300 76.73% 91 24.66% 278 75.34% 83 25.08% 248 74.92%
> 50 years old 4 2.60% 150 97.40% 3 2.04% 144 97.96% 5 3.52% 137 96.48%
30 to 50 years old 118 11.85% 878 88.15% 120 12.06% 875 87.94% 122 12.63% 844 87.37%
405-1 b. Percentage of employees per employee category in each of the following diversity categories
57 2020 CSN INTEGRATED REPORT | ANNEXES

CEMENT

We have a total of 849 suppliers in Cement, the national ones are located mostly in the following states, MG (39.44%), RJ (20.70%) and SP (14.41%). Our international suppliers represent 13.83%. Most Cement suppliers offer materials (70.99%) and services (29.01%). The most representative spend categories are, respectively: Road Transport, Reducers, Rail Transport, Ores and Minerals and Packaging.
2020
Minimum basic wage
Entry level wage
Ratio with entry level wage
Rótulos de Linha
Average basic wage
Men
Number of people
Average basic wage
Women
Number of people
Men Women
CEMENT 1,182.04 3 1,182.04 2 1.13 1.13
2019
Minimum basic wage
Entry level wage
Ratio with entry level wage
Rótulos de Linha
Average basic wage
Men
Number of people
Average basic wage
Women
Number of people
Men Women
CEMENT 1,182.04 3 1,182.04 2 1.18 1.18
202 Market presence202-1 Ratios of standard entry level wage by gender compared to local minimum wage
204 Procurement practices 204- 1 Proportion of spending on local suppliers
2018 2019 2020
% of local spent (consolidated)
CEMENT
37.0% 36.8% 31.7%
% spent with materials (Products)
32.8% 28.0% 20.7%
% of local expense with services
51.5% 55.8% 58.4%
Proportion of spending on local suppliers
201820192020
32%
37% 37%
102 - General Disclosures: Organizational profile 102-9: Supply chain
2018
Minimum basic wage
Entry level wage
Ratio with entry level wage
Rótulos de Linha
Average basic wage
Men
Number of people
Average basic wage
Women
Number of people
Men Women
CEMENT 1,149.78 1 1,125.00 4 1.21 1.18
102-13 - Membership of associations
Business area
Associations
CEMENT
Alternate FIEMG at State Council of the Environmental Policy (COPAM) - Alto São Francisco RegionalEffective Member of the Upper São Francisco River Hydrographic Basin CommitteeEffective Member of the Municipal Council for Environment (CODEMA) - Arcos cityEffective Member of the Advisory Council of the Corumbá Ecological Station - Ecological Station belonging to State Forestry Institute (IEF)
59 2020 CSN INTEGRATED REPORT | ANNEXES

301 - Materials
302 - Energy
301-1 Materials used by weight or volume 302-1 Energy consumption within the organization
Business area
Description Unit 2018 2019 2020
Materials used
CEMENT
Iron ore dry metric ton 20,062.00 4,394.00 22,744.22
Coke dry metric ton 195,744.90 198,564.20 222,363.01
Limestone dry metric ton 2,560,296.00 2,780,155.00 3,191,675.28
Crude dolomite dry metric ton 2,133.00 - -
TNT t 583.25 525.53 522.44
Acetylene t 1.76 - 2.09
Diesel t 1,923.59 584.26 2,657.17
LPG dry metric ton 180.68 147.03 131.43
Natural gas t 1,846.74 2,335.86 4,027.39
Gasoline t 24.69 21.29 24.12
Fuel oil t 2,714.31 - 2,922.58
Coal mill t 48,858.00 16,932.00 4,143.02
Clinker used t 1,861,286.00 2,067,593.00 2,302,630.00
Plaster t 65,234.00 95,850.05 110,027.34
Slag t 1,208,183.00 1,045,053.40 1,122,425.22
Total Materiais t 5,969,071.92 6,212,155.61 6,986,295.31
Produced Products
CEMENT
Equivalent cement production
t 3,469,360.00 3,546,466.00 3.976.470,00
Total Produced Products t 3,469,360.00 3,546,466.00 3.976.470,00
Business area
Description Unit 2018 2019 2020
Materials used
CEMENT
Total fuel consumption from non-renewable sources
GJ 7,575,032 6,918,208 7,735,023
Bituminous coal GJ 923,416 320,015 78,303
Petroleum coke GJ 6,361,711 6,453,338 7,226,798
Diesel / Brazil GJ 82,058 24,917 111,370
LiquefiedPetroleumGas(LPG) GJ 8,546 6,954 6,216
Natural gas GJ 88,644 112,121 193,315
Gasoline / Brazil GJ 999 862 949
Fuel oil GJ 109,658 - 118,072
Electricity, heating, cooling and steam acquired for consumption
GJ 759,233 790,071 944,327
i, electricity consumption GJ 759,233 790,071 944,327
Electricity acquired from the grid GJ 305,500 216,175 337,904
Electricity acquired from the grid (Clinker)
GJ 453,733 - -
Electricity acquired from the grid (Igarapava Hydroelectric Power Plant)
GJ - 59,495 55,892
Electricity acquired from the grid (Itá Hydroelectric Power Plant)
GJ - 514,401 550,530
Total energy consumption within theorganization
GJ 8,334,264 7,708,279 8,679,350
1- It does not have heating, cooling or steam consumption. It does not sell electricity, heating, cooling or steam. It does not have self-generated electricity, heating, cooling or steam. 2-Sourcesoftheconversionfactors:Nationalenergybalance,GHGProtocolandspecificdatafromCSN.
60 2020 CSN INTEGRATED REPORT | ANNEXES

302-4 Reduction of energy consumptiona. Eletricidade, aquecimento, refrigeração e vapor vendidos
Business area
Description Unit 2018 2019 2020
CEMENT
Amount of reductions in energy consumption achieved as a direct result of conservation andefficiencyinitiatives
GJ - (625,986) 345,086
Types of energy included in the reductions: whether fuel, electricity, cooling, steam, or all GJ
Fuel GJ - (656,824) 159,992
Electricity GJ - 30,838 185,094
302 - Energy
Note: Base year 2018. Sourcesused:NationalEnergyBalance(BEN),GHGProtocolandspecificdatafromCSN.
61 2020 CSN INTEGRATED REPORT | ANNEXES

2018 2019 2020
Business area In megaliters ML Source All areasAreas with
water stressAll areas
Areas with water stress
All areasAreas with
water stress
CEMENTWATER WITHDRAWAL BY SOURCE
Groundwater (total) WaterwithTotalDissolvedSolids≤1.000mg/L
248.16
- 244.66
-
245.96
-
303 - Water and effluents
1. There was no withdrawal of surface water, groundwater, ocean water, produced water and third party water
2018 2019 2020
Business area
In megaliters ML Source All areasAreas with
water stressAll areas
Areas with water stress
All areasAreas with
water stress
CEMENT
WATER WITHDRAWAL BY SOURCE
Total water withdrawal
Surface water (total) + groundwater (total) + seawater (total) + produced water (total) + third-party water (total)
248.16
- 244.66
-
245.96
-
303-3 Water withdrawal
CSN Cement
(in megaliters)
Total water withdrawal Total water discharge
202020192018
248.16 245.96244.66
1.00 1.85 0.83
62 2020 CSN INTEGRATED REPORT | ANNEXES

Note: There was no withdrawal of surface water, groundwater, ocean water, produced water and third party water
2018 2019 2020
Business area
In megaliters ML Source All areasAreas with
water stressAll areas
Areas with water stress
All areasAreas with
water stress
CEMENT
WATER DISCHARGE BY DESTINATION
Surface water (Total) 1.00 - 1.85 - 0.83 -
TOTAL WATER DISCHARGE
suface water (total) + groundwater (total) + seawater (total) + produced water (total) + third-party water (total)
- - - - 0.83 -
WATER DISCHARGE BY LEVEL OF TREATMENT
Treatment level Physical chemical and biological - - 0.83 -
303-4: Water discharge
2018 2019 2020
Business area
In megaliters ML Source All areasAreas with
water stressAll areas
Areas with water stress
All areasAreas with
water stress
CEMENT
WATER CONSUMPTION
Total water consumption 247.15 - 242.80 - 245.12 -
303-5: Water consumption
63 2020 CSN INTEGRATED REPORT | ANNEXES

305-4 GHG emissions intensity
305-1 Direct (Scope 1) GHG emissions 305-2 Energy indirect (Scope 2) GHG emissions 305-3 - Other indirect (Scope 3) GHG emissions
305 - Emissons
Category Emissions (Kg CO
2e/normalization factor)
2018 2019 2020
Kg CO2 eq/cement ton(2) 463.67 516.00 519.00
(2) According to Global Cement and Concrete Association (GCCA) methodology - Scope 1+2
Note: The increase in Scope 3 emissions is related to the improvement on the accounting methodology and management of the company's data
Business area
Emissions by scope (tCO2e) 2018 2019 2020
CEMENT
Scope 1 1,874,243.84 1,843,647.69 2,075,111.32
Scope 2 15,771.97 10,404.85 5,866.62
Scope 3 98,209.04 70,080.30 115,382.64
Emissions by scope - CSN Cimentos 2018 Emissions by scope - CSN Cimentos 2019 Emissions by scope - CSN Cimentos 2020
98,209.04 70,080.30 115,382.640
1,874,243.84 1,843,647.69 2,075,111.320
15,771.97 10,404.85 5,866.620
Scope 1 Scope 3Scope 2 Scope 1 Scope 3Scope 2 Scope 1 Scope 3Scope 2
64 2020 CSN INTEGRATED REPORT | ANNEXES

2018 2019 2020
Business area
Age range compiled Women Men Women Men Women Men
CEMENT
<30 years old 21 62 19 55 8 15
> 50 years old - 11 - 5 - 1
30 to 50 years old 11 85 30 92 8 28
401 Employment 401-1 New employee hires and employee turnover
a. Total number and rate of new employee hires during the reporting period, by age group, gender and region
Total weight of waste generate by composition of the waste
Unit 2018 2019 2020
Hazardouswaste t 218 606 1,746
Non-hazardouswaste t 2,224 1,334 1,433
Total waste generated t 2,442 1,940 3,179
306 Waste
306-3 Waste generated
CEMENT
Significant specific air emissions volume recorded by CSN Arcos - Cement (ton/clinker tons)
Specific emissions Category Source Unit 2018 2019 2020
NOX (excluding N2O) Furnace I and II t/year 1,591.71 1,187.69 2,197.20
SOX Furnace I and II t/year 16.42 316.13 36.23
Particulates (MP) – PM10
Arcos Cements: Furnace 01 /Furnace 02/Cement Mill 01/Cement Mill 02/Petcoke Mill 1/Petcoke Mill 2 Volta Redonda Cements: Cement Mill 01/Cement Mill 02/Packing 01/Packing 02
t/year 144.10 821.50 1,155.59
Volatile Organic Compounds (VOCs) Furnace I and II t/year 4.59 7.10 18.47
Polycyclic Aromatic Hydrocarbon (PAHs) Furnace I and II t/year 7.86 6.87 14.40
305-7 - Nitrogen oxides (NOx), sulfur oxides (SOx), and other significant air emissions
65 2020 CSN INTEGRATED REPORT | ANNEXES

401-1 New employee hires and employee turnover
b. Total number and rate of employee turnover during the reporting period, by age group, gender and region
TURNOVER
2018 2019 2020
Business area
RegionAge range compiled Women Men Women Men Women Men
CEMENT
Southeast <30 years old 22.73% 18.12% 21.01% 20.33% 19.49% 14.88%
Southeast > 50 years old 0 14.58% 0 16.45% 0 14.06%
Southeast30 to 50 years old 13.10% 16.27% 18.22% 17.88% 14.43% 12.76%
NEW HIRES
2018 2019 2020
Business area
RegionAge range compiled Women Men Women Men Women Men
CEMENT
Southeast <30 years old 21 62 19 55 8 15
Southeast > 50 years old 0 11 0 5 0 1
Southeast30 to 50 years old 11 85 30 92 8 28
401-1 New employee hires and employee turnover
a. Total number and rate of new employee hires during the reporting period, by age group, gender and region
DISMISSAL
2018 2019 2020
Business area
RegionAge range compiled Women Men Women Men Women Men
CEMENT
Southeast <30 years old 9 17 10 32 15 35
Southeast > 50 years old 0 10 0 20 0 17
Southeast30 to 50 years old 11 81 9 95 20 94
TOTAL WORKFORCE
2018 2019 2020
Business area
RegionAge range compiled Women Men Women Men Women Men
CEMENT
Southeast <30 years old 66 218 69 214 59 168
Southeast > 50 years old 3 72 3 76 5 64
Southeast30 to 50 years old 84 510 107 523 97 478
401-3 Parental leave
a. Total number of employees that were entitled to parental leave, by gender
2018 2019 2020
Business area Women Men Women Men Women Men
CSN GROUP 3,369 21,190 2,884 16,076 3,889 22,078
66 2020 CSN INTEGRATED REPORT | ANNEXES

2018 2019 2020
Business area Women Men Women Men Women Men
CEMENT
9 30 16 33 8 31
c. Total number of employees that returned to work in the reporting period after parental leave ended, by gender
2018 2019 2020
Business area Women Men Women Men Women Men
CEMENT
6 26 10 28 8 29
401-3 Parental leave
b. Total number of employees that took parental leave, by gender
401 Employment
403 - Occupational health and safety
Business area Unit Explanation 2018 2019 2020
CEMENT
Fatality rate. directly employed Number Reporteds as a rate per 10000 direct employees 0 0 0
Number of Fatalities (directly employed, contractros/ sub-contractors, third- parties
NumberNumber of fatalities of directly employed. contractors/subcontractors and third parties resulting from work-related incidents in a year
0 0 0
LTI Frquency Rate, directly employed NumberThe frequency rate is the number of lost time injuries per 1000000 (1 million) hours worked
0.63 0 0.61
LTI frequency rate, contractors and sub-contractors (on site)
NumberThe frequency rate is the number of lost time injuries per 1000000 (1 million) hours worked
0.53 0 0
LTI severity rate, directlyemployed NumberThe severity rate is the number of lost days caused by LTI per1000000(1million)hours worked
0 0 0
GCCA
Key Lagging Performance Inbdicators
Reference: https://gccassociation.org/wp-content/uploads/2020/03/GCCA_Guidelines_Safety_V1.0_Feb2020.pdf
67 2020 CSN INTEGRATED REPORT | ANNEXES

2018 2019 2020
Employee subgroup
Age group Number of people
Percentage of women
Number of people
Percentage of men
Number of people
Percentage of women
Number of people
Percentage of men
Number of people
Percentage of women
Number of people
Percentage of men
CEMENT
Administrative
< 30 years old 35 79.55% 9 20.45% 33 82.50% 7 17.50% 24 82.76% 5 17.24%
> 50 years old 1 100.00% - - 1 100.00% 0.00% 2 100.00% - -
30 to 50 years old 29 72.50% 11 27.50% 33 73.33% 12 26.67% 33 73.33% 12 26.67%
Senior management
< 30 years old - - - - - - - - - - - -
> 50 years old - - 2 100.00% - - 2 100.00% - - 2 100.00%
30 to 50 years old - - 2 100.00% - - 2 100.00% - - 2 100.00%
Coordinators
< 30 years old - - - - - - - - - - - -
> 50 years old - - 3 100.00% - - 3 100.00% - - 3 100.00%
30 to 50 years old 3 15.00% 17 85.00% 3 30.00% 7 70.00% 4 30.77% 9 69.23%
Engineering specialists
< 30 years old - - 1 100.00% - - - - - - - -
> 50 years old - - - - - - - - - - 1 100.00%
30 to 50 years old - - 5 100.00% 1 7.69% 12 92.31% 1 14.29% 6 85.71%
Engineers II
< 30 years old - - - - 1 100.00% - - 1 100.00% - -
> 50 years old - - - - - - - - - - - -
30 to 50 years old - - - - - - - - - - - -
Engineers III
< 30 years old - - 1 100.00% - - 1 100.00% - - 1 100.00%
> 50 years old - - - - - - - - - - - -
30 to 50 years old - - 3 100.00% - - 3 100.00% - - 3 100.00%
Engineers IV< 30 years old - - - - - - - - - - - -
> 50 years old - - 1 100.00% - - 1 100.00% - - 1 100.00%
Specialists
< 30 years old - - - - - - - - - - - -
> 50 years old - - 1 100.00% - - 2 100.00% - - 1 100.00%
30 to 50 years old - - 6 100.00% - - 6 100.00% - - 7 100.00%
405 - Diversity and equal opportunity
405-1: Diversity of governance bodies and employees b. Percentage of employees per employee category in each of the following diversity categories
68 2020 CSN INTEGRATED REPORT | ANNEXES

2018 2019 2020
Employee subgroup
Age group Number of people
Percentage of women
Number of people
Percentage of men
Number of people
Percentage of women
Number of people
Percentage of men
Number of people
Percentage of women
Number of people
Percentage of men
CEMENT
Managers
< 30 years old - - - - 10 5.68% 166 94.32% - - - -
> 50 years old - - 5 100.00% - - 38 100.00% - - 3 100.00%
30 to 50 years old - - 9 100.00% 16 5.71% 264 94.29% - - 8 100.00%
Operational
< 30 years old 6 3.47% 167 96.53% 3 75.00% 1 25.00% 11 7.91% 128 92.09%
> 50 years old - - 32 100.00% 4 80.00% 1 20.00% - - 35 100.00%
30 to 50 years old 5 1.82% 270 98.18% 4 50.00% 4 50.00% 14 5.36% 247 94.64%
Higher education - Level I
< 30 years old 2 40.00% 3 60.00% - - - - 7 100.00% - -
> 50 years old - - - - - - 1 100.00% - - - -
30 to 50 years old 6 100.00% - - 14 56.00% 11 44.00% 2 40.00% 3 60.00%
Higher education - Level II
< 30 years old 4 80.00% 1 20.00% 1 50.00% 1 50.00% 2 50.00% 2 50.00%
> 50 years old - - 1 100.00% 1 14.29% 6 85.71% 1 100.00% - -
30 to 50 years old 7 50.00% 7 50.00% 8 25.81% 23 74.19% 12 54.55% 10 45.45%
Higher education - Level III
< 30 years old 2 100.00% - - - - - - 1 100.00% - -
> 50 years old 1 11.11% 8 88.89% - - 3 100.00% 1 16.67% 5 83.33%
30 to 50 years old 11 29.73% 26 70.27% 8 38.10% 13 61.90% 5 25.00% 15 75.00%
Higher education - Level IV
< 30 years old - - - - 1 50.00% 1 50.00% - - 1 100.00%
> 50 years old - - 4 100.00% - - 1 100.00% - - 2 100.00%
30 to 50 years old 5 29.41% 12 70.59% 6 13.95% 37 86.05% 8 42.11% 11 57.89%
Supervisors
< 30 years old - - 3 100.00% 1 50.00% 1 50.00% 1 50.00% 1 50.00%
> 50 years old - - 2 100.00% - - 1 100.00% - - 1 100.00%
30 to 50 years old 6 18.18% 27 81.82% 6 13.95% 37 86.05% 5 14.29% 30 85.71%
Technicians
< 30 years old 17 34.00% 33 66.00% 16 32.65% 33 67.35% 12 28.57% 30 71.43%
> 50 years old 1 7.14% 13 92.86% 1 6.67% 14 93.33% 1 9.09% 10 90.91%
30 to 50 years old 9 7.38% 113 92.62% 12 9.16% 119 90.84% 12 9.68% 112 90.32%
405 - Diversity and equal opportunity
405-1: Diversity of governance bodies and employees b. Percentage of employees per employee category in each of the following diversity categories
69 2020 CSN INTEGRATED REPORT | ANNEXES

LOGISTICS

We have a total of 788 suppliers in Logistics, the national ones are located mostly in the following states, CE (44.59%), MG (19%) and SP (6.01%). Our international suppliers represent 16.73%. Most logistics providers offer materials (84.42%) and services (15.58%). The most representative spend categories are respectively: Civil Work, Maritime Transport, Facilities, Maintenance and Internal Transport.
2020
Minimum basic wage
Entry level wage
Ratio with entry level wage
Line labelsAverage
basic wage Men
Number of people
Average basic wage
Women
Number of people
Men Women
LOGISTICS 1,048.60 2 998.00 35 1.00 0.96
2018
Minimum basic wage
Entry level wage
Ratio with entry level wage
Line labelsAverage
basic wage Men
Number of people
Average basic wage
Women
Number of people
Men Women
LOGISTICS 954.00 2 954.00 20 1.00 1.00
2019
Minimum basic wage
Entry level wage
Ratio with entry level wage
Line labelsAverage
basic wage Men
Number of people
Average basic wage
Women
Number of people
Men Women
LOGISTICS 1,048.60 2 998.00 35 1.05 1.00
202-1 Ratios of standard entry level wage by gender compared to local minimum wage
202 Market presence
Proportion of spending on local suppliers
202020192018
33%
45%
29%
204 Procurement practices204- 1 Proportion of spending on local suppliers
2018 2019 2020
% of local expense (consolidated)
33.2% 29.1% 45.4%
LOGISTICS
% spent with materials (Products)
51.1% 36.3% 46.6%
% of local expense with services
15.6% 24.5% 45.2%
102 - General Disclosures: Organizational profile102-9: Supply chain
102-13 -Membership of associations
Business area
Associações
LOGISTICS
Area Committee of Sepetiba Bay (CABS)Brazilian Association of Port Terminals (ABTP)Port Operatosr Union of Itaguaí (SINDOPITA)Brazilian Association of Container Terminal (ABRATEC)National Association of Railroad Companies (ANTF)Agricultural Cooperation Association of Ceará State (ACACE)Association of Industrial and Port Complex Companies of Pecém (AECIPP)
71 2020 CSN INTEGRATED REPORT | ANNEXES

Business area
Description Unit 2018 2019 2020
Materials used
LOGISTICS
Acetylene t 2.32 0.26 3.87
Diesel t 9,303.90 8,506.03 9,145.45
LPG dry metric ton 23.28 23.02 3.08
Gasoline t 185.75 287.10 188.63
Ethanol t 0.17 0.49 0.84
Total Materials t 9,515.42 8,816.90 9,341.87
Produced Products
LOGISTICS
Total Produced Products t 0 0 0
301 - Materiais 301-1 Materials used by weight or volume
Business area
Description Unit 2018 2019 2020
LOGISTICS
Total non-renewable fuel consumption
GJ 405,513.06 375,470.32 390,879.61
Coque de petróleo GJ - - -
Diesel / Brazil GJ 396,894.11 362,761.39 383,314.36
LiquefiedPetroleumGas(LPG) GJ 1,101.14 1,088.85 145.68
Gasoline / Brazil GJ 7,517.81 11,620.08 7,419.57
Total renewable fuel consumption GJ 4.52 12.88 19.06
Hydrous ethanol GJ 4.52 12.88 19.06
Electricity, heating, cooling and steam acquired for consumption
GJ 48,690.54 3,986.14 6,268.08
i, electricity consumption GJ 48,690.54 3,986.14 6,268.08
Electricity acquired from the grid GJ 48,690.54 3,986.14 6,268.08
Total energy consumption within theorganization
GJ 454,208.12 379,469.33 397,166.75
302 - Energy 302-1 Energy consumption within the organization
1- It does not have heating, cooling or steam consumption. It does not sell electricity, heating, cooling or steam. It does not have self-generated electricity, heating, cooling or steam. 2-Sourcesoftheconversionfactors:Nationalenergybalance,GHGProtocolandspecificdatafromCSN.
302-4 Reduction of energy consumption
Business area
Description Unit 2018 2019 2020
LOGISTICS
Amount of reductions in energy consumption achieved as a direct result ofconservationandefficiencyinitiatives
GJ - (74,738.8) (57,041.4)
Types of energy included in the reductions: whether fuel, electricity, cooling, steam, or all
GJ - - -
Fuel GJ - (30,034.4) (14,618.9)
Electricity GJ - (44,704.4) (42,422.5)
1. Base year 2018. 2.Sourcesused:NationalEnergyBalance(BEN),GHGProtocolandspecificdatafromCSN.
72 2020 CSN INTEGRATED REPORT | ANNEXES
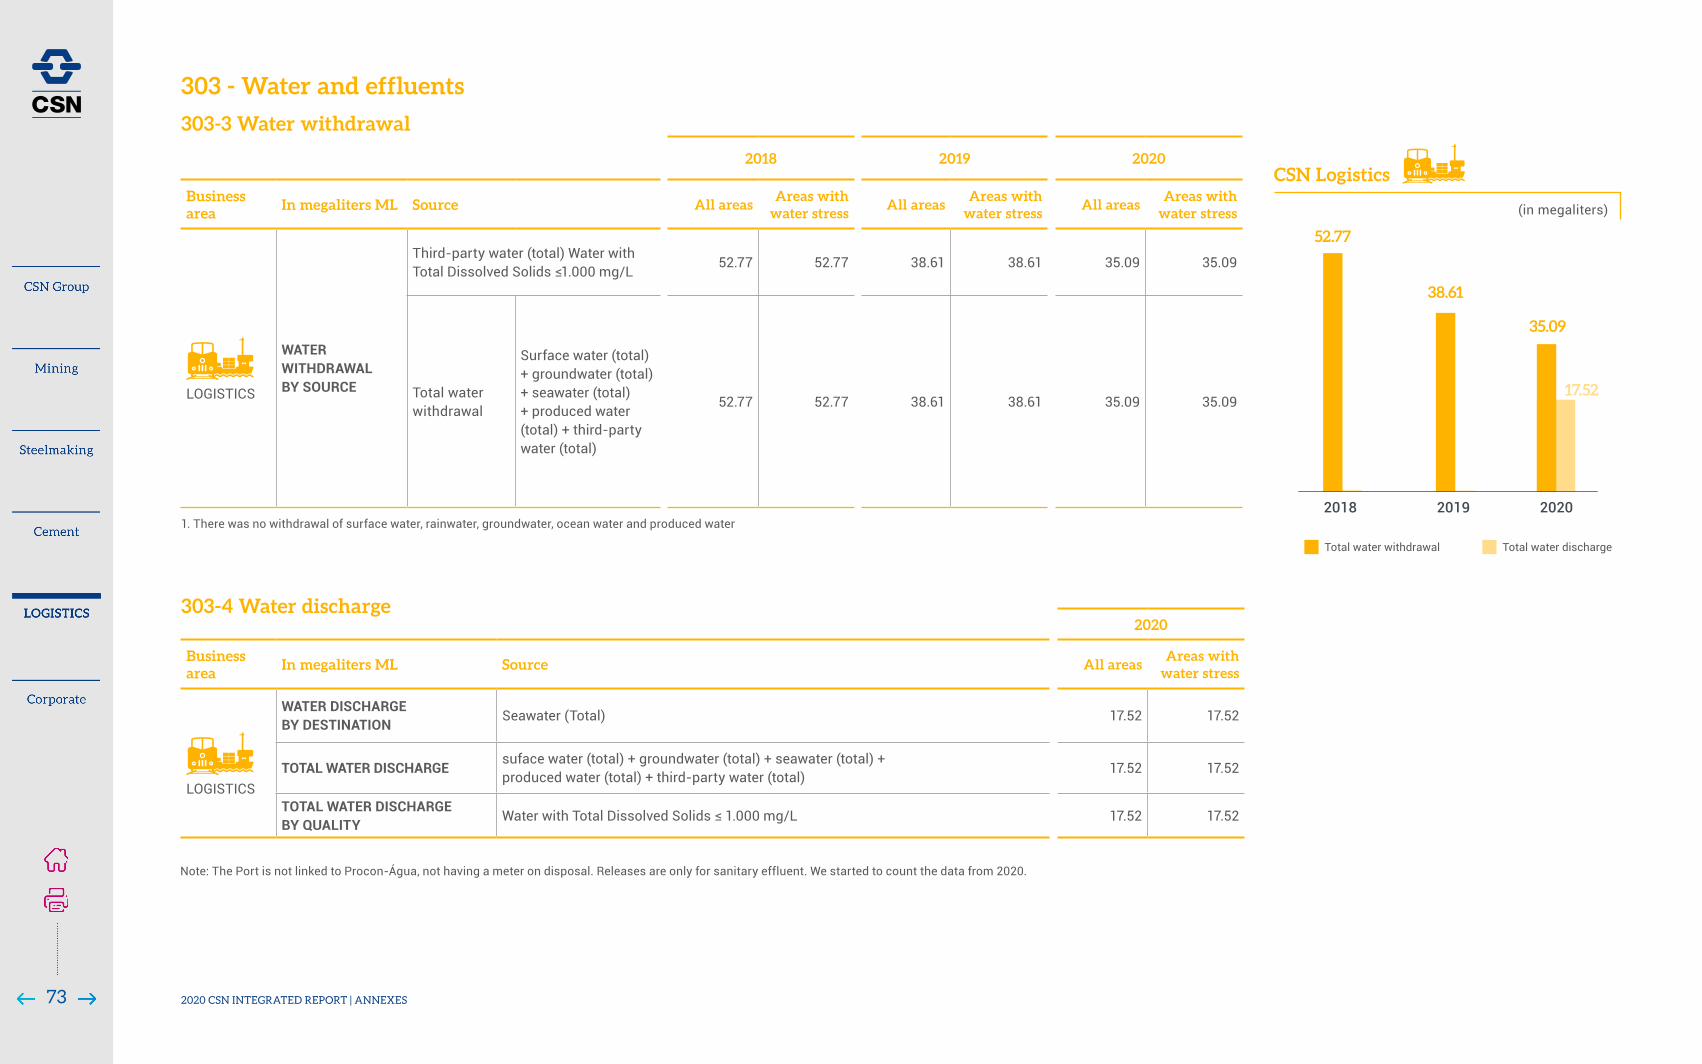
2018 2019 2020
Business area
In megaliters ML Source All areasAreas with
water stressAll areas
Areas with water stress
All areasAreas with
water stress
LOGISTICS
WATER WITHDRAWAL BY SOURCE
Third-party water (total) Water with TotalDissolvedSolids≤1.000mg/L
52.77 52.77 38.61 38.61 35.09 35.09
Total water withdrawal
Surface water (total) + groundwater (total) + seawater (total) + produced water (total) + third-party water (total)
52.77 52.77 38.61 38.61 35.09 35.09
303-3 Water withdrawal
Total water withdrawal Total water discharge
202020192018
CSN Logistics
(in megaliters)
1. There was no withdrawal of surface water, rainwater, groundwater, ocean water and produced water
303-4 Water discharge
2020
Business area
In megaliters ML Source All areasAreas with
water stress
LOGISTICS
WATER DISCHARGE BY DESTINATION
Seawater (Total) 17.52 17.52
TOTAL WATER DISCHARGE suface water (total) + groundwater (total) + seawater (total) + produced water (total) + third-party water (total)
17.52 17.52
TOTAL WATER DISCHARGE BY QUALITY
WaterwithTotalDissolvedSolids≤1.000mg/L 17.52 17.52
Note: The Port is not linked to Procon-Água, not having a meter on disposal. Releases are only for sanitary effluent. We started to count the data from 2020.
52.77
38.61
35.09
17.52
303 - Water and effluents
73 2020 CSN INTEGRATED REPORT | ANNEXES

Logistics CompanyNotice of Infraction
Date of Issue
Restated fine amount
Root cause Status
Notice of Infraction with Fine≥1mm Notices + Embargoes
SEPETIBA TECON
CILAMNOT 01108304
26/06/19Embargoes to the activities
Non-compliance with the permit
Discussion in court
307 Environmental Compliance 307-1 Non-compliance with environmental laws and regulations
2018 2019 2020
Business area
Age range compiled Women Men Women Men Women Men
LOGISTICS
<30 years old 25 124 18 77 4 16
> 50 years old 1 7 - 5 1 1
30 to 50 years old 17 116 14 109 6 23
401 Employment 401-1: New employee hires and employee turnover
a. Total number and rate of new employee hires during the reporting period, by age group, gender and region
303-5 Water consumption
2020
Business area In megaliters ML Source All areasAreas with
water stress
LOGISTICS
WATER CONSUMPTION Total water consumption 35.09 -
Total weight of waste generate by composition of the waste
Unit 2018 2019 2020
Hazardouswaste t 628 182 239
Non-hazardouswaste t 3,843 3,718 2,757
Total waste generated t 4,471 3,900 2,996
306 Waste306-3 Waste generated
74 2020 CSN INTEGRATED REPORT | ANNEXES

401-1: New employee hires and employee turnover
b. Total number and rate of employee turnover during the reporting period, by age group, gender and region
TURNOVER
2018 2019 2020
Business area
RegionAge range compiled Women Men Women Men Women Men
LOGISTICS
Northeast
<30 years old 22.22% 24.34% 27.17% 21.68% 13.24% 11.11%
> 50 years old 16.67% 6.25% 5.56% 8.21% 18.75% 26.35%
30 to 50 years old 11.29% 10.63% 14.62% 13.95% 18.18% 11.81%
Southeast
<30 years old 12.00% 19.42% 13.89% 19.51% 4.69% 16.90%
> 50 years old - 8.59% - 12.50% - -
30 to 50 years old 18.09% 9.82% 18.18% 13.17% 12.79% 9.49%
NEW HIRES
2018 2019 2020
Business area
RegionAge range compiled Women Men Women Men Women Men
LOGISTICS
Northeast
<30 years old 15 64 14 59 2 11
> 50 years old 1 5 3 1 1
30 to 50 years old 8 80 10 95 4 23
Southeast
<30 years old 10 60 4 18 2 5
> 50 years old - 2 2 - -
30 to 50 years old 9 36 4 14 2 -
401 Employment
DISMISSAL
2018 2019 2020
Business area
RegionAge range compiled Women Men Women Men Women Men
LOGISTICS
Northeast
<30 years old 5 28 11 26 7 23
> 50 years old 2 20 1 30 2 77
30 to 50 years old 6 58 9 90 16 113
Southeast
<30 years old 2 48 6 62 1 43
> 50 years old - 9 - 13 1 17
30 to 50 years old 8 40 12 74 9 56
TOTAL WORKFORCE
2018 2019 2020
Business area
RegionAge range compiled Women Men Women Men Women Men
LOGISTICS
Northeast
<30 years old 45 189 46 196 34 153
> 50 years old 9 200 9 201 8 148
30 to 50 years old 62 649 65 663 55 576
Southeast
<30 years old 50 278 36 205 32 142
> 50 years old 2 64 3 60 2 52
30 to 50 years old 47 387 44 334 43 295
401-1: New employee hires and employee turnover
b. Total number and rate of employee turnover during the reporting period, by age group, gender and region
75 2020 CSN INTEGRATED REPORT | ANNEXES

2018 2019 2020
Employee subgroup
Age group Number of people
Percentage of women
Number of people
Percentage of men
Number of people
Percentage of women
Number of people
Percentage of men
Number of people
Percentage of women
Number of people
Percentage of men
LOGISTICS
Administrative
< 30 years old 23 56.10% 18 43.90% 23 56.10% 18 43.90% 17 47.22% 19 52.78%
> 50 years old - - 7 100.00% - - 6 100.00% - - 6 100.00%
30 to 50 years old 16 47.06% 18 52.94% 15 42.86% 20 57.14% 12 40.00% 18 60.00%
Senior management
> 50 years old - - 2 100.00% - - 2 100.00% - - 2 100.00%
30 to 50 years old - - 3 100.00% - - 2 100.00% - - 2 100.00%
Apprentices from Capacitar
< 30 years old - - 2 100.00% 1 33.33% 2 66.67% - - 1 100.00%
> 50 years old - - 4 100.00% - - 4 100.00% - - 3 100.00%
30 to 50 years old 7 23.33% 23 76.67% 6 22.22% 21 77.78% 5 19.23% 21 80.77%
Coordinators > 50 years old - - 4 100.00% - - 3 100.00% - - 3 100.00%
Officers 30 to 50 years old - - - - - - 1 100.00% - - 1 100.00%
ExecutiveOfficers > 50 years old - - 1 100.00% - - 1 100.00% - - - -
Engineering specialists
< 30 years old - - 1 100.00% 1 50.00% 1 50.00% - - - -
> 50 years old 2 5.88% 32 94.12% 3 7.89% 35 92.11% 3 7.89% 35 92.11%
30 to 50 years old 7 9.09% 70 90.91% 9 11.25% 71 88.75% 11 14.86% 63 85.14%
405 Diversity of governance bodies and employees 405-1 b. Percentage of employees per employee category in each of the following diversity categories
2018 2019 2020
Business area Women Men Women Men Women Men
LOGISTICS
15 49 7 56 75 401
2018 2019 2020
Business area Women Men Women Men Women Men
LOGISTICS
11 33 5 45 72 383
401-3 - Parental leave
b. Total number of employees that took parental leave, by gender
401-3 - Parental leave
c. Total number of employees that returned to work in the reporting period after parental leave ended, by gender
76 2020 CSN INTEGRATED REPORT | ANNEXES
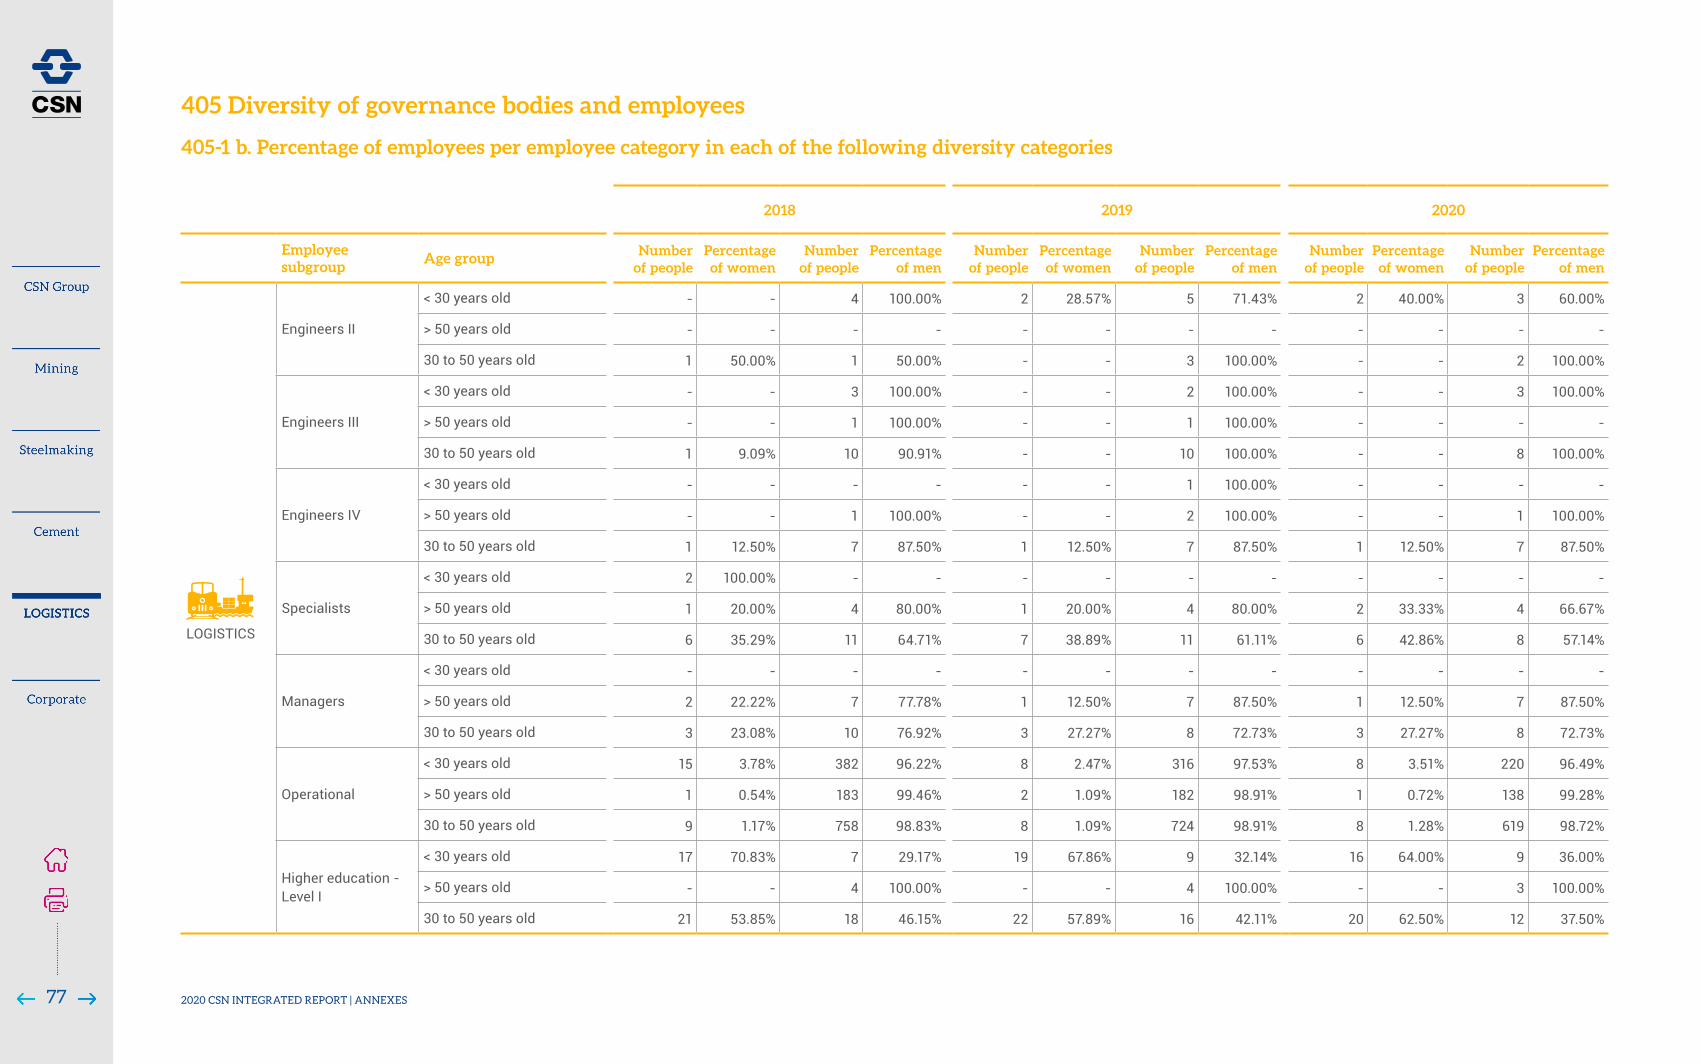
2018 2019 2020
Employee subgroup
Age group Number of people
Percentage of women
Number of people
Percentage of men
Number of people
Percentage of women
Number of people
Percentage of men
Number of people
Percentage of women
Number of people
Percentage of men
LOGISTICS
Engineers II
< 30 years old - - 4 100.00% 2 28.57% 5 71.43% 2 40.00% 3 60.00%
> 50 years old - - - - - - - - - - - -
30 to 50 years old 1 50.00% 1 50.00% - - 3 100.00% - - 2 100.00%
Engineers III
< 30 years old - - 3 100.00% - - 2 100.00% - - 3 100.00%
> 50 years old - - 1 100.00% - - 1 100.00% - - - -
30 to 50 years old 1 9.09% 10 90.91% - - 10 100.00% - - 8 100.00%
Engineers IV
< 30 years old - - - - - - 1 100.00% - - - -
> 50 years old - - 1 100.00% - - 2 100.00% - - 1 100.00%
30 to 50 years old 1 12.50% 7 87.50% 1 12.50% 7 87.50% 1 12.50% 7 87.50%
Specialists
< 30 years old 2 100.00% - - - - - - - - - -
> 50 years old 1 20.00% 4 80.00% 1 20.00% 4 80.00% 2 33.33% 4 66.67%
30 to 50 years old 6 35.29% 11 64.71% 7 38.89% 11 61.11% 6 42.86% 8 57.14%
Managers
< 30 years old - - - - - - - - - - - -
> 50 years old 2 22.22% 7 77.78% 1 12.50% 7 87.50% 1 12.50% 7 87.50%
30 to 50 years old 3 23.08% 10 76.92% 3 27.27% 8 72.73% 3 27.27% 8 72.73%
Operational
< 30 years old 15 3.78% 382 96.22% 8 2.47% 316 97.53% 8 3.51% 220 96.49%
> 50 years old 1 0.54% 183 99.46% 2 1.09% 182 98.91% 1 0.72% 138 99.28%
30 to 50 years old 9 1.17% 758 98.83% 8 1.09% 724 98.91% 8 1.28% 619 98.72%
Higher education - Level I
< 30 years old 17 70.83% 7 29.17% 19 67.86% 9 32.14% 16 64.00% 9 36.00%
> 50 years old - - 4 100.00% - - 4 100.00% - - 3 100.00%
30 to 50 years old 21 53.85% 18 46.15% 22 57.89% 16 42.11% 20 62.50% 12 37.50%
405 Diversity of governance bodies and employees 405-1 b. Percentage of employees per employee category in each of the following diversity categories
77 2020 CSN INTEGRATED REPORT | ANNEXES

2018 2019 2020
Employee subgroup
Age group Number of people
Percentage of women
Number of people
Percentage of men
Number of people
Percentage of women
Number of people
Percentage of men
Number of people
Percentage of women
Number of people
Percentage of men
LOGISTICS
Higher education - Level II
< 30 years old 9 40.91% 13 59.09% 8 53.33% 7 46.67% 9 69.23% 4 30.77%
> 50 years old 1 14.29% 6 85.71% 1 14.29% 6 85.71% 1 16.67% 5 83.33%
30 to 50 years old 16 44.44% 20 55.56% 18 46.15% 21 53.85% 33 62.26% 20 37.74%
Higher education - Level III
< 30 years old 1 25.00% 3 75.00% 1 33.33% 2 66.67% 2 66.67% 1 33.33%
> 50 years old 2 33.33% 4 66.67% 3 42.86% 4 57.14% 3 50.00% 3 50.00%
30 to 50 years old 10 41.67% 14 58.33% 8 33.33% 16 66.67% 19 52.78% 17 47.22%
Higher education - Level IV
< 30 years old - - 4 100.00% - - 2 100.00% 1 50.00% 1 50.00%
> 50 years old 1 100.00% - - 1 100.00% - - 2 28.57% 5 71.43%
30 to 50 years old 8 57.14% 6 42.86% 5 41.67% 7 58.33% 26 54.17% 22 45.83%
Supervisors
< 30 years old 6 85.71% 1 14.29% 4 66.67% 2 33.33% 3 16.67% 15 83.33%
> 50 years old - - 19 100.00% - - 20 100.00% 1 2.00% 49 98.00%
30 to 50 years old 2 4.55% 42 95.45% 3 6.67% 42 93.33% 7 2.59% 263 97.41%
Technicians
< 30 years old 22 42.31% 30 57.69% 16 31.37% 35 68.63% 83 25.08% 248 74.92%
> 50 years old 3 14.29% 18 85.71% 3 15.79% 16 84.21% 5 3.52% 137 96.48%
30 to 50 years old 8 7.77% 95 92.23% 13 12.87% 88 87.13% 122 12.63% 844 87.37%
405-1 b. Percentage of employees per employee category in each of the following diversity categories
78 2020 CSN INTEGRATED REPORT | ANNEXES
CORPORATE
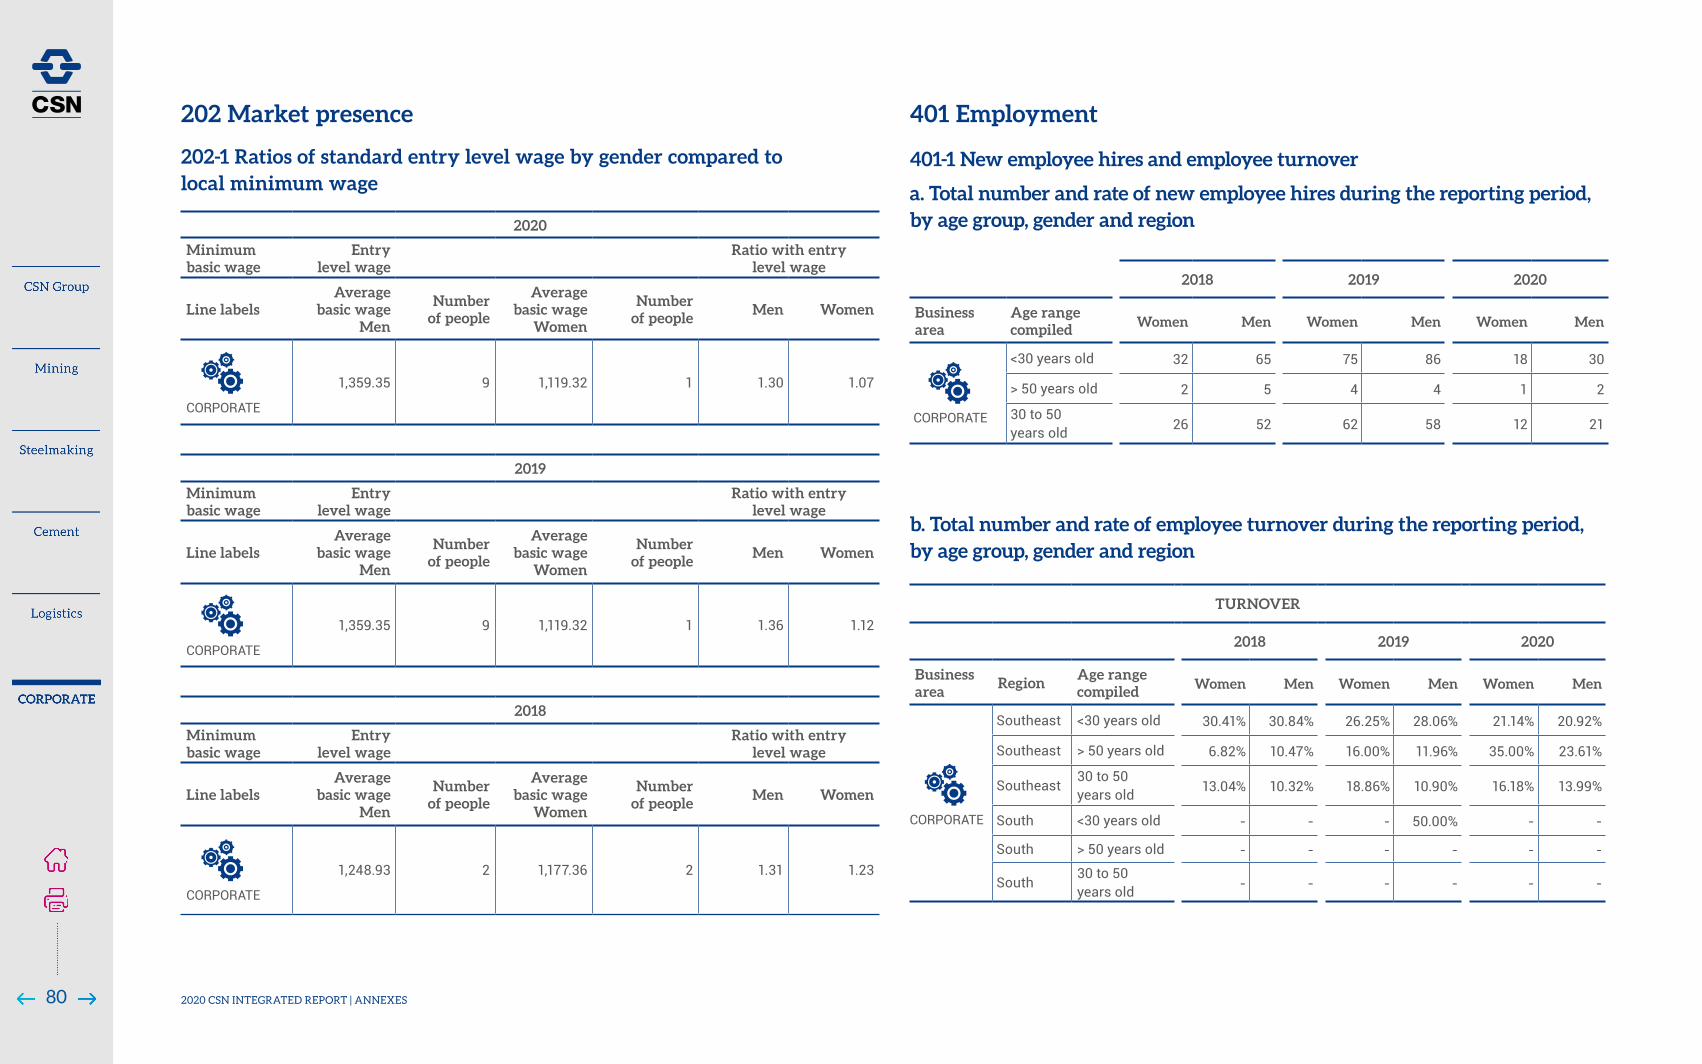
2020
Minimum basic wage
Entry level wage
Ratio with entry level wage
Line labels Average
basic wage Men
Number of people
Average basic wage
Women
Number of people
Men Women
CORPORATE
1,359.35 9 1,119.32 1 1.30 1.07
2019
Minimum basic wage
Entry level wage
Ratio with entry level wage
Line labels Average
basic wage Men
Number of people
Average basic wage
Women
Number of people
Men Women
CORPORATE
1,359.35 9 1,119.32 1 1.36 1.12
2018
Minimum basic wage
Entry level wage
Ratio with entry level wage
Line labels Average
basic wage Men
Number of people
Average basic wage
Women
Number of people
Men Women
CORPORATE
1,248.93 2 1,177.36 2 1.31 1.23
202 Market presence
202-1 Ratios of standard entry level wage by gender compared to local minimum wage
80 2020 CSN INTEGRATED REPORT | ANNEXES
2018 2019 2020
Business area
Age range compiled Women Men Women Men Women Men
CORPORATE
<30 years old 32 65 75 86 18 30
> 50 years old 2 5 4 4 1 2
30 to 50 years old 26 52 62 58 12 21
401 Employment 401-1 New employee hires and employee turnover
a. Total number and rate of new employee hires during the reporting period, by age group, gender and region
TURNOVER
2018 2019 2020
Business area
RegionAge range compiled Women Men Women Men Women Men
CORPORATE
Southeast <30 years old 30.41% 30.84% 26.25% 28.06% 21.14% 20.92%
Southeast > 50 years old 6.82% 10.47% 16.00% 11.96% 35.00% 23.61%
Southeast30 to 50 years old 13.04% 10.32% 18.86% 10.90% 16.18% 13.99%
South <30 years old - - - 50.00% - -
South > 50 years old - - - - - -
South30 to 50 years old - - - - - -
b. Total number and rate of employee turnover during the reporting period, by age group, gender and region

401-1 New employee hires and employee turnover
b. Total number and rate of employee turnover during the reporting period, by age group, gender and region
2018 2019 2020
Business area Women Men Women Men Women Men
CORPORATE
13 19 26 23 12 14
2018 2019 2020
Business area Women Men Women Men Women Men
CORPORATE
10 18 13 22 11 11
401-3 Parental leave b. Total number of employees that took parental leave, by gender
c. Total number of employees that returned to work in the reporting period after parental leave ended, by gender
81 2020 CSN INTEGRATED REPORT | ANNEXES
NEW HIRES
2018 2019 2020
Business area
RegionAge range compiled Women Men Women Men Women Men
CORPORATE
Southeast <30 years old 32 65 75 85 18 29
Southeast > 50 years old 2 5 4 4 1 2
Southeast30 to 50 years old 26 52 62 57 12 21
South <30 years old - - 1 - 1
South > 50 years old - - - - - -
South30 to 50 years old - - - 1 - -
TOTAL WORKFORCE
2018 2019 2020
Business area
RegionAge range compiled Women Men Women Men Women Men
CORPORATE
Southeast <30 years old 97 154 160 196 123 153
Southeast > 50 years old 22 86 25 92 20 72
Southeast30 to 50 years old 230 436 281 454 241 404
South <30 years old 1 2 - 2 2 2
South > 50 years old 1 1 1 2 - 3
South30 to 50 years old 5 17 6 17 4 15
DISMISSAL
2018 2019 2020
Business area
RegionAge range compiled Women Men Women Men Women Men
CORPORATE
Southeast <30 years old 27 30 9 25 34 35
Southeast > 50 years old 1 13 4 18 13 32
Southeast30 to 50 years old 34 38 44 42 66 92
South <30 years old - - - 1 - -
South > 50 years old - - - - 1 -
South30 to 50 years old - - - - 1 1

405 - Diversity and equal opportunity
405-1 b. Percentage of employees per employee category in each of the following diversity categories
2018 2019 2020
Employee subgroup
Age group Number of people
Percentage of women
Number of people
Percentage of men
Number of people
Percentage of women
Number of people
Percentage of men
Number of people
Percentage of women
Number of people
Percentage of men
CORPORATE
Administrative
< 30 years old 4 57.14% 3 42.86% 30 53.57% 26 46.43% 21 51.22% 20 48.78%
> 50 years old 5 55.56% 4 44.44% 4 44.44% 5 55.56% 3 42.86% 4 57.14%
30 to 50 years old - - - - 22 36.07% 39 63.93% 19 35.19% 35 64.81%
Senior management
> 50 years old 1 10.00% 9 90.00% 1 12.50% 7 87.50% 1 12.50% 7 87.50%
30 to 50 years old 3 16.67% 15 83.33% 3 13.64% 19 86.36% 3 15.79% 16 84.21%
Coordinators> 50 years old 2 18.18% 9 81.82% 2 14.29% 12 85.71% 2 20.00% 8 80.00%
30 to 50 years old 12 32.43% 25 67.57% 15 36.59% 26 63.41% 16 39.02% 25 60.98%
CEO > 50 years old - 0.00% 1 100.00% - 0.00% 1 100.00% - 0.00% 1 100.00%
Officers> 50 years old 1 16.67% 5 83.33% 2 28.57% 5 71.43% 1 20.00% 4 80.00%
> 50 years old 1 16.67% 5 83.33% - 0.00% 6 100.00% 1 12.50% 7 87.50%
Executive Officers
> 50 years old - 0.00% 2 100.00% - 0.00% 2 100.00% - 0.00% 2 100.00%
30 to 50 years old - 0.00% 1 100.00% - 0.00% 1 100.00% - 0.00% 1 100.00%
Engineering specialists
> 50 years old - 0.00% 1 100.00% - 0.00% 2 100.00% - 0.00% 1 100.00%
30 to 50 years old - 0.00% 4 100.00% 1 33.33% 2 66.67% 1 33.33% 2 66.67%
Engineers III < 30 years old 3 100.00% - 0.00% 1 100.00% - 0.00% 1 100.00% - 0.00%
Engineers IV < 30 years old - - - - 1 100.00% - 0.00% 1 100.00% - 0.00%
Specialists
< 30 years old 6 50.00% 6 50.00% 4 33.33% 8 66.67% 3 42.86% 4 57.14%
> 50 years old 3 18.75% 13 81.25% 3 17.65% 14 82.35% 3 18.75% 13 81.25%
30 to 50 years old 58 47.93% 63 52.07% 65 52.85% 58 47.15% 51 47.66% 56 52.34%
Managers
< 30 years old 1 100.00% 0.00% 1 50.00% 1 50.00% 1 50.00% 1 50.00%
> 50 years old 3 27.27% 8 72.73% 2 20.00% 8 80.00% 2 25.00% 6 75.00%
30 to 50 years old 16 31.37% 35 68.63% 18 33.96% 35 66.04% 17 34.69% 32 65.31%
82 2020 CSN INTEGRATED REPORT | ANNEXES

2018 2019 2020
Employee subgroup
Age group Number of people
Percentage of women
Number of people
Percentage of men
Number of people
Percentage of women
Number of people
Percentage of men
Number of people
Percentage of women
Number of people
Percentage of men
CORPORATE
Operational
< 30 years old 1 1.67% 59 98.33% 6 7.69% 72 92.31% 4 7.55% 49 92.45%
> 50 years old 1 11.11% 8 88.89% 1 10.00% 9 90.00% 1 11.11% 8 88.89%
30 to 50 years old 3 3.23% 90 96.77% 7 7.37% 88 92.63% 6 7.50% 74 92.50%
Higher education - Level I
< 30 years old 42 60.87% 27 39.13% 64 62.14% 39 37.86% 46 58.23% 33 41.77%
> 50 years old 4 40.00% 6 60.00% 5 50.00% 5 50.00% 3 42.86% 4 57.14%
30 to 50 years old 18 38.30% 29 61.70% 33 50.77% 32 49.23% 30 55.56% 24 44.44%
Higher education - Level II
< 30 years old 14 43.75% 18 56.25% 21 56.76% 16 43.24% 25 56.82% 19 43.18%
> 50 years old 3 50.00% 3 50.00% 3 37.50% 5 62.50% 1 33.33% 2 66.67%
30 to 50 years old 28 43.08% 37 56.92% 25 37.88% 41 62.12% 37 41.57% 52 58.43%
Higher education - Level III
< 30 years old 13 54.17% 11 45.83% 18 72.00% 7 28.00% 7 58.33% 5 41.67%
> 50 years old 2 25.00% 6 75.00% 2 20.00% 8 80.00% 2 20.00% 8 80.00%
30 to 50 years old 35 46.67% 40 53.33% 44 51.76% 41 48.24% 17 40.48% 25 59.52%
Higher education - Level IV
< 30 years old 8 38.10% 13 61.90% 9 40.91% 13 59.09% 12 57.14% 9 42.86%
> 50 years old - 0.00% 5 100.00% - 0.00% 6 100.00% - 0.00% 3 100.00%
30 to 50 years old 46 47.42% 51 52.58% 43 43.43% 56 56.57% 40 44.94% 49 55.06%
Supervisors
< 30 years old 1 100.00% - 0.00% - 0.00% 1 100.00% - 0.00% 1 100.00%
> 50 years old 1 33.33% 2 66.67% 1 50.00% 1 50.00% 1 33.33% 2 66.67%
30 to 50 years old 1 14.29% 6 85.71% 1 12.50% 7 87.50% 1 16.67% 5 83.33%
Technicians
< 30 years old 5 20.83% 19 79.17% - 0.00% 12 100.00% 2 12.50% 14 87.50%
> 50 years old 2 18.18% 9 81.82% - 0.00% 4 100.00% 0.00% 2 100.00%
30 to 50 years old 9 15.79% 48 84.21% 10 33.33% 20 66.67% 6 27.27% 16 72.73%
Trainees < 30 years old - - - - 5 62.50% 3 37.50% 2 100.00% - 0.00%
405 - Diversity and equal opportunity
405-1 b. Percentage of employees per employee category in each of the following diversity categories
83 2020 CSN INTEGRATED REPORT | ANNEXES
Related Documents