01/2015 1 EPI 5344: Survival Analysis in Epidemiology Maximum Likelihood Estimation: An Introduction March 10, 2015 Dr. N. Birkett, School of Epidemiology, Public Health & Preventive Medicine, University of Ottawa

Welcome message from author
This document is posted to help you gain knowledge. Please leave a comment to let me know what you think about it! Share it to your friends and learn new things together.
Transcript
101/2015
EPI 5344:Survival Analysis in
EpidemiologyMaximum Likelihood Estimation: An Introduction
March 10, 2015
Dr. N. Birkett,School of Epidemiology, Public Health &
Preventive Medicine,University of Ottawa

201/2015
Objectives
• MLE was introduced by me in EPI5340• Likely covered in other courses too.• Won’t cover much on the basics.• Parameter estimation using maximum
likelihood• Using MLE to estimate variance and do
statistical testing.

301/2015
Intro (1)
• Conduct an experiment– Toss a coin 10 times and observe 6 heads– What is the probability of getting a head when
tossing this coin?– NOTE: we do not know that the coin is fair!
• Let p = prob(head). Assume binomial dist’n:
401/2015
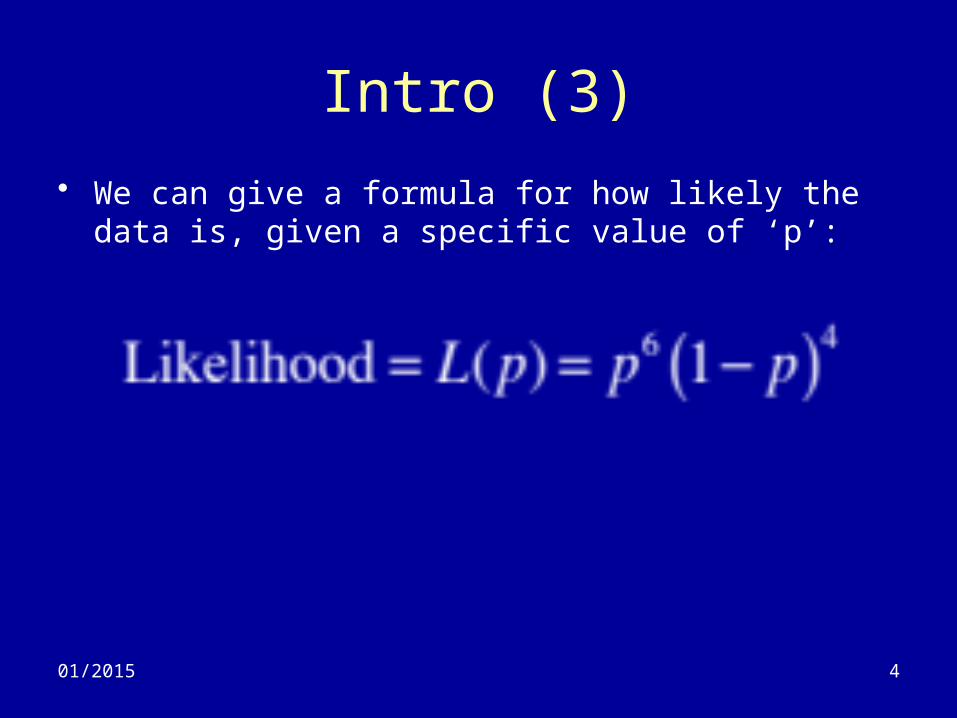
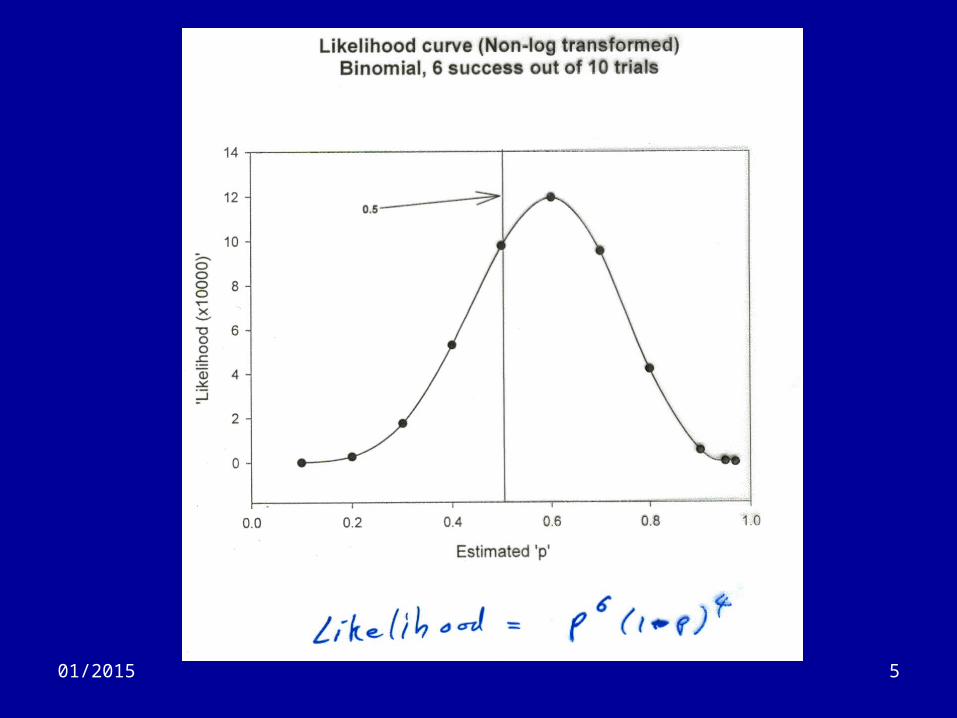
Intro (3)
• We can give a formula for how likely the data is, given a specific value of ‘p’:
501/2015
601/2015
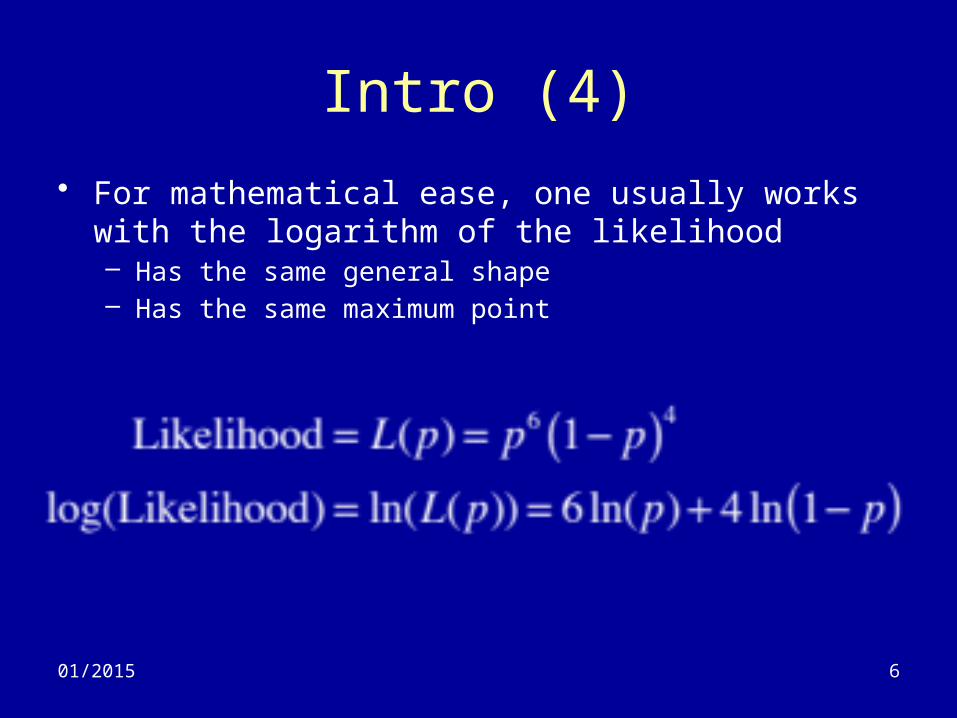
Intro (4)
• For mathematical ease, one usually works with the logarithm of the likelihood– Has the same general shape– Has the same maximum point
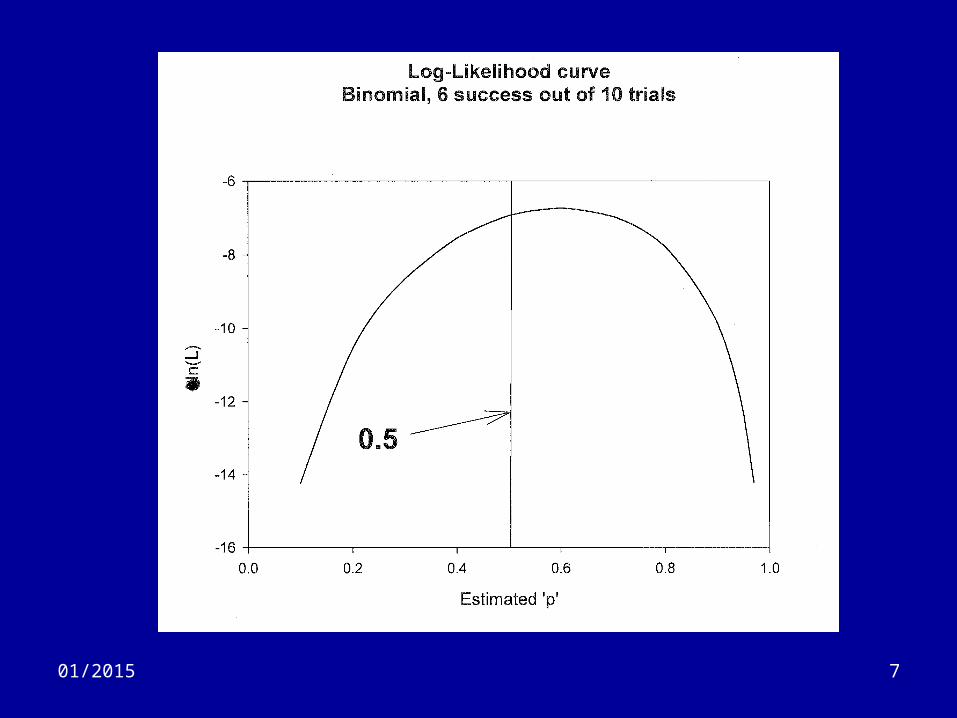
701/2015
801/2015
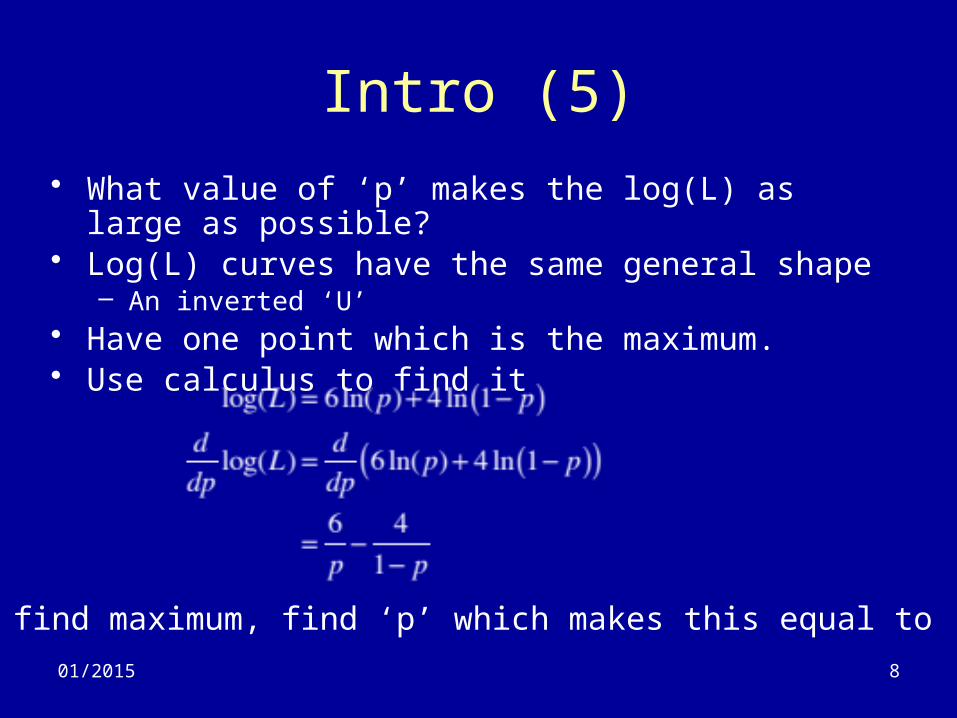
Intro (5)
• What value of ‘p’ makes the log(L) as large as possible?• Log(L) curves have the same general shape
– An inverted ‘U’• Have one point which is the maximum.• Use calculus to find it
To find maximum, find ‘p’ which makes this equal to ‘0’
901/2015
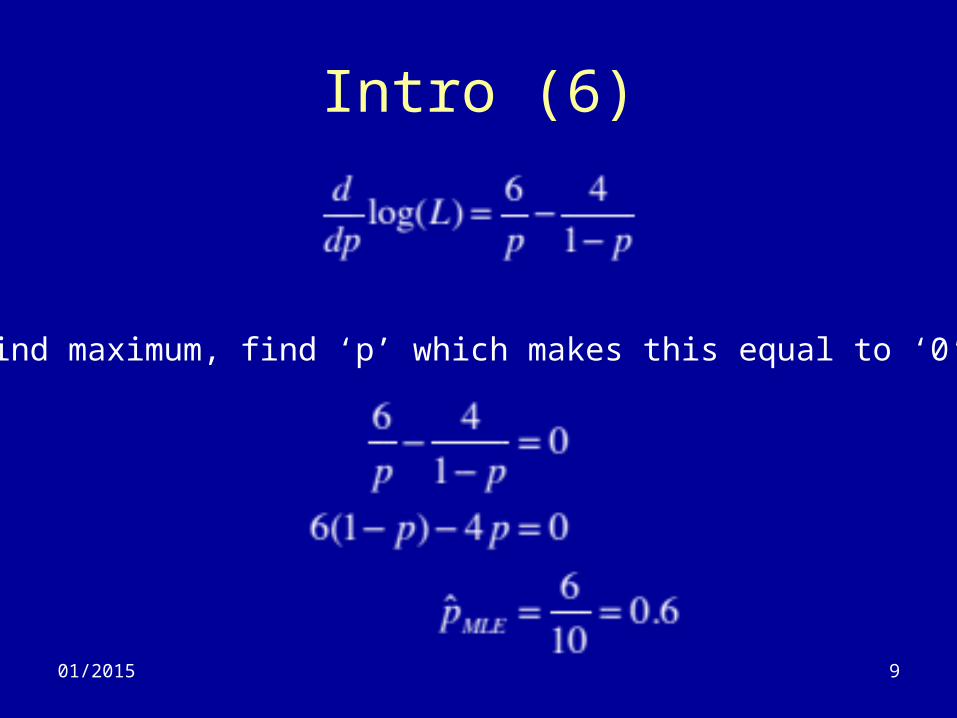
Intro (6)
To find maximum, find ‘p’ which makes this equal to ‘0’

1001/2015
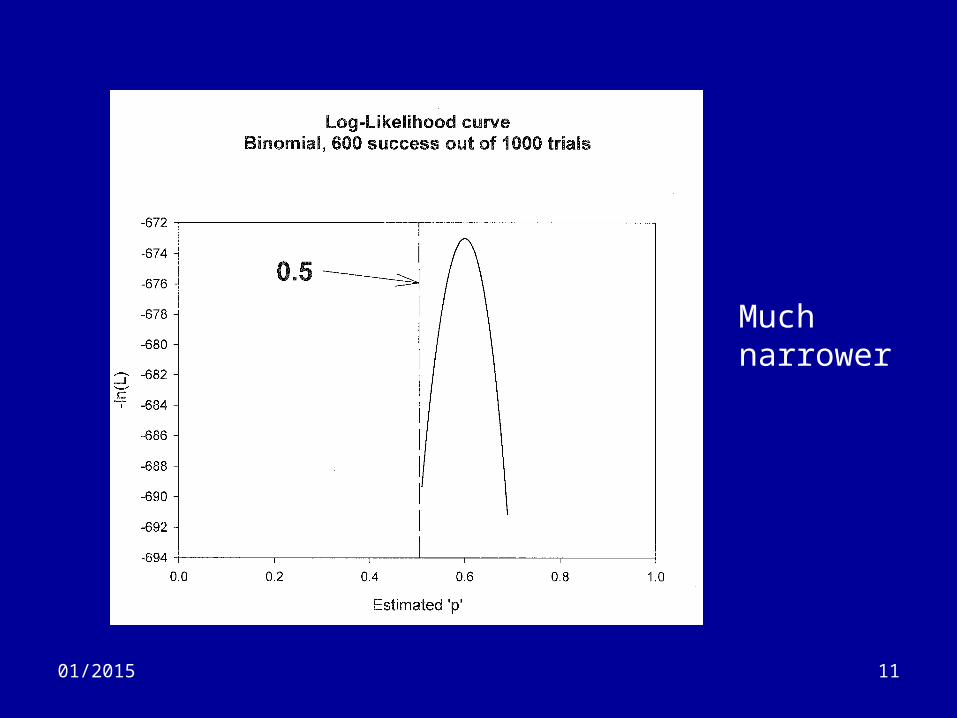
Intro (7)
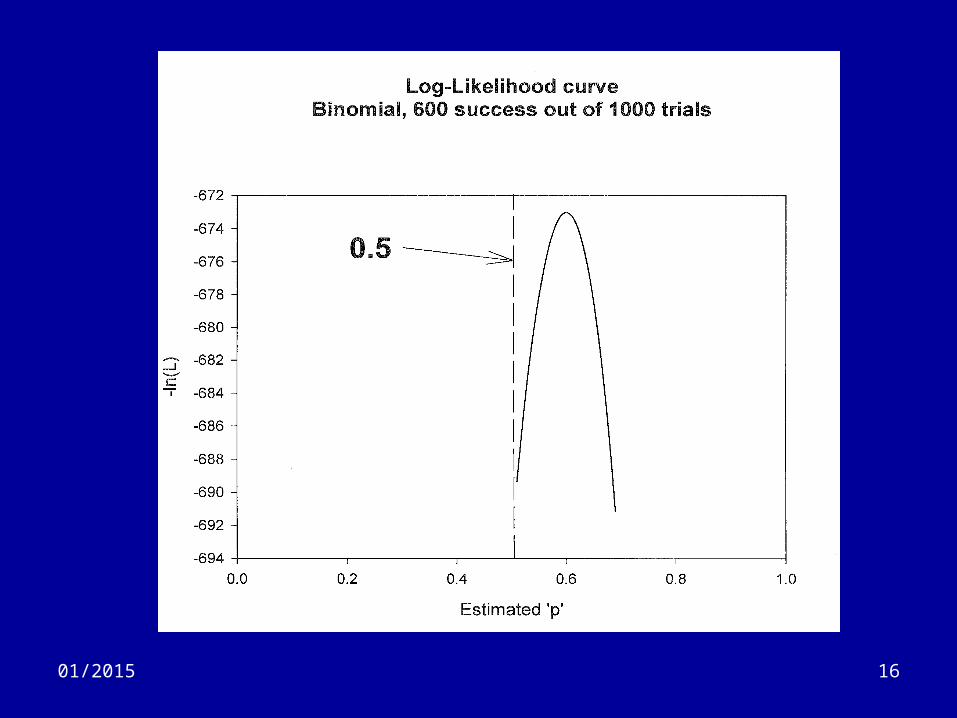
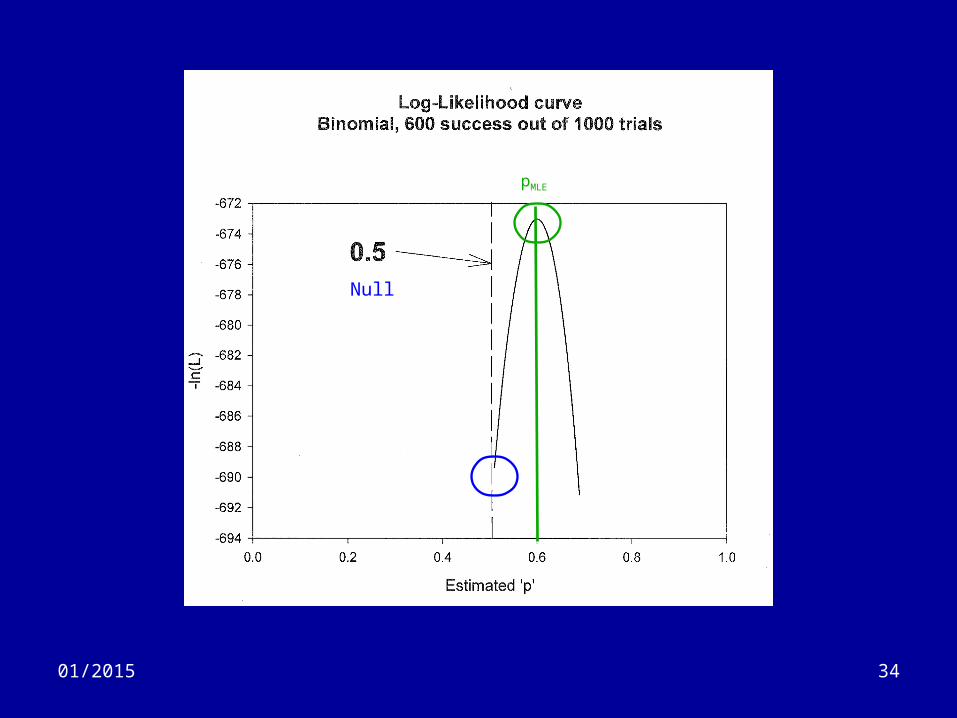
• Suppose we re-do experiment and get 600 heads in 1,000 tosses.
• What is pMLE?– 600/1000 = 0.6 (the same)
• Do we gain anything by doing 100 times for tosses?– Plot the log(L) curve
1101/2015
Much narrower
1201/2015
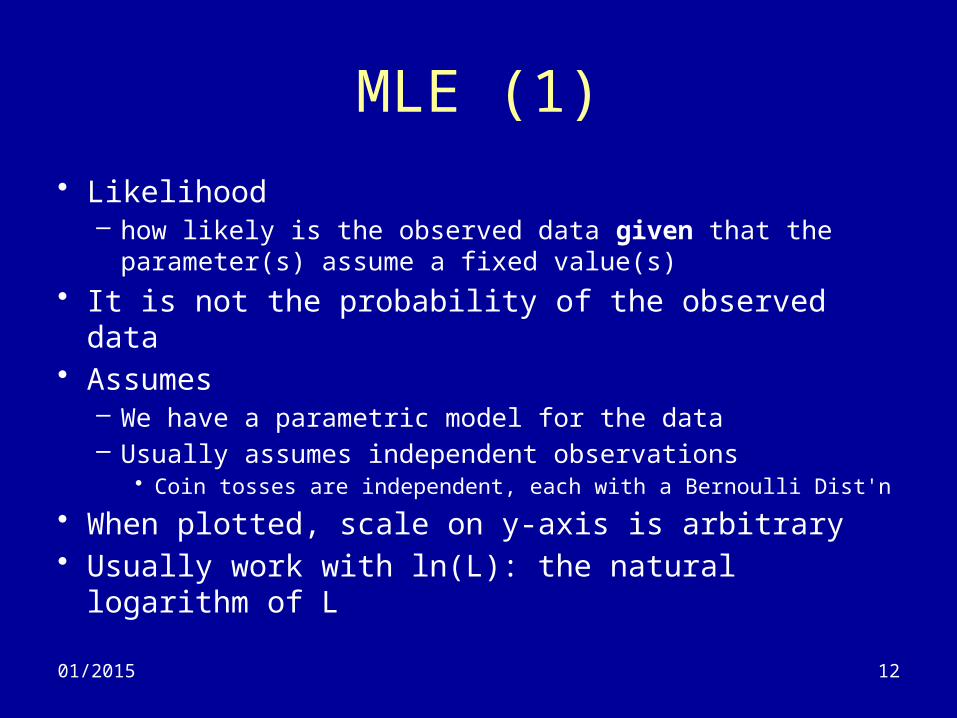
MLE (1)
• Likelihood– how likely is the observed data given that the
parameter(s) assume a fixed value(s)
• It is not the probability of the observed data• Assumes
– We have a parametric model for the data– Usually assumes independent observations
• Coin tosses are independent, each with a Bernoulli Dist'n
• When plotted, scale on y-axis is arbitrary• Usually work with ln(L): the natural logarithm of L
1301/2015
MLE (2)
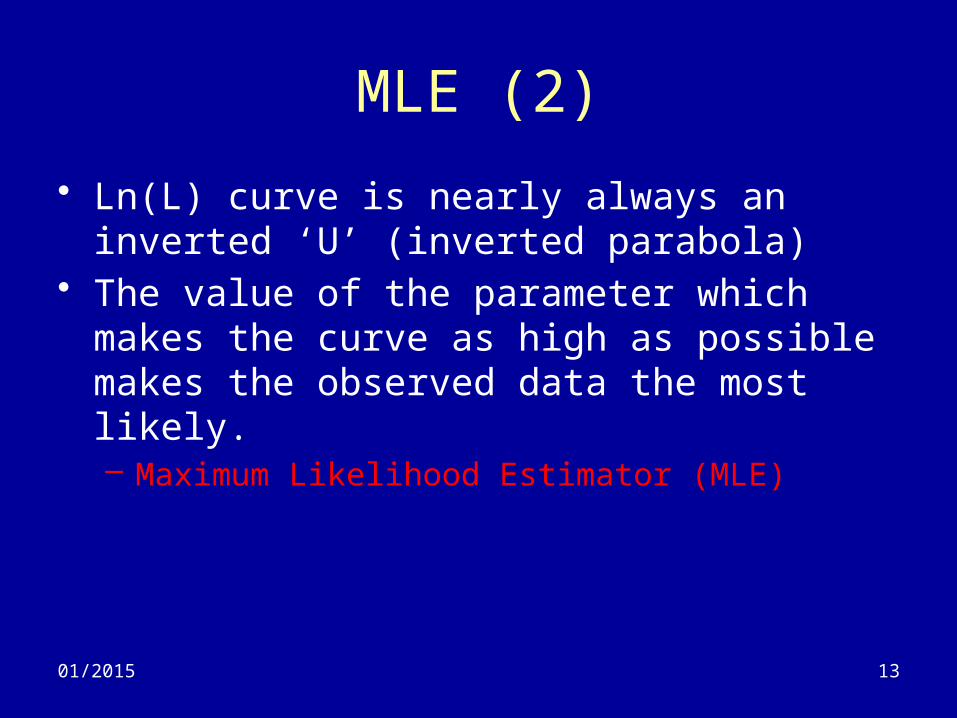
• Ln(L) curve is nearly always an inverted ‘U’ (inverted parabola)
• The value of the parameter which makes the curve as high as possible makes the observed data the most likely.– Maximum Likelihood Estimator (MLE)
1401/2015
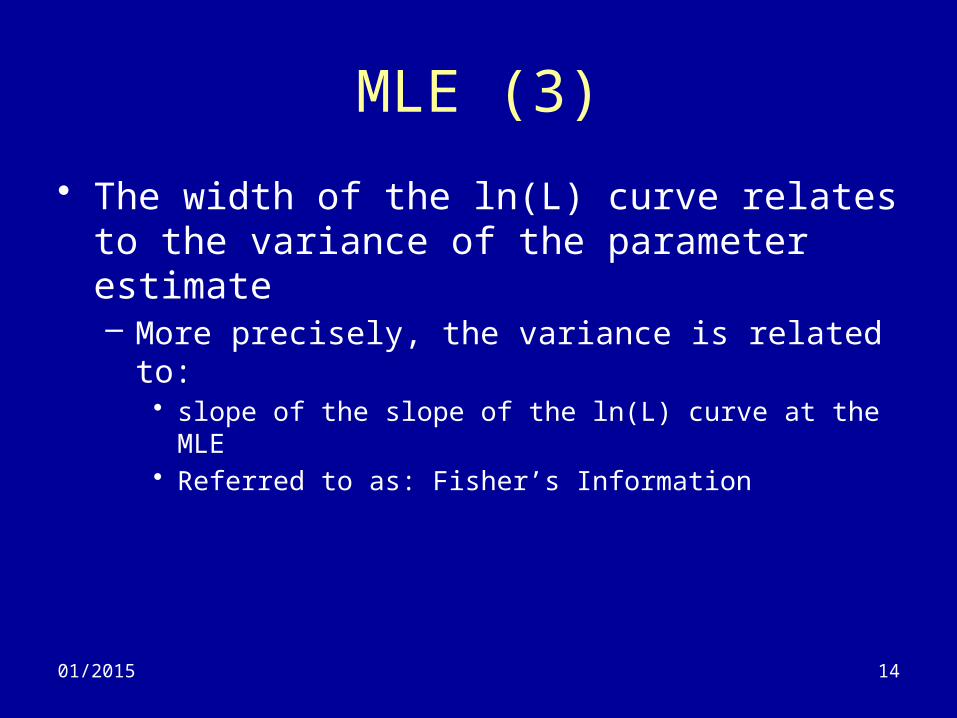
MLE (3)
• The width of the ln(L) curve relates to the variance of the parameter estimate– More precisely, the variance is related to:
• slope of the slope of the ln(L) curve at the MLE• Referred to as: Fisher’s Information

1501/2015
1601/2015
17
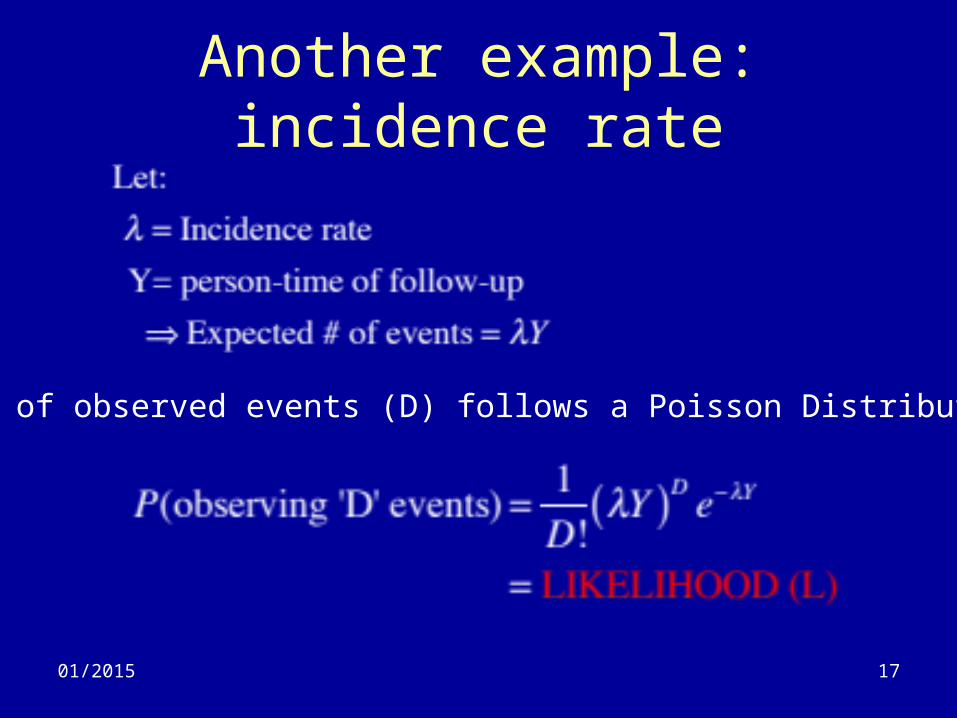
Another example: incidence rate
01/2015
# of observed events (D) follows a Poisson Distribution:
1801/2015
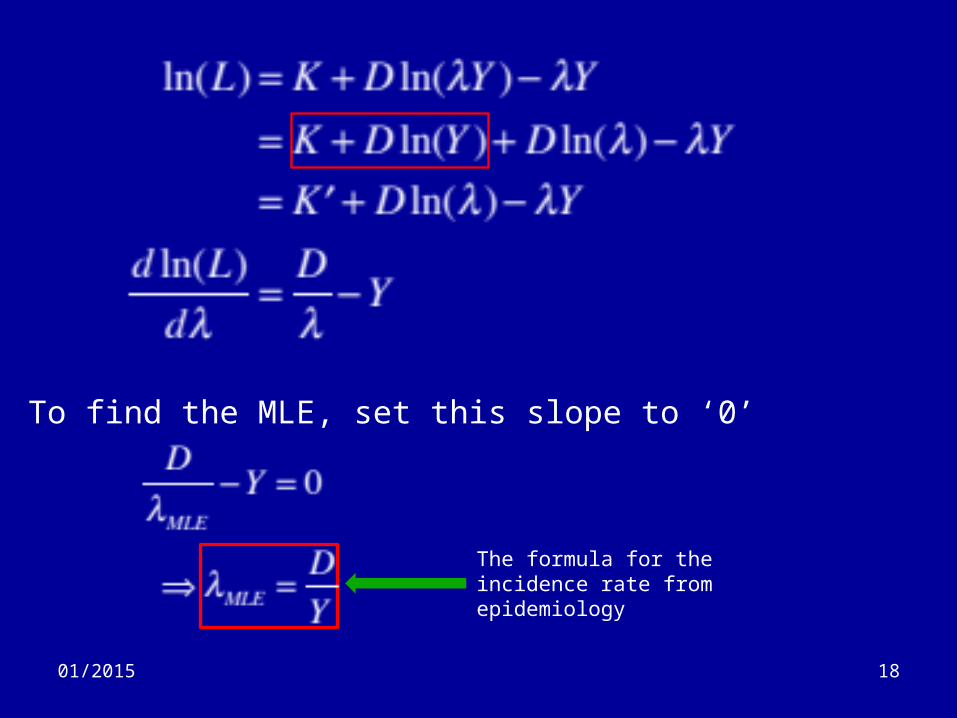
To find the MLE, set this slope to ‘0’
The formula for the incidence rate from epidemiology
19
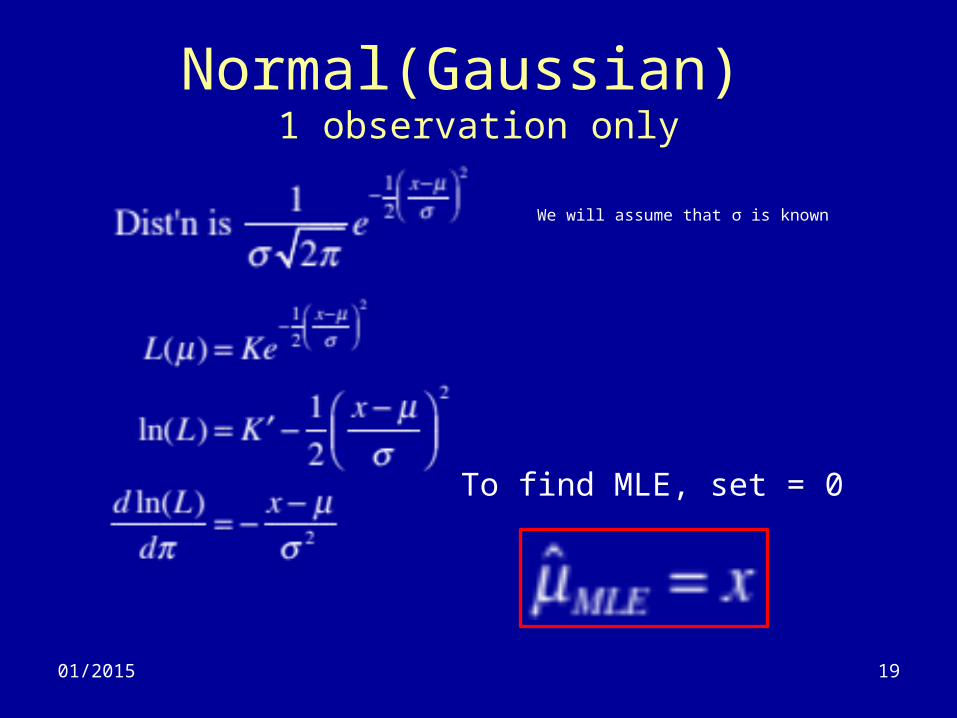
Normal(Gaussian) 1 observation only
01/2015
We will assume that σ is known
To find MLE, set = 0
20
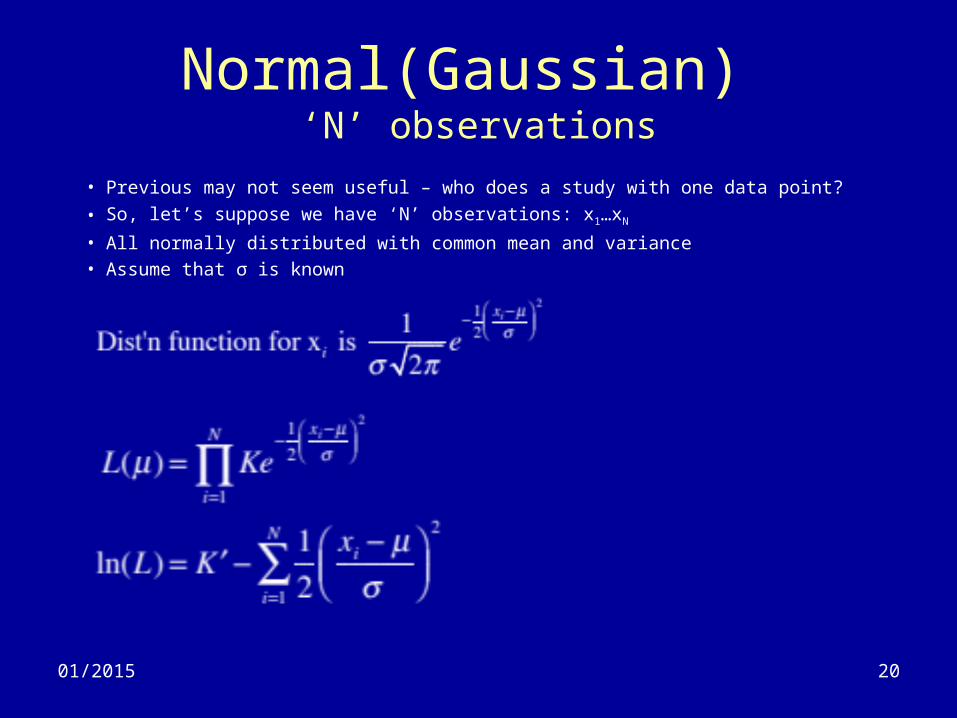
Normal(Gaussian) ‘N’ observations
01/2015
• Previous may not seem useful – who does a study with one data point?
• So, let’s suppose we have ‘N’ observations: x1…xN
• All normally distributed with common mean and variance• Assume that σ is known
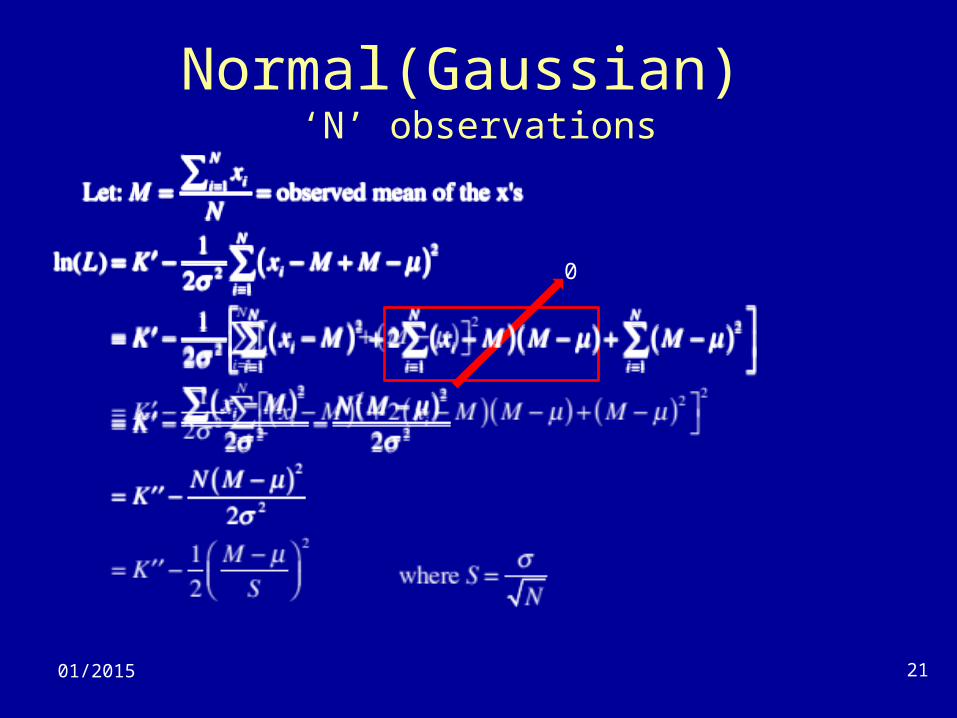
Normal(Gaussian) ‘N’ observations
01/2015 21
0
22
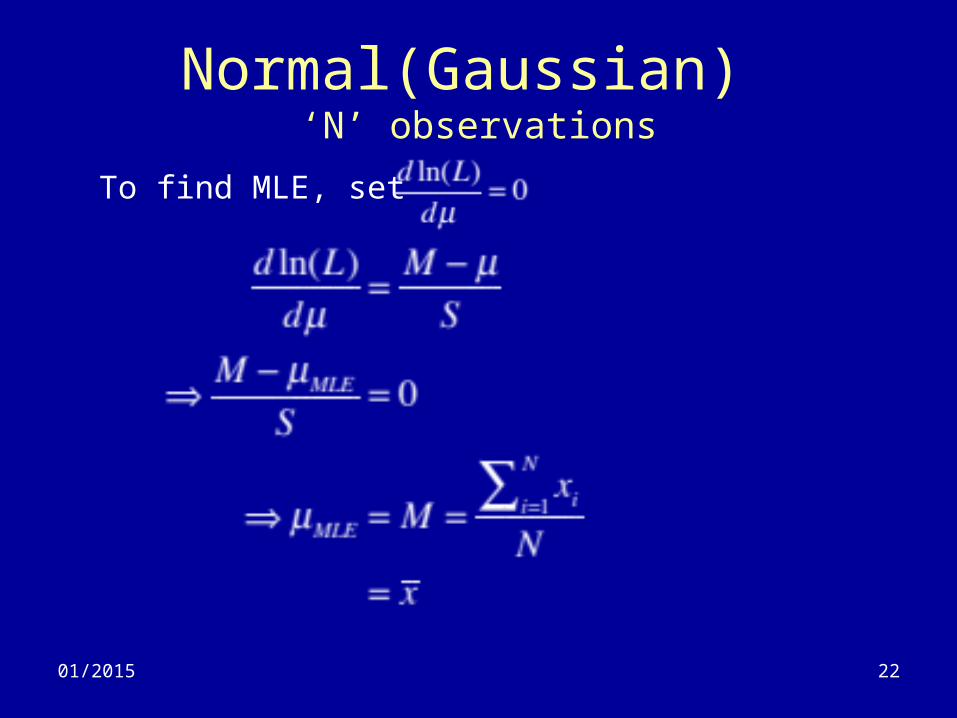
Normal(Gaussian) ‘N’ observations
01/2015
To find MLE, set
2301/2015
Approximations (1)
• All likelihoods have a similar shape– Inverted ‘U’, with one peak
• Over some range of parameter values (near the
MLE), all likelihood curves look like a parabola– Larger sample size larger range of fit
• We can approximate any likelihood curve with a
parabola
Normal approximation.
• This is useful since it provides statistical tests.
2401/2015
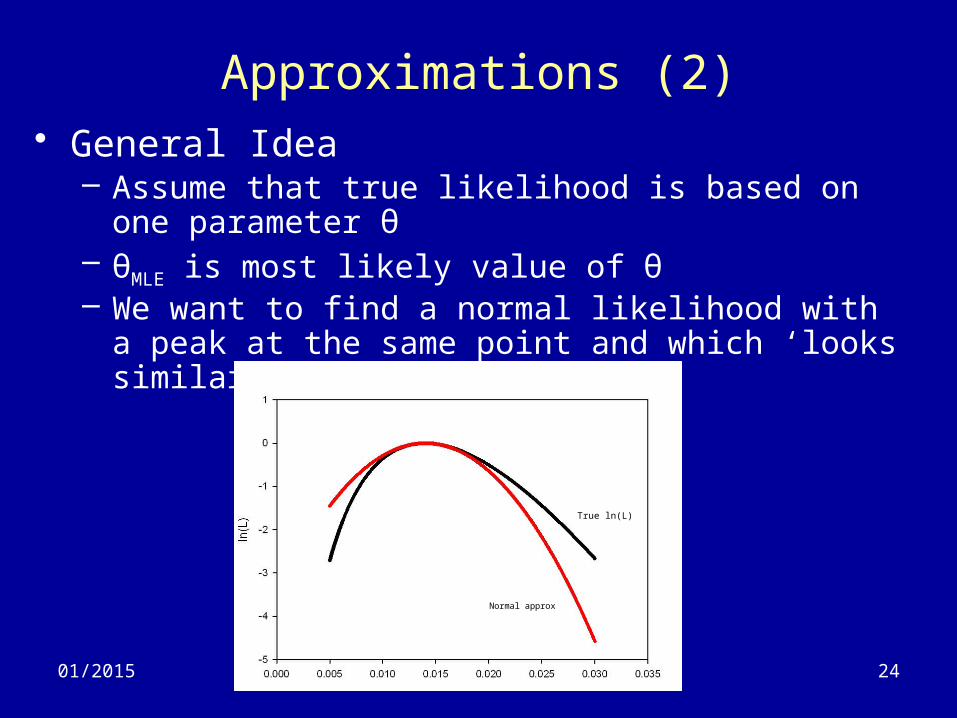
Approximations (2)• General Idea
– Assume that true likelihood is based on one parameter θ– θMLE is most likely value of θ– We want to find a normal likelihood with a peak at the
same point and which ‘looks similar’ around the MLE point:
True ln(L)
Normal approx
2501/2015
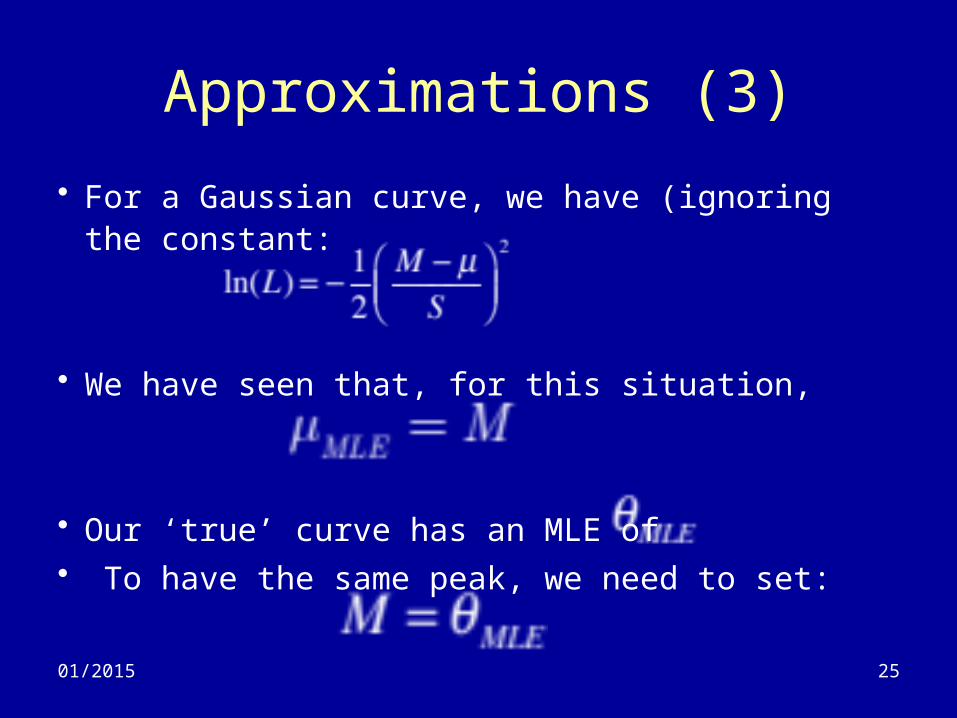
Approximations (3)
• For a Gaussian curve, we have (ignoring the constant:
• We have seen that, for this situation,
• Our ‘true’ curve has an MLE of• To have the same peak, we need to set:
2601/2015
Approximations (4)
• What do we mean by ‘similar shape’?– Can’t use ‘slope’ since it is always ‘0’ at MLE
• Many criteria could be used.• We will use ‘curvature’
2701/2015
Approximations (5)
• Curvature = - second derivative of log(L) = - Information • Curvature
– The slope of the slope of the likelihood curve at the MLE• Rate at which the slope is changing at the MLE• Peeked curves have higher values• It is always < 0
2801/2015
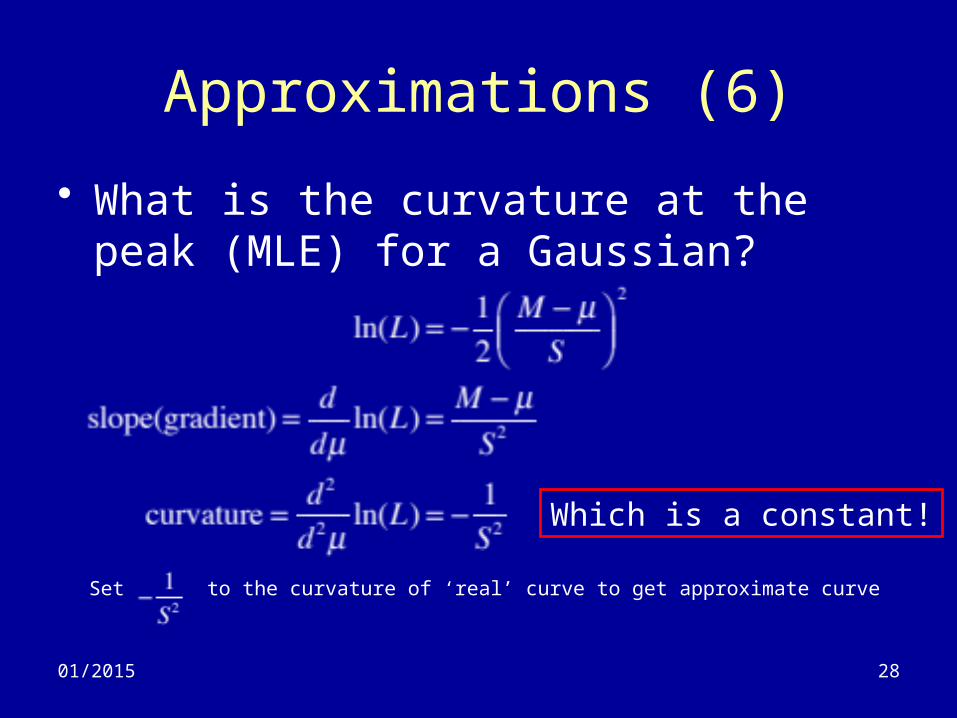
Approximations (6)
• What is the curvature at the peak (MLE) for a Gaussian?
Which is a constant!
Set to the curvature of ‘real’ curve to get approximate curve
29
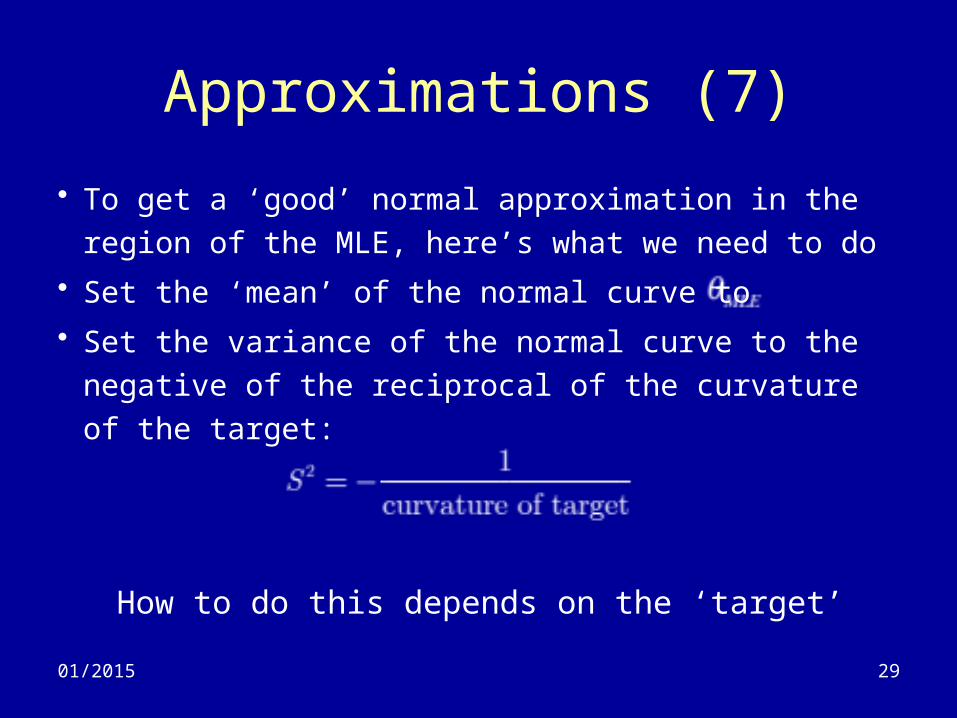
Approximations (7)
• To get a ‘good’ normal approximation in the region
of the MLE, here’s what we need to do
• Set the ‘mean’ of the normal curve to
• Set the variance of the normal curve to the negative
of the reciprocal of the curvature of the target:
01/2015
How to do this depends on the ‘target’
3001/2015
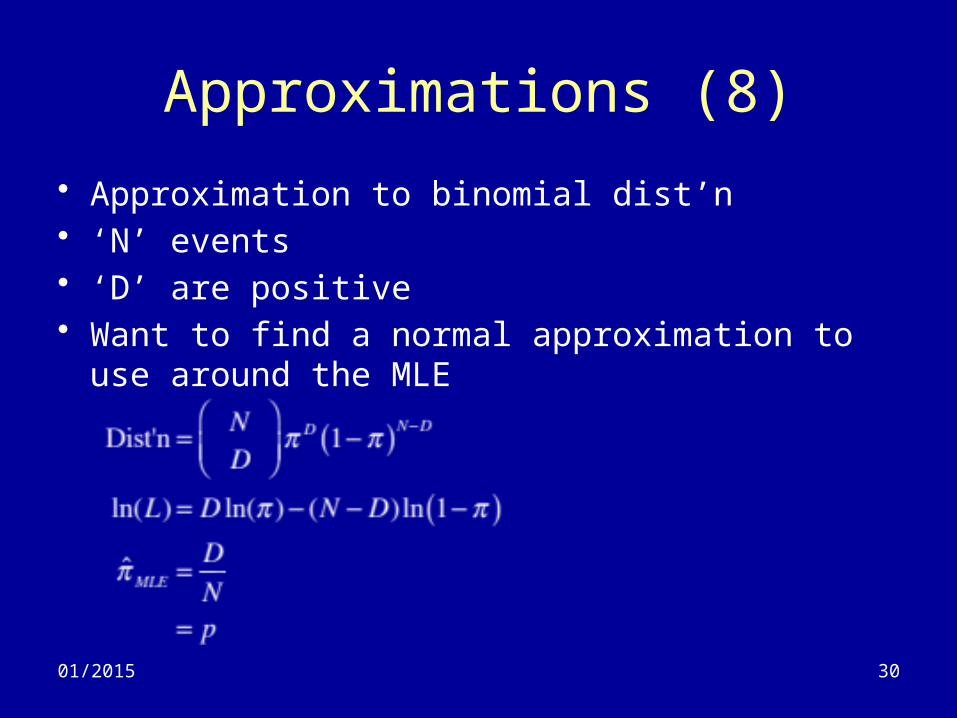
Approximations (8)
• Approximation to binomial dist’n• ‘N’ events• ‘D’ are positive• Want to find a normal approximation to use around
the MLE
3101/2015
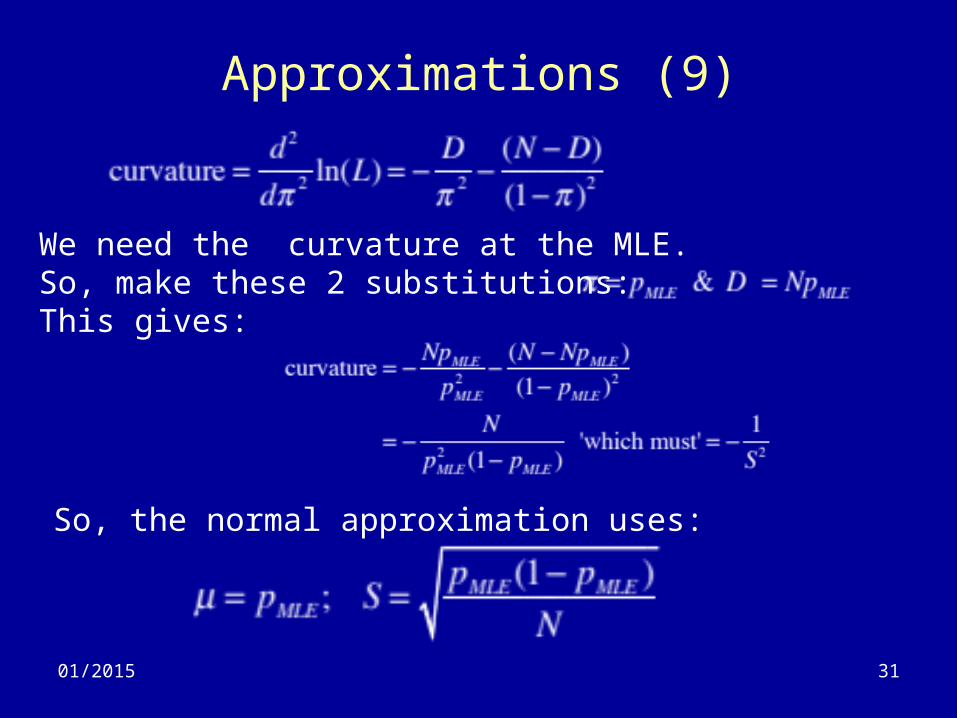
Approximations (9)
We need the curvature at the MLE.So, make these 2 substitutions: This gives:
So, the normal approximation uses:
3201/2015
3301/2015
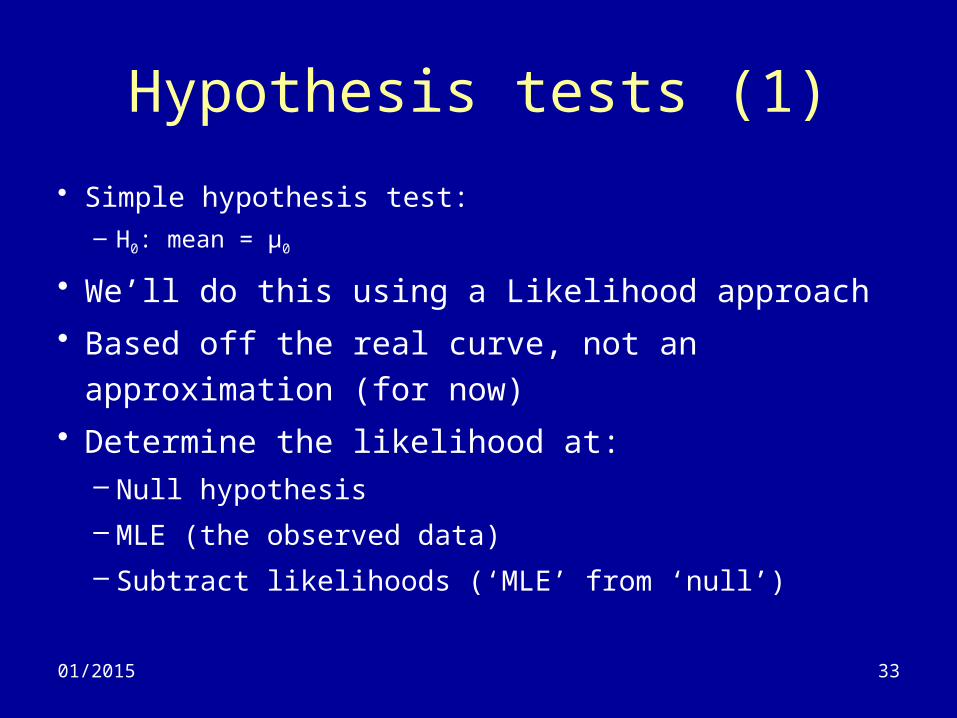
Hypothesis tests (1)
• Simple hypothesis test:– H0: mean = μ0
• We’ll do this using a Likelihood approach
• Based off the real curve, not an approximation
(for now)
• Determine the likelihood at:– Null hypothesis
– MLE (the observed data)
– Subtract likelihoods (‘MLE’ from ‘null’)
3401/2015
pMLE
Null
3501/2015
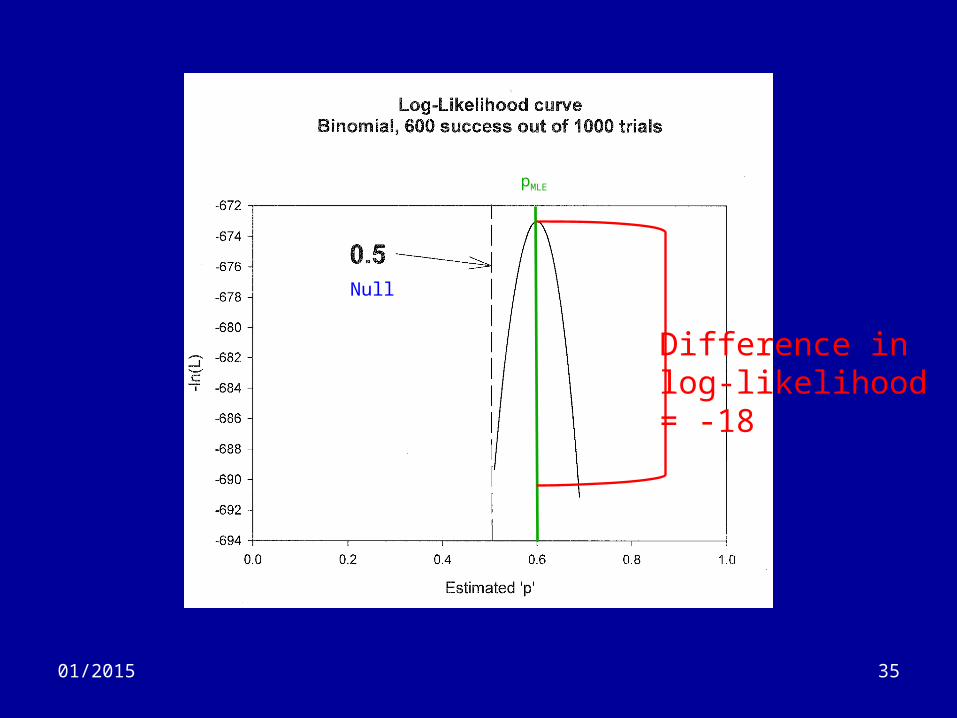
Difference inlog-likelihood= -18
pMLE
Null
3601/2015
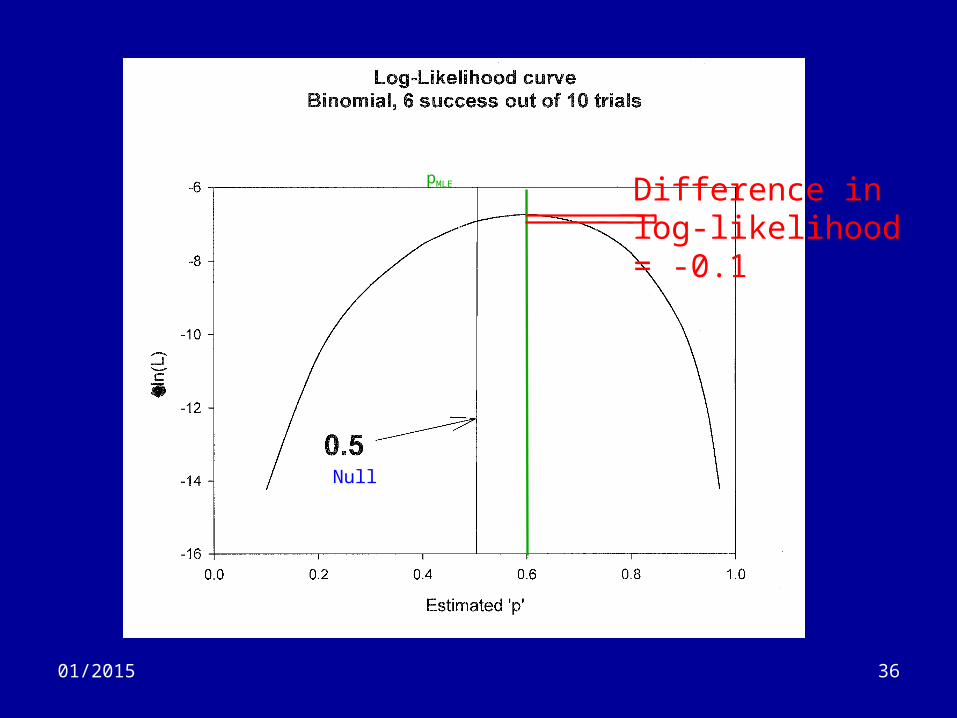
pMLE
Null
Difference inlog-likelihood= -0.1
3701/2015
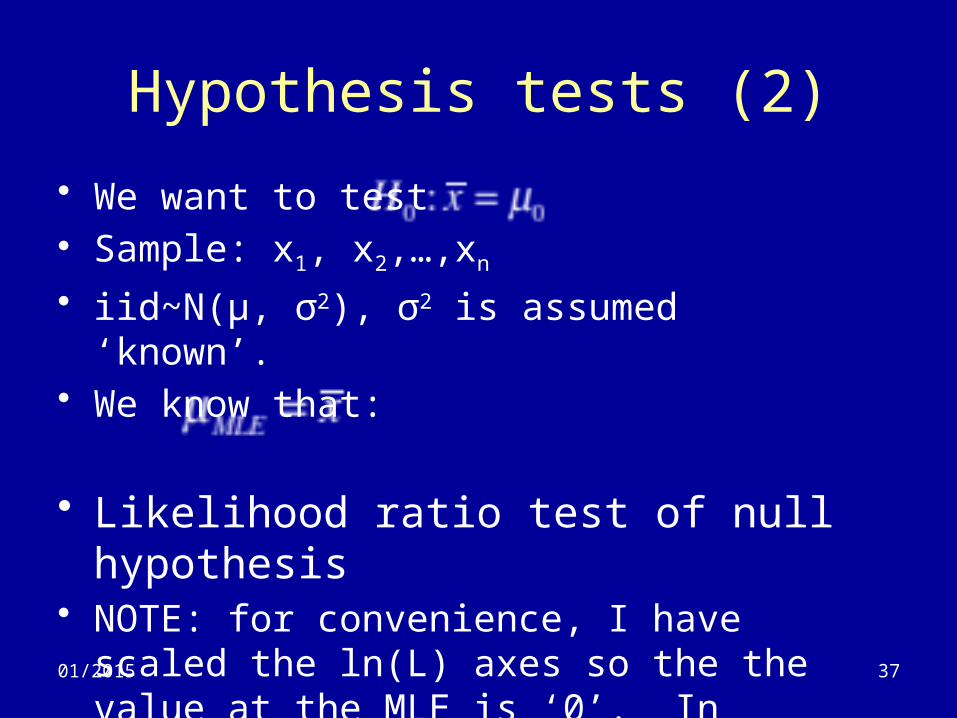
Hypothesis tests (2)
• We want to test• Sample: x1, x2,…,xn
• iid~N(μ, σ2), σ2 is assumed ‘known’.• We know that:
• Likelihood ratio test of null hypothesis• NOTE: for convenience, I have scaled the ln(L)
axes so the the value at the MLE is ‘0’. In reality, the ln(L) value at the MLE is not ‘0’.
3801/2015
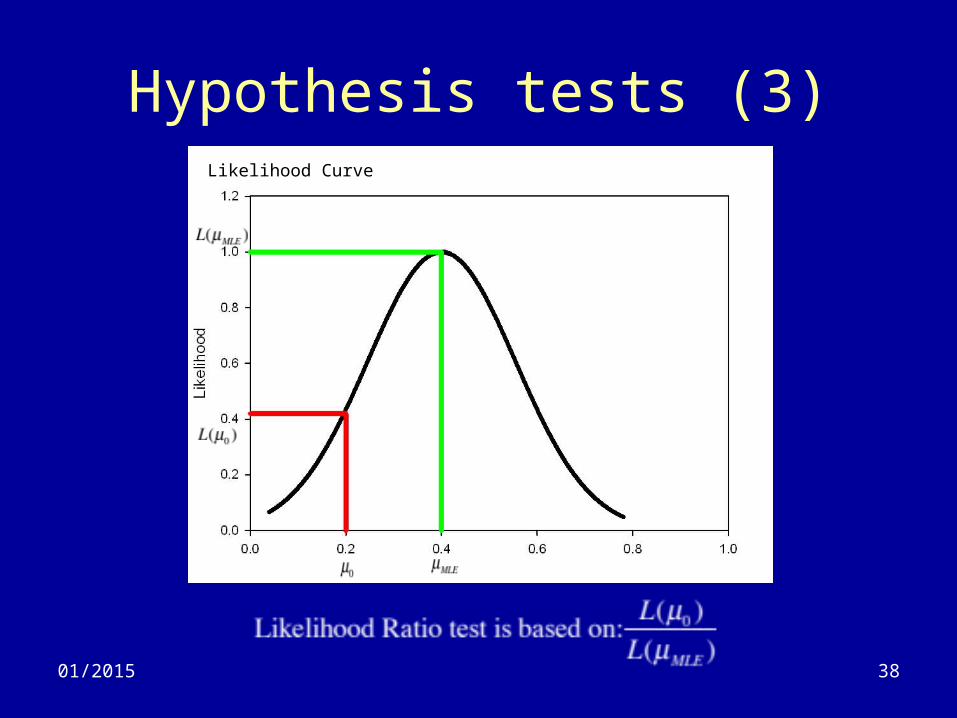
Hypothesis tests (3)Likelihood Curve

3901/2015
Hypothesis tests (4)
But, it again is easier to work with logs.So, the test is based on:
4001/2015
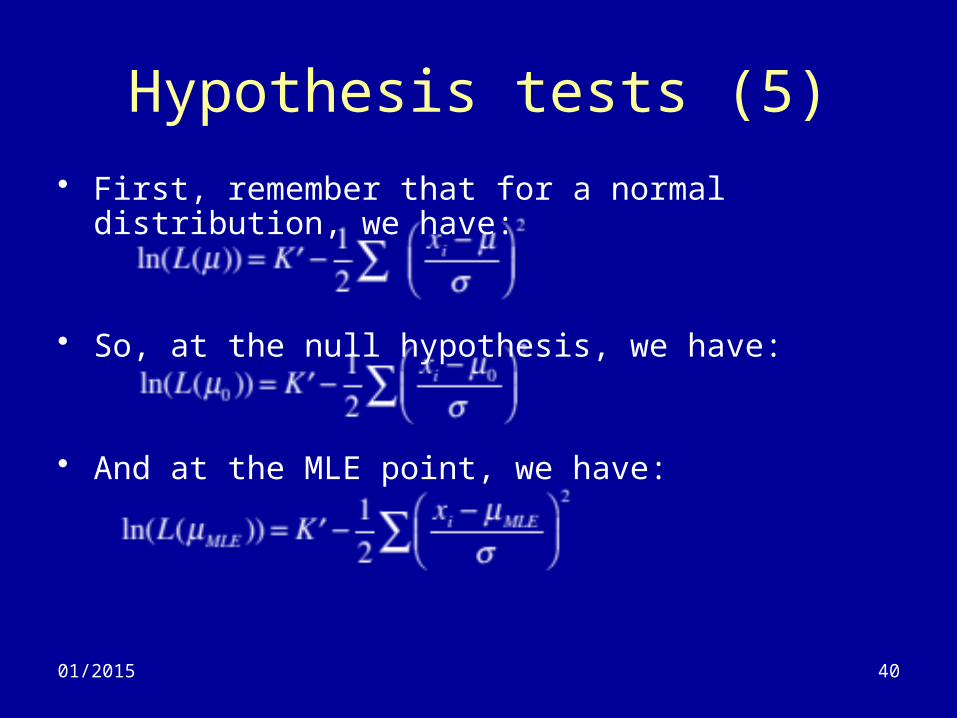
Hypothesis tests (5)
• First, remember that for a normal distribution, we have:
• So, at the null hypothesis, we have:
• And at the MLE point, we have:
4101/2015
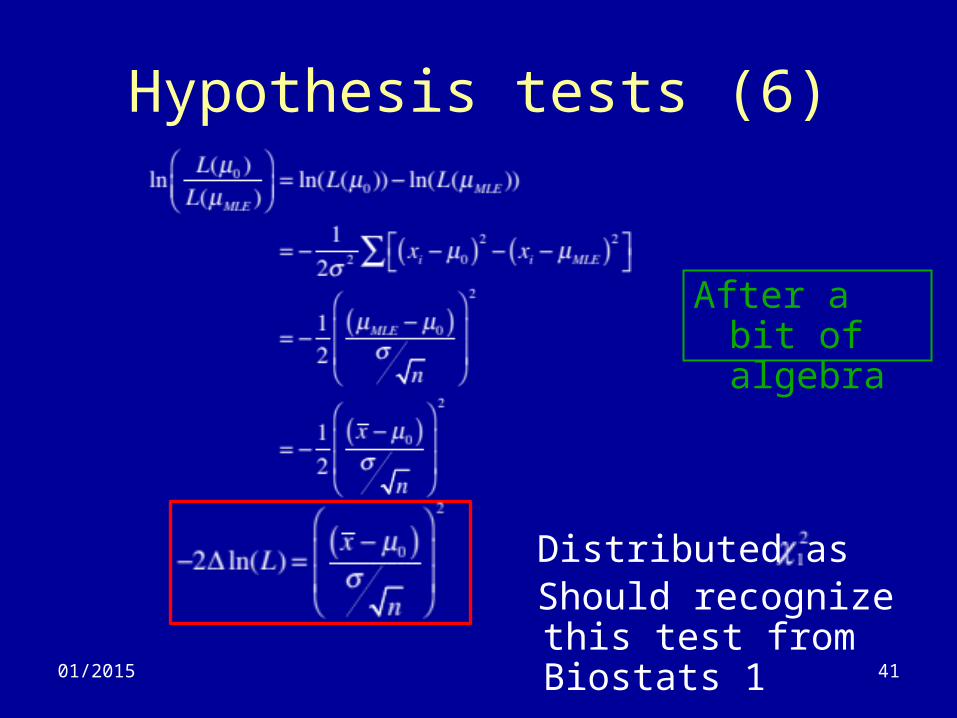
Hypothesis tests (6)
Distributed asShould recognize this test from Biostats 1
After a bit of algebra
42
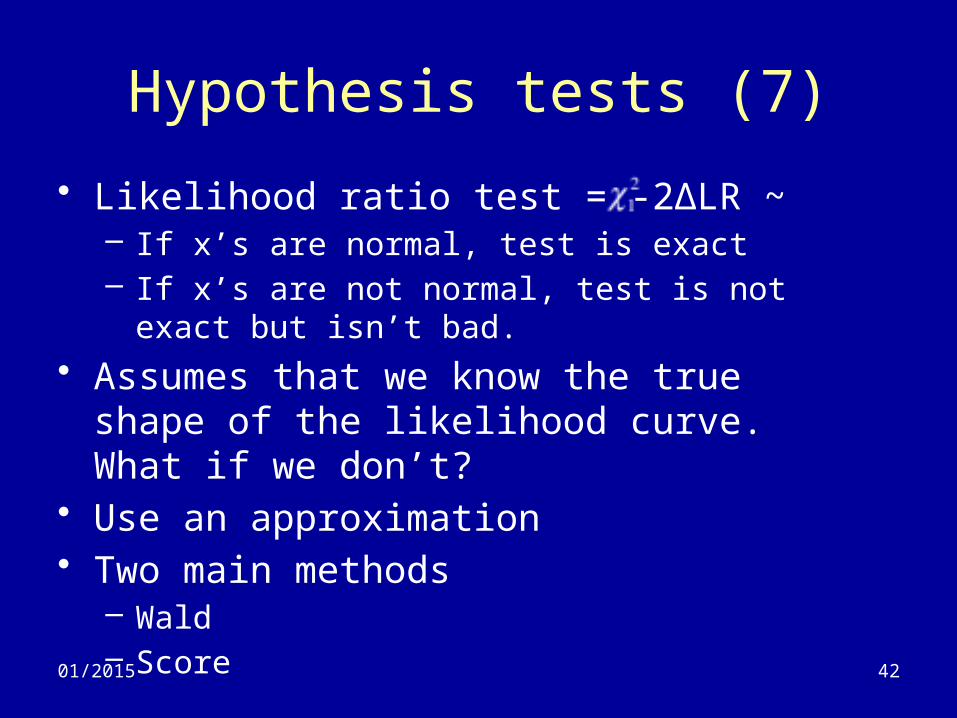
• Likelihood ratio test = -2ΔLR ~ – If x’s are normal, test is exact– If x’s are not normal, test is not exact but isn’t bad.
• Assumes that we know the true shape of the likelihood curve. What if we don’t?
• Use an approximation• Two main methods
– Wald– Score
01/2015
Hypothesis tests (7)
4301/2015
Hypothesis tests (8)
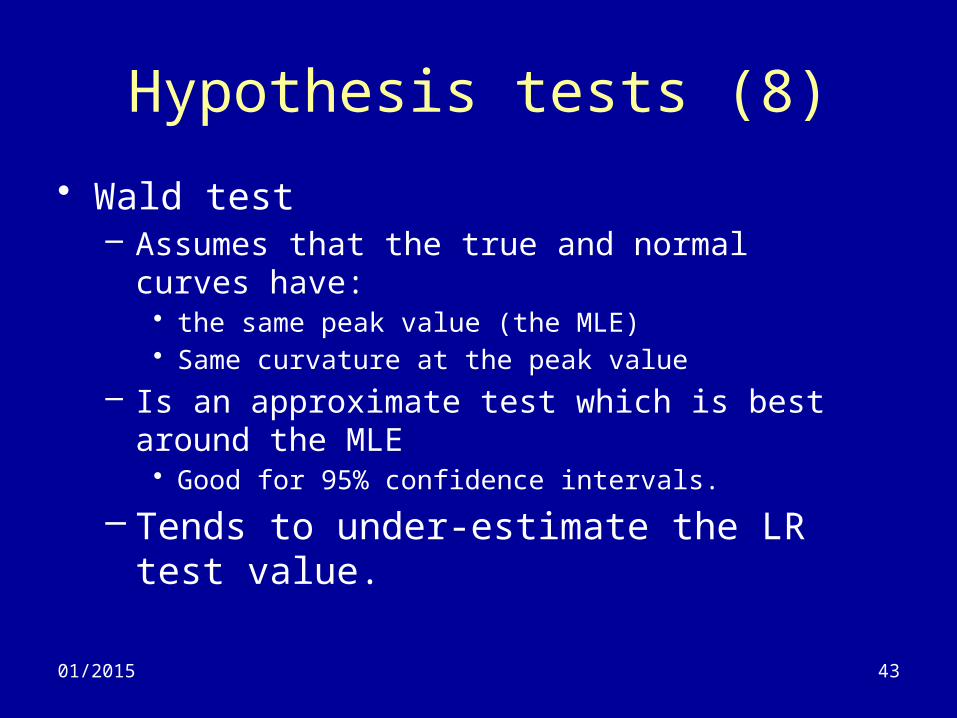
• Wald test– Assumes that the true and normal curves have:
• the same peak value (the MLE)• Same curvature at the peak value
– Is an approximate test which is best around the MLE• Good for 95% confidence intervals.
– Tends to under-estimate the LR test value.
4401/2015
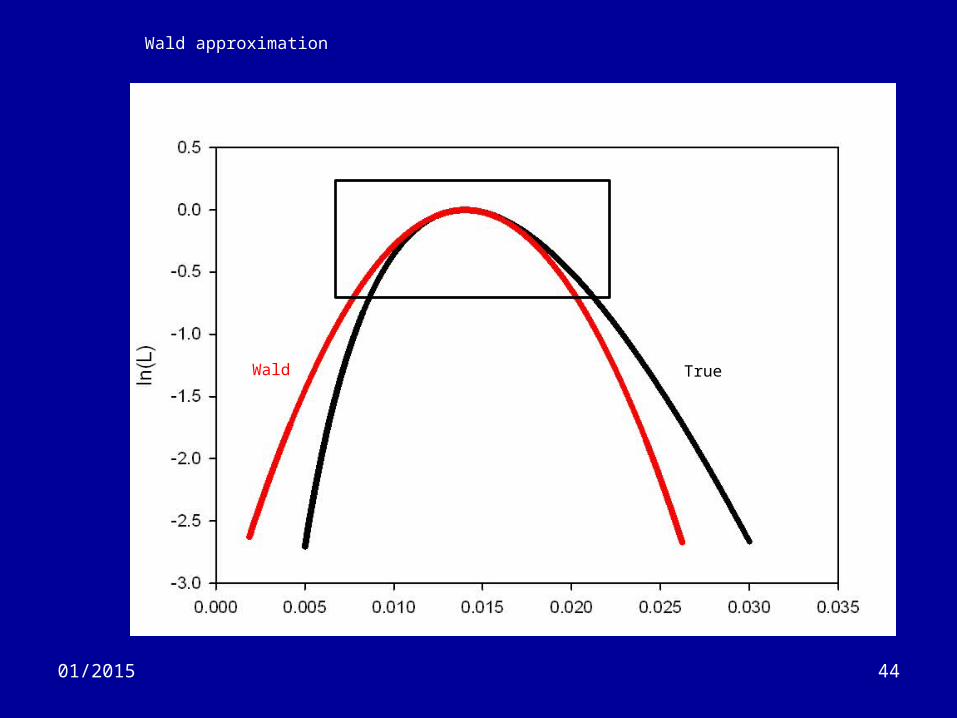
Wald approximation
Wald True

4501/2015
True LR test
Wald LR test
Wald True
4601/2015
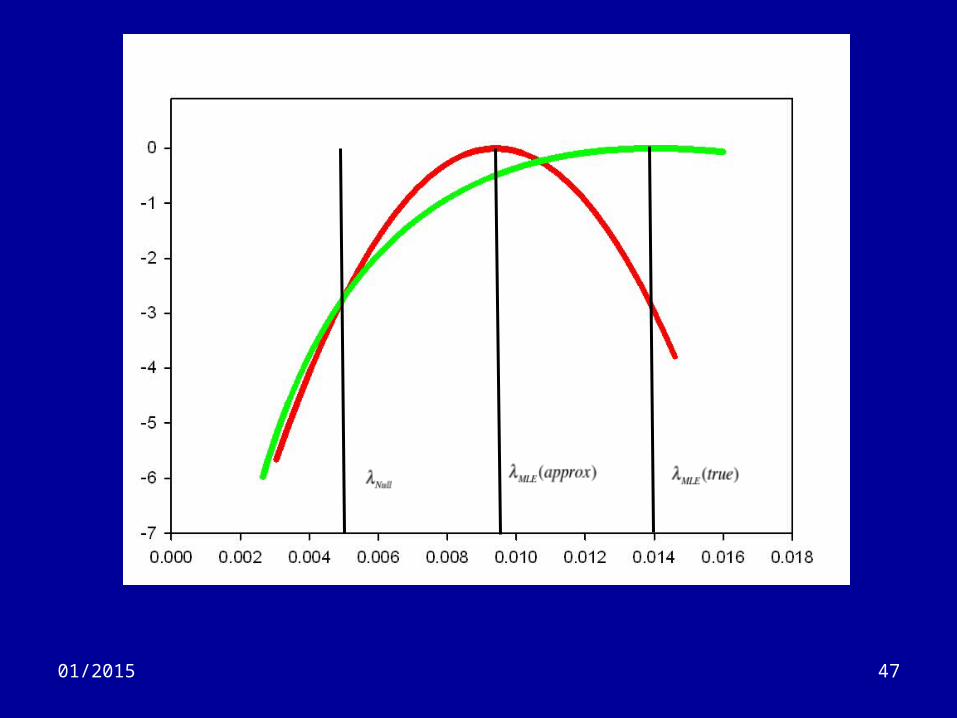
Hypothesis tests (9)
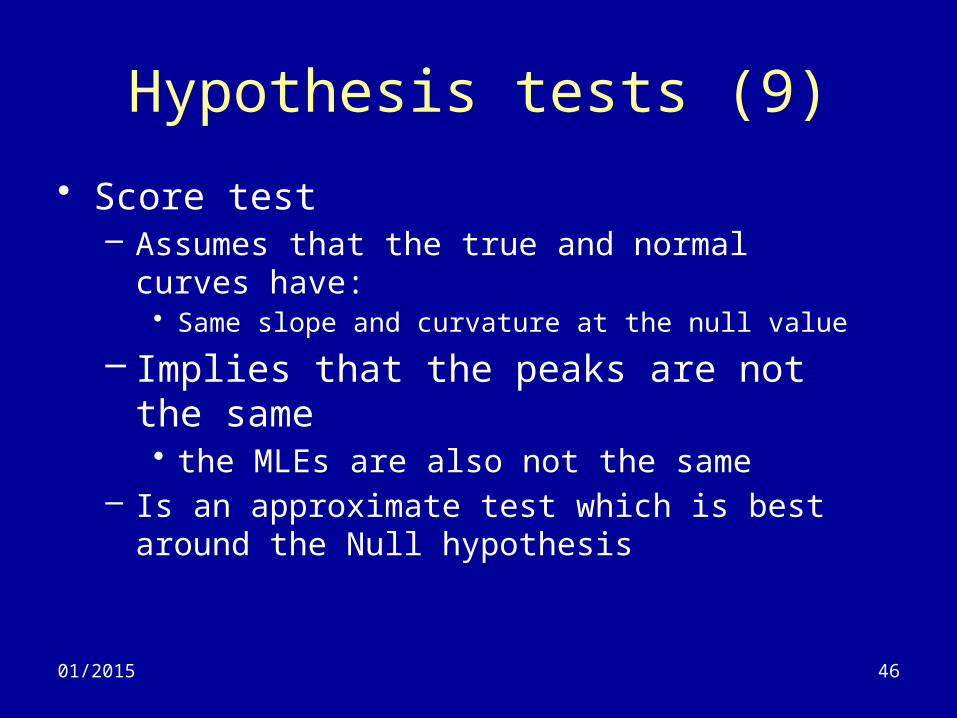
• Score test– Assumes that the true and normal curves have:
• Same slope and curvature at the null value
– Implies that the peaks are not the same• the MLEs are also not the same
– Is an approximate test which is best around the Null hypothesis
4701/2015
4801/2015
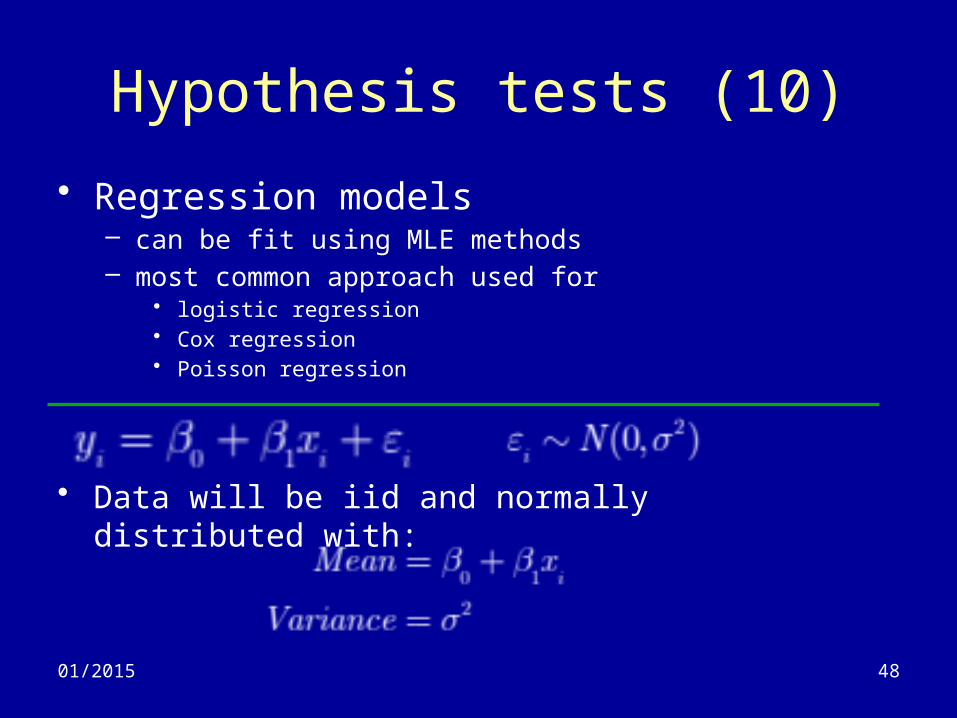
Hypothesis tests (10)
• Regression models– can be fit using MLE methods– most common approach used for
• logistic regression• Cox regression• Poisson regression
• Data will be iid and normally distributed with:
4901/2015
Hypothesis tests (11)
• Can use MLE to estimate the Betas• Fitted model will have a ln(L) value.• Now, fit two models:
– one with x– one without x.
• Each model will have a ln(L)– ln(Lwith x)
– ln(Lwithout x)
5001/2015
Hypothesis tests (12)
• Likelihood ratio test of is given by:
• Complicated way to test one Beta• Easily extended to more complex models• Very similar to using Partial F-tests which you
covered when learning linear regression

5101/2015
Related Documents


