Report IEA PVPS T1-32:2017 TRENDS 2017 IN PHOTOVOLTAIC APPLICATIONS Survey Report of Selected IEA Countries between 1992 and 2016 ediTion 22 ND 2017

Welcome message from author
This document is posted to help you gain knowledge. Please leave a comment to let me know what you think about it! Share it to your friends and learn new things together.
Transcript
Report IEA PVPS T1-32:2017
TRENDS 2017IN PHOTOVOLTAIC APPLICATIONS
Survey Report of Selected IEA Countries between
1992 and 2016
edition
22ND
2017
ieA PVPS trendS 2017 In PHotoVoltAIc APPlIcAtIonS
ISBN 978-3-906042-68-8
DISCLAIMER
Numbers provided in this report, “Trends 2017 in Photovoltaic Applications”, are valid at the time of publication. Please note that allfigures have been rounded.
REPORT SCOPE AND OBJECTIVE
Annual surveys of photovoltaic (PV) power applications and markets are carried out in the reporting countries, as part of the IEA PVPSProgramme’s work.
The Trends reports objective is to present and interpret developments in the PV power systems market and the evolving applicationsfor these products within this market. These trends are analysed in the context of the business, policy and nontechnical environmentin the reporting countries.
This report is prepared to assist those who are responsible for developing the strategies of businesses and public authorities, and tosupport the development of medium term plans for electricity utilities and other providers of energy services. It also provides guidanceto government officials responsible for setting energy policy and preparing national energy plans. The scope of the report is limitedto PV applications with a rated power of 40 W or more. National data supplied are as accurate as possible at the time of publication.Data accuracy on production levels and system prices varies, depending on the willingness of the relevant national PV industry toprovide data. This report presents the results of the 22nd international survey. It provides an overview of PV power systemsapplications, markets and production in the reporting countries and elsewhere at the end of 2016 and analyses trends in theimplementation of PV power systems between 1992 and 2016. Key data for this publication were drawn mostly from national surveyreports and information summaries, which were supplied by representatives from each of the reporting countries. These nationalsurvey reports can be found on the IEA PVPS website: www.iea-pvps.org. Information from the countries outside IEA PVPS aredrawn from a variety of sources and, while every attempt is made to ensure their accuracy, the validity of some of these data cannotbe assured with the same level of confidence as for IEA PVPS member countries.
COVER IMAGEPope Paul VI Audience Hall, viewed from the dome of St. Peter's,
showing the photovoltaic panel roof © nomadFra/shutterstock
3
ieA PVPS trendS 2017 In PHotoVoltAIc APPlIcAtIonS
Foreword // ieA PVPS trendS 2017 In PHotoVoltAIc APPlIcAtIonS
again whereas competition remains high. Policy support continues
to be relevant but is quickly moving towards new more market-
oriented business models, even if feed-in tariffs and similar financial
incentives remain the main driving force. In many regions of the
world, PV is becoming the cheapest option for electricity generation
from not only new renewable energy technologies but also all
conventional technologies. with bids close to 20 USd/kwh, PV has
the potential to become the cheapest source of power generation
everywhere in the coming years. All of these developments are
accompanied by continuous technology evolution, making PV a
growing player in the energy field. with its rising level of penetration
within electric grids, PV is more and more affecting electricity
systems as a whole and the integration into various technical and
economic environments becomes crucial. Quantitatively, the
number of countries experiencing PV as an essential part of their
electricity supply is increasing, with more than 30 countries
covering more than 1% of their electricity supply from PV, and PV
has in sight a share of 2% of the global electricity supply. Altogether,
these are encouraging signs of a maturing industry which is
however only at the early beginning of its future market relevance,
with many developments expected in the building and transport
sector. learn all about the details of this exciting development by
reading through our 22nd edition of the trends report!
The IEA PVPS Programme is proud to provide you its 22ndedition of the international survey report on Trends inPhotovoltaic (PV) Applications.
tracking the global progress in PV markets and industry
systematically since 1992, the “trends report” is one of the flagship
publications of the IeA PVPS Programme and an important source
of unbiased and objective information. the unique series of “trends
reports” has covered the transition of PV technology from its early
and expensive niche market developments in the 1990s to the
recent large-scale global deployment and increased
competitiveness. 2016 was a record year which saw the PV market
jumping to 76 Gw for the very first time. It has confirmed the global
PV markets trends and the consolidated market development
observed since 2013. the rise of PV markets in Asia and Americas
has been confirmed, with china installing more than 34 Gw alone.
overall, more than 65 Gw of PV were installed in the IeA PVPS
member countries during 2016, whereas the global PV market is
estimated to stand just below 76 Gw. the global installed total PV
capacity is estimated at roughly 303 Gw at the end of 2016 and will
have reached close to 400 Gw at the end of 2017. PV modules and
system prices have seen again a significant decline, pushed by
industry overcapacities but also extremely competitive tenders on
all continents. on the industry supply side, production increased
Foreword
IEA-PVPS
Stefan nowakchairmanIeA PVPS Programme
Main Authors:Gaëtan Massonand izumi Kaizuka
tAble oF contentS // ieA PVPS trendS 2017 In PHotoVoltAIc APPlIcAtIonS
ieA PVPS trendS 2017 In PHotoVoltAIc APPlIcAtIonS
4
FOREWORD 3
1. PV TECHNOLOGY AND APPLICATIONS 5
PV tecHnoloGy 5PV APPlIcAtIonS And MArket SeGMentS 6
2. PV MARKET DEVELOPMENT TRENDS 7
MetHodoloGy 7tHe GlobAl PV InStAlled cAPAcIty 7tHe MArket eVolUtIon 8PV deVeloPMent Per reGIon And SeGMent 14tHe AMerIcAS 16ASIA PAcIFIc 19eUroPe 25MIddle eASt And AFrIcA 34
3. POLICY FRAMEWORK 38
PV MArket drIVerS 38UPFront IncentIVeS 42electrIcIty StorAGe 45
4. TRENDS IN THE PV INDUSTRY 47
tHe UPStreAM PV Sector (MAnUFActUrerS) 47downStreAM Sector 54
trAde conFlIctS 57
5. PV AND THE ECONOMY 59
VAlUe For tHe econoMy 59trendS In eMPloyMent 60
6. COMPETITIVENESS OF PV ELECTRICITY IN 2016 61
SySteM PrIceS 61GrId PArIty – Socket PArIty 66coMMentS on GrId PArIty And coMPetItIVeneSS 67
7. PV IN THE POWER SECTOR 68
PV electrIcIty ProdUctIon 68electrIc UtIlItIeS InVolVeMent In PV 71
CONCLUSION 72
ANNEXES 74
LIST OF FIGURES AND TABLES 78
tAble oF contentS
ieA PVPS trendS 2017 In PHotoVoltAIc APPlIcAtIonS
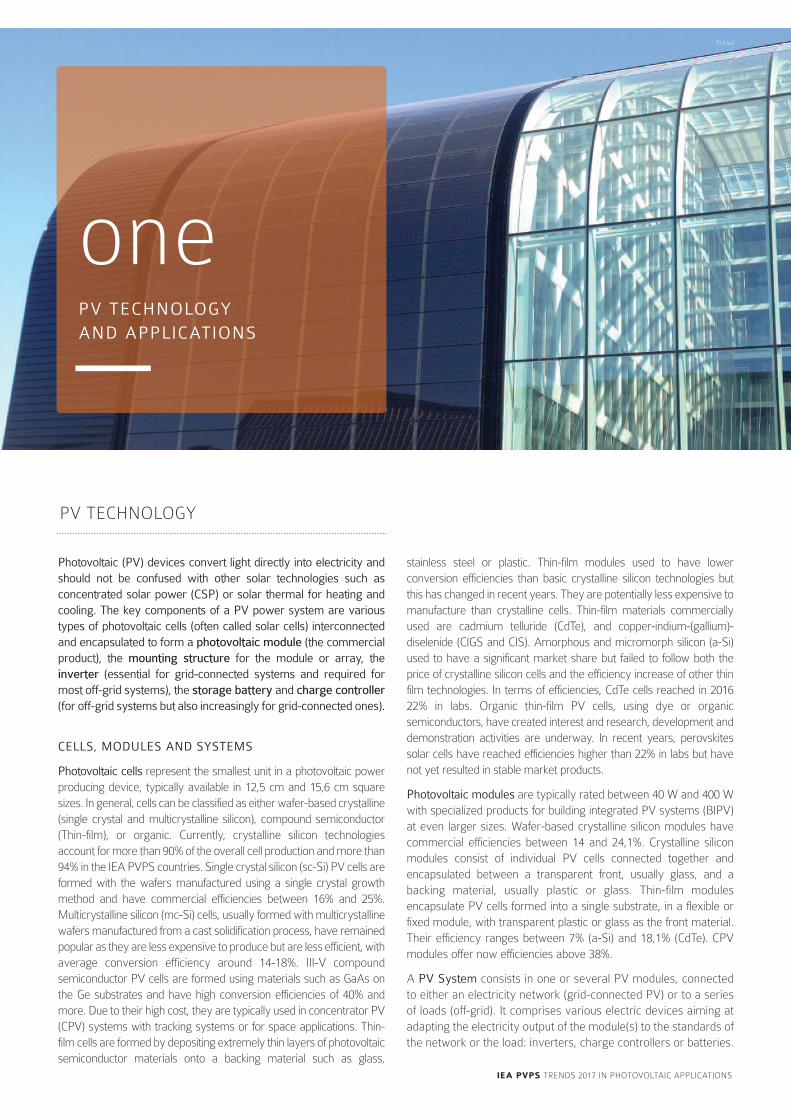
stainless steel or plastic. thin-film modules used to have lowerconversion efficiencies than basic crystalline silicon technologies butthis has changed in recent years. they are potentially less expensive tomanufacture than crystalline cells. thin-film materials commerciallyused are cadmium telluride (cdte), and copper-indium-(gallium)-diselenide (cIGS and cIS). Amorphous and micromorph silicon (a-Si)used to have a significant market share but failed to follow both theprice of crystalline silicon cells and the efficiency increase of other thinfilm technologies. In terms of efficiencies, cdte cells reached in 201622% in labs. organic thin-film PV cells, using dye or organicsemiconductors, have created interest and research, development anddemonstration activities are underway. In recent years, perovskitessolar cells have reached efficiencies higher than 22% in labs but havenot yet resulted in stable market products.
Photovoltaic modules are typically rated between 40 w and 400 wwith specialized products for building integrated PV systems (bIPV)at even larger sizes. wafer-based crystalline silicon modules havecommercial efficiencies between 14 and 24,1%. crystalline siliconmodules consist of individual PV cells connected together andencapsulated between a transparent front, usually glass, and abacking material, usually plastic or glass. thin-film modulesencapsulate PV cells formed into a single substrate, in a flexible orfixed module, with transparent plastic or glass as the front material.their efficiency ranges between 7% (a-Si) and 18,1% (cdte). cPVmodules offer now efficiencies above 38%.
A PV System consists in one or several PV modules, connectedto either an electricity network (grid-connected PV) or to a seriesof loads (off-grid). It comprises various electric devices aiming atadapting the electricity output of the module(s) to the standards ofthe network or the load: inverters, charge controllers or batteries.
Photovoltaic (PV) devices convert light directly into electricity andshould not be confused with other solar technologies such asconcentrated solar power (CSP) or solar thermal for heating andcooling. The key components of a PV power system are varioustypes of photovoltaic cells (often called solar cells) interconnectedand encapsulated to form a photovoltaic module (the commercialproduct), the mounting structure for the module or array, theinverter (essential for grid-connected systems and required formost off-grid systems), the storage battery and charge controller(for off-grid systems but also increasingly for grid-connected ones).
CELLS, MODULES AND SYSTEMS
Photovoltaic cells represent the smallest unit in a photovoltaic powerproducing device, typically available in 12,5 cm and 15,6 cm squaresizes. In general, cells can be classified as either wafer-based crystalline(single crystal and multicrystalline silicon), compound semiconductor(thin-film), or organic. currently, crystalline silicon technologiesaccount for more than 90% of the overall cell production and more than94% in the IeA PVPS countries. Single crystal silicon (sc-Si) PV cells areformed with the wafers manufactured using a single crystal growthmethod and have commercial efficiencies between 16% and 25%.Multicrystalline silicon (mc-Si) cells, usually formed with multicrystallinewafers manufactured from a cast solidification process, have remainedpopular as they are less expensive to produce but are less efficient, withaverage conversion efficiency around 14-18%. III-V compoundsemiconductor PV cells are formed using materials such as GaAs onthe Ge substrates and have high conversion efficiencies of 40% andmore. due to their high cost, they are typically used in concentrator PV(cPV) systems with tracking systems or for space applications. thin-film cells are formed by depositing extremely thin layers of photovoltaicsemiconductor materials onto a backing material such as glass,
PV tecHnoloGy
onePV TECHNOLOGY AND APPLICATIONS
© Issol
have entered the market and enable starting with a small kit andadding extra loads later. they are mainly used for off-grid basicelectrification, mainly in developing countries.
Off-grid domestic systems provide electricity to households andvillages that are not connected to the utility electricity network(also referred to as grid). they provide electricity for lighting,refrigeration and other low power loads, have been installedworldwide and are often the most appropriate technology to meetthe energy demands of off-grid communities. off-grid domesticsystems in the reporting countries are typically up to 5 kw in size.
Generally they offer an economic alternative to extending theelectricity distribution network at distances of more than 1 or 2 kmfrom existing power lines. defining such systems is becomingmore difficult where, for example, mini-grids in rural areas aredeveloped by electricity utilities.
Off-grid non-domestic installations were the first commercialapplication for terrestrial PV systems. they provide power for a widerange of applications, such as telecommunications, water pumping,vaccine refrigeration and navigational aids. these are applicationswhere small amounts of electricity have a high value, thus making PVcommercially cost competitive with other small generating sources.
Hybrid systems combine the advantages of PV and dieselgenerator in mini grids. they allow mitigating fuel price increases,deliver operating cost reductions, and offer higher service qualitythan traditional single-source generation systems. the combiningof technologies provides new possibilities. the micro-hybridsystem range for use as a reliable and cost-effective power sourcefor telecom base stations continues to develop and expand. thedevelopment of small distributed hybrid generation systems forrural electrification to address the needs of remote communitieswill rely on the impetus given by institutions in charge of providingpublic services to rural customers. large-scale hybrids can beused for large cities powered today by diesel generators and havebeen seen for instance in central Africa for powering cities farfrom the grid with a base of utility-scale PV and battery storage.
Grid-connected distributed PV systems are installed to providepower to a grid-connected customer or directly to the electricitynetwork (specifically where that part of the electricity distributionnetwork is configured to supply power to a number of customersrather than to provide a bulk transport function). Such systems maybe on, or integrated into, the customer’s premises often on thedemand side of the electricity meter, on residential, commercial orindustrial buildings, or simply in the built environment on motorwaysound-barriers, etc. Size is not a determining feature – while a 1 Mw PV system on a rooftop may be large by PV standards, this isnot the case for other forms of distributed generation. on buildings,we have to distinguish between bAPV and bIPV systems. bAPVrefers to PV systems installed on an existing building while bIPVimposes to replace conventional building materials by PV ones.
Grid-connected centralized systems perform the functions ofcentralized power stations. the power supplied by such a systemis not associated with a particular electricity customer, and thesystem is not located to specifically perform functions on theelectricity network other than the supply of bulk power. thesesystems are typically ground-mounted and functioningindependently of any nearby development.
A wide range of mounting structures has been developedespecially for bIPV; including PV facades, sloped and flat roofmountings, integrated (opaque or semi-transparent) glass-glassmodules and “PV roof tiles”. Single or two-axis tracking systemshave recently become more and more attractive for ground-mounted systems, particularly for PV utilization in countries with ahigh share of direct irradiation. by using such systems, the energyyield can typically be increased by 25-35% for single axis trackersand 35-45% for double axis trackers compared with fixed systems.
GRID-CONNECTED PV SYSTEMS
In grid-connected PV systems, an inverter is used to convertelectricity from direct current (dc) as produced by the PV array toalternating current (Ac) that is then supplied to the electricitynetwork. the typical weighted conversion efficiency is in the rangeof 95% to 99%. Most inverters incorporate a Maximum PowerPoint tracker (MPPt), which continuously adjusts the loadimpedance to provide the maximum power from the PV array.one inverter can be used for the whole array or separate invertersmay be used for each “string” of modules. PV modules withintegrated inverters, usually referred to as “Ac modules”, can bedirectly connected to the electricity network (where approved bynetwork operators) and play an increasing role in certain markets.
OFF-GRID PV SYSTEMS
For off-grid systems, a storage battery is required to provide energyduring low-light periods. nearly all batteries used for PV systems areof the deep discharge lead-acid type. other types of batteries (e. g.nicad, niMH, li-Ion) are also suitable and have the advantage thatthey cannot be over-charged or deep-discharged, but these areconsiderably more expensive. the lifetime of a battery varies,depending on the operating regime and conditions, but is typicallybetween 5 and 10 years even if progresses are seen in that field.
A charge controller (or regulator) is used to maintain the batteryat the highest possible state of charge (Soc) and provide the userwith the required quantity of electricity while protecting thebattery from deep discharge or overcharging. Some chargecontrollers also have integrated MPP trackers to maximize the PVelectricity generated. If there is the requirement for Ac electricity,a “stand-alone inverter” can supply conventional Ac appliances.
there are six primary applications for PV power systems startingfrom small pico systems of some watts to very large-scale PVplants of hundreds of Mw.
Pico PV systems have experienced significant development in thelast few years, combining the use of very efficient lights (mostlyleds) with sophisticated charge controllers and efficient batteries.with a small PV panel of only a few watts, essential services can beprovided, such as lighting, phone charging and powering a radio ora small computer. expandable versions of solar pico PV systems
ieA PVPS trendS 2017 In PHotoVoltAIc APPlIcAtIonS
one // chAPter 1 PV tecHnoloGy And APPlIcAtIonS 6
PV APPlIcAtIonS And
MArket SeGMentS
PV tecHnoloGy / contInUed
ieA PVPS trendS 2017 In PHotoVoltAIc APPlIcAtIonS
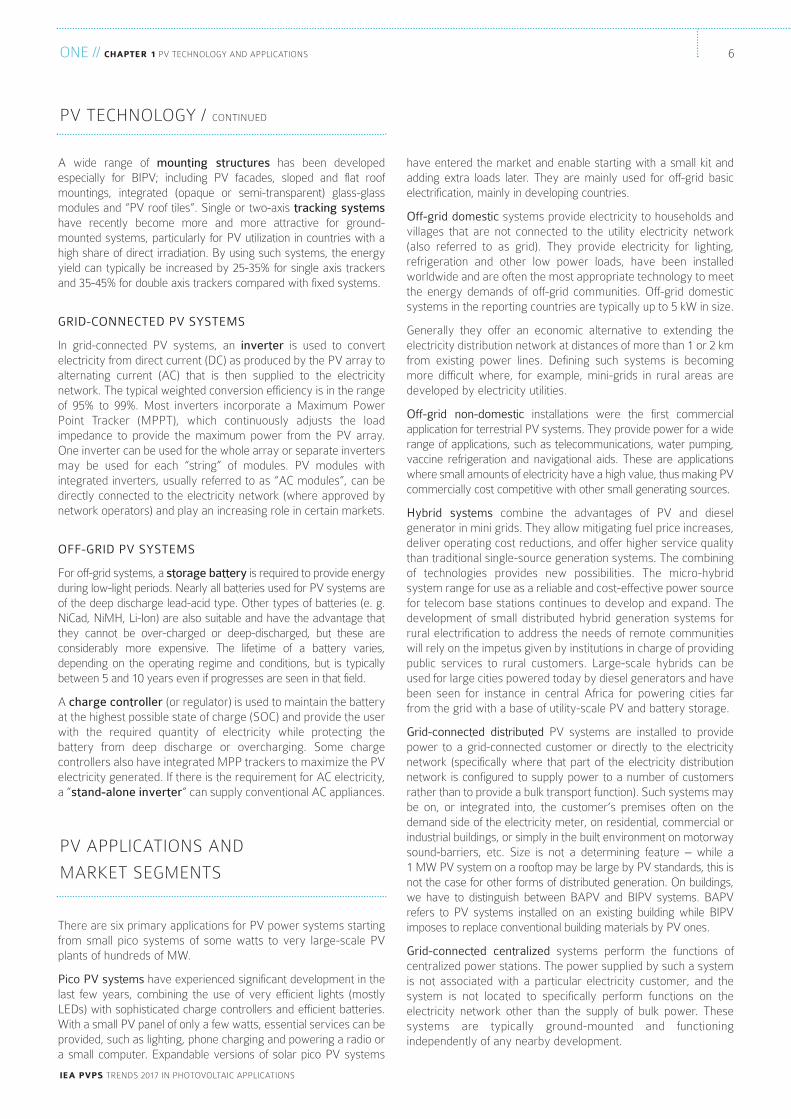
the IeA PVPS countries represented more than 264 Gw ofcumulative PV installations altogether, mostly grid-connected, atthe end of 2016. the other 38 countries that have been consideredand are not part of the IeA PVPS Programme represented 40additional Gw. An historical part is located in europe: Uk withalmost 12 Gw, Greece with 2,6 Gw, czech republic with 2,2 Gwinstalled, romania with 1,4 Gw, bulgaria with 1,0 Gw and Ukraineand Slovakia below the Gw mark. the other major countries thataccounted for the highest cumulative installations at the end of2016 are India with more than 9 Gw, South Africa with 1 Gw,taiwan with 1,2 Gw, Pakistan with an estimated 1 Gw, Ukrainewith 0,7 Gw and the Philippines with 0,9 Gw. numerous countriesall over the world have started to develop PV but few have yetreached a significant development level in terms of cumulativeinstalled capacity at the end of 2016 outside the ones mentionedabove. According to a paper released in 20171 49 countries had aleast 100 Mw cumulative at the end of 2016 and 58 countries hadmore than 10 Mw.
Presently it appears that 303 Gw represents the minimuminstalled by end of 2016 with a firm level of certainty.
More than twenty years of PV market development haveresulted in the deployment of more than 303 GW of PVsystems all over the world. However, the diversity of PVmarkets calls for an in-depth look at the way PV has beendeveloping in all major markets, in order to better understandthe drivers of this growth.
this report counts all installations, both grid-connected andreported off-grid installations. by convention, the numbersreported refer to the nominal power of PV systems installed.these are expressed in w (or wp). Some countries are reportingthe power output of the PV inverter (device converting dc powerfrom the PV system into Ac electricity compatible with standardelectricity networks). the difference between the standard dcPower (in wp) and the Ac power can range from as little as 5%(conversion losses) to as much as 40% (for instance some gridregulations limit output to as little as 65% of the peak power fromthe PV system, but also higher dc/Ac ratios reflect the evolutionof utility-scale PV systems). conversion of Ac data has beenmade when necessary, in order to calculate the most preciseinstallation numbers every year. Global totals should beconsidered as indications rather than exact statistics. data fromcountries outside of the IeA PVPS network have been obtainedthrough different sources, some of them based on trade statistics.
MetHodoloGy
twoPV MARKET DEVELOPMENT TRENDS
© Gaetan Masson
tHe GlobAl PV
InStAlled cAPAcIty
1 “latest developments in Global Installed Photovoltaic capacity and Identification of HiddenGrowth Markets”, werner ch., Gerlach A., Masson G., breyer ch., 2017.
ieA PVPS trendS 2017 In PHotoVoltAIc APPlIcAtIonS
two // chAPter 2 PV MArket deVeloPMent trendS 8
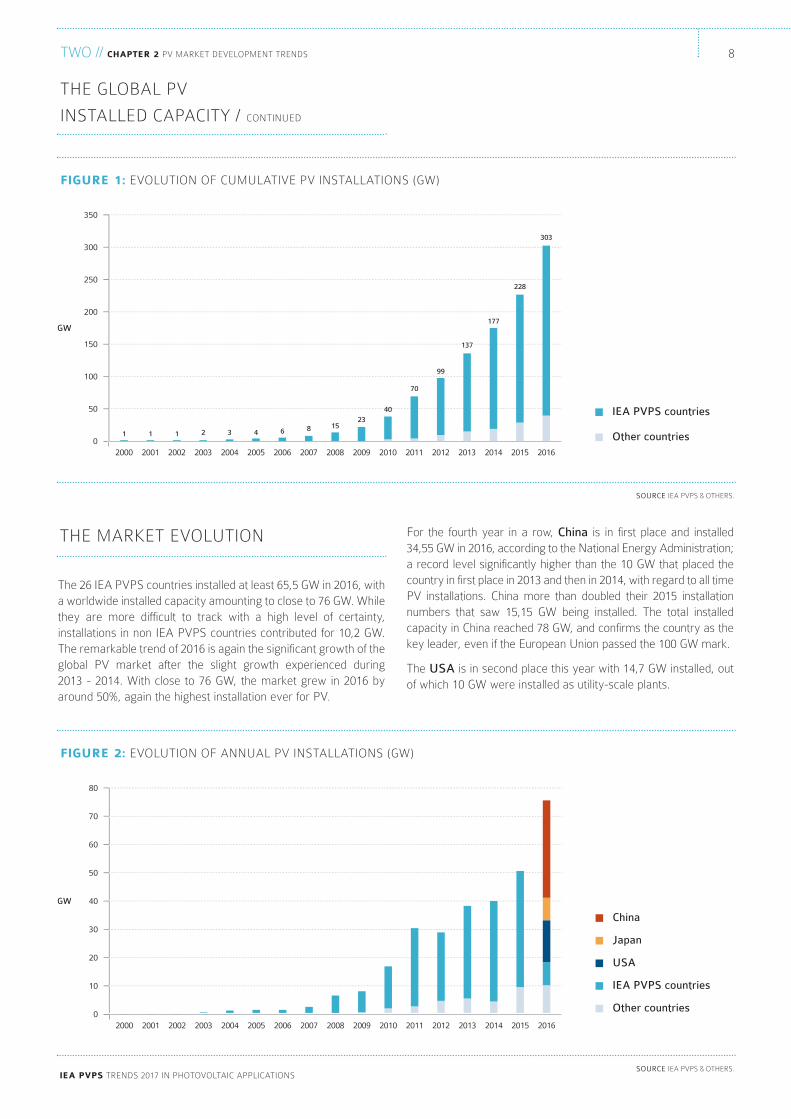
For the fourth year in a row, China is in first place and installed 34,55 Gw in 2016, according to the national energy Administration;a record level significantly higher than the 10 Gw that placed thecountry in first place in 2013 and then in 2014, with regard to all timePV installations. china more than doubled their 2015 installationnumbers that saw 15,15 Gw being installed. the total installedcapacity in china reached 78 Gw, and confirms the country as thekey leader, even if the european Union passed the 100 Gw mark.
the USA is in second place this year with 14,7 Gw installed, outof which 10 Gw were installed as utility-scale plants.
the 26 IeA PVPS countries installed at least 65,5 Gw in 2016, witha worldwide installed capacity amounting to close to 76 Gw. whilethey are more difficult to track with a high level of certainty,installations in non IeA PVPS countries contributed for 10,2 Gw.the remarkable trend of 2016 is again the significant growth of theglobal PV market after the slight growth experienced during 2013 - 2014. with close to 76 Gw, the market grew in 2016 byaround 50%, again the highest installation ever for PV.
tHe MArket eVolUtIon
SOURCE IeA PVPS & otHerS.
fiGure 1: eVolUtIon oF cUMUlAtIVe PV InStAllAtIonS (Gw)
0
50
100
150
200
250
300
350
GW
2000
1
2001
1
2002
1
2003
2
2004
3
2005
4
2006
6
2007
8
2008
15
2009
23
2010
40
2011
70
2012
99
2013
137
2014
177
2015
228
2016
303
40404
137371
IEA PVPS countries
Other countries
SOURCE IeA PVPS & otHerS.
fiGure 2: eVolUtIon oF AnnUAl PV InStAllAtIonS (Gw)
0
10
20
30
40
50
60
70
80
GW
2000 2001 2002 2003 2004 2005 2006 2007 2008 2009 2010 2011 2012 2013 2014 2015 2016
Japan
USA
Other countries
IEA PVPS countries
China
tHe GlobAl PV
InStAlled cAPAcIty / contInUed
9
ieA PVPS trendS 2017 In PHotoVoltAIc APPlIcAtIonS
two // chAPter 2 PV MArket deVeloPMent trendS
IEA-PVPS
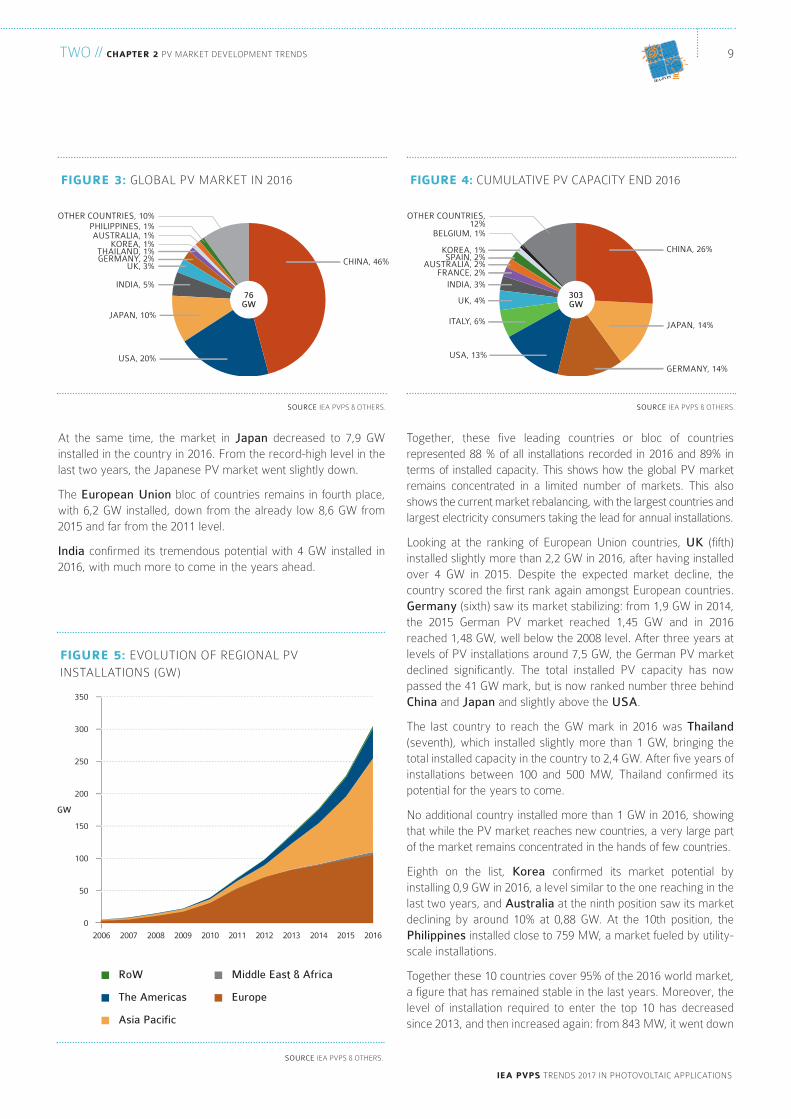
At the same time, the market in Japan decreased to 7,9 Gwinstalled in the country in 2016. From the record-high level in thelast two years, the Japanese PV market went slightly down.
the European Union bloc of countries remains in fourth place,with 6,2 Gw installed, down from the already low 8,6 Gw from2015 and far from the 2011 level.
India confirmed its tremendous potential with 4 Gw installed in2016, with much more to come in the years ahead.
together, these five leading countries or bloc of countriesrepresented 88 % of all installations recorded in 2016 and 89% interms of installed capacity. this shows how the global PV marketremains concentrated in a limited number of markets. this alsoshows the current market rebalancing, with the largest countries andlargest electricity consumers taking the lead for annual installations.
looking at the ranking of european Union countries, UK (fifth)installed slightly more than 2,2 Gw in 2016, after having installedover 4 Gw in 2015. despite the expected market decline, thecountry scored the first rank again amongst european countries.Germany (sixth) saw its market stabilizing: from 1,9 Gw in 2014,the 2015 German PV market reached 1,45 Gw and in 2016reached 1,48 Gw, well below the 2008 level. After three years atlevels of PV installations around 7,5 Gw, the German PV marketdeclined significantly. the total installed PV capacity has nowpassed the 41 Gw mark, but is now ranked number three behindChina and Japan and slightly above the USA.
the last country to reach the Gw mark in 2016 was Thailand(seventh), which installed slightly more than 1 Gw, bringing thetotal installed capacity in the country to 2,4 Gw. After five years ofinstallations between 100 and 500 Mw, thailand confirmed itspotential for the years to come.
no additional country installed more than 1 Gw in 2016, showingthat while the PV market reaches new countries, a very large partof the market remains concentrated in the hands of few countries.
eighth on the list, Korea confirmed its market potential byinstalling 0,9 Gw in 2016, a level similar to the one reaching in thelast two years, and Australia at the ninth position saw its marketdeclining by around 10% at 0,88 Gw. At the 10th position, thePhilippines installed close to 759 Mw, a market fueled by utility-scale installations.
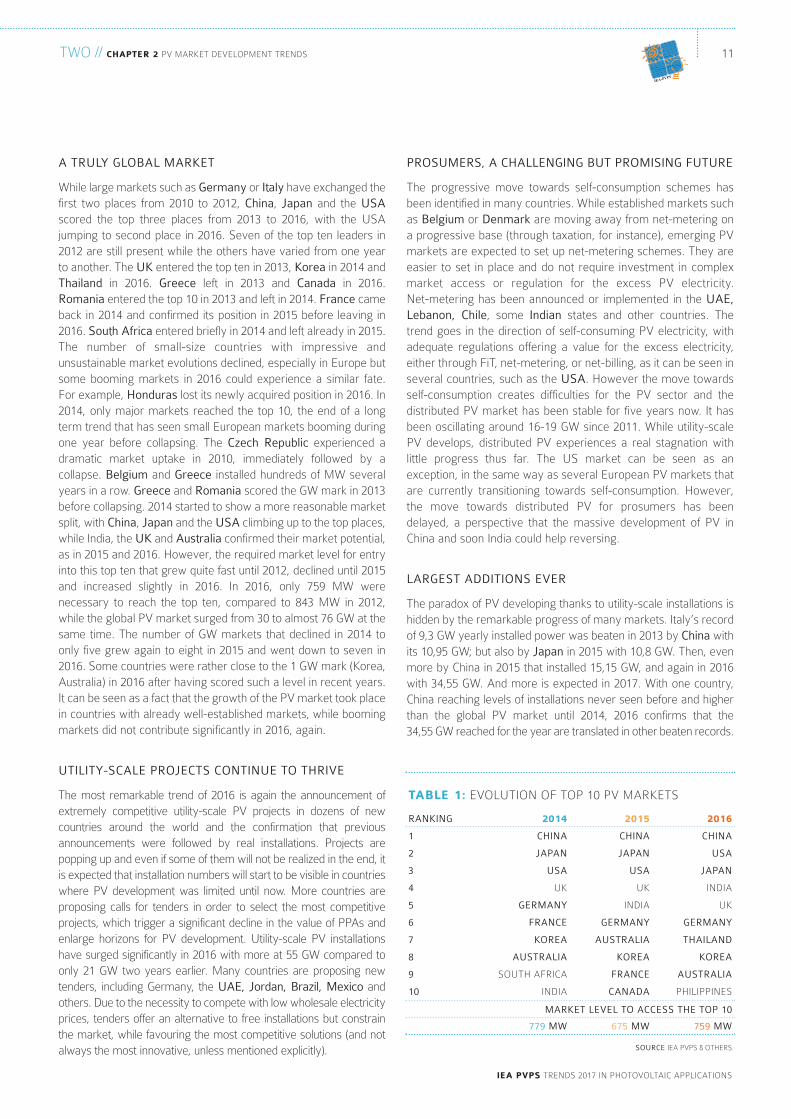
together these 10 countries cover 95% of the 2016 world market,a figure that has remained stable in the last years. Moreover, thelevel of installation required to enter the top 10 has decreasedsince 2013, and then increased again: from 843 Mw, it went down
SOURCE IeA PVPS & otHerS.
fiGure 3: GlobAl PV MArket In 2016
CHINA, 46%
JAPAN, 10%
INDIA, 5%
UK, 3%GERMANY, 2%THAILAND, 1%
KOREA, 1%AUSTRALIA, 1%
PHILIPPINES, 1%OTHER COUNTRIES, 10%
76GW
USA, 20%
SOURCE IeA PVPS & otHerS.
fiGure 4: cUMUlAtIVe PV cAPAcIty end 2016
CHINA, 26%
GERMANY, 14%
JAPAN, 14%
USA, 13%
SPAIN, 2%
ITALY, 6%
UK, 4%
INDIA, 3%FRANCE, 2%
AUSTRALIA, 2%
KOREA, 1%
BELGIUM, 1%
OTHER COUNTRIES,12%
303GW
SOURCE IeA PVPS & otHerS.
fiGure 5: eVolUtIon oF reGIonAl PV
InStAllAtIonS (Gw)
0
50
100
150
200
250
300
350
GW
2006 2007 2008 2009 2010 2011 2012 2013 2014 2015 2016
Middle East & Africa
Asia Pacific
The Americas
RoW
Europe
(roughly 171 Mwdc), compared to 151 Mw of the year before.Sweden, Finland and Norway reached respectively 79 Mw, 37,4 Mw and 26,6 Mw of cumulative installed capacity withmarkets growing at a low level.
In Asia, Malaysia installed 72 Mw for the fifth year of its Feed-intariff (Fit) system. Taiwan installed 369 Mw in a growing marketnow supported by pro-solar policymakers and many othercountries in the region have started to implement PV policies.
In latin America, Chile leads installation capacity with 495 Mw in2016. Projects are popping up in brazil and Honduras. Hondurasinstalled 391 Mw in 2015, but this outcome was not repeated in2016. the real PV development of grid-connected PV plants hasfinally started and additional countries have installed dozens ofMw. Among the most promising prospects in the region, Mexicoinstalled close to 143 Mw but several Gw have been granted todevelopers, which might transform the country into the very firstGw-size market in latin America.
In the Middle east, with hundreds of Mw of projects granted tosuper competitive tenders in Jordan or the UAe, the MenAregion seems on the verge of becoming a new focal point for PVdevelopment, especially with the extremely low PPA grantedthere: Jordan installed more than 150 Mw. Finally, Africa alsosees PV deployment, with Algeria having installed 268 Mw in2015 and 54 Mw more in 2016. South Africa commissionedaround 70 Mw after a rapid expansion in 2014 and more isalready granted for the years to come. Many other countries areexperiencing some PV development, from Morocco to Ghana oreven Nigeria, with double-digit Mw markets.
to 675 Mw in 2015, and rose again to 759 Mw in 2016, a sign thatthe growth of the global PV market has been driven by topcountries, while others are contributing marginally, still in 2016;fueling fears for the market stability if one of the top threemarkets, and especially China, would experience a slowdown.
behind the top ten, some countries installed significant amounts of PV.Turkey installed 583 Mw, in progress and France installed 559 Mw,going down significantly compared to previous years despite a realchange in policies. the Netherlands installed with 525 Mw, togetherwith Chile (495Mw), Italy (382 Mw) and Israel (130 Mw). SouthAfrica installed officially 70 Mw and Canada 143 Mw.
Among these countries, some have already reached high PVcapacities due to past installations. this is the case for Italy that tops19,3 Gw but also for the Netherlands which has reached the 2 Gwmark, Romania with 1,4 Gw and Israel is approaching 1 Gw.
In europe, several other countries where the PV market used todevelop in the last years, have performed in various ways. Belgiuminstalled 173 Mw and has reached 3,4 Gw. Some countries thatgrew dramatically over recent years have now stalled orexperienced limited additions: Spain (55 Mw) now totals 4,7 Gwacof PV systems (respectively dc calculation 58 Mwdc and 5,5 Gwdc), followed by the Czech Republic at 2,2 Gw andSwitzerland at 1,66 Gw. In Denmark, the market that experienceda rebound due to utility-scale installations in 2015 went down again:the distributed PV market that developed thanks to the net-meteringscheme remained at a low level. Denmark installed a total of 71 Mw. Austria continued at the same place with 155 Mwac
two // chAPter 2 PV MArket deVeloPMent trendS
ieA PVPS trendS 2017 In PHotoVoltAIc APPlIcAtIonS
10
tHe MArket eVolUtIon / contInUed
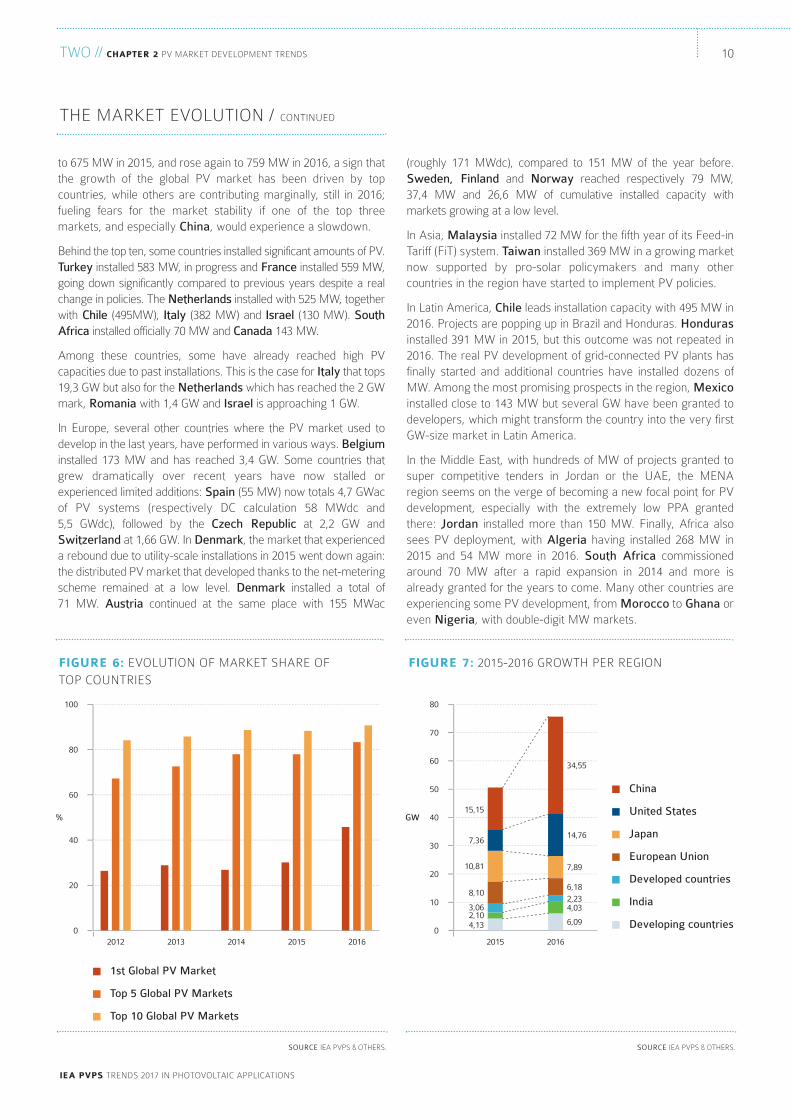
fiGure 6: eVolUtIon oF MArket SHAre oF
toP coUntrIeS
0
20
40
60
80
100
%
2012 2013 2014 2015 2016
Top 5 Global PV Markets
1st Global PV Market
Top 10 Global PV Markets
fiGure 7: 2015-2016 GrowtH Per reGIon
0
10
20
30
40
50
60
70
80
GW
2015 2016
India
Developing countries
Developed countries
European Union
Japan
United States
China
15,15
34,55
7,3614,76
10,81 7,89
8,106,18
3,062,23
2,104,03
4,13 6,09
SOURCE IeA PVPS & otHerS.SOURCE IeA PVPS & otHerS.
11
ieA PVPS trendS 2017 In PHotoVoltAIc APPlIcAtIonS
two // chAPter 2 PV MArket deVeloPMent trendS
IEA-PVPS
A TRULY GLOBAL MARKET
while large markets such as Germany or Italy have exchanged thefirst two places from 2010 to 2012, China, Japan and the USAscored the top three places from 2013 to 2016, with the USAjumping to second place in 2016. Seven of the top ten leaders in2012 are still present while the others have varied from one yearto another. the UK entered the top ten in 2013, Korea in 2014 andThailand in 2016. Greece left in 2013 and Canada in 2016.Romania entered the top 10 in 2013 and left in 2014. France cameback in 2014 and confirmed its position in 2015 before leaving in2016. South Africa entered briefly in 2014 and left already in 2015.the number of small-size countries with impressive andunsustainable market evolutions declined, especially in europe butsome booming markets in 2016 could experience a similar fate.For example, Honduras lost its newly acquired position in 2016. In2014, only major markets reached the top 10, the end of a longterm trend that has seen small european markets booming duringone year before collapsing. the Czech Republic experienced adramatic market uptake in 2010, immediately followed by acollapse. Belgium and Greece installed hundreds of Mw severalyears in a row. Greece and Romania scored the Gw mark in 2013before collapsing. 2014 started to show a more reasonable marketsplit, with China, Japan and the USA climbing up to the top places,while India, the UK and Australia confirmed their market potential,as in 2015 and 2016. However, the required market level for entryinto this top ten that grew quite fast until 2012, declined until 2015and increased slightly in 2016. In 2016, only 759 Mw werenecessary to reach the top ten, compared to 843 Mw in 2012,while the global PV market surged from 30 to almost 76 Gw at thesame time. the number of Gw markets that declined in 2014 toonly five grew again to eight in 2015 and went down to seven in2016. Some countries were rather close to the 1 Gw mark (korea,Australia) in 2016 after having scored such a level in recent years.It can be seen as a fact that the growth of the PV market took placein countries with already well-established markets, while boomingmarkets did not contribute significantly in 2016, again.
UTILITY-SCALE PROJECTS CONTINUE TO THRIVE
the most remarkable trend of 2016 is again the announcement ofextremely competitive utility-scale PV projects in dozens of newcountries around the world and the confirmation that previousannouncements were followed by real installations. Projects arepopping up and even if some of them will not be realized in the end, itis expected that installation numbers will start to be visible in countrieswhere PV development was limited until now. More countries areproposing calls for tenders in order to select the most competitiveprojects, which trigger a significant decline in the value of PPAs andenlarge horizons for PV development. Utility-scale PV installationshave surged significantly in 2016 with more at 55 Gw compared toonly 21 Gw two years earlier. Many countries are proposing newtenders, including Germany, the UAE, Jordan, Brazil, Mexico andothers. due to the necessity to compete with low wholesale electricityprices, tenders offer an alternative to free installations but constrainthe market, while favouring the most competitive solutions (and notalways the most innovative, unless mentioned explicitly).
PROSUMERS, A CHALLENGING BUT PROMISING FUTURE
the progressive move towards self-consumption schemes hasbeen identified in many countries. while established markets suchas Belgium or Denmark are moving away from net-metering ona progressive base (through taxation, for instance), emerging PVmarkets are expected to set up net-metering schemes. they areeasier to set in place and do not require investment in complexmarket access or regulation for the excess PV electricity. net-metering has been announced or implemented in the UAE,Lebanon, Chile, some Indian states and other countries. thetrend goes in the direction of self-consuming PV electricity, withadequate regulations offering a value for the excess electricity,either through Fit, net-metering, or net-billing, as it can be seen inseveral countries, such as the USA. However the move towardsself-consumption creates difficulties for the PV sector and thedistributed PV market has been stable for five years now. It hasbeen oscillating around 16-19 Gw since 2011. while utility-scalePV develops, distributed PV experiences a real stagnation withlittle progress thus far. the US market can be seen as anexception, in the same way as several european PV markets thatare currently transitioning towards self-consumption. However,the move towards distributed PV for prosumers has beendelayed, a perspective that the massive development of PV inchina and soon India could help reversing.
LARGEST ADDITIONS EVER
the paradox of PV developing thanks to utility-scale installations ishidden by the remarkable progress of many markets. Italy’s recordof 9,3 Gw yearly installed power was beaten in 2013 by China withits 10,95 Gw; but also by Japan in 2015 with 10,8 Gw. then, evenmore by china in 2015 that installed 15,15 Gw, and again in 2016with 34,55 Gw. And more is expected in 2017. with one country,china reaching levels of installations never seen before and higherthan the global PV market until 2014, 2016 confirms that the 34,55 Gw reached for the year are translated in other beaten records.
SOURCE IeA PVPS & otHerS.
tAble 1: eVolUtIon oF toP 10 PV MArketS
RANKING
1
2
3
4
5
6
7
8
9
10
2014
CHINA
JAPAN
USA
Uk
GERMANY
FRANCE
KOREA
AUSTRALIA
SoUtH AFrIcA
IndIA
779 MW
2015
CHINA
JAPAN
USA
Uk
IndIA
GERMANY
AUSTRALIA
KOREA
FRANCE
CANADA
675 MW
2016
CHINA
USA
JAPAN
IndIA
Uk
GERMANY
THAILAND
KOREA
AUSTRALIA
PHIlIPPIneS
759 MW
MARKET LEVEL TO ACCESS THE TOP 10
two // chAPter 2 PV MArket deVeloPMent trendS
ieA PVPS trendS 2017 In PHotoVoltAIc APPlIcAtIonS
12
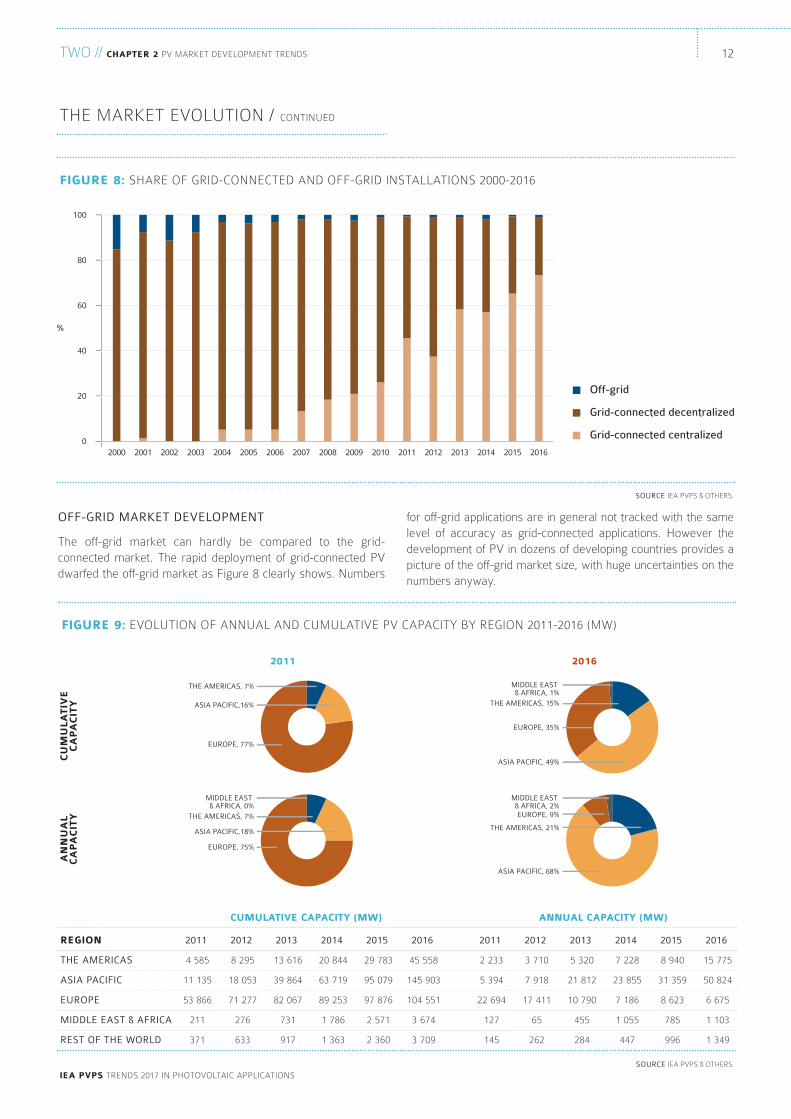
for off-grid applications are in general not tracked with the samelevel of accuracy as grid-connected applications. However thedevelopment of PV in dozens of developing countries provides apicture of the off-grid market size, with huge uncertainties on thenumbers anyway.
OFF-GRID MARKET DEVELOPMENT
the off-grid market can hardly be compared to the grid-connected market. the rapid deployment of grid-connected PVdwarfed the off-grid market as Figure 8 clearly shows. numbers
tHe MArket eVolUtIon / contInUed
SOURCE IeA PVPS & otHerS.
fiGure 8: SHAre oF GrId-connected And oFF-GrId InStAllAtIonS 2000-2016
0
20
40
60
80
100
%
2000 2001 2002 2003 2004 2005 2006 2007 2008 2009 2010 2011 2012 2013 2014 2015 2016
Grid-connected decentralized
Off-grid
Grid-connected centralized
2011 2016
SOURCE IeA PVPS & otHerS.
fiGure 9: eVolUtIon oF AnnUAl And cUMUlAtIVe PV cAPAcIty by reGIon 2011-2016 (Mw)
ASIA PACIFIC,16%
THE AMERICAS, 7%
EUROPE, 77%
ASIA PACIFIC,18%
THE AMERICAS, 7%
MIDDLE EAST & AFRICA, 0%
EUROPE, 75%
ASIA PACIFIC, 49%
THE AMERICAS, 15%
MIDDLE EAST & AFRICA, 1%
EUROPE, 35%
ASIA PACIFIC, 68%
THE AMERICAS, 21%
MIDDLE EAST & AFRICA, 2%EUROPE, 9%
cu
Mu
lAtiV
ec
AP
Ac
ity
An
nu
Al
cA
PA
cit
y
reGion
THE AMERICAS
ASIA PACIFIC
EUROPE
MIDDLE EAST & AFRICA
REST OF THE WORLD
2011
4 585
11 135
53 866
211
371
2012
8 295
18 053
71 277
276
633
2013
13 616
39 864
82 067
731
917
2014
20 844
63 719
89 253
1 786
1 363
2015
29 783
95 079
97 876
2 571
2 360
2016
45 558
145 903
104 551
3 674
3 709
2011
2 233
5 394
22 694
127
145
2012
3 710
7 918
17 411
65
262
2013
5 320
21 812
10 790
455
284
2014
7 228
23 855
7 186
1 055
447
2015
8 940
31 359
8 623
785
996
2016
15 775
50 824
6 675
1 103
1 349
AnnuAl cAPAcity (Mw)cuMulAtiVe cAPAcity (Mw)
13
ieA PVPS trendS 2017 In PHotoVoltAIc APPlIcAtIonS
two // chAPter 2 PV MArket deVeloPMent trendS
IEA-PVPS
nevertheless, off-grid applications are developing more rapidly inseveral countries than in the past and some targeted support hasbeen implemented.
In Australia, 36 Mw of off-grid systems have been installed in 2016,bringing the total to 210 Mw. In China, some estimates showed that10 Mw of off-grid applications have been installed in 2016, with anunknown percentage of hybrid systems and mobile products. It canbe considered that most industrial applications and ruralelectrification systems are most probably hybrid. It must be notedthat China has reached 100% of electrification in 2015, which will inany case significantly reduce the level of off-grid installations in thefuture. Japan has reported 34 Mw of off-grid applications in 2016,significantly higher than in 2015; bringing the installed capacityabove 150 Mw, mainly in the non-domestic segment.
In most European countries, the off-grid market remains a verysmall one, mainly for remote sites, leisure and communicationdevices that deliver electricity for specific uses. Some mountainsites are equipped with PV as an alternative to bringing fuel toremote, hardly accessible places. However, this market remainsquite small, with at most some Mw installed per year per country,for instance with around 1,5 Mw in Sweden.
In some countries, off-grid systems with back-up (either dieselgenerators or chemical batteries) represent an alternative in orderto bring the grid into remote areas. this trend is specific tocountries that have enough solar resource throughout the year tomake a PV system viable. In Africa for instance, PV has beenseen being deployed to power off-grid cities and villages. theexample of the city of Manono in katanga (dr congo) shows howoff-grid applications are becoming mainstream and increase alsoin size: 1 Mw of ground-mounted PV with 3 Mwh of battery-storage powers up the city and opens a brand new market forlarge-scale off-grid PV applications.
In most developed countries in Europe, Asia or the Americas,this trend remains unseen and the future development of off-gridapplications will most probably be seen first on remote islands.the case of Greece is rather interesting in europe, with numerousislands not connected to the mainland grid that have installeddozens of Mw of PV systems in the previous years. thesesystems, providing electricity to some thousands of customers willrequire rapid adaptation of the management of these mini-grids inorder to cope with high penetrations of PV. the French islands inthe caribbean Sea and the Indian ocean have already imposedspecific grid codes to PV system owners: PV production must beforecasted and announced in order to better plan gridmanagement. As an example, Reunion Island (France) operatedmore than 189 Mw of PV at the end of 2016 for a total populationof 840 000. High PV penetration levels on several islands havedirect consequences on the share of PV electricity: in Kiribati, thispercentage reaches 12,3%, in Cape Verde 6,7%, and around 5%in Malta, Comoros and Solomon Islands.
off-grid SHS systems (small PV systems with a small battery)have developed rapidly in the last years, with six million systemsinstalled worldwide. outside the IeA PVPS network, bangladeshinstalled an impressive amount of these off-grid SHS systems inrecent years. More than four million systems were operational bythe end of 2016 with at least 180 Mw installed. Six million PVinstallations providing basic electricity needs for more than thirtymillion people were expected by end 2017.
In latin America, Peru has committed to a program of ruralelectrification with PV, as is the case in many other countries.
India has foreseen up to 2 Gw of off-grid installations by 2017,including twenty million solar lights in its national Solar Mission.these impressive numbers show how PV now represents acompetitive alternative to providing electricity in areas wheretraditional grids have not yet been deployed. In the same way asmobile phones are connecting people without the traditional lines,PV is perceived as a way to provide electricity without firstbuilding complex and costly grids. the challenge of providingelectricity for lighting and communication, including access to theInternet, will see the progress of PV as one of the most reliableand promising sources of electricity in developing countries in thecoming years.
In China, the solar program allows building PV plants on buildings inremote areas to fight poverty. this poverty alleviation program hasalready led to several Gw of PV installations and continues in 2017.
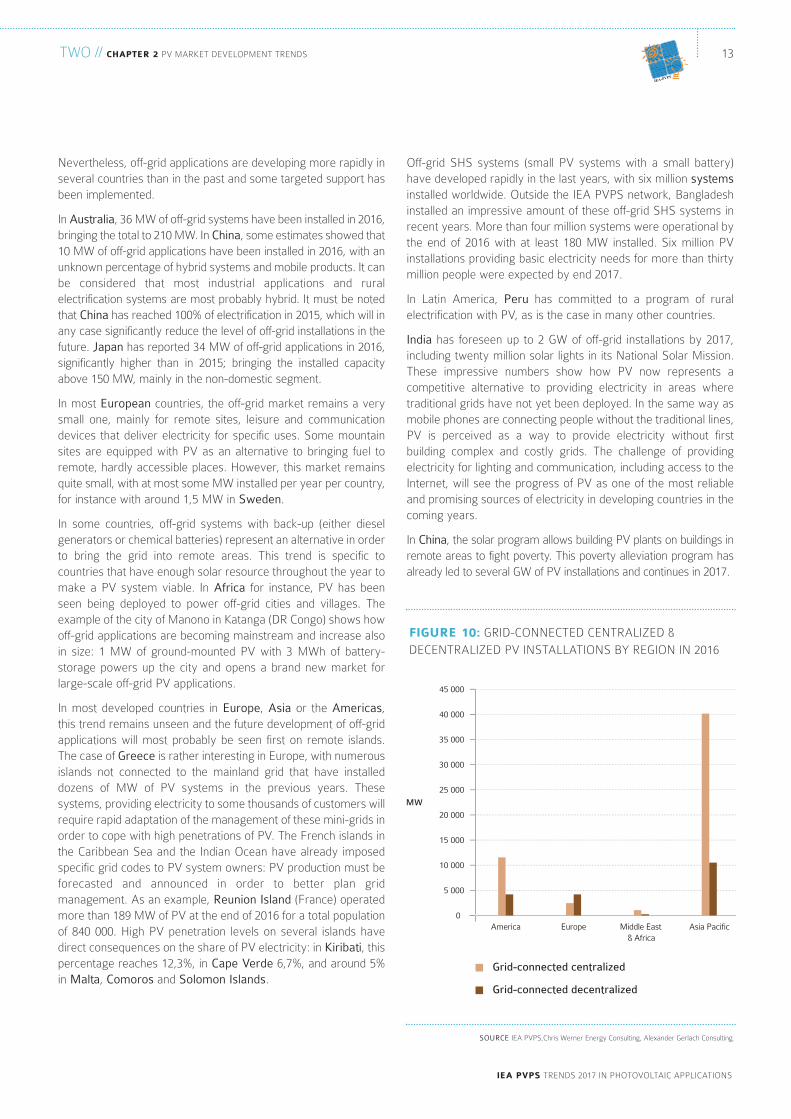
SOURCE IeA PVPS,chris werner energy consulting, Alexander Gerlach consulting.
fiGure 10: GrId-connected centrAlIzed &
decentrAlIzed PV InStAllAtIonS by reGIon In 2016
0
5 000
10 000
15 000
20 000
25 000
30 000
35 000
40 000
45 000
MW
America Europe Middle East & Africa
Asia Pacific
Grid-connected centralized
Grid-connected decentralized
more than 730 000 electric vehicles sold in the world in 2016 andmore than one million expected during the year 2017, theautomotive sector is moving quickly towards connecting to theelectricity industry.
the role of PV as an enabler of that energy transition is more andmore obvious and the idea of powering mobility with solar isbecoming slowly a reality thanks to joint commercial offers for PVand storage.
THE ENERGY STORAGE MARKET
while 2015 was a year of significant announcements with regardto electricity storage, in comparison 2016 delivered little. themarket is not moving quickly, except in some specific countries.the reason is rather simple: few incentives exist and the numberof markets where electricity storage could be competitive isreduced. As a matter of fact, only Germany has incentives forbattery storage in PV systems, Italy has a tax rebate and someSwiss cantons have subsidy schemes. In Germany during the year2016, the installation of storage systems was funded for 6 468storage systems (800 for existing and 5 668 for newly installed PVsystems), with the total volume of loans reaching 105 MeUr.
In the USA, california has funded up to-date approximately 59 Mw of storage, and 280 storage projects. In Hawaii, 17 utility-led energy storage projects have been supported. In theFrench overseas’ departments (including corsica), a call fortenders for 50 Mw of PV systems above 100 kw with storage hasbeen initiated in 2015, aiming at increasing the grid stability. thewinning candidates for this call have been announced in June2016. out of 356 Mw of submitted projects, 52 Mw were selectedwith an average contract tariff of 204 eUr/Mwh. Half of thevolume will be built in the French Antilles (including FrenchGuyana). Half of the volume will be ground mounted or parkingcanopy systems, the rest will be installed in buildings.
In Japan, projects to install storage batteries are also increasingbut they are limited by subsidies since the cost remains high.Storage batteries for residential applications are part of a subsidyprogram to accelerate the development of net zero energyhouses. For this subsidy program, five rounds of public invitationwere carried out, which received 6 368 applications in total. othersubsidy for storage batteries are available in Japan.
In general, battery storage is seen by some as an opportunity tosolve some grid integration issues linked to PV and to increase theself-consumption ratios of PV plants. However, the cost of such asolution prevents them from largely being used for the time being.on large-scale PV plants, batteries can be used to stabilize gridinjection and in some cases, to provide ancillary services to the grid.
THE ELECTRIFICATION OF TRANSPORT, HEATING ANDCOOLING.
the energy transition will require electricity to become the mainvector for applications that used to consume fossil fuels, directlyor indirectly. In that respect, the development of solar heating andcooling hasn’t experienced major developments in 2016, on thecontrary to electric mobility that starts to develop fast in severalcountries: China intends that 10% of all cars sold in china in 2019should be fully electric or plug-in hybrids. In parallel, more andmore countries announced that fossil-fueled cars will be bannedfrom the market from 2030 or 2040. Automotive manufacturersare announcing the electrification of the entire fleet in the comingyears, even if the market remains small in most countries. with
PV deVeloPMent Per
reGIon And SeGMent
two // chAPter 2 PV MArket deVeloPMent trendS
ieA PVPS trendS 2017 In PHotoVoltAIc APPlIcAtIonS
14
tHe MArket eVolUtIon / contInUed
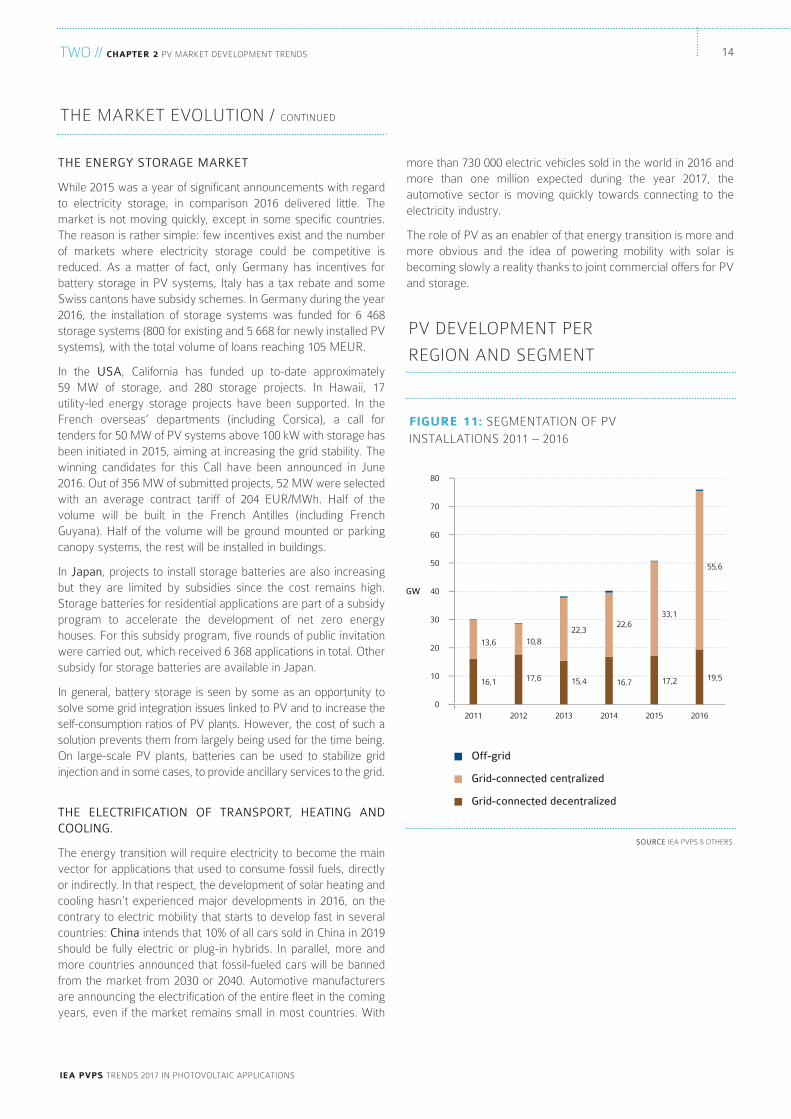
SOURCE IeA PVPS & otHerS.
fiGure 11: SeGMentAtIon oF PV
InStAllAtIonS 2011 – 2016
0
10
20
30
40
50
60
70
80
GW
2011 2012 2013 2014 2015 2016
Grid-connected centralized
Off-grid
Grid-connected decentralized
13,6 10,8
17,6
22,322,6
33,1
55,6
16,1 15,4 16,7 17,2 19,5
15
ieA PVPS trendS 2017 In PHotoVoltAIc APPlIcAtIonS
two // chAPter 2 PV MArket deVeloPMent trendS
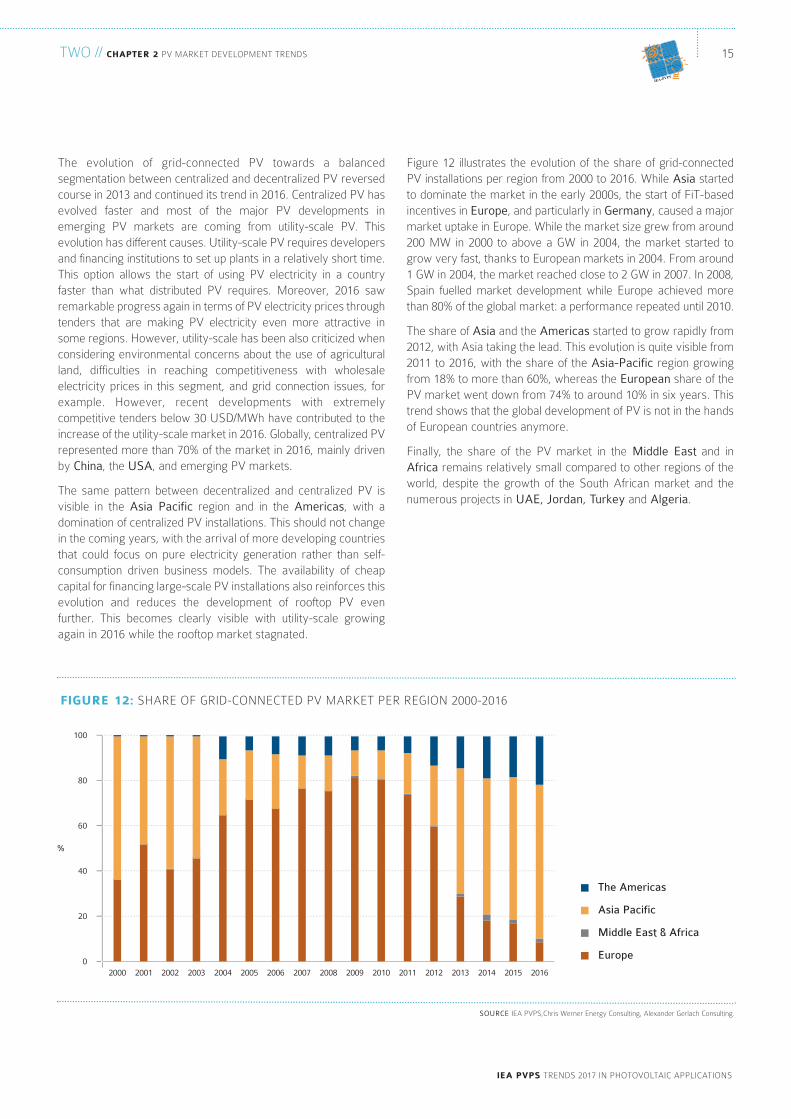
Figure 12 illustrates the evolution of the share of grid-connectedPV installations per region from 2000 to 2016. while Asia startedto dominate the market in the early 2000s, the start of Fit-basedincentives in Europe, and particularly in Germany, caused a majormarket uptake in europe. while the market size grew from around200 Mw in 2000 to above a Gw in 2004, the market started togrow very fast, thanks to european markets in 2004. From around1 Gw in 2004, the market reached close to 2 Gw in 2007. In 2008,Spain fuelled market development while europe achieved morethan 80% of the global market: a performance repeated until 2010.
the share of Asia and the Americas started to grow rapidly from2012, with Asia taking the lead. this evolution is quite visible from2011 to 2016, with the share of the Asia-Pacific region growingfrom 18% to more than 60%, whereas the European share of thePV market went down from 74% to around 10% in six years. thistrend shows that the global development of PV is not in the handsof european countries anymore.
Finally, the share of the PV market in the Middle East and inAfrica remains relatively small compared to other regions of theworld, despite the growth of the South African market and thenumerous projects in UAE, Jordan, Turkey and Algeria.
the evolution of grid-connected PV towards a balancedsegmentation between centralized and decentralized PV reversedcourse in 2013 and continued its trend in 2016. centralized PV hasevolved faster and most of the major PV developments inemerging PV markets are coming from utility-scale PV. thisevolution has different causes. Utility-scale PV requires developersand financing institutions to set up plants in a relatively short time.this option allows the start of using PV electricity in a countryfaster than what distributed PV requires. Moreover, 2016 sawremarkable progress again in terms of PV electricity prices throughtenders that are making PV electricity even more attractive insome regions. However, utility-scale has been also criticized whenconsidering environmental concerns about the use of agriculturalland, difficulties in reaching competitiveness with wholesaleelectricity prices in this segment, and grid connection issues, forexample. However, recent developments with extremelycompetitive tenders below 30 USd/Mwh have contributed to theincrease of the utility-scale market in 2016. Globally, centralized PVrepresented more than 70% of the market in 2016, mainly drivenby China, the USA, and emerging PV markets.
the same pattern between decentralized and centralized PV isvisible in the Asia Pacific region and in the Americas, with adomination of centralized PV installations. this should not changein the coming years, with the arrival of more developing countriesthat could focus on pure electricity generation rather than self-consumption driven business models. the availability of cheapcapital for financing large-scale PV installations also reinforces thisevolution and reduces the development of rooftop PV evenfurther. this becomes clearly visible with utility-scale growingagain in 2016 while the rooftop market stagnated.
IEA-PVPS
SOURCE IeA PVPS,chris werner energy consulting, Alexander Gerlach consulting.
0
20
40
60
80
100
%
2000 2001 2002 2003 2004 2005 2006 2007 2008 2009 2010 2011 2012 2013 2014 2015 2016
Middle East & Africa
Asia Pacific
The Americas
Europe
fiGure 12: SHAre oF GrId-connected PV MArket Per reGIon 2000-2016
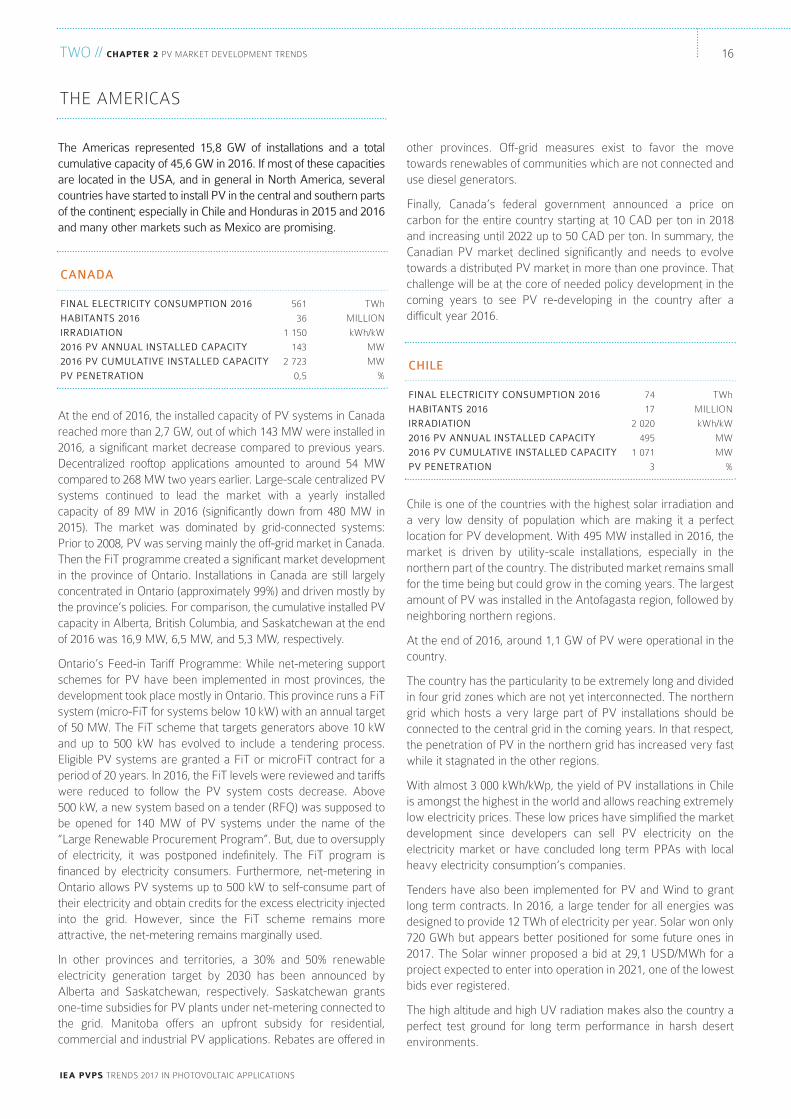
The Americas represented 15,8 GW of installations and a totalcumulative capacity of 45,6 GW in 2016. If most of these capacitiesare located in the USA, and in general in North America, severalcountries have started to install PV in the central and southern partsof the continent; especially in Chile and Honduras in 2015 and 2016and many other markets such as Mexico are promising.
At the end of 2016, the installed capacity of PV systems in canadareached more than 2,7 Gw, out of which 143 Mw were installed in2016, a significant market decrease compared to previous years.decentralized rooftop applications amounted to around 54 Mwcompared to 268 Mw two years earlier. large-scale centralized PVsystems continued to lead the market with a yearly installedcapacity of 89 Mw in 2016 (significantly down from 480 Mw in2015). the market was dominated by grid-connected systems:Prior to 2008, PV was serving mainly the off-grid market in canada.then the Fit programme created a significant market developmentin the province of ontario. Installations in canada are still largelyconcentrated in ontario (approximately 99%) and driven mostly bythe province’s policies. For comparison, the cumulative installed PVcapacity in Alberta, british columbia, and Saskatchewan at the endof 2016 was 16,9 Mw, 6,5 Mw, and 5,3 Mw, respectively.
ontario’s Feed-in tariff Programme: while net-metering supportschemes for PV have been implemented in most provinces, thedevelopment took place mostly in ontario. this province runs a Fitsystem (micro-Fit for systems below 10 kw) with an annual targetof 50 Mw. the Fit scheme that targets generators above 10 kwand up to 500 kw has evolved to include a tendering process.eligible PV systems are granted a Fit or microFit contract for aperiod of 20 years. In 2016, the Fit levels were reviewed and tariffswere reduced to follow the PV system costs decrease. Above 500 kw, a new system based on a tender (rFQ) was supposed tobe opened for 140 Mw of PV systems under the name of the“large renewable Procurement Program”. but, due to oversupplyof electricity, it was postponed indefinitely. the Fit program isfinanced by electricity consumers. Furthermore, net-metering inontario allows PV systems up to 500 kw to self-consume part oftheir electricity and obtain credits for the excess electricity injectedinto the grid. However, since the Fit scheme remains moreattractive, the net-metering remains marginally used.
In other provinces and territories, a 30% and 50% renewableelectricity generation target by 2030 has been announced byAlberta and Saskatchewan, respectively. Saskatchewan grantsone-time subsidies for PV plants under net-metering connected tothe grid. Manitoba offers an upfront subsidy for residential,commercial and industrial PV applications. rebates are offered in
other provinces. off-grid measures exist to favor the movetowards renewables of communities which are not connected anduse diesel generators.
Finally, canada’s federal government announced a price oncarbon for the entire country starting at 10 cAd per ton in 2018and increasing until 2022 up to 50 cAd per ton. In summary, thecanadian PV market declined significantly and needs to evolvetowards a distributed PV market in more than one province. thatchallenge will be at the core of needed policy development in thecoming years to see PV re-developing in the country after adifficult year 2016.
chile is one of the countries with the highest solar irradiation anda very low density of population which are making it a perfectlocation for PV development. with 495 Mw installed in 2016, themarket is driven by utility-scale installations, especially in thenorthern part of the country. the distributed market remains smallfor the time being but could grow in the coming years. the largestamount of PV was installed in the Antofagasta region, followed byneighboring northern regions.
At the end of 2016, around 1,1 Gw of PV were operational in thecountry.
the country has the particularity to be extremely long and dividedin four grid zones which are not yet interconnected. the northerngrid which hosts a very large part of PV installations should beconnected to the central grid in the coming years. In that respect,the penetration of PV in the northern grid has increased very fastwhile it stagnated in the other regions.
with almost 3 000 kwh/kwp, the yield of PV installations in chileis amongst the highest in the world and allows reaching extremelylow electricity prices. these low prices have simplified the marketdevelopment since developers can sell PV electricity on theelectricity market or have concluded long term PPAs with localheavy electricity consumption’s companies.
tenders have also been implemented for PV and wind to grantlong term contracts. In 2016, a large tender for all energies wasdesigned to provide 12 twh of electricity per year. Solar won only720 Gwh but appears better positioned for some future ones in2017. the Solar winner proposed a bid at 29,1 USd/Mwh for aproject expected to enter into operation in 2021, one of the lowestbids ever registered.
the high altitude and high UV radiation makes also the country aperfect test ground for long term performance in harsh desertenvironments.
two // chAPter 2 PV MArket deVeloPMent trendS
ieA PVPS trendS 2017 In PHotoVoltAIc APPlIcAtIonS
16
tHe AMerIcAS
CANADA
FINAL ELECTRICITY CONSUMPTION 2016
HABITANTS 2016
IRRADIATION
2016 PV ANNUAL INSTALLED CAPACITY
2016 PV CUMULATIVE INSTALLED CAPACITY
PV PENETRATION
561
36
1 150
143
2 723
0,5
twh
MIllIon
kwh/kw
Mw
Mw
%CHILE
FINAL ELECTRICITY CONSUMPTION 2016
HABITANTS 2016
IRRADIATION
2016 PV ANNUAL INSTALLED CAPACITY
2016 PV CUMULATIVE INSTALLED CAPACITY
PV PENETRATION
74
17
2 020
495
1 071
3
twh
MIllIon
kwh/kw
Mw
Mw
%
17
ieA PVPS trendS 2017 In PHotoVoltAIc APPlIcAtIonS
two // chAPter 2 PV MArket deVeloPMent trendS
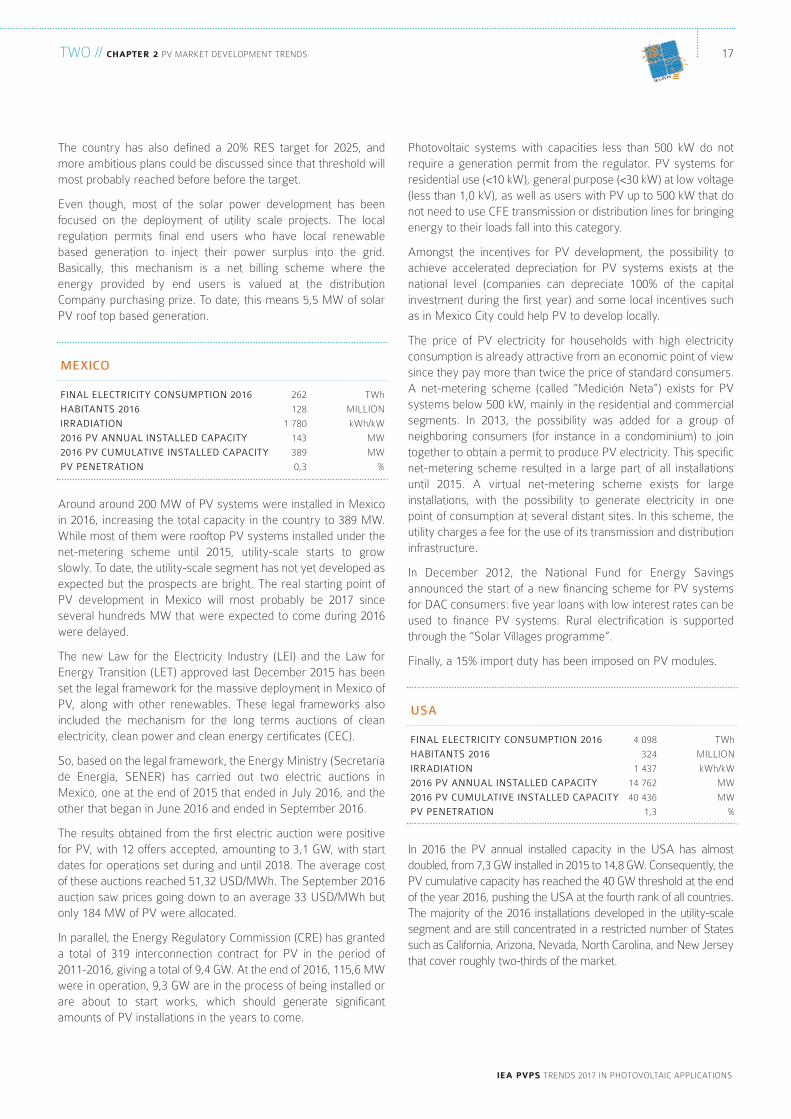
Photovoltaic systems with capacities less than 500 kw do notrequire a generation permit from the regulator. PV systems forresidential use (<10 kw), general purpose (<30 kw) at low voltage(less than 1,0 kV), as well as users with PV up to 500 kw that donot need to use cFe transmission or distribution lines for bringingenergy to their loads fall into this category.
Amongst the incentives for PV development, the possibility toachieve accelerated depreciation for PV systems exists at thenational level (companies can depreciate 100% of the capitalinvestment during the first year) and some local incentives suchas in Mexico city could help PV to develop locally.
the price of PV electricity for households with high electricityconsumption is already attractive from an economic point of viewsince they pay more than twice the price of standard consumers.A net-metering scheme (called “Medición neta”) exists for PVsystems below 500 kw, mainly in the residential and commercialsegments. In 2013, the possibility was added for a group ofneighboring consumers (for instance in a condominium) to jointogether to obtain a permit to produce PV electricity. this specificnet-metering scheme resulted in a large part of all installationsuntil 2015. A virtual net-metering scheme exists for largeinstallations, with the possibility to generate electricity in onepoint of consumption at several distant sites. In this scheme, theutility charges a fee for the use of its transmission and distributioninfrastructure.
In december 2012, the national Fund for energy Savingsannounced the start of a new financing scheme for PV systemsfor dAc consumers: five year loans with low interest rates can beused to finance PV systems. rural electrification is supportedthrough the “Solar Villages programme”.
Finally, a 15% import duty has been imposed on PV modules.
In 2016 the PV annual installed capacity in the USA has almostdoubled, from 7,3 Gw installed in 2015 to 14,8 Gw. consequently, thePV cumulative capacity has reached the 40 Gw threshold at the endof the year 2016, pushing the USA at the fourth rank of all countries.the majority of the 2016 installations developed in the utility-scalesegment and are still concentrated in a restricted number of Statessuch as california, Arizona, nevada, north carolina, and new Jerseythat cover roughly two-thirds of the market.
the country has also defined a 20% reS target for 2025, andmore ambitious plans could be discussed since that threshold willmost probably reached before before the target.
even though, most of the solar power development has beenfocused on the deployment of utility scale projects. the localregulation permits final end users who have local renewablebased generation to inject their power surplus into the grid.basically, this mechanism is a net billing scheme where theenergy provided by end users is valued at the distributioncompany purchasing prize. to date, this means 5,5 Mw of solarPV roof top based generation.
Around around 200 Mw of PV systems were installed in Mexicoin 2016, increasing the total capacity in the country to 389 Mw.while most of them were rooftop PV systems installed under thenet-metering scheme until 2015, utility-scale starts to growslowly. to date, the utility-scale segment has not yet developed asexpected but the prospects are bright. the real starting point ofPV development in Mexico will most probably be 2017 sinceseveral hundreds Mw that were expected to come during 2016were delayed.
the new law for the electricity Industry (leI) and the law forenergy transition (let) approved last december 2015 has beenset the legal framework for the massive deployment in Mexico ofPV, along with other renewables. these legal frameworks alsoincluded the mechanism for the long terms auctions of cleanelectricity, clean power and clean energy certificates (cec).
So, based on the legal framework, the energy Ministry (Secretariade energía, Sener) has carried out two electric auctions inMexico, one at the end of 2015 that ended in July 2016, and theother that began in June 2016 and ended in September 2016.
the results obtained from the first electric auction were positivefor PV, with 12 offers accepted, amounting to 3,1 Gw, with startdates for operations set during and until 2018. the average costof these auctions reached 51,32 USd/Mwh. the September 2016auction saw prices going down to an average 33 USd/Mwh butonly 184 Mw of PV were allocated.
In parallel, the energy regulatory commission (cre) has granteda total of 319 interconnection contract for PV in the period of2011-2016, giving a total of 9,4 Gw. At the end of 2016, 115,6 Mwwere in operation, 9,3 Gw are in the process of being installed orare about to start works, which should generate significantamounts of PV installations in the years to come.
IEA-PVPS
MEXICO
FINAL ELECTRICITY CONSUMPTION 2016
HABITANTS 2016
IRRADIATION
2016 PV ANNUAL INSTALLED CAPACITY
2016 PV CUMULATIVE INSTALLED CAPACITY
PV PENETRATION
262
128
1 780
143
389
0,3
twh
MIllIon
kwh/kw
Mw
Mw
%
USA
FINAL ELECTRICITY CONSUMPTION 2016
HABITANTS 2016
IRRADIATION
2016 PV ANNUAL INSTALLED CAPACITY
2016 PV CUMULATIVE INSTALLED CAPACITY
PV PENETRATION
4 098
324
1 437
14 762
40 436
1,3
twh
MIllIon
kwh/kw
Mw
Mw
%
As in recent years, net-metering remains the most widespreadsupport measure for distributed PV and it is present in 38 statesplus district of columbia and Puerto rico. recently there havebeen some disputes between utilities and solar advocates overthe net-metering and, as a result, several jurisdictions are nowapproaching the maximum allowed capacity allowed.
even though during 2016 some incentives has been eliminatedsuch as the solar tax credit which has been cancelled in 4 Statesand capital subsidies for ground mounted installations expired for3 States, many project under construction were able to qualify inorder to receive fundings.
In 2015, the US environmental Protection Agency issued final rulesfor carbon emissions reductions of 30% (from 2005 levels) by astate-by-state approach to be implemented between 2020 – 2030.Additionally, ePA expanded their draft rules to include a cleanenergy Incentive Programme to encourage states to meet carbonreduction goals through wind, solar and energy efficiency, providingsubstantial incentives to accelerate the deployment of solar andwind technologies in short term. this enforcement was halted byePA in 2016, under the imposition of the U.S. Supreme court, after27 states petitioned the U.S. court of Appeals for the district ofcolumbia circuit for an emergency stay of the clean Power Plant.
As it concerned self consumption, recently the State of californiahas started to promote policies in order to encourage energystorage through the Self-Generation Incentive Program thatissues incentives between 0,32 and 0,45 USd/wh according tothe size of the implants. Moreover others incentives for selfconsumption are present in Hawaii State where it has beenregistered an increase in the smart water heaters, battery storagesystems, and other load controls are started to be coupled withPV installations.
the USA’s PV market has been mainly driven by the Investmenttax credit (Itc) and an accelerated 5-year tax depreciation. theItc was set initially to expire in 2016, however it was finallyextended to 2020. beginning in 2020, the credits will step downgradually until they reach 10% in 2022 for commercial entities andexpire for individuals. An expected market boom caused by theItc cliff didn’t happen but a part of the expected installations willtake place in the coming years in any case.
As of october 2016, 22 states and washington dc had rPSpolicies with specific solar or customer-sited provisions. In 2016,42 states had laws crediting customers for exported electricity,typically through a “net-metering” arrangement. In the realitythese “net-metering” schemes are diverse and cover differentrealities between pure self-consumption and real net-metering.
net metering is the most popular process for selling distributedsolar energy to the grid and 41 states plus the district of columbiaand Puerto rico have net metering policies. 18 states modifiedtheir net metering policies in 2016. while most of these wereminor rule or process changes, 3 states increased their neMcaps, 3 states transitioned to a new compensation program, andtwo states implemented new self-consumption policies.
3 states currently have Fits that are accepting new applicants.Some utilities offer feed in tariffs. 15 states are offering capitalsubsidy, 29 states have set up an rPS (renewable PortfolioStandard) system out of which 21 have specific PV requirements.
In most cases, the financing of these measures is done throughindirect public funding and/or absorbed by utilities.
third party financing developed fast in the USA, with for instance60% of residential systems installed under the california SolarInitiative being financed in such a way. third parties are alsowidely used to monetize the Investment tax credit in cases ofinsufficient tax appetite. these innovative financing companiescover the high up-front investment through solar leases, forexample. third party financing is led by a limited number ofresidential third-party development companies, two of themhaving captured 50% of the market.
Interestingly, due to the continued reduction in system pricing aswell as the availability of new loan products and third-partyarrangement with lower financing costs, a significant portion of PVsystems have recently been installed without any state incentives.
In 2016, loan have emerged as an effective financial mechanismfor residential systems and are even beginning to rival third-partyownership in some markets.
with regard to utility-scale PV projects, these are developingunder Power Purchase Agreements (PPAs) with utilities. thesupport of the Itc allows to produce PV electricity at acompetitive price, which allows utilities to grant PPAs.
PAce programmes have been enabled in more than 30 states aswell; PAce (Property Assessed clean energy) is a means offinancing renewable energy systems and energy efficiencymeasures. It also allows avoiding significant upfront investments andeases the inclusion of the PV system cost in case of property sale.
with such a diverse regulatory landscape, and different electricityprices, PV has developed differently across the country. 28 statescurrently have 50 Mw or more PV capacity and 17 states eachinstalled more than 50 Mw in 2016 alone. with more than 18 Gwof contracted utility scale PV projects in the pipeline as of october,total installations in 2016 are expected to increase yet again.
In december 2012, in an effort to settle claims by USmanufacturers that chinese manufacturers “dumped” product intothe US market and received unfair subsidies from the chinesegovernment, the US department of commerce issued orders tobegin enforcing duties to be levied on products with chinese madePV cells. the majority of the tariffs range between 23-34% of theprice of the product. In december 2013, new antidumping andcountervailing petitions were filed with the US department ofcommerce (doc) and the United States International tradecommission (Itc) against chinese and taiwanese manufacturersof PV cells and modules. In Q1 2014, the Itc made a preliminarydetermination, that “there is a reasonable indication that anindustry in the United States is materially injured by reason ofimports from china and taiwan of certain crystalline siliconphotovoltaic products.”1 In december of 2014, the doc issued its
two // chAPter 2 PV MArket deVeloPMent trendS
ieA PVPS trendS 2017 In PHotoVoltAIc APPlIcAtIonS
18
tHe AMerIcAS / contInUed
19
ieA PVPS trendS 2017 In PHotoVoltAIc APPlIcAtIonS
two // chAPter 2 PV MArket deVeloPMent trendS
IEA-PVPS
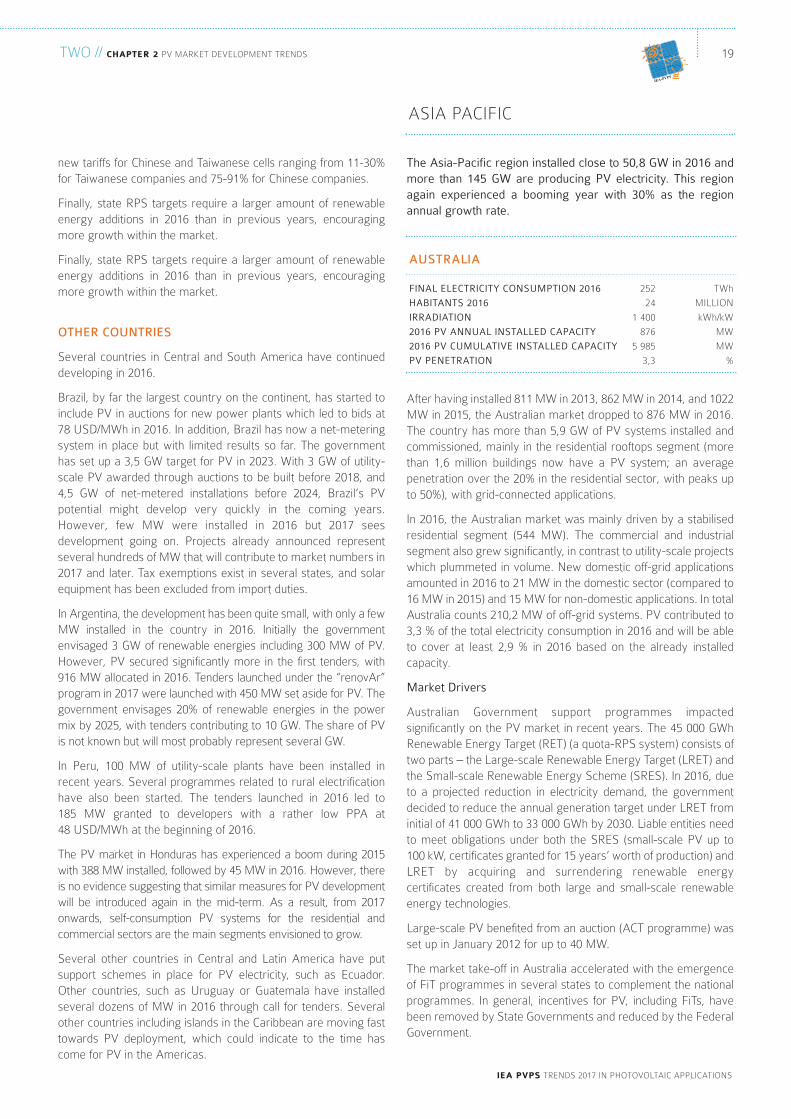
The Asia-Pacific region installed close to 50,8 GW in 2016 andmore than 145 GW are producing PV electricity. This regionagain experienced a booming year with 30% as the regionannual growth rate.
After having installed 811 Mw in 2013, 862 Mw in 2014, and 1022Mw in 2015, the Australian market dropped to 876 Mw in 2016.the country has more than 5,9 Gw of PV systems installed andcommissioned, mainly in the residential rooftops segment (morethan 1,6 million buildings now have a PV system; an averagepenetration over the 20% in the residential sector, with peaks upto 50%), with grid-connected applications.
In 2016, the Australian market was mainly driven by a stabilisedresidential segment (544 Mw). the commercial and industrialsegment also grew significantly, in contrast to utility-scale projectswhich plummeted in volume. new domestic off-grid applicationsamounted in 2016 to 21 Mw in the domestic sector (compared to16 Mw in 2015) and 15 Mw for non-domestic applications. In totalAustralia counts 210,2 Mw of off-grid systems. PV contributed to3,3 % of the total electricity consumption in 2016 and will be ableto cover at least 2,9 % in 2016 based on the already installedcapacity.
Market Drivers
Australian Government support programmes impactedsignificantly on the PV market in recent years. the 45 000 Gwhrenewable energy target (ret) (a quota-rPS system) consists oftwo parts – the large-scale renewable energy target (lret) andthe Small-scale renewable energy Scheme (SreS). In 2016, dueto a projected reduction in electricity demand, the governmentdecided to reduce the annual generation target under lret frominitial of 41 000 Gwh to 33 000 Gwh by 2030. liable entities needto meet obligations under both the SreS (small-scale PV up to100 kw, certificates granted for 15 years’ worth of production) andlret by acquiring and surrendering renewable energycertificates created from both large and small-scale renewableenergy technologies.
large-scale PV benefited from an auction (Act programme) wasset up in January 2012 for up to 40 Mw.
the market take-off in Australia accelerated with the emergenceof Fit programmes in several states to complement the nationalprogrammes. In general, incentives for PV, including Fits, havebeen removed by State Governments and reduced by the FederalGovernment.
new tariffs for chinese and taiwanese cells ranging from 11-30%for taiwanese companies and 75-91% for chinese companies.
Finally, state rPS targets require a larger amount of renewableenergy additions in 2016 than in previous years, encouragingmore growth within the market.
Finally, state rPS targets require a larger amount of renewableenergy additions in 2016 than in previous years, encouragingmore growth within the market.
OTHER COUNTRIES
Several countries in central and South America have continueddeveloping in 2016.
brazil, by far the largest country on the continent, has started toinclude PV in auctions for new power plants which led to bids at78 USd/Mwh in 2016. In addition, brazil has now a net-meteringsystem in place but with limited results so far. the governmenthas set up a 3,5 Gw target for PV in 2023. with 3 Gw of utility-scale PV awarded through auctions to be built before 2018, and4,5 Gw of net-metered installations before 2024, brazil’s PVpotential might develop very quickly in the coming years.However, few Mw were installed in 2016 but 2017 seesdevelopment going on. Projects already announced representseveral hundreds of Mw that will contribute to market numbers in2017 and later. tax exemptions exist in several states, and solarequipment has been excluded from import duties.
In Argentina, the development has been quite small, with only a fewMw installed in the country in 2016. Initially the governmentenvisaged 3 Gw of renewable energies including 300 Mw of PV.However, PV secured significantly more in the first tenders, with916 Mw allocated in 2016. tenders launched under the “renovAr”program in 2017 were launched with 450 Mw set aside for PV. thegovernment envisages 20% of renewable energies in the powermix by 2025, with tenders contributing to 10 Gw. the share of PVis not known but will most probably represent several Gw.
In Peru, 100 Mw of utility-scale plants have been installed inrecent years. Several programmes related to rural electrificationhave also been started. the tenders launched in 2016 led to 185 Mw granted to developers with a rather low PPA at 48 USd/Mwh at the beginning of 2016.
the PV market in Honduras has experienced a boom during 2015with 388 Mw installed, followed by 45 Mw in 2016. However, thereis no evidence suggesting that similar measures for PV developmentwill be introduced again in the mid-term. As a result, from 2017onwards, self-consumption PV systems for the residential andcommercial sectors are the main segments envisioned to grow.
Several other countries in central and latin America have putsupport schemes in place for PV electricity, such as ecuador.other countries, such as Uruguay or Guatemala have installedseveral dozens of Mw in 2016 through call for tenders. Severalother countries including islands in the caribbean are moving fasttowards PV deployment, which could indicate to the time hascome for PV in the Americas.
ASIA PAcIFIc
AUSTRALIA
FINAL ELECTRICITY CONSUMPTION 2016
HABITANTS 2016
IRRADIATION
2016 PV ANNUAL INSTALLED CAPACITY
2016 PV CUMULATIVE INSTALLED CAPACITY
PV PENETRATION
252
24
1 400
876
5 985
3,3
twh
MIllIon
kwh/kw
Mw
Mw
%
• In dec. 2016, the national energy Administration issued a “Solarpower development plan during the thirteenth five-year planperiod”, setting the targets of no less than 105 Gw for PVelectricity, down from the 150 Gw for PV installations previouslyset. Instead of the 170 twh previously defined as a target by theyear 2020, the levels were reduced to 105 twh, with only 20 twh for distributed PV, in line with the difficulties experiencedin that segment. However, given the market development speed,a “guiding opinion” was issued in July 2017: PV installed capacityin china could then reach about 240 Gw by 2020.
• A stable Fit scheme for utility-scale PV and rooftop PV drivesthe market development. It is entirely financed by a renewableenergy surcharge paid by electricity consumers. Hence, indecember 2016, the national development and reformcommission lowered the PV feed-in benchmark price, butletting it operational with late 2016 values until June 2017.depending on the region, the price dropped in a range of 0,13 to 0,15 rMb/kwh to the Fit range between 0,65 and 0,85 rMb/kwh (down from 0,8 to 0,98 during the year 2016).
• to push prices down, china started to select bidders for “leadingrunner” PV projects in 2016. the bidding price was below theFit price, with winning bids from 0,45 to 0,61 rMb/kwh. Inparallel, neA started to guide reS development with cleartargets for each province. this rPS defines reS targetsexcluding hydropower by 2020.
• to ensure a faster development of distributed PV, the nationaldevelopment and reform commission issued the “notice onPerfection of onshore wind Power and PV Power Feed-inbenchmark Price Policy”. this intends to allow distributed PVsystem owners to choose between a self-consumption modeland a pure feed-in model, with limited possibilities to switch theremuneration model during the plant lifetime. Under self-consumption, the electricity injected into the grid is paid at thewholesale price (based on coal-fired power plants cost) plus0,42 rMb/kwh. the self-consumed electricity also gets thesame premium on the top of the retail electricity price.
• while the market is mostly concentrated in the traditional gridconnected systems, other types of distributed PV have beendeveloped such as hydro-PV hybrid plants, PV for agriculturalgreenhouses and ad-hoc PV installations for fisheries.
• the PV Poverty alleviation program allows to develop PV onroofs in 7 provinces and cities with no scale limitation in orderto fight poverty. the installations reached 3,5 Gw in 2016.
• In June 2015, the neA, MIIt and cncA jointly issued the“opinions on Promoting Application of PV Products withAdvanced technologies and Industrial Upgrading”, proposingthe implementation of the “leading runner” (also known as “toprunner), which included construction of PV power pilot baseswith advanced technology and new technology pilot projects,requiring that all these projects apply products with advancedtechnologies. Under this program, 5,5 Gw of high efficiencytechnologies have been deployed in 2016, supporting the PVindustry in china to raise the technology bar in production.
Self-Consumption
Self-consumption of electricity is allowed in all jurisdictions inAustralia. currently no additional taxes or grid-support costs mustbe paid by owners of residential PV systems (apart from costsdirectly associated with connection and metering of the PVsystem), although there is significant lobbying from utilities foradditional charges to be levied on PV system owners.
In 2016, several local governments offered storage incentives andthe demand response market is starting to expand from largeindustrial facilities to residential (homes with air-conditioners thatcan be operated at reduced power during times of peak demand).
the interest in on-site storage technologies has continued toincrease with at least 6 750 installations of grid-connectedbatteries combined with PV systems totalling 42 Mwh in 2016.
with 34,55 Gw installed in 2016, the chinese PV market has onceagain experienced a significant growth rate, from 15 Gw in 2015.china has significantly beaten its initial official target of 18 Gw setby the national Action Planning document in the beginning of2016. with these installations, chinese PV capacity confirmed itsfirst rank with more than 78 Gw at the end of 2016. Much more isdue to come, showing that china takes it very seriously with reSdevelopment and intends to lead the deployment of GHG-freepower sources.
the utility-scale segment continued to dominate the chinese PVmarket with 30,3 Gw installed in 2016. From 2013 until 2016, thissegment contributed for a large part of all installations. Followingthe political willingness to develop the rooftop PV segment, it hasreceived some interest and starts to develop, in both bAPV (PVon rooftops) and bIPV (PV integrated in the building envelope)segments. In 2013, 311 Mw were installed, a number thatincreased to 2,1 Gw in 2014, went down to 1,4 Gw in 2015 andincreased again in 2016 with 4,2 Gw, showing the challenge ofdeveloping the distributed market. on the other side, the growthof centralized PV applications in the last 4 years has proven theability of the Fit regime to develop PV markets rapidly.
Several schemes are incentivizing the development of PV inchina. they aim at developing utility-scale PV through adequateschemes, rooftop PV in city areas and micro-grids and off-gridapplications in the last un-electrified areas of the country. thefollowing regulations were in place in 2016:
two // chAPter 2 PV MArket deVeloPMent trendS
ieA PVPS trendS 2017 In PHotoVoltAIc APPlIcAtIonS
20
CHINA
FINAL ELECTRICITY CONSUMPTION 2016
HABITANTS 2016
IRRADIATION
2016 PV ANNUAL INSTALLED CAPACITY
2016 PV CUMULATIVE INSTALLED CAPACITY
PV PENETRATION
5 920
1 379
1 300
34 550
78 080
1,1
twh
MIllIon
kwh/kw
Mw
Mw
%
ASIA PAcIFIc / contInUed
21
ieA PVPS trendS 2017 In PHotoVoltAIc APPlIcAtIonS
two // chAPter 2 PV MArket deVeloPMent trendS
In July 2016, the Fit was adjusted downwards with a certainimpact on the PV market so far. However, the rapid price declinefor PV modules indicates that the margins of installers anddevelopers are also declining. capital subsidies are also availablefor system not applying to the Fit, for commercial, industrial andutility-scale applications. A system of green certificates also existsfor utility-scale plants but since it provides a lower remunerationthan the Fit, it is not widely used for PV systems.
Self-Consumption
For prosumers’ PV systems below 10 kw, the Fit programme isused to remunerate excess PV electricity. the self-consumed part ofPV electricity is not incentivized. Self-consumed electricity is notsubject to taxation and transmission & distribution charge. Self-consumption can benefit from subsidies in the commercial segment.
BIPV
bIPV has been included in demonstration programs that arecurrently running. the market for bIPV remains relatively smallcompared to the usual bAPV market and around 40 Mw wereinstalled in 2016. However, Japan is preparing the offtake of bIPV.nedo started a study project named “study on bIPV” in order tocollect information and identify issues for the commercialization ofbIPV systems and in addition, MetI runs a project on“International standardization of bIPV modules”.
Storage
new demonstration projects to install storage batteries werestarted in various locations in 2016. they aim at managing therapidly increasing penetration of PV. the “demonstration Projectfor Improving the balance of Power Supply and demand with alarge-capacity Storage battery System” installs large-capacitystorage batteries at grid substations in order to reduce reverseflows and better manage the impact of concentrated PVinstallations. decentralized storage in residential PV applicationsis incentivized in order to increase the reliability of the powerprovision in case of emergency. demonstration projects are alsoconducted for hydrogen storage.
Conclusion
the once second market for PV reached a high level in 2015 butwith 7,89 Gw it but experienced a significant decline in 2016.Hopefully the market will see a soft landing in the coming years.the appetite for electricity after the Great earthquake in 2011 andthe need for diversifying the electricity mix is expected to continuefueling PV development. Given the geographical configuration ofthe archipelago, it is highly probable that decentralized PVapplications will constitute the majority of PV installations in someyears. with numerous global PV players in all segments of thevalue chain, Japan will be one of the key players in tomorrow’senergy world. PV contributed to 4,5 % of the total electricityconsumption in 2016 and will be able to cover at least 4,82 % in2017 based on the already installed capacity.
Conclusions
china was the first PV market in the world for the fourth year in arow in 2016. Adequate policies are being put in placeprogressively and will allow the market to continue at a high level,driven by the climate change mitigation targets. due to the factthat incentives for utility-scale PV plants were lowered with aninstallation deadline end of June 2017, the first half year of 2017witnessed again a rapid increase in the construction of utility-scalePV plants. According to statistics of the neA, in the half yearalone, the newly added PV capacity already reached 24 Gw, up20% compared to 2016. PV contributed to 1,1 % of the totalelectricity consumption in 2016.
In 2016 Japan registered 7,89 Gw of new PV capacity, around27% less than the installations that occured in 2015. the countryhas reached a total installed PV capacity of 42 Gw, making it thesecond country in the world after china. currently the majority ofthe capacities installed are grid-connected installations, while off-grid remains marginal. After having reached close to 11 Gw, themarket declined in 2016 due to policy changes and the need tobetter streamline PV development in the country.
with the start of the Fit programme in July 2012, the market forpublic, industrial application and utility-scale PV systems grew fastand brought rapidly Japan to the top of the global PV market.while Japan was one of the first market in the world in the firstdecade of this century, most installations took place after theimplementation of the Fit program.
while the PV market in Japan developed in the traditionalresidential rooftop market, 2016 has seen again a majordeployment of utility-scale plants: such systems represented to3,2 Gw in 2016. the residential market reached 766 Mw in 2016,followed by the commercial segment with more than 2,4 Gw andthe industrial segment with close to 1,4 Gw. bIPV represented 40 Mw and off-grid applications 34 Mw.
Feed-in Tariff
the Fit scheme remains the main driver for PV development inJapan. on 1st July 2012, the existing scheme that allowedpurchasing excess PV production was replaced by this new Fitscheme, paid during 20 years for systems above 10 kw and 10years for the excess electricity of PV systems below 10 kw. Itscost is shared among electricity consumers with some exceptionsfor electricity-intensive industries. this scheme, consideredsometimes as quite generous, has triggered the importantdevelopment of the Japanese PV seen in last three years.
IEA-PVPS
JAPAN
FINAL ELECTRICITY CONSUMPTION 2016
HABITANTS 2016
IRRADIATION
2016 PV ANNUAL INSTALLED CAPACITY
2016 PV CUMULATIVE INSTALLED CAPACITY
PV PENETRATION
912
127
1 050
7 890
42 041
4,5
twh
MIllIon
kwh/kw
Mw
Mw
%
Home Subsidy Programme
this programme was launched in 2004, and merged with theexisting 100 000 rooftop PV system installation programme. Itaims at the construction of one million green homes utilizing PV aswell as solar thermal, geothermal, small-size wind, fuel cells andbio-energy until 2020. In general, single-family houses and multi-family houses including apartments can benefit from thisprogramme. the Government provides 60% of the initial PVsystem cost for single-family and private multi-family houses, and100% for public multi-family rental houses. the maximum PVcapacity allowed for a household is 3 kw. only some dozens ofMw were installed under this programme in 2016.
Building Subsidy Programme
the Government supports up to 50% of installation cost for PVsystems (below 50 kw) in buildings excluding homes. In addition,the Government supports 80% of initial cost for special purposedemonstration and pre-planned systems in order to help thedeveloped technologies and systems to diffuse into the market.Various grid-connected PV systems were installed in schools,public facilities, welfare facilities, as well as universities.
Regional Deployment Subsidy Programme
the government supports 50% of the installation cost for nre(including PV) systems owned or operated by local authorities. In2016, 14 Mw was installed under this programme.
Public Building Obligation Programme
the new buildings of public institutions, the floor area of which exceeds1 000 square meters, are obliged by law to use more than 15% (in2016) of their total expected energy from newly installed renewableenergy resource systems. Public institutions include stateadministrative bodies, local autonomous entities, and state-runcompanies. the building energy mandate percentage will increase upto 30% by 2020. In 2016, 33 Mw was installed under this programme.
PV Rental Programme
Household owners who are using more than 350 kwh electricitycan apply for this program. owners pay a PV system rental fee(maximum monthly 70 000 krw which is on the average lessthan 80% of the electricity bill) for a minimum of 7 years and canuse the PV system with no initial investment and no maintenancecost for the rental period. PV rental companies recover theinvestment by earning PV rental fees and selling the reP(renewable energy Point) having no multiplier. In 2016, 8,6 Mw(8 796 households) were installed under this programme.
Convergence and Integration Subsidy Programme for NRE
this programme is designed to help diffuse the nre into sociallydisadvantaged and vulnerable regions and classes such as islands,remote areas (not connected to the grid), long-term rental housingdistrict, etc. local adaptability is one of the most important criteria,thus the convergence between various nre resources (PV, wind,electricity and heat) and the complex between areas (home, businessand public) are primarily considered to benefit from this programme.In 2016. 5 Mw was installed under this programme.
Since “the renewable Portfolio Standards” (rPS) replaced thekorean Fit at the end of 2011, the korean PV market followed anupward trend. In 2015, under this programme, the korean PVmarket passed the Gw mark with 1 011 Mw compared to 926 Mw in 2014. In 2016, 904 Mw were installed, showing arelative stability for three years in the market, while the solar PVindustry continued to grow.
At the end of 2016, the total installed capacity reached 4,4 Gw,among which utility-scale PV plants accounted for around 88% ofthe total cumulative installed capacity. distributed PV systemsamounted to around 12% of the total cumulative capacity. theshare of off-grid PV systems has continued to decrease andrepresents less than 1% of the total cumulative installed PVcapacity. centralized PV applications represented 804 Mw in2016 compared to only 100 Mw of distributed applications. PVcontributed to 0,74 % of the total electricity consumption in 2016and will be able to cover at least 1,19 % in 2017.
Various incentives have been used to support PV development. In2014, the “Fourth basic Plan for the Promotion of technologicaldevelopment, Use, and diffusion of new and renewable energy”based on the “Second national energy basic Plan” was issued.this plan includes many new subsidy measures including thedevelopment of “eco-friendly energy towns,” “energy-independent Islands,” and “PV rental Programs.”
the rPS scheme launched in 2012 will be active until 2024 and isexpected to be the major driving force for PV installations inkorea, with improved details such as boosting the small scaleinstallations (less than 100 kw size) by adjusting the rec andmultipliers, and unifying the PV and non-PV markets.
RPS Programme
the rPS is a mandated requirement that the electricity utilitybusiness sources a portion of their electricity supplies fromrenewable energy. In korea, electricity utility business companies(total 18 power producing companies) exceeding 500 Mw arerequired to supply a total of 10% of their electricity from nre(new and renewable energy) sources by 2024, starting from 2%in 2012. the PV set-aside requirement plan was shortened by oneyear in order to support the local PV industry. In 2016 alone, 800 Mw were installed under this programme. with regard to thecumulative installed capacity, about 68% of the total PVinstallations in korea were made under rPS scheme, to becompared with about 500 Mw (about 14%) that were installedunder the previous Fit programme which ended in 2011.
two // chAPter 2 PV MArket deVeloPMent trendS
ieA PVPS trendS 2017 In PHotoVoltAIc APPlIcAtIonS
22
ASIA PAcIFIc / contInUed
KOREA
FINAL ELECTRICITY CONSUMPTION 2016
HABITANTS 2016
IRRADIATION
2016 PV ANNUAL INSTALLED CAPACITY
2016 PV CUMULATIVE INSTALLED CAPACITY
PV PENETRATION
484
51
1 314
904
4 397
0,7
twh
MIllIon
kwh/kw
Mw
Mw
%
23
ieA PVPS trendS 2017 In PHotoVoltAIc APPlIcAtIonS
two // chAPter 2 PV MArket deVeloPMent trendS
the PV market increased significantly in thailand with 1,03 Gwthat have been installed in 2016 compared to 121 Mw in 2015 and475 Mw in 2014. the large majority of installations developed in2016 were in the utility-scale segment, while less than 1 Mw ofnew off-grid systems were officially deployed. In thailand, at theend of 2016, the cumulative grid-connected PV capacity reached2,41 Gw and 33,80 Mw of off-grid PV applications.
According to the latest Alternative energy development Plan2016-2036, thailand aims to reach 6 Gw of total installed PVcapacity in the next 20 years, an objective that looks achievableeasily given the past development trends.
the Feed-in tariff scheme continued to drive installations duringthe year 2016. Until April, the newly installed capacity resulted ofthe extension of the feed-in tariff (for ground-mounted PV powerplants) from december 2015 to April 2016. At the end of the year,the driver shifted towards the program for governmental agenciesand agricultural cooperatives for ground-mounted systems. InSeptember, the national energy Policy committee (nePc)revised the Fit rate down from 5.66 tHb/kwh to 4.12 tHb/kwhfor the PV plant below 10 Mw (or VSPP plants, for Very SmallPower Plants) (≤10 Mw).
In addition, PV for rural electrification can be incentivized up to100% and cover schools, community centers, national parks,military installations and hospitals. However, the installedcapacities remain at a very low level, with some kw in each case.
to support distributed PV for rooftops, the PV Pilot project for self-consumption or “Quick win” program has been implemented. Itstarget has been set at 100 Mw for households and buildings orfactories with electricity consumption during day time. Applicantsare allowed to feed in electricity into to the grid without anycompensation from government, in order to promote local self-consumption.
the PV rooftop pilot program was released in August with theobjective to identify barriers, grid challenges, and the impact on allelectricity system stakeholders. It received 358 applicationstotaling 32,72 Mw that were awarded a contract under thisprogram. these systems should be installed and connected to thegrid by 2017. the result will be used to improve policies andmeasures in future PV rooftop policies.
PV investors are offered the exemption in corporate tax andimport duty for machinery if the capital investment is above acertain level. In addition, a program has been implemented tosupport the deployment of PV as an energy efficiency solution. Itaims at supporting factories and buildings to reduce theirelectricity consumption.
with these schemes, thailand aims at continuing to support theexpansion of the deployment of grid-connected PV in the rooftopsegments, after a rapid start in the utility-scale segment,continuing to lead PV development in Southeast Asia.
the Malaysian market remains small compared to some keymarkets in Asia but implements policies that should pave the wayto renewable energy development. due to policy changes, the PVmarket increased from 26,8 Mw in 2015 to 71,8 Mw in 2016. thetotal installed capacity in Malaysia topped 335,77 Mw at the endof 2016. As of the end of december 2016, the Sustainable energydevelopment Authority Malaysia approved a total of 3 794 newapplications (equivalent to 101,6 Mw). of the newly installedcapacity in 2016, the bAPV applications were 30,9 Mw, bIPV33,12 Mw, ground mounted 7,5 Mw and floating solar 0,27 Mw.
the national renewable energy Policy and Action Plan (nrePAP)provides long-term goals and commitment to deploy renewableenergy resources in Malaysia. the objectives of nrePAP includenot only the growth of reS in the electricity mix but alsoreasonable costs and industry development.
the Sustainable energy development Authority Malaysia or SedAMalaysia was established on 1st September 2011 with the importantresponsibility to implement and administer the Fit mechanism.
the Fit Programme is financed by a renewable energy Fund (reFund) funded by electricity consumers via a 1,6% collection imposedon the consumers’ monthly electricity bills. domestic consumerswith a consumption no more than 300 kwh per month are exemptedfrom contributing to the fund. due to the limited amount of the reFund, the Fit is designed with a cap for each technology. on 29december 2016, new degression rates were announced. thedegression rates for installed PV capacities of up to 1 Mw remainedunchanged whereas for PV systems with capacities greater than 1Mw and up to 30 Mw, the rate was revised from 20% to 15%. thedecrease rate for bonus Fit rate for use as in building or buildingstructures were reduced from 20% to 10%.
In october 2015, the Prime Minister of Malaysia announced a net-metering scheme with a 100 Mw quota per year for PV installationstarting 1st november 2016, that could accelerate the developmentof the PV market in Malaysia. the total PV quota allocated underthe net metering is 500 Mw over a period of five years.
IEA-PVPS
MALAYSIA
FINAL ELECTRICITY CONSUMPTION 2016
HABITANTS 2016
IRRADIATION
2016 PV ANNUAL INSTALLED CAPACITY
2016 PV CUMULATIVE INSTALLED CAPACITY
PV PENETRATION
141
31
1 200
72
336
0,3
twh
MIllIon
kwh/kw
Mw
Mw
%
THAILAND
FINAL ELECTRICITY CONSUMPTION 2016
HABITANTS 2016
IRRADIATION
2016 PV ANNUAL INSTALLED CAPACITY
2016 PV CUMULATIVE INSTALLED CAPACITY
PV PENETRATION
181
69
1 355
1 027
2 446
1,8
twh
MIllIon
kwh/kw
Mw
Mw
%
two // chAPter 2 PV MArket deVeloPMent trendS
ieA PVPS trendS 2017 In PHotoVoltAIc APPlIcAtIonS
24
OTHER COUNTRIES
2016 has seen PV developing in more Asian countries in such away that Asia is now the very first region in terms of new PVinstallations. Several countries present interesting features thatare described below.
India, with more than one billion inhabitants has been experiencingsevere electricity shortages for years. the Indian market jumped to4,1 Gw in 2016 from 779 Mw in 2014 and 2 Gw in 2015, poweredby various incentives in different states. the PV market in India isdriven by a mix of national targets and support schemes at variouslegislative levels. the Jawaharlal nehru national Solar Mission aimsto install 20 Gw of grid-connected PV systems by 2022 and anadditional 2 Gw of off-grid systems, including 20 million solar lights.Some states have announced policies targeting large shares of solarphotovoltaic installations over the coming years. Finally, 2 Gw of off-grid PV systems should have been installed by 2017. However, in2014 a brand-new target of 100 Gw was unveiled: 60 Gw ofcentralized PV and 40 Gw of rooftop PV. the support of the centralgovernment in India for PV is now obvious and will lead in thecoming years to a significant increase of installations. Much moreinstallations are expected in the years to come and already in 2017to meet the official ambitions. India has also initiated the launch ofthe International Solar alliance, aiming at accelerating thedevelopment of solar in emerging countries. this ISA has beenannounced during the coP21 in Paris together with France.
In 2016 taiwan installed about 369 Mw mostly as grid-connectedrooftop installations after having installed 227 Mw in 2015 and223 Mw in 2014. the total installed capacity at end of 2016 isestimated to be around 1,2 Gw. the market is supported by a Fitscheme guaranteed for 20 years and managed by the bureau ofenergy, Ministry of economic Affairs. this scheme is part of therenewable energy development Act (redA) passed in 2009 thatdrove the development of PV in taiwan. the initial generous Fitwas combined with capital subsidy. It has later been reduced andnow applies with different tariffs to rooftops and ground-mountedsystems. larger systems and ground based systems have to beapproved in a competitive bidding process based on the lowestFit offered. Property owners can receive an additional capitalsubsidy. It is intended to favor small scale rooftops at the expenseof larger systems, in particular ground based installations. So far,agricultural facilities and commercial rooftops have led themarket. the country targets 2,1 Gw in 2020 and 6,2 Gw in 2030(3 Gw on rooftops, 3,2 Gw for utility-scale PV). In 2012, taiwanlaunched the “Million roof Solar Project” aimed at developing thePV market in the country,with the support of municipalities. theauthorization process has been simplified in 2012, in order tofacilitate the deployment of PV systems and will most probablyease the development of PV within the official targets as theprogress of the market has shown.
the Government of bangladesh has been emphasizing thedevelopment of solar home systems (SHS), since about half of thepopulation has no access to electricity. Under the bangladesh zero-interest loan from the world bank Group as well as support from arange of other donors, the government is promoting incentive
schemes to encourage entrepreneurs who wish to start PV actions;at present led by the Infrastructure development company ltd.(Idcol) working with about 40 nGos. thanks to the decrease inprices of the systems and a well-conceived micro-credit scheme(15% of the 300 USd cost is paid directly by the owner and the restis financed through a loan), off-grid PV deployment exploded inrecent years. the number of systems in operation is estimatedabove 4 million SHS in the beginning of 2016. More are expectedafter some financing from the world bank, up to 6 million by the endof 2017. the average size of the system is around 50-60 w; forlighting, tV connections and mobile phone charging. local industriesare involved in the process and could replicate this in othercountries. Idcol also targets of 1 500 irrigation PV pumps by 2018.the government started to introduce more PV power by setting upa Solar energy Program and is planning to introduce more than 1 Gw of solar energy in the coming years. Several announcementshave been made, which remains to become concrete.
the Philippines have installed 759 Mw in 2016, raising the totalinstalled capacity to 900 Mw and much more is foreseen in thecoming years. As of 31 december 2016, there were 124 grid-connected projects in the pipeline that had been awardedunder the country’s renewable energy (re) law, totalling 4 016 Mw. Meanwhile, there were 13 self-consumption projectstotalling 2,4 Mw also awarded. total self-consumption capacitystood at 1,9 Mw at the end of 2016.
other Asian countries are seeing some progress in thedevelopment of PV. Pakistan installed several hundreds of Mwwhich followed the approval of 793 Mw of solar plants. A Fit hasbeen introduced for utility-scale PV in 2014. It is estimated that atleast 500 Mw have been installed so far. brunei has announced thata Fit policy should be put in place over the next 18-24 months.
In 2014, Indonesia put in place a solar policy which started alreadyin 2013. Under this regulation, solar photovoltaic power is boughtbased on the capacity quota offered through online public auctionby the directorate General of new renewable energy and energyconservation. the plant that wins the auction will sign a powerpurchase agreement with the national electric company at theprice determined by the regulation. However, so far only 20 Mwwere installed in 2014 and in 2016 the first utility-scale plants wereconnected to the grid. In early 2016 the government announced a5 Gw plan to develop PV in the country.
Myanmar has signed a memorandum for building several large-scale plants and 220 Mw were foreseen at the end of 2016. InSingapore, the total PV installed capacity was 30 Mw at the endof 2016 with a target of 350 Mw in 2020. Uzbekistan has theintention to install 2 Gw of PV plants and 300 Mw of utility-scaleplants were being developed at the end of 2016. In kazakhstan,the government aims at installing 700 Mw and has established aFit program in 2014. In nepal, the electricity Agency planned todevelop PV power plants totalling 325 Mw by 2017.
In Vietnam, 800 Mw have been allocated and should be builtbefore 2020 and a national solar plan is being developed withambitious targets until 2030.
ASIA PAcIFIc / contInUed
At least two utilities provide the possibility to invest in PV systemswithout installing them directly. Such virtual investment schemesallow the deployment of PV financed by private electricityconsumers without any physical link. Virtual storage options havebeen also proposed to PV consumers by some utilities, showingthat utilities are considering PV seriously in Austria.
belgium is a complex case with different PV incentives in the threeregions that compose the country, but an electricity market thatcovers the entire country. organized in a federation of regions(Flanders, wallonia and brussels region), the country set upregulations that are sometimes regional, sometimes national.
despite this organization, all three regions selected an rPSsystem, with quotas for reS that utilities have to provide, and setup three different trading systems for green certificates. Inaddition, the price of green certificates is guaranteed by thenational tSo that charges the cost to electricity consumers.
Flanders started to develop first and has installed about 2,57 Gwof PV systems. In wallonia, the market started with a two-yearsdelay and remains largely concentrated in the residential andsmall commercial segments with around 914 Mw at the end of2016. In Flanders, large rooftops and commercial applicationshave developed since 2009. 170 Mw were installed in the countryin 2016, a strong increase in comparison with the 107 Mwinstalled in 2015. belgium now runs 3,5 Gw of PV systems.
For small rooftop installations below 5 kw or 10 kw, a net-metering system exists across the country. Until 2010, furthergrants were paid in addition to other support schemes while thetax rebates were cancelled in november 2011.
In Flanders, a prosumer fee (95 eUr/kw) was introduced in July2015 for all small PV systems (below 10 kw). And despite this, themarket remains quite active. this fee enables dSos to charge forthe cost of grid use by PV owners, without changing the systemof net metering. It gives a simple payback time around 15 yearsfor a new PV installation. this success is mainly due to the positivecommunication action made in Flanders to promote PV with asimple message: “you earn more by investing your savings intoPV than by leaving it on your bank account.”
In wallonia, the “Qualiwatt” support plan for small systems (≤10 kw) introduced in 2014 has had a relative success in 2016. Itimproved compared to 2015 but the maximum allowed quota forinstallations was not reached (~5 300 out of 12 000). the Qualiwattprogram is an up-front incentive paid over five years andcalculated to reach a payback time of 8 years (5 % Irr for a 3 kwp
Europe has led PV development for almost a decade andrepresented more than 70% of the global cumulative PVmarket until 2012. Since 2013, European PV installations wentdown while there has been rapid growth in the rest of theworld. Europe accounted for only 17% of the global PV marketwith 6,5 GW in 2016. European countries installed 104 GW ofcumulative PV capacity by the end of 2016, still the largestcapacity globally, for the last year. It is important to distinguishthe European Union and its countries, which benefit from acommon regulatory framework from part of the energymarket, and other European countries which have their ownenergy regulations and are not part of the European Union.
Austria’s support for PV relies on a mix of capped Fit and investmentgrants. due to a cap on the tariffs, the development of PV in Austriaremained constrained at a relatively low level with a market below100 Mw until 2012. After 363 Mw in 2013, the market appears toenter a stage of stable development, with around 150 Mw in the lastthree years. with 155 Mw-Ac installed in 2016 (around 171 Mw-dcgiven the high share of residential installations), the market isconcentrated in the distributed segment, with only 6,7 Mw-Ac(around 8 Mw-dc) of ground-mounted installations. bIPVinstallations represented around 2 Mw in 2016. off-grid developmentamounted to around 1 Mw. off-grid contribute in total for around 6Mw out of 1,1 Gw as Austria cumulative market end of 2016.
Systems below 5 kwp are incentivized through a financialincentive. Additional investment subsidy is available for bIPVinstallations. Above 5 kwp, the Green electricity Act provides aFit that was reduced in 2014. the Fit is guaranteed during 13years and financed by a contribution of electricity consumers.Some financial grants can be added for specific buildings. Inaddition to federal incentives, some provinces are providingadditional incentives through investment subsidies.
Self-consumption is allowed for all systems. A self-consumptionfee of 1,5 eUrcent/kwh has to be paid if the self-consumption ofPV electricity is higher than 25 000 kwh per year.
rural electrification in remote areas not connected to the grid isincentivized through an investment subsidy up to 35% of the cost.
Since 2016, more and more provinces provide an investmentsubsidy to support the installation of decentralized electricitystorage systems in combination with PV. For example, Viennaprovides a limited incentive of 500 eUr/kwh while burgenlandhas a non-refundable rebate of 275 eUr/kwh for storages up to 5 kwh. the highest incentive reached up to 600 eUr/kwh with alimit at 7.5 kwh.
25
ieA PVPS trendS 2017 In PHotoVoltAIc APPlIcAtIonS
two // chAPter 2 PV MArket deVeloPMent trendS
IEA-PVPS
eUroPe
AUSTRIA
FINAL ELECTRICITY CONSUMPTION 2016
HABITANTS 2016
IRRADIATION
2016 PV ANNUAL INSTALLED CAPACITY
2016 PV CUMULATIVE INSTALLED CAPACITY
PV PENETRATION
59
9
1 026
171
1 108
1,88
twh
MIllIon
kwh/kw
Mw
Mw
%
BELGIUM
FINAL ELECTRICITY CONSUMPTION 2016
HABITANTS 2016
IRRADIATION
2016 PV ANNUAL INSTALLED CAPACITY
2016 PV CUMULATIVE INSTALLED CAPACITY
PV PENETRATION
84
11
990
173
3 423
4
twh
MIllIon
kwh/kw
Mw
Mw
%
regulation allows compensation to take place during only onehour. this change reduced the number of installations from 2013onwards. then the Fit system was suspended in May 2015 dueto its success. All technology specific incentives are expected tobe completely phased-out in 2017. Self-consumption replaced itas the main driver for distributed PV applications, especially in theresidential and commercial segments, but again at a lower level.
At the end of 2015, denmark launched a one-off pilot tenderscheme of 20 Mw for utility-scale ground-mounted PV systemsup to 2,3 Mw. A particularity from that tendering system is that itis open to German bids, which implies that PV installations inGermany could compete in the tender and the other way around.the utility-scale development that has been seen in 2015 was theconsequence of an interpretation of the existing eU legislation:Five utility-scale PV farms ranging from 9 to 70 Mw wereregistered in december 2015. All were built in subunits of 400 kwdriven by the 2015 Fit regulations. this continued in 2016 at alower level.
there are presently no direct support measures for bIPV.However, the building codes promote the use of bIPV in newbuildings and at major refurbishments.
Finally, the debate about the legality of the scheme supporting PVin denmark has been questioned by european authorities, underthe excuse that they could oppose state aid regulation, which waspushing the danish government at that time to move the budgetto support PV to the state budget. this example shows how pro-PV regulations could become a complex regulatory issue intoday’s europe, with the need to choose between the energytransition and free-market regulations. In addition, with high retailelectricity prices due to taxes, self-consumption of PV electricity isseen as a threat to the tax income for the government and raisesa significant opposition despites its competitiveness.
EUROPEAN UNION
In addition to all measures existing in Member States, the europeanUnion has set up various legislative measures that aim at supportingthe development of renewable energy sources in europe.
the most well-known measure is the renewable energy directivethat imposes all countries to achieve a given share of renewableenergy in their mixes so as to reach an overall 20% share ofrenewable energy in the energy mix at the european level.directive 2009/28/ec set mandatory targets for the MemberStates, but let them decide about the way to achieve their binding2020 targets, PV targets were set up in various ways. In october2014, the european council adopted an eU targets until 2030 forrenewable energy development in the framework of its climatechange policies. It set a new target of at least 27% of renewableenergy sources in the energy mix, together with energy savingstargets and GHG emissions. However, different to the 2009directive no mandatory targets have been proposed for theindividual Member States and it is unlikely that the new directiveunder preparation will do so, even if the target could be revisedupwards, possible to 35% in 2018.
installation after 20 years). besides the financial aspects, this newplan also introduces strong quality criteria on the equipment(european norms, factory inspection), the installer (reScerttraining) and the installation (standard conformity declaration,standard contract) to increase the reliability and confidence.Anyway the climate for PV remains negative due the legacy of thefirst uncontrolled years of development and the lack of awarenessof most policymakers about the need for a rapid energy transition.
brussels will be the first region to replace the yearly net-meteringsystem for small systems (< 5 kw) by a self-consumption schemeby 2018, but the details of the scheme are not known yet.
larger systems benefit from a self-consumption scheme and froman additional green certificate support scheme. For large systems inwallonia, 2016 was a good year. Since 2015, a system of Gcreservation controls the development of the market. the maximumhas been reached with more than 60 Mw reserved in 2016.
In general, the belgian market is transitioning from an incentive-driven market to a self-consumption-driven market. thistransition will imply a revision of net-metering policies andpossibly new forms of incentives in the coming years. the majorrisk lies in the willingness of several policymakers and gridoperators to tax prosumers, a counterproductive policy that hasso far limited the confidence in PV.
71 Mw of PV systems were installed in denmark in 2016, with 20 Mw in the distributed segment and 51 Mw of utility-scaleplants. the development of PV in denmark has experienceddifficulties, following a rapid start: by the end of 2011, only 17 Mwwere installed in denmark. Grid-connected installationsrepresented the majority, and some off-grid installations werefound for instance in Greenland for stand-alone systems in thetelecommunication network and remote signaling. that net-metering system set by law for private households andinstitutions led to a rapid market expansion in 2012 that continuedpartially in 2013 before the market collapsed to 42 Mw in 2014.the PV market then increased significantly in 2015 with 181 Mwinstalled, thanks mainly to utility-scale applications whichrepresented 131 Mw, and a rather stable rooftop market. off-gridremains anecdotic with 0,4 Mw installed in 2016. In total 858 Mwof PV are producing electricity in the country at the end of 2016.
back in november 2012, the government reacted to the high levelof market development and modified the net-metering law. whilethe compensation between PV electricity production and localelectricity consumption occurred during the entire year, the new
two // chAPter 2 PV MArket deVeloPMent trendS
ieA PVPS trendS 2017 In PHotoVoltAIc APPlIcAtIonS
26
eUroPe / contInUed
DENMARK
FINAL ELECTRICITY CONSUMPTION 2016
HABITANTS 2016
IRRADIATION
2016 PV ANNUAL INSTALLED CAPACITY
2016 PV CUMULATIVE INSTALLED CAPACITY
PV PENETRATION
30,5
6
925
71
858
2,8
twh
MIllIon
kwh/kw
Mw
Mw
%
27
ieA PVPS trendS 2017 In PHotoVoltAIc APPlIcAtIonS
two // chAPter 2 PV MArket deVeloPMent trendS
Finally, in order to answer complaints from europeanmanufacturers, the european commission adopted final measuresin the solar trade case with china in december 2013 which were stillapplicable at the end of 2016. this decision confirms the impositionof anti-dumping and countervailing duties on imports into theeuropean Union of crystalline silicon photovoltaic modules and cellsoriginating from china. these duties, which are valid for a period oftwo years, were not applied retroactively.
Meanwhile, the acceptance of the undertaking offer submitted bychina to limit the volumes and to set a threshold for prices hasbeen accepted. the companies covered by this undertaking willbe exempted from the general imposition of duties but will have tocomply with minimum prices for modules and cells sold in europe,within a certain volume. Following the decline of PV modulescosts and prices, some companies decided to go out of theagreement and to enter the european PV market by paying theanti-dumping charges : the low prices on the market shouldcontinue to push additional companies to exit the agreement.
the energy Performance in buildings directive (ePbd) will enterinto force in 2020 and might become an important driver of PVdevelopment in the building sector by pushing PV as the mainpossibility to reduce the net energy consumption in buildings afterenergy efficiency. while the final effect will have to be scrutinizedafter 2020, it represents a major opportunity for the buildingsector and PV to work together.
the total capacity of grid-connected PV plants is estimated ataround 37 Mw. However, the market in 2016 witnessed visiblesigns that the segment of grid-connected rooftop PV systems isstarting to grow in commercial and residential scales with 17 Mwinstalled. there has been no utility-scale PV plants in Finland so far.the off-grid PV market in Finland started in the 1980’s and hasfocused mainly on summer cottages and mobile applications. thesesystems are generally quite small size, typically less than 200 w.
there are some financial support schemes available for PVinstallations. the Ministry of economic Affairs and employmentgrants investment support for the energy production. this energysupport is particularly intended for promoting the introduction andmarket launch of new energy technology. So far, the Ministry hasgranted a 25% investment subsidy of the total costs of grid-connected PV projects. during the year 2016, 6 MeUr wasgranted for 17 Mw of new PV capacity . the decision for theinvestment subsidy is made case-by-case based on application.
besides the renewable energy directive, the so-called energyPerformance of building directive defines a regulatory frameworkfor energy performance in buildings and paves the way for near-zero and positive energy buildings.
the grid development is not forgotten. dedicated fundingschemes (ten-e) have been created to facilitate investments inspecific interconnections, while several network codes (e.g. gridconnection codes) are currently being prepared. this will have aclear impact on PV systems generators when finally approvedand adopted.
In addition, the question of the future of electricity markets is centralin all electricity sector’s discussions. the growing share ofrenewable energy suggests to rethink the way the electricitymarket in europe is organized in order to accompany the energytransition in a sustainable way for new and incumbent players.Meanwhile, it has been made rather clear that the huge losses ofseveral utilities in the last years can rather be attributed to cheaplignite pushing gas out of the market and other similar elementsrather than the impact of a few percent of PV electricity. while therole of PV was sometimes questioned due to the observed pricedecrease during the midday peak that is attributed to PV powerproduction, it is absolutely not obvious whether this decreaseduring a limited number of hours every year really has an impact onthe profitability of traditional utilities. In parallel to this, it is importantto mention the failure of the emission trading Scheme (etS), thataimed at putting a carbon price which would have normally pushedcoal power plants out of the market. However due to the inability ofthe scheme to maintain a fair carbon price, coal power plants werenot decommissioned. More than 100 Gw of gas power plants thatwere built in the last decade in anticipation of the decommissioningof coal power plants finally caused a huge overcapacity inconventional electricity production. In that respect, with more thana decade of rapid increase of production capacities and electricityconsumption stagnation, several utilities suffer from reducedoperating hours and lower revenues. the demand has hardlyincreased in the last decade in europe.
Fearing for generation adequacy issues in the coming years dueto gas power plants decommissioning, some Member States aswell as companies are pushing for capacity remunerationMechanisms in order to maintain the least competitive gas plantson the market. while the impact of PV on this remains to beproven with certainty, the future of the electricity markets ineurope will be at the cornerstone of the development of PV.
the debate about the future of renewables continued in 2016 withthe revision of the state-aid rules, through which the europeancommission pushed Member States to shift incentives from Fits tomore market based instruments, including possible technology-neutral tenders. this recommendation has already been followedby several member states including Germany or Spain. At the endof 2016, the proposal called “clean energy for All europeans” pavedthe way for a development of self-consumption under fair rules,together with market improvements and rules for decentralizedstorage. while the package hasn’t yet been approved, it highlightsa change in mentalities going in the right direction.
IEA-PVPS
FINLAND
FINAL ELECTRICITY CONSUMPTION 2016
HABITANTS 2016
IRRADIATION
2016 PV ANNUAL INSTALLED CAPACITY
2016 PV CUMULATIVE INSTALLED CAPACITY
PV PENETRATION
85
6
838
17,4
37,4
0,0
twh
MIllIon
kwh/kw
Mw
Mw
%
the rooftop market below 250 kw represented around 37%whereas systems above 250 kw, both rooftop and utility-scale,represented around 63% of added capacity in 2016. the totalinstalled capacity reached 7,1 Gw by the end of 2016, includingoverseas departments (367 Mw). In total utility-scale PV systemsrepresented slightly less than 2,6 Gw at the end of 2016, with a300 Mw plant installed in 2016. off-grid installations in 2016 werearound 0,5 Mw while the total off-grid installed capacity was closeto 31 Mw.
the national support measures currently implemented in Franceare guaranteed feed-in-tariffs (paid for by electricity consumers)and tender procedures for systems above 100 kw.
one specific element of the French regulatory framework lies inthe priority given to supporting bIPV systems over conventionalbAPV systems. In May 2016, feed-in tariffs were limited tosystems under 100 kw installed on buildings, but with a continuedsupport for bIPV. the support to bIPV explains the relatively highcosts of support schemes in France. the income tax credit forprivate bIPV roof owners was phased out on 1 January 2014, butthe material costs still benefit from a reduced 10 % VAt rate. In2016, the residential hybrid system PV-t has become eligible tothe cIte energy transition tax credit.
Projects over 100 kw can respond to calls for tenders. A newcalendar for new tenders with capacity of 4 350 Mw between2016 and 2019 was published in 2016. So far, the low retail pricesfor electricity have been a challenge especially for thedevelopment of self-consumption in France. Hence, some regionsare promoting self-consumption projects through their calls forproposals. new call for tenders will be dedicated to self-consumption from 2016 onwards.
From 2017, for systems over 0,5 Mw, electricity generated will besold directly on the electricity spot market, with an additionalremuneration to meet tendered rates.
overseas departments and territories of France are mainlycomposed of islands with different grid connection rules than themainland in order to cope with the smaller grids, and capacitypenetration limits.
with three years in a row (2010 - 2012) above 7 Gw of PVsystems connected to the grid, Germany used to be the mosticonic PV market for many years. this was achieved thanks to acombination of several elements:
• A long term stability of support schemes;
only companies, communities and other organizations are eligiblefor the support. For the agricultural sector an investment subsidyfor renewable energy production from the Agency of rural Affairsis available as well. the subsidy covers 40% of the totalinvestment. However, only the portion of the investment used inagricultural production is taken into account.
Self-consumption of PV electricity is allowed in Finland. However,the current net-metering scheme is real-time, and the majority ofinstalled electricity meters do not net-meter between phases. thehourly-based net-metering for individual consumers is underdiscussion, and will possibly be implemented. In residential andcommercial scales both the consumption and the generation ofelectricity is metered with the same energy meter owned by thedSo. Several energy companies offer two-way electricity (buyingand selling) contracts for prosumers. electricity generation below100 kVA is exempted from the payment of electricity tax. the taxexemption is also valid for larger plants than 100 kVA if theirannual electricity generation is below 800 Mwh. the owning of aPV system is not regarded as a business activity in Finland.Individuals can produce electricity for their own household usewithout paying taxes. For individual persons, the income from thesurplus electricity sales is considered as a personal income.However, individuals can subtract the depreciation and yearlysystem maintenance cost from the sales income. As a result inmost cases the additional income from a rooftop PV system willnot lead to additional taxes. Individuals can get a tax credit for theinstallation of the PV system on an existing building. the amountcovers 45% of the total work cost including taxes. the maximumtax credit for a person is 2 400 eUr/year and it is subtracteddirectly from the amount of taxes that have to be paid.
with these incentives, Finland has started to see some PVdevelopment which should continue in the coming years.
the political decision was taken to maintain the market around 1 Gwper year in the last years and to increase it in the coming years, upto 2 Gw a year. However, unexpected long grid connection delayshave drastically slowed down the capacity increase.
the newly added capacity in France decreased slightly to 559 Mw in 2016 compared with 894 Mw in 2015, after havingreached 1 120 Mw in 2012 and 654 Mw in 2013; a number thatshould increase in the coming years. Indeed, following coP21,France has put an effort in boosting its solar market by revisingthe national PV installed capacity target to 10,2 Gw in 2018 andbetween 18,2 to 20,2 Gw in 2023.
two // chAPter 2 PV MArket deVeloPMent trendS
ieA PVPS trendS 2017 In PHotoVoltAIc APPlIcAtIonS
28
eUroPe / contInUed
FRANCE
FINAL ELECTRICITY CONSUMPTION 2016
HABITANTS 2016
IRRADIATION
2016 PV ANNUAL INSTALLED CAPACITY
2016 PV CUMULATIVE INSTALLED CAPACITY
PV PENETRATION
483
67
1 160
559
7 164
1,7
twh
MIllIon
kwh/kw
Mw
Mw
% GERMANY
FINAL ELECTRICITY CONSUMPTION 2016
HABITANTS 2016
IRRADIATION
2016 PV ANNUAL INSTALLED CAPACITY
2016 PV CUMULATIVE INSTALLED CAPACITY
PV PENETRATION
548
83
942
1 476
41 186
6,4
twh
MIllIon
kwh/kw
Mw
Mw
%
29
ieA PVPS trendS 2017 In PHotoVoltAIc APPlIcAtIonS
two // chAPter 2 PV MArket deVeloPMent trendS
A programme of incentives for storage units was introduced 1st May2013, which aims at increasing self-consumption and developing PVwith battery storage in Germany. A 25 MeUr market stimulationprogramme has been introduced to boost the installation of localstationary storage systems in conjunction with small PV systems (< 30 kwp). within the framework of this storage support programmearound 20 000 decentralized local storage systems were funded bythe end of 2016. during 2016, around 800 local storage systems forexisting PV systems were funded with 7 MeUr. 5 668 of the newlyinstalled funded PV systems were build with local storage. Acontinuation of this programme is planned until the end of 2018.
Market Integration Model
In contrast to self-consumption incentives, Germany pushes PVproducers to sell electricity on the electricity market through a“market premium”. the producer can decide to sell its electricityon the market during a period of time instead of getting the fixedtariff and receives an additional premium on the top of the marketprice. the producer can go back and forth to the Fit system or themarket as often as necessary. new PV installations above 100 kwp are forced to access the electricity.
to take part in the “market integration model” ground mountedsystems have to run a tendering procedure. three calls with atotal capacity of 600 Mw are executed every year. the price levelwas reduced from call to call: from 0,0917 eUr/kwh in the pilotauction 2015 it declined continuously: the most recent priceobtained from the sixth solar auction in december 2016 was 0,069eUr/kwh. 2017 auctions have contributed to even lower prices.
Grid Integration
due to the high penetration of PV in some regions of Germany,new grid integration regulations were introduced. the mostnotable ones are:
• the frequency disconnection settings of inverters (in the pastset at 50,2 Hz) has been changed to avoid a cascadedisconnection of all PV systems in case of frequency deviation.
• Peak shaving at 70% of the maximum power output (systemsbelow 30 kw) that is not remotely controlled by the grid operator.
Italy in 2016 installed 382 Mw compared to a lower 300 Mw in2015. Grid-connected installed capacity reached 19 283 Mw within addition 14 Mw of off-grid plants. the growth of the last fewyears lowered compared to past years because of the end ofincentive scheme in 2013.
• the confidence of investors;
• the appetite of residential, commercial and industrial buildingowners for PV.
From 2013 to 2016, the PV market went down to 3,3 Gw (2013)then around 1.5 Gw (2015 and 2016), below the political will toframe the development of PV within a 2,4-2,6 Gw range eachyear. this results into a total installed PV capacity of 41,2 Gwconnected to the electricity grid at the end of 2016. regarding thetotal installed capacity, 2016 was also the year that saw Japanovertaking Germany and putting itself in the second place. thisshows the relative decline of the market that used to power theentire PV sector at the beginning of the decade.
Breathing Feed-in Tariff
the eeG law has introduced the Fit idea and has continued topromote it partially. It introduces a Fit for PV electricity that ismutualised in the electricity bill of electricity consumers.exemption is applied to energy-intensive industries, a situationthat was challenged by the european commission in 2013. withthe fast price decrease of PV, Germany introduced the “breathingFit” concept in 2009: a method allowing the level of Fits to declineaccording to the market evolution. depending on the deviationfrom a defined threshold value, the degression of the Fit will beaccelerated or decelerated. during the years, threshold value anddegression rates have been changed several times, especially theperiod between updates and the calculation period for the actualmarket size have been reduced to avoid market booms (thebiggest one came in december 2011 with 3 Gw in one singlemonth). the latest change was put in place 2017, when thethreshold was changed from a 2,4-2,6 Gw corridor to a fixedvalue of 2,5 Gw: 1,9 Gw bAPV/bIPV + 0,6 Gw ground mounted.during the year 2016, no reduction of the Fit was executed dueto the low market level.
Since September 2012, Germany started to limit the size ofinstallations that can profit from the Fit. Since 2017 only systemsbelow 100 kwp can profit from a classic Fit, while systems up to1 Mw on residential buildings and up to 10 Mw on non-residentialbuildings have the possibility to benefit from the so called “marketintegration model” (see below).
Self-Consumption
Until 2012, a self-consumption premium that was paid above theretail electricity price was the main incentive to self-consumeelectricity rather than injecting it into the grid. on the 1st April2012, the premium was cancelled when Fit levels went below theretail electricity prices. with the same idea, for systems between10 kw and 1 Mw, the grid injection is capped to 70% of themaximum system power in order to force self-consumption. If theremaining 30% has to be injected anyway, a low market price ispaid instead of the Fit.
Prosumers have to pay 40% of the surcharge for renewableelectricity for the self-consumed electricity for systems above 10kw. In 2017 this surcharge amounts to 6,88 eUrct on every kwhconsumed from the grid.
IEA-PVPS
ITALY
FINAL ELECTRICITY CONSUMPTION 2016
HABITANTS 2016
IRRADIATION
2016 PV ANNUAL INSTALLED CAPACITY
2016 PV CUMULATIVE INSTALLED CAPACITY
PV PENETRATION
308
61
1 158
382
19 297
7,2
twh
MIllIon
kwh/kw
Mw
Mw
%
pushing the PV installed capacity to close to 2,1 Gw mark, mostlyin the residential PV market.
A reverse auctioning system exists for large-scale PV systems,called Sde+ which attracted 48 Mw in 2013, 137 Mw in 2014 butonly 3 Mw in 2015 and 22 Mw in 2016. more should come in thecoming years with the Sde+ 2017 call expected to grant morethan 2 Gw to PV systems above 15 kw.
this environment is triggering the development of new businessmodels. For example, contracts to purchase electricity fromneighbours are developing, resulting in new community-basedsystems. the dutch market is very competitive and it will beinteresting to observe the fast evolution of net-metering and thepotential reaction from grid operators, while high electricity pricesare making grid parity accessible in the residential segment.
to reach the renewable energy goals in 2023, there is now apotential for 1 Gw or more of PV installations a year.
with good research centers and companies active in the PVsector, the netherlands appear as an interesting innovator thatcould accelerate the emergence of bIPV in europe. From PVroads to concept for complete roof renewals, PV integrated in thebuilt environment (and not only in buildings) could provide aninteresting framework for the future in a country where free spaceis scarce and the built environment majoritary. From a marketpoint of view, the political commitment to keep the net-meteringscheme until the end of the decade offers a safe harbour for PVinvestment, before the expected transition to a pure self-consumption regulatory regime.
the PV market in norway was driven mainly by off-gridapplications until 2014. However, this was taken over by grid-connected segmentation when it jumped ten-fold from 0,1 Mw in 2013 to 1,4 Mw at the end of 2014. 2015 saw a weakgrowth in commercial business installations, but this was offsetwith the growth coming from household systems. therefore, thegrid-connected segment increased modestly to 1,5 Mw in 2015.In 2016 the grid-connected segment dominated the marketcompletely with 10 Mw installed: installations were split betweencommercial (7,4 Mw) and residential (3 Mw) installations.
overall, the total installed capacity reached 27 Mw at the end of2016. the estimates for 2017 indicate further market growthdespite weak incentives and low electricity-prices.
the off-grid market refers to both the leisure market (cabins, leisureboats) and the professional market (primarily lighthouses/lanternsalong the coast and telecommunication systems). this segment is
Italy developed different incentive mechanisms. the first one wasthe “10 000 PV roofs” that was implemented in the early 2000,followed in July 2005 by a Feed-in tariff (Feed-in Premium until2012) system, the so-called “conto energia”. this scheme wasregulated with four successive ministerial decrees that furtherexploited the already existing mechanism of net-metering and areal time self-consumption.
the cost of the incentive is covered by a component of theelectricity tariff structure paid by all final consumers (the financialcap set by Fit was 6,7 beUr in terms of yearly payments).
In 2009 Italy switched from the net-metering mechanism to theso-called “Scambio Sul Posto” (SSP) for systems below 200 kw(500 kw for plants installed starting from 2016). the SSP is a net-billing scheme, in which electricity fed into the grid is remuneratedthrough an “energy quota” based on electricity market prices anda “service quota” depending on grid services costs (transport,distribution, metering and other extra charges). In case theproducer does not want to apply for the SSP, electricity marketprices are applied for the electricity injected into the grid. out of382 Mw installed in 2016, almost all plants are under the SSP net-billing scheme.
tax credit (available only for small size plants up to 20 kw),together with the net-billing scheme, are the remaining measuresto support the PV market; in addition, in the frame of a specific lawrelated to urban planning, the opportunity to increase the volumeof existing buildings in case of reS plants is confirmed.
residential installations represented 40% of the Italian PV marketin 2016; utility scale market is on a slightly recovering trend,thanks also to the sharp drop of the PV module costs.
regarding storage, tax credit measures are foreseen, but so farstorage has been installed in few residential PV plants, integratedwith the inverter in order to achieve a better performance of theinstalled system.
Until 2003, the dutch PV market developed thanks to aninvestment grant that was extremely successful. due to budgetreallocation, the grant was cancelled and the market went downto a low level. From 2008-2009 the government introduced a newFit programme with a financial cap. this revitalized the marketuntil the end of the programme in 2010. Since 2011, the mainincentive in the netherlands is a net-metering scheme for smallresidential systems up to 15 kw and 5000 kwh. this triggered animportant market development which lasts till now. In 2015, 437 Mw of PV systems were installed and 525 Mw in 2016,
two // chAPter 2 PV MArket deVeloPMent trendS
ieA PVPS trendS 2017 In PHotoVoltAIc APPlIcAtIonS
30
eUroPe / contInUed
NETHERLANDS
FINAL ELECTRICITY CONSUMPTION 2016
HABITANTS 2016
IRRADIATION
2016 PV ANNUAL INSTALLED CAPACITY
2016 PV CUMULATIVE INSTALLED CAPACITY
PV PENETRATION
114
17
950
525
2 084
1,7
twh
MIllIon
kwh/kw
Mw
Mw
%
NORWAY
FINAL ELECTRICITY CONSUMPTION 2016
HABITANTS 2016
IRRADIATION
2016 PV ANNUAL INSTALLED CAPACITY
2016 PV CUMULATIVE INSTALLED CAPACITY
PV PENETRATION
132
5
800
11,4
26,6
0,0
twh
MIllIon
kwh/kw
Mw
Mw
%
31
ieA PVPS trendS 2017 In PHotoVoltAIc APPlIcAtIonS
two // chAPter 2 PV MArket deVeloPMent trendS
the Portuguese PV market stood at 51,7 Mw in 2016, registering asmall increase with respect to the previous yearly level ofinstallations. the market has been mostly driven by the Fit scheme.the industrial segment was the largest with 28 Mw installed, whilethe other distributed segments reached 35,6 Mw together. 16 Mwof utility-scale plants were installed in Portugal in 2016. the totalinstalled capacity reached about 516 Mw end of 2016.
by october 2014, the new self-consumption and FIt regimeregulation for small units (systems under 250 kw) was published.
on January 2016, the Green tax reform was implemented settingthe maximum tax depreciation of solar at 8%. the proposal ofreducing 50% of the Municipal real estate tax (IMI) for reSpower producing buildings was accepted.
In 2013, given the difficult financial situation of the country, thegovernment decided to revise targets under the nationalrenewable energy Action Plan for 2020 and the official goal forPV was reduced from 1,5 Gw to 720 Mw in 2020.
In 2007 and 2008, Spain’s Fit programme triggered a rapidexpansion of the PV market. After a moratorium in october 2008that made the market go down, in January 2012 a newmoratorium was put in place for all the renewables projects withFit. In 2016, only 55 Mwdc were installed in Spain and the totalinstalled capacity tops almost 4,7 Gwac (5,5 Gwdc), which can beexplained by the difficult economic environment and theconstraining PV policies.
In the summer of 2013, the Government announced a new reformof the electricity market. Under the 24/213 Power Sector Act, theFit system was stopped in July 2013 and the new schemes arebased on the remuneration of capacity rather than production.the new system is based on government-estimated standardcosts, with a legal possibility to change the revenues allocatedevery three years. Projects are financed at market price and theirincomes are complemented with revenues should they achievethe level of profitability established by the government. this hascaused many projects to be in a state of default. the largestprojects have changed hands, since international investors foundinterest in the acquisition of this projects.
the 24/2013 Power Sector Act considers very restrictive forms ofself-consumption. the regulatory framework for self-consumptionwas developed under royal decree (rd) 900/2015 and didn´tchange in 2016. this rd established that the maximum capacityof the self-consumption installation must be equal or below thecontracted capacity. It also specifies two types of self-consumers:
growing caused by an increasing number of larger hybrid systemswith larger battery-capacities, diesel or petrol back-up generatorsand electrical conversion to 230 Volt Ac.
Self-consumption for grid-connected systems is allowed under the‘Plus-customer scheme’ provided that the customer is a netcustomer of grid-electricity on a yearly basis, and limits themaximum feed-in power to 100 kw. there are several drivers forthe strong growth in the residential market segment during 2016.environmental awareness and access to capital, especially amongtechnological interested people who typically already driveelectric cars, but also new business models where severalcompanies now offer leasing of PV-systems.
From January 2016, owners of small PV systems below 15 kwp areeligible for a financial investment support provided by enova SF, apublic agency owned by the Ministry of Petroleum and energy.enova also offers financial supports for “building with High-energyPerformance” where the energy performance goes beyond thenormal technical norms. environmental qualities is an increasinglyimportant market parameter for stakeholders in the norwegianbuilding and construction sector. enova has a strong focus on energyefficient buildings and supports innovative technologies and solutions.bIPV and associated batteries, and smart control is emerging alongwith new companies with innovative business models.
In 2014, the municipality of oslo launched a capital subsidy for PVsystems on residential buildings covering a maximum of 40% ofthe investment cost. the programme has been extended everyyear since the start and is funding installations also in 2017.
during 2015, self-consumption for large PV systems were underdiscussion to be eligible for el-certificate (renewable energycertificates, recS) market which created uncertainty forinvestors, but from 2016 PV-plants receive el-certificates for thetotal annual production for 15 years. the value of the el-certificates is not fixed, but are priced in the range of 0,15nok/kwh at the moment. Power-plants must be in operationwithin the end of 2020 to be part of the recS support program.
with a low density of population, a nordic cold climate (which fitsperfectly the use of PV) and an extremely high share (96-99%) ofcheap (0,20-0,50 nok/kwh in the summer), hydro-basedrenewable energy in the electricity mix, norway is not expectedto become a huge PV market. However, it represents aninteresting showcase of PV possibilities, especially in combinationwith the increasing share of electric vehicles.
IEA-PVPS
PORTUGAL
FINAL ELECTRICITY CONSUMPTION 2016
HABITANTS 2016
IRRADIATION
2016 PV ANNUAL INSTALLED CAPACITY
2016 PV CUMULATIVE INSTALLED CAPACITY
PV PENETRATION
51
10
1 600
52
517
1,6
twh
MIllIon
kwh/kw
Mw
Mw
%
SPAIN
FINAL ELECTRICITY CONSUMPTION 2016
HABITANTS 2016
IRRADIATION
2016 PV ANNUAL INSTALLED CAPACITY
2016 PV CUMULATIVE INSTALLED CAPACITY
PV PENETRATION
265
46
1 300
58
5 483
3,0
twh
MIllIon
kwh/kw
Mw
Mw
%
the off-grid market stabilized to around 1,5 Mw. As in 2015, andin the same way as in many european countries, the largeincrease of installed systems occurred within the submarket ofgrid-connected systems. with 77,6 Mw installed in 2016 for grid-connected PV, the cumulative grid-connected PV reached193 Mw while the off-grid capacity established itself at 12,7 Mw atthe end of 2016. the strong growth in the Swedish PV market is dueto lower system prices, a growing interest in PV and a direct capitalsubsidy along with newly introduced tax deduction system.
Incentives
A direct capital subsidy for installation of grid-connected PVsystems that have been active in Sweden since 2009. It was firstprolonged for 2012 and later extended until 2015. these fundswere completely used in 2014 already, which pushed thegovernment to add 50 MSek for 2015. due to the much higherinterest in the support scheme, as compared to the allocatedbudget, the waiting time for a decision about the investmentsubsidy is quite long, in general about 1-2 years. In an effort tolower the waiting times the government decided in the autumn of2016 to greatly increase the annual budget of this scheme for theyears 2016–2019 with 235, 390, 390 and 390 MSek, respectively.
net-metering has been discussed and investigated several timesbut it has not been introduced. In the meantime, some utilitieshave decided to put in place different compensation schemes forthe excess electricity of micro-producers. In addition, from 2015the government introduced a tax deduction of 0,06 eUr per kwhfor the excess electricity fed into the grid, which PV owners witha fuse below 100 ampere is entitled to. this remuneration is inaddition to the compensation offered by the utility company. the tax deduction will apply on the income tax, and has a cap of3 100 eUr per year.
Additionally, a tradable green certificates scheme exists since 2003, but only around 48,6 Mw of the 115,7 Mw of grid-connected PV installations in Sweden are using it so far dueto the complexity for micro-producer to benefit from the scheme.It is expected that the Swedish green electricity certificate systemwill be prolonged to 2030.
the Swedish PV market is in the short term expected to continueto grow with the introduction of the tax deduction for micro-producer, the increase of supports from utilities, regulationchanges that lessen the administrative procedure and theincreased budget for the investment subsidy. However, theadministrative burden and long queue in getting the investmentsubsidy need to be addressed properly in order for market tothrive in the upcoming years.
• type 1: maximum capacity installed of 100 kw – there is nocompensation for the electricity surplus fed in the grid.
• type 2: not limit to the allowed capacity – the surplus can besold in the wholesale market directly or through anintermediary. A specific grid tax of 0.5 eUr/Mwh has to be paidtogether with a 7% tax on the electricity produced.
regulation indicates that self-generated power above 10 kw ischarged with a fee per kwh consumed as a “grid backup toll”,commonly known as the “sun tax”. Adding battery storage to theinstallation also implies an additional tax. In 2016 geographicalcompensation is not allowed, and self-consumption for severalend customers or a community is not allowed either.
Grid parity has been reached in Spain thanks to two factors: highsolar irradiation resource and better prices for components. PVinstallations have decreased their price 80% in the past five years.Given the context of a lack of feed-in-tariff, the future of the SpanishPV market lies in the deployment of large PV plants thanks to therenewable energy tenders planned to meet the eU energy andclimate targets and the Paris Agreement. In 2016, however, the firstSpanish renewable energy tender only allowed wind and biomassto participate. PV projects were therefore left out. the tender wasnot successful because of its design, which allowed projects toparticipate at zero cost. For 2017 new tenders have beenannounced, which should in theory favor PV and lead to severalGw of installations before 2020. PV project developers are alsolooking into other sources of financing, such as PPAs or merchant.
one of the key objectives supported by an important part of thecivil society and policymakers is the elimination of some self-consumption barriers, like technical and administrative barriers.this would power the development of self-consumption in Spain.
PV installations increased once again in Sweden in 2016: 79 Mwwere installed compared to 47 Mw one year before. In the last tenyears, more grid-connected capacity than off-grid capacity hasbeen installed and grid-connected PV largely outscores off-gridsystems, a trend which is now visible in Finland and norway aswell. the grid-connected market is almost exclusively made up ofroof mounted systems installed by private persons or companies:residential installations reached 21 Mw and commercial orindustrial ones 48 Mw. bIPV represented less than 2 Mw andground-mounted systems less than 7 Mw.
the total installed capacity reached the 200 Mw mark in 2016 asthe total installed capacity was 204,45 Mw, compared to 126,8Mw at the end of 2015.
two // chAPter 2 PV MArket deVeloPMent trendS
ieA PVPS trendS 2017 In PHotoVoltAIc APPlIcAtIonS
32
eUroPe / contInUed
SWEDEN
FINAL ELECTRICITY CONSUMPTION 2016
HABITANTS 2016
IRRADIATION
2016 PV ANNUAL INSTALLED CAPACITY
2016 PV CUMULATIVE INSTALLED CAPACITY
PV PENETRATION
140
10
950
79
205
0,1
twh
MIllIon
kwh/kw
Mw
Mw
%
SWITZERLAND
FINAL ELECTRICITY CONSUMPTION 2016
HABITANTS 2016
IRRADIATION
2016 PV ANNUAL INSTALLED CAPACITY
2016 PV CUMULATIVE INSTALLED CAPACITY
PV PENETRATION
58
8
950
270
1 664
2,3
twh
MIllIon
kwh/kw
Mw
Mw
%
33
ieA PVPS trendS 2017 In PHotoVoltAIc APPlIcAtIonS
two // chAPter 2 PV MArket deVeloPMent trendS
IEA-PVPS
270 Mw were connected to the grid in Switzerland in 2016, a 20%decrease compared to 2015, but a rather stable market looking atthe last five years. In total, Switzerland hosted 1,66 Gw of PVsystems at the end of 2016.
Almost the entire PV market consists of rooftop applications andthe few ground mounted PV applications are relatively small insize. the total off-grid applications market stood at level of lessthan 4 Mw with a market below the 1 Mw mark. residentialinstallations represented 50 Mw, the commercial segment about160 Mw and the industrial one 40 Mw. bIPV represented around20 Mw thanks to a special premium offered by the Swiss Fit anddirect subsidy scheme. out of these 20 Mw, 15 Mw are in theresidential segment. Ground-mounted applications representedless than 1 Mw in 2016.
the limitations of a new funding scheme with Feed in tariffs anddirect subsidies had a negative effect on the market and pushed itdown. Since only small installations below 30 kw have still aguaranteed right for direct subsidies, the market for largersystems is drying out.
Switzerland has the national capped Fit scheme financed througha levy on electricity prices but the main drivers for marketdevelopment in 2016 were self-consumption and the directsubsidy scheme for small installations up to 30 kw introduced in2014. Self-consumption is now the main driver for residential aswell as commercial sized systems. depending on grid costconditions as well as energy buy-back tariffs, some dSo allow theoperation of PV systems to be profitable for the time being.
besides the (capped) national Fit scheme there are still manyregional, local and utility-supported incentives schemes. theseare either based on direct subsidies or Fits equal or below thefederal level.
the average size of the systems installed in 2016 was about 30 kw. About 9 300 systems have been installed. More than 6 800systems are smaller than 20 kw (and can be considered asresidential systems).
In 2016 PV contributed to 2,3 % of the total electricityconsumption and will be able to cover at least 2,8 % in 2017. withthis production level, PV has become second to hydropower in therenewable electricity portfolio.
Since the referendum in May 2017 where the Swiss voted for newsupport schemes for renewables and put a ban on new nuclearpower plants, the market outlook for Switzerland looks quite good.
OTHER COUNTRIES
2,15 Gw of PV systems (against 4,1 Gw in 2015) have beeninstalled in 2016 in the United kingdom (Uk), bringing the totalinstalled capacity to more than 11 Gw. the Uk was again the firsteuropean market in 2016, ahead of Germany, due to a strongdeployment of utility-scale PV. this market is driven by two mainsupport schemes: a generation tariff coupled with a feed-inpremium and a system of green certificates linked to a quota
(called roc, for renewable obligation certificates). thegeneration tariff is granted for small size PV systems. Systemsbelow 30 kw receive in addition to the generation tariff, a bonus forthe electricity injected into the grid (the “export-tariff”, a feed-inpremium above the generation tariff), while the self-consumed partof electricity allows for reducing the electricity bill. this scheme canbe seen as an indirect support to self-consumption; the export tariffbeing significantly smaller than retail electricity prices. Above 30 kw, excess electricity is sold on the electricity market.
For larger systems, the Uk has implemented its own rPS system,called roc. In this scheme, PV producers receive certificates witha multiplying factor. this scheme applies to buildings and utility-scale PV systems. this system has now been replaced forsystems above 5 Mw by a market premium using a contract fordifferences (cfd) to guarantee a fixed remuneration based on avariable wholesale electricity price. the Uk market is expected tocontinue decreasing in 2017 and even more in a near future dueto the changes in incentives.
bulgaria experienced a very fast PV market boom in 2012 that wasfuelled by relatively high Fits. officially 1 Gw of PV systems wereinstalled in this country with 7 million inhabitants in a bit more thanone year, creating the fear of potential grid issues. In addition topossible retroactive measures aiming at reducing the level of alreadygranted Fits, bulgarian grid operators have opted for additional gridfees in order to limit market development. the consequence is thatthe market went down to around 10 Mw in 2016.
In the czech republic, driven by low administrative barriers and aprofitable Fit scheme, the czech PV market boomed in 2009 andespecially in 2010. with more than 2 Gw installed, installationsstopped and the total installed capacity was even reviseddownwards. composed mainly of large utility-scale installations,the czech PV landscape left little space to residential rooftopinstallations. At the end of 2015, the energy regulators used thefalse excuse (that european institutions should validate the Fitpayments) to discontinue paying the Fit to existing plants, onemore attempt, after the tax on Fit, to reduce the cost of previousFit expenses. And to reduce the confidence of investors into PV inczech republic. in 2016, about 5 Mw were installed in the country.the market could start to move again in 2017 under new policies.
After having installed 912 Mw in 2012, Greece installed 1,04 Gw ofPV systems in 2013, and reached 2,6 Gw of installed capacity. themarket continued the downward trend with almost nothing installedin 2016. the market was driven by Fits that were adjusteddownwards several times. the installations are mainly concentratedin the rooftop segments (commercial and industrial segments inparticular). with dozens of islands powered by diesel generators, thedeployment of PV in the Greek islands went quite fast in 2012 and2013. due to the rapid market uptake, grid operators asked in 2012to slow down the deployment of PV, in order to maintain the abilityof the grid to operate within normal conditions.
romania experienced a rapid market development with 1,1 Gwinstalled in one year, driven by an rPS system with quotas paidduring 15 years. Financial incentives can be granted but reduce theamount of green certificates paid. In 2014, the government decidedto freeze 2 out of 6 green certificates until 2017 in order to limit thedecline of the green certificates price on the market. In addition, thenumber of green certificates granted for new PV installations wentdown to 3. the total installed capacity reached 1382 Mw with 70Mw installed in 2016. romania illustrates the case of an rPSsystem with Green certificates where the level of the rPS was notadjusted fast enough to cope with the growth of installations.
After years outside of the global PV market, Poland installedaround 100 Mw in 2016 and the total installed capacity reached199 Mw at the end of the year. A large part of installations tookpart in the residential and commercial segments. the Polishgovernment is currently supporting solar through net metering (upto 40 kw) and an auction mechanism for large-scale projects(over 40 kw). the two schemes, which replaced the greencertificate mechanism, were introduced with a new renewableenergy law in July 2016. Under the net metering scheme,operators of PV systems up to 10 kw are refunded 80% for eachkilowatt they inject into the electricity system, while owners of PVinstallations ranging in size between 10 kw and 40 kw arerefunded 70%. As for the auction mechanism, the governmentheld the first auction in late december 2016. through the tender,a total of 82 renewable energy projects up to 1 Mw wereselected, the majority for Mw-sized PV plants. the lowest bid wasabout 6,2 USdcents/kwh.
Hungary also experienced some market development in 2016, witharound 100 Mw installed and around 270 Mw of total installedcapacity at the end of the year. Most of this capacity comes in theform of PV systems up to 50 kw installed under the country’s net-metering scheme up to 50kw. the remaining cumulative capacityis represented by PV systems installed under the FIt scheme.Under this program, PV projects with simplified license andcapacity between 50 kw and 500 kw can be financed while PVprojects over 500 kw require the full licensing process. Installationsin 2015 and 2016 reached 100 Mw, while in 2014 and 2013 newinstallations reached 36.9 Mw and 18,8 Mw, respectively.
other european countries have experienced some marketdevelopment in 2016, driven by a mix of Fits, self-consumptionmeasures and calls for tenders that are now in place. Slovakiaexperienced very fast market development in 2011 with 321 Mwinstalled but less than 1 Mw with reduced incentives and a rathernegative climate towards PV investments in 2014. Ukraine hasseen a spectacular market development from 2011 to 2013 with616 Mw of large installations. However, the political instability willhave long term impacts on the PV development in the country.
In total, the european markets represented 6,6 Gw of new PVinstallations and 105,84 Gw of total installed capacity in 2016.
two // chAPter 2 PV MArket deVeloPMent trendS
ieA PVPS trendS 2017 In PHotoVoltAIc APPlIcAtIonS
34
eUroPe / contInUed
Continuing the rising development trend started in 2014 and 2015,many countries had considered PV as one of the main renewablesource in producing electricity in 2016. Several countries aredefining PV development plans and the prospects on the short tomedium term are positive. The Middle East is now the mostcompetitive place for PV installations, with PPAs granted throughtendering processes among the lowest in the world.
Israel installed 130 Mw of new PV systems in 2016, whereas thecountry installed several years more than 200 Mw. In total, closeto 1 Gw of PV systems were operational in Israel at the end of2016. of this capacity, around 200 Mw comes from PV projectsexceeding 12 Mw, while the remaining power is represented byresidential installations up to 15 kw (50 Mw), commercialinstallations ranging in size from 15 kw to 50 kw (240 Mw), anddistributed generation PV plants up to 14 Mw (downsized to 12 Mw) (315 Mw). on top of this, there are more than 100 Mwof capacity installed under the country’s net metering scheme.
2016 has seen a dramatic decline in the electricity cost in Israel(around 15%) leading to tougher competition of renewable energy.However, it is still clear that PV system are close to grid parity.
A tariff has been set up for re manufacturers and it is notsubjected to FIt quotas. the tariff is the recognized conventionalelectricity generation tariff + a premium for emissions reduction(currently 0,26 + 0,08 IlS). the main issue for PV entrepreneursnow, is the fact that the rate fluctuates with conventional electricitygeneration rates, and is thus not guaranteed. An example for thisuncertainty was seen last year with the steep decline of electricitygeneration costs.
In december 2014 a first utility-scale system was connected to thetransmission grid (37,5 Mw). Most of the new installationscontinued to be medium size: between 500 kw to several Mwwith connection to the distribution grid. In the next two years,additional PV power is expected to come mostly from large plantsinstallation. the capacity factor for PV in Israel is considerablyhigher than in europe and stands around 19% for actualproduction on an annual average. the penetration of single axistracking systems is increasing due to the higher capacity factor,standing at around 24%.
due to the scarcity of land, efforts are being made to develop PVsystems as a secondary land usage. In addition to the obviousrooftop solution, the option of using water reservoirs, and wasteland is being tested also the use on the same plot of land withsome types of agriculture. tracking systems are particularly fit forthis, as the spacing between the panels is larger.
MIddle eASt And AFrIcA
ISRAEL
FINAL ELECTRICITY CONSUMPTION 2016
HABITANTS 2016
IRRADIATION
2016 PV ANNUAL INSTALLED CAPACITY
2016 PV CUMULATIVE INSTALLED CAPACITY
PV PENETRATION
56
9
1 450
130
1 016
2,6
twh
MIllIon
kwh/kw
Mw
Mw
%
35
ieA PVPS trendS 2017 In PHotoVoltAIc APPlIcAtIonS
two // chAPter 2 PV MArket deVeloPMent trendS
once a very small PV market, turkey aims now to reach 5 Gw ofPV installations by the end of 2023 according to its Strategy Plan(2016 - 2019) and to increase its electricity production capacityfrom solar power to 10 Gw until 2030. Following the upwarddevelopment trend from the previous year, the turkish PV marketsurged to 583 Mw in 2016.
turkey considers two different procedures to install PV: licencedprojects without size limit and unlicensed projects, which arelimited to 1 Mw. to date, only 2 licensed PV plants have beeninstalled in turkey with a total installed capacity of 12,9 Mw. Giventhe complexity of the process in the past, some investorspreferred to set up Mw-scale PV plants unlicensed. Such limitsapply for projects that inject electricity into the grid but projectsself-consuming all of their PV production are not limited in size.
the market increased mainly thanks to “unlicenced” projects.More than 4 Gw of projects have already received the approvaland 1,5 Gw installed by June 2017. cumulative grid-connectedinstalled PV power in turkey reached 848,7 Mw at the end of2016. As the speed of installations accelerates, the mediumscenario for PV development in 2017 sees the market in turkeygoing much higher than in 2016. 1 to 1,5 Gw of newly installedcapacities are expected in 2017.
the remuneration of PV projects is based on a traditional Fitsystem paid 13,3 USdcents/kwh during 10 years, with differentlevels according to the share of local production: PV modules,cells, inverters, installation and construction can benefit from anadditional Fit which may reach up to 6,7 USdcents/kwh.
As of 19 december 2016, PV module imports will be charged animport tax, based on weight – specifically 35 USd/kg. Anexemption from the tax exists by presenting an “InvestmentIncentive certificate” for the approved projects which alreadyreceived this certificate before december 2016.
Solar energy is the most important alternative energy resourcewhich is still untapped in turkey with a potential of dozens of Gw.Given the current support from the government, a rapidly growingmarket in turkey, in the near future, will not be surprising.
IEA-PVPS
Government support is given in the form of guaranteed Fit for 20years. Fits vary by project nature, size and other parameters. Fithave decreased considerably over the last few years, and areexpected to continue their decline. Israel is trying a new biddingsystem for the FIt in large PV project based on quota and price.current starting price for this system is 0,27 IlS per kwh (0,07 USdcents).
because Fit includes a subsidy, which is paid by the electricityconsumer, there are quotas (caps) for each renewable energycategory. In 2014 an additional quota of 340 Mw for PV wasissued, to be evenly spread during 2016-2017. this quota comesmostly at the expense of biomass electricity production, for whichit was decided that the original targets were too high, due to lackof source material. In addition, there is a quota of 180 Mw, whichis expected to be converted from cSP to PV. the series of 1 Gwtenders launched by the Israeli government at the beginning of2017 is intended to help the country reach a target of 10% shareof renewables in its energy mix by 2020. Solar is expected to growby another 2.5 Gw by then. overall, Israel is targeting to cover itsenergy consumption with renewables by 13% in 2025, and by 17%in 2030.
Net-Metering/Self-Consumption.
In 2013, a net-metering scheme was implemented for all reS witha cap of 200 Mw. this programme was extended to 2016.
• real-time self-consumption simply reduces the electricity bill.
• excess PV production can be fed into the grid in exchange formonetary credits, which can be used to offset electricityconsumption from the grid during the following 24 months. thecredit is time of day dependent. thus a small overproduction atpeak times, can offset a large consumption at low times.
• credits can be transferred to any other consumer and inparticular to other locations of the same entity.
• one has the option to sell a preset amount of the electricity tothe grid for money (and not credit), but at a conventionalmanufacturing price (currently 0,30 nIS/kwh).
• All the electricity fed into the grid is subject to Grid andServices charges.
• A back-up fee that aims to cover the need to back-up PVsystems with conventional power plants will be imposed, whenthe installed capacity will reach 1,8 Gw. this fee is technologydependent and will grow for solar from 0,03 nIS/kwh to0,06 nIS/kwh after 2,4 Gw will be installed.
• A balancing fee (0,015 nIS/kwh) for variable renewable sourceshas also been introduced.
• Finally, a grid fee that depends on the time of day and day of theweek and connection type (to transmission, distribution, orsupply grid) has been introduced and ranges between0,01 nIS/kwh and 0,05 nIS/kwh.
TURKEY
FINAL ELECTRICITY CONSUMPTION 2016
HABITANTS 2016
IRRADIATION
2016 PV ANNUAL INSTALLED CAPACITY
2016 PV CUMULATIVE INSTALLED CAPACITY
PV PENETRATION
222
80
1 527
583
849
0,6
twh
MIllIon
kwh/kw
Mw
Mw
%
PV licencing system or registration process. For this reason, theSouth African Photovoltaic Industry Association (SAPVIA)together with the industry developed PV Green card to promotequality and safe solar PV installations. the main motivation for theprogramme is the peace of mind that your solar PV installationcomplies with industry and international best practice. the idea isto create a safe environment for end clients, installers andinvestors. the procedure is simple: SAPVIA gives out guidelinesfor assessments where installers undergo a theoretical andpractical test which they must pass in order to be included in thelist of certified installers in the PV Green card database. then forevery installation, a PV Green card is issued by the certifiedinstallers in order to proof the correctness of the installation. theplan is to make the PV Green card a seal of quality and mandatoryfor any official installations.
Local Content
South Africa took a decision focussed on re-industrialisation in thecountry in order to drive local manufacturing and sustainable jobcreation. this decision is embedded in the Public ProcurementPolicy Framework Act (PPPFA) regulations, which mandate thedepartment of trade and Industry (dtI) to designate strategicsectors of the economy for local procurement. the department oftrade and Industry designated a number of products for localcontent in various sectors of the economy. In the latest instructionnote issued by the national treasury, the dtI designated the SolarPV system component at various levels of local content as follows:laminated PV Module (15%), Module frame (65%), dc combinerboxes (65%), Mounting Structure (90%) and Inverter (40%). Allstate entities procuring Solar PV plants are required to complywith the local content requirements.
OTHER COUNTRIES
In MeA (Middle east and Africa) countries, the development of PVremains modest but almost all countries saw a small developmentof PV in the last years and few of them a significant increase.there is a clear trend in most countries to include PV in energyplanning, to set national targets and to prepare the regulatoryframework to accommodate PV.
winning bids in tenders in the United Arab emirates (dubaï andAbu dhabi) and Jordan have reached extremely low levels downto below 0,03 USd/kwh. dubai will install 1 000 Mw in the comingyears and more have been announced. Jordan at one timeannounced 200 Mw, then that it aimed for at least 1 Gw of PV in2030. Qatar launched its first tender for 200 Mw in october 2013.Saudi Arabia launched a tender in 2017 which will provide mostprobably the lowest bid ever seen in PV.
other countries in the Middle east have set up plans for PVdevelopment at short or long term. lebanon has set up a Fit andSaudi Arabia has made plans for PV development which havebeen delayed but the country is expected to launch its first tenderin 2016.
In Africa, besides South-Africa, the fastest mover was egypt,which has announced plans to develop PV. A Fit program targets
South Africa became the first African PV market in 2014 witharound 960 Mw installed, mostly ground mounted, but themomentum didn’t last and at the end of 2016, the total installedcapacity reached 1 030 Mw. the large majority of this capacityhas been in large scale ground mounted systems, while therooftop solar photovoltaic (rtPV) market, despite its enormouspotential, remains dormant. Small distributed generators likertPV have the potential to grow rapidly (around 500 to 1000 Mwannually), as only small financial investments per project arerequired and project planning can hypothetically be performedquite quickly.
the indicative installed capacity of small scale embeddedgeneration (SSeG) in South African municipalities is in the order of17 Mwp.
The Renewable Energy Independent Power ProducerProcurement Programme
A variety of mid- and long-term interventions has beenimplemented by the government of South Africa in order to quicklyacquire new capacities while ensuring sustainable development.the South African department of energy through the renewableenergy Independent Power Producer Procurement Programme(reIPPPP), a subsidy mechanism for large scale and grid-connected renewable energy systems such as PV to promote anincrease of installed capacities by independent power producers(IPPs). A total of 8.1 Gw of renewables (mainly from wind and PV)for procurement from IPPs has already been allocated. out of this,6.3 Gw have reached preferred bidder status, 4.0 Gw havefinancially closed and signed the Power Purchase Agreements witheskom and 1 474 Mw of solar PV were operational and fed energyinto the grid by dec 2016.
Rooftop Solar PV – Wiring code
the lack of a clearly defined wiring code for small rooftop PV(rtPV) systems is one of the key remaining barriers to preventingthe market from a rapid and cost-effective expansion. A workinggroup has been established to put together a standard for SouthAfrica on connecting embedded generation up to 1 Mw. It willsupport the safe operation of embedded generation forconsumers, installers and grid operators.
PV Green Card
the drastic cost reduction of solar PV systems together with risingelectricity tariffs and uncertainty of supply, have made solar PVincreasingly attractive both for residential and commercial usersin South Africa. However, there is no industry-wide, standardized
two // chAPter 2 PV MArket deVeloPMent trendS
ieA PVPS trendS 2017 In PHotoVoltAIc APPlIcAtIonS
36
MIddle eASt And AFrIcA / contInUed
SOUTH AFRICA
FINAL ELECTRICITY CONSUMPTION 2016
HABITANTS 2016
IRRADIATION
2016 PV ANNUAL INSTALLED CAPACITY
2016 PV CUMULATIVE INSTALLED CAPACITY
PV PENETRATION
238
56
1 702
70
1 030
1,1
twh
MIllIon
kwh/kw
Mw
Mw
%
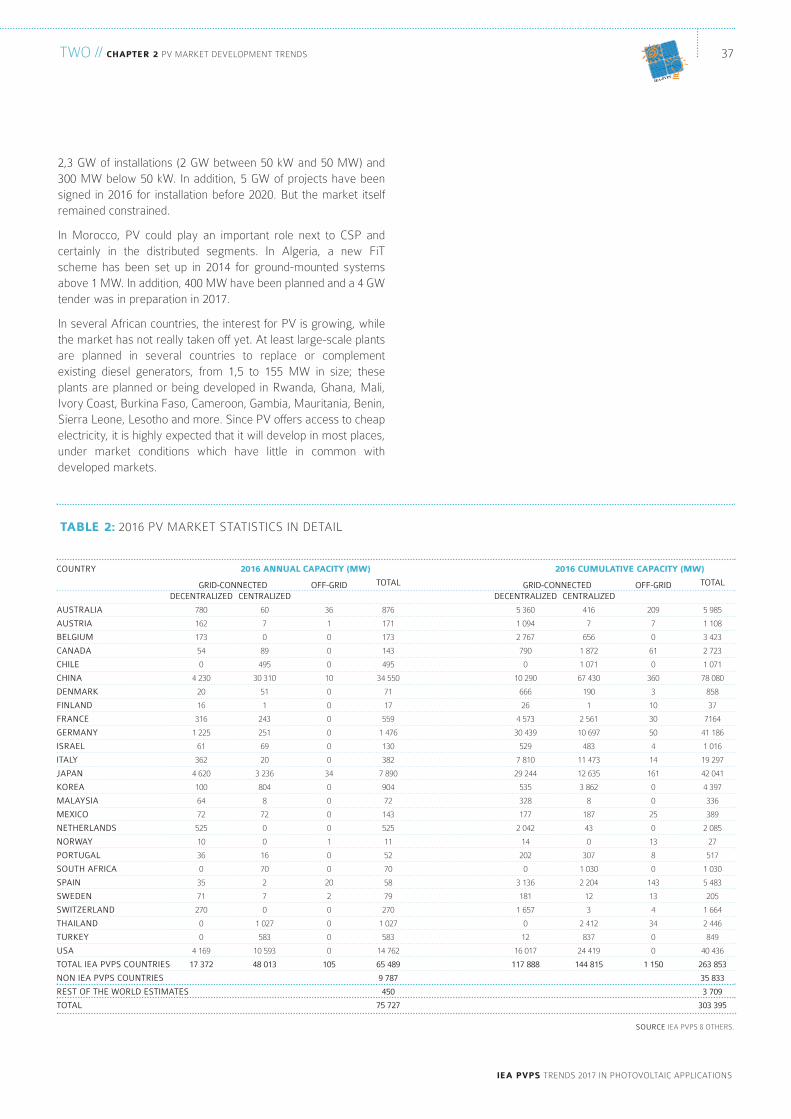
37
ieA PVPS trendS 2017 In PHotoVoltAIc APPlIcAtIonS
two // chAPter 2 PV MArket deVeloPMent trendS
2,3 Gw of installations (2 Gw between 50 kw and 50 Mw) and300 Mw below 50 kw. In addition, 5 Gw of projects have beensigned in 2016 for installation before 2020. but the market itselfremained constrained.
In Morocco, PV could play an important role next to cSP andcertainly in the distributed segments. In Algeria, a new Fitscheme has been set up in 2014 for ground-mounted systemsabove 1 Mw. In addition, 400 Mw have been planned and a 4 Gwtender was in preparation in 2017.
In several African countries, the interest for PV is growing, whilethe market has not really taken off yet. At least large-scale plantsare planned in several countries to replace or complementexisting diesel generators, from 1,5 to 155 Mw in size; theseplants are planned or being developed in rwanda, Ghana, Mali,Ivory coast, burkina Faso, cameroon, Gambia, Mauritania, benin,Sierra leone, lesotho and more. Since PV offers access to cheapelectricity, it is highly expected that it will develop in most places,under market conditions which have little in common withdeveloped markets.
IEA-PVPS
tAble 2: 2016 PV MArket StAtIStIcS In detAIl
COUNTRY
AUSTRALIA
AUSTRIA
BELGIUM
CANADA
CHILE
CHINA
DENMARK
FINLAND
FRANCE
GERMANY
ISRAEL
ITALY
JAPAN
KOREA
MALAYSIA
MEXICO
NETHERLANDS
NORWAY
PORTUGAL
SOUTH AFRICA
SPAIN
SWEDEN
SWITZERLAND
THAILAND
TURKEY
USA
TOTAL IEA PVPS COUNTRIES
NON IEA PVPS COUNTRIES
REST OF THE WORLD ESTIMATES
TOTAL
DECENTRALIZED
780
162
173
54
0
4 230
20
16
316
1 225
61
362
4 620
100
64
72
525
10
36
0
35
71
270
0
0
4 169
17 372
GRID-CONNECTED
2016 AnnuAl cAPAcity (Mw)
OFF-GRIDCENTRALIZED
60
7
0
89
495
30 310
51
1
243
251
69
20
3 236
804
8
72
0
0
16
70
2
7
0
1 027
583
10 593
48 013
36
1
0
0
0
10
0
0
0
0
0
0
34
0
0
0
0
1
0
0
20
2
0
0
0
0
105
TOTAL
876
171
173
143
495
34 550
71
17
559
1 476
130
382
7 890
904
72
143
525
11
52
70
58
79
270
1 027
583
14 762
65 489
9 787
450
75 727
DECENTRALIZED
5 360
1 094
2 767
790
0
10 290
666
26
4 573
30 439
529
7 810
29 244
535
328
177
2 042
14
202
0
3 136
181
1 657
0
12
16 017
117 888
GRID-CONNECTED
2016 cuMulAtiVe cAPAcity (Mw)
OFF-GRIDCENTRALIZED
416
7
656
1 872
1 071
67 430
190
1
2 561
10 697
483
11 473
12 635
3 862
8
187
43
0
307
1 030
2 204
12
3
2 412
837
24 419
144 815
209
7
0
61
0
360
3
10
30
50
4
14
161
0
0
25
0
13
8
0
143
13
4
34
0
0
1 150
TOTAL
5 985
1 108
3 423
2 723
1 071
78 080
858
37
7164
41 186
1 016
19 297
42 041
4 397
336
389
2 085
27
517
1 030
5 483
205
1 664
2 446
849
40 436
263 853
35 833
3 709
303 395
SOURCE IeA PVPS & otHerS.
threePOLICY FRAMEWORK
© APere
Figure 13 shows that about only 1% of the world PV market wasdriven by pure self-consumption or the sole competitiveness of PVinstallations in 2016. It also means 99% of the global PV marketdepends either on support schemes or adequate regulatoryframeworks. this number has slightly increased compared to the96% seen in 2014 due to a finer understanding of some regulationsbut as a whole the global PV market remains incentives orregulatory driven. the share of off-grid installations can also beconsidered as part of the competitiveness-driven market.
In 2016 a large part of the market still remained dominated by Fitschemes (59%, down from 63%) granted without a tenderingprocess. If we add 4% of PV installations granted through atendering process, the share of PV installations receiving apredefined tariff for part or all of their production remained stable.Subsidies aiming at reducing the upfront investment (or taxbreaks), used as the main driver for PV development representedaround 22% of the installations, up compared to 2015 due to theUS market growth. Incentivised self-consumption including net-billing and net-metering was the main incentive in 2016 for 10% ofthe world market. Various forms of incentivized self-consumptionschemes exist (and are often called improperly net-metering),such as Italy with the Scambio Sul Posto, Israel, or Germany.Green certificates and similar schemes based on rPS representedonly a minority of the market with 4%.
Historically, the dominance of Fits and direct subsidies is similarbut even more visible in Figure 14.
PV development has been powered by the deployment ofsupport policies, aiming at reducing the gap between PV’s costof electricity and the price of conventional electricity sourcesover the last ten years. These support schemes took variousforms depending on the local specificities and evolved to copewith unexpected market evolution or policy changes.
In 2016, the price of PV systems, as we have seen, and accordinglythe cost of producing electricity from PV (lcoe) continued to dropto levels that are in some countries close or even below the retailprice of electricity (the so-called “grid parity”) or in some casesclose to or below the wholesale price of electricity.
In several countries, the so-called “fuel parity” has been reached.this means that producing electricity with a PV system is now inmost cases cheaper than producing it with a diesel generator,which will have a tremendous impact on the future of PV as anelectricity source for rural electrification.
but PV systems are not yet fully competitive in all markets andsegments and the development of PV still requires adequate supportschemes as well as ad hoc policies with regard to electricity gridsconnections, building use and many others. this chapter focuses onexisting policies and how they have contributed to develop PV. Itpinpoints, as well, local improvements and examines how the PVmarket reacted to these changes.
PV MArket drIVerS
ieA PVPS trendS 2017 In PHotoVoltAIc APPlIcAtIonS
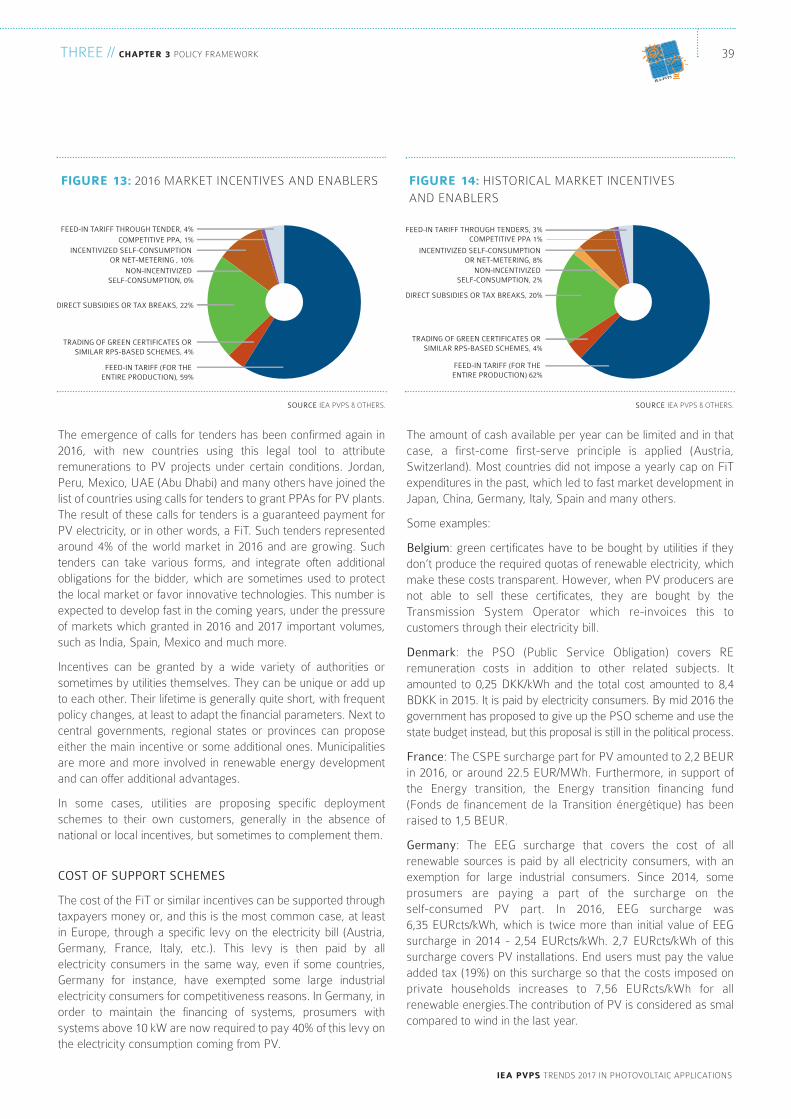
ieA PVPS trendS 2017 In PHotoVoltAIc APPlIcAtIonS
39tHree // chAPter 3 PolIcy FrAMework
IEA-PVPS
the emergence of calls for tenders has been confirmed again in2016, with new countries using this legal tool to attributeremunerations to PV projects under certain conditions. Jordan,Peru, Mexico, UAe (Abu dhabi) and many others have joined thelist of countries using calls for tenders to grant PPAs for PV plants.the result of these calls for tenders is a guaranteed payment forPV electricity, or in other words, a Fit. Such tenders representedaround 4% of the world market in 2016 and are growing. Suchtenders can take various forms, and integrate often additionalobligations for the bidder, which are sometimes used to protectthe local market or favor innovative technologies. this number isexpected to develop fast in the coming years, under the pressureof markets which granted in 2016 and 2017 important volumes,such as India, Spain, Mexico and much more.
Incentives can be granted by a wide variety of authorities orsometimes by utilities themselves. they can be unique or add upto each other. their lifetime is generally quite short, with frequentpolicy changes, at least to adapt the financial parameters. next tocentral governments, regional states or provinces can proposeeither the main incentive or some additional ones. Municipalitiesare more and more involved in renewable energy developmentand can offer additional advantages.
In some cases, utilities are proposing specific deploymentschemes to their own customers, generally in the absence ofnational or local incentives, but sometimes to complement them.
COST OF SUPPORT SCHEMES
the cost of the Fit or similar incentives can be supported throughtaxpayers money or, and this is the most common case, at leastin europe, through a specific levy on the electricity bill (Austria,Germany, France, Italy, etc.). this levy is then paid by allelectricity consumers in the same way, even if some countries,Germany for instance, have exempted some large industrialelectricity consumers for competitiveness reasons. In Germany, inorder to maintain the financing of systems, prosumers withsystems above 10 kw are now required to pay 40% of this levy onthe electricity consumption coming from PV.
the amount of cash available per year can be limited and in thatcase, a first-come first-serve principle is applied (Austria,Switzerland). Most countries did not impose a yearly cap on Fitexpenditures in the past, which led to fast market development inJapan, china, Germany, Italy, Spain and many others.
Some examples:
Belgium: green certificates have to be bought by utilities if theydon’t produce the required quotas of renewable electricity, whichmake these costs transparent. However, when PV producers arenot able to sell these certificates, they are bought by thetransmission System operator which re-invoices this tocustomers through their electricity bill.
Denmark: the PSo (Public Service obligation) covers reremuneration costs in addition to other related subjects. Itamounted to 0,25 dkk/kwh and the total cost amounted to 8,4bdkk in 2015. It is paid by electricity consumers. by mid 2016 thegovernment has proposed to give up the PSo scheme and use thestate budget instead, but this proposal is still in the political process.
France: the cSPe surcharge part for PV amounted to 2,2 beUrin 2016, or around 22.5 eUr/Mwh. Furthermore, in support ofthe energy transition, the energy transition financing fund(Fonds de financement de la transition énergétique) has beenraised to 1,5 beUr.
Germany: the eeG surcharge that covers the cost of allrenewable sources is paid by all electricity consumers, with anexemption for large industrial consumers. Since 2014, someprosumers are paying a part of the surcharge on the self-consumed PV part. In 2016, eeG surcharge was 6,35 eUrcts/kwh, which is twice more than initial value of eeGsurcharge in 2014 - 2,54 eUrcts/kwh. 2,7 eUrcts/kwh of thissurcharge covers PV installations. end users must pay the valueadded tax (19%) on this surcharge so that the costs imposed onprivate households increases to 7,56 eUrcts/kwh for allrenewable energies.the contribution of PV is considered as smalcompared to wind in the last year.
SOURCE IeA PVPS & otHerS.
fiGure 13: 2016 MArket IncentIVeS And enAblerS
TRADING OF GREEN CERTIFICATES OR SIMILAR RPS-BASED SCHEMES, 4%
COMPETITIVE PPA, 1%
FEED-IN TARIFF (FOR THE ENTIRE PRODUCTION), 59%
DIRECT SUBSIDIES OR TAX BREAKS, 22%
NON-INCENTIVIZED SELF-CONSUMPTION, 0%
FEED-IN TARIFF THROUGH TENDER, 4%
INCENTIVIZED SELF-CONSUMPTION OR NET-METERING , 10%
SOURCE IeA PVPS & otHerS.
fiGure 14: HIStorIcAl MArket IncentIVeS
And enAblerS
TRADING OF GREEN CERTIFICATES OR SIMILAR RPS-BASED SCHEMES, 4%
COMPETITIVE PPA 1%FEED-IN TARIFF THROUGH TENDERS, 3%
FEED-IN TARIFF (FOR THE ENTIRE PRODUCTION) 62%
NON-INCENTIVIZED SELF-CONSUMPTION, 2%
DIRECT SUBSIDIES OR TAX BREAKS, 20%
INCENTIVIZED SELF-CONSUMPTION OR NET-METERING, 8%
tHree // chAPter 3 PolIcy FrAMework
ieA PVPS trendS 2017 In PHotoVoltAIc APPlIcAtIonS
40
for the difference of solar resource in its regions: up to 20% morewas paid for northern installations.
Fit can also be granted by utilities themselves (Austria, Swedenand Switzerland), outside of the policy framework as a way toincrease customers’ fidelity.
Automatic or Ad Hoc Adjustment
when the budget available for the Fit payments is not limited,market regulation must come from another control measure. It isassumed that most market booms in countries with unlimited Fitschemes were caused by an imbalance between the level of thetariffs and the declining cost of PV systems. with the rapid pricedecrease of PV systems over the last years, the profitability of PVinvestments grew very quickly when the level of the Fit was notadapted fast enough. this situation caused the market boom inSpain in 2008, in czech republic in 2010, in Italy in 2011 and to acertain extent in china in 2015, 2016 (and 2017). And in manyother countries.
the “corridor” principle has been experimented in Germany since2011 and was effective in 2013. the level of the Fit can beadapted on a monthly basis in order to reduce the profitability ofPV investments if during a reference period (one year), the markethas grown faster than the target decided by the government. thefirst attempt was hardly successful in Germany, with long delaysbetween the Fit updates that allowed PV investment to remainhighly profitable during several months, leading for instance to thetremendous december 2011 market boom where 3 Gw wereinstalled in Germany. In 2016, due to a low market level andunachieved targets, the Fit was not decreased in Germany.
In the last years, other countries adopted the principle ofdecreasing Fit levels over time, with sometimes (France andItaly) a clear pattern for the future. However few countries haveopted for a clear decrease strategy and adapt their Fit on aregular basis, such as Japan or china.
Fit remains a very simple instrument to develop PV, but it needsto be fine-tuned on a regular basis in order to avoid uncontrolledmarket development.
Tendering
calls for tender are another way to grant Fit schemes with anindirect financial cap. this system has been adopted in manycountries around the world, with the clear aim of reducing the costof PV electricity. Since bidders have to compete one with eachother, they tend to reduce the bidding price at the minimumpossible and shrink their margins. this process is currentlyshowing how low the bids can go under the constraint ofcompetitive tenders. Many countries are now using such a way todeploy PV at the lowest possible cost. However, many believesuch low bids are possible with extremely low capital costs, lowcomponents costs and a reduced risk hedging. Since theyrepresented 4% of all PV installations in 2016 (but this shouldincrease in the coming years), it is conceivable that they don’trepresent the fair PV price in all cases but showcases for super-competitive developers.
Italy: around 3,95 eUrcts/kwh are paid by the electricityconsumers in the residential sector at the end of 2016 (includingaround 2 eUrcts/kwh for PV) and smaller amount by others finalelectricity users. the total annual cost amounts to 15,9 beUr forall reS including 6,7 beUr for PV.
Japan: Surcharge to promote renewable energy powergeneration for an household was set at 2,25 JPy/kwh in April2017 and 2,64 JPy/kwh from May 2017 to April 2018. High-volume electricity users such as manufacturers are entitledto reduce the surcharge. the amount of purchased electricitygenerated by PV systems under the FIt program is around 93,7 twh as of the end of december 2016, exceeding 3,8 tJPy in total.
Malaysia: consumers above 300 kwh/month are paying asurcharge for the re Fund that finances the Fit. It representedaround 1,6% of the electricity price paid by retail consumers.
Spain: the surcharge for all renewables accounted for 2,3% of thetotal electricity bill for industrial consumers and 6,5% forhousehold consumers. In 2015, the total amount collected tosupport PV was 2 432 MeUr. In 2016, the remuneration forrenewable energy sources, cHP and waste was 2.3% of the totalelectricity bill for industrial consumers and 6.5% for householdconsumers according to european statistics.
USA: the Itc tax break is borne by the federal budget indirectly(since the budget is not used but it represents rather a decreaseof the potential income from PV development costs). besidefederal benefits, solar project developers can rely on other stateand local incentives, which come in many forms, including — butnot limited to — up-front rebates, performance-based incentives,state tax credits, renewable energy certificate (rec) payments,property tax exemptions, and low-interest loans. Incentives atboth the federal and state levels vary by sector and by whether ornot the systems are utility scale or distributed
FEED-IN TARIFFS
the concept of Fits is quite simple. electricity produced by the PVsystem and injected into the grid is paid at a predefined price andguaranteed during a fixed period. In theory, the price could beindexed on the inflation rate but this is rarely the case. thisassumes that a PV system produces electricity for exporting intothe grid rather than for local consumption. the most successfulexamples of Fit systems can be found in china, Japan, Germanyand Italy (until 2013), to mention a few. the attractiveness of Fithas been slightly reduced but they still drive a large part of the PVmarket. while Fits still represent more than 59% of the 2016 PVmarket, they have lost ground in european countries where theyare mostly constrained.
National or Local
depending on the country specifics, Fit can be defined at nationallevel (china, Japan, Germany, etc.), at a regional level (Australia,canada) with some regions opting for and others not, or withdifferent characteristics. In 2011, the French Fit law introduced ageographical parameter in the Fit level, in order to compensate
PV MArket drIVerS / contInUed
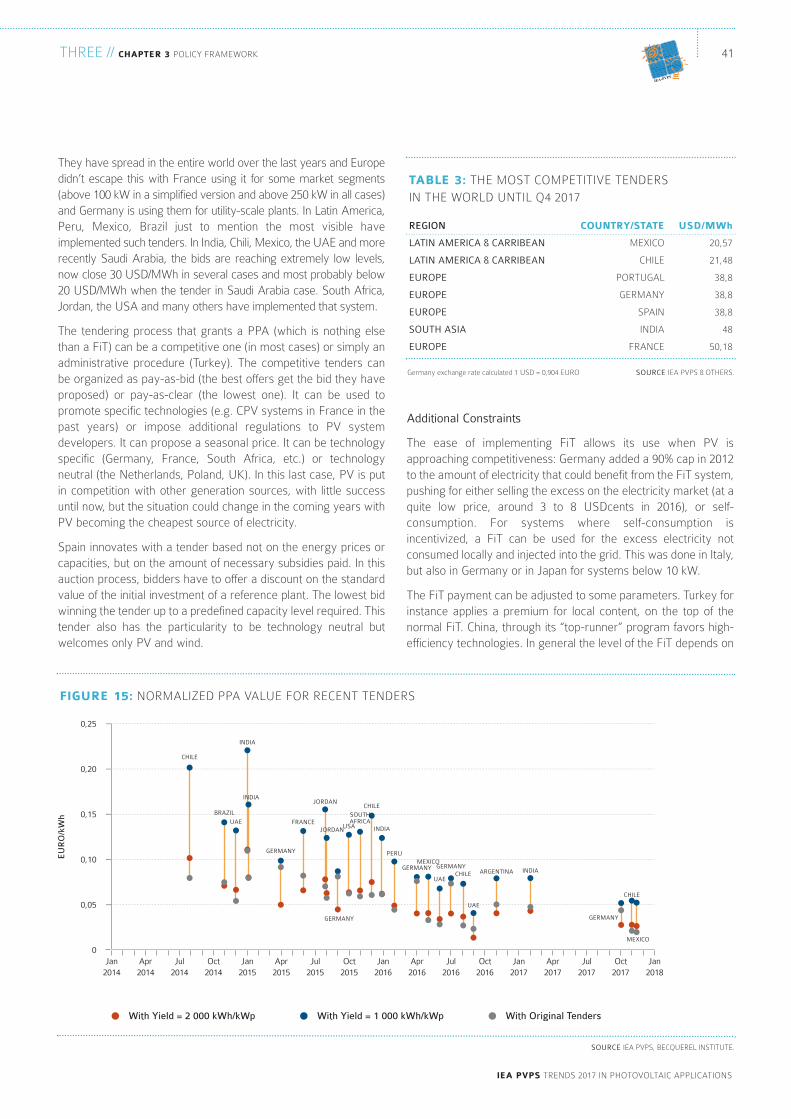
41
ieA PVPS trendS 2017 In PHotoVoltAIc APPlIcAtIonS
tHree // chAPter 3 PolIcy FrAMework
IEA-PVPS
Additional Constraints
the ease of implementing Fit allows its use when PV isapproaching competitiveness: Germany added a 90% cap in 2012to the amount of electricity that could benefit from the Fit system,pushing for either selling the excess on the electricity market (at aquite low price, around 3 to 8 USdcents in 2016), or self-consumption. For systems where self-consumption isincentivized, a Fit can be used for the excess electricity notconsumed locally and injected into the grid. this was done in Italy,but also in Germany or in Japan for systems below 10 kw.
the Fit payment can be adjusted to some parameters. turkey forinstance applies a premium for local content, on the top of thenormal Fit. china, through its “top-runner” program favors high-efficiency technologies. In general the level of the Fit depends on
they have spread in the entire world over the last years and europedidn’t escape this with France using it for some market segments(above 100 kw in a simplified version and above 250 kw in all cases)and Germany is using them for utility-scale plants. In latin America,Peru, Mexico, brazil just to mention the most visible haveimplemented such tenders. In India, chili, Mexico, the UAe and morerecently Saudi Arabia, the bids are reaching extremely low levels,now close 30 USd/Mwh in several cases and most probably below20 USd/Mwh when the tender in Saudi Arabia case. South Africa,Jordan, the USA and many others have implemented that system.
the tendering process that grants a PPA (which is nothing elsethan a Fit) can be a competitive one (in most cases) or simply anadministrative procedure (turkey). the competitive tenders canbe organized as pay-as-bid (the best offers get the bid they haveproposed) or pay-as-clear (the lowest one). It can be used topromote specific technologies (e.g. cPV systems in France in thepast years) or impose additional regulations to PV systemdevelopers. It can propose a seasonal price. It can be technologyspecific (Germany, France, South Africa, etc.) or technologyneutral (the netherlands, Poland, Uk). In this last case, PV is putin competition with other generation sources, with little successuntil now, but the situation could change in the coming years withPV becoming the cheapest source of electricity.
Spain innovates with a tender based not on the energy prices orcapacities, but on the amount of necessary subsidies paid. In thisauction process, bidders have to offer a discount on the standardvalue of the initial investment of a reference plant. the lowest bidwinning the tender up to a predefined capacity level required. thistender also has the particularity to be technology neutral butwelcomes only PV and wind.
SOURCE IeA PVPS & otHerS.Germany exchange rate calculated 1 USd = 0,904 eUro
tAble 3: tHe MoSt coMPetItIVe tenderS
In tHe world UntIl Q4 2017
REGION
LATIN AMERICA & CARRIBEAN
LATIN AMERICA & CARRIBEAN
EUROPE
EUROPE
EUROPE
SOUTH ASIA
EUROPE
country/StAte
MexIco
cHIle
PortUGAl
GerMAny
SPAIn
IndIA
FrAnce
uSd/Mwh
20,57
21,48
38,8
38,8
38,8
48
50,18
SOURCE IeA PVPS, becQUerel InStItUte.
0
0,05
0,10
0,15
0,20
0,25
EU
RO
/kW
h
Jan2014
Apr2014
Jul2014
Oct2014
Jan2015
Apr2015
Jul2015
Oct2015
Jan2016
Apr2016
Jul2016
Oct2016
Jan2017
Apr2017
Jul2017
Oct2017
Jan2018
With Yield = 2 000 kWh/kWp With Yield = 1 000 kWh/kWp With Original Tenders
CHILE
BRAZIL
USA
GERMANY
JORDAN
INDIA
PERU
CHILE
SOUTHAFRICA
GERMANY
JORDANFRANCE
INDIA
UAE
INDIA
MEXICOGERMANY
UAE
GERMANYCHILE ARGENTINA INDIA
GERMANY
CHILE
MEXICO
UAE
fiGure 15: norMAlIzed PPA VAlUe For recent tenderS
the segment but it can also evolve during the lifetime of the plantto follow some key indicators. Fit increasing over time for existingplants have been seen but this remains marginal.
In summary, Fit remains the most popular support scheme for allsizes of grid-tied PV systems; from small household rooftopsapplications to large utility-scale PV systems. the easiness ofimplementation continues to make it the most used regulatoryframework for PV globally.
Feed-in Premium
In several countries, the Fit schemes are being replaced by feed-in premiums. the concept behind the premium is to be paid inaddition to the wholesale electricity market price. Fixed andvariable premiums can be considered. In Germany, the “directmarketing” of solar PV electricity is based on a Feed-in Premium(FiP) that is paid on top of the electricity wholesale market price inorder to allow a remuneration slightly higher than the Fit,including a management premium. In the Uk, the contract fordifference scheme can be seen as a FiP that ensures a constantremuneration by covering the difference between the expectedremuneration and the electricity market price. In china, FiPs arebased on the coal power price.
Private PPAs
while Fit are paid in general by official bodies or utilities, looking forPPAs is compulsory in some countries. In chile, for instance, the PVplants built in the northern desert of Atacama had to find PPAs withlocal industries in order to be beneficial (even if the low prices arenow pushing for PV electricity sold into the electricity market). Suchplants can be considered as really competitive since they rely onPPAs with private companies rather than official Fit schemes.
PV is by nature a technology with limited maintenance costs, nofuel costs but has a high upfront investment need. this has ledsome countries to put policies in place that reduce the up frontinvestment in order to incentivize PV. this took place over theyears in Austria, Australia, belgium, Sweden, Japan, Italy andchina; just mention some of them. these subsidies are, by nature,part of the government expenditures and are limited by theircapacity to free up enough money. the 2017 tender in Spain couldbe considered to a certain extent as an upfront incentive.
off-grid applications can use such financing schemes in an easier way,than for instance Fit that are not adapted to off-grid PV development.
TAX CREDITS
tax credits can be considered in the same way as direct subsidiessince they allow reducing the upfront PV investment. tax creditshave been used in a large variety of countries, ranging fromcanada, the USA, to belgium (until 2011), Switzerland, France,Japan, netherlands and others. Italy uses a tax credit for smallsize plants. the debate was intense in the USA in 2015 whether
or not extending the Itc (Investment tax credit) or to phase it outrapidly. Finally, the decision was taken to continue the currentscheme at least until the end of the decade.
RENEWABLE PORTFOLIO STANDARDS AND GREEN CERTIFICATES
the regulatory approach commonly referred to as “renewablePortfolio Standard” (rPS) aims at promoting the development ofrenewable energy sources by imposing a quota of re sources. theauthorities define a share of electricity to be produced by renewablesources that all utilities have to adopt, either by producingthemselves or by buying specific certificates on the market. whenavailable, these certificates are sometimes called “green certificates”and allow renewable electricity producers to get a variableremuneration for their electricity, based on the market price of thesecertificates. this system exists under various forms. In the USA,some states have defined regulatory targets for reS, in some caseswith PV set-asides. In belgium’s regions, romania and korea, PVreceives a specific number of these green certificates for each Mwhproduced. A multiplier can be used for PV, depending on thesegment and size in order to differentiate the technology from otherrenewables. korea, which used to incentivize PV through a Fitsystem moved to a rPS system in 2012 with a defined quota for PVinstallations. In belgium, all three regions used the trading of greencertificates that comes in addition to other schemes such as net-metering and in the past, direct capital subsidies and tax credits. theregion of brussels has introduced a specific correction factor thatadapts the number of certificates in order to always get the return oninvestment in seven years. romania uses a quota system, too,which however experienced a drop in the value of the greencertificates in 2014. the Uk was still using a system called roc(renewable obligation certificates) for large-scale PV in 2015, but itwas replaced in 2016. It must be noted that Sweden and norwayshare a joint, cross-border, Green electricity certificate system.
Since 2010, the european Union lives under a directive (law) thatimposes on all european countries to produce a certainpercentage of their energy consumption with renewable energysources. this directive, sometimes known as the 20-20-20 (20%reS, 20% less green house gases and 20% energy efficiency)translates into a target of around 35% of electricity coming fromreS sources in 2020, but with differentiated targets for allmember states. It is expected that these targets will be met by2020. this overarching directive does not impose utilities to meetthese targets directly but allows european countries to decide onthe best way to implement the directive and reach the target. thisexplains the variety of schemes existing in europe and the verydifferent official targets that have been defined for PV, dependingon the country. For instance, Germany alone targets 52 Gw of PVinstallations to be reached by the incentives defined in the eeGlaw. In 2014 a new directive defined 2030 objectives but these sofar have not been made compulsory and the impact they will haveon PV development in the coming years is still unknown. therelatively low level of ambition of these targets (27% of renewableenergy by 2030) was heavily criticized and could be revised in thecoming months or years.
tHree // chAPter 3 PolIcy FrAMework
ieA PVPS trendS 2017 In PHotoVoltAIc APPlIcAtIonS
42
PV MArket drIVerS / contInUed
UPFront IncentIVeS
43
ieA PVPS trendS 2017 In PHotoVoltAIc APPlIcAtIonS
tHree // chAPter 3 PolIcy FrAMework
IEA-PVPS
SELF-CONSUMPTION SCHEMES
with around 25% of distributed PV installations in 2016, it seemslogical that a part of the PV future will come from its deploymenton buildings, in order to provide electricity locally. even ifdistributed PV applications are declining for years, the decliningcost of PV electricity puts it in direct competition with retailelectricity provided by utilities through the grid and severalcountries have already adopted schemes allowing localconsumption of electricity. these schemes are often referred to asself-consumption or net-metering schemes.
these schemes simply allow self-produced electricity to reducethe PV system owner’s electricity bill, on site or even betweendistant sites (Mexico, brazil, France). Various schemes exist thatallow compensating electricity consumption and the PV electricityproduction, some compensate real energy flows, while others arecompensating financial flows. while details may vary, the basesare similar.
In order to better compare existing and future self-consumptionschemes, the IeA PVPS published a comprehensive guide toanalyze and compare self-consumption policies. this “review ofPV Self-consumption Policies” proposes a methodology tounderstand, analyze and compare schemes that might befundamentally diverse, sometimes under the same wording. Italso proposes an analysis of the most important elementsimpacting the business models of all stakeholders, from gridoperators to electric utilities.
Self-Consumption
Pure self-consumption exists in several countries and in particularin Germany. For instance, electricity from a PV system can beconsumed by the PV system owner, reducing the electricity bill.the excess electricity can then benefit from the Fit system. Until2012, Germany incentivized self-consumption by granting a bonusabove the retail price of electricity. this bonus was increased oncethe threshold of 30% of self-consumed PV electricity was passed.with the decline of Fit levels, these are now below the price ofretail electricity and the bonus has disappeared. Self-consumptionimplies revenues coming from savings on the electricity bill. theserevenues can be decreased if grid taxes and some levies are to bepaid in any case by the prosumer, on the self-consumedelectricity. even if these measures appear rather unfair forprosumers and tend to show how fierce the opposition fromconventional electricity stakeholders could be, they were appliedin 2015 in some countries, such as Germany, Spain or belgium.
Excess PV Electricity Exported to the Grid
traditional self-consumption systems assume that the electricityproduced by a PV system should be consumed immediately orwithin a 15 minutes timeframe in order to be compensated. thePV electricity not self-consumed is therefore injected into the grid.
Several ways to value this excess electricity exist today:
• the lowest remuneration is 0: excess PV electricity is not paidwhile injected (Spain, thailand pilot project);
CARBON TAXES
Some attempts have been made to impose carbon taxes as a wayto support the development of renewables indirectly by putting anadditional cost on co2 emitting technologies. the most importantregulation has been the emission trading System in europe (etS)which aims at putting a price on the ton of co2. So far it has failedto really incentivized the development of PV or any otherrenewable source because of the low carbon price that came outof the system due to its flaws. whether that system will bereviewed in the coming years is still unknown. carbon pricing wasin effect in Australia from 2011 until 2014. canada is discussing theimplementation of a carbon tax as this publication goes to press.In September 2015, china announced that its own cap-and-tradecarbon program could enter into force in 2017. In general, theconclusion of an agreement during the coP21 in Paris in 2015 hassignalled the start of a potential new era for carbon freetechnologies and the need to accelerate the transition to a carbon-free electricity system. In this respect, PV would greatly benefitfrom a generalized carbon price, pushing co2 emittingtechnologies out of the market.
SUSTAINABLE BUILDING REQUIREMENTS
with around 40% of PV installations occurring on buildings, thebuilding sector has a major role to play in PV development.Sustainable building regulations could become a major incentiveto deploy PV in countries where the competitiveness of PV isclose. these regulations include requirements for new buildingdevelopments (residential and commercial) and also, in somecases, on properties for sale. PV may be included in a suite ofoptions for reducing the energy footprint of the building orspecifically mandated as an inclusion in the building development.
In korea, the nre Mandatory Use for Public buildingsProgramme imposes on new public institution buildings with floorareas exceeding 1 000 square meters to source more than 10% oftheir energy consumption from new and renewable sources. Indenmark, the national building code has integrated PV as a wayto reduce the energy footprint. Spain used to have some specificregulations but they never really succeeded in developing this partof the PV market. In all member states of the european Union, thenew energy Performance in buildings directive (ePbd) willimpose to look for ways to decrease the local energy consumptionin buildings, which could favor decentralized energy sources,among which PV appears to be the most developed one, from2020 onwards.
two concepts should be distinguished here:
• near zero energy buildings (reduced energy consumption butstill a negative balance);
• Positive energy buildings (buildings producing more energythan what they consume).
these concepts will influence the use of PV systems on building ina progressive way, now that competitiveness has improved inmany countries.
ieA PVPS trendS 2017 In PHotoVoltAIc APPlIcAtIonS
tHree // chAPter 3 PolIcy FrAMework 44
• excess electricity gets the electricity market price, with orwithout a bonus (Germany);
• A Fit remunerates the excess electricity (Japan below 10 kw,Germany) at a predefined price. depending on the country, thistariff can be lower or higher than the retail price of electricity.
• Price of retail electricity (net-metering), sometimes withadditional incentives or additional taxes (belgium, USA).
A net-metering system allows such compensation to occur duringa longer period of time, ranging from one month to several years,sometimes with the ability to transfer the surplus of consumptionor production to the next month(s). this system exists in severalcountries and has led to some rapid market development in 2012in denmark and in the netherlands until now. In belgium, thesystem exists for PV installations below 10 kw. In USA, 38 statesplus the district of columbia and Puerto rico have implementednet-metering policies. In 2013, the debate started in the USAabout the impact of net-metering policies on the financing ofutilities, especially vertically integrated distribution actors. theconclusion so far was to either do nothing until the penetration ofPV would reach a certain level (california) or to impose a small fee(Arizona) to be paid by the prosumer. Several emerging PVcountries have implemented net-metering schemes or will do soin 2016 (Israel, Jordan, UAe (dubai) and chile). Portugal is settingup a net-billing scheme.
the main question that developed in 2016 concerns the extension ofself-consumption concepts to distant production and consumptionsites. As already mentioned above, this has been tested in somecountries, while the question of the remuneration of the grid remainscentral. Many start to consider the “virtual self-consumption” or“virtual net-metering” as a way to ease the integration of PV in thedistribution grids, while solving the acute question of the self-consumption ratio in residential and commercial buildings. Given thecomplex questions that such schemes create, especially with regardto the use of the grid, the legal aspects related to compensatingelectricity between several meters and the innovative aspect of thescheme, it is believe it can ease the integration of PV into the energytransformation, support the development of smarter buildings andaccelerate the transition to electric vehicles.
Virtual Self-Consumption
while self-consumption could be understood as the compensation ofproduction and consumption locally, it offers innovative alternativesonce it becomes collective or virtual. collective self-consumptionallows to share electricity between several users, in general behindthe meter. Virtual sel-consumption expands to delocalizedconsumption and production and opens a wide range of possibilitiesinvolving ad hoc grid tariffs. In that respect, prosumers at districtlevel would pay less grid costs that prosumers at regional or nationallevel. Such policies have been tested in some cases in somecountries as seen above but are still considered by manypolicymakers as too innovative. without legislation, utilities canalready propose (as in Austria or Switzerland) innovative productsmixing PV installations, PV investment and virtual storage. thisevolution will be scrutinized in the coming years.
Other Direct Compensation Schemes
while the self-consumption and net-metering schemes are basedon an energy compensation of electricity flows, other systemsexist. Italy, through its Scambio Sul Posto (net-billing scheme),attributes different prices to consumed and the electricity fed intothe grid. In Israel, the net-billing system works on a similar basis.
Grid Costs and Taxes
the opposition from utilities and in some cases grid operators (incountries where the grid operator and the electricity producers andretailers are unbundled as in europe) grew significantly against net-metering schemes. while some argue that the benefits of PV for thegrid and the utilities cover the additional costs, others are pledging inthe opposite direction. In belgium, the attempt of adding a grid tax tomaintain the level of financing of grid operators was stopped by thecourts and then reintroduced. while these taxes were cancelled later,they reveal a concern from grid operators in several countries. InGermany, the debate that started in 2013 about whether prosumersshould pay an additional tax was finally concluded. the eeGsurcharge will be paid partially on self-consumed electricity. In Israel,the net-billing system is accompanied by grid-management fees inorder to compensate the back-up costs and the balancing costs. Ingeneral, several regulators in europe are expected to introducecapacity-based tariffs rather than energy-based tariffs for grid costs.this could change the landscape in which PV is playing for rooftopapplications and delay its competitiveness in some countries.
MARKET BASED INCENTIVES
Most countries analysed here have a functional electricity marketwhere at least a part of the electricity consumed in the country istraded at prices defined by the laws of electricity’s supply anddemand. In order to further integrate PV into the electricity system,Germany set the so-called “market integration model” in 2012.
A limitation at 90% (for systems between 10 kw and 1 Mw) of theamount of PV electricity that can benefit from the Fit scheme hasbeen introduced in Germany in 2012. It has pushed PV systemowners to sell the remaining PV electricity on the market. this canbe done at a fixed monthly price with a premium. In addition, theGerman law allows selling PV electricity directly on the market, withvariable, market-based prices, the same management premium andan additional premium to cover the difference with Fit levels, withthe possibility to go back and forth between the Fit scheme and themarket. At the end of 2016, an average 6 Gw of PV (out of 41 Gwinstalled) were traded on a regular basis on the electricity market.
Market premiums can use existing financial instruments: see theFiP paragraph above. In several countries, it starts to berecognized that the current organization of electricity markets willhave to be revised in depth in order to allow variable renewablesand especially PV to integrate them.
SOFT COSTS
Financial support schemes have not always succeeded in startingthe deployment of PV in a country. Several examples of well-
UPFront IncentIVeS / contInUed
ieA PVPS trendS 2017 In PHotoVoltAIc APPlIcAtIonS
45tHree // chAPter 3 PolIcy FrAMework
IEA-PVPS
In the current stage of development, electricity storage remains tobe incentivized to develop. while some iconic actors areproposing trendy batteries, the real market remains morecomplex and largely uncompetitive without financial support.
In Germany, since 2013, the kfw is running a market stimulationprogram to boost the installation of local stationary storagesystems in conjunction with small PV systems below 30 kwp.
Some US states have developed programs for storagedevelopment. In particular, california has introduced the Self-Generation Incentive Program that offers rebates for“advanced energy storage”. these incentives varies between 0,32 and 0,45 USd/wh. the current Hawaiian self-consumptionprogram provides a self-supply option, where PV owners can gainpreferential permitting treatment by consuming all PV onsite. In thiscase no value is given to exported generation. In the Frenchoverseas’ departments (including corsica), a call for tenders for 50Mw of PV systems above 100 kw with storage has been setproposed in 2015, aiming at increasing the grid stability. In Japan,demo projects have been started on the grid as well. Projects toinstall storage batteries are also increasing but they are limited bysubsidies since the cost remains high. Storage batteries forresidential applications are part of a subsidy program to acceleratethe development of net zero energy houses. For this subsidyprogram, five rounds of public invitation were carried out, whichreceived 6 368 applications in total. other subsidy for storagebatteries are available in Japan. In Australia, storage incentiveswere offered by the city of Adelaide and the city of Melbourne in2015. the city of Adelaide provides 50% of the cost of batteries upto a value of AUd 5 000, plus up to a further AUd 5 000 for 20% ofthe price of a PV system. Many other countries are incentivizingbattery storage. However the trend is not clear yet whether batterystorage will be supported for improving local self-consumption or toreduce the pressure on weak grids. the benefits of energy storageat system level appear clearly, for stability and generationadequacy. but at consumer level, stationary batteries enter in directcompetition with advanced virtual self-consumption systems butalso electric vehicles. Few (or no) countries propose today a clearvision of the future integration of decentralized storage in futureelectricity grids, taking into account electric mobility, electrificationof heating and cooling and the possibilities that digitalization offersto implement innovative business models for self-consumption.
designed Fit systems have been proven unsuccessful because ofinadequate and costly administrative barriers. Progress has beennoted in most countries in the last years, with a streamlining ofpermit procedures, with various outcomes. the lead time couldnot only be an obstacle to fast PV development but also a risk oftoo high incentives, kept at a high level to compensate for legaland administrative costs.
Soft costs remain high in several countries but prices have started togo down in some key markets, such as Japan or the USA. In thesetwo markets for instance, system prices for residential systemscontinue to be significantly higher than prices in key europeanmarkets. while the reason could be that installers adapt to the existingincentives, it seems to be more a combination of various reasonsexplaining why final system prices are not converging faster in somekey markets. Moreover, it seems that additional regulations in somecountries have a tendency to increase the soft costs compared to thebest cases. this will have to be scrutinized in the coming years toavoid eating up the gains from components price decrease.
INNOVATIVE BUSINESS MODELS
Until recently, a large part of the PV market was based on traditionalbusiness models based on the ownership of the PV plant. For rooftopapplications, it was rather obvious that the PV system owner was theowner of the building. but the high upfront capacity requirements arepushing different business models to develop, especially in the USA,and to a certain extent in some european countries. PV-as-a-servicecontributes significantly to the residential US market for instance,with the idea that PV could be sold as a service contract, not implyingthe ownership or the financing of the installation. these businessmodels could deeply transform the PV sector in the coming years,with their ability to include PV in long term contracts, reducing theuncertainty for the contractor. Such business models representalready more than 50% of the residential market in the USA, andsome German, Austrian, Swiss and Swedish utilities are starting topropose them, as we will see below. However, the US case isinnovative by the existence of pure-players proposing PV (such asSolarcity, Vivint…) as their main product. Since it solves manyquestions related to the financing, the operations and reduces theuncertainty on the long term for the prosumer, it is possible that suchservices will develop in a near future, as the necessarydevelopments that will push the distributed PV market up.
GRID INTEGRATION
with the share of PV electricity growing in the electricity system ofseveral countries, the question of the integration to the electricitygrid became more acute. In china, the adequacy of the grid remainsone important question that pushed the government to favour morethe development of decentralized PV in the future rather than largeutility-scale power plants. In europe or Australia, specific grid codeshave been adapted for PV and more will come. In Mexico, specificgrid requirements have in some cases be imposed to bidders intendering processes. In any case, grid integration policies willbecome an important subject in the coming years, with the need toregulate PV installations in densely equipped areas.
electrIcIty StorAGe
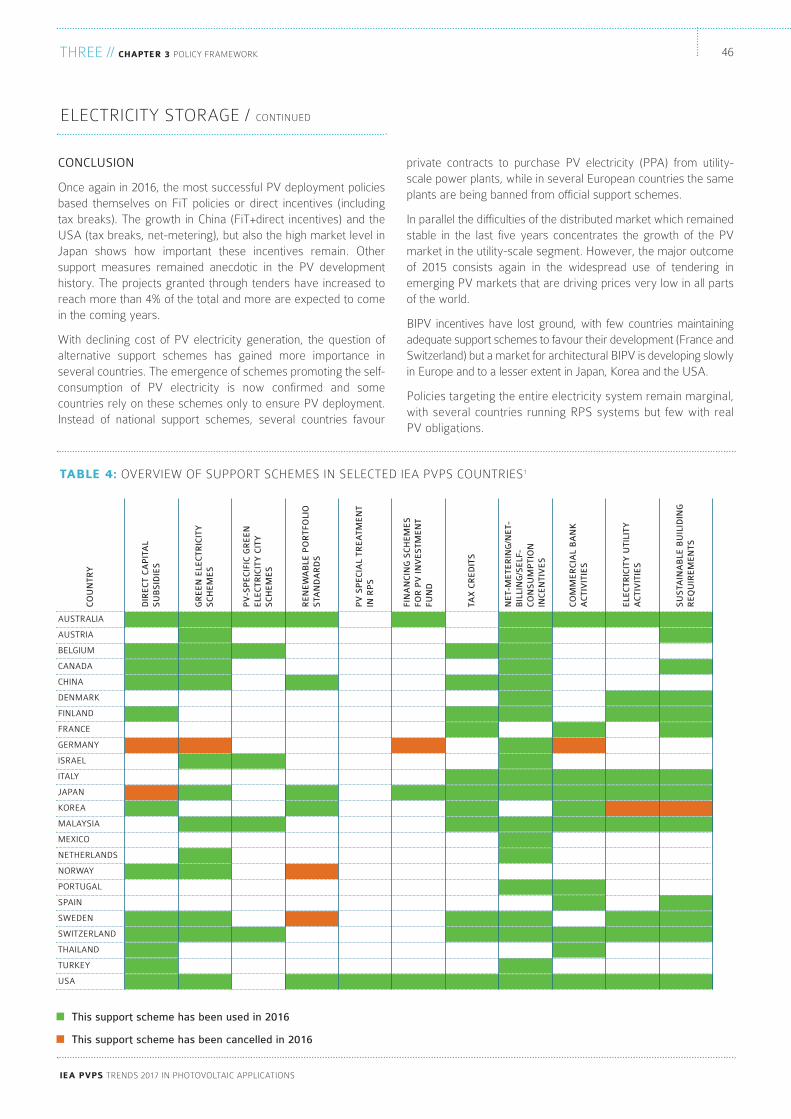
CONCLUSION
once again in 2016, the most successful PV deployment policiesbased themselves on Fit policies or direct incentives (includingtax breaks). the growth in china (Fit+direct incentives) and theUSA (tax breaks, net-metering), but also the high market level inJapan shows how important these incentives remain. othersupport measures remained anecdotic in the PV developmenthistory. the projects granted through tenders have increased toreach more than 4% of the total and more are expected to comein the coming years.
with declining cost of PV electricity generation, the question ofalternative support schemes has gained more importance inseveral countries. the emergence of schemes promoting the self-consumption of PV electricity is now confirmed and somecountries rely on these schemes only to ensure PV deployment.Instead of national support schemes, several countries favour
private contracts to purchase PV electricity (PPA) from utility-scale power plants, while in several european countries the sameplants are being banned from official support schemes.
In parallel the difficulties of the distributed market which remainedstable in the last five years concentrates the growth of the PVmarket in the utility-scale segment. However, the major outcomeof 2015 consists again in the widespread use of tendering inemerging PV markets that are driving prices very low in all partsof the world.
bIPV incentives have lost ground, with few countries maintainingadequate support schemes to favour their development (France andSwitzerland) but a market for architectural bIPV is developing slowlyin europe and to a lesser extent in Japan, korea and the USA.
Policies targeting the entire electricity system remain marginal,with several countries running rPS systems but few with realPV obligations.
tHree // chAPter 3 PolIcy FrAMework
ieA PVPS trendS 2017 In PHotoVoltAIc APPlIcAtIonS
46
electrIcIty StorAGe / contInUed
tAble 4: oVerVIew oF SUPPort ScHeMeS In Selected IeA PVPS coUntrIeS1
COUNTR
Y
DIRECT CAPITAL
SUBSIDIES
GREEN ELE
CTR
ICITY
SCHEMES
PV-SPECIFIC GREEN
ELE
CTR
ICITY CITY
SCHEMES
RENEWABLE
PORTF
OLIO
STA
NDARDS
PV SPECIAL TR
EATM
ENT
IN RPS
FINANCING SCHEMES
FOR PV INVESTM
ENT
FUND
TAX CREDITS
NET-METE
RING/N
ET-
BILLING/SELF
-CONSUMPTION
INCENTIVES
COMMERCIAL BANK
ACTIVITIES
ELE
CTR
ICITY U
TILITY
ACTIVITIES
SUSTA
INABLE
BUILIDING
REQUIREMENTS
AUSTRALIA
AUSTRIA
BELGIUM
CANADA
CHINA
DENMARK
FINLAND
FRANCE
GERMANY
ISRAEL
ITALY
JAPAN
KOREA
MALAYSIA
MEXICO
NETHERLANDS
NORWAY
PORTUGAL
SPAIN
SWEDEN
SWITZERLAND
THAILAND
TURKEY
USA
This support scheme has been used in 2016
This support scheme has been cancelled in 2016
ieA PVPS trendS 2017 In PHotoVoltAIc APPlIcAtIonS
trade conflicts in some regions continued to affect the strategiesof PV manufacturing sites. Major PV module manufacturersstarted production outside of china, mainly in countries such asMalaysia, thailand and Vietnam. Under this circumstance, theacceleration of the downstream business continued throughoutthe year, powered by lowered prices.
this section reviews some trends of value chain of crystalline silicontechnology and thin-film PV technologies. while PV system consistsof various steps and materials as shown in Figure 16, this sectionfocuses on the key trends of polysilicon, ingot/wafer/cells and PVmodules (crystalline silicon and thin film PV) as well as inverters.
Polysilicon Production
wafer-based crystalline silicon technology remains dominant forproducing PV cells. In that respect, this section focuses on thewafer-based production pathway. Although some IeA PVPScountries reported production of feedstock, ingots and wafers, thepictures from the national Survey reports of these sections of thePV industry supply chain are not complete and consequently thissection provides more background information on the upstreampart of the PV value chain thanks to additional information.1
It is estimated that polysilicon production for solar cells increased from 310 000 tons in 2015 to 360 000 tons in 2016.
This chapter provides a brief overview of the upstream part ofthe PV manufacturing industry. It is involved in the production ofPV materials (feedstock, ingots, blocks/bricks and wafers), PVcells, PV modules and balance-of-system (BOS) components(inverters, mounting structures, charge regulators, storagebatteries, appliances, etc.). The downstream part of the PVsector during 2016, including development and maintenance isalso briefly presented. This chapter is intending to provide asummarized overview of the PV industry: more detailedinformation on the PV industry in each IEA PVPS membercountry can be found in the relevant National Survey Reports.
A national overview of PV material production and cell/modulemanufacturing in the IeA PVPS countries during 2016 is presentedin Annex 3 and is directly based on the information provided in thenational Survey reports of IeA PVPS member countries.
As presented above in this report, the global PV installed capacityreached 76 Gw in 2016 achieving a 50% year on year growth. theproduction of polysilicon, ingots, wafers PV cells and modules alsoincreased to record levels. the chinese market influenced the entireglobal PV production in a sharper way than the previous year(s). In2016, the first half of the year was extremely bullish with more than20 Gw of PV systems newly installed in china due to a rush forsecuring the higher FIt level granted until the end of June. the samerush was visible in the first months of 2017 and will lead to the sameresults. the third quarter in china in 2016 remained sluggish andsome further PV module price decrease was observed, bringingmodule prices to new unseen lows and putting the pressure on theentire industry. the market prices of silicon feedstock, PV cells andmodules continued to be on declining trends in 2016. this resulted ina new significant reduction of the initial cost of PV systems.
fourTRENDS IN THE PV INDUSTRY
© Vitronic, wiesbaden
tHe UPStreAM PV Sector
(MAnUFActUrerS)
footnote 1 Source: rtS corporation from Japan.
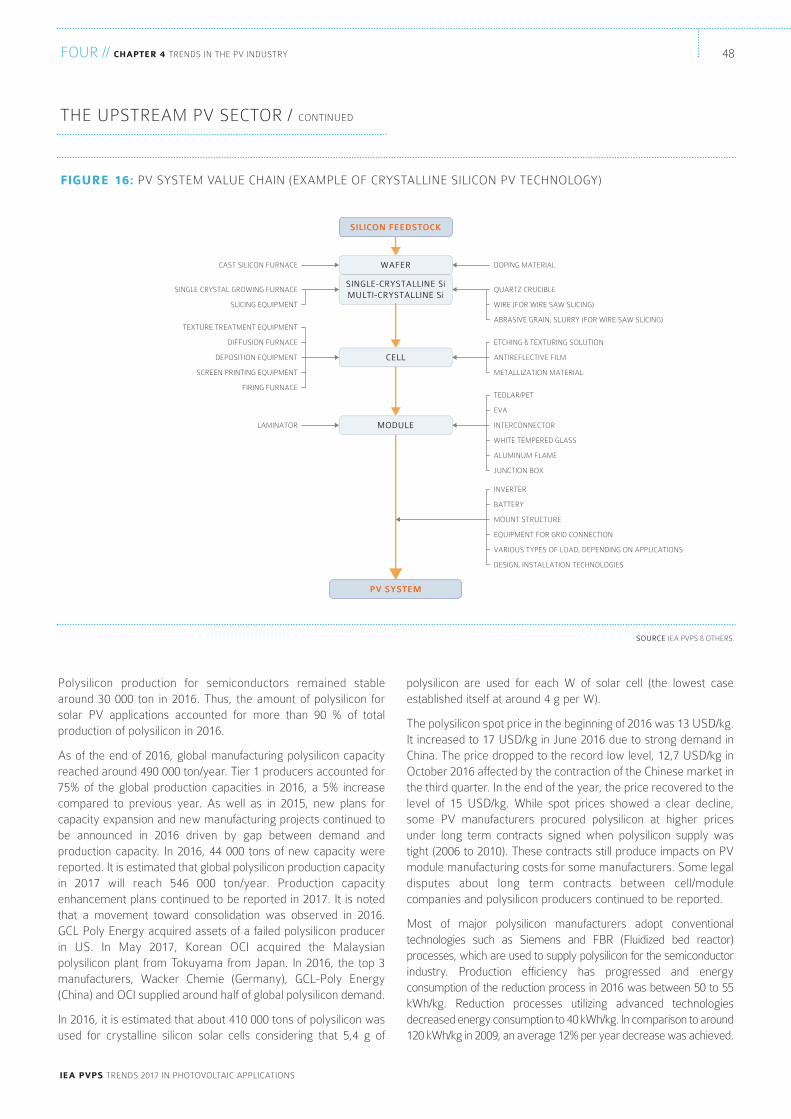
ieA PVPS trendS 2017 In PHotoVoltAIc APPlIcAtIonS
polysilicon are used for each w of solar cell (the lowest caseestablished itself at around 4 g per w).
the polysilicon spot price in the beginning of 2016 was 13 USd/kg.It increased to 17 USd/kg in June 2016 due to strong demand inchina. the price dropped to the record low level, 12,7 USd/kg inoctober 2016 affected by the contraction of the chinese market inthe third quarter. In the end of the year, the price recovered to thelevel of 15 USd/kg. while spot prices showed a clear decline,some PV manufacturers procured polysilicon at higher pricesunder long term contracts signed when polysilicon supply wastight (2006 to 2010). these contracts still produce impacts on PVmodule manufacturing costs for some manufacturers. Some legaldisputes about long term contracts between cell/modulecompanies and polysilicon producers continued to be reported.
Most of major polysilicon manufacturers adopt conventionaltechnologies such as Siemens and Fbr (Fluidized bed reactor)processes, which are used to supply polysilicon for the semiconductorindustry. Production efficiency has progressed and energyconsumption of the reduction process in 2016 was between 50 to 55kwh/kg. reduction processes utilizing advanced technologiesdecreased energy consumption to 40 kwh/kg. In comparison to around120 kwh/kg in 2009, an average 12% per year decrease was achieved.
Polysilicon production for semiconductors remained stablearound 30 000 ton in 2016. thus, the amount of polysilicon forsolar PV applications accounted for more than 90 % of totalproduction of polysilicon in 2016.
As of the end of 2016, global manufacturing polysilicon capacityreached around 490 000 ton/year. tier 1 producers accounted for75% of the global production capacities in 2016, a 5% increasecompared to previous year. As well as in 2015, new plans forcapacity expansion and new manufacturing projects continued tobe announced in 2016 driven by gap between demand andproduction capacity. In 2016, 44 000 tons of new capacity werereported. It is estimated that global polysilicon production capacityin 2017 will reach 546 000 ton/year. Production capacityenhancement plans continued to be reported in 2017. It is notedthat a movement toward consolidation was observed in 2016.Gcl Poly energy acquired assets of a failed polysilicon producerin US. In May 2017, korean ocI acquired the Malaysianpolysilicon plant from tokuyama from Japan. In 2016, the top 3manufacturers, wacker chemie (Germany), Gcl-Poly energy(china) and ocI supplied around half of global polysilicon demand.
In 2016, it is estimated that about 410 000 tons of polysilicon wasused for crystalline silicon solar cells considering that 5,4 g of
SOURCE IeA PVPS & otHerS.
fiGure 16: PV SySteM VAlUe cHAIn (exAMPle oF cryStAllIne SIlIcon PV tecHnoloGy)
DOPING MATERIALCAST SILICON FURNACE
SINGLE CRYSTAL GROWING FURNACE
SLICING EQUIPMENT
TEXTURE TREATMENT EQUIPMENT
DIFFUSION FURNACE
DEPOSITION EQUIPMENT
SCREEN PRINTING EQUIPMENT
FIRING FURNACE
LAMINATOR
QUARTZ CRUCIBLE
WIRE (FOR WIRE SAW SLICING)
ABRASIVE GRAIN, SLURRY (FOR WIRE SAW SLICING)
ETCHING & TEXTURING SOLUTION
ANTIREFLECTIVE FILM
METALLIZATION MATERIAL
TEDLAR/PET
EVA
INTERCONNECTOR
WHITE TEMPERED GLASS
ALUMINUM FLAME
JUNCTION BOX
INVERTER
BATTERY
MOUNT STRUCTURE
EQUIPMENT FOR GRID CONNECTION
VARIOUS TYPES OF LOAD, DEPENDING ON APPLICATIONS
DESIGN, INSTALLATION TECHNOLOGIES
WAFER
SILICON FEEDSTOCK
PV SYSTEM
SINGLE-CRYSTALLINE SiMULTI-CRYSTALLINE Si
CELL
MODULE
FoUr // chAPter 4 trendS In tHe PV IndUStry 48
tHe UPStreAM PV Sector / contInUed
ieA PVPS trendS 2017 In PHotoVoltAIc APPlIcAtIonS
49FoUr // chAPter 4 trendS In tHe PV IndUStry
IEA-PVPS
the Fbr process requires less electricity than the Siemensprocess and produce granular polysilicon that can be efficientlypacked in the crucibles with polysilicon blocks. to reach a costadvantage, some of the major companies are planning to enhancetheir capacities with the Fbr process. Another lower cost processis the metallurgical process that directly enables to produce frommetallic silicon. Silicor Materials, USA announced it concludedfinancing for constructing a 19,000 ton/year plant withmetallurgical process in Iceland.
As well as in the previous year, the major polysilicon producingcountries among IeA PVPS countries were china, Germany,South korea, USA, Japan, Malaysia and norway in 2016. chinacontinued to be the largest producer and consumer of polysiliconin the world. china reported that it produced 194 000 tons ofpolysilicon with 210 000 ton/year of production capacity, a 17,6%increase over the 165 000 tons from 2015, accounting for about anhalf of the total global production. china reported that it consumed330 000 tons of polysilicon for solar cells and imported around 136 000 tons of polysilicon produced outside of china, mainly fromGermany, korea and Malaysia where anti-dumping duties thegovernment imposes are free or lower. the largest producer inchina was Gcl-Poly energy (Jiangsu zhongneng Polysilicontechnology development). it possesses a 75 000 ton/yearcapacity and produced 69 345 tons in 2016. Second largestproducer, tbeA Solar produced 22 800 tons. the main othermajor manufacturers in china are china Silicon and daqo newenergy. the pressure on the price of polysilicon observed in thefourth quarter lead to a restart of operation of the polysiliconplants in china. It is reported that the number of chinesepolysilicon producers in operation increased from 13 companies in2015 to 17 companies in 2016.
South korea reported 82 000 ton/year of production capacity in2016. the largest producer ocI obtained the Malaysianpolysilicon plant from tokuyama of Japan in May 2017 and its total production capacity home and abroad reached 80 000 tons/year. It produced 60 000 tons of polysilicon in 2016.other reported korean producers are Hanwha chemical,Hankook Silicon and SMP (Joint venture of lotte Fine chemicaland Gcl-Poly energy of china).
Germany has more than 60 000 ton/year of domestic polysiliconmanufacturing capacity. wacker chemie has 80 000 ton/year ofproduction capacity in Germany and USA. It is estimated thatwacker shipped more than 70 000 tons in 2016 and the companyreached the number 1 position as polysilicon producer in theworld in 2016.
the USA increased their polysilicon manufacturing capacity at 90 000 ton/year including a plant in tennessee operated by wackerchemie, Germany. other major US manufacturers are HemlockSemiconductor and rec Silicon. Sunedison filed for bankruptcy inApril 2016 and sold its polysilicon assets to Gcl-Poly energy of china.the polysilicon production in the USA showed a further decrease in2016 from 34 853 tons in 2015 to 29 624 due to Anti-dumping duties(Ads) imposed in china and the bankruptcy of Sun edison.
In Japan, tokuyama produced 16 300 tons of polysilicon in Japanand Malaysia including the production for semiconductors. thecompany sold its Malaysian polysilicon plant with 20 000 ton/yearcapacity to ocI, korea as mentioned above. canada, the USA andnorway reported activities of polysilicon producers working onmetallurgical process aiming at lowering the production cost.Silicor Materials in USA owns a plant in canada and is building amanufacturing one in Iceland. elkem Solar in norway produced 6 500 tons of polysilicon in 2016 as well as in 2015.
Ingot & Wafer
to produce single-crystalline silicon (sc-Si) ingots (also known asmono-crystalline) or multi-crystalline silicon (mc-Si) ingots, thebasic input material consists of highly purified polysilicon. theingots need to be cut into bricks or blocks and then sawn into thinwafers. conventional silicon ingots are of two types: Single-crystalline and multi-crystalline. the first type, although withdifferent specifications regarding purity and specific dopants, isalso produced for microelectronics applications, while mc-Siingots are only used in the PV industry.
Ingot producers are in many cases producers of wafers. Inaddition to major ingot/wafer manufacturers, some PV modulesmanufacturers such as Jinko Solar (china), JA solar (china), yingliGreen energy (china), rec Solar (Singapore), Solarworld(Germany), Panasonic (Japan), kyocera (Japan) and more alsomanufacture silicon ingots and wafers for their in-house uses. thissituation makes it difficult to track down the entire picture of ingotsand wafers production. due to the cost pressure, some of themajor PV module manufacturers that established verticallyintegrated manufacturing are now procuring wafers fromspecialized manufacturers because of cost and qualityadvantages. In 2016, it is estimated that over 75 Gw of crystallinesilicon wafers were produced. the total global wafermanufacturing capacity was estimated to be around 100 Gw/yearat the end of the year 2016.
In 2016, china produced 64,8 Gw of solar wafers, achieving a 86%share in the global wafers production. china increased its productioncapacity of wafer from 64,3 Gw/year in 2015 to 81,9 Gw/year in 2016. As during the previous year, Gcl-Poly energy was thelargest producer in china (and globally) and it produced 17,33 Gwwith 20 Gw/year of manufacturing capacity in 2016.
compared to china, the manufacturing capacities in other IeAPVPS countries remain small: korea (2,38 Gw/year), Japan (> 1,2 Gw/year). Malaysia, norway and the USA also reportedsome ingots/wafers manufacturing activities. outside IeA PVPScountries, the chinese taipei/taiwan island remains a major actorfor solar wafers production. Around 10 companies including solarcell manufacturers have more than 6,5 Gw of yearly productioncapacity in total. the norwegian company, rec Solar producessolar wafers for its own use in its Singaporean factory with about1 Gw of annual capacity.
the mc-Si wafers spot price continued to decline until the thirdquarter in 2016 and then showed a slight recovery in the fourthquarter of the same year. reported price in the beginning and end
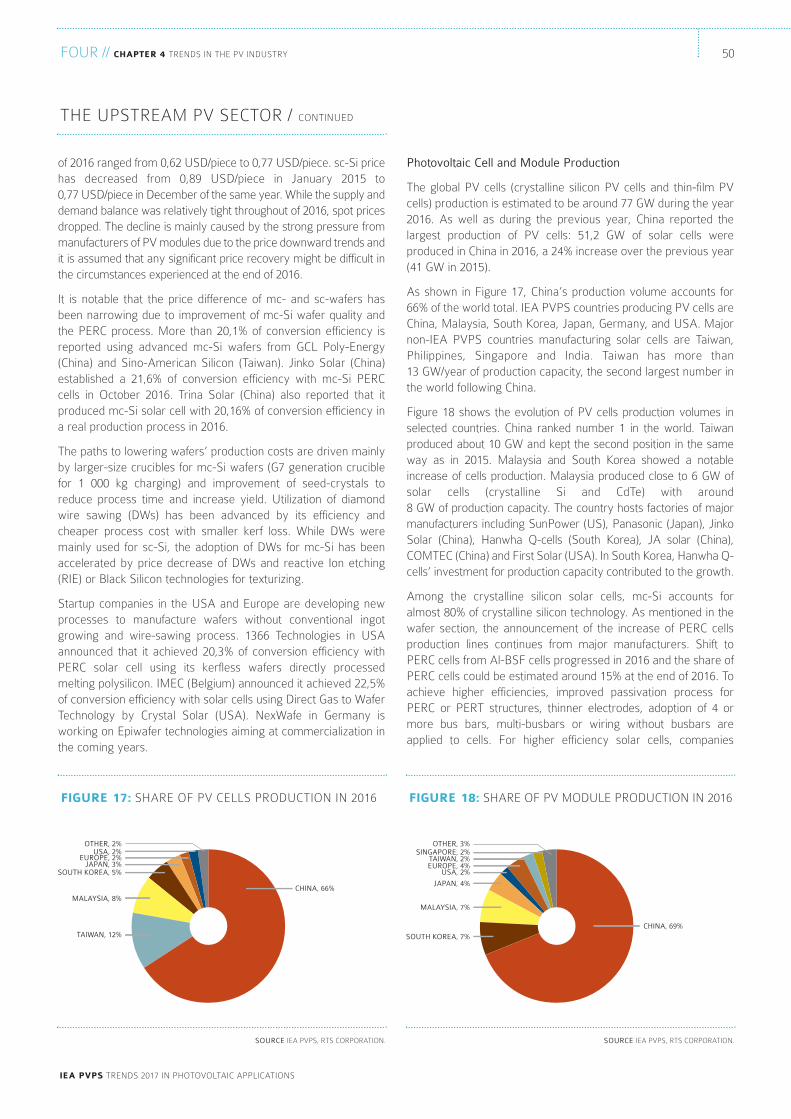
ieA PVPS trendS 2017 In PHotoVoltAIc APPlIcAtIonS
FoUr // chAPter 4 trendS In tHe PV IndUStry 50
Photovoltaic Cell and Module Production
the global PV cells (crystalline silicon PV cells and thin-film PVcells) production is estimated to be around 77 Gw during the year2016. As well as during the previous year, china reported thelargest production of PV cells: 51,2 Gw of solar cells wereproduced in china in 2016, a 24% increase over the previous year(41 Gw in 2015).
As shown in Figure 17, china’s production volume accounts for66% of the world total. IeA PVPS countries producing PV cells arechina, Malaysia, South korea, Japan, Germany, and USA. Majornon-IeA PVPS countries manufacturing solar cells are taiwan,Philippines, Singapore and India. taiwan has more than 13 Gw/year of production capacity, the second largest number inthe world following china.
Figure 18 shows the evolution of PV cells production volumes inselected countries. china ranked number 1 in the world. taiwanproduced about 10 Gw and kept the second position in the sameway as in 2015. Malaysia and South korea showed a notableincrease of cells production. Malaysia produced close to 6 Gw ofsolar cells (crystalline Si and cdte) with around 8 Gw of production capacity. the country hosts factories of majormanufacturers including SunPower (US), Panasonic (Japan), JinkoSolar (china), Hanwha Q-cells (South korea), JA solar (china),coMtec (china) and First Solar (USA). In South korea, Hanwha Q-cells’ investment for production capacity contributed to the growth.
Among the crystalline silicon solar cells, mc-Si accounts foralmost 80% of crystalline silicon technology. As mentioned in thewafer section, the announcement of the increase of Perc cellsproduction lines continues from major manufacturers. Shift toPerc cells from Al-bSF cells progressed in 2016 and the share ofPerc cells could be estimated around 15% at the end of 2016. toachieve higher efficiencies, improved passivation process forPerc or Pert structures, thinner electrodes, adoption of 4 ormore bus bars, multi-busbars or wiring without busbars areapplied to cells. For higher efficiency solar cells, companies
of 2016 ranged from 0,62 USd/piece to 0,77 USd/piece. sc-Si pricehas decreased from 0,89 USd/piece in January 2015 to 0,77 USd/piece in december of the same year. while the supply anddemand balance was relatively tight throughout of 2016, spot pricesdropped. the decline is mainly caused by the strong pressure frommanufacturers of PV modules due to the price downward trends andit is assumed that any significant price recovery might be difficult inthe circumstances experienced at the end of 2016.
It is notable that the price difference of mc- and sc-wafers hasbeen narrowing due to improvement of mc-Si wafer quality andthe Perc process. More than 20,1% of conversion efficiency isreported using advanced mc-Si wafers from Gcl Poly-energy(china) and Sino-American Silicon (taiwan). Jinko Solar (china)established a 21,6% of conversion efficiency with mc-Si Perccells in october 2016. trina Solar (china) also reported that itproduced mc-Si solar cell with 20,16% of conversion efficiency ina real production process in 2016.
the paths to lowering wafers’ production costs are driven mainlyby larger-size crucibles for mc-Si wafers (G7 generation cruciblefor 1 000 kg charging) and improvement of seed-crystals toreduce process time and increase yield. Utilization of diamondwire sawing (dws) has been advanced by its efficiency andcheaper process cost with smaller kerf loss. while dws weremainly used for sc-Si, the adoption of dws for mc-Si has beenaccelerated by price decrease of dws and reactive Ion etching(rIe) or black Silicon technologies for texturizing.
Startup companies in the USA and europe are developing newprocesses to manufacture wafers without conventional ingotgrowing and wire-sawing process. 1366 technologies in USAannounced that it achieved 20,3% of conversion efficiency withPerc solar cell using its kerfless wafers directly processedmelting polysilicon. IMec (belgium) announced it achieved 22,5%of conversion efficiency with solar cells using direct Gas to wafertechnology by crystal Solar (USA). nexwafe in Germany isworking on epiwafer technologies aiming at commercialization inthe coming years.
tHe UPStreAM PV Sector / contInUed
SOURCE IeA PVPS, rtS corPorAtIon.
fiGure 17: SHAre oF PV cellS ProdUctIon In 2016
CHINA, 66%MALAYSIA, 8%
TAIWAN, 12%
SOUTH KOREA, 5%JAPAN, 3%
EUROPE, 2%USA, 2%
OTHER, 2%
SOURCE IeA PVPS, rtS corPorAtIon.
fiGure 18: SHAre oF PV ModUle ProdUctIon In 2016
CHINA, 69%
SOUTH KOREA, 7%
MALAYSIA, 7%
JAPAN, 4%
USA, 2%EUROPE, 4%TAIWAN, 2%
SINGAPORE, 2%OTHER, 3%
51
ieA PVPS trendS 2017 In PHotoVoltAIc APPlIcAtIonS
FoUr // chAPter 4 trendS In tHe PV IndUStry
IEA-PVPS
(cPIA), china’s domestic PV modules production capacityincreased from 69 Gw/year in 2015 to 79 Gw/year in 2016. theutilization rate in 2016 was 73% and increased by 6% from theprevious year. Utilization of PV modules capacity showed someimprovement. Most of tier 1 PV modules manufacturers haveplans for manufacturing capacity enhancement as they foreseefurther growth in the global PV market. the enhancement ofmanufacturing capacities is not only achieved by building newfactories but also by the acquisition of closed factories or theestablishment of joint ventures with other companies. theincrease in capacities is also coming marginally from the increaseof efficiencies but this plays a minor role.
It is estimated that 4,9 Gw of thin film PV modules were producedin 2016, accounting for 6% of total PV modules production (seeFigure 17). thin-film PV modules are mainly produced inMalaysia, Japan, USA, Germany and Italy as it was the caseduring the previous year. the largest thin-film producer remainsFirst Solar of USA. the company produced 3 Gw of cdte thin-film PV modules in its factories in the USA and Malaysia in2016. It ranked seventh in the global PV module production. It isnotable that conversion efficiencies of cdte PV modules has beenimproved. the company achieved 22,1% of conversion efficiencywith its laboratory made module. the second largest thin-film PVmanufacturer is Solar Frontier of Japan. It produced 910 Mw ofcIS modules in 2016. other thin-film manufacturing activities werereported from Germany, Italy, china and thailand, whileproduction volumes remained relatively small.
As well as previous years, efforts on r&d and commercializationof cIGS PV modules are continuously reported in a number of IeAPVPS member countries aiming at higher conversion efficiencies,higher throughput and larger sizes. to compete with crystallinesilicon technology, First Solar decided to introduce large-size cdtemodules earlier than originally planned. Flexible or light-weightPV modules are also part of r&d efforts. bIPV applications areexpected to become a major market for flexible PV modules.Some thin-film PV modules manufacturers shifted to HeteroJunction crystalline Silicon solar cell utilizing their thin-film silicontechnology. Japan’s kaneka is one of the example and 3SUn, anItalian thin-film PV modules manufacturer also announced theirbusiness plan to produce HJt cell. Hevel Solar, a russiancompany also announced its plan for HJt cells production.
In 2016, activities on concentrator PV (cPV) cells/ modules werereported by several IeA PVPS member countries. this techniqueis mainly based on specific high-efficiency multi-junction PV cellsusing group III-V materials, such as GaAs, InP, etc. Germany,USA, France, Japan and Spain are active in r&d of these highefficiency solar cells. while conversion efficiency of cPV moduleshas been improving, cPV system seems to less cost competitiveand have difficulties competing with conventional PV systems.because of the withdrawal of several cPV companies from thebusiness, most activities related to cPV technologies shifted backto r&d and demonstrators.
continued to invest in r&d. In 2016, kaneka from Japan achieveda record efficiency for n-type sc-Si cell: 26,33% withheterojunction and back-contact technologies.
Global PV modules production (crystalline silicon PV and thin-filmPV) is estimated around 80 Gw in 2016. More than 90% of PVmodules were produced in IeA PVPS member countries. As shownin Figure 15, china is the largest producing country with 53,7 Gw ofPV modules produced in 2016, accounting for 69% of global PVmodule production. Following china, South korea and Malaysiaproduced close to 6 Gw of PV modules each. other major IeAPVPS countries reporting PV modules production capacity in 2016are Japan, Germany and the USA but also other countries at alower level, such as Australia, Austria, canada, Mexico, denmark,France, Italy, Finland, Sweden, thailand and turkey.
the largest PV module producer in 2016 was Jinko Solar thatproduced 5,7 Gw. the second largest company was trina Solarwith 5,5 Gw of production. JA Solar (4,7 Gw), canadian Solar (4,5 Gw) and Gcl Systems (3,8 Gw) followed. As during theprevious year, major chinese companies established productionplants outside of china in turkey, Malaysia, thailand, Vietnam andbrazil in order to avoid Ads implemented by trade conflicts orsimply meet domestic content requirements. As a result, PVmodules production bases have been more and more diversified.trina Solar inaugurated its factory in thailand in March 2016. JASolar is also planning to invest into a production facility inthailand. In non-IeA PVPS members, major producing countrieswere Singapore, taiwan, the Philippines, Vietnam, India, andPoland. Plans for production were announced in Algeria, brazil,Morocco, Ghana, Saudi Arabia, and much more countries.
PV modules have seen products with a higher power output thathave been released using high efficiency solar cells or half-cutsolar cells to increase their power. other technologies such aslight trapping with glass coatings, encapsulants with wavelengthconversion functions are also used. PV modules using overlappedsolar cells without ribbons are developed by several companies.other new products comprise double glass PV modules with 30years warrantee or bifacial PV modules for an increased yield,specific PV modules for 1 500 V connections, light-weightcrystalline silicon PV modules used chemical tempered glass orpolymers, etc.
the average spot price of PV modules at the beginning of 2016started at 55 USdcent/w and rapidly decreased until the end ofsecond quarter. during the third quarter, the price dropped below40 USd cent/w and the price at the end of the year reached 36 to40 USdcent/w. It is expected that with rapidly decreasingmargins, the consolidation of PV modules manufacturers willcontinue as long as capacity exceeds demand.
Figure 15 shows the trends of estimated global productioncapacity and production. the estimated global PV manufacturingcapacity increased from 94 Gw in 2015 to 105 Gw in 2016. thelargest increase of production capacity is reported in china.According to the chinese Photovoltaic Industry Association
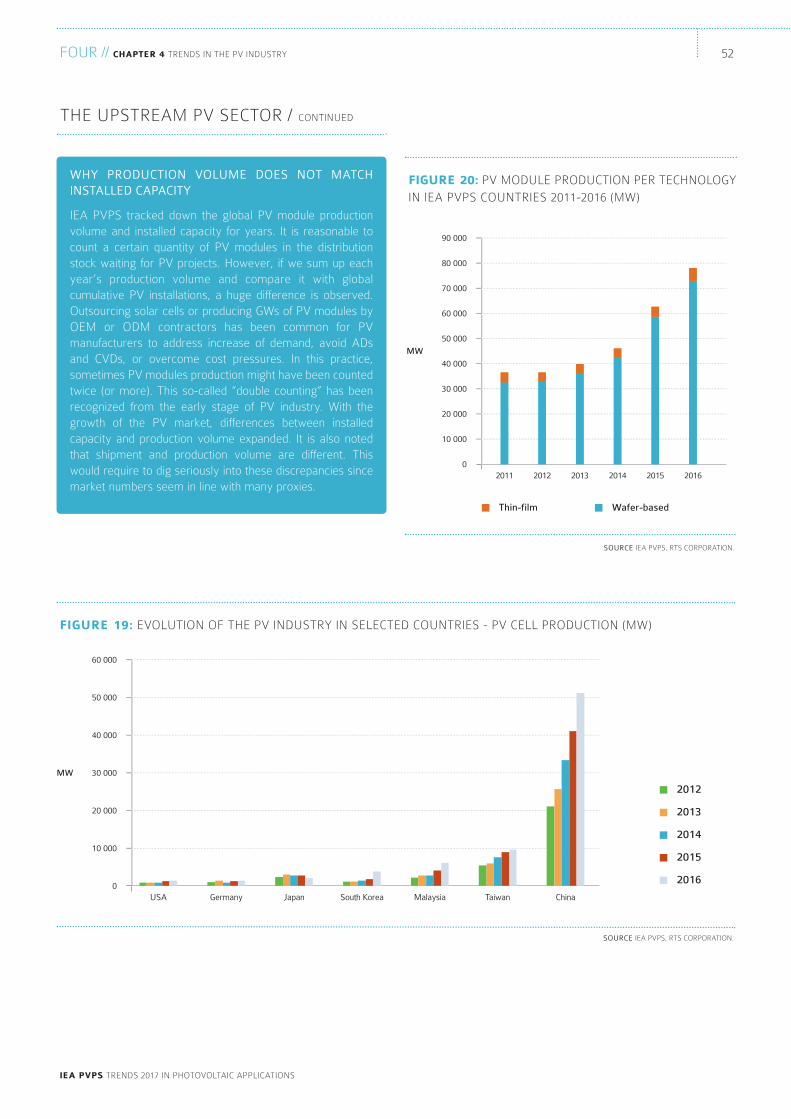
FoUr // chAPter 4 trendS In tHe PV IndUStry
ieA PVPS trendS 2017 In PHotoVoltAIc APPlIcAtIonS
52
tHe UPStreAM PV Sector / contInUed
SOURCE IeA PVPS, rtS corPorAtIon.
fiGure 19: eVolUtIon oF tHe PV IndUStry In Selected coUntrIeS - PV cell ProdUctIon (Mw)
0
10 000
20 000
30 000
40 000
50 000
60 000
MW
USA Germany Japan South Korea Malaysia Taiwan China
2014
2013
2012
2015
2016
SOURCE IeA PVPS, rtS corPorAtIon.
fiGure 20: PV ModUle ProdUctIon Per tecHnoloGy
In IeA PVPS coUntrIeS 2011-2016 (Mw)
0
10 000
20 000
30 000
40 000
50 000
60 000
70 000
80 000
90 000
MW
2011 2012 2013 2014 2015 2016
Thin-film Wafer-based
WHY PRODUCTION VOLUME DOES NOT MATCHINSTALLED CAPACITY
IeA PVPS tracked down the global PV module productionvolume and installed capacity for years. It is reasonable tocount a certain quantity of PV modules in the distributionstock waiting for PV projects. However, if we sum up eachyear’s production volume and compare it with globalcumulative PV installations, a huge difference is observed.outsourcing solar cells or producing Gws of PV modules byoeM or odM contractors has been common for PVmanufacturers to address increase of demand, avoid Adsand cVds, or overcome cost pressures. In this practice,sometimes PV modules production might have been countedtwice (or more). this so-called “double counting” has beenrecognized from the early stage of PV industry. with thegrowth of the PV market, differences between installedcapacity and production volume expanded. It is also notedthat shipment and production volume are different. thiswould require to dig seriously into these discrepancies sincemarket numbers seem in line with many proxies.
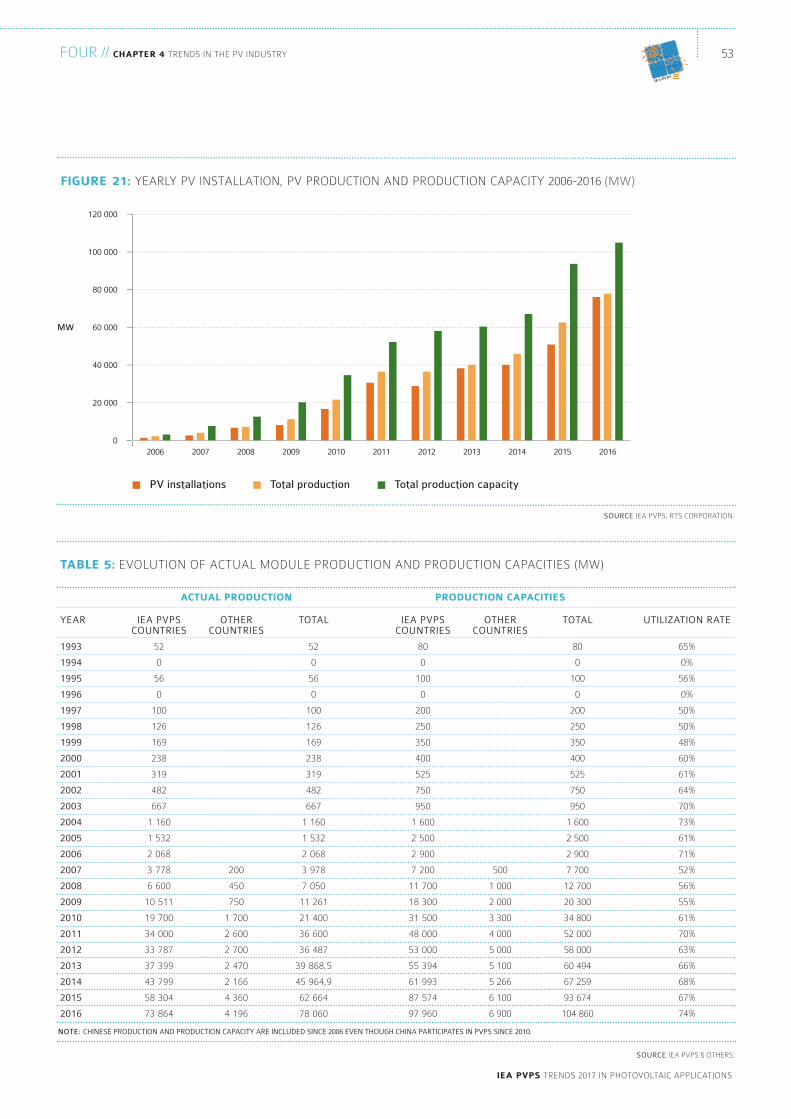
53
ieA PVPS trendS 2017 In PHotoVoltAIc APPlIcAtIonS
FoUr // chAPter 4 trendS In tHe PV IndUStry
IEA-PVPS
SOURCE IeA PVPS & otHerS.
NOTE: CHINESE PRODUCTION AND PRODUCTION CAPACITY ARE INCLUDED SINCE 2006 EVEN THOUGH CHINA PARTICIPATES IN PVPS SINCE 2010.
tAble 5: eVolUtIon oF ActUAl ModUle ProdUctIon And ProdUctIon cAPAcItIeS (Mw)
YEAR
1993
1994
1995
1996
1997
1998
1999
2000
2001
2002
2003
2004
2005
2006
2007
2008
2009
2010
2011
2012
2013
2014
2015
2016
IEA PVPSCOUNTRIES
52
0
56
0
100
126
169
238
319
482
667
1 160
1 532
2 068
3 778
6 600
10 511
19 700
34 000
33 787
37 399
43 799
58 304
73 864
OTHERCOUNTRIES
200
450
750
1 700
2 600
2 700
2 470
2 166
4 360
4 196
TOTAL
52
0
56
0
100
126
169
238
319
482
667
1 160
1 532
2 068
3 978
7 050
11 261
21 400
36 600
36 487
39 868,5
45 964,9
62 664
78 060
IEA PVPSCOUNTRIES
80
0
100
0
200
250
350
400
525
750
950
1 600
2 500
2 900
7 200
11 700
18 300
31 500
48 000
53 000
55 394
61 993
87 574
97 960
OTHERCOUNTRIES
500
1 000
2 000
3 300
4 000
5 000
5 100
5 266
6 100
6 900
TOTAL
80
0
100
0
200
250
350
400
525
750
950
1 600
2 500
2 900
7 700
12 700
20 300
34 800
52 000
58 000
60 494
67 259
93 674
104 860
Production cAPAcitieSActuAl Production
UTILIZATION RATE
65%
0%
56%
0%
50%
50%
48%
60%
61%
64%
70%
73%
61%
71%
52%
56%
55%
61%
70%
63%
66%
68%
67%
74%
fiGure 21: yeArly PV InStAllAtIon, PV ProdUctIon And ProdUctIon cAPAcIty 2006-2016 (MW)
0
20 000
40 000
60 000
80 000
100 000
120 000
MW
2006 2007 2008 2009 2010 2011 2012 2013 2014 2015 2016
Total production capacityTotal productionPV installations
SOURCE IeA PVPS, rtS corPorAtIon.
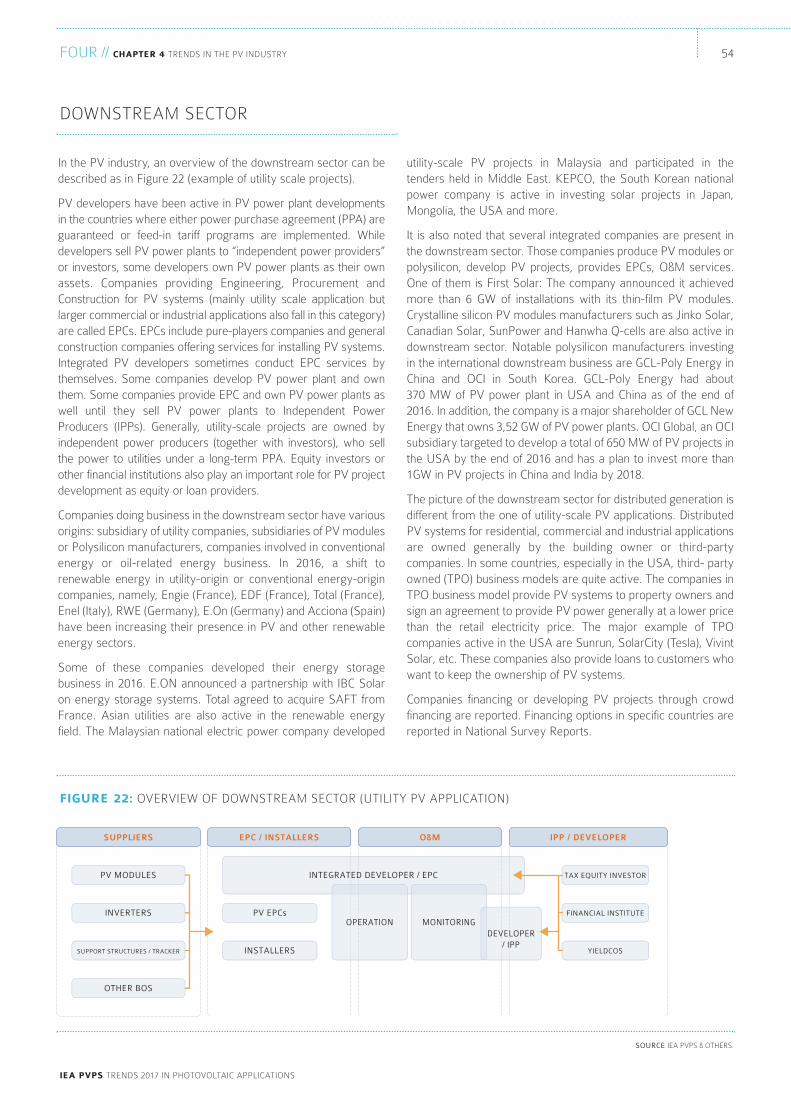
FoUr // chAPter 4 trendS In tHe PV IndUStry
ieA PVPS trendS 2017 In PHotoVoltAIc APPlIcAtIonS
54
downStreAM Sector
utility-scale PV projects in Malaysia and participated in thetenders held in Middle east. kePco, the South korean nationalpower company is active in investing solar projects in Japan,Mongolia, the USA and more.
It is also noted that several integrated companies are present inthe downstream sector. those companies produce PV modules orpolysilicon, develop PV projects, provides ePcs, o&M services.one of them is First Solar: the company announced it achievedmore than 6 Gw of installations with its thin-film PV modules.crystalline silicon PV modules manufacturers such as Jinko Solar,canadian Solar, SunPower and Hanwha Q-cells are also active indownstream sector. notable polysilicon manufacturers investingin the international downstream business are Gcl-Poly energy inchina and ocI in South korea. Gcl-Poly energy had about 370 Mw of PV power plant in USA and china as of the end of2016. In addition, the company is a major shareholder of Gcl newenergy that owns 3,52 Gw of PV power plants. ocI Global, an ocIsubsidiary targeted to develop a total of 650 Mw of PV projects inthe USA by the end of 2016 and has a plan to invest more than1Gw in PV projects in china and India by 2018.
the picture of the downstream sector for distributed generation isdifferent from the one of utility-scale PV applications. distributedPV systems for residential, commercial and industrial applicationsare owned generally by the building owner or third-partycompanies. In some countries, especially in the USA, third- partyowned (tPo) business models are quite active. the companies intPo business model provide PV systems to property owners andsign an agreement to provide PV power generally at a lower pricethan the retail electricity price. the major example of tPocompanies active in the USA are Sunrun, Solarcity (tesla), VivintSolar, etc. these companies also provide loans to customers whowant to keep the ownership of PV systems.
companies financing or developing PV projects through crowdfinancing are reported. Financing options in specific countries arereported in national Survey reports.
In the PV industry, an overview of the downstream sector can bedescribed as in Figure 22 (example of utility scale projects).
PV developers have been active in PV power plant developmentsin the countries where either power purchase agreement (PPA) areguaranteed or feed-in tariff programs are implemented. whiledevelopers sell PV power plants to “independent power providers”or investors, some developers own PV power plants as their ownassets. companies providing engineering, Procurement andconstruction for PV systems (mainly utility scale application butlarger commercial or industrial applications also fall in this category)are called ePcs. ePcs include pure-players companies and generalconstruction companies offering services for installing PV systems.Integrated PV developers sometimes conduct ePc services bythemselves. Some companies develop PV power plant and ownthem. Some companies provide ePc and own PV power plants aswell until they sell PV power plants to Independent PowerProducers (IPPs). Generally, utility-scale projects are owned byindependent power producers (together with investors), who sellthe power to utilities under a long-term PPA. equity investors orother financial institutions also play an important role for PV projectdevelopment as equity or loan providers.
companies doing business in the downstream sector have variousorigins: subsidiary of utility companies, subsidiaries of PV modulesor Polysilicon manufacturers, companies involved in conventionalenergy or oil-related energy business. In 2016, a shift torenewable energy in utility-origin or conventional energy-origincompanies, namely, engie (France), edF (France), total (France),enel (Italy), rwe (Germany), e.on (Germany) and Acciona (Spain)have been increasing their presence in PV and other renewableenergy sectors.
Some of these companies developed their energy storagebusiness in 2016. e.on announced a partnership with Ibc Solaron energy storage systems. total agreed to acquire SAFt fromFrance. Asian utilities are also active in the renewable energyfield. the Malaysian national electric power company developed
SOURCE IeA PVPS & otHerS.
fiGure 22: oVerVIew oF downStreAM Sector (UtIlIty PV APPlIcAtIon)
PV MODULES INTEGRATED DEVELOPER / EPC TAX EQUITY INVESTOR
SUPPLIERS EPC / INSTALLERS O&M IPP / DEVELOPER
OTHER BOS
INVERTERS PV EPCsOPERATION MONITORING
DEVELOPER/ IPP
FINANCIAL INSTITUTE
SUPPORT STRUCTURES / TRACKER INSTALLERS YIELDCOS
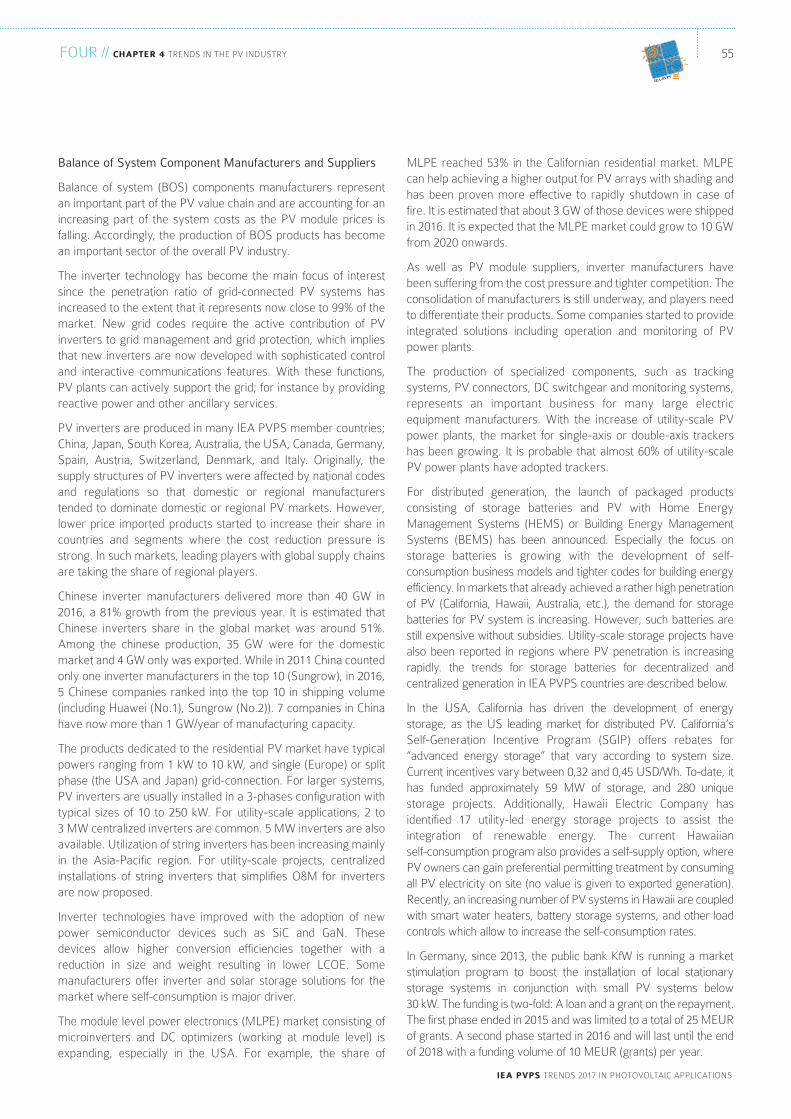
55
ieA PVPS trendS 2017 In PHotoVoltAIc APPlIcAtIonS
FoUr // chAPter 4 trendS In tHe PV IndUStry
IEA-PVPS
MlPe reached 53% in the californian residential market. MlPecan help achieving a higher output for PV arrays with shading andhas been proven more effective to rapidly shutdown in case offire. It is estimated that about 3 Gw of those devices were shippedin 2016. It is expected that the MlPe market could grow to 10 Gwfrom 2020 onwards.
As well as PV module suppliers, inverter manufacturers havebeen suffering from the cost pressure and tighter competition. theconsolidation of manufacturers is still underway, and players needto differentiate their products. Some companies started to provideintegrated solutions including operation and monitoring of PVpower plants.
the production of specialized components, such as trackingsystems, PV connectors, dc switchgear and monitoring systems,represents an important business for many large electricequipment manufacturers. with the increase of utility-scale PVpower plants, the market for single-axis or double-axis trackershas been growing. It is probable that almost 60% of utility-scalePV power plants have adopted trackers.
For distributed generation, the launch of packaged productsconsisting of storage batteries and PV with Home energyManagement Systems (HeMS) or building energy ManagementSystems (beMS) has been announced. especially the focus onstorage batteries is growing with the development of self-consumption business models and tighter codes for building energyefficiency. In markets that already achieved a rather high penetrationof PV (california, Hawaii, Australia, etc.), the demand for storagebatteries for PV system is increasing. However, such batteries arestill expensive without subsidies. Utility-scale storage projects havealso been reported in regions where PV penetration is increasingrapidly. the trends for storage batteries for decentralized andcentralized generation in IeA PVPS countries are described below.
In the USA, california has driven the development of energystorage, as the US leading market for distributed PV. california’sSelf-Generation Incentive Program (SGIP) offers rebates for“advanced energy storage” that vary according to system size.current incentives vary between 0,32 and 0,45 USd/wh. to-date, ithas funded approximately 59 Mw of storage, and 280 uniquestorage projects. Additionally, Hawaii electric company hasidentified 17 utility-led energy storage projects to assist theintegration of renewable energy. the current Hawaiian self-consumption program also provides a self-supply option, wherePV owners can gain preferential permitting treatment by consumingall PV electricity on site (no value is given to exported generation).recently, an increasing number of PV systems in Hawaii are coupledwith smart water heaters, battery storage systems, and other loadcontrols which allow to increase the self-consumption rates.
In Germany, since 2013, the public bank kfw is running a marketstimulation program to boost the installation of local stationarystorage systems in conjunction with small PV systems below 30 kw. the funding is two-fold: A loan and a grant on the repayment.the first phase ended in 2015 and was limited to a total of 25 MeUrof grants. A second phase started in 2016 and will last until the endof 2018 with a funding volume of 10 MeUr (grants) per year.
Balance of System Component Manufacturers and Suppliers
balance of system (boS) components manufacturers representan important part of the PV value chain and are accounting for anincreasing part of the system costs as the PV module prices isfalling. Accordingly, the production of boS products has becomean important sector of the overall PV industry.
the inverter technology has become the main focus of interestsince the penetration ratio of grid-connected PV systems hasincreased to the extent that it represents now close to 99% of themarket. new grid codes require the active contribution of PVinverters to grid management and grid protection, which impliesthat new inverters are now developed with sophisticated controland interactive communications features. with these functions,PV plants can actively support the grid; for instance by providingreactive power and other ancillary services.
PV inverters are produced in many IeA PVPS member countries;china, Japan, South korea, Australia, the USA, canada, Germany,Spain, Austria, Switzerland, denmark, and Italy. originally, thesupply structures of PV inverters were affected by national codesand regulations so that domestic or regional manufacturerstended to dominate domestic or regional PV markets. However,lower price imported products started to increase their share incountries and segments where the cost reduction pressure isstrong. In such markets, leading players with global supply chainsare taking the share of regional players.
chinese inverter manufacturers delivered more than 40 Gw in2016, a 81% growth from the previous year. It is estimated thatchinese inverters share in the global market was around 51%.Among the chinese production, 35 Gw were for the domesticmarket and 4 Gw only was exported. while in 2011 china countedonly one inverter manufacturers in the top 10 (Sungrow), in 2016,5 chinese companies ranked into the top 10 in shipping volume(including Huawei (no.1), Sungrow (no.2)). 7 companies in chinahave now more than 1 Gw/year of manufacturing capacity.
the products dedicated to the residential PV market have typicalpowers ranging from 1 kw to 10 kw, and single (europe) or splitphase (the USA and Japan) grid-connection. For larger systems,PV inverters are usually installed in a 3-phases configuration withtypical sizes of 10 to 250 kw. For utility-scale applications, 2 to 3 Mw centralized inverters are common. 5 Mw inverters are alsoavailable. Utilization of string inverters has been increasing mainlyin the Asia-Pacific region. For utility-scale projects, centralizedinstallations of string inverters that simplifies o&M for invertersare now proposed.
Inverter technologies have improved with the adoption of newpower semiconductor devices such as Sic and Gan. thesedevices allow higher conversion efficiencies together with areduction in size and weight resulting in lower lcoe. Somemanufacturers offer inverter and solar storage solutions for themarket where self-consumption is major driver.
the module level power electronics (MlPe) market consisting ofmicroinverters and dc optimizers (working at module level) isexpanding, especially in the USA. For example, the share of
FoUr // chAPter 4 trendS In tHe PV IndUStry
ieA PVPS trendS 2017 In PHotoVoltAIc APPlIcAtIonS
56
downStreAM Sector / contInUed
batteries which are introduced together with PV systems are alsoeligible for the subsidy. the subsidy rate is one-third or less of theeligible cost for SMes with the cap of 50 MJPy and one-sixth orless of the eligible cost for other companies with a cap of 25 MJPy.the Ministry of economy and Industry (MetI) also promotes thedevelopment of electricity storage technology using large-capacity storage batteries. to adjust short-cycle variations andbalance supply and demand following the large-scale introductionof renewable energy, electric power companies conducts projectsto introduce large-capacity storage batteries in substations withthe support from MetI.
the korean government is conducting technological developmentthrough smart-grid projects. MotIe launched the smart grid test-bed project in September 2012 in Jeju island and invested 76,6 billion krw (a total of 249,5 billion krw including the 172,9 billion krw investment from the private sector). the projectended in May 2013, and it aimed at verifying the energy systemsintegration technology using smart metering devices. the projectalso aimed at developing business models for commercialization.the 2nd phase of the smart grid diffusion project was designed in2014 and expected to be launched in 2016. the utilization ofenergy storage systems are also reported for rural electrification.the “energy-independent Islands” project was jointly planned bythe central government and the Gyeongbuk provincialgovernment in 2014 and was launched in 2015 for Ulleungdoisland, and will be expanded to more islands in korea. windpower, PV, geothermal and energy Storage System (eSS) will becombined to increase the new and renewable energy share inUlleungdo island from 3.6% in 2014 to 68% in 2017. 30 Mwh eSSwill be installed by 2017.
In Australia, storage batteries incentives are offered by localgovernments. the city of Adelaide provides 50% of the cost ofbatteries up to a value of 5 000 AUd, in addition to a further 5 000AUd covering 20% of the price of a PV system. the Australiancapital territory (Act) government’s next Generation StorageProgram paid a subsidy of 900 AUd per kw of peak output, aspart of a rollout of 36 Mw of distributed storage across 5 000homes and businesses between 2016 and 2020. the northernterritory government’s Home Improvement Scheme offers a 2 000 AUd subsidy for the installation of rooftop solar and storagesystems. In 2016, many electricity network operators conductedtests of batteries within their substations, and within homes. Forexample, energex and ergon trailed 80 sites across Queenslandwhile SAPn offered highly subsidized PV-storage systems as partof a trial for 100 houses.
In Japan, storage batteries are supported in the subsidies forinstallations of net zero energy house (zeH) and demonstrationprojects of zeb. A project to accelerate dissemination of net zeroenergy house (zeH) is funded with 1,25 million JPy per house. tointroduce a storage system, 50 000 JPy are granted per kwh ofstorage capacity. It covers maximum one-third of the cost or 500 000 JPy. with the demonstration project for net zero energybuilding (nzeb)”, part of the storage costs is subsidized to forrenovation of existing buildings and new buildings. It introduceshigh-performance building materials or equipment as componentof zeb. the subsidy can cover up to two-thirds of the cost and thecap of the total subsidy is 1 bJPy/year. the tokyo MetropolitanGovernment (tMG) started a project to expand the developmentof renewable energy for local production and local consumption.It supports private businesses which install renewable energypower generation plants for self-consumption in tokyo. Storage
57
ieA PVPS trendS 2017 In PHotoVoltAIc APPlIcAtIonS
FoUr // chAPter 4 trendS In tHe PV IndUStry
IEA-PVPS
trAde conFlIctS
trade conflicts concerning PV products, including polysilicon,continued to impact business strategies of PV companies. toavoid the duties imposed in several countries for different kinds ofproducts, PV module manufacturers announced new productionenhancement plans in Malaysia, thailand, India, and someeuropean countries. In this section, the trends regarding the majortrade conflicts observed in 2016 are described.
the US department of commerce (doc) revised the margins foranti-dumping duties (Ads) and countervailing duties (cVds) in2016. compared to Ads and cVds for chinese PV products andAds for taiwanese products decided in 2013 and revised inJanuary 2015, reviewed Ad and cVd margins are lower for mostof companies. chinese manufacturers adapted to use solar cellsmade in china instead of solar cells made-in taiwan. In 2017, docrevised Ads and cVds related to made in taiwan crystallineSilicon PV cells and modules. the duties for Ads for thecompanies cooperating to the review process remained at a lowerlevel, below 4,2%. Since the revised levels are lower for mostcompanies, it seems that the revision has not produced anysignificant impact on the price level.
A new issue emerged in the USA in 2017. Suniva, a bankrupt USPV cells and modules manufacturer filed a petition to theInternational trade commission (Itc) under doc together withSolarworld America. they claimed that some serious damageshave been caused by imported solar cells and modules. Itcstarted a survey in May 2017 and concluded that importedcrystalline Silicon PV products caused a damage to domestic PVmanufacturers. If the safeguard measure will be implemented, allthe imported PV cells and modules may be subject to specificmeasures such as setting a minimum imported price. the finaldecision of Itc on such concrete measures remains to be seen atthe time of writing these lines. but in case Itc implements aMinimum Imported Price, PV modules prices are expected to risein the USA and according to some stakeholders could result in apossible decrease of utility scale PV projects.
In europe, the european commission (ec) and the chinese PVindustry continued to implement an agreement on minimumimported price (MIP) and a maximum shipping volume. PVproducts are subjects to Ads and cVds if producers do notparticipate in the agreement. In February 2017, the ec decided toextend the agreement for 18 months and announced that dutymargins and MIP would be gradually decreased following costreduction trends of PV products. In February 2016, ec announcedto apply Ads and cVds to chinese PV modules imported via
taiwan and Malaysia. Several major PV modules producersvoluntary decided to withdraw from the agreement because theMIP did not reflect the actual market prices trends. Most of thesemanufacturers established their production facilities outside ofchina. In July, dG trade announced a draft proposal to set the MIPlevel quarterly. because of the withdrawal of major chinesecompanies (which prefer to pay the duties), the effectiveness ofthe MIP agreement has been questioned.
In Australia, the Anti-dumping committee concluded itsantidumping investigation started in May 2014. while thecommittee confirmed dumping in April 2015, it did not imposeduties because damage to Australian industry was not observed.In 2016, the committee reviewed the survey results andconcluded that influence on the domestic industry was minorwhile dumping was recognized.
the turkish government decided to impose Ads for chinese PVmodules in April 2017. the committee responsible for the surveydecided 27% of dumping margin.
In July 2017, the Indian directorate General of Anti-dumping andAllied duties (dGAd) under the department of commerceinitiated an antidumping survey following a petition submitted bythe Indian Solar Manufacturers Association (ISMA). the subject ofthe survey are PV cells and modules produced in china, Malaysiaand taiwan. while it is expected that the survey takes a year ormore, preliminary results will be announced earlier. In August2017, the Ministry of Finance decided to impose a duty on glassfor PV modules coming from china. In parallel the Indiangovernment agreed to terminate the domestic contentsrequirement (dcr) in its national tender programs by the 14th ofdecember 2017 following a conclusion of the world tradeorganization (wto) that concluded that dcr is violating theglobal trading agreement.
In 2016, china decided an 18 months extension of Ads and cVdson polysilicon made in USA and europe and Ads on korean-made polysilicon set in May 2014. Mainly US manufacturers areaffected by Ads and cVds while korean producers can continueto import it with lower Ads. the chinese Ministry of commercedecided to review duty margins for polysilicon made in Southkorea in november 2016. wacker chemie, a Germany polysiliconproducer avoids Ad by the agreement on the price with thechinese government. rec Silicon of norway that possessesmanufacturing plants in the USA announced to establish a jointventure with chinese companies to construct a plant using theFbr process in china.
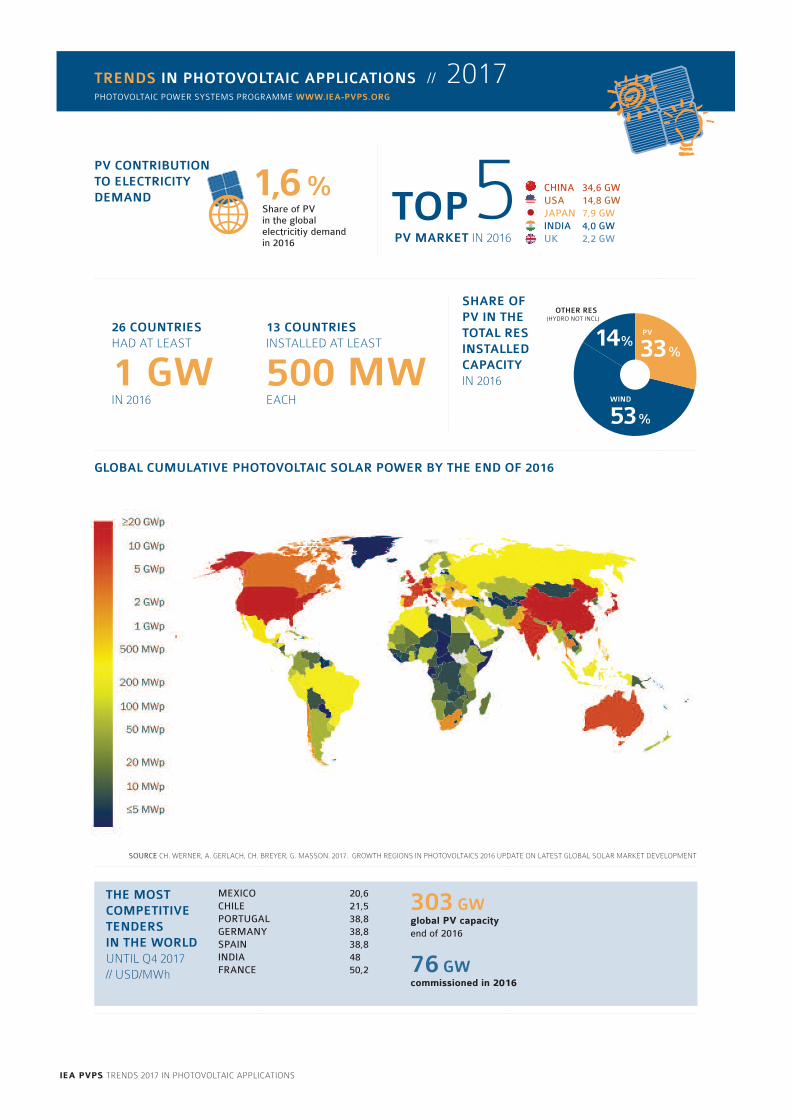
SOURCE CH. WERNER, A. GERLACH, CH. BREYER, G. MASSON. 2017. GROWTH REGIONS IN PHOTOVOLTAICS 2016 UPDATE ON LATEST GLOBAL SOLAR MARKET DEVELOPMENT
TRENDS IN PHOTOVOLTAIC APPLICATIONS // 2017PHOTOVOLTAIC POWER SYSTEMS PROGRAMME WWW.IEA-PVPS.ORG
CHINA 34,6 GWUSA 14,8 GWJAPAN 7,9 GWINDIA 4,0 GWUK 2,2 GWPV MARKET IN 2016
TOP5
global PV capacity end of 2016
303 GW
commissioned in 201676 GW
26 COUNTRIES HAD AT LEAST
1 GWIN 2016
PV CONTRIBUTION TO ELECTRICITY DEMAND Share of PV
in the global electricitiy demand in 2016
1,6 %
MEXICO 20,6CHILE 21,5PORTUGAL 38,8GERMANY 38,8SPAIN 38,8INDIA 48FRANCE 50,2
THE MOST COMPETITIVE TENDERS IN THE WORLD UNTIL Q4 2017 // USD/MWh
SHARE OF PV IN THE TOTAL RES INSTALLED CAPACITY IN 2016
PV
WIND
OTHER RES (HYDRO NOT INCL)
14 %
53 %
33 %
13 COUNTRIES INSTALLED AT LEAST
500 MWEACH
GLOBAL CUMULATIVE PHOTOVOLTAIC SOLAR POWER BY THE END OF 2016
ieA PVPS trendS 2017 In PHotoVoltAIc APPlIcAtIonS
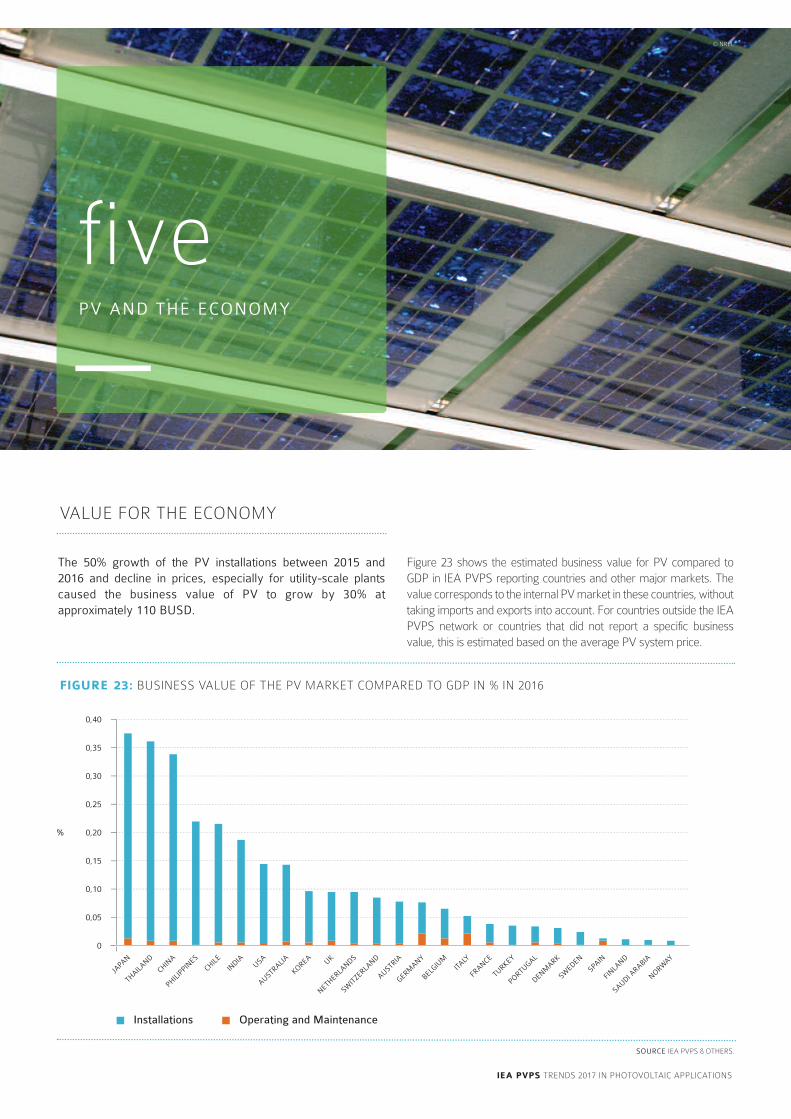
59
fivePV AND THE ECONOMY
© nrel
Figure 23 shows the estimated business value for PV compared toGdP in IeA PVPS reporting countries and other major markets. thevalue corresponds to the internal PV market in these countries, withouttaking imports and exports into account. For countries outside the IeAPVPS network or countries that did not report a specific businessvalue, this is estimated based on the average PV system price.
The 50% growth of the PV installations between 2015 and 2016 and decline in prices, especially for utility-scale plantscaused the business value of PV to grow by 30% atapproximately 110 BUSD.
VAlUe For tHe econoMy
fiGure 23: bUSIneSS VAlUe oF tHe PV MArket coMPAred to GdP In % In 2016
0
0,05
0,10
0,15
0,20
0,25
0,30
0,35
0,40
%
Installations Operating and Maintenance
JAPA
NCHILE UK
CHINA
PHILIPPIN
ES
INDIA
SWIT
ZERLAND
NETHERLA
NDS
KOREAUSA
FINLA
ND
DENMARK
GERMANY
AUSTRALIA
NORWAY
AUSTRIA
FRANCE
THAILA
ND
BELGIU
M
TURKEY
ITALY
PORTUGAL
SWEDEN
SAUDI ARABIA
SPAIN
SOURCE IeA PVPS & otHerS.
ieA PVPS trendS 2017 In PHotoVoltAIc APPlIcAtIonS
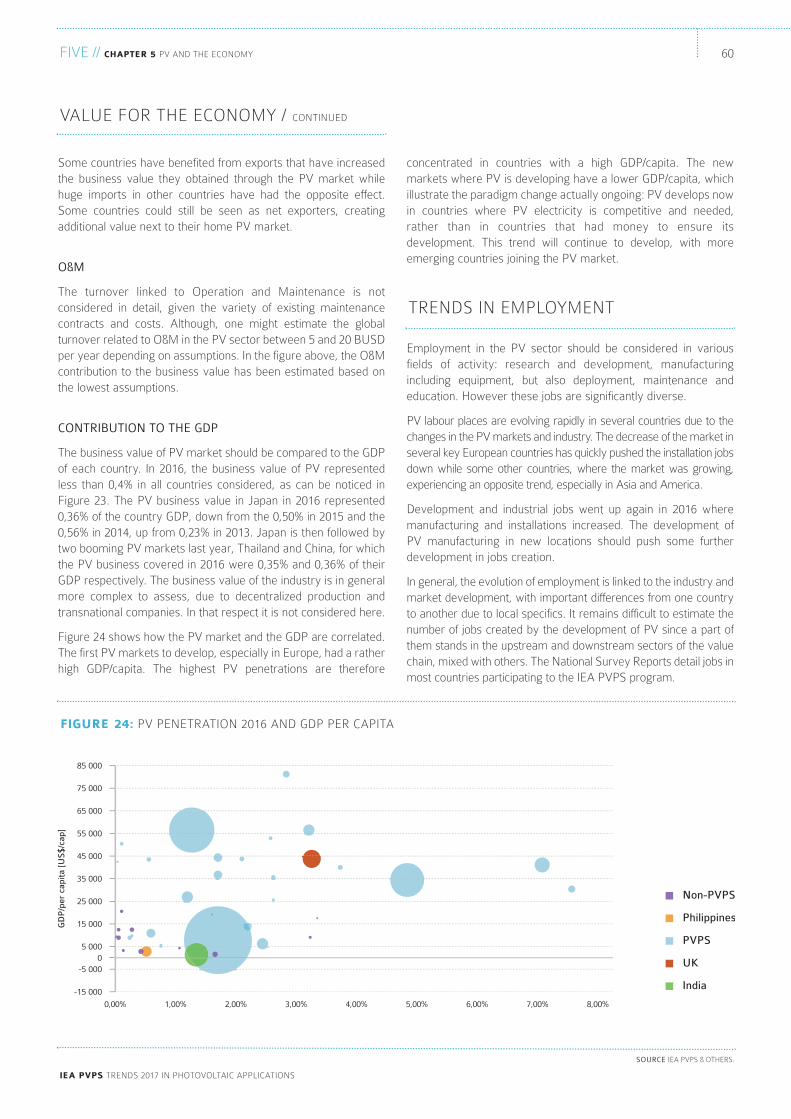
ieA PVPS trendS 2017 In PHotoVoltAIc APPlIcAtIonS
concentrated in countries with a high GdP/capita. the newmarkets where PV is developing have a lower GdP/capita, whichillustrate the paradigm change actually ongoing: PV develops nowin countries where PV electricity is competitive and needed,rather than in countries that had money to ensure itsdevelopment. this trend will continue to develop, with moreemerging countries joining the PV market.
employment in the PV sector should be considered in variousfields of activity: research and development, manufacturingincluding equipment, but also deployment, maintenance andeducation. However these jobs are significantly diverse.
PV labour places are evolving rapidly in several countries due to thechanges in the PV markets and industry. the decrease of the market inseveral key european countries has quickly pushed the installation jobsdown while some other countries, where the market was growing,experiencing an opposite trend, especially in Asia and America.
development and industrial jobs went up again in 2016 wheremanufacturing and installations increased. the development ofPV manufacturing in new locations should push some furtherdevelopment in jobs creation.
In general, the evolution of employment is linked to the industry andmarket development, with important differences from one countryto another due to local specifics. It remains difficult to estimate thenumber of jobs created by the development of PV since a part ofthem stands in the upstream and downstream sectors of the valuechain, mixed with others. the national Survey reports detail jobs inmost countries participating to the IeA PVPS program.
Some countries have benefited from exports that have increasedthe business value they obtained through the PV market whilehuge imports in other countries have had the opposite effect.Some countries could still be seen as net exporters, creatingadditional value next to their home PV market.
O&M
the turnover linked to operation and Maintenance is notconsidered in detail, given the variety of existing maintenancecontracts and costs. Although, one might estimate the globalturnover related to o&M in the PV sector between 5 and 20 bUSdper year depending on assumptions. In the figure above, the o&Mcontribution to the business value has been estimated based onthe lowest assumptions.
CONTRIBUTION TO THE GDP
the business value of PV market should be compared to the GdPof each country. In 2016, the business value of PV representedless than 0,4% in all countries considered, as can be noticed inFigure 23. the PV business value in Japan in 2016 represented0,36% of the country GdP, down from the 0,50% in 2015 and the0,56% in 2014, up from 0,23% in 2013. Japan is then followed bytwo booming PV markets last year, thailand and china, for whichthe PV business covered in 2016 were 0,35% and 0,36% of theirGdP respectively. the business value of the industry is in generalmore complex to assess, due to decentralized production andtransnational companies. In that respect it is not considered here.
Figure 24 shows how the PV market and the GdP are correlated.the first PV markets to develop, especially in europe, had a ratherhigh GdP/capita. the highest PV penetrations are therefore
trendS In eMPloyMent
VAlUe For tHe econoMy / contInUed
SOURCE IeA PVPS & otHerS.
fiGure 24: PV PenetrAtIon 2016 And GdP Per cAPItA
-15 000
-5 0000
5 000
15 000
25 000
35 000
45 000
55 000
65 000
75 000
85 000
GD
P/p
er c
apit
a [U
S$/
cap]
0,00% 1,00% 2,00% 3,00% 4,00% 5,00% 6,00% 7,00% 8,00%
India
UK
PVPS
Philippines
Non-PVPS
FIVe // chAPter 5 PV And tHe econoMy 60
ieA PVPS trendS 2017 In PHotoVoltAIc APPlIcAtIonS
sixCOMPETITIVENESS OF PV ELECTRICITY IN 2016
© Gaetan Masson
on average, system prices for the lowest priced off-gridapplications are significantly higher than for the lowest pricedgrid-connected applications. this is attributed to the fact that off-grid systems might require storage batteries and associatedequipment. large-scale off-grid systems are often installed inplaces far from the grid but also far from places easily accessible.the higher price asked for such installations also depends onhigher costs for transport of components, technicians, withouteven mentioning the higher cost of maintenance.
Additional information about the systems and prices reported formost countries can be found in the various national survey reports;excluding VAt and sales taxes. More expensive grid-connectedsystem prices are often associated with roof integrated slates, tiles,one-off building integrated designs or single projects: bIPV systemsin general are considered more expensive when using dedicatedcomponents, even if prices are also showing some decline.
In 2016, the lowest system prices in the off-grid sector,irrespective of the type of application, typically ranged from about2.71 USd/w to 12 USd/w. the large range of reported prices intable 6 is a function of country and project specific factors. Ingeneral, the price range decreased from the previous year.
the lowest achievable installed price of grid-connected systems in2016 also varied between countries as shown in table 6. theaverage price of these systems is tied to the segment. large grid-connected installations can have either lower system pricesdepending on the economies of scale achieved, or higher systemprices where the nature of the building integration and installation,degree of innovation, learning costs in project management andthe price of custom-made modules may be considered as quitesignificant factors. In summary, system prices continued to go
The fast price decline that PV experienced in the last years hasalready opened possibilities to develop PV systems in manylocations with limited or no financial incentives. However, theroad to full competitiveness of PV systems with conventionalelectricity sources depends on answering many questions andbringing innovative solutions to emerging challenges.
this section aims at defining where PV stands with regard to itsown competitiveness, starting with a survey of system prices inseveral IeA PVPS reporting countries. Given the number ofparameters involved in competitiveness simulations, this chapterwill mostly highlight the comparative situation in key countries.Prices are often averages and should always be looked at assegment-related.
reported prices for PV systems vary widely and depend on a varietyof factors including system size, location, customer type, connectionto an electricity grid, technical specification and the extent to whichend-user prices reflect the real costs of all the components.
Figure 25 shows the range of system prices in the global PVmarket in 2016. It shows that half of the PV market consists inprices below 1,1 USd/wp. while this figure is based on reportedprices and some averages it explains the rationale behind low costPV installations in the utility-scale segment. the second half of themarket mixes more costly utility-scale PV together withdistributed PV applications by nature costlier.
SySteM PrIceS
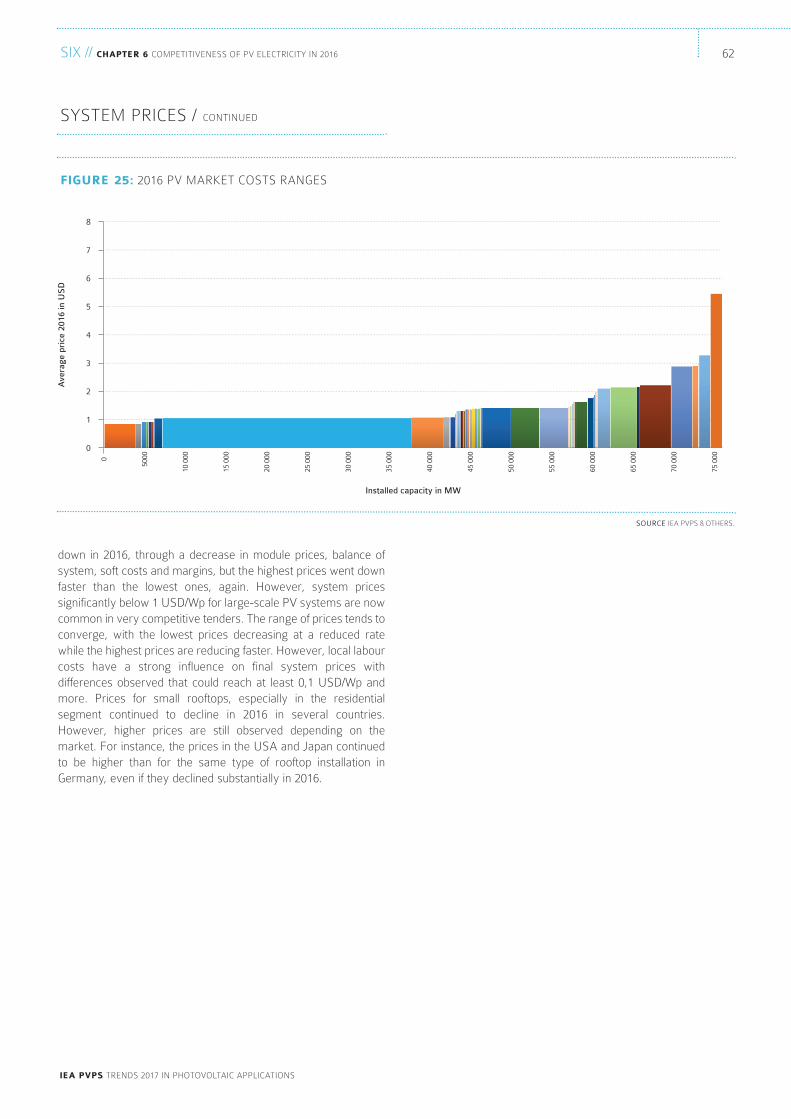
down in 2016, through a decrease in module prices, balance ofsystem, soft costs and margins, but the highest prices went downfaster than the lowest ones, again. However, system pricessignificantly below 1 USd/wp for large-scale PV systems are nowcommon in very competitive tenders. the range of prices tends toconverge, with the lowest prices decreasing at a reduced ratewhile the highest prices are reducing faster. However, local labourcosts have a strong influence on final system prices withdifferences observed that could reach at least 0,1 USd/wp andmore. Prices for small rooftops, especially in the residentialsegment continued to decline in 2016 in several countries.However, higher prices are still observed depending on themarket. For instance, the prices in the USA and Japan continuedto be higher than for the same type of rooftop installation inGermany, even if they declined substantially in 2016.
ieA PVPS trendS 2017 In PHotoVoltAIc APPlIcAtIonS
SOURCE IeA PVPS & otHerS.
fiGure 25: 2016 PV MArket coStS rAnGeS
0
1
2
3
4
5
6
7
8
Ave
rage
pri
ce 2
016
in U
SD
0
5000
10 0
00
15 0
00
20 0
00
25 0
00
30 0
00
35 0
00
40 0
00
45 0
00
50 0
00
55 0
00
60 0
00
65 0
00
70 0
00
75 0
00
Installed capacity in MW
SIx // chAPter 6 coMPetItIVeneSS oF PV electrIcIty In 2016 62
SySteM PrIceS / contInUed
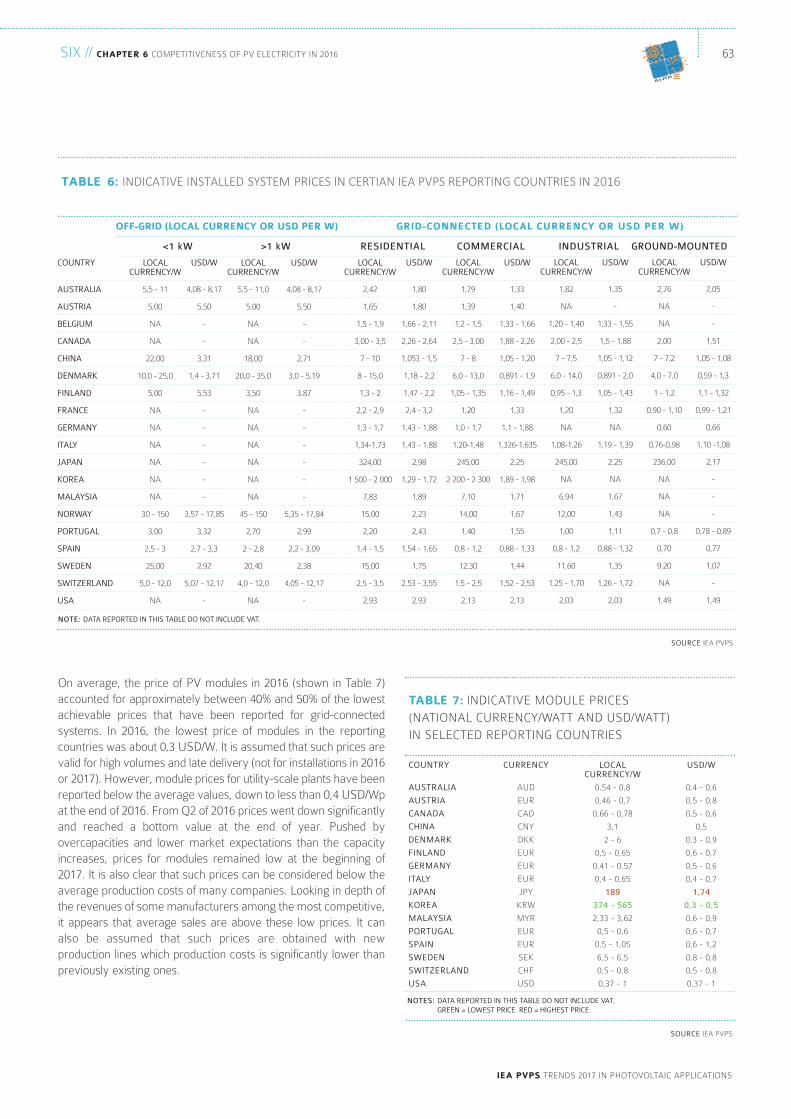
ieA PVPS trendS 2017 In PHotoVoltAIc APPlIcAtIonS
63SIx // chAPter 6 coMPetItIVeneSS oF PV electrIcIty In 2016
IEA-PVPS
tAble 6: INDICATIVE INSTALLED SYSTEM PRICES IN CERTIAN IEA PVPS REPORTING COUNTRIES IN 2016
COUNTRY
AUSTRALIA
AUSTRIA
BELGIUM
CANADA
CHINA
DENMARK
FINLAND
FRANCE
GERMANY
ITALY
JAPAN
KOREA
MALAYSIA
NORWAY
PORTUGAL
SPAIN
SWEDEN
SWITZERLAND
USA
LOCALCURRENCY/W
5,5 - 11
5,00
nA
nA
22,00
10,0 - 25,0
5,00
nA
nA
nA
nA
nA
nA
30 - 150
3,00
2,5 - 3
25,00
5,0 - 12,0
nA
USD/W
4,08 - 8,17
5,50
-
-
3,31
1,4 - 3,71
5,53
-
-
-
-
-
-
3,57 - 17,85
3,32
2,7 - 3,3
2,92
5,07 - 12,17
-
<1 kW
off-Grid (locAl currency or uSd Per w)
>1 kW RESIDENTIAL
Grid-connected (locAl currency or uSd Per w)
COMMERCIAL INDUSTRIAL GROUND-MOUNTED
LOCALCURRENCY/W
5,5 - 11,0
5,00
nA
nA
18,00
20,0 - 35,0
3,50
nA
nA
nA
nA
nA
nA
45 - 150
2,70
2 - 2,8
20,40
4,0 - 12,0
nA
USD/W
4,08 - 8,17
5,50
-
-
2,71
3,0 - 5,19
3,87
-
-
-
-
-
-
5,35 - 17,84
2,99
2,2 - 3,09
2,38
4,05 - 12,17
-
LOCALCURRENCY/W
2,42
1,65
1,5 - 1,9
3,00 - 3,5
7 - 10
8 - 15,0
1,3 - 2
2,2 - 2,9
1,3 - 1,7
1,34-1,73
324,00
1 500 - 2 000
7,83
15,00
2,20
1,4 - 1,5
15,00
2,5 - 3,5
2,93
USD/W
1,80
1,80
1,66 - 2,11
2,26 - 2,64
1,053 - 1,5
1,18 - 2,2
1,47 - 2,2
2,4 - 3,2
1,43 - 1,88
1,43 - 1,88
2,98
1,29 - 1,72
1,89
2,23
2,43
1,54 - 1,65
1,75
2,53 - 3,55
2,93
LOCALCURRENCY/W
1,79
1,39
1,2 - 1,5
2,5 - 3,00
7 - 8
6,0 - 13,0
1,05 - 1,35
1,20
1,0 - 1,7
1,20-1,48
245,00
2 200 - 2 300
7,10
14,00
1,40
0,8 - 1,2
12,30
1,5 - 2,5
2,13
USD/W
1,33
1,40
1,33 - 1,66
1,88 - 2,26
1,05 - 1,20
0,891 - 1,9
1,16 - 1,49
1,33
1,1 - 1,88
1,326-1,635
2,25
1,89 - 1,98
1,71
1,67
1,55
0,88 - 1,33
1,44
1,52 - 2,53
2,13
LOCALCURRENCY/W
1,82
nA
1,20 - 1,40
2,00 - 2,5
7 - 7,5
6,0 - 14,0
0,95 - 1,3
1,20
nA
1,08-1,26
245,00
nA
6,94
12,00
1,00
0,8 - 1,2
11,60
1,25 - 1,70
2,03
USD/W
1,35
-
1,33 - 1,55
1,5 - 1,88
1,05 - 1,12
0,891 - 2,0
1,05 - 1,43
1,32
nA
1,19 - 1,39
2,25
nA
1,67
1,43
1,11
0,88 - 1,32
1,35
1,26 - 1,72
2,03
LOCALCURRENCY/W
2,76
nA
nA
2,00
7 - 7,2
4,0 - 7,0
1 - 1,2
0,90 - 1,10
0,60
0,76-0,98
236,00
nA
nA
nA
0,7 - 0,8
0,70
9,20
nA
1,49
USD/W
2,05
-
-
1,51
1,05 - 1,08
0,59 - 1,3
1,1 - 1,32
0,99 - 1,21
0,66
1,10 -1,08
2,17
-
-
-
0,78 - 0,89
0,77
1,07
-
1,49
SOURCE IeA PVPS.
NOTE: DATA REPORTED IN THIS TABLE DO NOT INCLUDE VAT.
SOURCE IeA PVPS.
NOTES: DATA REPORTED IN THIS TABLE DO NOT INCLUDE VAT.GREEN = LOWEST PRICE. RED = HIGHEST PRICE.
tAble 7: IndIcAtIVe ModUle PrIceS
(nAtIonAl cUrrency/wAtt And USd/wAtt)
In Selected rePortInG coUntrIeS
COUNTRY
AUSTRALIA
AUSTRIA
CANADA
CHINA
DENMARK
FINLAND
GERMANY
ITALY
JAPAN
KOREA
MALAYSIA
PORTUGAL
SPAIN
SWEDEN
SWITZERLAND
USA
CURRENCY
AUd
eUr
cAd
cny
dkk
eUr
eUr
eUr
JPy
krw
Myr
eUr
eUr
Sek
cHF
USd
LOCALCURRENCY/W
0,54 - 0,8
0,46 - 0,7
0,66 - 0,78
3,1
2 - 6
0,5 - 0,65
0,41 - 0,57
0,4 - 0,65
189
374 - 565
2,33 - 3,62
0,5 - 0,6
0,5 - 1,05
6,5 - 6,5
0,5 - 0,8
0,37 - 1
USD/W
0,4 - 0,6
0,5 - 0,8
0,5 - 0,6
0,5
0,3 - 0,9
0,6 - 0,7
0,5 - 0,6
0,4 - 0,7
1,74
0,3 - 0,5
0,6 - 0,9
0,6 - 0,7
0,6 - 1,2
0,8 - 0,8
0,5 - 0,8
0,37 - 1
on average, the price of PV modules in 2016 (shown in table 7)accounted for approximately between 40% and 50% of the lowestachievable prices that have been reported for grid-connectedsystems. In 2016, the lowest price of modules in the reportingcountries was about 0,3 USd/w. It is assumed that such prices arevalid for high volumes and late delivery (not for installations in 2016or 2017). However, module prices for utility-scale plants have beenreported below the average values, down to less than 0,4 USd/wpat the end of 2016. From Q2 of 2016 prices went down significantlyand reached a bottom value at the end of year. Pushed byovercapacities and lower market expectations than the capacityincreases, prices for modules remained low at the beginning of2017. It is also clear that such prices can be considered below theaverage production costs of many companies. looking in depth ofthe revenues of some manufacturers among the most competitive,it appears that average sales are above these low prices. It canalso be assumed that such prices are obtained with newproduction lines which production costs is significantly lower thanpreviously existing ones.
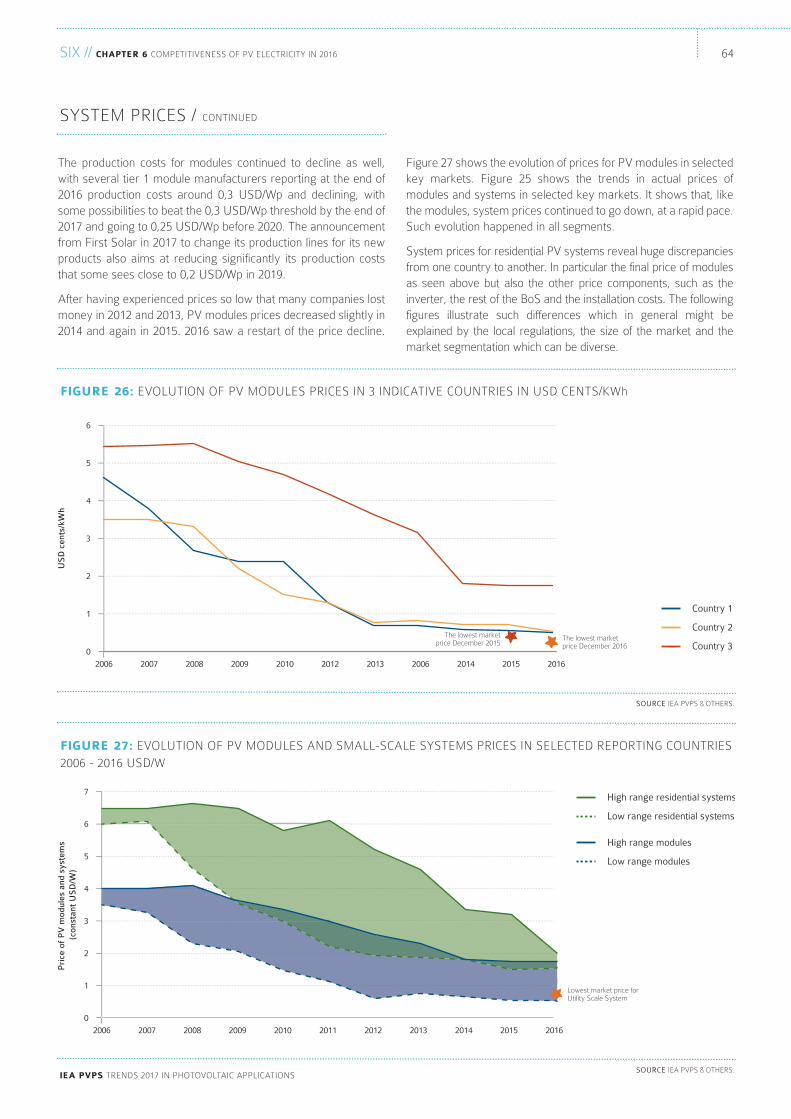
SIx // chAPter 6 coMPetItIVeneSS oF PV electrIcIty In 2016
ieA PVPS trendS 2017 In PHotoVoltAIc APPlIcAtIonS
64
SySteM PrIceS / contInUed
the production costs for modules continued to decline as well,with several tier 1 module manufacturers reporting at the end of2016 production costs around 0,3 USd/wp and declining, withsome possibilities to beat the 0,3 USd/wp threshold by the end of2017 and going to 0,25 USd/wp before 2020. the announcementfrom First Solar in 2017 to change its production lines for its newproducts also aims at reducing significantly its production coststhat some sees close to 0,2 USd/wp in 2019.
After having experienced prices so low that many companies lostmoney in 2012 and 2013, PV modules prices decreased slightly in2014 and again in 2015. 2016 saw a restart of the price decline.
Figure 27 shows the evolution of prices for PV modules in selectedkey markets. Figure 25 shows the trends in actual prices ofmodules and systems in selected key markets. It shows that, likethe modules, system prices continued to go down, at a rapid pace.Such evolution happened in all segments.
System prices for residential PV systems reveal huge discrepanciesfrom one country to another. In particular the final price of modulesas seen above but also the other price components, such as theinverter, the rest of the boS and the installation costs. the followingfigures illustrate such differences which in general might beexplained by the local regulations, the size of the market and themarket segmentation which can be diverse.
SOURCE IeA PVPS & otHerS.
fiGure 26: eVolUtIon oF PV ModUleS PrIceS In 3 IndIcAtIVe coUntrIeS In USd centS/kwh
0
1
2
3
4
5
6
US
D c
ents
/kW
h
2006 2007 2008 2009 2010 2012 2013 2006 2014 2015 2016
Country 2
Country 1
Country 3The lowest market price December 2016
The lowest marketprice December 2015
SOURCE IeA PVPS & otHerS.
fiGure 27: eVolUtIon oF PV ModUleS And SMAll-ScAle SySteMS PrIceS In Selected rePortInG coUntrIeS
2006 - 2016 USd/w
0
1
2
3
4
5
6
7
Pri
ce o
f P
V m
odul
es a
nd s
yste
ms
(con
stan
t U
SD
/W)
2006 2007 2008 2009 2010 2011 2012 2013 2014 2015 2016
High range residential systems
High range modules
Low range residential systems
Low range modules
Lowest market price for Utility Scale System
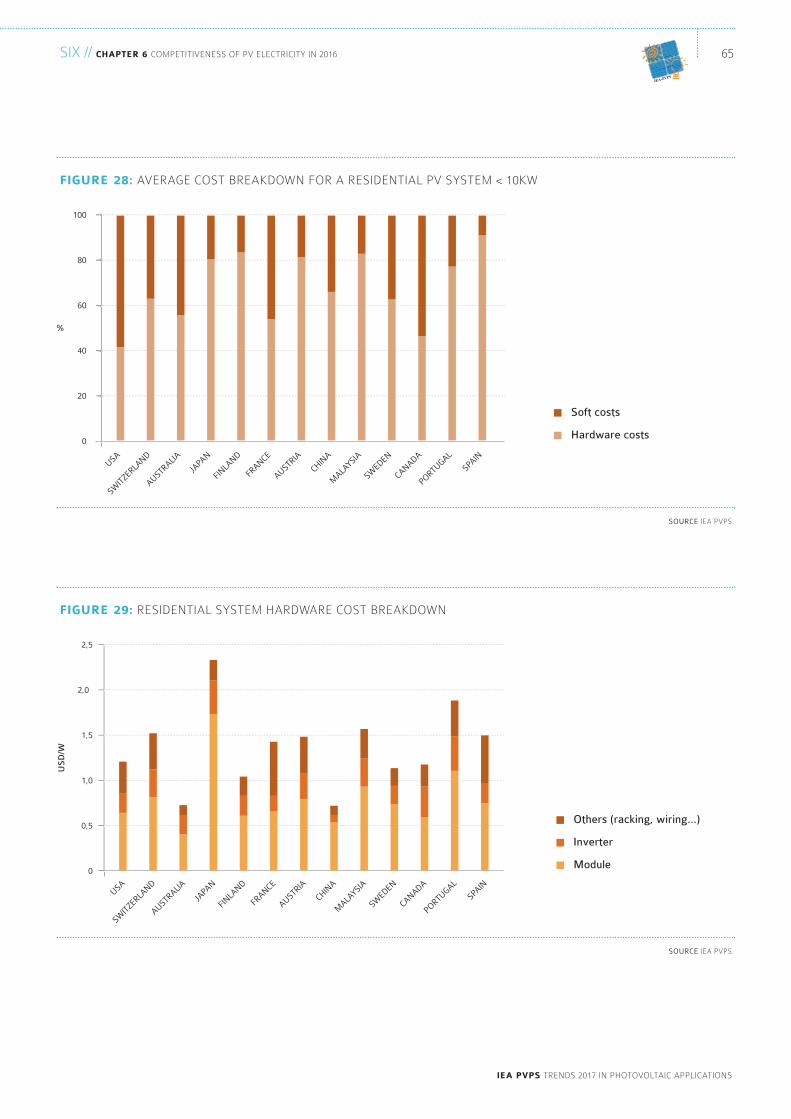
65
ieA PVPS trendS 2017 In PHotoVoltAIc APPlIcAtIonS
SIx // chAPter 6 coMPetItIVeneSS oF PV electrIcIty In 2016
IEA-PVPS
SOURCE IeA PVPS.
fiGure 29: reSIdentIAl SySteM HArdwAre coSt breAkdown
0
0,5
1,0
1,5
2,0
2,5
US
D/W
USA
SWITZERLAND
AUSTRALIA
JAPAN
FINLAND
FRANCE
AUSTRIA
CHINA
SWEDEN
CANADA
PORTUGAL
SPAIN
MALAYSIA
Module
Inverter
Others (racking, wiring...)
SOURCE IeA PVPS.
fiGure 28: AVerAGe coSt breAkdown For A reSIdentIAl PV SySteM < 10kw
0
20
40
60
80
100
%
USA
SWITZERLAND
AUSTRALIA
JAPAN
FINLAND
FRANCE
AUSTRIA
CHINA
SWEDEN
CANADA
PORTUGAL
SPAIN
MALAYSIA
Hardware costs
Soft costs
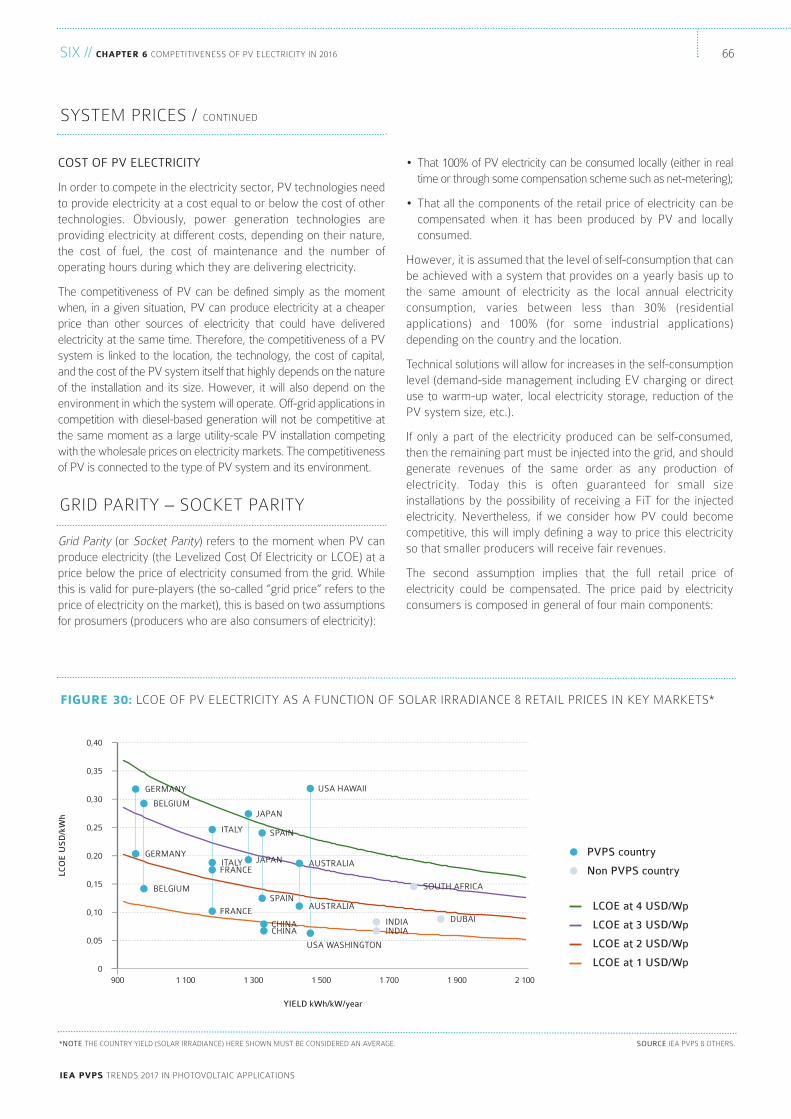
ieA PVPS trendS 2017 In PHotoVoltAIc APPlIcAtIonS
SIx // chAPter 6 coMPetItIVeneSS oF PV electrIcIty In 2016 66
COST OF PV ELECTRICITY
In order to compete in the electricity sector, PV technologies needto provide electricity at a cost equal to or below the cost of othertechnologies. obviously, power generation technologies areproviding electricity at different costs, depending on their nature,the cost of fuel, the cost of maintenance and the number ofoperating hours during which they are delivering electricity.
the competitiveness of PV can be defined simply as the momentwhen, in a given situation, PV can produce electricity at a cheaperprice than other sources of electricity that could have deliveredelectricity at the same time. therefore, the competitiveness of a PVsystem is linked to the location, the technology, the cost of capital,and the cost of the PV system itself that highly depends on the natureof the installation and its size. However, it will also depend on theenvironment in which the system will operate. off-grid applications incompetition with diesel-based generation will not be competitive atthe same moment as a large utility-scale PV installation competingwith the wholesale prices on electricity markets. the competitivenessof PV is connected to the type of PV system and its environment.
Grid Parity (or Socket Parity) refers to the moment when PV canproduce electricity (the levelized cost of electricity or lcoe) at aprice below the price of electricity consumed from the grid. whilethis is valid for pure-players (the so-called “grid price” refers to theprice of electricity on the market), this is based on two assumptionsfor prosumers (producers who are also consumers of electricity):
• that 100% of PV electricity can be consumed locally (either in realtime or through some compensation scheme such as net-metering);
• that all the components of the retail price of electricity can becompensated when it has been produced by PV and locallyconsumed.
However, it is assumed that the level of self-consumption that canbe achieved with a system that provides on a yearly basis up tothe same amount of electricity as the local annual electricityconsumption, varies between less than 30% (residentialapplications) and 100% (for some industrial applications)depending on the country and the location.
technical solutions will allow for increases in the self-consumptionlevel (demand-side management including eV charging or directuse to warm-up water, local electricity storage, reduction of thePV system size, etc.).
If only a part of the electricity produced can be self-consumed,then the remaining part must be injected into the grid, and shouldgenerate revenues of the same order as any production ofelectricity. today this is often guaranteed for small sizeinstallations by the possibility of receiving a Fit for the injectedelectricity. nevertheless, if we consider how PV could becomecompetitive, this will imply defining a way to price this electricityso that smaller producers will receive fair revenues.
the second assumption implies that the full retail price ofelectricity could be compensated. the price paid by electricityconsumers is composed in general of four main components:
GrId PArIty – Socket PArIty
SySteM PrIceS / contInUed
SOURCE IeA PVPS & otHerS.*NOTE tHe coUntry yIeld (SolAr IrrAdIAnce) Here SHown MUSt be conSIdered An AVerAGe.
0
0,05
0,10
0,15
0,20
0,25
0,30
0,35
0,40
LCO
E U
SD
/kW
h
900 1 100 1 300 1 500 1 700 1 900 2 100
LCOE at 4 USD/Wp
LCOE at 3 USD/Wp
LCOE at 2 USD/Wp
LCOE at 1 USD/Wp
YIELD kWh/kW/year
JAPAN
USA HAWAII
FRANCE
SPAIN
GERMANY
CHINA
BELGIUM
JAPANGERMANY
BELGIUM
USA WASHINGTON
SPAIN
CHINA
FRANCEITALY
ITALY
AUSTRALIA
AUSTRALIA
DUBAIINDIAINDIA
SOUTH AFRICA
Non PVPS country
PVPS country
fiGure 30: lcoe oF PV electrIcIty AS A FUnctIon oF SolAr IrrAdIAnce & retAIl PrIceS In key MArketS*
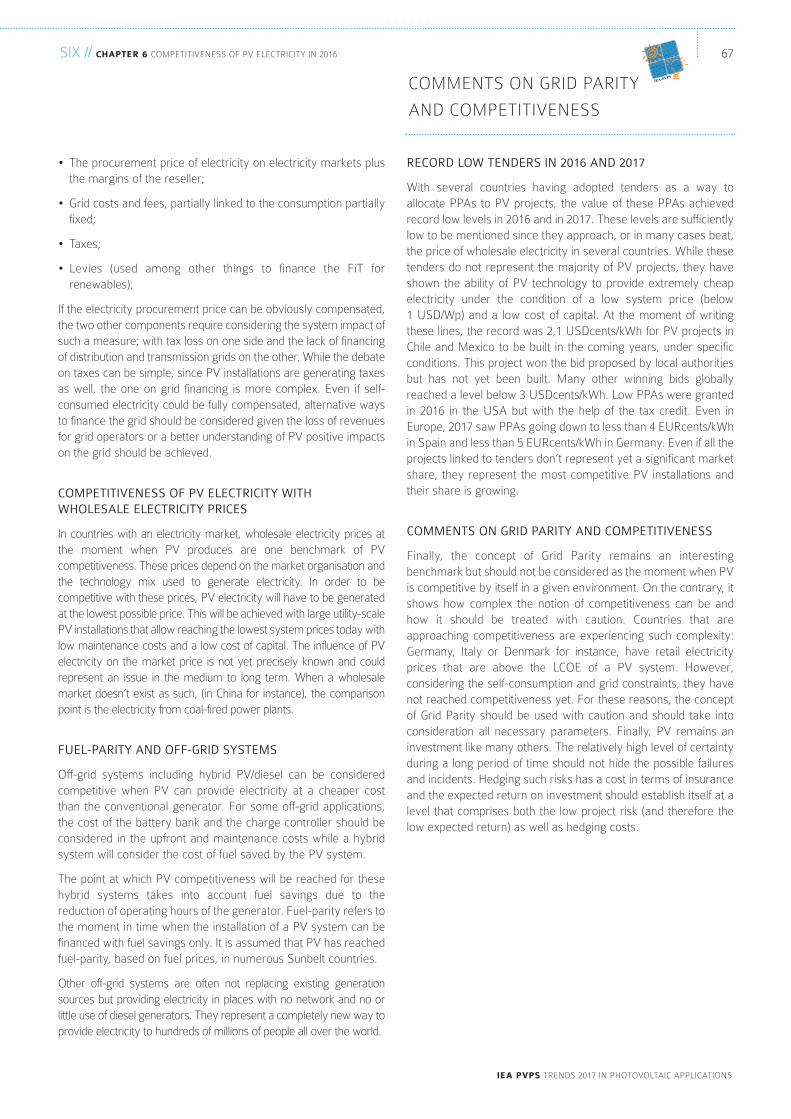
ieA PVPS trendS 2017 In PHotoVoltAIc APPlIcAtIonS
67SIx // chAPter 6 coMPetItIVeneSS oF PV electrIcIty In 2016
IEA-PVPScoMMentS on GrId PArIty
And coMPetItIVeneSS
RECORD LOW TENDERS IN 2016 AND 2017
with several countries having adopted tenders as a way toallocate PPAs to PV projects, the value of these PPAs achievedrecord low levels in 2016 and in 2017. these levels are sufficientlylow to be mentioned since they approach, or in many cases beat,the price of wholesale electricity in several countries. while thesetenders do not represent the majority of PV projects, they haveshown the ability of PV technology to provide extremely cheapelectricity under the condition of a low system price (below 1 USd/wp) and a low cost of capital. At the moment of writingthese lines, the record was 2,1 USdcents/kwh for PV projects inchile and Mexico to be built in the coming years, under specificconditions. this project won the bid proposed by local authoritiesbut has not yet been built. Many other winning bids globallyreached a level below 3 USdcents/kwh. low PPAs were grantedin 2016 in the USA but with the help of the tax credit. even ineurope, 2017 saw PPAs going down to less than 4 eUrcents/kwhin Spain and less than 5 eUrcents/kwh in Germany. even if all theprojects linked to tenders don’t represent yet a significant marketshare, they represent the most competitive PV installations andtheir share is growing.
COMMENTS ON GRID PARITY AND COMPETITIVENESS
Finally, the concept of Grid Parity remains an interestingbenchmark but should not be considered as the moment when PVis competitive by itself in a given environment. on the contrary, itshows how complex the notion of competitiveness can be andhow it should be treated with caution. countries that areapproaching competitiveness are experiencing such complexity:Germany, Italy or denmark for instance, have retail electricityprices that are above the lcoe of a PV system. However,considering the self-consumption and grid constraints, they havenot reached competitiveness yet. For these reasons, the conceptof Grid Parity should be used with caution and should take intoconsideration all necessary parameters. Finally, PV remains aninvestment like many others. the relatively high level of certaintyduring a long period of time should not hide the possible failuresand incidents. Hedging such risks has a cost in terms of insuranceand the expected return on investment should establish itself at alevel that comprises both the low project risk (and therefore thelow expected return) as well as hedging costs.
• the procurement price of electricity on electricity markets plusthe margins of the reseller;
• Grid costs and fees, partially linked to the consumption partiallyfixed;
• taxes;
• levies (used among other things to finance the Fit forrenewables);
If the electricity procurement price can be obviously compensated,the two other components require considering the system impact ofsuch a measure; with tax loss on one side and the lack of financingof distribution and transmission grids on the other. while the debateon taxes can be simple, since PV installations are generating taxesas well, the one on grid financing is more complex. even if self-consumed electricity could be fully compensated, alternative waysto finance the grid should be considered given the loss of revenuesfor grid operators or a better understanding of PV positive impactson the grid should be achieved.
COMPETITIVENESS OF PV ELECTRICITY WITHWHOLESALE ELECTRICITY PRICES
In countries with an electricity market, wholesale electricity prices atthe moment when PV produces are one benchmark of PVcompetitiveness. these prices depend on the market organisation andthe technology mix used to generate electricity. In order to becompetitive with these prices, PV electricity will have to be generatedat the lowest possible price. this will be achieved with large utility-scalePV installations that allow reaching the lowest system prices today withlow maintenance costs and a low cost of capital. the influence of PVelectricity on the market price is not yet precisely known and couldrepresent an issue in the medium to long term. when a wholesalemarket doesn’t exist as such, (in china for instance), the comparisonpoint is the electricity from coal-fired power plants.
FUEL-PARITY AND OFF-GRID SYSTEMS
off-grid systems including hybrid PV/diesel can be consideredcompetitive when PV can provide electricity at a cheaper costthan the conventional generator. For some off-grid applications,the cost of the battery bank and the charge controller should beconsidered in the upfront and maintenance costs while a hybridsystem will consider the cost of fuel saved by the PV system.
the point at which PV competitiveness will be reached for thesehybrid systems takes into account fuel savings due to thereduction of operating hours of the generator. Fuel-parity refers tothe moment in time when the installation of a PV system can befinanced with fuel savings only. It is assumed that PV has reachedfuel-parity, based on fuel prices, in numerous Sunbelt countries.
other off-grid systems are often not replacing existing generationsources but providing electricity in places with no network and no orlittle use of diesel generators. they represent a completely new way toprovide electricity to hundreds of millions of people all over the world.
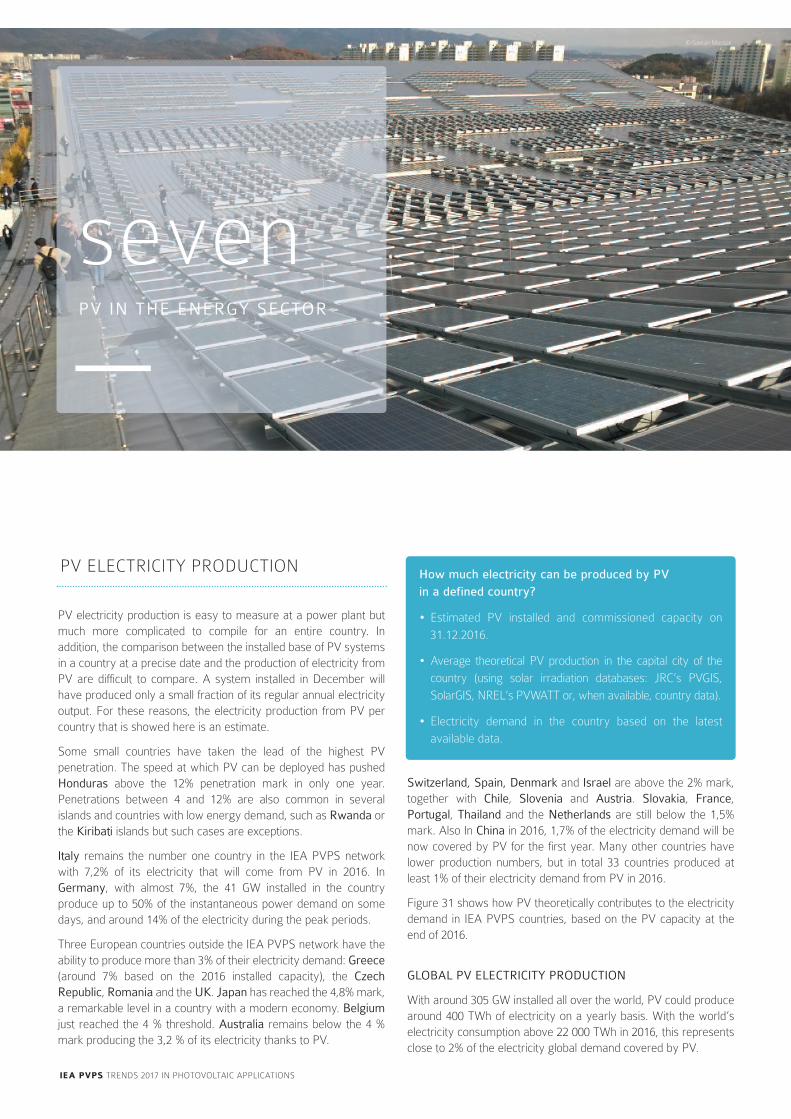
ieA PVPS trendS 2017 In PHotoVoltAIc APPlIcAtIonS
sevenPV IN THE ENERGY SECTOR
© Gaetan Masson
Switzerland, Spain, Denmark and Israel are above the 2% mark,together with Chile, Slovenia and Austria. Slovakia, France,Portugal, Thailand and the Netherlands are still below the 1,5%mark. Also In China in 2016, 1,7% of the electricity demand will benow covered by PV for the first year. Many other countries havelower production numbers, but in total 33 countries produced atleast 1% of their electricity demand from PV in 2016.
Figure 31 shows how PV theoretically contributes to the electricitydemand in IeA PVPS countries, based on the PV capacity at theend of 2016.
GLOBAL PV ELECTRICITY PRODUCTION
with around 305 Gw installed all over the world, PV could producearound 400 twh of electricity on a yearly basis. with the world’selectricity consumption above 22 000 twh in 2016, this representsclose to 2% of the electricity global demand covered by PV.
PV electricity production is easy to measure at a power plant butmuch more complicated to compile for an entire country. Inaddition, the comparison between the installed base of PV systemsin a country at a precise date and the production of electricity fromPV are difficult to compare. A system installed in december willhave produced only a small fraction of its regular annual electricityoutput. For these reasons, the electricity production from PV percountry that is showed here is an estimate.
Some small countries have taken the lead of the highest PVpenetration. the speed at which PV can be deployed has pushedHonduras above the 12% penetration mark in only one year.Penetrations between 4 and 12% are also common in severalislands and countries with low energy demand, such as Rwanda orthe Kiribati islands but such cases are exceptions.
Italy remains the number one country in the IeA PVPS networkwith 7,2% of its electricity that will come from PV in 2016. InGermany, with almost 7%, the 41 Gw installed in the countryproduce up to 50% of the instantaneous power demand on somedays, and around 14% of the electricity during the peak periods.
three european countries outside the IeA PVPS network have theability to produce more than 3% of their electricity demand: Greece(around 7% based on the 2016 installed capacity), the CzechRepublic, Romania and the UK. Japan has reached the 4,8% mark,a remarkable level in a country with a modern economy. Belgiumjust reached the 4 % threshold. Australia remains below the 4 %mark producing the 3,2 % of its electricity thanks to PV.
PV electrIcIty ProdUctIon How much electricity can be produced by PV in a defined country?
• estimated PV installed and commissioned capacity on
31.12.2016.
• Average theoretical PV production in the capital city of the
country (using solar irradiation databases: Jrc’s PVGIS,
SolarGIS, nrel’s PVwAtt or, when available, country data).
• electricity demand in the country based on the latest
available data.
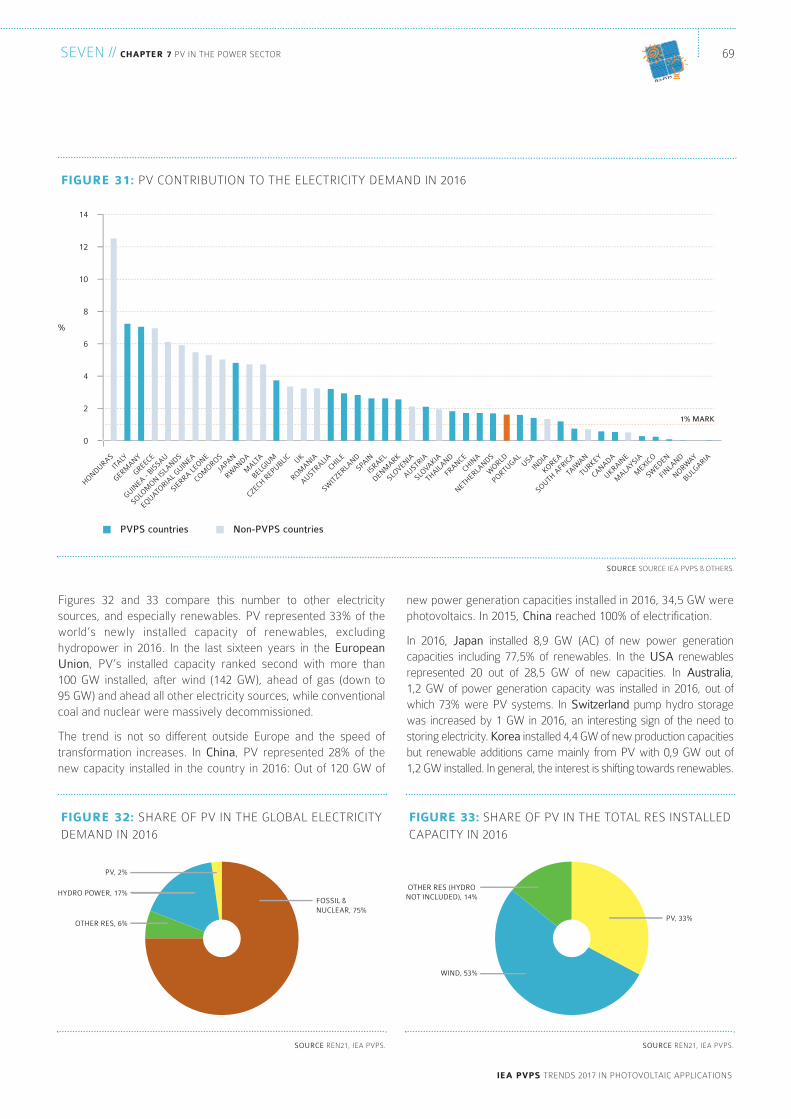
ieA PVPS trendS 2017 In PHotoVoltAIc APPlIcAtIonS
new power generation capacities installed in 2016, 34,5 Gw werephotovoltaics. In 2015, China reached 100% of electrification.
In 2016, Japan installed 8,9 Gw (Ac) of new power generationcapacities including 77,5% of renewables. In the USA renewablesrepresented 20 out of 28,5 Gw of new capacities. In Australia, 1,2 Gw of power generation capacity was installed in 2016, out ofwhich 73% were PV systems. In Switzerland pump hydro storagewas increased by 1 Gw in 2016, an interesting sign of the need tostoring electricity. Korea installed 4,4 Gw of new production capacitiesbut renewable additions came mainly from PV with 0,9 Gw out of 1,2 Gw installed. In general, the interest is shifting towards renewables.
Figures 32 and 33 compare this number to other electricitysources, and especially renewables. PV represented 33% of theworld’s newly installed capacity of renewables, excludinghydropower in 2016. In the last sixteen years in the EuropeanUnion, PV’s installed capacity ranked second with more than 100 Gw installed, after wind (142 Gw), ahead of gas (down to 95 Gw) and ahead all other electricity sources, while conventionalcoal and nuclear were massively decommissioned.
the trend is not so different outside europe and the speed oftransformation increases. In China, PV represented 28% of thenew capacity installed in the country in 2016: out of 120 Gw of
SOURCE SoUrce IeA PVPS & otHerS.
fiGure 31: PV contrIbUtIon to tHe electrIcIty deMAnd In 2016
0
14
12
10
8
6
4
2
%
TURKEY
SWEDEN
MEXIC
O
HONDURASITA
LY
GREECE
GERMANY
FINLA
ND
NORWAY
BULGARIA
GUINEA -
BISSAU
SOLOM
ON ISLA
NDS
EQUATORIA
L GUIN
EA
SIERRA LE
ONE
COMOROS
RWANDA
MALT
A
BELGIU
M
JAPA
N
CZECH REPUBLIC
SPAIN
ROMANIA
AUSTRALIAUK
SWIT
ZERLAND
ISRAEL
DENMARK
SLOVENIA
SLOVAKIA
CHILE
FRANCE
AUSTRIA
THAILA
ND
PORTUGAL
NETHERLA
NDS
WORLD
CHINA
KOREAUSA
INDIA
SOUTH A
FRIC
A
CANADA
UKRAINE
TAIW
AN
MALA
YSIA
PVPS countries Non-PVPS countries
1% MARK
SOURCE ren21, IeA PVPS.
fiGure 32: SHAre oF PV In tHe GlobAl electrIcIty
deMAnd In 2016
FOSSIL & NUCLEAR, 75%
HYDRO POWER, 17%
OTHER RES, 6%
PV, 2%
SOURCE ren21, IeA PVPS.
fiGure 33: SHAre oF PV In tHe totAl reS InStAlled
cAPAcIty In 2016
PV, 33%
WIND, 53%
OTHER RES (HYDRO NOT INCLUDED), 14%
69SeVen // chAPter 7 PV In tHe Power Sector
IEA-PVPS
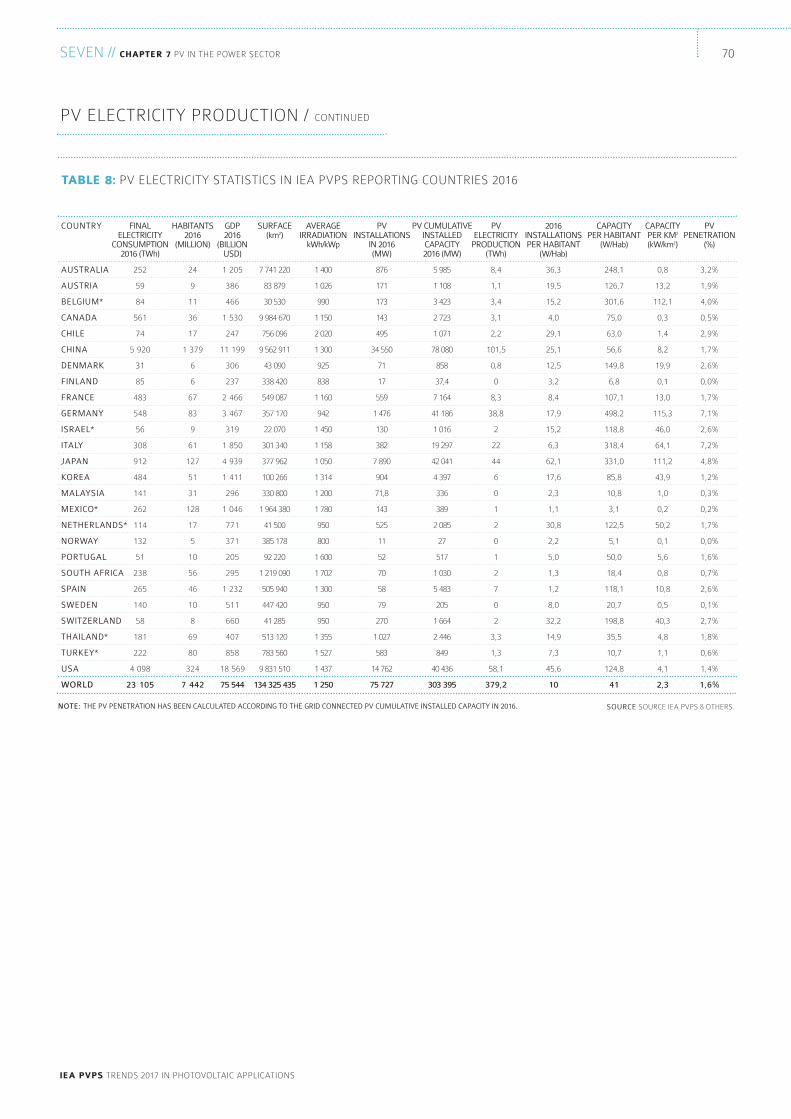
ieA PVPS trendS 2017 In PHotoVoltAIc APPlIcAtIonS
SeVen // chAPter 7 PV In tHe Power Sector 70
PV electrIcIty ProdUctIon / contInUed
tAble 8: PV electrIcIty StAtIStIcS In IeA PVPS rePortInG coUntrIeS 2016
COUNTRY
AUSTRALIA
AUSTRIA
BELGIUM*
CANADA
CHILE
CHINA
DENMARK
FINLAND
FRANCE
GERMANY
ISRAEL*
ITALY
JAPAN
KOREA
MALAYSIA
MEXICO*
NETHERLANDS*
NORWAY
PORTUGAL
SOUTH AFRICA
SPAIN
SWEDEN
SWITZERLAND
THAILAND*
TURKEY*
USA
WORLD
FINALELECTRICITY
CONSUMPTION2016 (TWh)
252
59
84
561
74
5 920
31
85
483
548
56
308
912
484
141
262
114
132
51
238
265
140
58
181
222
4 098
23 105
HABITANTS 2016
(MILLION)
24
9
11
36
17
1 379
6
6
67
83
9
61
127
51
31
128
17
5
10
56
46
10
8
69
80
324
7 442
GDP2016
(BILLION USD)
1 205
386
466
1 530
247
11 199
306
237
2 466
3 467
319
1 850
4 939
1 411
296
1 046
771
371
205
295
1 232
511
660
407
858
18 569
75 544
SURFACE (km2)
7 741 220
83 879
30 530
9 984 670
756 096
9 562 911
43 090
338 420
549 087
357 170
22 070
301 340
377 962
100 266
330 800
1 964 380
41 500
385 178
92 220
1 219 090
505 940
447 420
41 285
513 120
783 560
9 831 510
134 325 435
AVERAGEIRRADIATION
kWh/kWp
1 400
1 026
990
1 150
2 020
1 300
925
838
1 160
942
1 450
1 158
1 050
1 314
1 200
1 780
950
800
1 600
1 702
1 300
950
950
1 355
1 527
1 437
1 250
PV CUMULATIVEINSTALLEDCAPACITY 2016 (MW)
5 985
1 108
3 423
2 723
1 071
78 080
858
37,4
7 164
41 186
1 016
19 297
42 041
4 397
336
389
2 085
27
517
1 030
5 483
205
1 664
2 446
849
40 436
303 395
PVINSTALLATIONS
IN 2016(MW)
876
171
173
143
495
34 550
71
17
559
1 476
130
382
7 890
904
71,8
143
525
11
52
70
58
79
270
1 027
583
14 762
75 727
PVPENETRATION
(%)
3,2%
1,9%
4,0%
0,5%
2,9%
1,7%
2,6%
0,0%
1,7%
7,1%
2,6%
7,2%
4,8%
1,2%
0,3%
0,2%
1,7%
0,0%
1,6%
0,7%
2,6%
0,1%
2,7%
1,8%
0,6%
1,4%
1,6%
PV ELECTRICITY
PRODUCTION (TWh)
8,4
1,1
3,4
3,1
2,2
101,5
0,8
0
8,3
38,8
2
22
44
6
0
1
2
0
1
2
7
0
2
3,3
1,3
58,1
379,2
2016INSTALLATIONSPER HABITANT
(W/Hab)
36,3
19,5
15,2
4,0
29,1
25,1
12,5
3,2
8,4
17,9
15,2
6,3
62,1
17,6
2,3
1,1
30,8
2,2
5,0
1,3
1,2
8,0
32,2
14,9
7,3
45,6
10
CAPACITY PER HABITANT
(W/Hab)
248,1
126,7
301,6
75,0
63,0
56,6
149,8
6,8
107,1
498,2
118,8
318,4
331,0
85,8
10,8
3,1
122,5
5,1
50,0
18,4
118,1
20,7
198,8
35,5
10,7
124,8
41
CAPACITY PER KM2
(kW/km2)
0,8
13,2
112,1
0,3
1,4
8,2
19,9
0,1
13,0
115,3
46,0
64,1
111,2
43,9
1,0
0,2
50,2
0,1
5,6
0,8
10,8
0,5
40,3
4,8
1,1
4,1
2,3
SOURCE SoUrce IeA PVPS & otHerS. NOTE: THE PV PENETRATION HAS BEEN CALCULATED ACCORDING TO THE GRID CONNECTED PV CUMULATIVE INSTALLED CAPACITY IN 2016.
71
ieA PVPS trendS 2017 In PHotoVoltAIc APPlIcAtIonS
SeVen // chAPter 7 PV In tHe Power Sector
IEA-PVPS
In several european countries, small local utilities are taking apositive approach towards the development of PV, as in Swedenor Switzerland by proposing investment in PV plants in exchangeof rebates on the electricity bills or free electricity. In Denmark,energiMidt made use of capital incentives for a couple of years for its customers willing to deploy PV. In Austria, the utility of thecity of Vienna proposes innovative products such as virtualstorage for prosumers or the investment in distant PV plantsagainst free electricity.
In Japan, utilities are engaging into the development of PVsystems across the country and have started using PV in theirown facilities. In China, most utilities are involved in solardevelopment one way or another. Among the big five utilities, PVproduction used to be a part of the business until the productionboomed in the last years, making investments for additionalcapacities more important.
In Canada, the calgary Utility developed its Generate choiceProgramme where it offers customers a selection of pricingprogrammes for 1,3 kw systems or more. In ontario, severalutilities are offering solar installations and maintenanceprogrammes for their customers. roof leasing exists in parallel tothe offering of turnkey solutions. Utility involvement offers them abetter control on the distribution systems that they operate andthe possibility to offer additional services to their customers.
In the USA, in addition to similar offerings, some utilities arestarting to oppose PV development, and especially the net-metering system. In Arizona and california, the debate was quiteintense in 2013, concerning the viability of net-metering schemesfor PV. However, utilities are also sizing opportunities for businessand are starting to offer products or to develop PV plantsthemselves. third-party investment comes often from privatecompanies disconnected from the utilities.
In Australia, the fast development of PV has raised concernsabout the future business model of utilities. established generatorsare losing market share, especially during the daytime peak loadperiod where electricity prices used to be quite high. However,the two largest retailers have stepped into the PV business,capturing significant market share.
In addition to conventional utilities, large PV developers could beseen as the utilities of tomorrow; developing, operating and tradingPV electricity on the markets. A simple comparison between theinstalled capacity of some renewable energy developers andconventional utilities shows how these young companies havesucceeded in developing many more plants than older companies.
In this section, the word “Utilities” will be used to qualify electricityproducers and retailers. In some parts of the world, especially ineurope, the management of the electricity network is nowseparated from the electricity generation and selling business.this section will then focus on the role of electricity producers andretailers in developing the PV market.
In europe, the involvement of utilities in the PV business remainsquite heterogeneous, with major differences from one country toanother. In Germany, where the penetration of PV provides alreadyclose to 7% of the electricity demand, the behaviour of utilities canbe seen as a mix of an opposition towards PV development andattempts to take part in the development of this new business.companies such as e.on have established subsidiaries to targetthe PV on rooftop customers but are delaying the start of theircommercial operations. At the end of 2014, e.on decided to split intwo companies, with one of them focusing on renewable energydevelopment; in 2016 rwe decided to opt for the same strategy.other utilities such as MVV are starting to propose PV and storage-based services. In France, edF, the main utility in the country hasset up a subsidiary that develops utility-scale PV plants in europeand north America. end 2016, edF-en owned close to 1 Gw of PVsystems in various countries. In addition, another subsidiary of edF,edF-enr, took over the integrated producer of PV modules,Photowatt, present along the whole value chain and restarted itsactivities with the aim to provide less than 100 Mw of PV modulesfor in-house projects. the same subsidiary offers PV systems forsmall rooftop applications, commercial, industrial and agriculturalapplications. two other major French energy actors are presentedin the PV sector: enGIe (formerly GdF Suez), the French gas andengineering company develops utility-scale PV plants (and hasacquired Solairedirect, a competitive developer active globally) andits subsidiary in Belgium starts to propose PV services for rooftopapplications. total, the French oil and gas giant, which possessedmany companies related to PV for years, has acquired SunPowerand has integrated solar in its communication. It has created in 2017a division called total Solar, aiming at PV development and hasacquired SAFt, a french battery manufacturer.
In Italy, the main utility, enel, owns a reS-focused subsidiary,enel Green Power, which invests and builds utility-scale PVpower plants all over the world, including in its home country. At theend of 2016, eGP had more than 1,5 Gw of PV power plants inoperation and much more in development. It won severalcompetitive tenders in several key countries and appears as one ofthe leading developers. In addition, it produces in Italy thin-film multi-junction (composed of amorphous and microcrystalline silicon) PVmodules through 3SUn, founded as joint venture with Sharp andStMicroelectronics and now totally owned by eGP, using it for in-house projects. In 2017 it announced its willingness to shift theproduction towards mainly HeteroJunction cells and modules.
electrIc UtIlItIeS InVolVeMent In PV
conclUSIon // ieA PVPS trendS 2017 In PHotoVoltAIc APPlIcAtIonS
ieA PVPS trendS 2017 In PHotoVoltAIc APPlIcAtIonS
72
models for PV deployment, even if super-low prices cannot bealways considered as competitive. PV is more and more seen asa way to produce electricity locally rather than buying it from thegrid. Self-consumption opens the door for the large deployment ofPV on rooftops, and the transformation of the electricity system ina decentralized way. In parallel, large-scale PV continued toprogress, with plant announcements now up to 2000 Mw. eachyear, larger plants are connected to the grid and plans for evenbigger plants are being disclosed. However, PV is not only on therise in developed countries, it also offers adequate products tobring electricity in places where grids are not yet developed. thedecline of prices for off-grid systems offers new opportunities toelectrify millions of people around the world who have neverbenefited from it before.
the challenges are still numerous before PV can become a majorsource of electricity in the world. the way how distribution gridscould cope with high shares of PV electricity, generation adequacyand balancing challenges in systems with high shares of variablerenewables, and the cost of transforming existing grids will be atthe cornerstone of PV deployment in the coming years.Moreover, the ability to successfully transform electricity marketsto integrate PV electricity in a fair and sustainable way will haveto be scrutinized. but the trend is clear: PV is now recognized asa competitive electricity source, so competitive that it may dwarfmany competitors in the coming years..the price of PV electricitywill continue to decline and accordingly, its competitiveness. thequest for PV installation quality will continue and will improve PVsystem reliability together with lowering the perceived risk ofowning and maintaining PV power plants.
Finally, the ability of the PV industry to lower its costs in thecoming years and to present innovative products will become thekey challenge. Financing new production capacities in a PVmarket above 100 Gw a year will be key. Manufacturing of PVremains a poloitical subject that will have to be scrutinized.
the road to PV competitiveness is open but remains complex andlinked to political decisions. nevertheless, the assets of PV arenumerous and as seen in this 22nd edition of the IeA PVPS trendsreport, the appetite for PV electricity grows all over the world. theroad will be long before PV will represent a major source ofelectricity in most countries, but as some european countries haveshown in recent years, PV has the ability to continue progressingfast and become the major source of electricity in the world.
the year 2016 experienced again a significant growth of the PVmarket and confirmed the Asian leadership on the PV market andindustry. PV has entered rapidly into a new era where the PVmarket concentrates in countries with energy needs and ad hocpolicies. two of the top three markets in 2016 were located in Asia(china and Japan), followed by a booming US market and europeas a whole. India and many emerging markets can be consideredas the fastest growing part of the market.
this trend should be confirmed again in 2017, with Asiaconsolidating the core of the PV market, and bringing someadditional growth, followed by the Americas, India and europe.with PV development occurring in latin America, Africa and theMiddle east, it becomes clear that in the short term, all continentswill experience a sound PV development, with various patterns. Itis important to note that new markets spots have popped up inmany places around the world, from the Philippines to Abu dhabiand Jordan or Mexico, confirming the globalization trends.
In Asia, next to china and Japan, thailand, korea, taiwan,Vietnam, the Philippines and many other countries are starting orcontinuing to develop. India becomes the fifth pole of PVdevelopment, and the plans to install 100 Gw in the coming yearswill lead to enough installations to reach that goal. even if the goalis ambitious, especially in the distributed segments, theannouncement in 2017 of large tenders will support thedevelopment. the Americas are following at a slower pace, withlatin America starting to engage in PV development in Mexico,Peru, brazil, Panama, Honduras and of course chile, the numberone market in the region again in 2016. Mexico will most probablylead the pace from 2018 onwards.
the price decrease that has been experienced in the last yearsrestarted in the second quarter of 2016 and continued in 2017. Ithas brought several countries and market segments close to areal level of competitiveness. this is true in countries where theretail price of electricity in several consumers segments is nowhigher than the PV electricity’s production cost. this is also true inseveral other countries for utility-scale PV or hybrid systems.However, the distributed segments experience difficulties in manycountries, due to the difficulties to set-up sometimes complexregulations for self-consumption. In that respect, the absolutemarket size for distributed PV applications remained roughlystable from 2011 to 2015 and increase only slightly in 2016 whilethe utility-scale market boomed significantly. competitive tendershave also paved the way for low PV electricity prices in severalkey markets. these declining prices are opening new business
conclUSIon – A cHAllenGInG yeAr
SURVEY METHOD key data for this publication were drawn mostly from national survey reports and information summaries, which weresupplied by representatives from each of the reporting countries. these national survey reports can be found on the website www.iea-pvps.org.Information from the countries outside IeA PVPS are drawn from a variety of sources and, while every attempt is made to ensure theiraccuracy, the validity of some of these data cannot be assured with the same level of confidence as for IeA PVPS member countries.

73
ieA PVPS trendS 2017 In PHotoVoltAIc APPlIcAtIonS
IEA-PVPS
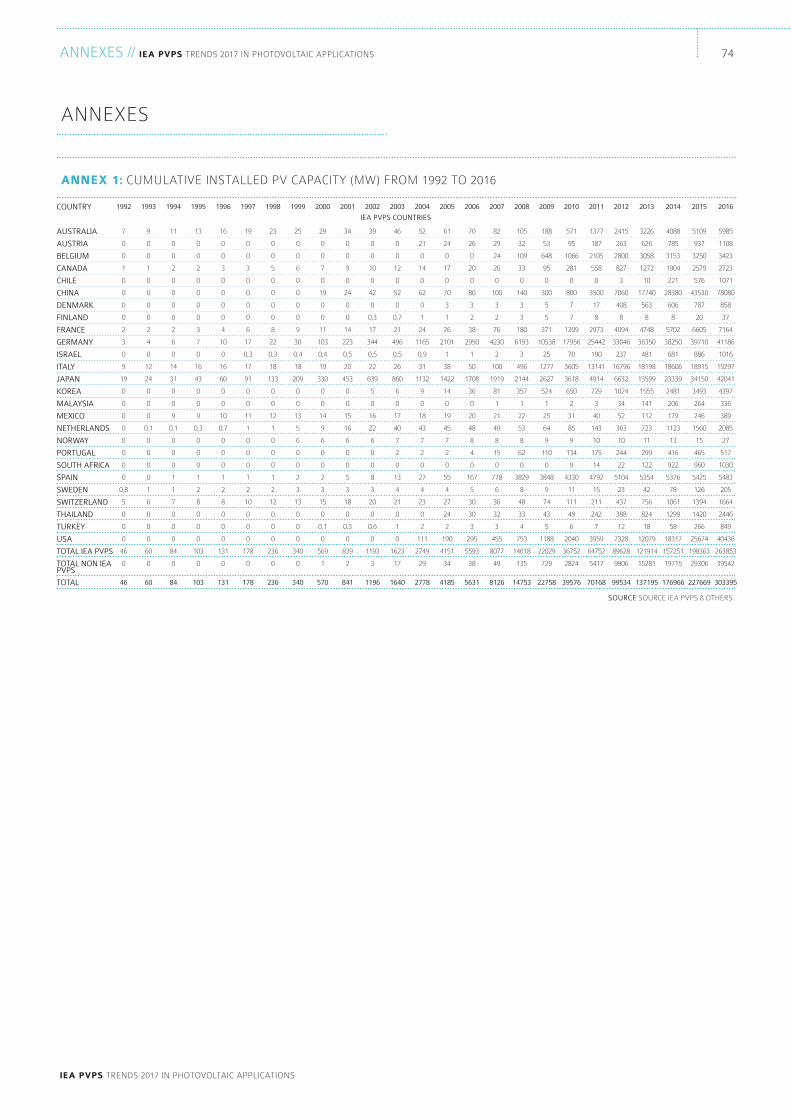
AnnexeS // ieA PVPS trendS 2017 In PHotoVoltAIc APPlIcAtIonS
ieA PVPS trendS 2017 In PHotoVoltAIc APPlIcAtIonS
74
AnnexeS
Annex 1: cUMUlAtIVe InStAlled PV cAPAcIty (Mw) FroM 1992 to 2016
IEA PVPS COUNTRIES
1992
7
0
0
1
0
0
0
0
2
3
0
9
19
0
0
0
0
0
0
0
0
0,8
5
0
0
0
46
0
46
1993
9
0
0
1
0
0
0
0
2
4
0
12
24
0
0
0
0,1
0
0
0
0
1
6
0
0
0
60
0
60
1994
11
0
0
2
0
0
0
0
2
6
0
14
31
0
0
9
0,1
0
0
0
1
1
7
0
0
0
84
0
84
1995
13
0
0
2
0
0
0
0
3
7
0
16
43
0
0
9
0,3
0
0
0
1
2
8
0
0
0
103
0
103
1996
16
0
0
3
0
0
0
0
4
10
0
16
60
0
0
10
0,7
0
0
0
1
2
8
0
0
0
131
0
131
1997
19
0
0
3
0
0
0
0
6
17
0,3
17
91
0
0
11
1
0
0
0
1
2
10
0
0
0
178
0
178
1998
23
0
0
5
0
0
0
0
8
22
0,3
18
133
0
0
12
1
0
0
0
1
2
12
0
0
0
236
0
236
1999
25
0
0
6
0
0
0
0
9
30
0,4
18
209
0
0
13
5
6
0
0
2
3
13
0
0
0
340
0
340
2000
29
0
0
7
0
19
0
0
11
103
0,4
19
330
0
0
14
9
6
0
0
2
3
15
0
0,1
0
569
1
570
2001
34
0
0
9
0
24
0
0
14
223
0,5
20
453
0
0
15
16
6
0
0
5
3
18
0
0,3
0
839
2
841
2002
39
0
0
10
0
42
0
0,3
17
344
0,5
22
639
5
0
16
22
6
0
0
8
3
20
0
0,6
0
1193
3
1196
2003
46
0
0
12
0
52
0
0,7
21
496
0,5
26
860
6
0
17
40
7
2
0
13
4
21
0
1
0
1623
17
1640
2004
52
21
0
14
0
62
0
1
24
1165
0,9
31
1132
9
0
18
43
7
2
0
27
4
23
0
2
111
2749
29
2778
2005
61
24
0
17
0
70
3
1
26
2101
1
38
1422
14
0
19
45
7
2
0
55
4
27
24
2
190
4151
34
4185
2006
70
26
0
20
0
80
3
2
38
2950
1
50
1708
36
0
20
48
8
4
0
167
5
30
30
3
295
5593
38
5631
2007
82
29
24
26
0
100
3
2
76
4230
2
100
1919
81
1
21
49
8
15
0
778
6
36
32
3
455
8077
49
8126
2008
105
32
109
33
0
140
3
3
180
6193
3
496
2144
357
1
22
53
8
62
0
3829
8
48
33
4
753
14618
135
14753
2009
188
53
648
95
0
300
5
5
371
10538
25
1277
2627
524
1
25
64
9
110
0
3848
9
74
43
5
1188
22029
729
22758
2010
571
95
1066
281
0
800
7
7
1209
17956
70
3605
3618
650
2
31
85
9
134
9
4330
11
111
49
6
2040
36752
2824
39576
2011
1377
187
2105
558
0
3500
17
8
2973
25442
190
13141
4914
729
3
40
143
10
175
14
4792
15
211
242
7
3959
64752
5417
70168
2012
2415
263
2800
827
3
7060
408
8
4094
33046
237
16796
6632
1024
34
52
363
10
244
22
5104
23
437
388
12
7328
89628
9906
99534
2013
3226
626
3058
1272
10
17740
563
8
4748
36350
481
18198
13599
1555
141
112
723
11
299
122
5354
42
756
824
18
12079
121914
15281
137195
2014
4088
785
3153
1904
221
28380
606
8
5702
38250
681
18606
23339
2481
206
179
1123
13
416
922
5376
78
1061
1299
58
18317
157251
19715
176966
2015
5109
937
3250
2579
576
43530
787
20
6605
39710
886
18915
34150
3493
264
246
1560
15
465
960
5425
126
1394
1420
266
25674
198363
29306
227669
2016
5985
1108
3423
2723
1071
78080
858
37
7164
41186
1016
19297
42041
4397
336
389
2085
27
517
1030
5483
205
1664
2446
849
40436
263853
39542
303395
SOURCE SoUrce IeA PVPS & otHerS.
COUNTRY
AUSTRALIA
AUSTRIA
BELGIUM
CANADA
CHILE
CHINA
DENMARK
FINLAND
FRANCE
GERMANY
ISRAEL
ITALY
JAPAN
KOREA
MALAYSIA
MEXICO
NETHERLANDS
NORWAY
PORTUGAL
SOUTH AFRICA
SPAIN
SWEDEN
SWITZERLAND
THAILAND
TURKEY
USA
TOTAL IEA PVPS
TOTAL NON IEAPVPS
TOTAL
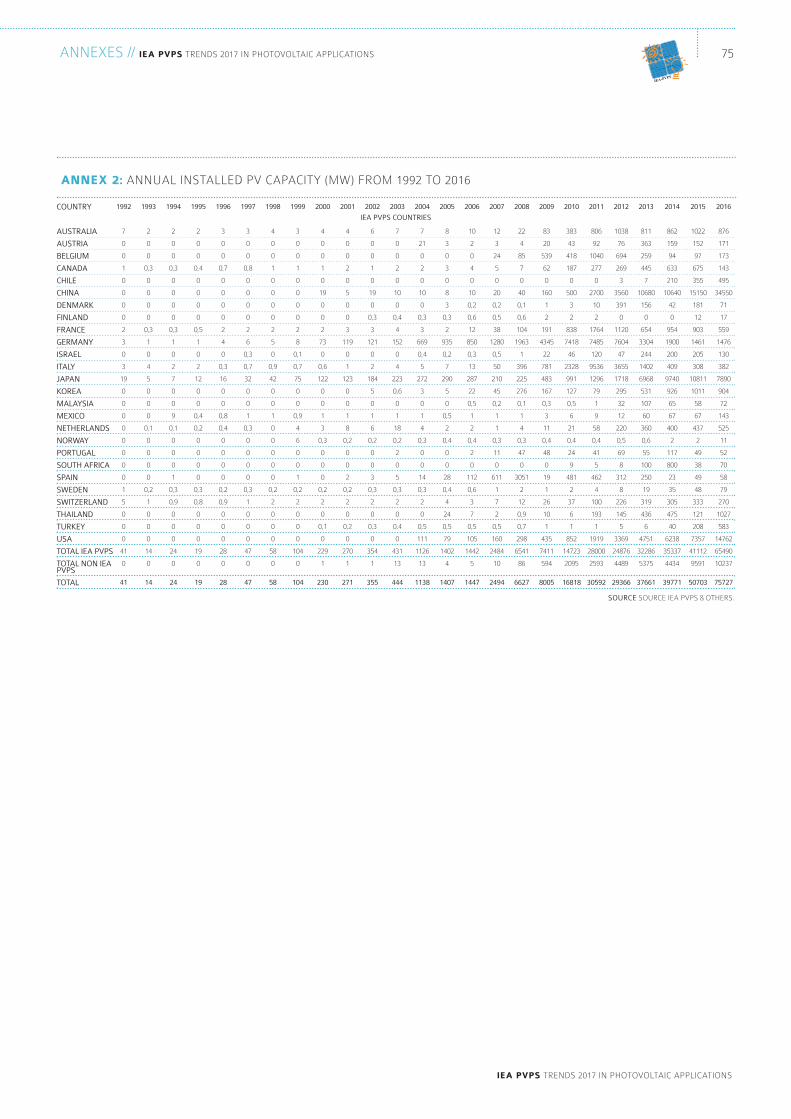
IEA PVPS COUNTRIES
75
ieA PVPS trendS 2017 In PHotoVoltAIc APPlIcAtIonS
AnnexeS // ieA PVPS trendS 2017 In PHotoVoltAIc APPlIcAtIonS
IEA-PVPS
1992
7
0
0
1
0
0
0
0
2
3
0
3
19
0
0
0
0
0
0
0
0
1
5
0
0
0
41
0
41
1993
2
0
0
0,3
0
0
0
0
0,3
1
0
4
5
0
0
0
0,1
0
0
0
0
0,2
1
0
0
0
14
0
14
1994
2
0
0
0,3
0
0
0
0
0,3
1
0
2
7
0
0
9
0,1
0
0
0
1
0,3
0,9
0
0
0
24
0
24
1995
2
0
0
0,4
0
0
0
0
0,5
1
0
2
12
0
0
0,4
0,2
0
0
0
0
0,3
0,8
0
0
0
19
0
19
1996
3
0
0
0,7
0
0
0
0
2
4
0
0,3
16
0
0
0,8
0,4
0
0
0
0
0,2
0,9
0
0
0
28
0
28
1997
3
0
0
0,8
0
0
0
0
2
6
0,3
0,7
32
0
0
1
0,3
0
0
0
0
0,3
1
0
0
0
47
0
47
1998
4
0
0
1
0
0
0
0
2
5
0
0,9
42
0
0
1
0
0
0
0
0
0,2
2
0
0
0
58
0
58
1999
3
0
0
1
0
0
0
0
2
8
0,1
0,7
75
0
0
0,9
4
6
0
0
1
0,2
2
0
0
0
104
0
104
2000
4
0
0
1
0
19
0
0
2
73
0
0,6
122
0
0
1
3
0,3
0
0
0
0,2
2
0
0,1
0
229
1
230
2001
4
0
0
2
0
5
0
0
3
119
0
1
123
0
0
1
8
0,2
0
0
2
0,2
2
0
0,2
0
270
1
271
2002
6
0
0
1
0
19
0
0,3
3
121
0
2
184
5
0
1
6
0,2
0
0
3
0,3
2
0
0,3
0
354
1
355
2003
7
0
0
2
0
10
0
0,4
4
152
0
4
223
0,6
0
1
18
0,2
2
0
5
0,3
2
0
0,4
0
431
13
444
2004
7
21
0
2
0
10
0
0,3
3
669
0,4
5
272
3
0
1
4
0,3
0
0
14
0,3
2
0
0,5
111
1126
13
1138
2005
8
3
0
3
0
8
3
0,3
2
935
0,2
7
290
5
0
0,5
2
0,4
0
0
28
0,4
4
24
0,5
79
1402
4
1407
2006
10
2
0
4
0
10
0,2
0,6
12
850
0,3
13
287
22
0,5
1
2
0,4
2
0
112
0,6
3
7
0,5
105
1442
5
1447
2007
12
3
24
5
0
20
0,2
0,5
38
1280
0,5
50
210
45
0,2
1
1
0,3
11
0
611
1
7
2
0,5
160
2484
10
2494
2008
22
4
85
7
0
40
0,1
0,6
104
1963
1
396
225
276
0,1
1
4
0,3
47
0
3051
2
12
0,9
0,7
298
6541
86
6627
2009
83
20
539
62
0
160
1
2
191
4345
22
781
483
167
0,3
3
11
0,4
48
0
19
1
26
10
1
435
7411
594
8005
2010
383
43
418
187
0
500
3
2
838
7418
46
2328
991
127
0,5
6
21
0,4
24
9
481
2
37
6
1
852
14723
2095
16818
2011
806
92
1040
277
0
2700
10
2
1764
7485
120
9536
1296
79
1
9
58
0,4
41
5
462
4
100
193
1
1919
28000
2593
30592
2012
1038
76
694
269
3
3560
391
0
1120
7604
47
3655
1718
295
32
12
220
0,5
69
8
312
8
226
145
5
3369
24876
4489
29366
2013
811
363
259
445
7
10680
156
0
654
3304
244
1402
6968
531
107
60
360
0,6
55
100
250
19
319
436
6
4751
32286
5375
37661
2014
862
159
94
633
210
10640
42
0
954
1900
200
409
9740
926
65
67
400
2
117
800
23
35
305
475
40
6238
35337
4434
39771
2015
1022
152
97
675
355
15150
181
12
903
1461
205
308
10811
1011
58
67
437
2
49
38
49
48
333
121
208
7357
41112
9591
50703
2016
876
171
173
143
495
34550
71
17
559
1476
130
382
7890
904
72
143
525
11
52
70
58
79
270
1027
583
14762
65490
10237
75727
SOURCE SoUrce IeA PVPS & otHerS.
Annex 2: AnnUAl InStAlled PV cAPAcIty (Mw) FroM 1992 to 2016
COUNTRY
AUSTRALIA
AUSTRIA
BELGIUM
CANADA
CHILE
CHINA
DENMARK
FINLAND
FRANCE
GERMANY
ISRAEL
ITALY
JAPAN
KOREA
MALAYSIA
MEXICO
NETHERLANDS
NORWAY
PORTUGAL
SOUTH AFRICA
SPAIN
SWEDEN
SWITZERLAND
THAILAND
TURKEY
USA
TOTAL IEA PVPS
TOTAL NON IEAPVPS
TOTAL
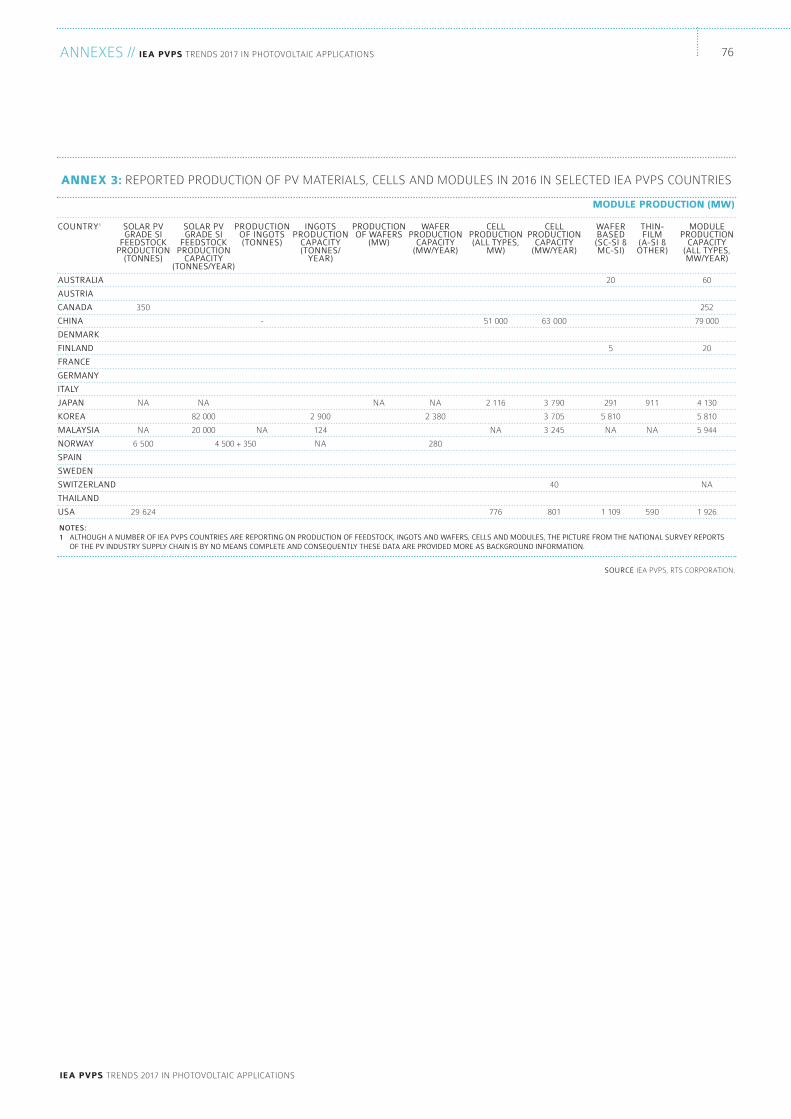
AnnexeS // ieA PVPS trendS 2017 In PHotoVoltAIc APPlIcAtIonS
ieA PVPS trendS 2017 In PHotoVoltAIc APPlIcAtIonS
76
SOURCE IeA PVPS, rtS corPorAtIon.
NOTES: 1 ALTHOUGH A NUMBER OF IEA PVPS COUNTRIES ARE REPORTING ON PRODUCTION OF FEEDSTOCK, INGOTS AND WAFERS, CELLS AND MODULES, THE PICTURE FROM THE NATIONAL SURVEY REPORTS OF THE PV INDUSTRY SUPPLY CHAIN IS BY NO MEANS COMPLETE AND CONSEQUENTLY THESE DATA ARE PROVIDED MORE AS BACKGROUND INFORMATION.
Annex 3: rePorted ProdUctIon oF PV MAterIAlS, cellS And ModUleS In 2016 In Selected IeA PVPS coUntrIeS
COUNTRY1
AUSTRALIA
AUSTRIA
CANADA
CHINA
DENMARK
FINLAND
FRANCE
GERMANY
ITALY
JAPAN
KOREA
MALAYSIA
NORWAY
SPAIN
SWEDEN
SWITZERLAND
THAILAND
USA
SOLAR PVGRADE SI
FEEDSTOCKPRODUCTION
(TONNES)
350
nA
nA
6 500
29 624
SOLAR PVGRADE SI
FEEDSTOCKPRODUCTION
CAPACITY(TONNES/YEAR)
nA
82 000
20 000
4 500 + 350
PRODUCTIONOF INGOTS(TONNES)
-
nA
INGOTSPRODUCTION
CAPACITY(TONNES/
YEAR)
2 900
124
nA
PRODUCTIONOF WAFERS
(MW)
nA
WAFERPRODUCTION
CAPACITY(MW/YEAR)
nA
2 380
280
CELLPRODUCTION(ALL TYPES,
MW)
51 000
2 116
nA
776
CELLPRODUCTION
CAPACITY(MW/YEAR)
63 000
3 790
3 705
3 245
40
801
WAFERBASED (SC-SI & MC-SI)
20
5
291
5 810
nA
1 109
THIN-FILM
(A-SI & OTHER)
911
nA
590
Module Production (Mw)
MODULEPRODUCTION
CAPACITY (ALL TYPES,MW/YEAR)
60
252
79 000
20
4 130
5 810
5 944
nA
1 926
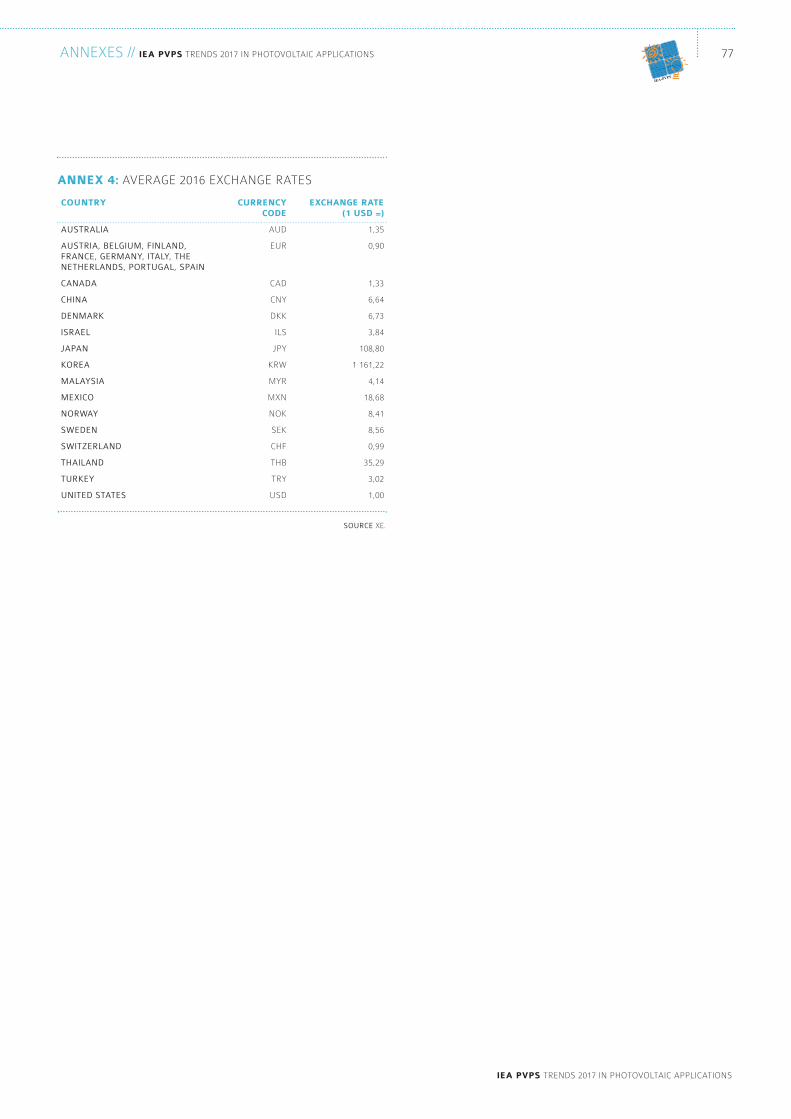
77
ieA PVPS trendS 2017 In PHotoVoltAIc APPlIcAtIonS
AnnexeS // ieA PVPS trendS 2017 In PHotoVoltAIc APPlIcAtIonS
IEA-PVPS
SOURCE xe.
Annex 4: AVerAGe 2016 excHAnGe rAteS
country
AUSTRALIA
AUSTRIA, BELGIUM, FINLAND,FRANCE, GERMANY, ITALY, THENETHERLANDS, PORTUGAL, SPAIN
CANADA
CHINA
DENMARK
ISRAEL
JAPAN
KOREA
MALAYSIA
MEXICO
NORWAY
SWEDEN
SWITZERLAND
THAILAND
TURKEY
UNITED STATES
currency code
AUd
eUr
cAd
cny
dkk
IlS
JPy
krw
Myr
Mxn
nok
Sek
cHF
tHb
try
USd
exchAnGe rAte(1 uSd =)
1,35
0,90
1,33
6,64
6,73
3,84
108,80
1 161,22
4,14
18,68
8,41
8,56
0,99
35,29
3,02
1,00
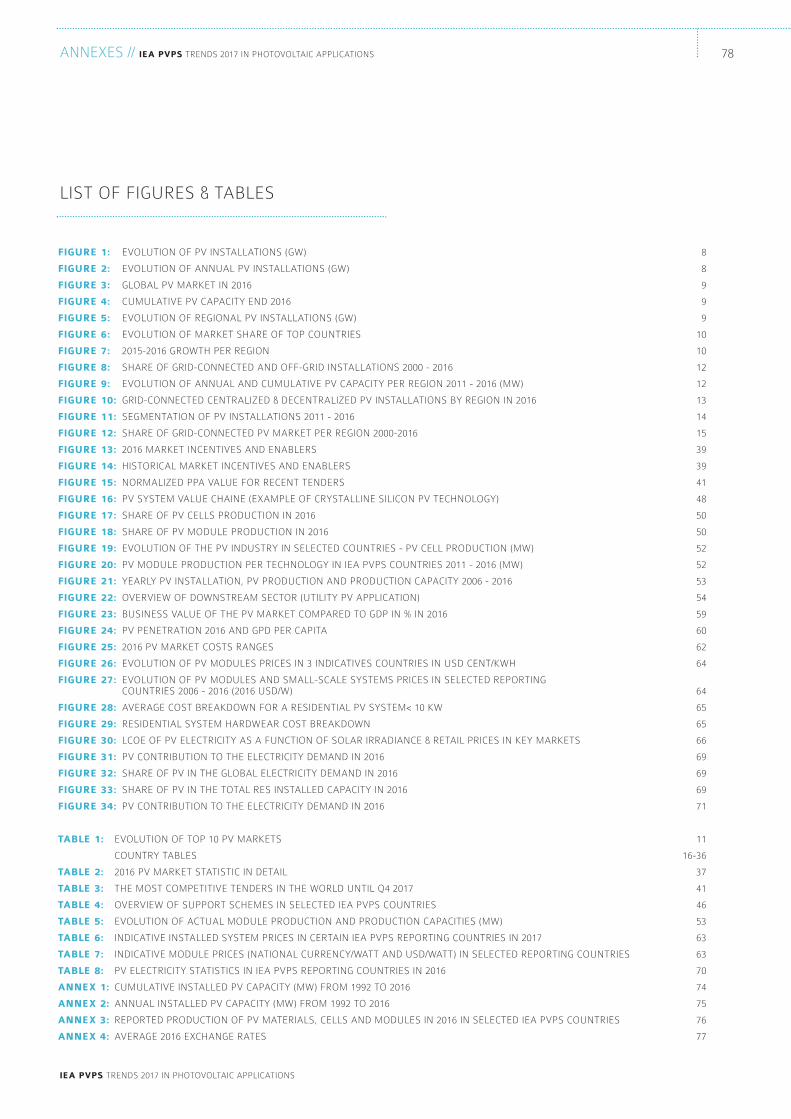
AnnexeS // ieA PVPS trendS 2017 In PHotoVoltAIc APPlIcAtIonS
ieA PVPS trendS 2017 In PHotoVoltAIc APPlIcAtIonS
78
fiGure 1: eVolUtIon oF PV InStAllAtIonS (Gw) 8
fiGure 2: eVolUtIon oF AnnUAl PV InStAllAtIonS (Gw) 8
fiGure 3: GlobAl PV MArket In 2016 9
fiGure 4: cUMUlAtIVe PV cAPAcIty end 2016 9
fiGure 5: eVolUtIon oF reGIonAl PV InStAllAtIonS (Gw) 9
fiGure 6: eVolUtIon oF MArket SHAre oF toP coUntrIeS 10
fiGure 7: 2015-2016 GrowtH Per reGIon 10
fiGure 8: SHAre oF GrId-connected And oFF-GrId InStAllAtIonS 2000 - 2016 12
fiGure 9: eVolUtIon oF AnnUAl And cUMUlAtIVe PV cAPAcIty Per reGIon 2011 - 2016 (Mw) 12
fiGure 10: GrId-connected centrAlIzed & decentrAlIzed PV InStAllAtIonS by reGIon In 2016 13
fiGure 11: SeGMentAtIon oF PV InStAllAtIonS 2011 - 2016 14
fiGure 12: SHAre oF GrId-connected PV MArket Per reGIon 2000-2016 15
fiGure 13: 2016 MArket IncentIVeS And enAblerS 39
fiGure 14: HIStorIcAl MArket IncentIVeS And enAblerS 39
fiGure 15: norMAlIzed PPA VAlUe For recent tenderS 41
fiGure 16: PV SySteM VAlUe cHAIne (exAMPle oF cryStAllIne SIlIcon PV tecHnoloGy) 48
fiGure 17: SHAre oF PV cellS ProdUctIon In 2016 50
fiGure 18: SHAre oF PV ModUle ProdUctIon In 2016 50
fiGure 19: eVolUtIon oF tHe PV IndUStry In Selected coUntrIeS - PV cell ProdUctIon (Mw) 52
fiGure 20: PV ModUle ProdUctIon Per tecHnoloGy In IeA PVPS coUntrIeS 2011 - 2016 (Mw) 52
fiGure 21: yeArly PV InStAllAtIon, PV ProdUctIon And ProdUctIon cAPAcIty 2006 - 2016 53
fiGure 22: oVerVIew oF downStreAM Sector (UtIlIty PV APPlIcAtIon) 54
fiGure 23: bUSIneSS VAlUe oF tHe PV MArket coMPAred to GdP In % In 2016 59
fiGure 24: PV PenetrAtIon 2016 And GPd Per cAPItA 60
fiGure 25: 2016 PV MArket coStS rAnGeS 62
fiGure 26: eVolUtIon oF PV ModUleS PrIceS In 3 IndIcAtIVeS coUntrIeS In USd cent/kwH 64
fiGure 27: eVolUtIon oF PV ModUleS And SMAll-ScAle SySteMS PrIceS In Selected rePortInG coUntrIeS 2006 - 2016 (2016 USd/w) 64
fiGure 28: AVerAGe coSt breAkdown For A reSIdentIAl PV SySteM< 10 kw 65
fiGure 29: reSIdentIAl SySteM HArdweAr coSt breAkdown 65
fiGure 30: lcoe oF PV electrIcIty AS A FUnctIon oF SolAr IrrAdIAnce & retAIl PrIceS In key MArketS 66
fiGure 31: PV contrIbUtIon to tHe electrIcIty deMAnd In 2016 69
fiGure 32: SHAre oF PV In tHe GlobAl electrIcIty deMAnd In 2016 69
fiGure 33: SHAre oF PV In tHe totAl reS InStAlled cAPAcIty In 2016 69
fiGure 34: PV contrIbUtIon to tHe electrIcIty deMAnd In 2016 71
tAble 1: eVolUtIon oF toP 10 PV MArketS 11
coUntry tAbleS 16-36
tAble 2: 2016 PV MArket StAtIStIc In detAIl 37
tAble 3: tHe MoSt coMPetItIVe tenderS In tHe world UntIl Q4 2017 41
tAble 4: oVerVIew oF SUPPort ScHeMeS In Selected IeA PVPS coUntrIeS 46
tAble 5: eVolUtIon oF ActUAl ModUle ProdUctIon And ProdUctIon cAPAcItIeS (Mw) 53
tAble 6: IndIcAtIVe InStAlled SySteM PrIceS In certAIn IeA PVPS rePortInG coUntrIeS In 2017 63
tAble 7: IndIcAtIVe ModUle PrIceS (nAtIonAl cUrrency/wAtt And USd/wAtt) In Selected rePortInG coUntrIeS 63
tAble 8: PV electrIcIty StAtIStIcS In IeA PVPS rePortInG coUntrIeS In 2016 70
Annex 1: cUMUlAtIVe InStAlled PV cAPAcIty (Mw) FroM 1992 to 2016 74
Annex 2: AnnUAl InStAlled PV cAPAcIty (Mw) FroM 1992 to 2016 75
Annex 3: rePorted ProdUctIon oF PV MAterIAlS, cellS And ModUleS In 2016 In Selected IeA PVPS coUntrIeS 76
Annex 4: AVerAGe 2016 excHAnGe rAteS 77
lISt oF FIGUreS & tAbleS
ieA PVPS trendS 2017 In PHotoVoltAIc APPlIcAtIonS
ACKNOWLEDGEMENT
This report has been written thanks to the information provided by IEA PVPS Task 1 participants and published under the form ofNational Survey Reports. Additional information has been provided by Becquerel Institute, RTS Corporation, CREARA, ChrisWerner, 2016, UNEF. Insights on Global Solar Markets, Chris Werner energy consulting, Ch. Werner, A. Gerlach, Ch. Breyer, G.Masson 2017. Global Photovoltaics in 2016 – Analysis of Current Solar Energy Markets and Hidden Growth Regions, 33rd EU-PVSEC 2017. This report has been prepared under the supervision of Task 1 by Task 1 participants: RTS Corporation fromJapan (and in particular Izumi Kaizuka) and Gaëtan Masson, with the special support from Stefan Nowak, IEA PVPS, MaryBrunisholz IEA PVPS and NET Ltd. and Carlotta Cambiè, Becquerel Institute. The report authors gratefully acknowledge theeditorial assistance received from a number of their Task 1 colleagues.
Design: onehemisphere, Sweden.
WHAT IS THE IEA PVPS?
The International Energy Agency (IEA), founded in 1974, is an autonomous body within the framework of the Organisation forEconomic Cooperation and Development (OECD). The IEA carries out a comprehensive programme of energy cooperation among its31 members and with the participation of the European Commission. The IEA Photovoltaic Power Systems Programme (IEA PVPS)is one of the collaborative research and development agreements within the IEA and was established in 1993. The mission of theprogramme is to “enhance the international collaborative efforts which facilitate the role of photovoltaic solar energy as a cornerstonein the transition to sustainable energy systems.”
In order to achieve this, the Programme’s participants have undertaken a variety of joint research projects in PV power systemsapplications. The overall programme is headed by an Executive Committee, comprised of one delegate from each country ororganisation member, which designates distinct “Tasks”, that may be research projects or activity areas. This report has beenprepared under Task 1, which facilitates the exchange and dissemination of information arising from the overall IEA PVPSProgramme. The participating countries are Australia, Austria, Belgium, Canada, Chile, China, Denmark, Finland, France, Germany,Israel, Italy, Japan, Korea, Malaysia, Mexico, the Netherlands, Norway, Portugal, South Africa, Spain, Sweden, Switzerland, Thailand,Turkey and the United States of America. The European Commission, SolarPower Europe (former EPIA), the Solar Electric PowerAssociation, the Solar Energy Industries Association and the Copper Alliance are also members.
IEA-PVPS

Related Documents