1 International Symposium for Capital Region Development 수수수 수수수 수수 수수 수수수수

Welcome message from author
This document is posted to help you gain knowledge. Please leave a comment to let me know what you think about it! Share it to your friends and learn new things together.
Transcript

1
International Symposium
for Capital Region Development
수도권 발전을 위한국제 심포지움

Presentations on Western City-Regions and Discussion
( 구미 대도시권 사례발표 및 토론 )
Session I

International Symposium for Capital Region Development
- London -October 25, 2005
Arthur D. Little London
l London

4
Agenda
11 Status and CompetitivenessStatus and Competitiveness
22 Supporting London’s Growth SectorsSupporting London’s Growth Sectors
33 Large Scale Redevelopment ProjectsLarge Scale Redevelopment Projects
44 Increasing the use of Public TransportationIncreasing the use of Public Transportation
5
Agenda
11 Status and CompetitivenessStatus and Competitiveness
2 Supporting London’s Growth Sectors
3 Large Scale Redevelopment Projects
4 Increasing the use of Public Transportation

6
Status and Competitiveness
London Metropolitan Area is part of densely populated Greater South East which accounts for 34% of the GDP and has population of over 15 million (26% of UK)
Greater South EastLondon Metropolitan Area is Part of Densely
Populated Greater South East Triangle
Greater South East
Average population density in the Greater South East at 752/km² is nearly three times the UK average
Figures in brackets show % of the UK total. Figures for 2003.
GDP(million $)
Population(000’)
Area ( ㎢ )
434,127(34.0%)
15,488(26.0%)
20,590(8.5%)
Greater South East
149,624(15,7%)
8,100(13.6%)
19,018(7.8%)
South Eastof England
284,503(18.3%)
7,388(12.4%)
1,572(0.7%)
Greater London area

7
London’s attractiveness as a major international business hub is reflected in high costs of renting and concentration of international companies and banks
Status and Competitiveness
London Position Compared to Other World Cities
Source: USB: Prices and earnings report. February 2005 update. Based on national purchasing power parities (PPP).
• London is the most expensive city (2005) in the world due to its high cost of renting accommodation
• Over 130 of Fortune 500 companies have their HQs in the city7514
75.813
77.812
79.711
80.210
819
81.18
81.77
82.26
855
85.54
85.83
89.42
1001
Cost IndexRank
0.0%
5.0%
10.0%
15.0%
20.0%
25.0%
30.0%
35.0%
Gre
ater
Lond
on
Par
is
Bru
ssel
s
Dus
seld
orf
Fra
nkfu
rt
Am
ster
dam
Dub
lin
Helsinki
Basel
Stockholm
Dublin
Geneva
Chicago
Paris
Zurich
Hong Kong
Copenhagen
Tokyo
New York
Oslo
London
City

8
London is the world’s financial center building on the highest concentration of international banks and strong insurance and capital markets
Status and Competitiveness
Financial Services have historically been the principal growth sector of London economy
Contributing Factors
• Colonial heritage and early
industrialisation
• UK’s comparatively liberal economy
• Limited restrictions on capital flows and
advanced regulatory framework / strict
“rules of the game”
• London City self-governance principles
• Since 80s working together London
authority on further development (e.g.
Canary Wharf)
Share of London Stock Exchangein global trading volumes
London Stock
Exchange30%
Rest of the world70%
Source: London Stock Exchange (2005)
9
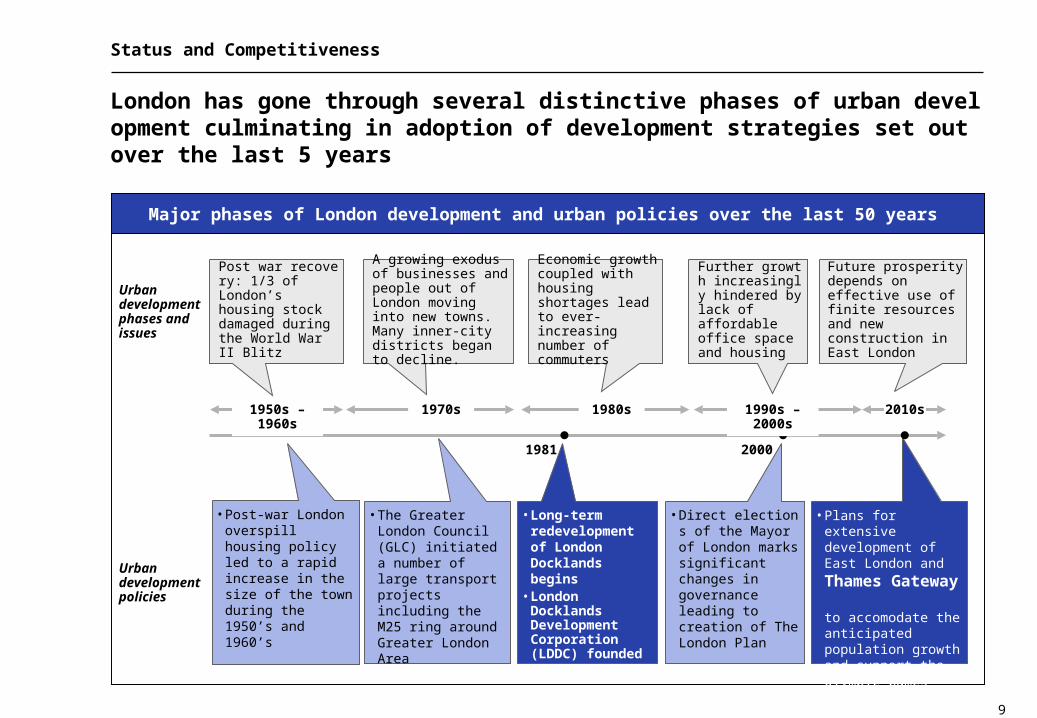
London has gone through several distinctive phases of urban development culminating in adoption of development strategies set out over the last 5 years
Status and Competitiveness
Major phases of London development and urban policies over the last 50 years
A growing exodus of businesses and people out of London moving into new towns. Many inner-city districts began to decline.
Further growth increasingly hindered by lack of affordable office space and housing
• Long-term redevelopment of London Docklands begins
• London Docklands Development Corporation (LDDC) founded
• Direct elections of the Mayor of London marks significant changes in governance leading to creation of The London Plan
Post war recovery: 1/3 of London’s housing stock damaged during the World War II Blitz
• Post-war London overspill housing policy led to a rapid increase in the size of the town during the 1950’s and 1960’s
• The Greater London Council (GLC) initiated a number of large transport projects including the M25 ring around Greater London Area
Urban development policies
Urban development phases and issues
Future prosperity depends on effective use of finite resources and new construction in East London
• Plans for extensive development of East London and
Thames Gateway to accomodate the anticipated population growth and support the Olympic Games 2012 bid
1990s – 2000s 2010s 1980s1970s1950s – 1960s
Economic growth coupled with housing shortages lead to ever-increasing number of commuters
1981 2000

10
There are a number of important internal and external developments driving evolution of strategies and urban development programmes in London
Status and Competitiveness
Vision & Strategy of London (~2015 - 2020)Main Drivers
• Changes in the governance structure
• Multi-agency approach
• Long-term development strategies
• Population growth
• Cultural richness
• Limited industrial diversity
• Past underinvestment
• Global competition
• Environmental protection
• Competition from other UK cities regions
• Security threats
• Olympic games 2012
ExternalInternal
VisionVision
ObjectivesObjectives
StrategiesStrategies
“A sustainable world city through strong economic growth, social inclusion and environmental improvement”
• Prosperous economy by making the most of the London’s most successful sectors
• Efficient use of finite resources and energy
• Sense of safety and security, diversity and inclusion
• High standards of education, health and welfare
• Efficient, safe and comfortable transport systems
• Ready access to affordable homes
• Invest effectively and continuously in every physical aspect of the city and in its people
• Create a framework of comprehensive and coherent strategies for spatial and economic development, environmental issues, transport and culture

11
Agenda
1 Status and Competitiveness
22 Supporting London’s Growth SectorsSupporting London’s Growth Sectors
3 Large Scale Redevelopment Projects
4 Increasing the use of Public Transportation
12
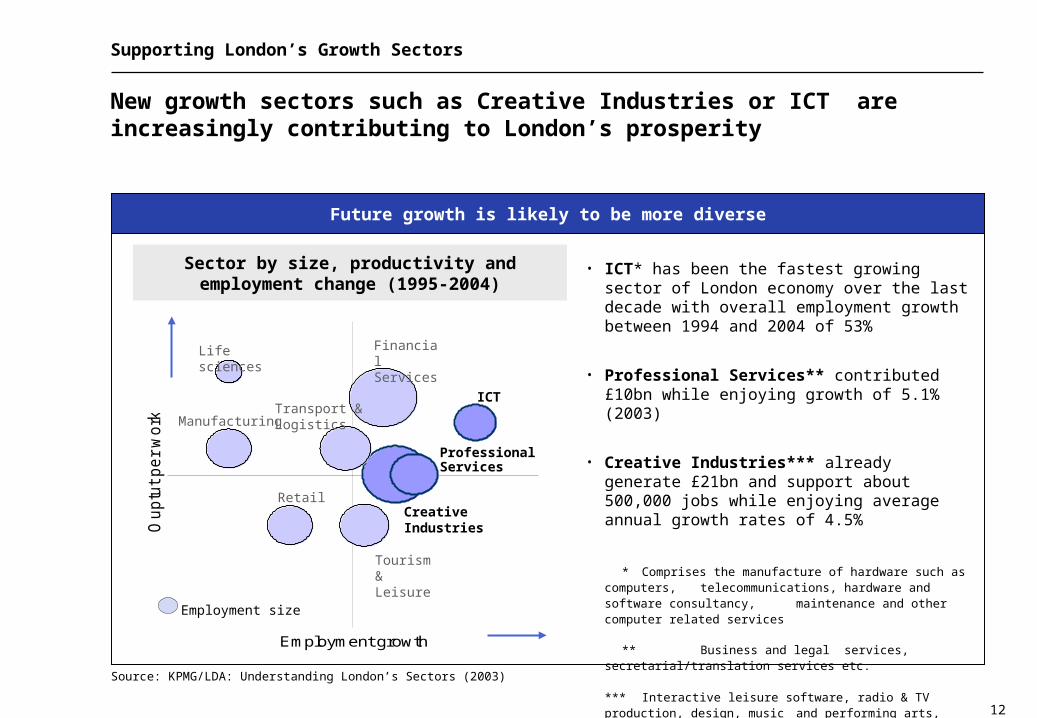
New growth sectors such as Creative Industries or ICT are increasingly contributing to London’s prosperity
Supporting London’s Growth Sectors
Future growth is likely to be more diverse
Source: KPMG/LDA: Understanding London’s Sectors (2003)
Sector by size, productivity andemployment change (1995-2004)
Employment growth
Ou
ptu
t p
er
wo
rke
r
Employment size
Financial Services
Tourism & Leisure
ICTTransport & Logistics
Retail
Manufacturing
Creative Industries
Professional Services
Life sciences
• ICT* has been the fastest growing sector of London economy over the last decade with overall employment growth between 1994 and 2004 of 53%
• Professional Services** contributed £10bn while enjoying growth of 5.1% (2003)
• Creative Industries*** already generate £21bn and support about 500,000 jobs while enjoying average annual growth rates of 4.5%
* Comprises the manufacture of hardware such as computers, telecommunications, hardware and software consultancy, maintenance and other computer related services
** Business and legal services, secretarial/translation services etc.
*** Interactive leisure software, radio & TV production, design, music and performing arts, film, fashion etc.

13
London has worked on providing more coherent support to London’s most promising sectors including Creative Industries
Supporting London’s Growth Sectors
• 40 % of people in the UK’s creative industries
• The Greater South East now contains 62 % of UK jobs
The Support AvailableCreative Industries in London
Support is provided on two conditions
1. The sector in question has potential to contribute to the prosperity on sustainable basis, and
2. There is a market failure effectively addressable by public sector intervention
Approach to supporting Creative Industries
• The London Development Agency created its dedicated strategic agency - Creative London
• The agency draws companies and individuals together through numerous projects
• Focuses on supporting new enterprises, initial financing, suitable premises and contacts
Source: London Development Agency: London’s Creative Sector.
Employment in Creative Industries in London andrest of the Greater South East

14
As in other cases London supports its Creative Industries through a dedicated strategic and funding agency
Supporting London’s Growth Sectors
• Launched in 2004
• Part of the LDA
• Helps address bottlenecks to the success
• Acts as a cohesive voice to represent the interests of the industry
Experience so far
• Welcome by the industries and viewed as a move in the right direction
• Started several major initiative including:
• ‘Creative Hubs’
• £50million seed fund
• Sponsorship to over 40 distinctive projects
Creative LondonExamples of support organisations in place
1 BioLondon - Advises on interventions in the biotechnology sector
Creative London - Strategic agency for London’s creative industries
Business Link for London - Small business support and advisory
2
London Development Agency (LDA)
BioLondon Creative London
1 2Business Link
for London
3
3
Illustrative
15
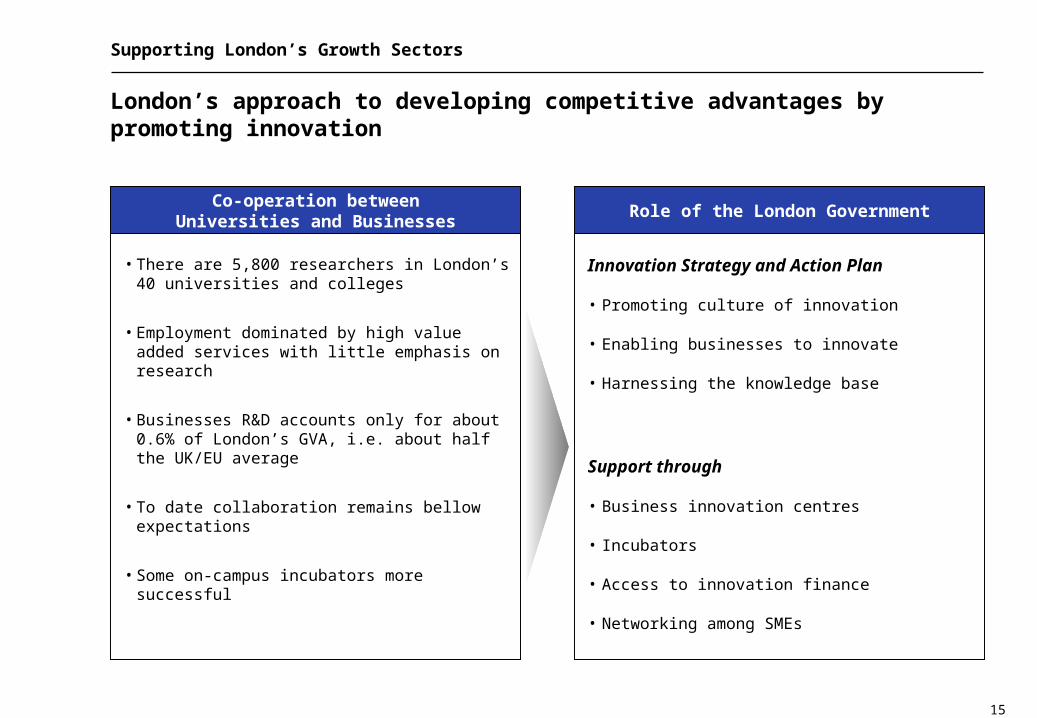
London’s approach to developing competitive advantages by promoting innovation
Supporting London’s Growth Sectors
• There are 5,800 researchers in London’s 40 universities and colleges
• Employment dominated by high value added services with little emphasis on research
• Businesses R&D accounts only for about 0.6% of London’s GVA, i.e. about half the UK/EU average
• To date collaboration remains bellow expectations
• Some on-campus incubators more successful
Role of the London GovernmentCo-operation between
Universities and Businesses
Innovation Strategy and Action Plan
• Promoting culture of innovation
• Enabling businesses to innovate
• Harnessing the knowledge base
Support through
• Business innovation centres
• Incubators
• Access to innovation finance
• Networking among SMEs

16
Agenda
1 Status and Competitiveness
2 Supporting London’s Growth Sectors
33 Large Scale Redevelopment ProjectsLarge Scale Redevelopment Projects
4 Increasing the use of Public Transportation

17
The UK Government has established several partnerships to foster long-term regeneration plans of high importance to the capital city
Large Scale Redevelopment Projects – London Docklands (1981-1998)
Situation in late was alarming 70s
• Large job losses with the Docks closure
• The extent of dereliction was severe and costs of development potentially high and uncertain
• The market alone was unlikely to provide the improvements
Solution: London Docklands Development Corporation (LDDC)
• Founded in 1981 by the UK Government as an Urban Development Corporation
• Wholly financed by the Government and from the disposal of land
• It had powers to acquire land by compulsory purchase
• Took over for planning activities from the London Boroughs but not their planning powers
Major achievements
• 2.6 million m2 of commercial/industrial floor space built and 24,000 housing units
• £7.7 billion in private investment on the back of £1.86 billion in public sector investment
• 1,066 acres of land sold for redevelopment
Regeneration of London Docklands: the London Docklands Development Corporation (LDDC)
18
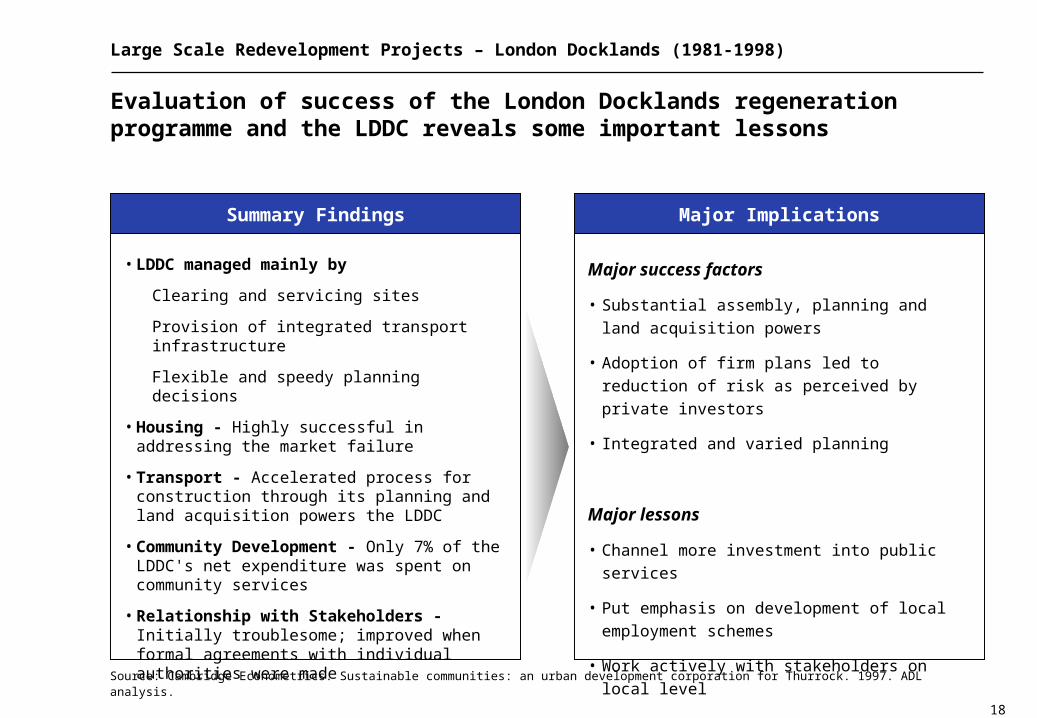
Evaluation of success of the London Docklands regeneration programme and the LDDC reveals some important lessons
Large Scale Redevelopment Projects – London Docklands (1981-1998)
• LDDC managed mainly by
Clearing and servicing sites
Provision of integrated transport infrastructure
Flexible and speedy planning decisions
• Housing - Highly successful in addressing the market failure
• Transport - Accelerated process for construction through its planning and land acquisition powers the LDDC
• Community Development - Only 7% of the LDDC's net expenditure was spent on community services
• Relationship with Stakeholders - Initially troublesome; improved when formal agreements with individual authorities were made
Major ImplicationsSummary Findings
Major success factors
• Substantial assembly, planning and land acquisition
powers
• Adoption of firm plans led to reduction of risk as
perceived by private investors
• Integrated and varied planning
Major lessons
• Channel more investment into public services
• Put emphasis on development of local employment
schemes
• Work actively with stakeholders on local level
Source: Cambridge Econometrics. Sustainable communities: an urban development corporation for Thurrock. 1997. ADL analysis.
19
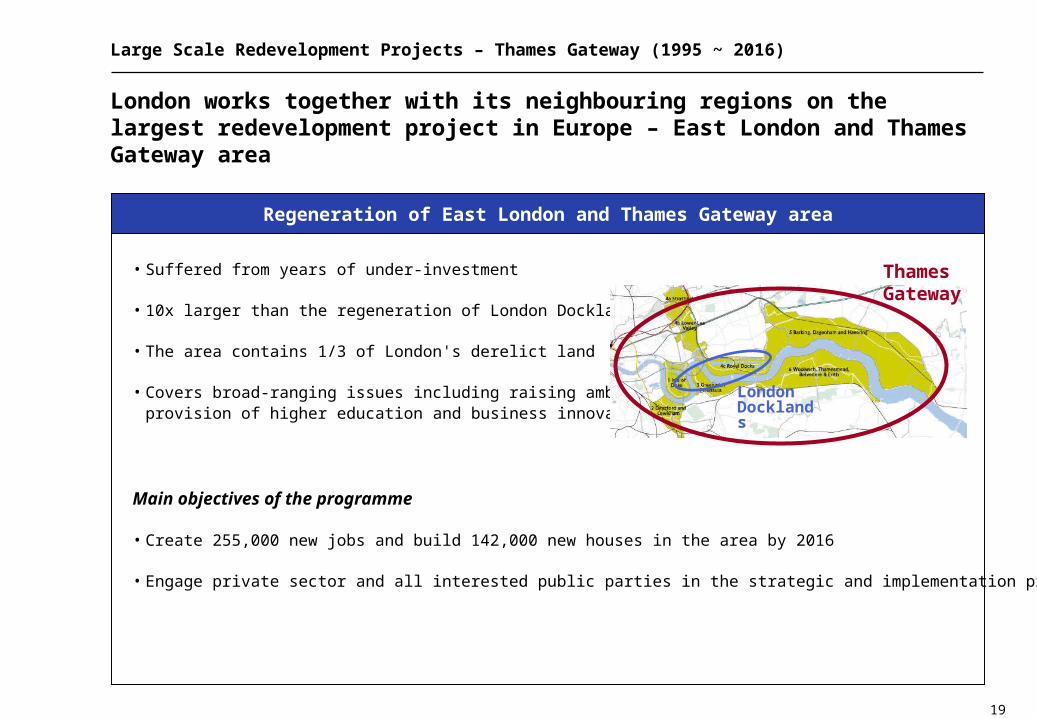
London works together with its neighbouring regions on the largest redevelopment project in Europe – East London and Thames Gateway area
Large Scale Redevelopment Projects – Thames Gateway (1995 ~ 2016)
• Suffered from years of under-investment
• 10x larger than the regeneration of London Docklands
• The area contains 1/3 of London's derelict land
• Covers broad-ranging issues including raising ambitions, provision of higher education and business innovation
Main objectives of the programme
• Create 255,000 new jobs and build 142,000 new houses in the area by 2016
• Engage private sector and all interested public parties in the strategic and implementation process
Regeneration of East London and Thames Gateway area
Thames Gateway
LondonDocklands
20
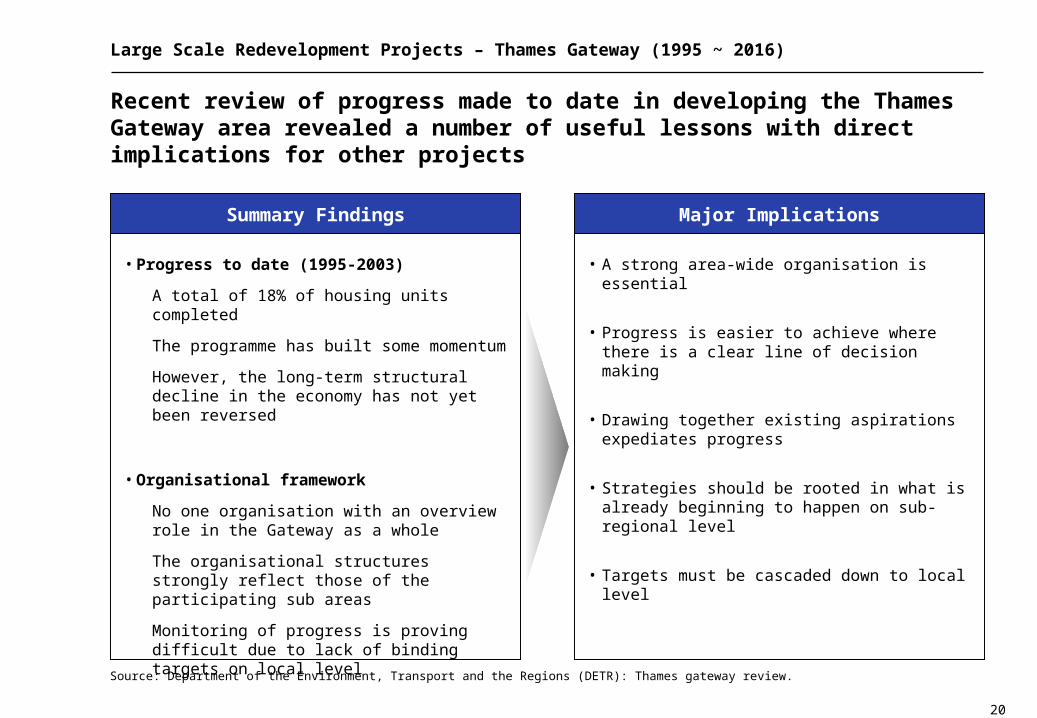
Recent review of progress made to date in developing the Thames Gateway area revealed a number of useful lessons with direct implications for other projects
Large Scale Redevelopment Projects – Thames Gateway (1995 ~ 2016)
• Progress to date (1995-2003)
A total of 18% of housing units completed
The programme has built some momentum
However, the long-term structural decline in the economy has not yet been reversed
• Organisational framework
No one organisation with an overview role in the Gateway as a whole
The organisational structures strongly reflect those of the participating sub areas
Monitoring of progress is proving difficult due to lack of binding targets on local level
Major ImplicationsSummary Findings
• A strong area-wide organisation is essential
• Progress is easier to achieve where there is a clear line of decision making
• Drawing together existing aspirations expediates progress
• Strategies should be rooted in what is already beginning to happen on sub-regional level
• Targets must be cascaded down to local level
Source: Department of the Environment, Transport and the Regions (DETR): Thames gateway review.
21
Agenda
1 Status and Competitiveness
2 Supporting London’s Growth Sectors
3 Large Scale Redevelopment Projects
44 Increasing the use of Public TransportationIncreasing the use of Public Transportation

22
Strategy and policy support to London’s transportation
Increasing the Use of Public Transport
London public transport
• Accounted for 34% of journeys in 2003
• 329km of Underground lines
• Traffic moves at an average speed of about 16 km/h
• Central London Congestion Charge introduced in 2003
Future directions
• Transport for London created as an integrated body responsible for the capital's transport system
• Extension of London’s public transport system over the next 10 years to serve new developments in east London and Thames Gateway
• The major long-term investment programmes include reconstruction of London Underground and extensions of Docklands Light Railway (DLR)
London Transport and Its Future Directions

23
London’s responses to growing road traffic and deteriorating accessibility
Increasing the Use of Public Transport
• Reduce number of cars entering inner parts of the city and
• Raise extra £130m each year to enhance public transport
• Makes use of a computerised network of CCTV cameras linked to a central database
• Heavy criticism by lobbying groups, most notably by retailers continues to date
Results so farCentral London Congestion Charge
• Number of cars entering the Central London dropped by 33%
• More than 350 busses added• Raised only £75 and £100 million in the first year
and second year, respectively
0
50000
100000
150000
200000
250000
Spring2002
Autumn2002
January2003
Feb/Mar2003
Spring2003
Spring2004
Source: Traffic for London (TfL)
Congestion charge introduced
Private cars entering the charging zone between 7:30 and 18:30

24
Central London Congestion Charge has contributed to reduction of private road traffic but there have been many controversies over its adoption
Increasing the Use of Public Transport
• Effective in reducing congestion and providing additional stream of revenue
• Must be accompanied by other measures promoting useof public transport
• Thorough planning, testing and consultation processes are essential
• Caused upheaval among retailers and other pressure groups
• Requires significant political will and support from citizens
Major Lessons
25
The UK Government has also established several other partnerships to foster long-term regeneration plans and improve quality of public services
Increasing the Use of Public Transport
• Since 2003, the London underground has been operated as a Public Private Partnership (PPP)
• Companies are granted long-term, not permanent, concessions to operate and modernise the tube infrastructure
Benefits sought by the Government
• The discipline and expertise of the private sector in managing large infrastructure projects
• More effective use of resources and faster implementation of the modernisation investment programme
Results so far
• Pushed ahead by the UK Government despite strong resentment from the Mayor of London
• Some safety issues
• Difficulties in meeting performance targets
Public-Private Partnership for London Underground
26
Public-Private Partnerships (PPPs) have been fostered by the UK Government as means of providing public goods and services at better quality and cost
Increasing the Use of Public Transport
• Fair conditions and transparency are essential
• Long-term frameworks (10-20 years)
• Performance targets must be clearly defined and linked to strong incentives
• PPPs are proving to be a highly contentious issue requiring strong political will
• Requires thorough assessment and monitoring on continuous basis
Major Lessons
27
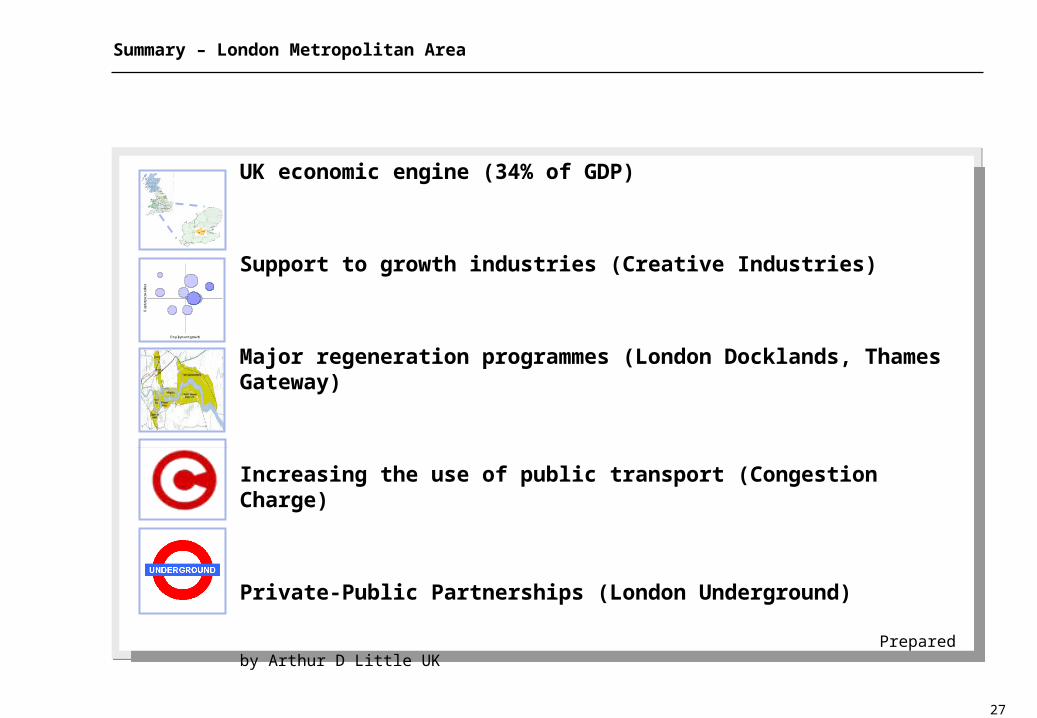
Summary – London Metropolitan Area
UK economic engine (34% of GDP)
Support to growth industries (Creative Industries)
Major regeneration programmes (London Docklands, Thames Gateway)
Increasing the use of public transport (Congestion Charge)
Private-Public Partnerships (London Underground)
Prepared by Arthur D Little UK
Employment growth
Ou
ptu
t p
er
wo
rke
r

International Symposium for Capital Region Development
- Paris -October 25, 2005
Arthur D. Little Paris
l Paris

29
Agenda
11 Status and CompetitivenessStatus and Competitiveness
22 VisionVision
33 Organization and ProcessOrganization and Process
44 ResourcesResources

30
Ile-de-France benchmarking directions
Four Steps Approach
Ile-de-France
Ile-de-France in the French context
VisionOrganization and
processResources Step
Key Issues
• Administrative system (territorial) : organization structure and R&R of central/local government, public/private institution
• Impact of degree of decentralization on regional development and urban planning
• Policy or plan making and implementing processes
• Detail procedures and participants
• Over concentration issues
• Disparity between districts within city-region1
• Land settlement and housing policy
• Transportation
• Living environment
• Industry structure and specialized industries
• Culture / tourism facilities
• Links between private sector education system
• IDF position in France
• Land policy historical background
• Legal frame of regional development and urban planning
• Development plan or strategy of city-region and core competency
• Background of vision and strategy (global urbanization)
• IDF strengths and weaknesses in economic development and urban planning
1 2 3 4
Note : all acronyms are French acronyms
1) Disparity issues between districts within city-region is handled through housing, transportation and settlement prism
31
Agenda
11 Ile-de-France in the French ContextIle-de-France in the French Context
2 Vision
3 Organization and Process
4 Resources
32
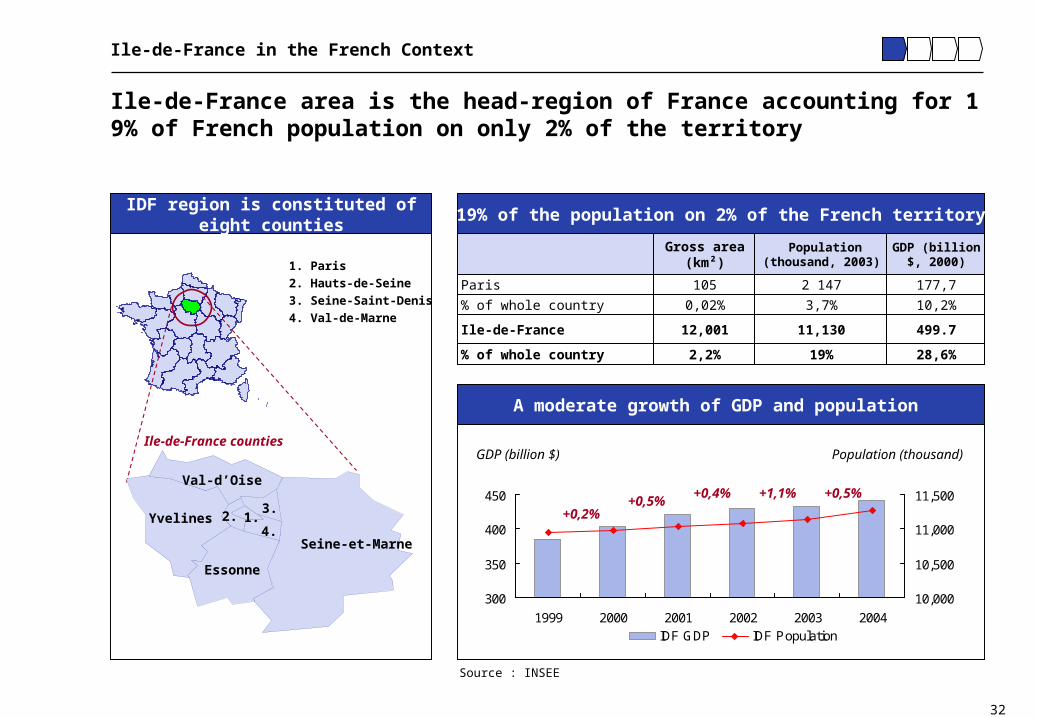
Ile-de-France area is the head-region of France accounting for 19% of French population on only 2% of the territory
Ile-de-France in the French Context
19% of the population on 2% of the French territoryIDF region is constituted of
eight counties
A moderate growth of GDP and population
177,72 147105Paris
499.711,13012,001Ile-de-France
28,6%19%2,2%% of whole country
10,2%3,7%0,02%% of whole country
GDP (billion $, 2000)
Population (thousand, 2003)
Gross area (km²)1. Paris
2. Hauts-de-Seine
3. Seine-Saint-Denis
4. Val-de-Marne
Ile-de-France counties
Seine-et-Marne
Essonne
Yvelines
Val-d’Oise
1.2.3.
4.
Source : INSEE
300
350
400
450
1999 2000 2001 2002 2003 2004
10,000
10,500
11,000
11,500
IDF GDP IDF Population
Population (thousand)GDP (billion $)
+0,2%+0,5%
+0,4% +1,1% +0,5%
33
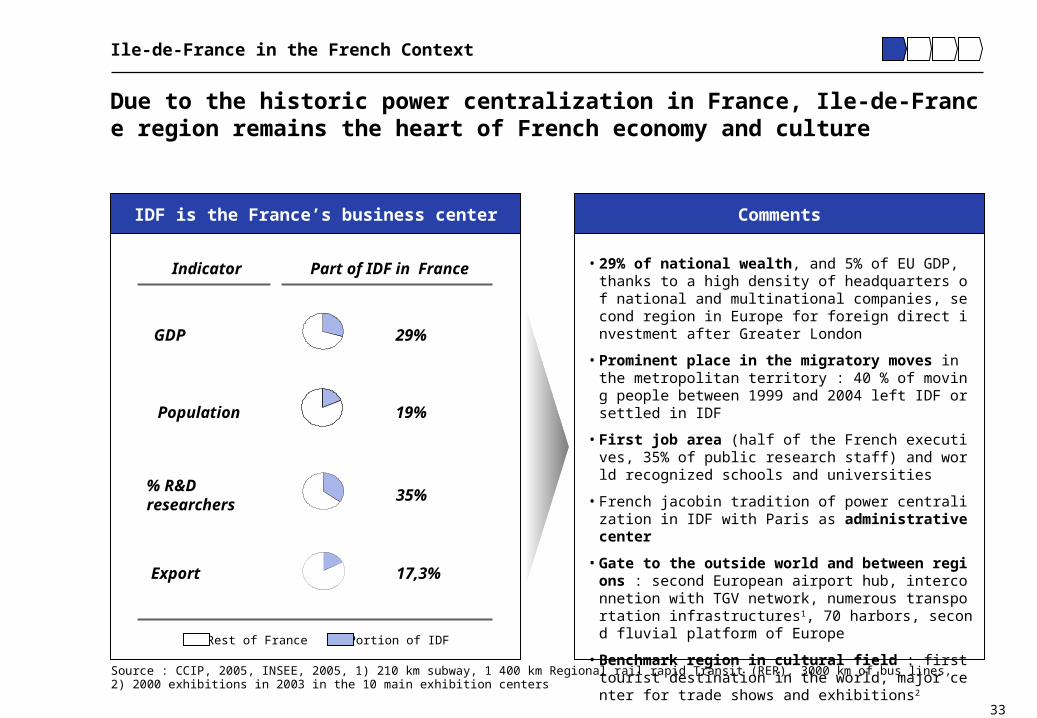
Due to the historic power centralization in France, Ile-de-France region remains the heart of French economy and culture
Ile-de-France in the French Context
CommentsIDF is the France’s business center
• 29% of national wealth, and 5% of EU GDP, thanks to a high density of headquarters of national and multinational companies, second region in Europe for foreign direct investment after Greater London
• Prominent place in the migratory moves in the metropolitan territory : 40 % of moving people between 1999 and 2004 left IDF or settled in IDF
• First job area (half of the French executives, 35% of public research staff) and world recognized schools and universities
• French jacobin tradition of power centralization in IDF with Paris as administrative center
• Gate to the outside world and between regions : second European airport hub, interconnetion with TGV network, numerous transportation infrastructures1, 70 harbors, second fluvial platform of Europe
• Benchmark region in cultural field : first tourist destination in the world, major center for trade shows and exhibitions2
Source : CCIP, 2005, INSEE, 2005, 1) 210 km subway, 1 400 km Regional rail rapid Transit (RER), 3000 km of bus lines, 2) 2000 exhibitions in 2003 in the 10 main exhibition centers
Rest of France Portion of IDF
Population
Part of IDF in FranceIndicator
29%GDP
19%
% R&D researchers
35%
Export 17,3%
34
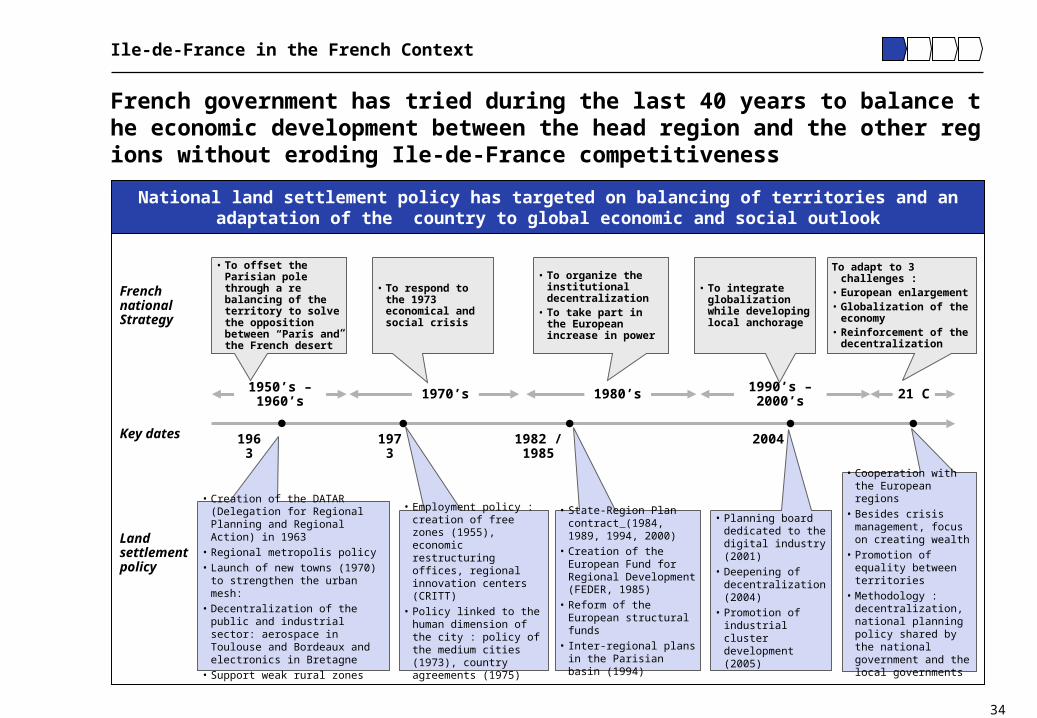
French government has tried during the last 40 years to balance the economic development between the head region and the other regions without eroding Ile-de-France competitiveness
Ile-de-France in the French Context
National land settlement policy has targeted on balancing of territories and an adaptation of the country to global economic and social outlook
Land settlement policy
French national Strategy
Key dates
1990’s –2000’s 21 C1980’s1970’s1950’s –1960’s
• To respond to the 1973 economical and social crisis
• To integrate globalization while developing local anchorage
• State-Region Plan contract (1984, 1989, 1994, 2000)
• Creation of the European Fund for Regional Development (FEDER, 1985)
• Reform of the European structural funds
• Inter-regional plans in the Parisian basin (1994)
• Planning board dedicated to the digital industry (2001)
• Deepening of decentralization (2004)
• Promotion of industrial cluster development (2005)
• To offset the Parisian pole through a re balancing of the territory to solve the opposition between “Paris and the French desert”
• Creation of the DATAR (Delegation for Regional Planning and Regional Action) in 1963
• Regional metropolis policy
• Launch of new towns (1970) to strengthen the urban mesh:
• Decentralization of the public and industrial sector: aerospace in Toulouse and Bordeaux and electronics in Bretagne
• Support weak rural zones
• Employment policy : creation of free zones (1955), economic restructuring offices, regional innovation centers (CRITT)
• Policy linked to the human dimension of the city : policy of the medium cities (1973), country agreements (1975)
To adapt to 3 challenges :• European enlargement• Globalization of the
economy• Reinforcement of the
decentralization
• Cooperation with the European regions
• Besides crisis management, focus on creating wealth
• Promotion of equality between territories
• Methodology : decentralization, national planning policy shared by the national government and the local governments
• To organize the institutional decentralization
• To take part in the European increase in power
1963 1973 1982 / 1985 2004

35
France is among European most dynamic country in terms of international attractiveness
Ile-de-France in the French Context
France capitalizes on its competitiveadvantages
France is ranked 2 in terms of internationalimplantation of strategic companies functions1)
Source : Ernst & Young 2005, Barometer of France site attractiveness – 204 international firms CEO survey
Source : Ernst & Young 2005, Barometer of France site attractivity, 1) Strategic functions : headquarters, R&D centers, services centers
Evaluation of satisfaction toward site France assets (note, out of 10)
10 first European implantation countries(2003-2004)
6.2
6.9
7.7
8.4
8.6
9.0
Innovation and research poles quality
Culture and language
Workforce qualification
Transport and logistic infrastructures
Telecom infrastructures
Quality of life
100%2885Total
22%28,7%828Other
-6%3,7%107Belgium
-12%3,4%97Sweden
-17%3,9%112Czech Republic
-29%4%116Russia
4,2%
4,8%
5,1%
5,7%
17,0%
19,5%
Market share in
2004
Market share
evolution 2003/2004
# of international
implantations in 2004
Country
-17%563United Kingdom
-32%121Spain
9%139Hungary
115%148Poland
-1%164Germany
5%490France
36
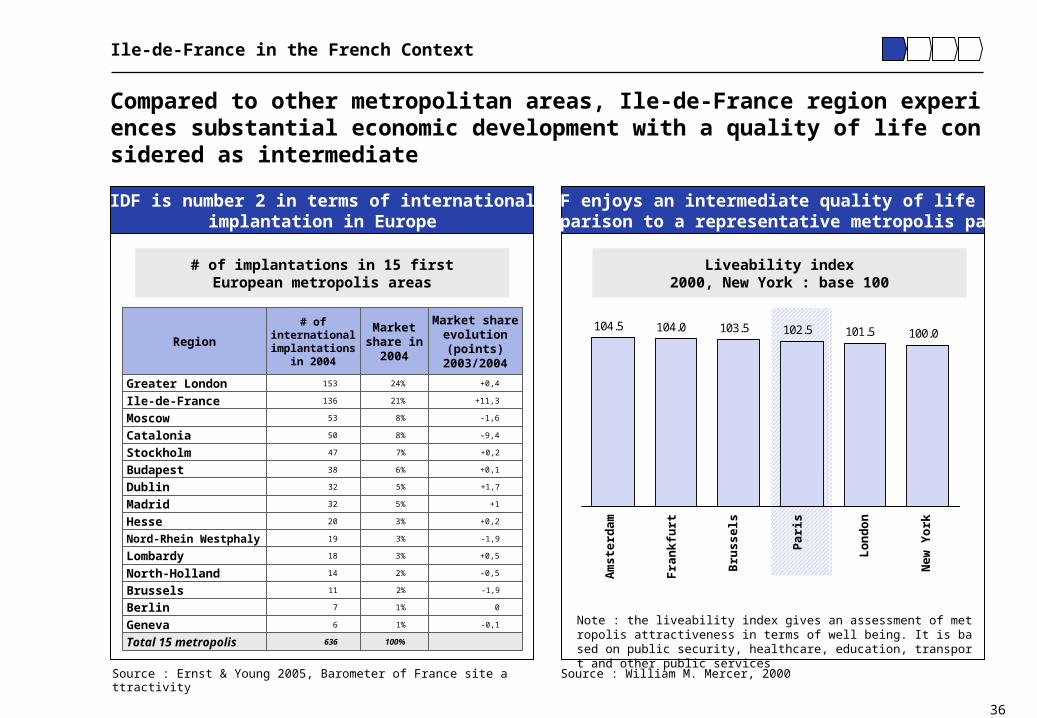
Compared to other metropolitan areas, Ile-de-France region experiences substantial economic development with a quality of life considered as intermediate
Ile-de-France in the French Context
IDF enjoys an intermediate quality of life incomparison to a representative metropolis panel
IDF is number 2 in terms of internationalimplantation in Europe
Liveability index2000, New York : base 100
# of implantations in 15 firstEuropean metropolis areas
Source : William M. Mercer, 2000Source : Ernst & Young 2005, Barometer of France site attractivity
104.5 104.0 102.5 101.5 100.0 103.5
New
Yo
rk
Lo
nd
on
Bru
ss
els
Fra
nk
furt
Am
ste
rda
m
Region
Hesse
Dublin
Stockholm
Madrid
Total 15 metropolis
Geneva
Brussels
Berlin
North-Holland
Lombardy
Greater London
Nord-Rhein Westphaly
Budapest
Catalonia
Moscow
Market share in
2004
Market share evolution (points)
2003/2004
# of international implantations
in 2004
+0,23%20
+1,75%32
+0,27%47
+15%32
100%636
-0,11%6
-1,92%11
01%7
-0,52%14
+0,53%18
3%
6%
8%
8%
21%
24% +0,4153
-1,919
+0,138
-9,450
-1,653
+11,3136Ile-de-France
Note : the liveability index gives an assessment of metropolis attractiveness in terms of well being. It is based on public security, healthcare, education, transport and other public services
Par
is

37
The Ile-de-France region have strong assets but suffers from pending weaknesses
Ile-de-France in the French Context
Main assets and weaknesses of IDF
Source : European Union, objective 2 program, report on Ile-de-France, 2004
Com-munautarism
Weak transport service on some
job areas
High unemployment
rate
Drain of middle class
Social / spatial dualization
Damaged urban network
Unbalanced Employment
structure
Low urban melting
R&D centers valorization
Activity potential around
infrastructures
National transport
infrastructures
Space opportunities
Intermunicipal solidarities
Young population
Major communication
axis
Cultural heritage
Worldwide clusters
Cultural equipment
quality
Competitive advantage
The plus product
The critical weaknesses
Strategic threats
High expectations
Medium expectations
Strong satisfactionLow satisfaction
20%
0% 50% 100%
40%
Telecom infrastructures
Economic network
Growing precariousness
School failures
Soils pollution green spaces
scarcity
Ill adapted education for
enterprise
38
Agenda
1 Ile-de-France in the French Context
22 VisionVision
3 Organization and Process
4 Resources

39
Change in IDF is driven by a moderate economic growth in a fierce global competition context
Vision
Driving Forces
1) IDF Transport Syndicate, 2005
• Moderate economic growth (2,8% year growth between 1999 and 2004), high unemployment rate (10% of active population)
• Migratory deficit (-64 500 people between 1999 and 2004)
• Low accessibility by collective transit means (Image note on collective means : 6,1/10 in 20041)
• Need of social and spatial cohesion
• Intermediate liveability rating (Citizen’s demand for better life conditions)
• Fierce competition between leading European areas (Ex : Olympic games 2012, biotechnologies)
• Globalization : companies headquarters’ and researchers’ mobility
• State land settlement policy pleading for an equilibrium with other regions
• New technologies (telecommunication, biotechnology, nanotechnology)
Internal IDF External
40
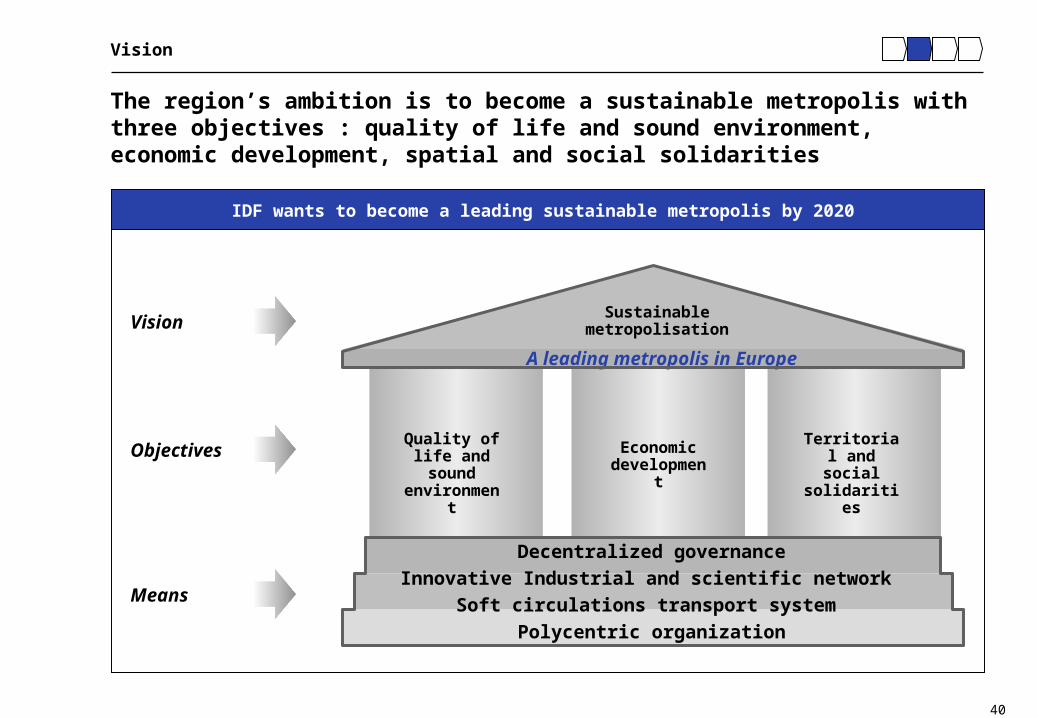
The region’s ambition is to become a sustainable metropolis with three objectives : quality of life and sound environment, economic development, spatial and social solidarities
Vision
IDF wants to become a leading sustainable metropolis by 2020
Quality of life and sound
environment
Sustainable metropolisation
Decentralized governance
Innovative Industrial and scientific network
Soft circulations transport system
Polycentric organization
Objectives
Means
Vision
Territorial and social solidarities
A leading metropolis in Europe
Economic development

41
Agenda
1 Ile-de-France in the French Context
2 Vision
33 Organization and ProcessOrganization and Process
4 Resources
42
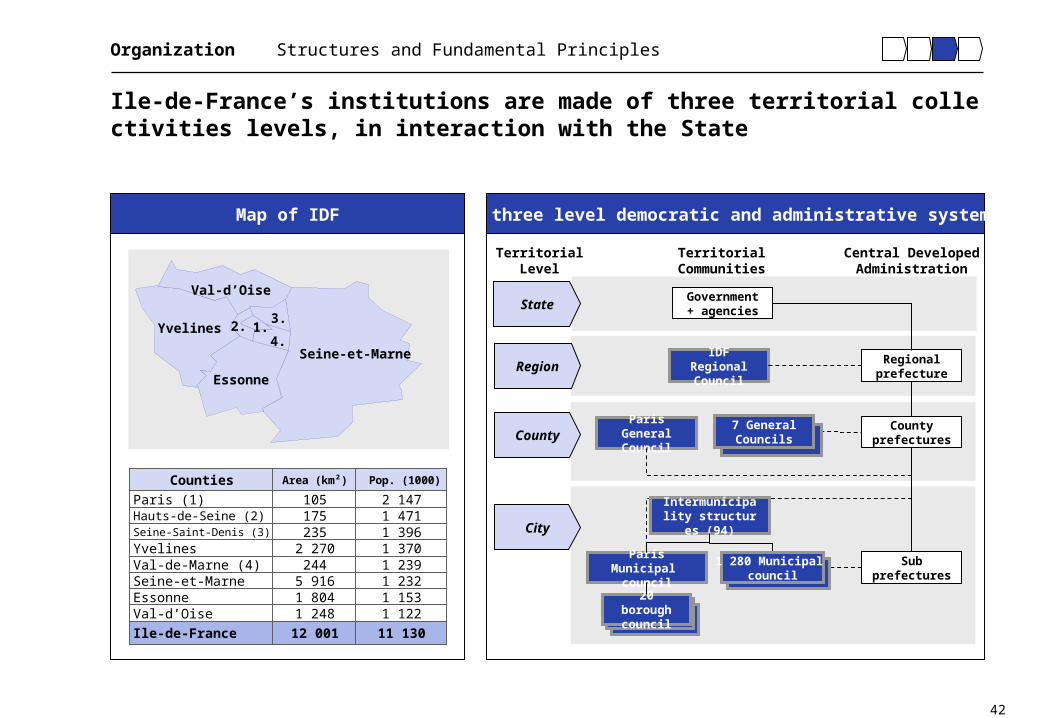
Ile-de-France’s institutions are made of three territorial collectivities levels, in interaction with the State
Organization Structures and Fundamental Principles
A three level democratic and administrative system Map of IDF
Seine-et-Marne
Essonne
Yvelines
Val-d’Oise
1.2.3.
4.
11 13012 001Ile-de-France
1 3702 270Yvelines
1 1221 1531 2321 239
1 3961 4712 147
Pop. (1000)
105Paris (1)
235Seine-Saint-Denis (3)175Hauts-de-Seine (2)
5 916Seine-et-Marne 244Val-de-Marne (4)
1 248Val-d’Oise1 804Essonne
Area (km²)Counties
Paris Municipal council
20 borough council
IDF Regional Council
Regional prefecture
County prefectures
Paris General Council
Sub prefectures
Intermunicipality structures (94)
7 General Councils
1 280 Municipal council
Government+ agencies
Region
County
City
State
Territorial Level
TerritorialCommunities
Central DevelopedAdministration

43
• Authority over great infrastructures (railways, motorways, airports) • Elaboration of director scheme with communities and State-Region Plan Contract• State control : Competency to modify Territorial Coherence Scheme, elaboration and approbation of
Territorial Settlement Guidelines • Initiative on Town Great projects and Public services scheme• Budget aid for housing, and environment
… with a decentralized set of competencies in interaction state
Organization Structures and Fundamental Principles
A decentralized set of competencies
State
• Financing and definition of regional scheme, Regional rail transport • Leading role on elaboration with state of director scheme of IDF (SDRIF) and elaboration
and approval of State-Region Contract plan• Housing priority definition and funding• Environment protection, inventory of heritage buildings, regional plan for air quality, regional
natural
• Transport : County transport plan, interurban transport• Elaboration with State of territorial guidelines (advice), director scheme of IDF (SDRIF),
State-Region Contract plan (+ approval)• Housing priority definition and funding and County household waste plan
• Organization and financing of transport in in urban perimeter• With State, elaboration of territorial guidelines, and of Territorial Coherence Scheme and Local Urbanism
Plan and State-Region Contract plan (+ approval)• Elaboration and approval of intercities charter• Housing priority definition (Local Housing Program, Great Town Projects, social housing organisms• Sewerage, drinkable water distribution, waste processing
Region
Country
City
44
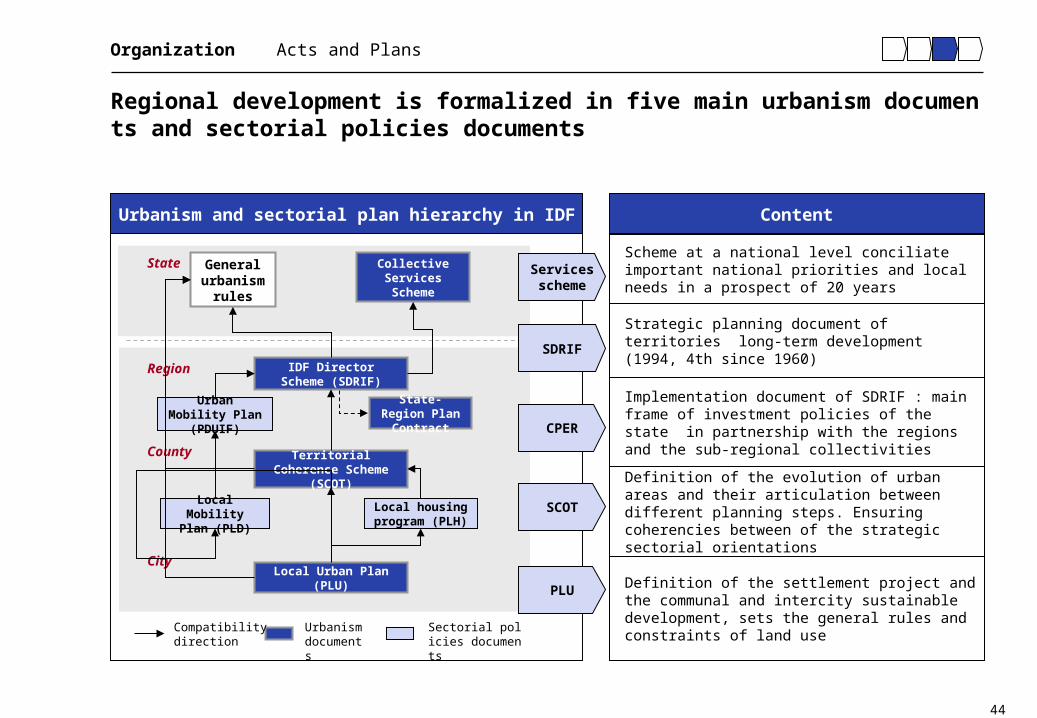
Regional development is formalized in five main urbanism documents and sectorial policies documents
Organization Acts and Plans
ContentUrbanism and sectorial plan hierarchy in IDF
Scheme at a national level conciliate important national priorities and local needs in a prospect of 20 years
Implementation document of SDRIF : main frame of investment policies of the state in partnership with the regions and the sub-regional collectivities
Strategic planning document of territories long-term development (1994, 4th since 1960)
Definition of the settlement project and the communal and intercity sustainable development, sets the general rules and constraints of land use
Definition of the evolution of urban areas and their articulation between different planning steps. Ensuring coherencies between of the strategic sectorial orientations
General urbanism
rules
IDF Director Scheme (SDRIF)
Urban Mobility Plan (PDUIF)
County
City
Local housing program (PLH)
Local Mobility Plan (PLD)
Territorial Coherence Scheme (SCOT)
Urbanism documents
Sectorial policies documents
Region
Compatibility direction
Local Urban Plan (PLU)
Collective Services Scheme
State-Region Plan Contract
SDRIF
CPER
SCOT
Services scheme
PLU
State

45
…. illustrated by the Ile-de-France transport syndicate’s evolution
Organization Structures and Fundamental Principles
• Responsibility for organizing public transport in IDF
• Local publicly-owned establishment which puts together :
- The IDF Region,
- The city of Paris,
- The 7 counties of the region,
- A representative of the publicly-owned establishments of intercity co-operation (EPCI)
- A representative of the regional Commerce and Industry Chamber of Paris Ile-de-France (CRCI)
The STIF will hereby become the organizing authorityin the region
The IDF Transport Syndicate(STIF) organization
Competence on : school transports organization, transports upon request, development and revision of the urban
mobility plan
Possibility to carry out investments projects, to fix the rates of the transport payment requested to the companies, within the price limit determined by l
aw
Ability to increase delegation of competencies to the local communities or
gathering of local communities
Increased competencies
• Since July 2005, complete withdrawal of the State from the Board of Directors of STIF : the syndicate is chaired by the president of the regional council instead of the region prefect
• The State will compensate the local collectivities for the cost of this responsibility transfer

46
• A new co-production method for land settlement vs. imposed guidelines by the State
• The State has a new positioning in line with a contractualization principle
• To find relevant discussion place level
The decentralization in France means a new co production method of land settlement policy, which have provided results an increasing complexity
Organization Structures and Fundamental Principles
Impacts of decentralization on land settlement policy …
• Potential dilution of the responsibilities : difficulty for the citizens to know who is in charge of land settlement issues (transport, urban policy, housing)
• Complex application of the subsidiarity principle : situation of extreme complexity and unreadable for the citizen in spite of the introduction of the “Head community” notion
• Relative confusion of the cross financings State-Region
Strengths
Drawbacks
… Which is observed in urbanism documents impact
• Variation in local projects (local mobility plan)
• Give coherence to the sectorial policies
• Higher achievement than the French average by the endof 2004 (57%) in a constrained budgetary environment
• High level of ambition,
• integrated approach • transversals of the
sets of themes
Strengths
• Variation of the plan proposals is currently ongoing
• Weak margin of operation in terms of organization and space management
• Relative confusion of the cross financings State-Region
• Sustainable development is not mentioned,
• excessively focused on sectors of activity,
• quantitative objectives too rigid and ill adapted,
• insufficient consensus between public and private actors,
• unequal articulation between general plan and sectors, or local scheme
Drawbacks
State-Region
Contract Plan
PDUIF
SDRIF
SCOT IDF
Document

47
Agenda
1 Ile-de-France in the French Context
2 Vision
3 Organization and Process
44 ResourcesResources

48
The Ile-de-France region experiences congestion problems mainly in housing and social disparities fields
Resources Main Issues’ Diagnosis
IDF main issues’ diagnosis
MediumGood
Quality level in IDF
Critical
Intermediate
Basic
Impact1)
Weak
• Tertiary activity is the major part of IDF economy
• Industries are the most dynamic activities (drugs, IT, services to companies)
• Stable density (940 h/km²)• Demographic dynamism in far
suburb • Behavior modifications
(domestic wastes production, use of motor vehicles use, increased mobility)
• 2/3 of strategic jobs are in Paris and Hauts-de-Seine
• Gentrification of south west : fiscal wealth is concentrated between a few numbers of municipalities of center and west
• high increase of ancient flat prices• Insufficient new housing
construction • Densification of close suburb, and
far suburbs
• Decentralization• Strong influence of
Paris City
• Medium growth of collective transport traffic • Stagnation of commuting between center and
agglomeration• Increase in moves from suburb to suburb • Time consuming transport (“time budget” : 1h30
/ day / h.)
• Widening of pollution definition
• Domestic wastes reach a high level (480 kg / h.)
• Increased awareness of pollution impacts
Transport system
EnvironmentHousing
Social disparities
Economic network
Demography
Governance
1) on economic development and quality of life

49
A policy mix is necessary to deal with interconnected issues
Resources Policies
A strong interdependance of main issues
Environment
Urban policyHousing
Economic development
Transport
• Quality of life
• Territory attractiveness
• High density
• Congestion
• Thoughtless development
Policy dealing with :

50
The transport policy promote a car reduction in the agglomeration, resulting in a move of traffic congestion from center to suburbs
Resources Policies
Source : STIFSource : State-Region Contract Plan 2000-2006
Public Answer Result Future Plan
• Infrastructures improvement and development of suburb to suburb collective transport means to comfort centralities in suburbs :
• Ring tramway in the close suburb
• Railroad line between main poles in far suburb (« Rail tangentials »)
• Great intermodal poles with 3 news rail station
• Interregional rail lines
• Promotion of soft circulations to contribute to qualitative improvement by a decrease of personal cars use in agglomeration :
• Regional objectives : car traffic decrease by 3%, increase of collective transport use by 2% (5% for the dense area), doubling of bicycle moves, 3% increase of freight transport by rail or waterway
• Paris city : created bus corridors, and regulation with pedestrian area, areas with limited car speed to 30km/h, green networks (bicycle itinerary)
• Stability of transport spent time through growth of IDF average transport speed and global increase of inhabitant “life basin” by 1,72% per year due to a higher performance of transport networks
• Stability of individual mobility
• Slight reduction of car moves toward agglomeration center
• Increased place of car in far suburb due to Insufficient suburbs to suburbs infrastructures
• Focus on service quality for poles generating great traffic (exhibition centers, airports, strong economic activity areas)
• Continuity of networks at the regional scale (achievement of rail « tangentials » and of great by-pass road axis
• Improvement of collective transport quality of service (information, cleanness, odors, conviviality)
Suburb to suburb links and car decrease Increased traffic in
suburbsObjectives
Transport1 2 3
51
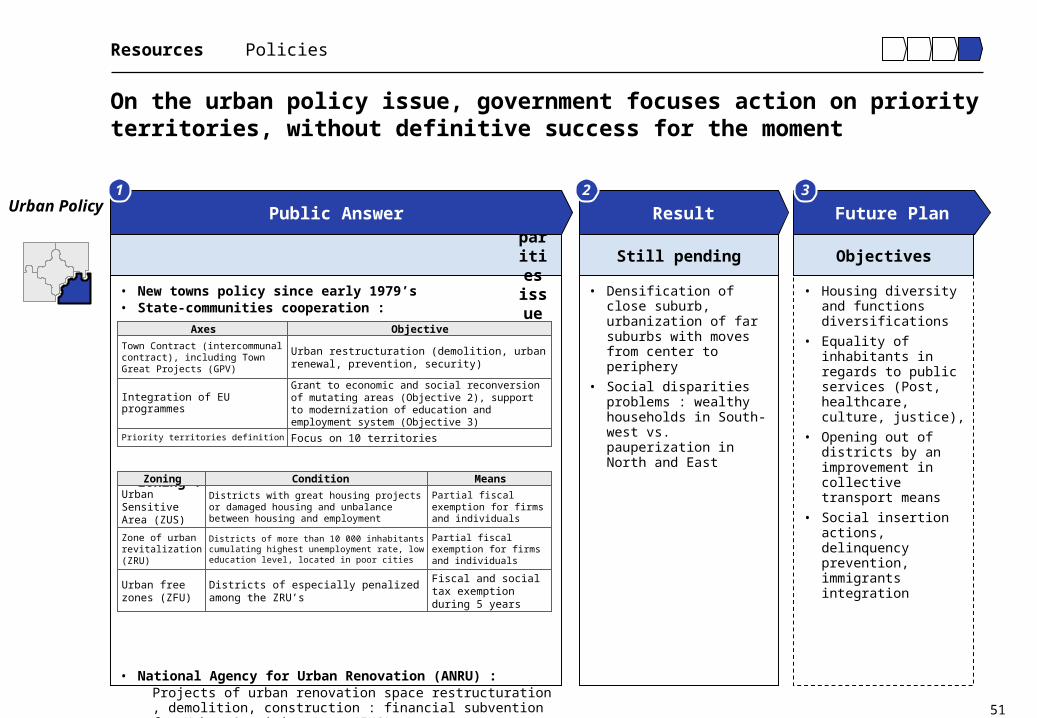
On the urban policy issue, government focuses action on priority territories, without definitive success for the moment
• New towns policy since early 1979’s• State-communities cooperation :
• Zoning :
• National Agency for Urban Renovation (ANRU) : Projects of urban renovation space restructuration, demolition, constr
uction : financial subvention for Urban Sensitive Area (ZUS) Co-financing with Regional council, European credits, State
• Densification of close suburb, urbanization of far suburbs with moves from center to periphery
• Social disparities problems : wealthy households in South-west vs. pauperization in North and East
• Housing diversity and functions diversifications
• Equality of inhabitants in regards to public services (Post, healthcare, culture, justice),
• Opening out of districts by an improvement in collective transport means
• Social insertion actions, delinquency prevention, immigrants integration
Districts of especially penalized among the ZRU’s
Districts of more than 10 000 inhabitants cumulating highest unemployment rate, low education level, located in poor cities
Districts with great housing projects or damaged housing and unbalance between housing and employment
Condition
Fiscal and social tax exemption during 5 years
Partial fiscal exemption for firms and individuals
Partial fiscal exemption for firms and individuals
Means
Urban Sensitive Area (ZUS)
Urban free zones (ZFU)
Zone of urban revitalization (ZRU)
Zoning
Focus on 10 territoriesPriority territories definition
Grant to economic and social reconversion of mutating areas (Objective 2), support to modernization of education and employment system (Objective 3)
Urban restructuration (demolition, urban renewal, prevention, security)
Objective
Town Contract (intercommunal contract), including Town Great Projects (GPV)
Integration of EU programmes
Axes
Public tools to tackle the urban disparities issue Still pending Objectives
Resources Policies
Urban Policy Public Answer Result Future Plan
1 2 3
52
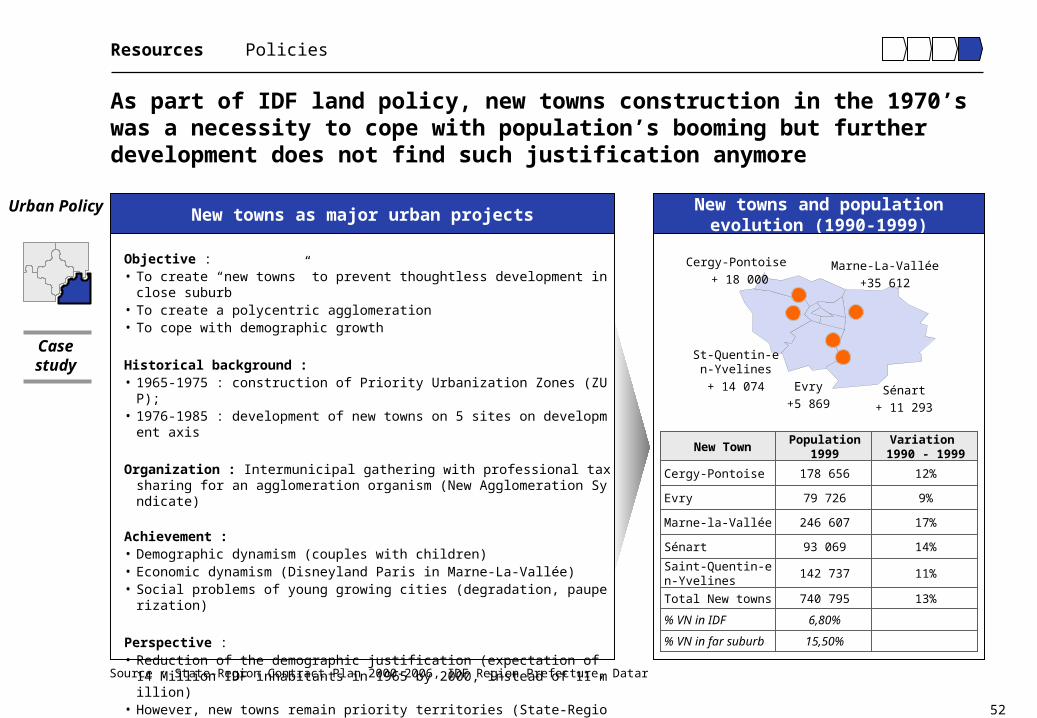
As part of IDF land policy, new towns construction in the 1970’s was a necessity to cope with population’s booming but further development does not find such justification anymore
Case study
Resources Policies
Urban Policy
Objective : • To create “new towns” to prevent thoughtless development in close suburb• To create a polycentric agglomeration• To cope with demographic growth
Historical background : • 1965-1975 : construction of Priority Urbanization Zones (ZUP); • 1976-1985 : development of new towns on 5 sites on development axis
Organization : Intermunicipal gathering with professional tax sharing for an agglomeration organism (New Agglomeration Syndicate)
Achievement : • Demographic dynamism (couples with children)• Economic dynamism (Disneyland Paris in Marne-La-Vallée) • Social problems of young growing cities (degradation, pauperization)
Perspective : • Reduction of the demographic justification (expectation of 14 Million IDF inhabita
nts in 1965 by 2000, instead of 11 million) • However, new towns remain priority territories (State-Region Contract Plan), exte
nsion of support to companies settlement
New towns as major urban projects
Source : State-Region Contract Plan 2000-2006, IDF Region Prefecture, Datar
New towns and populationevolution (1990-1999)
St-Quentin-en-Yvelines
+ 14 074 Evry
+5 869
Marne-La-Vallée
+35 612
Sénart
+ 11 293
Cergy-Pontoise
+ 18 000
New Town
15,50%% VN in far suburb
6,80%% VN in IDF
13%740 795Total New towns
11%142 737Saint-Quentin-en-Yvelines
14%93 069Sénart
17%246 607Marne-la-Vallée
Evry
Cergy-Pontoise
79 726
178 656
Population 1999
9%
12%
Variation 1990 - 1999

53
Urban planning efforts are focused on special development areas and on strategic areas
Resources Policies
Case study
Urban Policy Priority TerritoriesThe State-Region Contract plan defined 10 priority territories
Urban Free Areas (ZFU)A rehabilitation strategy for the suburbs
Source : State-Region Contract Plan 2000-2006, Region Prefecture, Datar, ANRU = National Agency for Urban Renovation (created in 2003)
Seine-Saint-Denis
8 ZFU
Yvelines
4 ZFU
European dimension centers
Restructuration area
New towns
Val d’Oise
3 ZFU
Seine et Marne
3 ZFU
Essonne
3 ZFUVal de Marne
2 ZFU
ND19Urban Renewal Area (ORU)
ND43Town contracts
27 cities
23 until 2008
67
157 including
27 GPV
Application in IDF
ND
ND
ND
financial subvention by ANRU for 55 area
3,4 billions € (2000-2006) 57% state, 43% region
Financing
EU program / Objectif 2
Urban Free Zones (ZFU)
Zone of Urban Revitalization (ZRU)
Urban Sensitive Area (ZUS)
Town Great Projects (GPV)
Urban planning tool
107 M€Massy-Saclay-Orly, Le Val de Seine around Boulogne Roissy
European centers registered in the SDRIF: sites with a high scientific or economic potential
New town of Marne la Vallée, new town of Sénart
Plaine Saint Denis, Plaine de France, Boucle de Gennevilliers
Application in IDF
35 M€
26 M€
Financing
Development of new towns
Strategic sites in difficulty, suffering mostly from de-industrialization
Priority territories
54
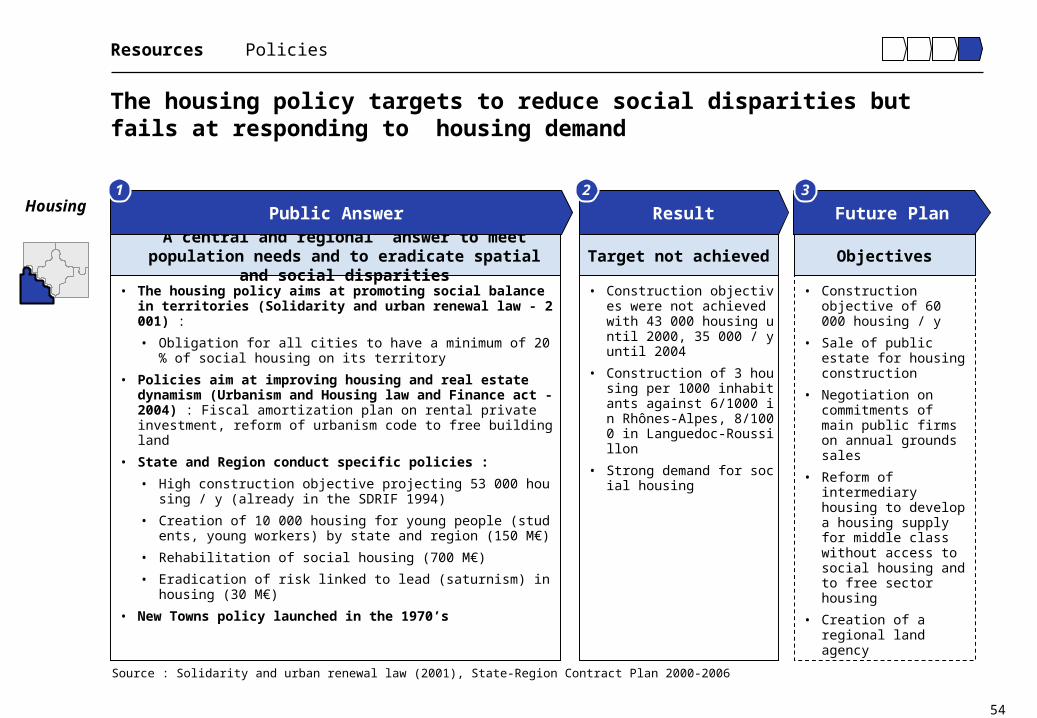
The housing policy targets to reduce social disparities but fails at responding to housing demand
• Construction objectives were not achieved with 43 000 housing until 2000, 35 000 / y until 2004
• Construction of 3 housing per 1000 inhabitants against 6/1000 in Rhônes-Alpes, 8/1000 in Languedoc-Roussillon
• Strong demand for social housing
• Construction objective of 60 000 housing / y
• Sale of public estate for housing construction
• Negotiation on commitments of main public firms on annual grounds sales
• Reform of intermediary housing to develop a housing supply for middle class without access to social housing and to free sector housing
• Creation of a regional land agency
• The housing policy aims at promoting social balance in territories (Solidarity and urban renewal law - 2001) :
• Obligation for all cities to have a minimum of 20% of social housing on its territory
• Policies aim at improving housing and real estate dynamism (Urbanism and Housing law and Finance act - 2004) : Fiscal amortization plan on rental private investment, reform of urbanism code to free building land
• State and Region conduct specific policies :
• High construction objective projecting 53 000 housing / y (already in the SDRIF 1994)
• Creation of 10 000 housing for young people (students, young workers) by state and region (150 M€)
• Rehabilitation of social housing (700 M€)
• Eradication of risk linked to lead (saturnism) in housing (30 M€)
• New Towns policy launched in the 1970’s
Source : Solidarity and urban renewal law (2001), State-Region Contract Plan 2000-2006
A central and regional answer to meet population needs and to eradicate spatial and social disparities
Target not achieved Objectives
Resources Policies
Housing Public Answer Result Future Plan
1 2 3

55
Via various plans, authorities were rather successful in enhancing environment quality in IDF
• Favorable conditions for environment preservation due to the moderate growth perspectives of the area (stable population)
• Air quality : frequency of pollution pics inferior to legal limitations. However, non sufficient respect of day-to-day air quality objectives
• Reduction of pollutant emissions thanks to enhancement of housing quality and energy savings but status quo on transport vehicles emissions
• To renovate controlling tools to adapt to changing nature of pollution (Ex : AIRPARIF for air quality control)
• To develop a transversal approach
• To further information campaigns
• Discussion about alternative circulation of car in function of license plate numbers
• To limit periurbanization impact on natural spaces
• Air quality : Objectives : 1) To fight in priority against chronic pollution rather than on peaks, pollutant-payer principle, 2) Objective of a 50% NOx reduction between 2000 and 2010 in whole agglomeration, 80% close to road traffic Actions : 1) Information of the IDF inhabitants to modify the displacement or way of life behaviors, 2) Automobile traffic restrictions, development of public transport and reduction of the transiting heavy lorries traffic in the dense IDF zone
• Polluant emissions : objective of respect before 2010 of the constraining regulatory limits of concentration for atmospheric pollutants (electricity production, heating, cars, planes)
• Wastes : the County Plan of Household Waste Disposal targets a reduction of waste from the start, sorting, matter valorization and close treatment. It is managed by counties.
• Water : plan of a global and balanced water management with four orientations: preservation of the water supply, fight against floods, treatment of worn water and protection of natural environments.
• Natural spaces : strengthening of soil occupation rules to protect natural spaces, certification of 15 sites in IDF as untouchable natural spaces
The environment issue is handled by specific plansSuccessfully taken into
accountObjectives
Resources Policies
Environment Public Answer Result Future Plan
1 2 3
56
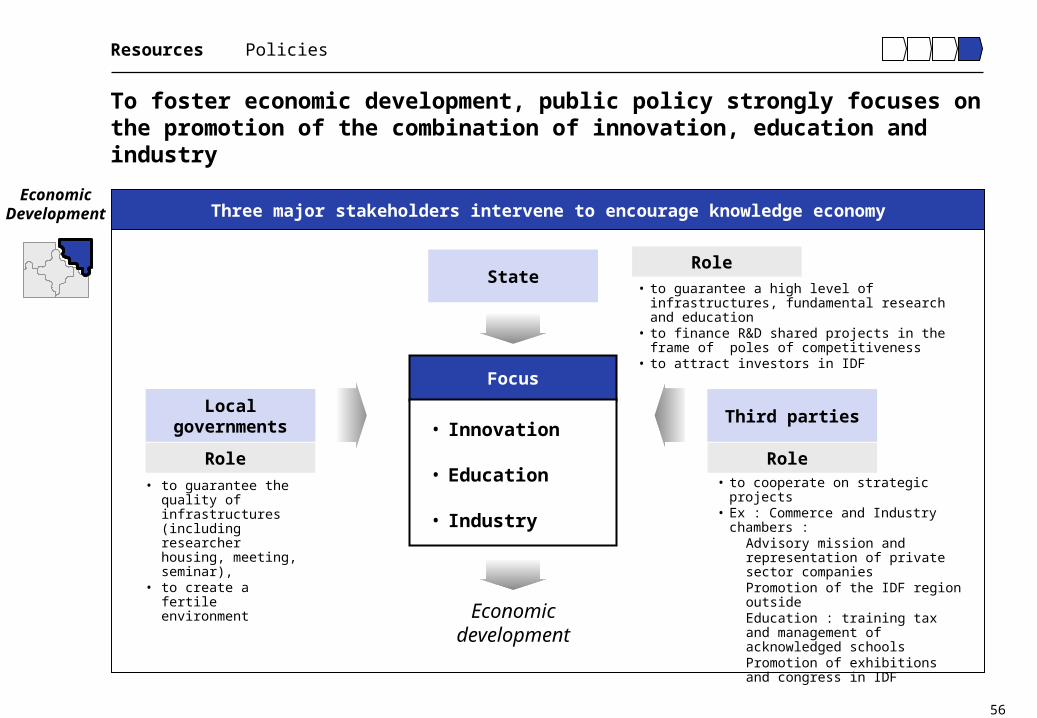
To foster economic development, public policy strongly focuses on the promotion of the combination of innovation, education and industry
Resources Policies
EconomicDevelopment Three major stakeholders intervene to encourage knowledge economy
Focus
• Innovation
• Education
• Industry
State
Third partiesLocal governments
• to guarantee a high level of infrastructures, fundamental research and education
• to finance R&D shared projects in the frame of poles of competitiveness
• to attract investors in IDF
• to cooperate on strategic projects• Ex : Commerce and Industry chambers
: Advisory mission and representation
of private sector companies Promotion of the IDF region outside Education : training tax and
management of acknowledged schools
Promotion of exhibitions and congress in IDF
• to guarantee the quality of infrastructures (including researcher housing, meeting, seminar),
• to create a fertile environment
Economic development
Role Role
Role
57
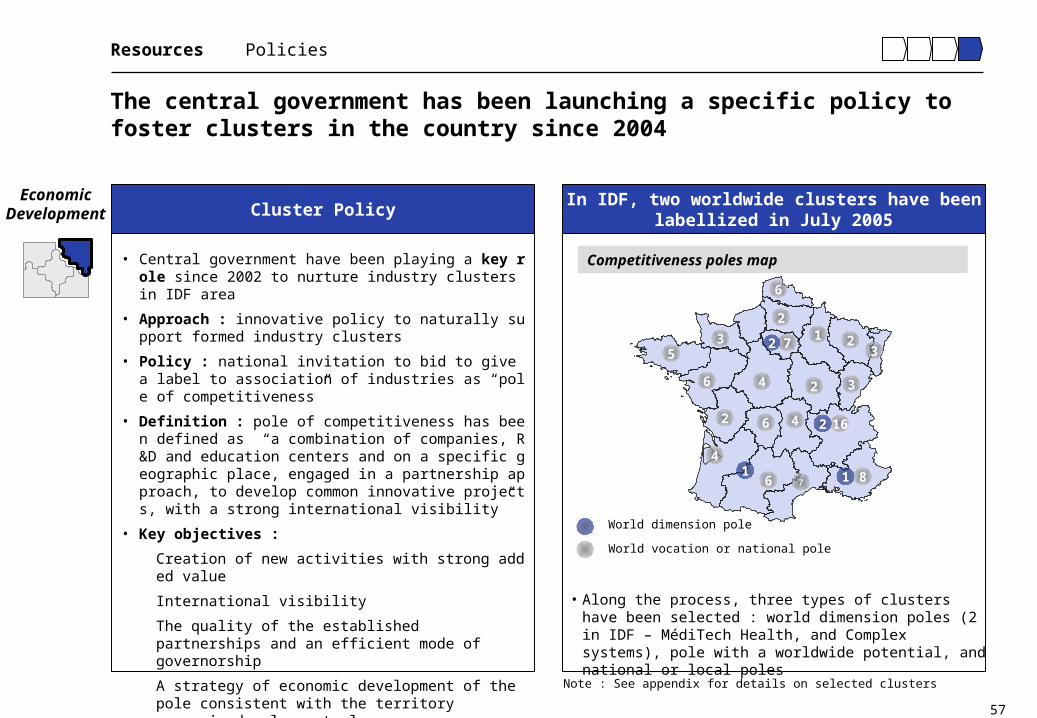
The central government has been launching a specific policy to foster clusters in the country since 2004
Resources Policies
EconomicDevelopment
• Central government have been playing a key role since 2002 to nurture industry clusters in IDF area
• Approach : innovative policy to naturally support formed industry clusters
• Policy : national invitation to bid to give a label to association of industries as “pole of competitiveness”
• Definition : pole of competitiveness has been defined as “a combination of companies, R&D and education centers and on a specific geographic place, engaged in a partnership approach, to develop common innovative projects, with a strong international visibility”
• Key objectives :
Creation of new activities with strong added value
International visibility
The quality of the established partnerships and an efficient mode of governorship
A strategy of economic development of the pole consistent with the territory economic development plan
In IDF, two worldwide clusters have beenlabellized in July 2005
Cluster Policy
World vocation or national pole
World dimension pole
7
6
5
6
3
4 2
1 23
3
6 7 8
2 1646
4
2
2
1 1
2
Competitiveness poles map
• Along the process, three types of clusters have been selected : world dimension poles (2 in IDF – MédiTech Health, and Complex systems), pole with a worldwide potential, and national or local poles
Note : See appendix for details on selected clusters

58
The cluster policy aims at focusing State support on promising cooperation projects
Resources Policies
EconomicDevelopment
• The call for tender was a success with 104 candidates• The call for tender was launched in a favorable context in w
hich the main actors had been aware of the need of change.
• The contracted forms and deadlines of the call for tender favored the mobilization and the alignment of the actors.
• The French Government chose to favor the created dynamic and to putting a label on as much as 67 poles. Nevertheless the impact of the various categories (world, with world vocation, national pole) remains to be evaluated.
• The poles of competitiveness undoubtedly constitute a rupture in the industrial policy of the French Government to cause initiatives and to help them rather than to decide for orientations.
• The schedule of conditions accentuated strongly on the governance which turns out to be a critical point in the duration.
• 10 months of work made it possible 1) to identify some poles and 2) to launch a dynamic but the process is only at its start.
• Public incentives Measures to develop shared projects in collaboration with university, industrials and public R&D centers :
Mobilization of the agencies for research and innovation (National Agency for Research, AII1, OSEO2) et the CDC1 : 800 million euros over a 3 year period
Government subsidiary grants : 400 million euros over a 3 year period
Tax and social exemptions : 300 million euros over a 3 year period
This money will be used to finance the projects selected by the poles of competitiveness and possibly the governorship structures
Cluster Policy Key LearningsPublic Incentives Measures
1) CDC : Caisse des Dépôts et Consignations : public financial institution in charge of public interest missions assigned by State or local communities

59
The large number of life sciences firms and of biotech projects is an example of new high tech sector government is promoting
Resources Policies
Case study
EconomicDevelopment
• IDF is the first European region before Great London by the number of pharmacy sector firms, second for biotech companies (behind Great London - Cambridge)
• Life sciences firms pertain to pharmaceutical (320) and biotech firms (150), including world leaders like Pfizer, Sanofi-Aventis, GlaxoSmithKline, Amgen, Biogen
• They employ 46 600 employees and 5 000 specifically in Biotech firms
• The region hosts 7,5% of European R&D spending with major projects like Genopole, Synchrotron Soleil, academic research, clinical research
• It gathers 90% of national capital venturing specialised in life sciences
• Incubators and technological parks dispose of 155 000 m²
The cluster’s success has been supported by public andprivate stakeholders commitment
In biotechnology sector,IDF belongs to the leading areas
Biotech cluster
Central government
• Public R&D program funding via public research organism (CNRS, Inserm, CEA, Inra…), and university network
• Poles of competitiveness (tax and social exemption policy) to foster cooperation between local actors (ex : pole MédiTech Santé Paris Ile-de-France)
• Clinical research in public hospitals (AP-HP)
Local government
• Doubling of regional R&D support budget from 2004 to 40 million €
• Capital venturing (CapDecisif, IDF Développement)
• Promotion of technological transfers through Regional centers for innovation (CRITT : CRITT Chemical, Bio CRITT)
• Promotion outside IDF and catalyst agencies (Regional Development Agency, ARD)
3rd parties
• Industrials investment and spin offs
• Valorization and technologies transfers structures linked with research organisms public (Inserm) or private (Pasteur Institute)
• Incubators (with label from National Research Department : Incuballiance, Agoranov, Paris Biotech)
Source : MédiTech Santé Paris Ile-de-France study, 2005

60
Tourism is a crucial economic field, organized in geographic poles where public effort is focused
Resources Policies
EconomicDevelopment IDF Tourism HighlightsTourism Policy
Leisure Structures
Background : • IDF is the world first touristy regional destination with 30,3 million tourists for Par
is and IDF region (2004), implying 250 000 direct jobs and representing 5% of IDF GDP, with essentially SMEs
• With 3% of the market Paris is the first city worldwide for congress and exhibitions (400 exhibitions, 380 congresses, counting for 10 million visitors) with 10 exhibition centers in Ile-de-France (563 000 m2)
Public policy is focusing on : • Preservation of heritage (Ex : renovation of Grand Palais exhibition center)• Focus on territorial poles and canals (help for project startup, investment on rec
eption centers, hosting structures, descriptive boards)• Enhancement of tourism firms and quality of touring performance (quality plans,
labels, certificate, ex : for beds & breakfast) for individual and for business • Promotion of events like White Night, Paris Beach, Paris Head of Creation• Creation of 9 leisures bases in IDF since 1960’s (Ex : nautism bases) • Support to business tourism (Promosalons association to support exhibitions in
IDF, Creation of a congress office at the Paris tourist home to federate professionals
• Cooperation between the city of Paris and region to promote IDF inhabitants tourism in IDF
• Economic observation of tourism (ORTIF : regional tourism observatory)
Source : City of Paris, Regional Tourism Observatory, 2005 Note : Non exhaustive
Amusement parks
Regional leisures bases
Zoo
Congress & exhibition centers
Tourism poles
Sud est IDF (Fontainebleau)
Auvers sur Oise
Vallée de la Chevreuse
Seine St Denis
Paris
Bords de Marne

International Symposium for Capital Region Development
- New York -October 25, 2005
Arthur D. Little New York
l New York
62
Agenda
11 New York Metropolitan AreaNew York Metropolitan Area
22 Vision and StrategyVision and Strategy
33 Organization and ProcessOrganization and Process
44 Battery Park City CaseBattery Park City Case

63
Agenda
11 New York Metropolitan AreaNew York Metropolitan Area
2 Vision and Strategy
3 Organization and Process
4 Battery Park City Case
64
New York Metropolitan Area Introduction
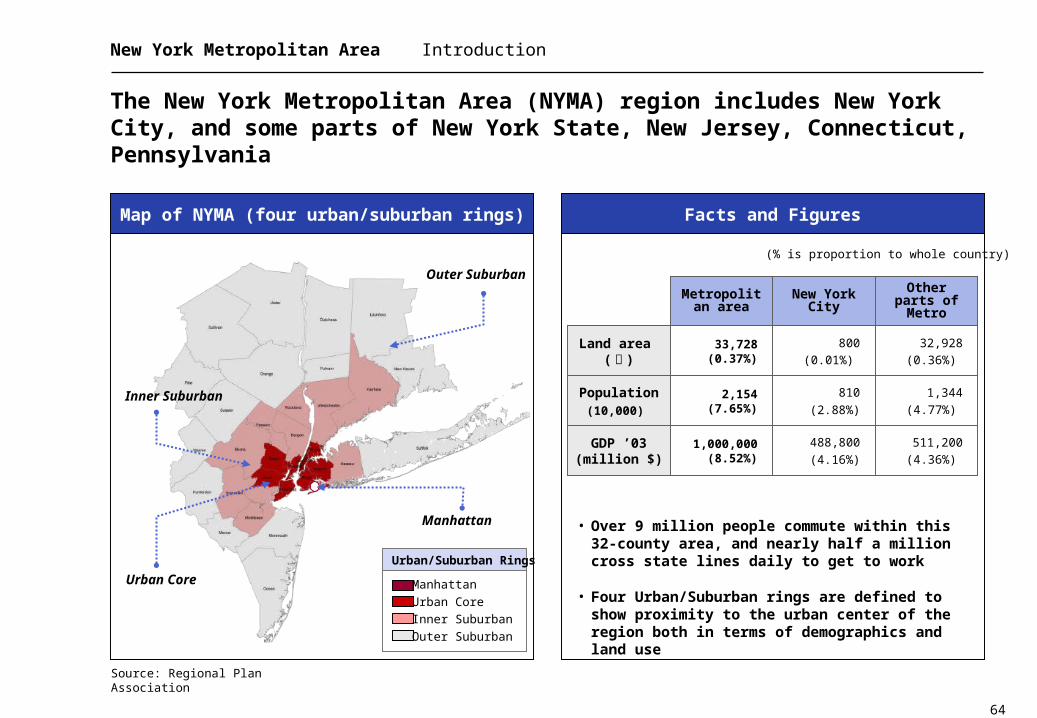
The New York Metropolitan Area (NYMA) region includes New York City, and some parts of New York State, New Jersey, Connecticut, Pennsylvania
Facts and FiguresMap of NYMA (four urban/suburban rings)
Manhattan • Over 9 million people commute within this 32-county area, and nearly half a million cross state lines daily to get to work
• Four Urban/Suburban rings are defined to show proximity to the urban center of the region both in terms of demographics and land use
Inner Suburban
Urban Core
Outer Suburban
Source: Regional Plan Association
(% is proportion to whole country)
Land area (㎢ )
Population(10,000)
GDP ’03(million $)
Metropolitan area
2,154(7.65%)
33,728(0.37%)
1,000,000(8.52%)
810
(2.88%)
488,800
(4.16%)
32,928
(0.36%)
New York City
Other parts of Metro
800
(0.01%)
1,344
(4.77%)
511,200
(4.36%)
Manhattan
Urban Core
Inner Suburban
Outer Suburban
Urban/Suburban Rings

65
New York Metropolitan Area New York City
In 2000 the city had 37% of the region’s population. If it were a nation, the city would have the 16th highest GDP ($488.8 billion) in the world, exceeding that of Belgium, and the second highest per capita GDP, at about $59,000/head
• The chief center of finance in the world• Wall street, NYSE, NASDAQ, American Stock Exchange, New York Board of Trade• Many major finance corporations have their headquarters in New York
• Public transportation is the common mode of travel for majority of its residents• As of 2001, 50% households and only 20% of Manhattan households had access to a vehicle, as
compared to more than 90% nationwide
• It has the most important scenes for art, music, and theater in the U.S., with an increasingly active artist's community
• The most important center for American mass media, journalism and publishing• Forty daily newspapers in several different languages• Home of the four major U.S. television networks, ABC, CBS the Fox Network, and NBC, as well as
news organization CNN
• The center of many of the service sector industries in the U.S., with more Fortune 500 companies headquartered in the city than anywhere else in the country
• The city also has a large tourism industry
• Absorbs a larger number of immigrants every day than all other U.S. cities except Los Angeles, giving New York an international flavor, and making it the archetype of the American ideal of a melting pot – a nation of immigrants
Roles of New York City
Finance Center
Transportation
Art
Media
Service Sector
International Flavor
66
New York Metropolitan Area Concentration
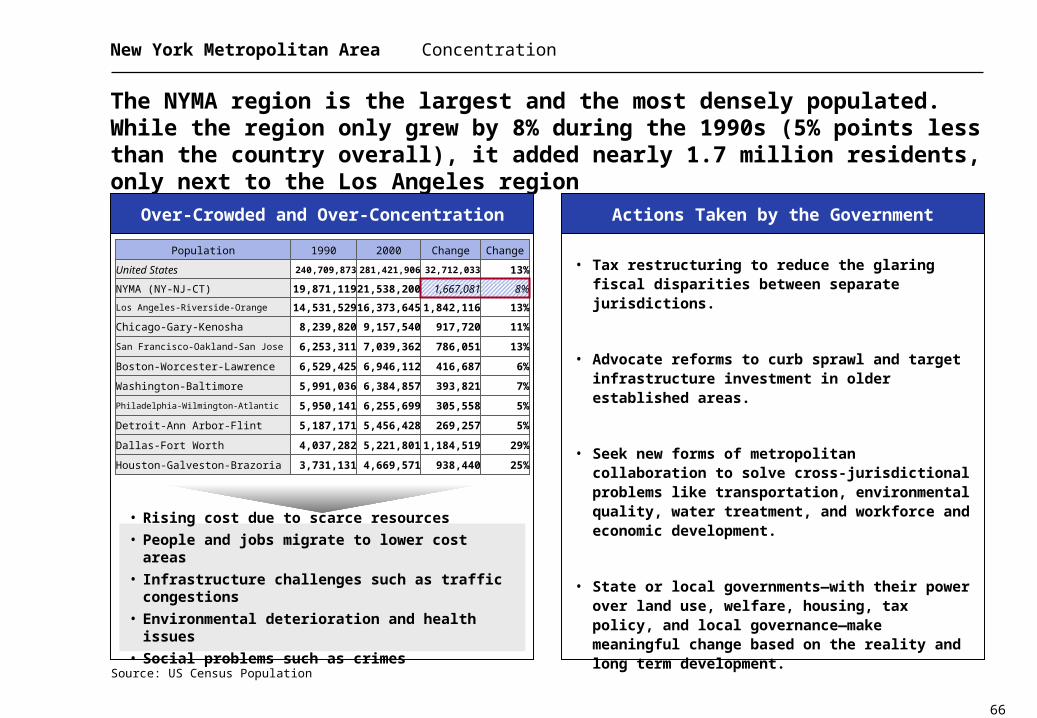
The NYMA region is the largest and the most densely populated. While the region only grew by 8% during the 1990s (5% points less than the country overall), it added nearly 1.7 million residents, only next to the Los Angeles region
• Tax restructuring to reduce the glaring fiscal disparities between separate jurisdictions.
• Advocate reforms to curb sprawl and target infrastructure investment in older established areas.
• Seek new forms of metropolitan collaboration to solve cross-jurisdictional problems like transportation, environmental quality, water treatment, and workforce and economic development.
• State or local governments—with their power over land use, welfare, housing, tax policy, and local governance—make meaningful change based on the reality and long term development.
Actions Taken by the GovernmentOver-Crowded and Over-Concentration
Source: US Census Population
• Rising cost due to scarce resources
• People and jobs migrate to lower cost areas
• Infrastructure challenges such as traffic congestions
• Environmental deterioration and health issues
• Social problems such as crimes
25%938,4404,669,5713,731,131Houston-Galveston-Brazoria
29%1,184,5195,221,8014,037,282Dallas-Fort Worth
5%269,2575,456,4285,187,171Detroit-Ann Arbor-Flint
5%305,5586,255,6995,950,141Philadelphia-Wilmington-Atlantic
7%393,8216,384,8575,991,036Washington-Baltimore
6%416,6876,946,1126,529,425Boston-Worcester-Lawrence
13%786,0517,039,3626,253,311San Francisco-Oakland-San Jose
11%917,7209,157,5408,239,820Chicago-Gary-Kenosha
13%1,842,11616,373,64514,531,529Los Angeles-Riverside-Orange
8%1,667,08121,538,20019,871,119NYMA (NY-NJ-CT)
13%32,712,033281,421,906240,709,873United States
ChangeChange20001990Population

67
New York Metropolitan Area Competitiveness
In recent years New York has been riding a wave of national prosperity, but not distinguishing itself with unique gains
• New York’s fiscal policies, its health and social welfare status, and some elements of its physical infrastructure place it behind all or nearly all of its competitors
• The percentage increase in population due to international migration is greater in New York than in all competitors except Los Angeles and San Francisco
• In contrast, New York has lost a greater share of its population due to net domestic migration than every other competitor
SituationScorecard: New York Metropolitan Area
Summary Rankings of the New York Metropolitan Area
Results among 13 top-tier US metropolitan areas
Current Position 5 Year Performance
TopTier
Population Mixed
Jobs and Income Keeping Pace
Technological Development and Entrepreneurship
Keeping Pace
MiddleTier
Labor Force Keeping Pace
Fiscal Policy GainingBottom
Tier
Public Safety and Tourism GainingMixed
Position
Health and Social Welfare Mixed
Physical Infrastructure Lagging
Source: US Citizens Budget Commission, 2001

68
Agenda
1 New York Metropolitan Area
22 Vision and StrategyVision and Strategy
3 Organization and Process
4 Battery Park City Case

69
Vision and Strategy Driving Forces
There are a number of important internal and external developments driving evolution of strategies and urban development programmes in NYMA
Main drivers underpinning adoption ofstrategies and urban development programmes in NYMA
ExternalInternal
• Infrastructure: New York City boasts the most extensive network of public transportation in the United States
• Higher education facilities: The area is home to a number of institutions of higher learning, some of national or even international reputation
• Business entities: The area is very innovation- and entrepreneur-oriented, and has strong industrial position
• Economy: The world’s financial center
• Potential investors
• Potential residents or immigrants bring abundant labor force
• Domestic competing areas are ‘stealing’ good labor force from NYMA
• Global competing areas
• National or international organizations & agencies
• International trade and the tertiary sector have always remained the real basis of New York's economy

70
Vision and Strategy
NYMA sets its vision in 2020 as ‘A Model for Metropolitan Regions around the World’
Vision & Strategy of NYMA ( ~2020)
VisionVision
StrategiesStrategies
• Become a model for metropolitan regions around the world
ObjectivesObjectives• To sustain quality of life and environmental systems
• To promote greater social integration and economic competitiveness in the first decades of the 21st century
• To be the best place to live, work and raise a family
• To attract, educate and retain a workforce with diverse skills and creative talent
• To enhance understanding of the region through economic and demographic research
• To implement workforce and community development projects that improve long-term prosperity and social equity
• To redirect much of the region’s growth to centers
• To extensively collaborate among hundreds of "third sector" civic groups throughout the region

71
Vision and Strategy Specialized Industries
The geographic concentration of business and people in the NYMA region creates unique economic conditions that generate new industries, speed the diffusion of knowledge, spur technological innovation, and increase productivity
• Economic development agencies providing the highest level of assistance and service
• Larger markets for goods and services, more specialized labor pools, and better transportation and telecommunications networks
• Home to 20 of the top 25 international banks, 8 of the world's top 10 securities firms, and 5 of the country's 10 largest insurance companies
• The New York Stock Exchange is the world's largest exchange marketplace for equities.
• High-tech and new media is a $9.2 billion industry in New York City, and the presence of 4,000 high-tech and new media companies
AdvantagesRepresentative Industries
Source: Empire State Development
New York has identified the 13 major industry clusters, including manufacturing clusters, services
clusters, and a few that are hybrids of both
DistributionCommunication
& Media Services
Food ProcessingBusiness Services
Software IndustriesBio Medical
Optics & ImagingTransportation Equipment
Materials ProcessingIndustrial Machinery
& Systems
Financial ServicesComputer Hardware
& Electronics
72
Agenda
1 New York Metropolitan Area
2 Vision and Strategy
33 Organization and ProcessOrganization and Process
4 Battery Park City Case
73
Organization and Process Administrative System
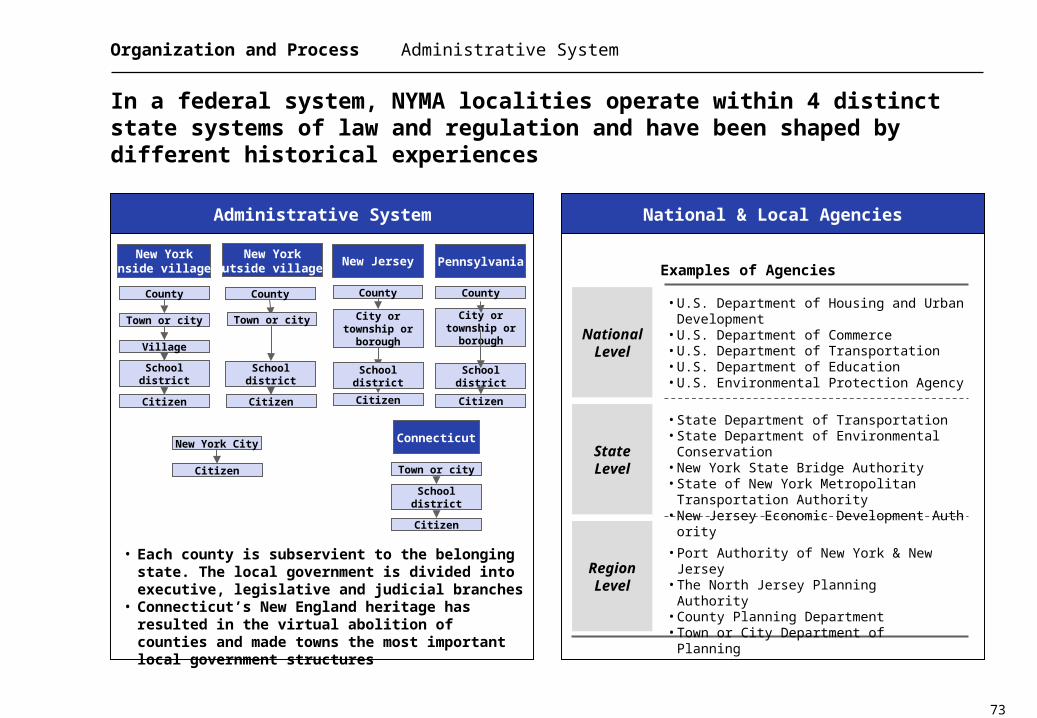
In a federal system, NYMA localities operate within 4 distinct state systems of law and regulation and have been shaped by different historical experiences
National & Local AgenciesAdministrative System
NationalLevel
StateLevel
RegionLevel
Examples of Agencies
• U.S. Department of Housing and Urban Development
• U.S. Department of Commerce• U.S. Department of Transportation• U.S. Department of Education• U.S. Environmental Protection Agency
• State Department of Transportation• State Department of Environmental Conservation• New York State Bridge Authority• State of New York Metropolitan Transportation
Authority• New Jersey Economic Development Authority
• Port Authority of New York & New Jersey• The North Jersey Planning Authority• County Planning Department• Town or City Department of Planning
New York(outside villages)
Citizen
County
City or township or borough
Connecticut
PennsylvaniaNew Jersey
School district
Citizen
New York City
Town or city
County
School district
Citizen
Town or city
New York(inside villages)
School district
Citizen
Village
County County
Citizen
School district
Citizen
Town or city City or township or borough
School district
• Each county is subservient to the belonging state. The local government is divided into executive, legislative and judicial branches
• Connecticut’s New England heritage has resulted in the virtual abolition of counties and made towns the most important local government structures

74
Organization and Process Public & Private Institutions
There are many public or private institutions playing important roles in NYMA planning, and RPA is the nation’s most influential regional planning organization
Regional Plan Association (RPA)Involving Institutions
Examples of institutions
CrossRegions
With-inRegion
• New York Metropolitan Transportation Authority• New Jersey Economic Development Authority• The New York Metropolitan Transportation
Council• New York City Economic Development Corp.• Greater New York Chamber of Commerce• New Jersey Transit
• Port Authority of New York and New Jersey• Regional Plan Association• Congress for the New Urbanism• American Planning Association• American Public Transportation Association• Association of Metropolitan Planning
Organizations• National Association of Regional Councils
• Independent, non-profit regional planning organization
• Partner with government and other allied organizations to promote long-term economic growth and vitality in NYMA
• Holds Regional Assembly, NYMA‘s premier annual public policy event on metropolitan issues, which offers workshops to over 500 private and public sector leaders
• RPA's three regional plans:
First Plan provided the blueprint for the transportation and open space networks
Second Plan was instrumental in restoring deteriorated mass transit system, preserving threatened natural resources and revitalizing urban centers
RPA's current work is aimed largely at implementing the ideas put forth in the Third Regional Plan (community design, open space, transportation, workforce and the economy, and housing)
1st Regional Plan
1929
2nd Regional Plan
1968
3rd Regional Plan
1996

75
Organization and Process Planning System
Specific federal decisions and interventions have huge spatial impacts in particular parts of the country
The InfluenceHierarchical System
• Federal government has an enormous impact through its investment in both traditional physical infrastructure and in newer forms of technological infrastructure that affect the flow of ideas and information
• Massive flows of federal money helped fund the expressways and apartment buildings. But now federal government’s longstanding inattention is one reason why progress has been halting on so many NYMA issues
• The federal government establishes the opportunity structure for low-wage workers and dramatically affects the equation for regional equity
PlanningActs
CentralGovernmentLevel
LocalGovernmentLevel
DevelopmentPlan
StructurePlan
LocalPlan
UnitaryDevelopment
Plan
• Fair Housing Act• Community Reinvestment Act• Transportation Equity Act for the
21st Century (TEA-21)• National Environmental Policy
Act (NEPA)• Clean Air Act Amendments • Clean Water Act• Endangered Species Act
County, City & Town
State
Greater New York Metropolitan Counties
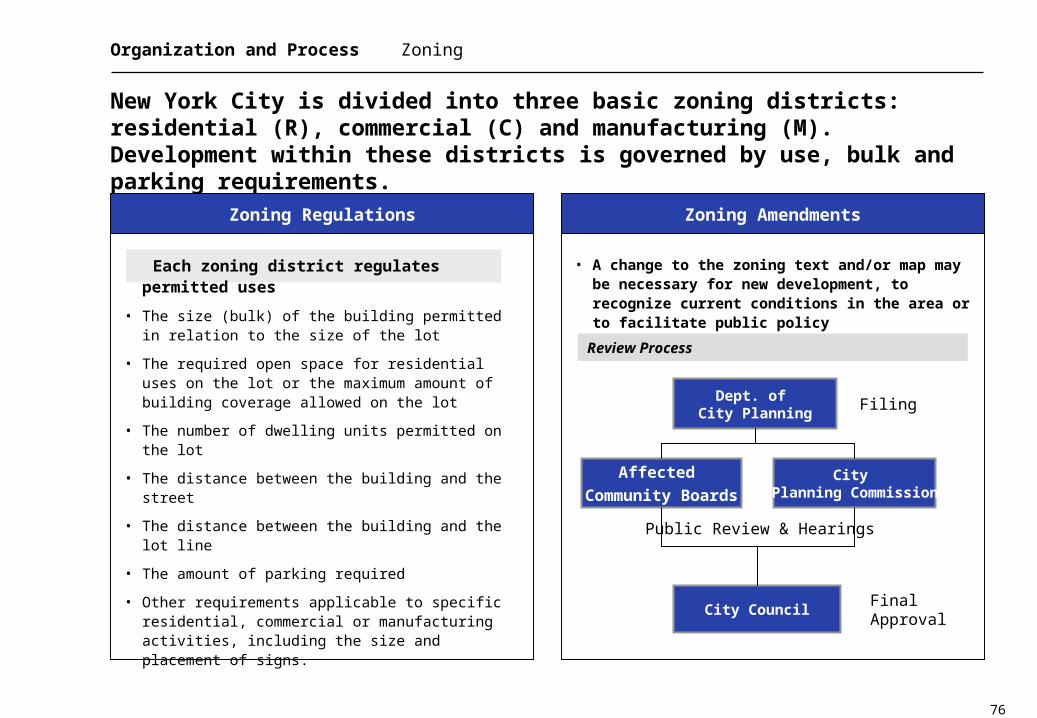
76
Each zoning district regulates permitted uses
• The size (bulk) of the building permitted in relation to the size of the lot
• The required open space for residential uses on the lot or the maximum amount of building coverage allowed on the lot
• The number of dwelling units permitted on the lot
• The distance between the building and the street
• The distance between the building and the lot line
• The amount of parking required
• Other requirements applicable to specific residential, commercial or manufacturing activities, including the size and placement of signs.
Organization and Process Zoning
New York City is divided into three basic zoning districts: residential (R), commercial (C) and manufacturing (M). Development within these districts is governed by use, bulk and parking requirements.
Zoning AmendmentsZoning Regulations
• A change to the zoning text and/or map may be necessary for new development, to recognize current conditions in the area or to facilitate public policy
Dept. of City Planning
Filing
City Council
Public Review & Hearings
Final Approval
City Planning Commission
Affected
Community Boards
Review Process

77
Organization and Process Empire Zones
One of the most important incentives in the state of New York is the Empire Zones program which offers tax benefits
Benefits of Empire Zone
Detailed Benefits
Tax ReductionCredit
Great for new and existing businesses experiencing employment growth within the Empire Zone, a tax reduction credit can reduce or eliminate all New York State tax liability
Real Property Tax Credit
Sales Tax Refund
Wage Tax Credit
Investment Tax Credit
Utility Rate Reduction
Capital Credit Corporation
485e Property Tax Abatement
Available for a five-year period, this incentive program allows qualified businesses to receive between $1500 and $3000 in tax credits per eligible employee
Property tax credits are available to qualified businesses located in the Empire Zone
Qualified businesses will receive a full 4% sales tax refund on all materials purchased for property improvements and renovations within the Zone
It is for industrial and production-oriented businesses located within the Empire Zone. Business could receive a 10% corporate tax credit and an additional 3% employment incentive credit will be available
This incentive is available for both tenants and landlords who occupy space in the Empire Zone
Loan funds are available with below-market rates for leasehold improvements, equipment and real estate purchases to eligible Empire Zone certified businesses
For property owners who wish to improve their properties in the Zone, but do not want to incur additional taxes based on increased assessments. Qualified building owners can keep their low assessment tax rates for the next seven years
78
Agenda
1 New York Metropolitan Area
2 Vision and Strategy
3 Organization and Process
44 Battery Park City CaseBattery Park City Case

79
Battery Park City Case
Battery Park City case is considered as one of the most successful city regeneration projects
Regeneration of Battery Park City
SituationSituation
SolutionSolution
Major AchievementsMajor Achievements
• Due to change of transportation means, Battery Park had been unused
• Business functions started to move out to other areas
• Security problems which had negative impacts on Wall Street
• Set up the direction of regeneration by ‘The Lower Manhattan Plan (1966)
• Battery Park City Development Corporation and Battery Park City Authority were founded in 1968
• Developed initial master plan in 1968 which was followed by amended master plan in 1979
• Adopted open-bid system to select developers and used lease of land instead of sale
• Many Business buildings such as World Financial Center has been built
• 10,000 housing units, two hotels, and marina has been constructed or under construction
• In 1999, Battery Park City Development Corporation’s revenue reached over 100 million USD
• 30% of total area is developed as attractive space for leisure and cultural activities
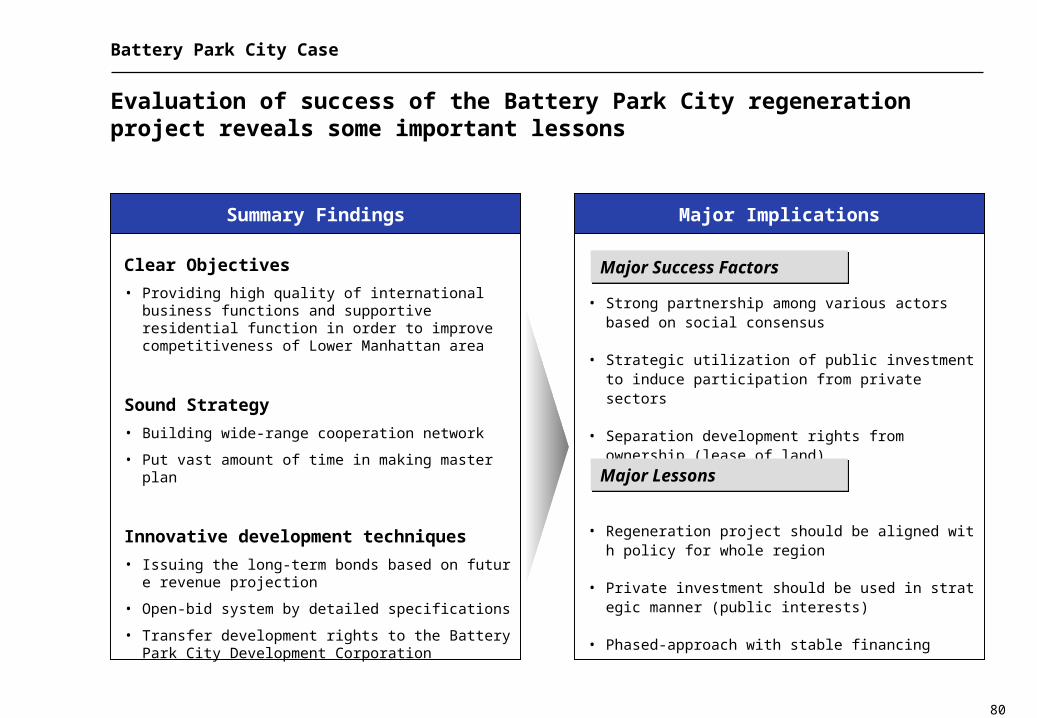
80
Battery Park City Case
Evaluation of success of the Battery Park City regeneration project reveals some important lessons
Clear Objectives
• Providing high quality of international business functions and supportive residential function in order to improve competitiveness of Lower Manhattan area
Sound Strategy
• Building wide-range cooperation network
• Put vast amount of time in making master plan
Innovative development techniques
• Issuing the long-term bonds based on future revenue projection
• Open-bid system by detailed specifications
• Transfer development rights to the Battery Park City Development Corporation
Major ImplicationsSummary Findings
• Strong partnership among various actors based on social consensus
• Strategic utilization of public investment to induce participation from private sectors
• Separation development rights from ownership (lease of land)
• Regeneration project should be aligned with policy for whole region
• Private investment should be used in strategic manner (public interests)
• Phased-approach with stable financing
Major Success FactorsMajor Success Factors
Major LessonsMajor Lessons

81
Session I
Discussion
Related Documents