{ Zebra Stripes By Aaron Jackson and Kristin Emrich

{ Zebra Stripes By Aaron Jackson and Kristin Emrich.
Jan 02, 2016
Welcome message from author
This document is posted to help you gain knowledge. Please leave a comment to let me know what you think about it! Share it to your friends and learn new things together.
Transcript

{Zebra Stripes
By Aaron Jackson and Kristin Emrich

Models the rate of change in the concentration of a gene.
S0 is a concentration of a gene signal g(t) is the concentration of the gene
The idea behind stripes

The third term tells us a lot about the equation.
A simpler version is
The sudden change from y=0 to y=1
The on/off switch
0.
Consider “dimensionless” variables
The result has 2 parameters instead of 5
Simplify the equation
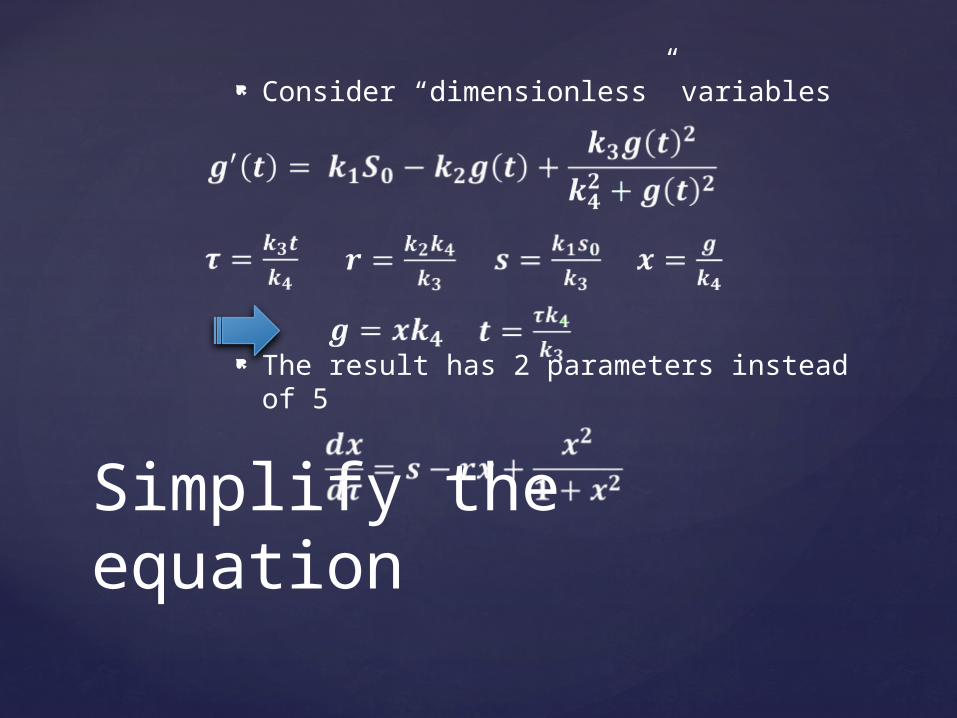
We need fixed points to find bifurcations and a region that is attracting or repelling (this will indicate black or white)
Bifurcation at To graph this we were given the two
equations
Fixed points

a
b

A closer look
a
b
If then
so for , x will decrease
If then
So for , x will increase
Then a is repelling and b is attracting

Given and we must show that
Remember:
True, so graph r and s parametrically to see bifurcation curves
Bifurcation Curves

Graph of bifurcation curve
There are 3 regions Pick coordinates in each region to find
how many fixed points there are
????1
3 1

Relating more to zebra stripes
Find fixed point for
or

• Consider the patch of “zebra skin” from 0 to 4π
• For values approaching b, color the “skin” black; for those approaching 0, color it white
b
a

“Chaos Theory”
Related Documents