November 8, 2016 To: Ann Beegan; [email protected] . RE: DRAFT CAP-AND-TRADE AUCTION PROCEEDS SECOND INVESTMENT PLAN The comments below are from the California Forestry Association (CFA). Calforests has a membership consisting of nearly all the large forest landowners, many family-owned forests of all sizes, most of the 36 remaining sawmills and veneer mills, one shavings mill, and many biomass power plants. Key goals of the association are to create a favorable environment for the forest industry, to ensure a sustainable supply of forest resources from public and private lands, and promote responsible management of our national forests. Draft Second Cap and Trade Investment Plan, Page 1 states – “Cap-and-Trade auction proceeds provide an opportunity for the State to invest in projects that help California achieve its climate goals and provide benefits to disadvantaged communities . . . The purpose of this Draft Second Investment Plan is to identify opportunities for greenhouse gas (GHG) emission reductions, and identify potential State investment priorities to help achieve GHG emission reduction goals, benefit disadvantaged communities, and yield valuable co-benefits.” Comment: Disadvantaged Communities List 1

Welcome message from author
This document is posted to help you gain knowledge. Please leave a comment to let me know what you think about it! Share it to your friends and learn new things together.
Transcript

November 8, 2016To: Ann Beegan; [email protected].
RE: DRAFT CAP-AND-TRADE AUCTION PROCEEDS SECOND INVESTMENT PLAN
The comments below are from the California Forestry Association (CFA). Calforests has a membership consisting of nearly all the large forest landowners, many family-owned forests of all sizes, most of the 36 remaining sawmills and veneer mills, one shavings mill, and many biomass power plants. Key goals of the association are to create a favorable environment for the forest industry, to ensure a sustainable supply of forest resources from public and private lands, and promote responsible management of our national forests.
Draft Second Cap and Trade Investment Plan, Page 1 states –
“Cap-and-Trade auction proceeds provide an opportunity for the State to invest in projects that help California achieve its climate goals and provide benefits to disadvantaged communities . . . The purpose of this Draft Second Investment Plan is to identify opportunities for greenhouse gas (GHG) emission reductions, and identify potential State investment priorities to help achieve GHG emission reduction goals, benefit disadvantaged communities, and yield valuable co-benefits.”
Comment:
Disadvantaged Communities List
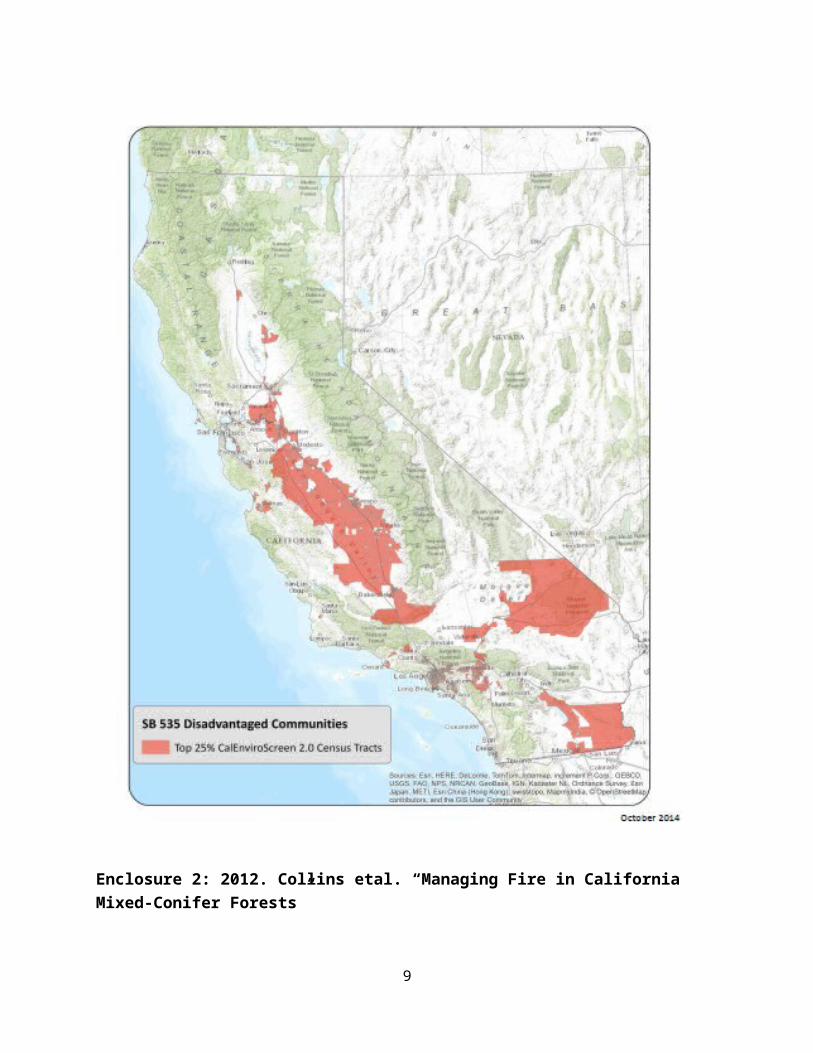
Attachment 1 shows the California map of Disadvantaged Communities. Note that there is not a single community in the foothill or mountainous areas of the Sierra Nevada’s, Southern Cascades, Modoc Plateau, Klamath Mountains, or north Coast Range that made the list.
There are dozens of rural communities in the above mentioned areas that put up with wildfire smoke every year that is well above the EPA thresholds for healthy air. There have been documented instances of wildfire smoke in rural communities that were up to 10 times or more the EPA thresholds that lasted for 87 consecutive days yet none of these communities are shown on the map.
1

Further, literally dozens and dozens and dozens of rural communities in the above mentioned areas have past and current unemployment rates that are substantially higher than the State-wide average. Yet, again, none of these communities are on the Disadvantaged Communities Map. Following is a list of some of the current unemployment rates in rural communities and their unemployment rates when CalEPA determined the list of Disadvantaged Communities from their California Communities Environmental Health Screening Tool:
County Community Unemployment Rate (Sept. 2015)
Unemployment Rate (Oct. 2014)
Alpine County 8.8% 8.3%Amador Jackson 6.6% 8.7%Calaveras Arnold 6.8% 8.7%
Mokelumne Hill 12.9% 16.1%West Point 9.6% 12.1%
El Dorado Placerville 6.5% 8.6%Del Norte Crescent City 10.1% 13.1%
Klamath 14.1% 18.2%
County Community Unemployment Rate (Sept. 2015)
Unemployment Rate (Sept. 2012)
Westwood 10.6% 13.2%Madera Oakhurst 7.4% 9.0%Mendocino Laytonville 14.8% 18.6%
Ukiah 6.9% 8.9%Modoc County 6.7% 8.5%Nevada Penn Valley 13.6% 17.1%Placer Colfax 8.4% 11.0%Plumas Chester 7.5% 9.5%
Greenville 12.0% 14.8%Portola 13.2% 16.5%
Shasta Fall River Mills 8.2% 10.2%Siskiyou Dunsmuir 15.3% 18.0%
McCloud 8.5% 10.1%Weed 7.4% 9.0%Yreka 10.3% 12.3%
Trinity Hayfork 11.6% 15.2%Tuolumne Chinese Camp 28.1% 34.3%
Columbia 11.0% 13.7%MiWuk Village 13.7% 16.9%Soulsbyville 11.1% 13.9%Twain Harte 8.2% 10.3%Mono Vista 12.1% 15.1%
2
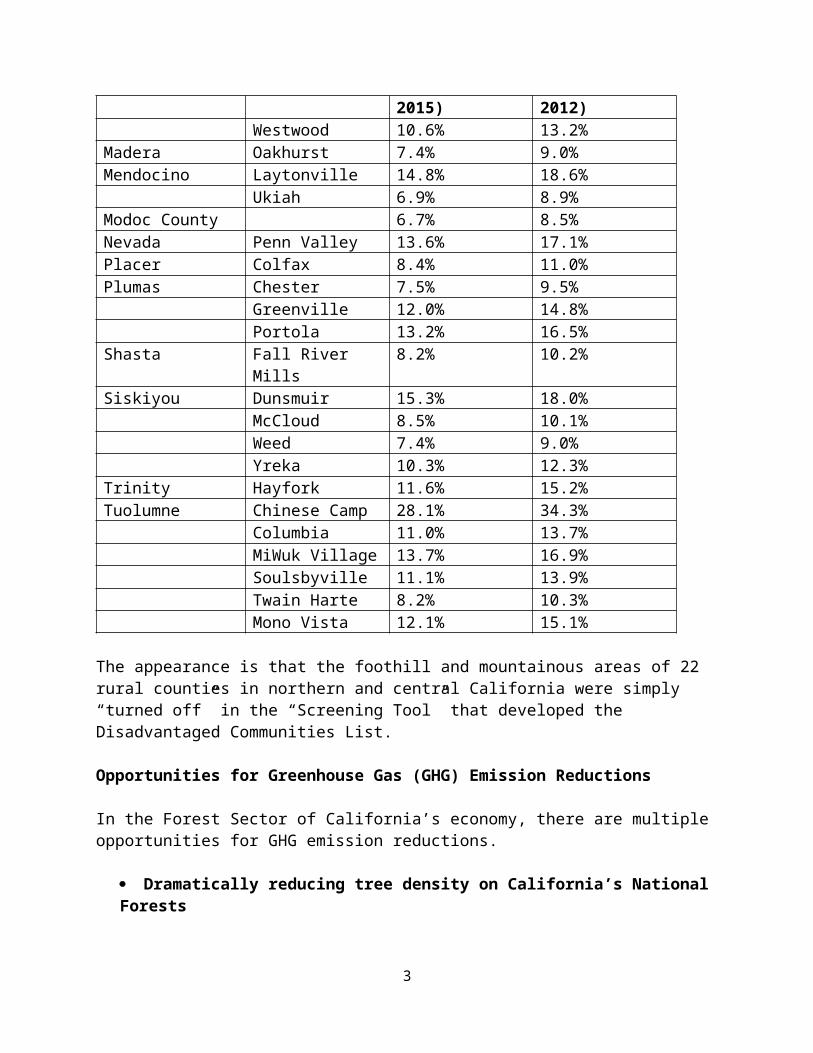
The appearance is that the foothill and mountainous areas of 22 rural counties in northern and central California were simply “turned off” in the “Screening Tool” that developed the Disadvantaged Communities List.
Opportunities for Greenhouse Gas (GHG) Emission Reductions
In the Forest Sector of California’s economy, there are multiple opportunities for GHG emission reductions.
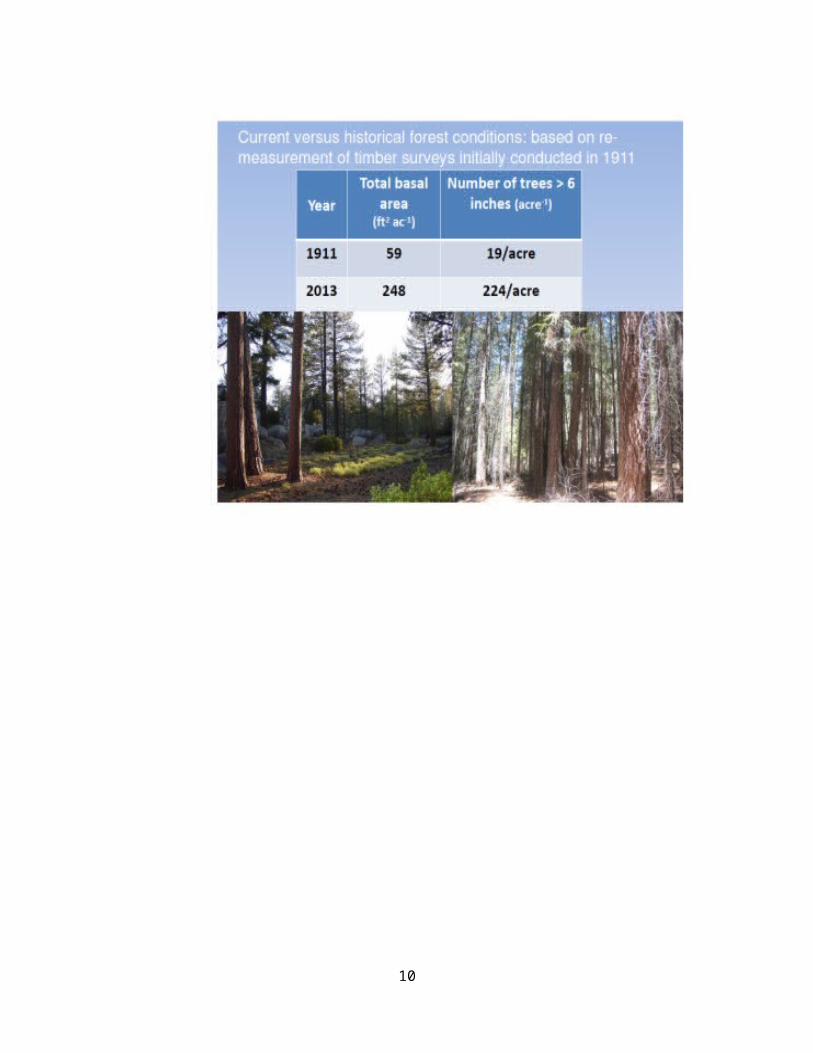
Dramatically reducing tree density on California’s National Forests
California’s National Forests average 224 trees/acre on a landscape historically that had about 19 trees/acre (Attachment 2).
The California Energy Commission sponsored study January 2010, Mark Nechodom, “Biomass to Energy: Forest Management for Wildfire Reduction, Energy Production, and other Benefits” (http://passthrough.fw-notify.net/download/381689/http://www.energy.ca.gov/2009publications/CEC-500-2009-080/CEC-500-2009-080.PDF) is one example that clearly shows substantial gains can be made by aggressively reducing the tree density on California’s National Forests. That study, on a life cycle basis, showed:
22% reduction in the extent of wildfire and significant reductions in fire severity 65% reduction in greenhouse gases (from 17 to 5.9 million tons CO2 equivalent) $246 million savings in wildfire damage $4.6 million reduction in firefighting costs Significant differences in watershed impacts No significant change in habitat quality
(http://www.energy.ca.gov/2009_energypolicy/documents/2009-04-21_workshop/presentations/11_B2E_for_CEC_Biofuels_Conf.pdf)
California’s National Forests are burning on average at the rate of over 304,000 acres/year since 2001 (Attachment #3). Further, and just as important, the percentage of acres burned that are high burn severity (greater than 90% of the vegetation killed) has increased from 21% in 1986 to 31% in 2010 to 38% on the Rim Fire in 2013 to 47% on the King Fire in 2014. Millions of tons of CO2 equivalent, Methane, and Particulate Matter are the result. In fact, ARB has recognized in its Climate Action Plan Update (fall, 2014) that 52% of all Particulate Matter generated statewide annually comes from wildfires.
On average approximately 20 million tons of Carbon Dioxide equivalent is being released into the atmosphere from California wildfires annually.
Consuming Forest Wood Waste in a Biomass Powerplant Boiler Rather Than Open Field Pile Burning or Open Field Decomposition
3
The research has been in since 1979 (Attachment 4) that burning wood waste in a biomass boiler reduces criteria pollutants by 98% compared to open field pile burning. These results have been verified in 2010 and 2015 publications by Bruce Springsteen Placer County Air Pollution Control District. (Sept. 2015, Springsteen etal. “Forest biomass diversion in the Sierra Nevada: Energy, economics and emissions;” October 10, 2011. Springsteen etal. “Emission Reductions from Woody Biomass Waste for Energy as an Alternative to Open Burning”. )
The Biomass Powerplant Industry in California was born in the early 1980’s under then Governor Jerry Brown. The State set a 12 cent/kW-hr price floor to incentivize development of the industry. 66 powerplants were built with an operating capacity of nearly 1000 megawatts (MW). In the early 1990’s the price floor expired and the biomass power plant industry has had to compete for an energy price contract with other renewables. As a result, the industry has been in a decline ever since.
In 1999, Dr. Gregg Morris, in his publication “The Value of Biomass Power” displayed that burning wood waste in a biomass boiler rather than open field pile burning has an 11.4 cent/kW-hr environmental benefit. This finding was verified by the Western Governors Association Biomass Taskforce Report in January 2006.
The decline in the industry has continued to where there are now 24 operating biomass powerplants remaining producing 616 MW. The Governor’s Aug. 22, 2012 bioenergy action plan calls for a doubling of the biomass powerplant industry to about 1,200 MW. The Governor’s Office just took action in the Proclamation of A State of Emergency for Insect, Disease, and Drought October 30, 2015 where the serious tree mortality situation addresses the biomass powerplant industry in the Proclamation Orders #8-13.
Attached to these comments is a separate paper entitled “Forest Wood Residues and the California Biomass Powerplant Industry (VERSION 7)” by Steve Brink, October 4, 2015 (Attachment #5).
The paper outlines in detail the emission reduction advantages and other environmental benefits of reducing tree density on the national forests and incentivizing the biomass powerplant industry again. One example of co-benefits of aggressively thinning California’s National Forests, and thereby reducing the tree density dramatically to return the forests to a resilient condition, is a likely increase of up to 16% in water yield (over 2 million acre-feet annually) (November 2011, Dr. Roger Bales etal. “Forests and Water in the Sierra Nevada: Sierra Nevada Watershed Ecosystem Enhancement Project”.
Governor’s Proclamation of a State of Emergency
“Over 22 million trees are dead and . . . tens of millions more likely to die”. These trees will simply decompose releasing carbon dioxide and methane into the atmosphere unless they are removed and the saw timber that can be utilized from
4
these dead trees for lumber can have the carbon stored in long lived wood products and the biomass used for heat and power at a biomass powerplant.
Helping small landowners remove the dead trees from their property and reestablishing vegetation by planting seedlings is needed.
The Cap and Trade Investment Plan should include minimizing CO2 equivalent emissions from the drought-induced insect and disease tree mortality statewide.
The September 2016 update to the Statewide Implementation Plan will have to address the reduction in the EPA-established Ozone Standard at 70 parts per billion versus the current 75 parts per billion. This could trigger re-opening on-road and off-road diesel engine rules in California. In-State on-road diesel trucks and off-road diesel equipment are not going to be able to respond financially to more rigorous replacement schedules.
The cap-and-trade investment plan should include voucher programs for both on-road diesel trucks and off-road diesel equipment replacements. CFA suggests a 70% of a new truck or piece of equipment price be in the form of a voucher similar to the existing Carl Moyer Truck Improvement/Modernization Benefitting Emission Reductions (TIMBER) Program to replace log trucks. This would greatly expedite replacement of older equipment and thereby allow the State to move quickly toward modernization of trucks and equipment to respond to the new standard.
CFA appreciates the opportunity to comment on the cap-and-trade second investment plan. Questions can be directed to Steve Brink, [email protected]; 916-208-2425.
Sincerely,
STEVEN A. BRINKVice President – Public Resources
Enclosures
5

Enclosure #1: Disadvantaged Communities
Formulated October 2014 from the California Communities Environmental Health Screening Tool in accordance with SB 535
6
Enclosure 2: 2012. Collins etal. “Managing Fire in California Mixed-Conifer Forests”
7

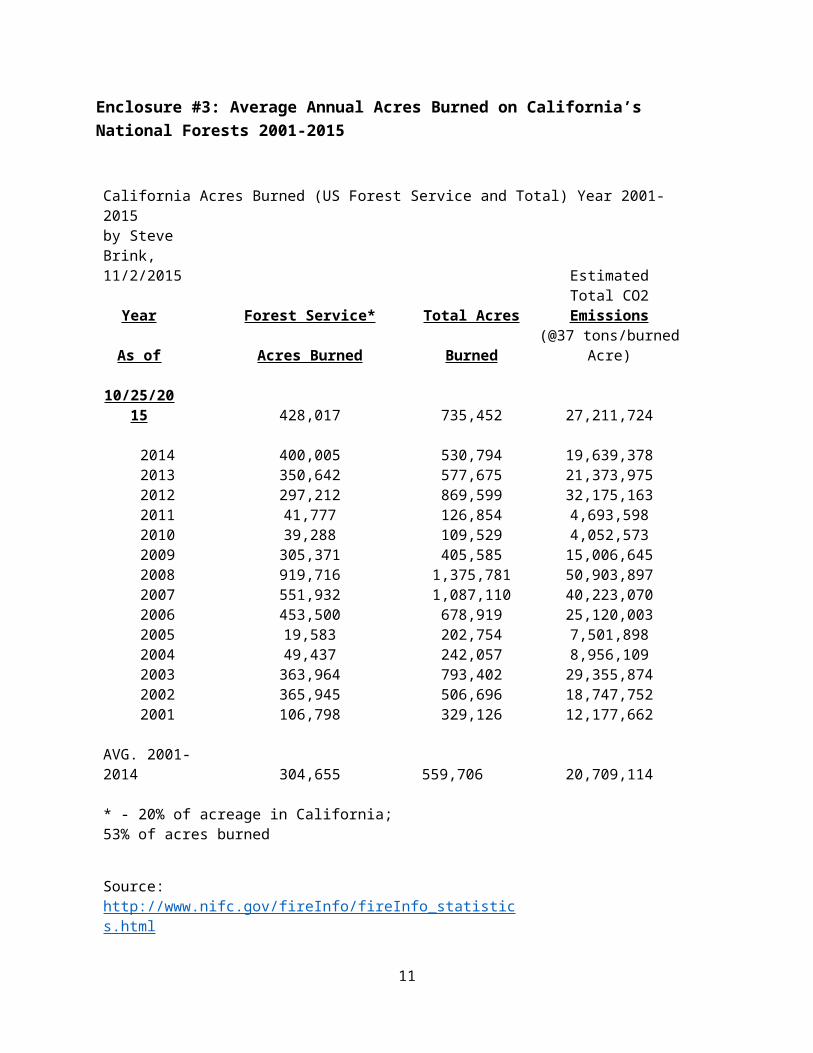
Enclosure #3: Average Annual Acres Burned on California’s National Forests 2001-2015
California Acres Burned (US Forest Service and Total) Year 2001-2015by Steve Brink, 11/2/2015 Estimated
Total CO2Year Forest Service* Total Acres Emissions
As of Acres Burned Burned(@37 tons/burned
Acre)
10/25/2015 428,017 735,452 27,211,724
2014 400,005 530,794 19,639,3782013 350,642 577,675 21,373,9752012 297,212 869,599 32,175,1632011 41,777 126,854 4,693,5982010 39,288 109,529 4,052,5732009 305,371 405,585 15,006,6452008 919,716 1,375,781 50,903,8972007 551,932 1,087,110 40,223,0702006 453,500 678,919 25,120,0032005 19,583 202,754 7,501,8982004 49,437 242,057 8,956,1092003 363,964 793,402 29,355,8742002 365,945 506,696 18,747,7522001 106,798 329,126 12,177,662
AVG. 2001-2014 304,655 559,706 20,709,114
* - 20% of acreage in California; 53% of acres burned
Source: http://www.nifc.gov/fireInfo/fireInfo_statistics.html
8
Enclosure #4:
April 1979. E.F. Darling. Cal/ARB Project A7-068-30, University of California, Riverside. “Hydrocarbons Characterization of Agricultural Waste Burning.”
9
Enclosure #5 -“Forest Wood Residues and the California Biomass Powerplant Industry (VERSION 7)” by Steve Brink, October 4, 2015
October 4, 2015
Forest Wood Residues and the California Biomass Powerplant Industry (VERSION 7)
This paper is divided up into several Chapters:
1.) Executive Summary2.) History of and current situation with California’s Wood-Fired Heat and Power
Industry3.) Social and Environmental Benefits of a Healthy Biomass Powerplant Industry
Reduced risk of large wildfiresCriteria Pollutants
4.) CO2 emissions and black carbon reduction benefits from Active Forest Management and the Wood Residues it produces
5.) Current state of the Vegetation Condition on California’s National Forests
By Steven BrinkVice President- Public Resources
10
California Forestry Association
I. Executive Summary
California’s existing wood-fired heat and power industry is in serious trouble. The industry has gone from 66 operating plants producing 957 megawatts (MW) down to the current level of 21 operating plants and about 616 MW. Closures will continue as energy price contracts expire unless the environmental benefits are recognized in the energy price.
California’s 2012 Bioenergy Action Plan calls for actions that will reduce the economic and regulatory barriers such that the wood-fired heat and power industry will expand to about 1,200 MW of operating capacity.
There are three major hurdles to implement California’s 2012 Bioenergy Action Plan:
1.) Recognizing and implementing policies that will compensate about ½ of the 11 cents/kW of uncompensated ancillary benefits associated with wood-fired heat and power (which would be additive to the current offering of about 3.5 cents/kW to match the cost of natural gas). Hence the total energy price would around 9 cents/kW.
2.) Recognizing biogenic boiler emissions are different than fossil emissions
3.) Avoiding and reversing any policies that lead to reduced forest harvest levels.
Other benefits to actively managing California’s National Forests and implementing the 2012 Biomass Energy Action Plan could include but not be limited to:
1) 22% reduction in burned acres from wildfires and a drop in burn severity;
2) a 65% reduction (11 million tons CO2equivalent) in net CO2 emissions and a 17,265 ton annual reduction in black carbon, including emissions associated with utilization of forest residues for biomass heat and power on a 2.7 million acre landscape that was modeled for 1.97 million acres of vegetation treatments over a 40 year time horizon;
3) 2 million acre-feet more water yield annually, and
4) Recognition that utilizing wood residues for biomass heat and power in lieu of open burning and/or decomposition can provide an 85-100% reduction in criteria pollutants.
For Benefit #1 and #2 above, without a major change in vegetation management direction on California’s National Forests, the national forests will continue to get denser and denser and denser leading to larger and more severe wildfires and more
11

insect and disease damage. With active management, returning the forest to a resilient condition could result in a significant net emission reduction from active forest land management on California’s National Forests and non-industrial private forest lands.
For Benefit #3, for scale 2 million acre-feet is about ½ of the total annual surface water request from crop agriculture in the San Joaquin Valley
For Benefit #4 – There is a 17% reduction in criteria pollutants and a 96% reduction in Particulate Matter from burning wood residue in a biomass powerplant boiler versus open pile burning. These measurements were published in 1999 by Dr. Gregg Morris’ “Value of Biomass Power” and verified in a 2010 study by Bruce Springsteen etal “Emission Reductions from Woody Biomass Waste for Energy as an Alternative to Open Burning”. Bruce Springsteen etal have again verified similar outcomes in a new study 2015. Springsteen etal. “Forest biomass diversion in the Sierra Nevada: Energy, economics, and emissions.”
The reduced criteria pollutants with the current 600 MW operating capacity of the Biomass Powerplant industry is annually about 17% (1.8 million tons of CO2e) and 96% (28,000 tons) of particulate matter. If the 2012 Bioenergy Action Plan were fully implemented increasing the operating capacity to 1,200 MW, the values of reduced criteria pollutants would double. Through the cap-and-trade offsets program, CO2e is selling for about $11/ton. Particulate Matter was estimated to have a $2,500/ton value in 1999; today the Carl Moyer Program incentives put the equivalent value at up to $16,000/ton.
12

II. History of and current situation with California’s Wood-Fired Heat and Power Industry
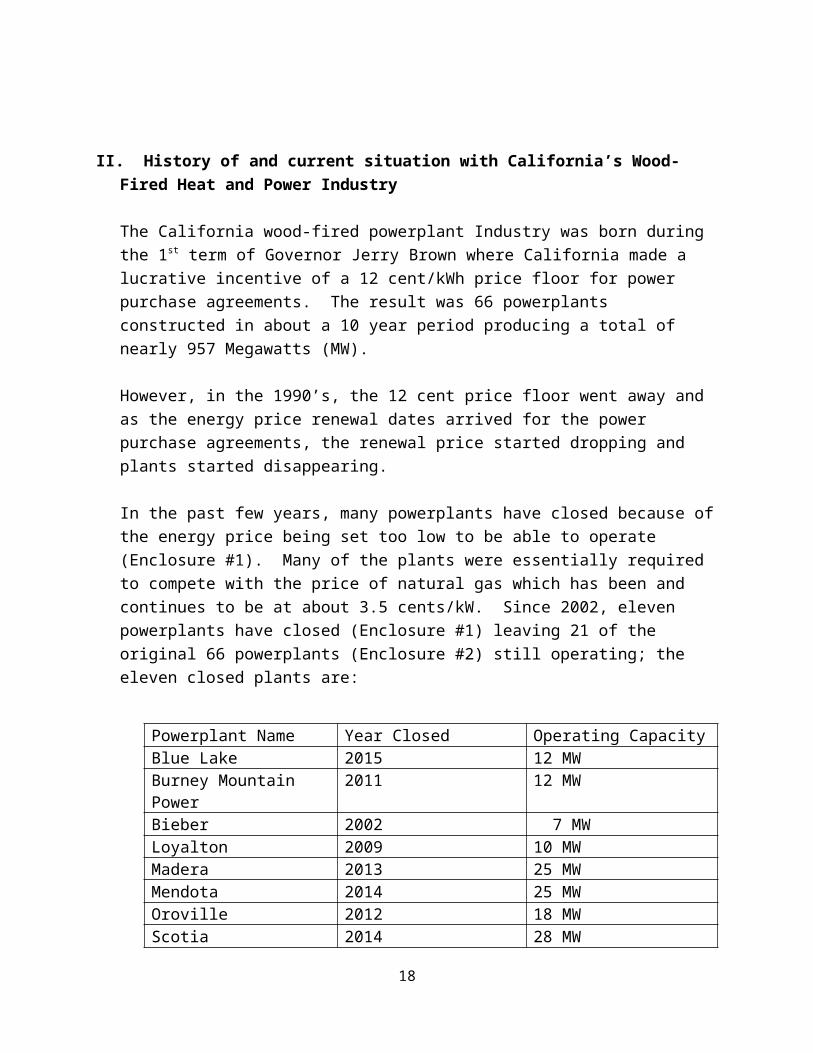
The California wood-fired powerplant Industry was born during the 1st term of Governor Jerry Brown where California made a lucrative incentive of a 12 cent/kWh price floor for power purchase agreements. The result was 66 powerplants constructed in about a 10 year period producing a total of nearly 957 Megawatts (MW).
However, in the 1990’s, the 12 cent price floor went away and as the energy price renewal dates arrived for the power purchase agreements, the renewal price started dropping and plants started disappearing.
In the past few years, many powerplants have closed because of the energy price being set too low to be able to operate (Enclosure #1). Many of the plants were essentially required to compete with the price of natural gas which has been and continues to be at about 3.5 cents/kW. Since 2002, eleven powerplants have closed (Enclosure #1) leaving 21 of the original 66 powerplants (Enclosure #2) still operating; the eleven closed plants are:
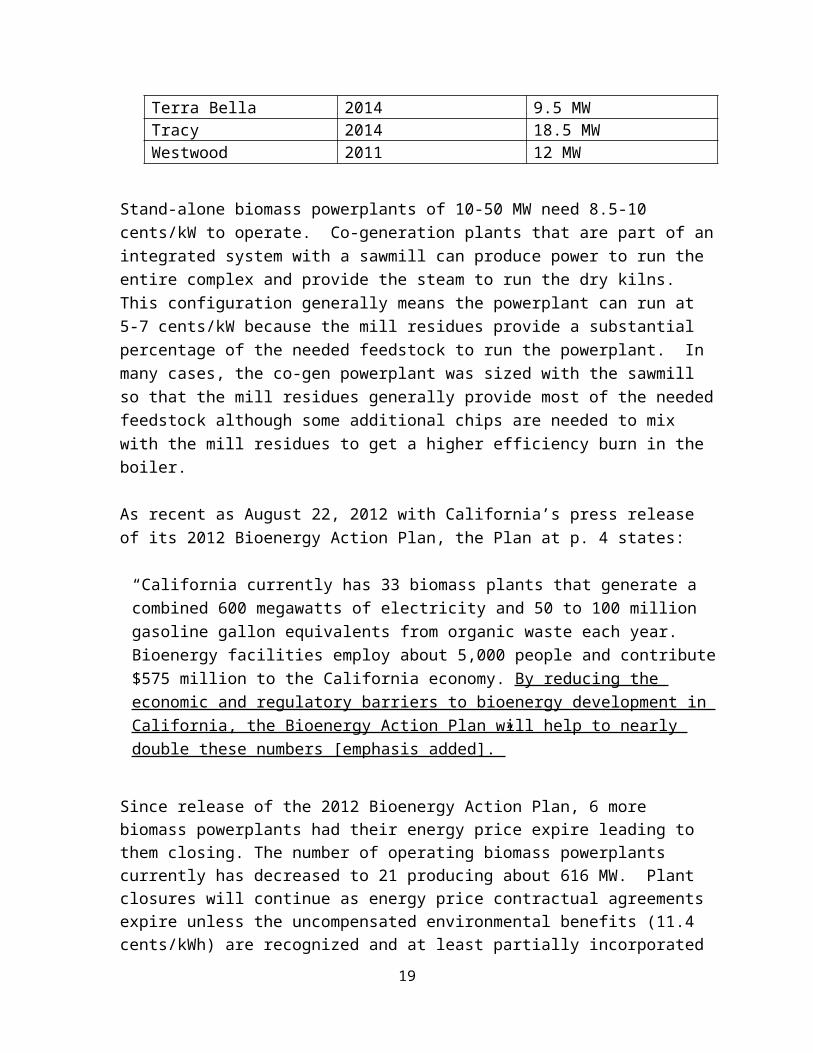
Powerplant Name Year Closed Operating CapacityBlue Lake 2015 12 MWBurney Mountain Power 2011 12 MWBieber 2002 7 MWLoyalton 2009 10 MWMadera 2013 25 MWMendota 2014 25 MWOroville 2012 18 MWScotia 2014 28 MWTerra Bella 2014 9.5 MWTracy 2014 18.5 MWWestwood 2011 12 MW
Stand-alone biomass powerplants of 10-50 MW need 8.5-10 cents/kW to operate. Co-generation plants that are part of an integrated system with a sawmill can produce power to run the entire complex and provide the steam to run the dry kilns. This configuration generally means the powerplant can run at 5-7 cents/kW because the mill residues provide a substantial percentage of the needed feedstock to run the powerplant. In many cases, the co-gen powerplant was sized with the sawmill so that the mill residues generally provide most of the needed feedstock although some
13

additional chips are needed to mix with the mill residues to get a higher efficiency burn in the boiler.
As recent as August 22, 2012 with California’s press release of its 2012 Bioenergy Action Plan, the Plan at p. 4 states:
“California currently has 33 biomass plants that generate a combined 600 megawatts of electricity and 50 to 100 million gasoline gallon equivalents from organic waste each year. Bioenergy facilities employ about 5,000 people and contribute $575 million to the California economy. By reducing the economic and regulatory barriers to bioenergy development in California, the Bioenergy Action Plan will help to nearly double these numbers [emphasis added].”
Since release of the 2012 Bioenergy Action Plan, 6 more biomass powerplants had their energy price expire leading to them closing. The number of operating biomass powerplants currently has decreased to 21 producing about 616 MW. Plant closures will continue as energy price contractual agreements expire unless the uncompensated environmental benefits (11.4 cents/kWh) are recognized and at least partially incorporated in the energy price. Recognition that utilizing wood residues for biomass heat and power in lieu of open burning and/or decomposition can provide an 85-100% reduction in criteria pollutants.
Doubling the operating biomass operating capacity to about 1,200 MW would increase total employment by 4.9 total jobs per megawatt (nearly 3,000 jobs). It would utilize an additional 4.8 million bone dry tons of urban, agriculture, and forest woody residues (historically about 40% forest, 30% urban, 30% agriculture) (2012 Bioenergy Action Plan, p. 12). Utilization of an additional 2 million bone dry tons of forest residues (separate from mill residues) would nearly equate to 100% utilization and virtual elimination of open field burning and/or in-the-woods decomposition.
Without recognition of the uncompensated 11.4 cent/kWh environmental benefit for wood-fired heat and power, it will continue to lead to the remaining powerplants competing with essentially the price of natural gas (about 3.5 cents/kW). The result will be a continuing reduction in the remaining operating powerplants as their current energy price contract expires.
As will be shown in the next Chapter, it’s been known for the past 15 years that there is an uncompensated ancillary 11.4 cent/kWh environmental benefit of utilizing wood residue burned in a controlled combustion boiler for heat and power in lieu of open field burning and/or in-the-forest decomposition.
To implement the 2012 State Bioenergy Action Plan for biomass, at least ½ of the ancillary benefits would have to be added to the price of natural gas (about 3.5 cents/kW) putting biomass powerplants up to generally around 9 cents/kW. For
14

powerplants less than 10 MW operating capacity, the price would have to be higher. SB1122 powerplants (less than 3 MW) have a PUC regulatory procedure that could lead to a 12.77 cent/kWh price floor for those plants.
A 5.5 cent/kW increase in energy price for the remaining biomass powerplants would equate to about $32 million. If incentives were such that the industry doubled in operating capacity, the total cost would be about $65 million.
15

III. Social and Environmental Benefits of a Healthy Biomass Powerplant Industry
Criteria Pollutants
The 11.4 cent/kW uncompensated ancillary benefits of biomass energy production are well established and discussed in detail in the Western Governors Association 2006 Biomass Taskforce Report (www.westgov.org) and the 1999 Value of Biomass Power report by Dr. Gregg Morris. These two reports display and discuss the value of the Benefits:
Criteria Pollutants - 4.3 cents/kilowatt Reduction in Greenhouse Gas Emissions - 5.9 cents/kilowatt Avoided Landfill - 1.1 cents/kilowatt Timber Stand Improvement - 0.1 cents/kilowatt
Some of the more obvious benefits are that all 3 forms of wood residue, urban, forest and agriculture, will produce substantial amounts of methane (25 times more potent as a GHG than CO2) if left to open burning or above ground decomposition. And, if the residues are open-burned, they emit unburned hydrocarbons and Particulate Matter that dramatically increase impacts relative to controlled combustion in a biomass boiler.”
The State’s Renewables Energy Portfolio Standard (RPS) makes no clear differentiation or preference currently between base load and intermittent power and places almost complete emphasis on “low price” wins.
California currently has no mechanism to address the non-electric environmental and social benefits provided by the biomass industry.
As reported by Lippke etal (CORRIM.org), “life cycle carbon accounting exposes many unintended policy impacts such as:
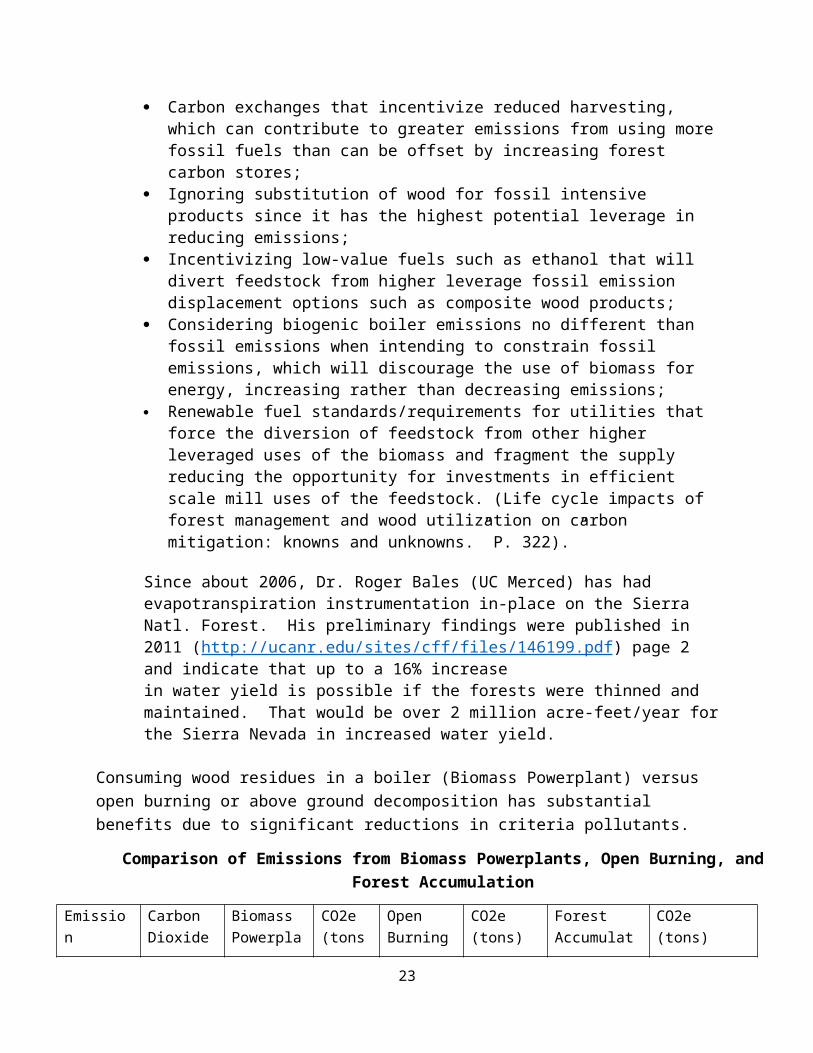
Carbon exchanges that incentivize reduced harvesting, which can contribute to greater emissions from using more fossil fuels than can be offset by increasing forest carbon stores;
Ignoring substitution of wood for fossil intensive products since it has the highest potential leverage in reducing emissions;
Incentivizing low-value fuels such as ethanol that will divert feedstock from higher leverage fossil emission displacement options such as composite wood products;
Considering biogenic boiler emissions no different than fossil emissions when intending to constrain fossil emissions, which will discourage the use of biomass for energy, increasing rather than decreasing emissions;
Renewable fuel standards/requirements for utilities that force the diversion of feedstock from other higher leveraged uses of the biomass and fragment the
16
supply reducing the opportunity for investments in efficient scale mill uses of the feedstock. (Life cycle impacts of forest management and wood utilization on carbon mitigation: knowns and unknowns.” P. 322).”
Since about 2006, Dr. Roger Bales (UC Merced) has had evapotranspiration instrumentation in-place on the Sierra Natl. Forest. His preliminary findings were published in 2011 (http://ucanr.edu/sites/cff/files/146199.pdf) page 2 and indicate that up to a 16% increase in water yield is possible if the forests were thinned and maintained. That would be over 2 million acre-feet/year for the Sierra Nevada in increased water yield.
Consuming wood residues in a boiler (Biomass Powerplant) versus open burning or above ground decomposition has substantial benefits due to significant reductions in criteria pollutants.
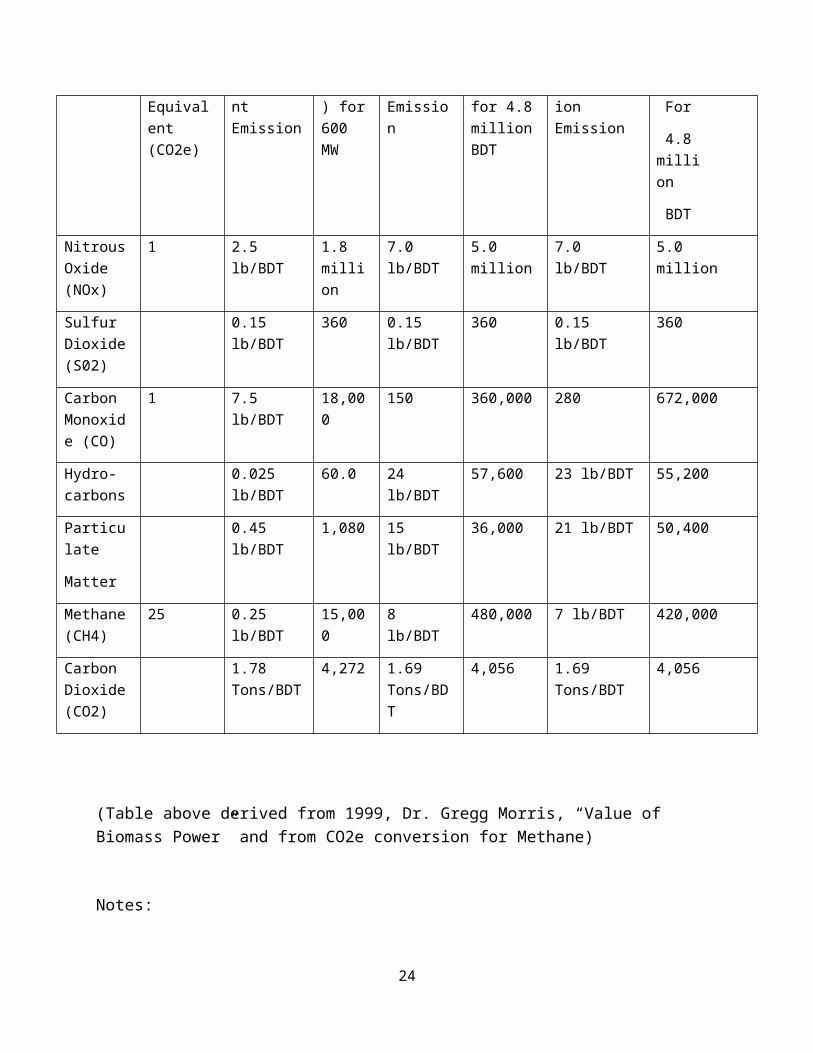
Comparison of Emissions from Biomass Powerplants, Open Burning, and Forest Accumulation
Emission Carbon Dioxide Equivalent (CO2e)
Biomass Powerplant Emission
CO2e (tons) for 600 MW
Open Burning Emission
CO2e (tons) for 4.8 million BDT
Forest Accumulation Emission
CO2e (tons)
For
4.8 million
BDT
Nitrous Oxide (NOx)
1 2.5 lb/BDT 1.8 million
7.0 lb/BDT 5.0 million 7.0 lb/BDT 5.0 million
Sulfur Dioxide (S02)
0.15 lb/BDT
360 0.15 lb/BDT
360 0.15 lb/BDT 360
Carbon Monoxide (CO)
1 7.5 lb/BDT 18,000 150 360,000 280 672,000
Hydro-carbons
0.025 lb/BDT
60.0 24 lb/BDT 57,600 23 lb/BDT 55,200
Particulate
Matter
0.45 lb/BDT
1,080 15 lb/BDT 36,000 21 lb/BDT 50,400
Methane (CH4)
25 0.25 lb/BDT
15,000 8 lb/BDT 480,000 7 lb/BDT 420,000
17
Carbon Dioxide (CO2)
1.78 Tons/BDT
4,272 1.69 Tons/BDT
4,056 1.69 Tons/BDT
4,056
(Table above derived from 1999, Dr. Gregg Morris, “Value of Biomass Power” and from CO2e conversion for Methane)
Notes:
1) 8,000 bone dry tons of wood residue produces 1 megawatt of electricity (MW)2) Hydrocarbons, Particulate Matter, and Methane are the primary differences in the 3
Alternative Scenarios3) Methane is 25 times more potent as a Greenhouse Gas compared to Carbon Dioxide4) Current 600 MW operating capacity in the industry consumes 4.8 million bone dry
tons of wood residue annually5) A 1,200 MW operating capacity would consume 9.6 million bone dry tons of wood
residue annually6) Current market value for CO2e on ARB Cap-and-Trade Offsets Program is $11/ton7) Estimate for value of Particulate Matter (PM) from Morris (1999, p.21) is
$2,500/ton although, based on the incentives in the Carl Moyer Program, the State has put a much higher value than this on PM
Synthesis of the above Table:
For the current 600 MW Operating Capacity, Biomass Powerplants, versus Open Burning or “left in the forest to decompose” scenarios, the Powerplant Industry annually reduces Carbon Dioxide equivalent by about 0.4 million tons (Methane) and reduces Particulate Matter by over 35,000 tons.
These reductions would be about double if the 2012 Bioenergy Action Plan was fully implemented with a Biomass Powerplant 1,200 MW operating capacity.
Note with the current ARB Cap-And-Trade Offset Market at about $11/ton, 0.4 million tons of CO2e is worth about $4.4 million; at $2,500/ton the Particulate Matter reduction is worth about $88 million.
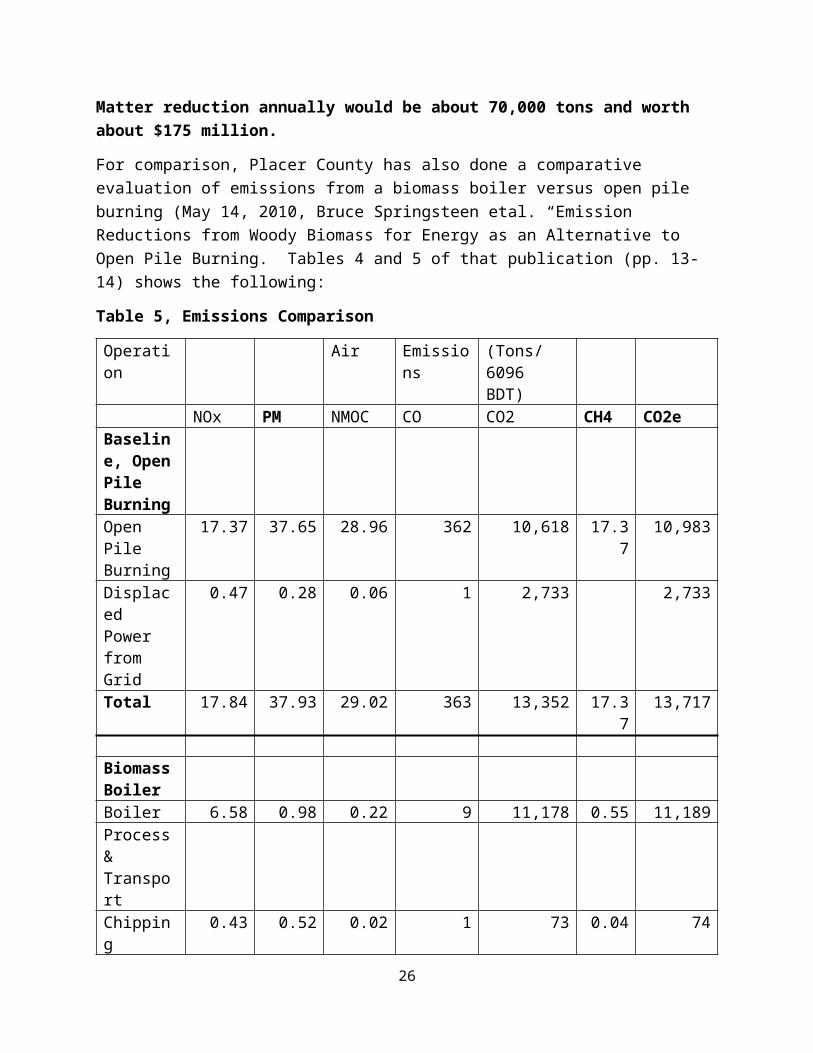
If the Biomass Power Industry doubled to about 1,200 MW of operating capacity, as called for in the 2012 Bioenergy Action Plan, there would be annually about 0.8 million tons of methane reduction in CO2e and be worth about $8.8 million; Particulate Matter reduction annually would be about 70,000 tons and worth about $175 million.
18
For comparison, Placer County has also done a comparative evaluation of emissions from a biomass boiler versus open pile burning (May 14, 2010, Bruce Springsteen etal. “Emission Reductions from Woody Biomass for Energy as an Alternative to Open Pile Burning. Tables 4 and 5 of that publication (pp. 13-14) shows the following:
Table 5, Emissions Comparison
Operation Air Emissions (Tons/6096 BDT)
NOx PM NMOC CO CO2 CH4 CO2eBaseline, Open Pile BurningOpen Pile Burning
17.37 37.65 28.96 362 10,618 17.37 10,983
Displaced Power from Grid
0.47 0.28 0.06 1 2,733 2,733
Total 17.84 37.93 29.02 363 13,352 17.37 13,717
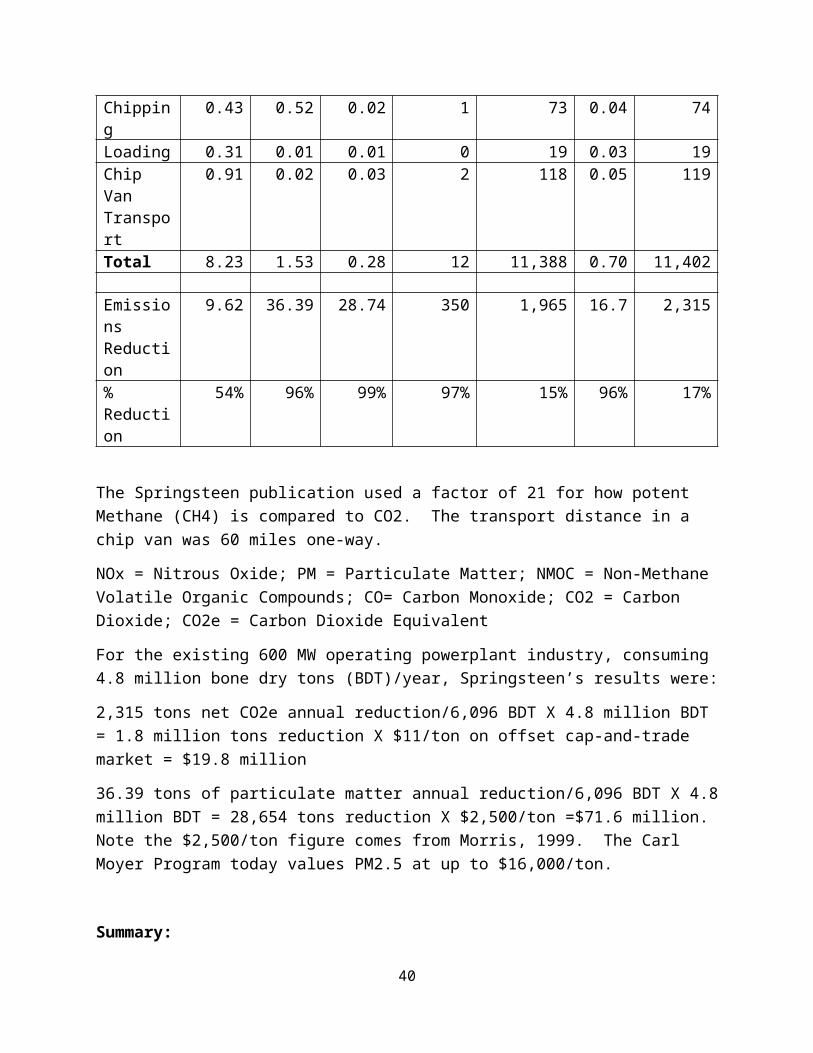
Biomass BoilerBoiler 6.58 0.98 0.22 9 11,178 0.55 11,189Process & TransportChipping 0.43 0.52 0.02 1 73 0.04 74Loading 0.31 0.01 0.01 0 19 0.03 19Chip Van Transport
0.91 0.02 0.03 2 118 0.05 119
Total 8.23 1.53 0.28 12 11,388 0.70 11,402
Emissions Reduction
9.62 36.39 28.74 350 1,965 16.7 2,315
% Reduction
54% 96% 99% 97% 15% 96% 17%
The Springsteen publication used a factor of 21 for how potent Methane (CH4) is compared to CO2. The transport distance in a chip van was 60 miles one-way.
NOx = Nitrous Oxide; PM = Particulate Matter; NMOC = Non-Methane Volatile Organic Compounds; CO= Carbon Monoxide; CO2 = Carbon Dioxide; CO2e = Carbon Dioxide Equivalent
For the existing 600 MW operating powerplant industry, consuming 4.8 million bone dry tons (BDT)/year:
19

16.7 tons CO2e/6,096 BDT X 4.8 million BDT = 1.8 million tons CO2e reduction X $11/ton on offset cap-and-trade market = $19.8 million
36.39 tons of particulate matter reduction/6,096 BDT X 4.8 million BDT = 28,654 tons reduction X $2,500/ton =$71.6 million. Note the $2,500/ton figure comes from Morris, 1999. The Carl Moyer Program today values PM2.5 at up to $16,000/ton.
Summary:
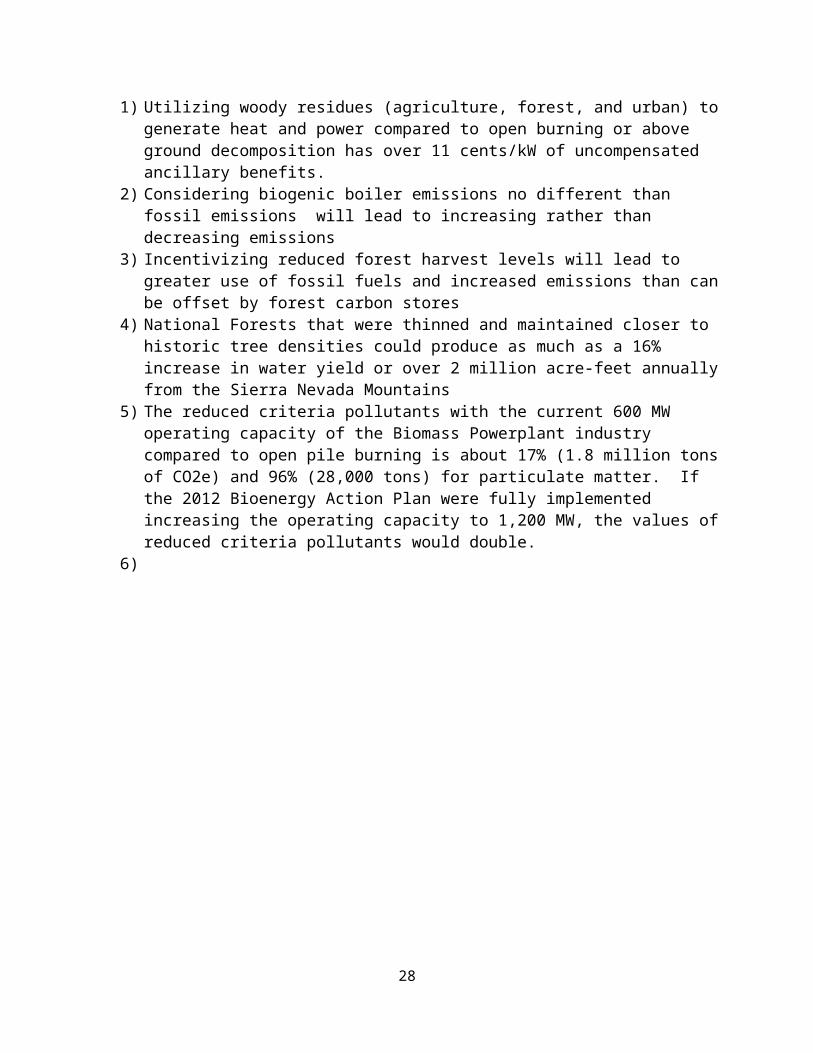
1) Utilizing woody residues (agriculture, forest, and urban) to generate heat and power compared to open burning or above ground decomposition has over 11 cents/kW of uncompensated ancillary benefits.
2) Considering biogenic boiler emissions no different than fossil emissions will lead to increasing rather than decreasing emissions
3) Incentivizing reduced forest harvest levels will lead to greater use of fossil fuels and increased emissions than can be offset by forest carbon stores
4) National Forests that were thinned and maintained closer to historic tree densities could produce as much as a 16% increase in water yield or over 2 million acre-feet annually from the Sierra Nevada Mountains
5) The reduced criteria pollutants with the current 600 MW operating capacity of the Biomass Powerplant industry compared to open pile burning is about 17% (1.8 million tons of CO2e) and 96% (28,000 tons) for particulate matter. If the 2012 Bioenergy Action Plan were fully implemented increasing the operating capacity to 1,200 MW, the values of reduced criteria pollutants would double.
6)
20

IV. CO2 emissions and black carbon reduction benefits from Active Forest Management and the Wood Residues it produces
Sequestration of CO2 from California’s National Forests
In the past 20 years, 1.3 million acres of the forestland on the national forests of the Sierra Nevada’s has burned; the Forest Service predicts another 1.2 million acres will burn in the next 20 years; a total of about ¼ of the entire public forest land in the Sierra’s. The trend in acres burned due to wildfire is such that in about 50 years, all of the productive forest land on California’s National Forests will have been subjected to a wildfire.
The California Energy Commission (CEC) greenhouse gas emissions inventory for California shows that forestry is the only “net carbon sink” in the entire inventory, i.e., holds tremendous opportunity to assist the State in CO2e emission level reductions.
Based on a 10-year average, Wildfires in California emit 1.2 million tons of GHG emissions annually (CARB, 2005 Almanac, Wildfire Emissions, Appendix E). In 2005, Winrock International estimated emissions from wildfires in California at 1.5 million tons.
Since then, we’ve had megafires including but not limited to the Rim Fire (Stanislaus National Forest and Yosemite National Park, 2013), which burned 257,000 acres and is estimated by the Sierra Nevada Conservancy that the wildfire caused an emission of 11.3 million GHG tons (http://www.sierranevada.ca.gov/our-region/rim-fire/rimairqualityfacts.pdf). In 2014, the King Fire on the Eldorado National Forest burned 97,000 acres and cumulatively about 200,000 acres burned in wildfires on the Happy Camp Complex (Klamath Natl. Forest), Bald and Eiler Fires (Lassen Natl. Forest), French Fire (Sierra Natl. Forest and Coffee Fire (Shasta-Trinity Natl. Forest). So far in 2015, over 188,000 acres on the Six Rivers National Forest, 100,000 acres on the Shasta-Trinity National Forest, and 150,000 acres on the Sierra/Sequoia National Forests have burned. On average 2001-2014, wildfires have burned 305,000 acres/year of California’s National Forests. The number will be higher in 2015 thus raising the 15 year average.
Carbon sequestration is about 12 tons/acre higher for an actively managed forest versus the current situation on California’s National Forests of 8.3 million acres of suitable and available productive forest land, where only about 7% of annual growth is being removed. So the National Forests continue to get denser and denser and denser and the number, size and severity of wildfires gets higher and higher as well as the occurrence of insect and disease damage. There’s some indication that some of California’s National Forests are now net emitters rather than net sinks. California’s National Forests if actively managed, on the 8.3 million acres, have the potential opportunity of annual net sequestration of about 13 million tons of CO2equivalent; a substantial contribution to California’s net emission reduction.
21

Black Carbon
ARB estimated that in 2010 (2010 Update to the Climate Change Scoping Plan, p. 21) 52% of annual black carbon emissions from California come from wildfires. The percentage is likely higher now. ARB estimated in its 2009 ARB Almanac that on average wildfires emitted 215 tons/day of black carbon). In comparison, all the black carbon from diesel exhaust in California is estimated to product less than 50 tons/day.
Only about 20% of the carbon in the high severity burned acres is actually consumed by the fire and emitted to the atmosphere. The remaining 80% of carbon is in dead material still on the landscape. It remains to be seen how much of the dead material from these large wildfires will be removed and how many acres will be restored to a forested condition or will be left to type convert to brushfields. The acres of dead material that is not removed will decay over the next 20 years and will release the remaining carbon in the form of CO2 and methane.
Unfortunately on wildfire-burned landscapes on California’s National Forests, Areas burning at high severity often grow back as montane chaparral rather than forest and are likely to reburn with high severity in future fires (Thompson and Spies, 2010; VanWagtendonk et al., 2012; Parks et al., 2013).
Benefits
What Would Be The Outcome, on California’s National Forests, of Active Forest Management On 8.3 Million Acres Of Available Productive Forest Land Not Reserved and the 4.6 million acres of non-industrial private land?
This research question was, in part, addressed by Mark Nechodom in a CEC sponsored study in Northern California (California Energy Commission Study (CEC-500-2009-080), January 2010; “Biomass to Energy: Forest Management for Wildfire Reduction, Energy Production, and Other Benefits”. It can be found at: http://passthrough.fw-notify.net/download/762289/http://www.energy.ca.gov/2009publications/CEC-500-2009-080/CEC-500-2009-080.PDF
The Explicit Purpose of the Research was to:
Model life cycle environmental & economic values of using forest biomass for energy production
Test effects of different forest management scenarios on wildfire behavior, total emissions and other environmental factors
Develop a decision-support framework to test policy scenarios
Some of the features of the Study were:
Used actual landscapes and land uses, mapped to a real region
22
Used actual data from biomass powerplants, operations and professional experience
Built a reference case and a test scenario based on real-time practices Delivered a modeling framework for further scenario development
The outcomes of the research shows:
22% reduction in the extent of wildfire and significant reductions in fire severity
65% reduction in greenhouse gases (from 17 to 5.9 million tons CO2 equivalent on a 2.7 million acre landscape that modeled vegetation treatment on 1.97 million acres)
$246 million savings in wildfire damage
$4.6 million reduction in firefighting costs
Significant differences in watershed impacts
No significant change in habitat quality from treatments
Life-cycle “savings” of 120 Terawatt-hours in fossil fuel generation by using biomass for power
$1.58 billion in power generation revenues
Extrapolating these outcomes to the 8.3 million acres of suitable productive forest land for active management on California’s National Forests, the 4.4 million acres of industrial productive forest land, and the 4.6 million acres of productive forest land on non-industrial private forest lands is difficult. Arguably the industrial forest lands are being actively managed. It’s the Forest Service and non-industrial private that is where most of the benefits would come from. The Nechodom 1.97 million acres of treatment in his study area was about 15% of the Forest Service and non-industrial private productive forest lands. A rough calculation would be to extrapolate a 6.7 times increase in benefits. That calculation yields about a 1.9 million ton per year net reduction in CO2e.
In addition, U.S. Fish and Wildlife Service has pointed out that the biggest risk to wildlife in California is catastrophic wildfire (Steve Thompson, USFWS, June 9, 2006 editorial in the Redding Searchlight). CA Dept. of Fish and Wildlife has also identified 12 bird species as having significant negative population trends because of Sierra Nevada forests becoming denser.
23
The issue of biomass and carbon neutrality
Often there is no differentiation between biogenic carbon (carbon that can be replaced by planting a tree) and anthropogenic carbon (e.g. fossil fuels). Yet whenever one bone dry ton of wood residue is used to generate heat and power, it is known that it provides a 0.4 tons of natural gas offset.
The net impact of the forest carbon cycle is that CO2 flows in and out of forests. The carbon in biomass will return to the atmosphere whether it is combusted in a boiler, open-burned, left to decompose on the forest floor, or burned in a wildfire. Overall, the flow is carbon-positive when forests are sustainably managed. Nationwide, over the past 50 years, there has been a net increase in forest carbon stocks. And even though overall forests are carbon sinks, even if some were carbon emitters, they still should be treated as carbon neutral because if they are left to decay, they will release substantial amounts of methane, which is far more potent as a greenhouse gas than CO2 (AF&PA CEO, Donna Harman).
Net Emissions from California’s Biomass Powerplants versus The Alternatives
Net emissions of conventional air pollutants associated with the disposal of biomass are typically reduced by 85-100 percent compared to other alternatives. Biomass to Energy projects reduce GHG emissions through: 1) avoiding criteria pollutants such as methane and nitrous oxide, which occur during disposal of biomass through open burning and/or decay and decomposition, and 2) producing renewable energy that displaces GHG emissions from fossil fuel combustion needed for an equivalent energy supply.
“During the past five years, over 4.5 million acres of California forests have been impacted by wildfire. Costs to suppress these wildfires have averaged approximately $1.2 billion per year. Many predict increasing size and severity of fires unless increased forest restoration treatments are implemented. These treatments will involve, in part, removing the excess biomass ‘fuel’ built up in the forests, which reduces the severity and scale of wildfires.
In this context, forest biomass consists of small-diameter woody material damaged or low-valued trees, the branches (slash) and diseased or insect infested wood, not suitable for other commercial use. This material represents a huge untapped resource for the generation of heat and power and its removal will improve forest health and reduce the risk of catastrophic wildfire. Additionally, use of biomass materials to generate energy is another way to maximize the greenhouse gas reduction benefits the forest sector can provide. Burning the biomass in a controlled biomass facility instead of open burning can reduce emissions of criteria pollutants by 85-100%.
24

Emission factors from “Hydrocarbon Characterization of Agricultural Waste Burning”, CAL/ARB Project A7-068-30, University of California, Riverside, E.F. Darley, April 1979.
Even when accounting for the emissions created by the transport and processing of biomass to create energy, the numbers only change slightly:
25
(Graph Below Provided by: Placer County Air Pollution Control District)”
(Excerpt from Sierra Nevada Conservancy website at: http://www.sierranevada.ca.gov/our-region/bioenergy.
Comparison of Emissions from Biomass Powerplants, Open Burning, and Forest Accumulation
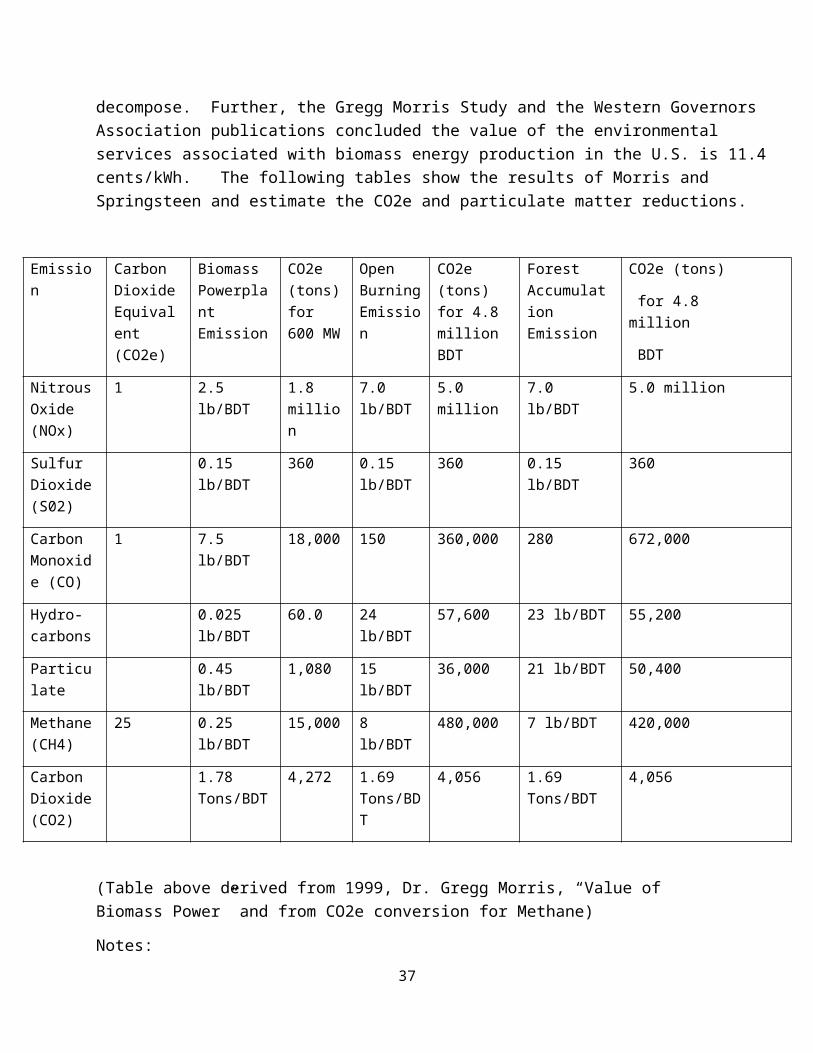
Five studies, 1979, E.F. Farley, 1999 Dr. Gregg Morris, 2006, Western Governors Association Biomass Taskforce Report, and the 2010 and 2015 Bruce Springsteen etal studies have addressed the question of criteria pollutant reductions and particulate matter reductions comparing biomass powerplant boilers, open pile burning, and wood residues left to decompose. Further, the Gregg Morris Study and the Western Governors Association publications concluded the value of the environmental services associated with biomass energy production in the U.S. is 11.4 cents/kWh. The following tables show the results of Morris and Springsteen and estimate the CO2e and particulate matter reductions.
26

Emission Carbon Dioxide Equivalent (CO2e)
Biomass Powerplant Emission
CO2e (tons) for 600 MW
Open Burning Emission
CO2e (tons) for 4.8 million BDT
Forest Accumulation Emission
CO2e (tons)
for 4.8 million
BDT
Nitrous Oxide (NOx)
1 2.5 lb/BDT 1.8 million
7.0 lb/BDT
5.0 million 7.0 lb/BDT 5.0 million
Sulfur Dioxide (S02)
0.15 lb/BDT
360 0.15 lb/BDT
360 0.15 lb/BDT 360
Carbon Monoxide (CO)
1 7.5 lb/BDT 18,000 150 360,000 280 672,000
Hydro-carbons
0.025 lb/BDT
60.0 24 lb/BDT
57,600 23 lb/BDT 55,200
Particulate 0.45 lb/BDT
1,080 15 lb/BDT
36,000 21 lb/BDT 50,400
Methane (CH4)
25 0.25 lb/BDT
15,000 8 lb/BDT 480,000 7 lb/BDT 420,000
Carbon Dioxide (CO2)
1.78 Tons/BDT
4,272 1.69 Tons/BDT
4,056 1.69 Tons/BDT
4,056
(Table above derived from 1999, Dr. Gregg Morris, “Value of Biomass Power” and from CO2e conversion for Methane)
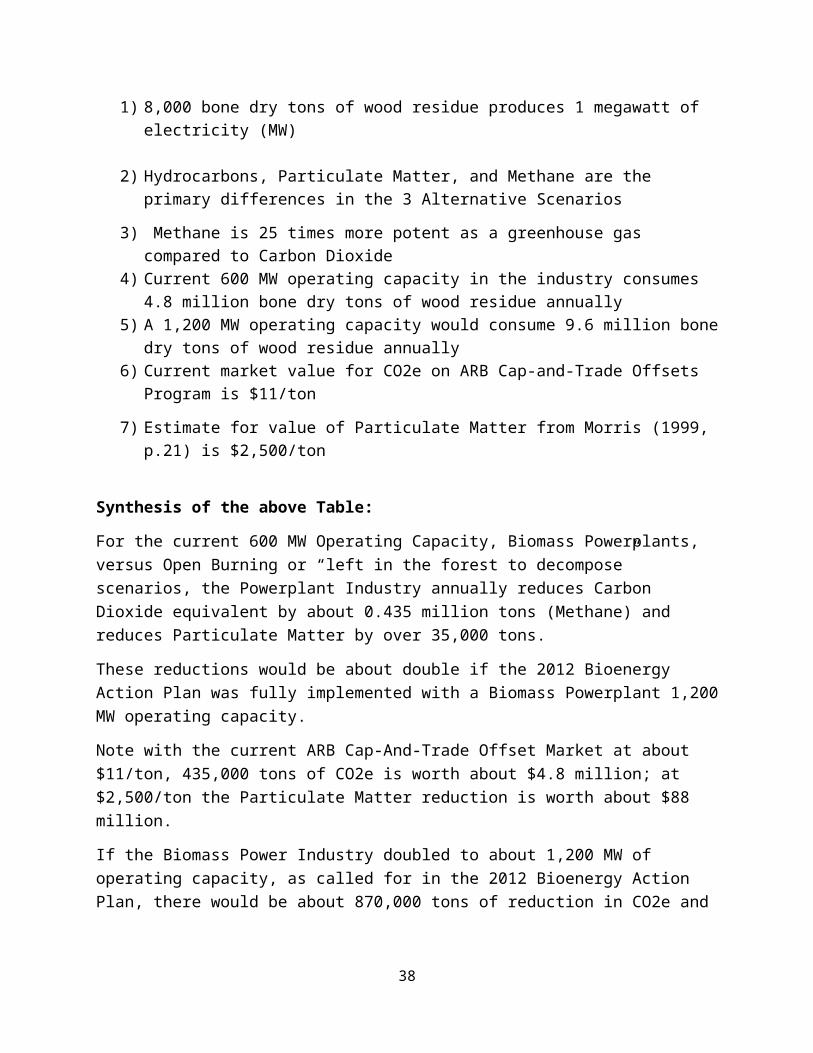
Notes:
1) 8,000 bone dry tons of wood residue produces 1 megawatt of electricity (MW)
2) Hydrocarbons, Particulate Matter, and Methane are the primary differences in the 3 Alternative Scenarios
3) Methane is 25 times more potent as a greenhouse gas compared to Carbon Dioxide4) Current 600 MW operating capacity in the industry consumes 4.8 million bone dry
tons of wood residue annually5) A 1,200 MW operating capacity would consume 9.6 million bone dry tons of wood
residue annually6) Current market value for CO2e on ARB Cap-and-Trade Offsets Program is $11/ton
7) Estimate for value of Particulate Matter from Morris (1999, p.21) is $2,500/ton
27
Synthesis of the above Table:
For the current 600 MW Operating Capacity, Biomass Powerplants, versus Open Burning or “left in the forest to decompose” scenarios, the Powerplant Industry annually reduces Carbon Dioxide equivalent by about 0.435 million tons (Methane) and reduces Particulate Matter by over 35,000 tons.
These reductions would be about double if the 2012 Bioenergy Action Plan was fully implemented with a Biomass Powerplant 1,200 MW operating capacity.
Note with the current ARB Cap-And-Trade Offset Market at about $11/ton, 435,000 tons of CO2e is worth about $4.8 million; at $2,500/ton the Particulate Matter reduction is worth about $88 million.
If the Biomass Power Industry doubled to about 1,200 MW of operating capacity, as called for in the 2012 Bioenergy Action Plan, there would be about 870,000 tons of reduction in CO2e and be worth about $9.6 million; Particulate Matter reduction would be about 70,000 tons and worth about $175 million.
For comparison, Placer County has also done a comparative evaluation of emissions from a biomass boiler versus open pile burning (May 14, 2010, Bruce Springsteen etal. “Emission Reductions from Woody Biomass for Energy as an Alternative to Open Pile Burning. Tables 4 and 5 of that publication (pp. 13-14) shows the following:
Table 5, Emissions Comparison
Operation Air Emissions (Tons/6096 BDT)
NOx PM NMOC CO CO2 CH4 CO2eBaseline, Open Pile BurningOpen Pile Burning
17.37 37.65 28.96 362 10,618 17.37 10,983
Displaced Power from Grid
0.47 0.28 0.06 1 2,733 2,733
Total 17.84 37.93 29.02 363 13,352 17.37 13,717
Biomass BoilerBoiler 6.58 0.98 0.22 9 11,178 0.55 11,189Process &
28

TransportChipping 0.43 0.52 0.02 1 73 0.04 74Loading 0.31 0.01 0.01 0 19 0.03 19Chip Van Transport
0.91 0.02 0.03 2 118 0.05 119
Total 8.23 1.53 0.28 12 11,388 0.70 11,402
Emissions Reduction
9.62 36.39 28.74 350 1,965 16.7 2,315
% Reduction
54% 96% 99% 97% 15% 96% 17%
The Springsteen publication used a factor of 21 for how potent Methane (CH4) is compared to CO2. The transport distance in a chip van was 60 miles one-way.
NOx = Nitrous Oxide; PM = Particulate Matter; NMOC = Non-Methane Volatile Organic Compounds; CO= Carbon Monoxide; CO2 = Carbon Dioxide; CO2e = Carbon Dioxide Equivalent
For the existing 600 MW operating powerplant industry, consuming 4.8 million bone dry tons (BDT)/year, Springsteen’s results were:
2,315 tons net CO2e annual reduction/6,096 BDT X 4.8 million BDT = 1.8 million tons reduction X $11/ton on offset cap-and-trade market = $19.8 million
36.39 tons of particulate matter annual reduction/6,096 BDT X 4.8 million BDT = 28,654 tons reduction X $2,500/ton =$71.6 million. Note the $2,500/ton figure comes from Morris, 1999. The Carl Moyer Program today values PM2.5 at up to $16,000/ton.
Summary:
1) Utilizing woody residues (agriculture, forest, and urban) to generate heat and power compared to open burning or above ground decomposition has over 11 cents/kW of uncompensated ancillary benefits.
2) Considering biogenic boiler emissions no different than fossil emissions will lead to increasing rather than decreasing emissions
3) Incentivizing reduced forest harvest levels will lead to greater use of fossil fuels and increased emissions than can be offset by forest carbon stores
4) National Forests that were thinned and maintained closer to historic tree densities could produce as much as a 16% increase in water yield or over 2 million acre-feet annually from the Sierra Nevada Mountains
5) The reduced criteria pollutants with the current 600 MW operating capacity of the Biomass Powerplant industry is about 17% (1.8 million tons of CO2e (methane)) and 98% (28,000 tons) for particulate matter. If the 2012 Bioenergy Action Plan
29

were fully implemented increasing the operating capacity to 1,200 MW, the values of reduced criteria pollutants would double.1)
30

V. Current state of the Vegetation Condition on California’s National Forests
The National Forests in California are over 50% of the productive forest land statewide. About 9.8 million acres of the productive forest land is available for active management (not reserved) (California’s Forest Resources, 20015-2005, Table 2). The Forest Service Regional Forester, Randy Moore, in a March 2011 publication titled “Region 5 Ecological Restoration, Leadership Intent” stated that 9 million acres needs forest health and/or fuels reduction treatment over the next 15-20 years to return the national forests to a resilient condition (resistant to insect, disease, and wildfire) (http://www.fs.usda.gov/Internet/FSE_DOCUMENTS/stelprdb5351674.pdf, page 3).
California’s National Forest productive forest land grows at the rate of 4.5 billion board feet per year and has annual mortality of about 840 million board feet (mmbf) per year (19% of growth) (Forest Service Forest Inventory and Analysis Data, 2001-2005 (Enclosure #3). In the late 1980’s, the Forest Service was removing about 1.8 billion board feet per year (40% of annual growth). Primarily because of the Northern and California Spotted Owl, that harvest level was reduced by 1994 to about 344 mmbf/year (about 7% of annual growth) and has remained at that level for the past 20 years (Board of Equalization Timber Yield Statistics, Enclosure #4).
By only removing on average 7% of annual growth over the past 20 years, the new growth has added nearly 2 tons/acre/year to the available productive forest land on the National Forests. Today the National Forests average about 224 trees/acre; in 1911, the Sierra Nevada’s averaged about 19 trees/acre (Enclosure #5). The National Forests have become homogenized and are grossly overly dense (Enclosure #6).
The result of negligible management of the National Forest vegetation for the past 20 years is that, coupled with the 4 years of drought, the forest has now become very susceptible to insect, disease and wildfire (Enclosures 7, 8, and 9). In fact, on average, 2001-2014, the national forests are experiencing 305,000 burned acres/year due to wildfire (Enclosure #10). Further, fire severity has increased dramatically from 21% high severity in 1986 to about 50% in 2014 (King Fire, Eldorado National Forest).
From their own statistics, the Forest Service, California Region, has shown that from 2005-2012 they are only restoring and reforesting less than 9% of the moderate and high severity burned acres (Enclosure #11). With now about 150,000 acres/year of high severity burn of which about 70% is productive forest land, and only 9% restoration, that leaves about 90,000 acres per year that are type converting from productive forestland to brushfields. The Forest Service is working toward increasing the percent restoration on recent large wildfires (Rim and King Fire) but the implementation has not yet begun.
The Forest Service mechanically thins about 60,000 acres/year in California on the National Forests producing about 780,000 bone dry tons of biomass (about 125 MW).
31

They are also salvaging about 15,000 acres/year of high severity burn from wildfires producing about 375,000 bone dry tons of biomass (45 MW).
Private forest lands in California are harvesting about 50,000 acres per year (1.2 billion board feet per year) generating about 1.5 million bone dry tons of biomass (190 MW).
Finally, the State of California, both State and Federal, cumulatively are spending about $1.2 billion per year on fire suppression. Nationally, the 52% of entire Forest Service budget goes toward wildfire preparedness and suppression. The trend is for continued increase in size and intensity of wildfire primarily due to the overly dense national forests. This will continue to take more and more dollars from the constrained Forest Service budget toward fire suppression rather than forest health and fuels reduction projects.
In summary, in regard to California’s National Forests:
1) Forest Service Regional Forester, Randy Moore, has published that he wants to see a tripling of forest health and fuels reduction accomplishments on California’s National Forests to about 500,000 acres per year. There are 9 million acres that need treatment over the coming 15-20 years.
2) They are grossly overly dense and homogenized leading to ever increasing number, size and intensity of wildfires and continuing damage from insects and disease.
3) Historically, the National Forests had about 19 trees/acre; today 224 trees/acre. Today, forest health treatments only remove about 7% of annual growth in contrast to the late 1980’s when 40% of annual growth was removed.
4) Wildfires on average over the past 15 years have burned about 305,000 acres per year on the National Forests and the severity has increased dramatically from 1986 where 21% of acres burned was high severity (greater than 90% of vegetation killed) to 2014 where the high severity was near 50%.
5) At the current rate of restorative activities on high severity burned acres, type conversion to brushfields will result, which will lead to more intense wildfires.
6) The national forests are going to continue to get denser and denser and denser spawning a continuing upward trend in number, size, and intensity of wildfire and insect and disease attack. Nothing can stop it until the Federal Government dramatically changes its approach to vegetation management.
7) Percentage of the Forest Service budget going to wildfire preparedness and prevention will continue to increase thereby reducing available appropriations for forest health and fuels reduction projects.
32

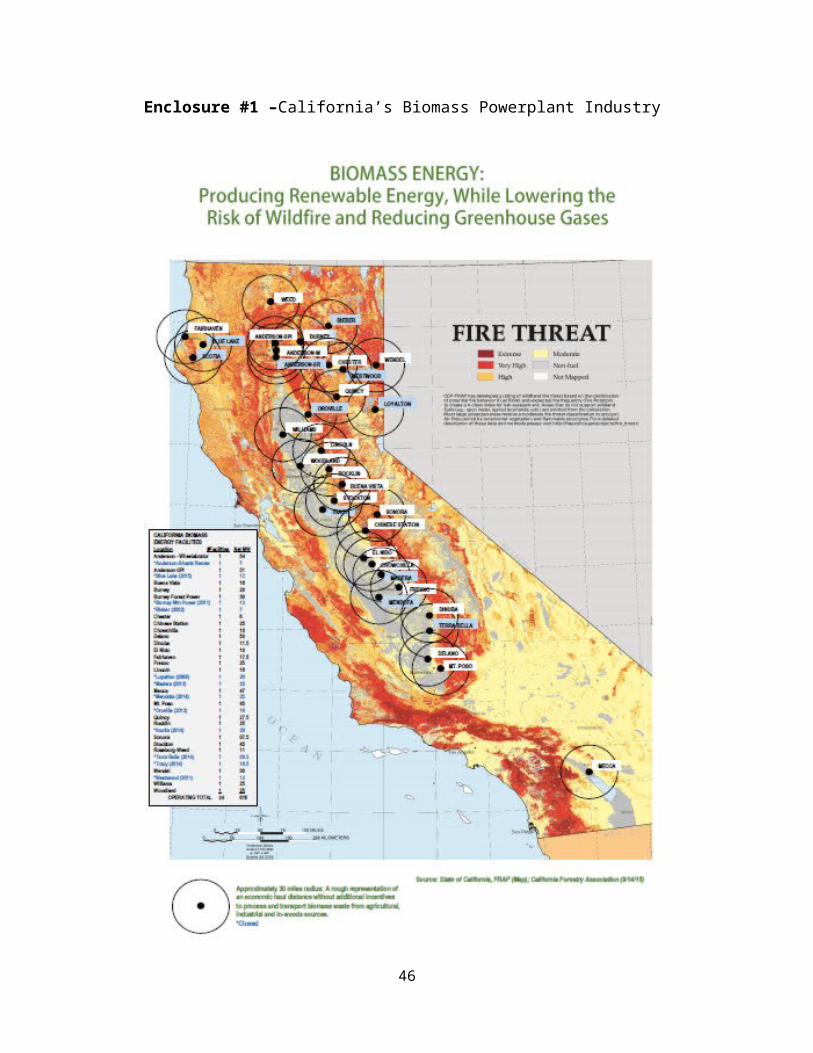
Enclosure #1 –California’s Biomass Powerplant Industry
33

Enclosure #2 – 66 Original Wood-Fired Powerplants Constructed in California
California Biomass Plants, June 2007
Plant Name Owner Town/City County Net MW Gross MW Big Valley Big Valley Lumber Bieber Lassen 6.8 8.3Burney Forest Power Connectiv Burney Shasta 31 35Collins Pine Collins Companies Chester Plumas 12 13.3Auberry Yonke Energy Auberry Fresno 7.5 8.3 (Idle)Mecca Colmac Energy Mecca Riverside 47 52Diamond Walnut Diamond Walnut Stockton San Joaquin 4.5 5 (Idle)Fairhaven Power Eel River Sawmill Eureka Humboldt 17.5 21GP Fort Bragg Georgia Pacific Ft. Bragg Mendocino 15 17 (Idle)Ione Jackson Valley Energy Ione Amador 16 18 (Idle)Modesto Energy Enpower Corp Modesto 14 15.2 (Idle)Blue Lake North American Power Blue Lake Humboldt 10.5 11.5 (Idle)HL Power CMS Susanville Lassen 30 33Pacific Lumber Pacific Lumber Co. Scotia Humboldt 19 27.5
Standard Fibreboard Standard Co. Sonora Tuolumne 3 3.3Burney Covanta Burney Shasta 10 11Westwood Covanta Westwood Lassen 12 13.3Oroville Covanta Oroville Butte 18 20
Blue Diamond Blue Diamond Growers Sacramento Sacramento 9.5 0 (Dismantled)Chinese Station Ultrapower Chinese Station Tuolumne 25 27.5Fresno Rio Bravo Fresno Fresno 25 28Rocklin Rio Bravo Rocklin Placer 25 28Madera Community Recycling Madera Madera 25 28
Chowchilla San Joaquin Valley Energy Chowchilla Madera 10 0 (Dismantled)Chowchilla II Madera Power LLC Chowchilla Madera 25 25El Nido San Joaquin Valley Energy El Nido Merced 10 11 (Idle)Sierra Power Sierra Forest Products Terra Bella Tulare 9.5 11SPI Burney Sierra Pacific Industries Burney Shasta 9.5 11SPI Lincoln Sierra Pacific Industries Lincoln Placer 15 16SPI Loyalton Renegy Loyalton Sierra 10 11SPI Quincy Sierra Pacific Industries Quincy Plumas 12.5 14SPI Susanville Renegy Susanville Lassen 9.8 11 (Idle)SPI Sonora Sierra Pacific Industries Sonora Tuolumne 3.5 4SPI Hayfork Sierra Pacific Industries Trinity 10 11 (Idle)
Sierra Pacific Industries Anderson Anderson 4 4 Feather River Energy Factors Feather River Yuba 16.5 0 (Dismantled)
Delano Covanta Delano Kern 50 56Mendota Covanta Mendota Fresno 25 28
Koppers Koppers Co. Oroville Butte 5.5 0 (Dismantled)Woodland Xcel Energy Woodland Yolo 25 28Tracy GWF Power Tracy San Joaquin 18.5 20.3Williams Wadham Energy Williams Colusa 25 27.5Brawley Primary Power Brawley Imperial 15 17 (Idle)Shasta Wheelabrator Anderson Shasta 50 55
34

Shasta 2 Wheelabrator Anderson Shasta 3 3Hudson Wheelabrator Anderson Shasta 7 7.5 (Idle)Martell Wheelabrator Martell Amador 18 20 (Idle)Soledad Yanke Energy Soledad Monterey 13.5 15 (Idle)Dinuba Community Recycling Dinuba Tulare 11.5 13
Lindsay Olive Lindsay Olive Co. Tulare 2.2 0 (Dismantled) North Fork North Fork Lumber Madera 8 0 (Dismantled) Agrico Agrico Cogen Fresno 25 0 (Conv. To Gas)
Gaylord Gaylord Paper AntiochContra Costa 30 0 (Conv. To Gas)
Jen Weld Jen Weld Ind. Lassen 2.5 0 (Conv. To Gas) Roseberg Roseburg Lumber Anderson Shasta 4 0 (Dismantled) Paul Bunyan Paul Bunyan Lumber Shasta 3 0 (Dismantled) Redding Power City of Redding Redding Shasta 25 0 (Conv. To Gas) Simpson Simpson Paper Co. Humboldt 29 0 (Conv. To Gas) Arcata Arcata Redwood Del Norte 8 0 (Dismantled) P and G Procter & Gamble Long Beach Los Angeles 13.5 0 Now Soledad
Apex Apex Orchards Bakersfield Kern 5.5 0 (Idle) Lassen Lassen College Lassen 1.5 0 (Dismantled) Redwood Redwood Foods Stanislaus 4.5 0 (Dismantled)
MW Totals 957.3
Operating Net MW today 616
35

Enclosure #3– California National Forests Available Productive Forest Land Not Reserved Growth and Mortality (Forest Service Inventory & Analysis (FIA) 2001-2005)
Note: The FIA plot data used in this graph is from 2001-2005. Since 2012, there has been a substantial increase in mortality due to insect and disease.
36
Enclosure #4 – California Board of Equalization Timber Yield Statistics for Private and Public Lands 1978-2014
California Board of Equalization
CALIFORNIA TIMBER HARVEST STATISTICSCOMPILED FROM TIMBER TAX RECORDS VOLUME FIGURES-ALL TIMBER in Million board feet (mmbf)
Calendar Total Public PrivateYEAR MMBF Volume Volume1978 4,491 1,725 2,7661979 3,991 1,723 2,2681980 3,164 1,228 1,9361981 2,672 950 1,7221982 2,318 818 1,5001983 3,358 1,468 1,8901984 3,546 1,446 2,1001985 3,818 1,613 2,2051986 4,265 1,869 2,3961987 4,500 1,860 2,6401988 4,670 2,048 2,6221989 4,424 1,791 2,6331990 4,021 1,326 2,6951991 3,195 1,142 2,0531992 2,973 841 2,1321993 2,871 608 2,2631994 2,316 344 1,9721995 2,306 375 1,9311996 2,273 288 1,9851997 2,400 357 2,0431998 2,091 254 1,8371999 2,144 241 1,9032000 1,966 265 1,7012001 1,603 128 1,4752002 1,690 169 1,5212003 1,663 155 1,5082004 1,706 113 1,5932005 1,725 230 1,4952006 1,631 200 1,4312007 1,626 187 1,4392008 1,372 99 1,2732009 805 60 7452010 1,161 136 1,0252011 1,288 158 1,1302012 1,307 150 1,1572013 1,645 223 1,4222014 1,466 235 1,231
37
Enclosure #5 – U.C. Berkeley (Scott Stephens) and Forest Service Pacific Southwest Research Station (Brandon Collins) Research on Sierra Nevada Historic Condition
38

Enclosure #6 – Pace and Scale of Thinning and Fuels Reduction on California National Forests has only been at a rate of 7% of annual growth for the past 20 years
39
Enclosure #7 – Drought Induced Insect and Disease Mortality in California, 2014 (Forest Service Aerial Survey, R5-PR-034)
Summary: 2014 - 820,000 acres with elevated mortality due to bark beetles or wood borers were mapped, up from 350,000 acres in 2013.
40

Enclosure #8 – Rim Fire (Stanislaus National Forest) Pre-Fire Photo July 15, 2013
41
Enclosure #9 – Rim Fire Post-Fire Photo Sept. 25, 2013 (same location as Enclosure #8)
42
Enclosure #10 – Average Wildfire Burned Acres on California National Forests 2001-2014
California Acres Burned (US Forest Service and Total) Year 2001-2014
Year Forest Service Statewide10/1/2015
Over 400,000 Over 700,000
2014 400,005 530,7942013 350,642 577,6752012 297,212 869,5992011 41,777 126,8542010 39,288 109,5292009 305,371 405,5852008 919,716 1,375,7812007 551,932 1,087,1102006 453,500 678,9192005 19,583 202,7542004 49,437 242,0572003 363,964 793,4022002 365,945 506,6962001 106,798 329,126
AVG. 2001-2014
304,655
559,706
* - 20% of acreage in California; 53% of acres burned
Source: http://www.nifc.gov/fireInfo/fireInfo_statistics.html
43

Enclosure #11 –
Regional Cumulative Effects Analysis for Black-Backed Woodpeckers in California
Using Burned Forested Habitat – June 13, 2013
Geographic Extent of Calculations
We defined the area of interest as the range of the Black-backed Woodpecker in California based on the revised California Wildlife Habitat Relations (CWHR) map/shapefile for the Black-backed Woodpecker that the California Department of Fish and Wildlife (DFW) used in their recent CESA listing package (Daniel Applebee, DFW, personal communication). Black-backed Woodpeckers are known to specialize on burned forest, but they also use unburned forests; we restricted this analysis to burned forest. Within the extent of the Black-backed Woodpecker’s range, we only considered CWHR forest types Douglas-Fir, Jeffrey Pine, Eastside Pine, Klamath Mixed Conifer, Lodgepole Pine, Ponderosa Pine, Red Fir, Subalpine Conifer, Sierran Mixed Conifer, White Fir, and Unknown Conifer in CWHR size classes greater or equal to 3 (size class 3 corresponds to 6-11 inch dbh) and where the CWHR tree canopy was moderate or dense as identified in the CalFIRE FRAP fveg02_2 data layer. These criteria correspond to the habitat preferences of Black-backed Woodpeckers:
“Researchers working in different forest types have defined tree size classes in various ways, but as a general guideline, large snags indicative of preferred foraging habitat roughly correspond to California Wildlife Habitat Relationships (CWHR; Mayer and Laudenslayer 1988) size class 5 (dbh >24”) and medium- and small-diameter snags typical of nesting habitat roughly correspond to CWHR size class 4 (dbh = 11-24”) or occasionally 3 (dbh = 6-11”)” (Bond et al. 2012, p. 9).
We considered the following land ownership categories: Forest Service lands, National Park Service (NPS) lands, and other lands. The other lands category primarily includes private lands, but could also include state or federal lands that are not part of NPS or the Forest Service.
Temporal Extent of Calculations
Black-backed Woodpecker are known to use areas burned in the previous 10 years with the greatest activity generally occurring in the 8 years following fire. We included fires that occurred from 2005-2012 which represents the prior 8 years for birds using the habitat in 2013.
Calculating the Amount of Burned Habitat
We used the Vegetation Burn Severity data layer to calculate the extent of burned habitat using GIS. This layer includes public and private lands and ranks the burn severity of forested lands as low, moderate, or high for fires at a minimum size of 300 acres, so our analysis only includes fires which were 300 acres or greater. Low severity represents
44

areas of surface fire with little change in cover and little mortality of the structurally dominant vegetation; 0.1 <= CBI < 1.25 (CBI=Composite Burn Index). Moderate severity represents fire areas between low and high and means there is a mixture of effects on the structurally dominant vegetation; 1.25 <= CBI < 2.25. High severity represents areas where the dominant vegetation has high to complete mortality; 2.25 <= CBI <= 3.0. For NPS lands, only fires that extend into Forest Service lands are mapped on the Vegetation Burn Severity data layer.
We calculated the amount of burned habitat within the range of the Black-backed Woodpecker using two sets of criteria for woodpecker habitat. We first calculated area using both moderate and high severity burn categories (which Black-backed Woodpeckers are known to prefer), and then we repeated the calculation to include low, moderate, and high severity areas within each fire. Although Black-backed Woodpeckers prefer high and moderate severity fire, they also use low severity fire areas, particularly when those areas are interspersed with more severely burned areas, and hence we did the calculation both ways in order to develop a range in the amount of burned habitat. We did not include the following burn severity categories: unchanged/no burn (in which a portion of the fire affected area did not burn) or unmapped (in which cloud cover obscured the degree to which an area had burned in the satellite data).
Calculating the Amount of Treated Burned Habitat
After calculating the amount of burned habitat with and without low severity fires (see above), we then determined the amount of this habitat that had been removed or altered due to post-fire timber management activities (referred to as “treated”). The FACTS GIS data layers include information on any tree/snag removal treatments that have occurred on Forest Service lands. We overlaid the FACTS layers for completed projects with the burned area layers to determine areas that burned and were subsequently treated, in order to calculate the area with post-fire tree removal. We included any FACTS treatment types in which standing trees were removed (e.g. salvage timber removal, hazardous tree removal, yarding, etc.).
For fires that occurred in 2012 within the boundary of the range of the Black-backed Woodpecker where treatments have not yet occurred as of May 2013, we included the proposed area to be treated on the Plumas National Forest (Peak fire and Chips fires), Lassen National Forest (Chips and Reading fires), Modoc National Forest (Barry Point fire), and Stanislaus National Forest (Ramsey fire). These are the 2012 fires within the Black-backed Woodpecker range in California in which snag removal projects are planned for 2013, but have not yet occurred. Because the projects have not yet occurred we did not always have spatially explicit information on the project boundaries (e.g. the scope of the project might include setting aside multiple 3-5 acre patches of snags, but the exact location of those patches has not been determined). Without the boundaries we could not necessarily determine the burn severity levels within the areas to be treated.
45
We did not have data for post-fire timber management activities on non-Forest Service lands. We made the assumption that 100% of the burned other lands (non-FS and non-NPS) were treated; this is likely an overestimate as not all of these lands are industrial timber lands. We chose to overestimate treatments on other lands in order to come up with a maximum value of the area potentially affected by snag removal. We also made the assumption that 100% of the NPS lands were not treated because NPS generally only removes hazardous trees and does not engage in other post-fire timber management practices (e.g. salvage timber removal).
Analyses
Our analyses were conducted within the range of the Black-backed Woodpecker in California, in burned forest types used by Black-backed Woodpeckers, for forested lands that burned from 2005-2012 (see details above). We included burned timber removal activities that occurred in 2005-2012, as well as burned timber removal activity proposed to occur in 2013 within areas that burned in 2012.
We calculated the amount of untreated Black-backed Woodpecker habitat created by fire within each of the three landowner categories. We calculated (or, for NPS and other lands, estimated, using the assumptions described above) the percent treated due to post-fire timber management activities that occurred in 2005-2012, or are proposed to occur in 2013.
Table 1: Amount of burned suitable Black-backed Woodpecker habitat that has been subsequently treated (tree removal) or untreated (no tree removal) within the range of the Black-backed Woodpecker in California from fires occurring in 2005-2012 of different burn severity categories (high, moderate, and low). Treated acres from 2012 fires are estimated based on proposed salvage work occurring in 2013 on 12,398 acres in suitable Black-backed Woodpecker habitat. Data are broken down by landowner (Forest Service, National Park Service, and Other) or summed for “all” lands. See text for methods and assumptions.
Treated Untreated Total Percent TreatedBurn severity
Hi/Mod/ Lo
Hi/mod Hi/Mod/ Lo
Hi/Mod Hi/Mod/ Lo
Hi/Mod Hi/Mod/ Lo
Hi/Mod
FS lands a 41,326 38,100 743,106 390,446 784,432 428,546 5.3% 8.9%NPS lands b 0 0 40,744 23,448 40,744 23,448 0.0% 0.0%Other lands c 124,590 91,591 0 0 124,590 91,591 100.0% 100.0%All lands d 165,916 129,690 783,850 413,894 949,766 543,584 17.5% 23.9%
a Treated values include 12,398 acres that burned in 2012 and are proposed for treatment in 2013. The burn severity is not known for the 12,398 acres, so they are included in BOTH burn severity categories.
b For NPS lands we assumed no burned acres were treated. Only fires that burned on
46

both Forest Service and NPS lands are included (see text) so we likely underestimate untreated acres.c For Other lands we assumed that all of the burned acres were treated. d For All lands we summed values for FS, NPS, and Other lands.
Our analyses show that between 5.3%-8.9% (depending on fire severity levels) of the FS acres that burned from 2005-2012 and are suitable for Black-backed Woodpeckers have been, or are proposed to be treated with post-fire timber removal. This percentage range can be further broken down into treatments that have already occurred (3.7%-6.0%) and treatments that are proposed to occur in 2013 (1.6%-2.9%) on 12,398 acres of suitable Black-backed Woodpecker habitat. Therefore the burned timber removal planned in 2013 (from the 2012 fires) will contribute to a 1.6%-2.9% reduction in suitable habitat for Black-backed Woodpeckers which is in addition to the 3.7-6.0% reduction in suitable habitat from treatments on fires that occurred in 2005-2011.
Our estimates for all lands (regardless of landowner) show that between 17.5% to 23.9% (depending on fire severity levels) of the acres that burned in the range of the Black-backed Woodpecker in California from 2005-2012 have been, or are proposed to be treated with post-fire timber removal (of which 5.3%-8.9% occur on FS lands). This range for treated acres on all lands is likely an overestimate because it includes the assumption that all “other lands” (non-FS and non-NPS) are harvested following a fire. Moreover, the percent treated values for all lands is likely missing fires that occurred exclusively on NPS land as we did not have access to data on fires that occurred exclusively on NPS lands (we only had access to data on fires where the fire perimeter overlapped with FS lands). An increase in fires on NPS lands would likely increase the amount of habitat available to woodpeckers and lead to an overall decrease in the percent treated on all lands (as NPS lands are not harvested).
47

Bibliography:
1) 2014, February. Danny L. Fry, Scott L. Stephens, Brandon M. Collins, Malcolm P. North, Ernesto Franco-Vizcaı´no, Samantha J. Gill. Contrasting Spatial Patterns in Active-Fire and Fire- Suppressed Mediterranean Climate Old-Growth Mixed Conifer Forests
2) 2015, March. Forest Service, California Region, 2014 Insect and Disease Aerial Mortality Survey (R5-PR-034).
3) 2015, March. Randy Moore. Region 5 Ecological Restoration Leadership Intent (R5-MR-048).
4) 2008, November. California’s Forest Resources, 2001-2005. Five-year forest inventory and analysis report. PNW-GTR-763.
5) 2010, January. Mark Nechodom. California Energy Commission Study (CEC-500-2009-080); “Biomass to Energy: Forest Management for Wildfire Reduction, Energy Production, and Other Benefits”.
6) 2009, April. Mark Nechodom, PowerPoint. “Forest Biomass: Wildfire, Ecosystem Services and Net Benefits of Bioenergy”
7) Leland Tarnay. PowerPoint Presentation. “Managing Smoke and Carbon: Strategies for minimizing impacts while increasing pace and scale of fire treatments”.
8) 2014. June. Lydersen, North, Collins. “Severity of an uncharacteristically large wildfire, the Rim Fire, in forests with relatively restored frequent fire regimes”. Forest Ecology and Management 328, 326-334.
9) 2014. February. California Air Resources Board. “Proposed First Update to the Climate Change Scoping Plan: Building on the Framework”.
10)2012. California Bioenergy Action Plan at: http://resources.ca.gov/docs/energy_and_climate_change/2012_Bioenergy_Action_Plan.pdf
11) 2012, August 22. Press Release for 2012 Bioenergy Action Plan at: http://resources.ca.gov/docs/Final_Bioenergy_Action_Plan_Release_8-22-12.pdf
12)2011. Lippke etal. “ Life cycle impacts of forest management and wood utilization on carbon mitigation: knowns and unknowns.” Carbon Management (2011) 2(3), pp. 303–333.
13)2006, January. Western Governors Association. “Biomass Taskforce Report”.14)1999. Dr. Gregg Morris. “The Value of the Benefits of U.S. Biomass Power”. National
Renewable Energy Lab/SR-570-27541.15)2011, November 29. Dr. Roger Bales, etal. “Forests and Water in the Sierra Nevada:
Sierra Nevada Watershed Ecosystem Enhancement Project”. (http://ucanr.edu/sites/cff/files/146199.pdf)
16)2010. Springsteen etal. “Emission Reductions from Woody Biomass Waste for Energy as an Alternative to Open Burning.” Air and Waste Management Assoc. 61:63-68. www.placer.ca.gov/~/media/apc/documents/APCD%20Biomass/EmissionReductionsFromWoodyBiomassAWMA.pdf
48

17)2015, September. Springsteen etal. “Forest biomass diversion in the Sierra Nevada: Energy, economics and emissions.” (Scheduled to be printed in California Agriculture September 2015 Edition.
18)1979, April. E.F. Darley, University of California, Riverside. “Hydrocarbon Characterization of Agricultural Waste Burning”, CAL/ARB Project A7-068-30.
49
Related Documents