Step-by-Step Ride Guide for Inspectors & Project Engineers At Any Time If you have a smoothness related question or would like assistance with any of the steps enumerated in this document, please contact one of the following individuals. o Tom Nordstrom, Pavement Management Analyst: 651-366- 5537 o Rob Golish, Assistant Concrete Engineer: 651-366-5576 o Greg Schneider, Assistant Bituminous Engineer: 651- 366-5403 Before Any Profiling is Performed by Contractor Familiarize yourself with the following pavement terms: o International Roughness Index (IRI) : roughness measurement that represents how the road “feels” to drivers and passengers o Mean Roughness Index (MRI) : average of left and right wheel path IRI o Smoothness : 528-foot MRI o Area(s) of Localized Roughness (ALR) : 25-foot continuous MRI ≥ 175.0 in/mi o ERD file : text file that contains pavement elevation data 2016 Version Page 1 of 24

Welcome message from author
This document is posted to help you gain knowledge. Please leave a comment to let me know what you think about it! Share it to your friends and learn new things together.
Transcript

Step-by-Step Ride Guide forInspectors & Project Engineers
At Any Time
If you have a smoothness related question or would like assistance with any of the steps enumerated in this document, please contact one of the following individuals.
o Tom Nordstrom, Pavement Management Analyst: 651-366-5537o Rob Golish, Assistant Concrete Engineer: 651-366-5576o Greg Schneider, Assistant Bituminous Engineer: 651-366-5403
Before Any Profiling is Performed by Contractor
Familiarize yourself with the following pavement terms:
o International Roughness Index (IRI) : roughness measurement that represents how the road “feels” to drivers and passengers
o Mean Roughness Index (MRI) : average of left and right wheel path IRIo Smoothness : 528-foot MRIo Area(s) of Localized Roughness (ALR) : 25-foot continuous MRI ≥ 175.0 in/mi o ERD file : text file that contains pavement elevation datao ProVAL (Profile Viewing and Analysis) : FHWA software application used to view
and analyze pavement profiles
Ask inertial profiler (IP) operator to provide evidence of current, valid operator and inertial profiler certifications.Operator certification is valid for multiple years, but inertial profiler certification expires at the end of each calendar year. Both certifications can be verified by accessing the Profiler Certification page of MnDOT’s Smoothness website: http://www.dot.state.mn.us/materials/profilercertification.html.
2016 Version Page 1 of 19

On the Day Profiling is Performed by Contractor
Receive a printout of each pass of data collected by the Contractor.While the data on this printout is not be used to calculate actual Pay Adjustments, it provides immediate, in-the-field approximations of a project’s Smoothness and ALR values. You should focus on the following four portions of the printout:
o Data collection software version,o Sensor serial number(s),o Low- and high-pass filters, ando 528-foot IRI & MRI values.
It is critical that the software version and IP serial number(s) match those used during IP certification. Once certified, all IP settings are posted to the Profiler Certification page of MnDOT’s Smoothness website, which can be accessed at: http://www.dot.state.mn.us/materials/profilercertification.html.
Confirm that the low- and high-pass filters are set to zero. If they are not, request a new printout. Low- and high-pass filters smooth out the profile, which can result in lower Smoothness values and higher Pay Adjustments.
Finally, examine the left and right wheel path 528-foot IRI values, as well as the 528-foot MRI values, for an indication of the pavement’s overall ride quality. The 528-foot MRI values listed on this printout should be nearly the same as the Smoothness values that will be entered into the Profile Summary worksheets by the Contractor at a later date.
Figure 1 shows a sample printout from MnDOT’s Ames high speed inertial profiler with the important portions of the printout highlighted. The left wheel path IRI, right wheel path IRI, and MRI tables are labeled “Track 1,” “Track 2,” and “Average,” respectively.
Receive an ERD file for each pass of data collected by the Contractor.ERD files are imported into a software application called ProVAL to generate Smoothness and ALR values. Each ERD file must be named in the YYMMDD-T-N-D-L-B-E.ERD standardized format in accordance with Table 1.
2016 Version Page 2 of 19

Table 1. Standardized Naming Convention for ERD Files
Abbreviation Definition
YY Two-digit year
MM Month (include leading zeros)
DD Day of month (include leading zeros)
T Route type (I, MN, US, CSAH, etc.)
N Route number and auxiliary ID if applicable (E, W, etc.)
D Primary route direction (I or D, indicating Increasing or Decreasing; Increasing = North or East, Decreasing = South or West)
L Lane number (1 for driving lane, increasing by one for each lane to the left; use 0 for other lanes, such as accel/decel or ramps/loops)
B Beginning station
E End station
For example, 080721-I-35W-I-1-5+21-100+00.ERD would indicate a beginning station of 5+21 and an end station of 100+00, in the driving lane, in the increasing (northbound) direction of I-35W, tested on July 21, 2008.
If the Contractor fails to submit the required data on the day of profiling, the measured segments must be reprofiled by the Contractor at a later date.
Upon Completion of Pavement Placement by Contractor
Within 5 calendar days of pavement placement, receive ProVAL summary reports containing “Smoothness Assurance” analyses.ProVAL summary reports contain the Smoothness and ALR data that will be entered into the Profile Summary worksheets by the Contractor (once any necessary Corrective Work is completed). See Figures 2 through 7 for a sample ProVAL report, paying particular attention to the highlighted portions.
2016 Version Page 3 of 19

The data in the ProVAL report is presented in four distinct sections. The first section—“Analysis: Smoothness Assurance”—contains a short table that lists all of the pavement sections and indicates whether each was analyzed with a 250-mm filter. If any of the sections were analyzed without the application of this filter, ask the Contractor to generate and submit a corrected ProVAL report. Sections two and three of the ProVAL report—titled “Short Continuous” and “Long Continuous”—contain ALR data, while the fourth section—“Fixed Interval”—contains Smoothness data.
Although it appears at the end of the report, examine the “Fixed Interval” section before the sections containing ALR. The first step is to confirm that the appropriate settings have been entered by the Contractor (see Figure 7). The “Segment Length” should always be 528 feet since the Profile Summary worksheets’ segment Pay Adjustments are calculated on a tenth-of-a-mile basis. The “Threshold” should equal the maximum Smoothness value before mandatory Corrective Work is triggered for a particular equation (Table 2 lists the Smoothness Corrective Work thresholds for each Smoothness equation). For instance, the “Threshold” for an HMA-A project is 75.0 in/mi. It is essential that both the “Segment Length” and “Threshold” settings are correct. If either of these is incorrect, request a new ProVAL report with the appropriate values.
Table 2. Smoothness Corrective Work Thresholds
Equation Smoothness Corrective Work Threshold (in/mi)
HMA-A 75.0HMA-B 80.0
HMA-C 95.0
PCC-A 85.0
After verifying the “Fixed Interval” settings, examine the Smoothness values presented in the “Fixed Interval” chart and table. The chart is useful for quickly surmising whether any of the 528-foot segments must undergo Corrective Work. The actual Smoothness values are listed in the table beneath the chart in the column labeled, “No Grinding MRI (in/mi).” The Smoothness values in this table should match very closely—within a tenth of an in/mi per comparison—to the 528-foot MRI values on the printout the Contractor submitted on the day of profiling.
2016 Version Page 4 of 19

Let’s suppose that the Smoothness data contained in the sample ProVAL report is for an HMA-A project. Examining the chart in Figure 7, it is obvious that two of the 528-foot segments—the third and fourth—exceed the Smoothness Corrective Work threshold of 75.0 in/mi. The bars that represent these segments are above the red, horizontal line, indicating that Corrective Work is necessary. Referring to the data table below the chart, you will find that the Smoothness values for these segments are 76.46 and 81.35, respectively.
At this point, it is recommended that you compare the ProVAL report’s Smoothness values against the Pay Adjustment table(s) that will be used for the project. Tables 3 and 4 consist of the various Pay Adjustments and Corrective Work requirements used for bituminous and concrete projects.
Table 3. Smoothness Pay Adjustments & Corrective Work Requirements for Bituminous Pavements
Equation Smoothness(in/mi)
Pay Adjustment ($/0.1 mi)
HMA-A< 25.0 400.00
25.0 − 75.0 800.00 – (16.000 × Smoothness)> 75.0 Corrective Work to ≤ 50.0 in/mi
HMA-B< 30.0 270.00
30.0 − 80.0 594.00 – (10.800 × Smoothness)> 80.0 Corrective Work to ≤ 55.0 in/mi
HMA-C< 35.0 180.00
35.0 − 95.0 390.00 – (6.000 x Smoothness)> 95.0 Corrective Work to ≤ 65.0 in/mi
Table 4. Smoothness Pay Adjustments & Corrective Work Requirements for Concrete Pavements
Equation Smoothness(in/mi)
Pay Adjustment ($/0.1 mi)
PCC-A< 45.0 890.00
45.0 − 85.0 2892.50 – (44.500 × Smoothness)> 85.0 Corrective Work to ≤ 65.0 in/mi
2016 Version Page 5 of 19

The next step is to inspect the “Short Continuous” section of the ProVAL report for ALR data. Begin by verifying that “Segment Length” and “Threshold” are 25 feet and 175.0 in/mi, respectively. If the values match, examine the “Short Continuous” graph, which displays 25-foot continuous MRI values. This graph contains a red, horizontal line that intersects the y-axis at 175.0 in/mi MRI. Any data points located at or above this line are defined as ALR. This graph is useful because it provides a visual representation of the amount and magnitude of the localized roughness (usually in the form of bumps and dips) that exist.
The “Short Continuous” graph of our sample profile (see Figure 3) shows two adjacent ALR—both having a maximum height of just over 260.0 in/mi. Below the graph is a table titled “No Grinding” that contains the ALR starting and ending locations, along with the 25-foot continuous MRI value for the apex of each ALR. According to this table, the peak values for the ALR are 264.83 and 262.93 in/mi, respectively.
After noting the locations and magnitudes of individual ALR, check the amount of pavement that falls within MnDOT’s ALR Monetary Deduction categories. This information can be found in the short table located at the end of the “Short Continuous” section (see Figure 4). For our sample profile, the length of pavement ≥ 175.0 to < 225.0 in/mi is 41.35 linear feet, while the amount ≥ 225.0 in/mi is 28.21 linear feet. Information on the various ALR categories and their corresponding Monetary Deductions and Corrective Work Requirements is located in Table 5.
The final part of the ProVAL report—the “Long Continuous” section—is the least important. The data in the “Long Continuous” graph is the same as the data that comprises the “Short Continuous” graph, with one exception: the red, horizontal line on the “Long Continuous” graph intercepts the y-axis at the upper ALR threshold of 225.0 in/mi instead at the lower ALR threshold of 175.0 in/mi MRI (see Figure 5). While not critical, a quick scan of the “Long Continuous” graph can help the viewer determine how much ALR, if any, falls in the upper deduct category. The settings for this section should be 25 feet for “Segment Length” and 225.0 in/mi for “Threshold.”
2016 Version Page 6 of 19

Table 5. ALR Monetary Deductions and Corrective Work Requirements
Equation 25-foot Continuous MRI (in/mi)
Corrective Work or Monetary Deduction, per linear 1.0 foot
HMA-A or HMA-B, and a posted vehicle
speed > 45 mph
< 175.0 Acceptable
≥ 175.0 to < 225.0Corrective Work unless both the
Engineer and the Contractor agree to a deduct of $25.00
≥ 225.0Corrective Work unless both the
Engineer and the Contractor agree to a deduct of $125.00
PCC-A and a posted vehicle speed >
45 mph
< 175.0 Acceptable
≥ 175.0 to < 225.0Corrective Work unless both the
Engineer and the Contractor agree to a deduct of $25.00
≥ 225.0 Corrective Work
HMA-C, PI, ramps, loops, concrete
intersections constructed under
traffic, or any paving with a posted vehicle
speed ≤ 45 mph
< 225.0 Acceptable
≥ 225.0 $25.00
2016 Version Page 7 of 19

Determine whether Corrective Work is necessary.
Two types of Corrective Work exist: Smoothness Corrective Work and ALR Corrective Work. Smoothness Corrective Work always is required when one or more Smoothness values exceed an equation’s Smoothness Corrective Work threshold. In contrast, ALR Corrective Work can be substituted with a monetary deduction if both the Engineer and the Contractor agree (see Table 5). However, if either party desires Corrective Work, a monetary deduction will not be allowed in lieu of Corrective Work.Note: PCC-A projects with a Posted Vehicle Speed > 45 mph that have ALR ≥ 225.0 in/mi must undergo Corrective Work until all ALR ≥ 225.0 are eliminated.
Figure 8 is a flowchart that was designed to simplify this oft confusing process. As you can see from the chart, Corrective Work never is required when both of the following are true:
1. Smoothness Corrective Work is NOT required by a Pay Adjustment table.2. No ALR exists, or the Posted Vehicle Speed ≤ 45 mph, or the Smoothness
Equation is either PI or HMA-C.
Receive Profile Summary worksheets (if no Corrective Work is necessary).If Corrective Work is indeed unnecessary, ask the Contractor to use the data in the initial ProVAL report to fill out the Profile Summary worksheets (see Figure 9 for a sample worksheet). Upon completion, collect the worksheets from the Contractor.
Review Profile Summary worksheets (if no Corrective Work is necessary).First, verify the data entered into the Profile Summary worksheets by comparing it to the data in the ProVAL summary report. Next, confirm that all of the worksheets’ green cells have data entered into them and that the correct lane description, Smoothness equation, and posted vehicle speed have been selected from the drop-down lists. Finally, it is critical that none of the white output cells indicates Corrective Work is necessary. The Profile Summary worksheets are programmed to not display a “Total Pay Adjustment + Areas of Localized Roughness Deduction” value if either Smoothness or ALR Corrective Work is required. This is to prevent disbursement of Pay Adjustments until after all necessary Corrective Work has been completed. Keep in mind that the Corrective Work indicated by a Profile Summary worksheet is not optional. If Corrective Work is indicated, it must be performed by the Contractor.
2016 Version Page 8 of 19

Before Corrective Work is Performed by Contractor
Receive a Corrective Work plan.You must approve this plan before the Contractor begins any Corrective Work. If no Smoothness Corrective Work is required and ALR Corrective Work is not mandatory, you may assess ALR Monetary Deductions in lieu of Corrective Work, provided the Contractor agrees to this substitution. If the Contractor does not agree to this substitution, ALR Corrective Work must be performed.
Receive Profile Summary worksheets (only if Corrective Work is not mandatory and the Contractor agrees to ALR Monetary Deductions instead of Corrective Work).If it is agreed that ALR Monetary Deductions will be substituted for Corrective Work, ask the Contractor to use the data in the initial ProVAL report to fill out the Profile Summary worksheets. Upon completion, collect the worksheets from the Contractor.
Review Profile Summary worksheets (only if Corrective Work is not mandatory and the Contractor agrees to ALR Monetary Deductions instead of Corrective Work).Refer to the section titled “Upon Completion of Pavement Placement by Contractor” for instructions on how to review Profile Summary worksheets.
After Corrective Work is Performed by Contractor
Receive new printouts and ERD files for Corrective Work segments.Following Corrective Work, the Contractor must reprofile all the 528-foot segments in which Corrective Work was performed. On the day of reprofiling, you will need to collect printouts and ERD files for these segments.
Receive an updated ProVAL summary report that contains “Smoothness Assurance” analyses for each 528-foot segment in which Corrective Work was performed.
Receive Profile Summary worksheets.Have the Contractor use the data in both the initial and updated ProVAL reports to fill out the Profile Summary worksheets. Upon completion, collect the worksheets from the Contractor.
Review Profile Summary worksheets.Refer to the section titled “Upon Completion of Pavement Placement by Contractor”
for instructions on how to review Profile Summary worksheets.
2016 Version Page 9 of 19

Figure 1. Sample of Printout to Receive on Each Day of Profiling
2016 Version Page 10 of 19

2016 Version Page 11 of 19

Figure 2. Sample ProVAL Report (page 1 of 6)
2016 Version Page 12 of 19

Figure 3. Sample ProVAL Report (page 2 of 6)
2016 Version Page 13 of 19
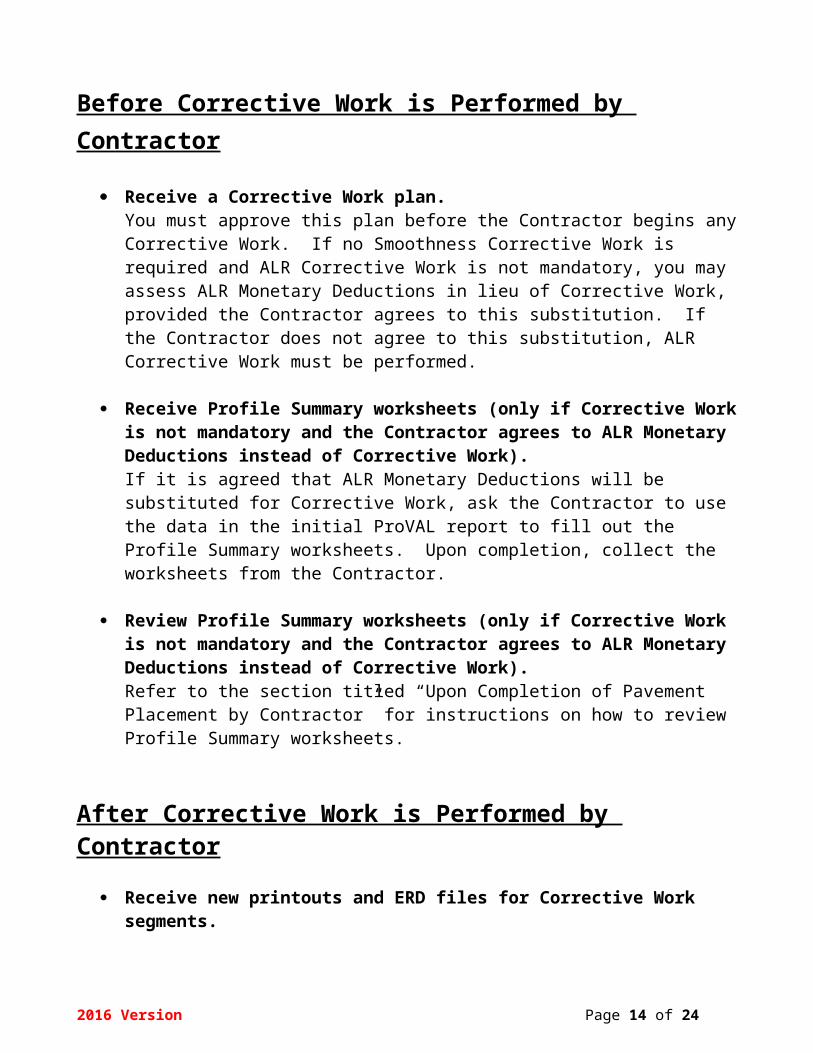
Figure 4. Sample ProVAL Report (page 3 of 6)
2016 Version Page 14 of 19

Figure 5. Sample ProVAL Report (page 4 of 6)
2016 Version Page 15 of 19

Figure 6. Sample ProVAL Report (page 5 of 6)
2016 Version Page 16 of 19

Figure 7. Sample ProVAL Report (page 6 of 6)
2016 Version Page 17 of 19

Figure 8. Flowchart: What Needs to be Done after Receiving the Initial ProVAL Report?
2016 Version Page 18 of 19
Receive a Corrective Work
Plan from Contractor.
No
Yes
Yes
Receive new ERDs and an
updated ProVAL report from Contractor.
Any ALR?
Is Smoothness CW required by Pay Adjust
table?
PCC
HMA
Receive a Corrective Work
Plan from Contractor.
No
No No No
CW
YesYes
HMA-A/B or
PCC-A?
END
START
Posted Vehicle Speed
≤ 45 mph?
ALR CW or ALR Deduct? CW unless both
parties agree to a monetary deduct
Monetary Deduct
Yes
Have Contractor perform CW and
reprofile all segments that received CW.
Receive Profile Summary
worksheets from Contractor.
Either Percent Improvement
or HMA-C?
Any ALR ≥ 225.0 in/mi?
Yes

Figure 9. Sample Profile Summary Worksheet
1-Mar-2016PCC-A
> 45 mph
Stationing Section 2Beginning 21+00 27.0End 37+50 0.0
S1 42.0 $890.00 S1
↓ 48.7 $725.35 ↓
↓ 51.5 $505.18 ↓
S2 62.9 $93.45 S2
↓ 68.4 -$151.30 ↓
↓ 71.7 -$298.15 ↓
↓ 55.0 $55.63 ↓
S3 48.0 $756.50 S3
↓ 43.9 $890.00 ↓
↓ 48.6 $729.80 ↓
↓ 54.0 $292.96 ↓
Total Pay AdjustmentAreas of Localized Roughness DeductionTotal Pay Adjustment + Areas of Localized Roughness Deduction
Data Checked BySignature
File Name(s) YYMMDD-T-N-D-L-B-E (1) YYMMDD-T-N-D-L-B-E (2) YYMMDD-T-N-D-L-B-E (3)
25-Jan-2016 2016 Concrete Profile Summary
Smoothness EquationPosted Vehicle Speed
85+8489+00
26+2831+5636+8437+5075+2880+56
This is a sample worksheet.
80+5685+84
$3,814.41
$4,489.41-$675.00
10+5615+00
528528316
SignatureData Entered By
Date Measured
T.H./CSAHLane Description
70+0075+28
Areas of Localized Roughness (ALR)
Additional Information
175.0 ≤ ALR < 225.0 (linear ft)ALR ≥ 225.0 (linear ft)
52852844452852852866
+
528
Beginning Station End Station Segment Length (ft) Segment Pay AdjustmentFinal Smoothness (in/mi)
S.P./S.A.P.
+15+00
Section 1 Section 3
Sample THMainline: lane 2
70+0089+00
Sample SP
5+2810+5621+0026+2831+5636+84
5+28
2016 Version Page 19 of 19
Related Documents