Suppl Table SI. Metabolite contents of pericarp samples taken from immature green fruits (22-25 DPA). Normalised to the wild type fold difference values are presented as mean ± SE of determinations from six independent samples, those determined by the t-test to be significantly different from wild type are set in bold type WT antiGSA 4 antiGSA 8 Amino acids Alanine 1. 00 0. 17 1. 39 0. 28 0. 72 0. 25 Asparagine 1. 00 0. 12 1. 16 0. 32 0. 99 0. 37 Aspartate 1. 00 0. 10 4. 64 0. 10 2. 66 0. 17 Beta-alanine 1. 00 0. 19 1. 09 0. 17 0. 70 0. 33 GABA 1. 00 0. 18 1. 08 0. 16 0. 87 0. 33 Glutamate 1. 00 0. 19 1. 14 0. 33 0. 70 0. 28 Glutamine 1. 00 0. 19 0. 82 0. 29 0. 54 0. 30 Glycine 1. 00 0. 15 1. 24 0. 21 1. 20 0. 26 Isoleucine 1. 00 0. 21 1. 40 0. 32 1. 21 0. 40 Leucine 1. 00 0. 24 1. 16 0. 29 0. 83 0. 42 Lysine 1. 00 0. 19 0. 81 0. 30 0. 83 0. 55 Methionine 1. 00 0. 14 1. 26 0. 23 1. 11 0. 34 Phenylalanine 1. 00 0. 22 1. 24 0. 22 0. 64 0. 38 Proline 1. 00 0. 21 1. 11 0. 16 0. 93 0. 27 Serine 1. 00 0. 09 1. 48 0. 22 1. 32 0. 28 Threonine 1. 00 0. 16 1. 03 0. 17 1. 14 0. 38 Tyrosine 1. 00 0. 14 1. 06 0. 18 0. 88 0. 40 Valine 1. 00 0. 17 1. 24 0. 23 1. 23 0. 36 Organic acids 1

Welcome message from author
This document is posted to help you gain knowledge. Please leave a comment to let me know what you think about it! Share it to your friends and learn new things together.
Transcript

Suppl Table SI. Metabolite contents of pericarp samples taken from immature green
fruits (22-25 DPA). Normalised to the wild type fold difference values are presented
as mean ± SE of determinations from six independent samples, those determined by
the t-test to be significantly different from wild type are set in bold type
WT antiGSA4 antiGSA8Amino acidsAlanine 1.0
0 0.1
71.39
0.28
0.72
0.25
Asparagine 1.00
0.12
1.16
0.32
0.99
0.37
Aspartate 1.00
0.10
4.64
0.10
2.66
0.17
Beta-alanine 1.00
0.19
1.09
0.17
0.70
0.33
GABA 1.00
0.18
1.08
0.16
0.87
0.33
Glutamate 1.00
0.19
1.14
0.33
0.70
0.28
Glutamine 1.00
0.19
0.82
0.29
0.54
0.30
Glycine 1.00
0.15
1.24
0.21
1.20
0.26
Isoleucine 1.00
0.21
1.40
0.32
1.21
0.40
Leucine 1.00
0.24
1.16
0.29
0.83
0.42
Lysine 1.00
0.19
0.81
0.30
0.83
0.55
Methionine 1.00
0.14
1.26
0.23
1.11
0.34
Phenylalanine 1.00
0.22
1.24
0.22
0.64
0.38
Proline 1.00
0.21
1.11
0.16
0.93
0.27
Serine 1.00
0.09
1.48
0.22
1.32
0.28
Threonine 1.00
0.16
1.03
0.17
1.14
0.38
Tyrosine 1.00
0.14
1.06
0.18
0.88
0.40
Valine 1.00
0.17
1.24
0.23
1.23
0.36
Organic acidsCitrate 1.0
0 0.1
00.90
0.09
1.17
0.16
Dehydroascorbate 1.00
0.06
1.03
0.10
0.95
0.06
Fumarate 1.00
0.10
0.92
0.06
1.45
0.23
Galacturonate 1.00
0.32
1.04
0.14
0.82
0.23
Malate 1.00
0.10
1.59
0.07
1.29
0.18
Succinate 1.00
0.18
0.74
0.05
0.92
0.09
Threonate 1.00
0.10
0.90
0.03
0.97
0.06
1

OthersBenzoate 1.0
0 0.1
01.21
0.12
1.12
0.11
Fructose 1.00
0.02
0.99
0.01
1.01
0.03
Galactinol 1.00
0.12
0.78
0.08
0.67
0.04
Glucose 1.00
0.02
0.99
0.02
1.04
0.02
Glycerol 1.00
0.07
1.03
0.11
1.07
0.09
Hexadecanoate 1.00
0.03
1.06
0.04
1.04
0.02
Inositol 1.00
0.08
1.11
0.05
1.44
0.15
Octadecanoic acid 1.00
0.02
1.03
0.03
1.01
0.02
Phosphoric acid 1.00
0.11
1.05
0.10
1.02
0.16
Putrescine 1.00
0.13
0.96
0.07
1.05
0.12
Quinate, 3-caffeoyl-, trans- 1.00
0.10
0.79
0.18
0.86
0.14
Sucrose 1.00
0.12
0.78
0.17
0.93
0.14
Urea 1.00
0.09
0.77
0.06
0.87
0.14
2

Suppl Table SII. Significantly altered transcripts of pericarp samples taken from immature green fruits (22-25DPA), line aGSA4. Cut-off 3-fold changes.
TOM2 ID SGN log2 Fold changes DescriptionDown regulated
opLeV0100003178 SGN-U215328 -5.090 34.1 glutathione S-transferase, putativeopLeV0100003541 SGN-U228980 -3.154 8.9 unknownopLeV0100002010 SGN-U226185 -3.102 8.6 unknownopLeV0100002789 SGN-U222105 -2.906 7.5 unknownopLeV0100009763 L39279 -2.566 5.9 glutamate-1-semialdehyde 2,1-aminomutase 1 (GSA 1)opLeV0100003434 SGN-U215474 -2.411 5.3 glutamate-1-semialdehyde 2,1-aminomutase 1 (GSA 1)opLeV0100006717 SGN-U213668 -2.379 5.2 BURP domain-containing protein, polygalacturonase, cell wall degredation; fruit softeningopLeV0100004108 SGN-U215329 -2.183 4.5 glutathione S-transferase, putativeopLeV0100004421 SGN-U219963 -2.085 4.2 DNA repair;DNA-3-methyladenine glycosylase I activityopLeV0100000299 SGN-U213431 -1.821 3.5 cytochrome P450 72A1, CYPLXXII, secologanin synthase, monooxygenaseopLeV0100010759 SGN-U231320 -1.792 3.5 transcription factor, homeobox, BEL1, DNA transcription; transcriptional regulationopLeV01C0000016 SGN-U213363 -1.684 3.2 unknownopLeV0100011496 SGN-U213187 -1.579 3.0 pectin methylesterase, putative, cell wall.pectin*esterases.PMEopLeV0100004772 SGN-U213363 -1.576 3.0 unknownopLeV0100009117 SGN-U226976 -1.559 2.9 ubiquitin-conjugating enzyme, putative, ubiquitin-conjugating enzyme E2opLeV0100004321 SGN-U217210 -1.478 2.8 zinc finger (C2H2 type) family protein, RNA.regulation of transcription.C2H2 zinc finger family
opLeV0100008243 SGN-U213790 -1.415 2.7basic endochitinase, chitinase (endo-), acidic, 26 kD, cell wall; cell wall protein; defense responsess
opLeV0100008172 SGN-U212621 -1.404 2.6AMP-dependent synthetase and ligase family protein, acyl-CoA synthetase, fatty acid biosynthesis
opLeV0100009734 SGN-U218586 -1.399 2.6 calmodulin-related protein, putative, signalling.calciumopLeV0100009709 SGN-U218305 -1.386 2.6 1-phosphatidylinositol phosphodiesterase-related, lipid degradation.lysophospholipasesopLeV0100003621 SGN-U212876 -1.370 2.6 protease inhibitor type II, CEVI57, protein degredation; protease inhibitoropLeV0100000339 SGN-U212845 -1.337 2.5 unknownopLeV0100008684 SGN-U222358 -1.336 2.5 kinase, serine/threonine kinase, signal transduction; phosphorylation; unknownopLeV0100009239 SGN-U212847 -1.328 2.5 elongation factor 1-alpha, EF-1, alpha, protein biosynthesis; peptide chain elongation
Up regulatedopLeV0100009418 SGN-U230999 2.340 5.1 ATP synthase CF0 A chain, PS.lightreaction.ATP synthaseopLeV0100008436 SGN-U213489 2.179 4.5 protochlorophyllide reductase B, chloroplastopLeV0100011617 SGN-U222903 2.013 4.0 arginine/serine-rich splicing factor SC35, glutamate permease; glutamate transport
3

opLeV0100003464 SGN-U214192 1.788 3.5 omega-6 fatty acid desaturase, endoplasmic reticulum (FAD2)opLeV0100000194 SGN-U218283 1.650 3.1 SKP1 interacting partner 3-related, lectin, phloem-specific lectinopLeV0100002614 SGN-U213218 1.563 3.0 no apical meristem (NAM) family protein, transcription factor, NAC domainopLeV0100005186 SGN-U213488 1.584 3.0 protochlorophyllide reductase B, chloroplastopLeV0100008005 SGN-U212570 1.560 2.9 photosystem I reaction center subunit VI, chloroplast, putativeopLeV0100001770 SGN-U240424 1.506 2.8 nodulin MtN3 family protein; development.unspecifiedopLeV0100000322 SGN-U216443 1.432 2.7 membrane transport; membrane protein; glutamate permease; glutamate transport; unknownopLeV0100008911 SGN-U213070 1.445 2.7 12S seed storage protein (CRA1); globulin, 11SopLeV0100010455 SGN-U214486 1.445 2.7 serine decarboxylase; histidine catabolism; histamine biosynthesis; ripening relatedopLeV0100009813 SGN-U213785 1.362 2.6 receptor-like protein kinase 4, putative; serine/threonine receptor kinaseopLeV0100005210 SGN-U213301 1.340 2.5 chlorophyll A-B binding protein; PS.lightreaction.photosystem I.LHC-I
4

Suppl Table SIII. Significantly altered transcripts of pericarp samples taken from immature green fruits (22-25DPA), line aGSA8. Cut-off 3-fold changes.
TOM ID SGN log2 Fold changes DescriptionDown regulated
opLeV0100003178 SGN-U215328 -5.734 53.2 glutathione S-transferase T3, putativeopLeV0100009763 L39279 -3.546 11.7 glutamate-1-semialdehyde 2,1-aminomutase 1 (GSA 1)opLeV0100003434 SGN-U215474 -3.368 10.3 glutamate-1-semialdehyde 2,1-aminomutase 1 (GSA 1)opLeV0100002789 SGN-U222105 -2.784 6.9 unknownopLeV0100002010 SGN-U226185 -2.657 6.3 unknownopLeV0100006717 SGN-U213668 -2.559 5.9 BURP domain-containing protein, polygalacturonase, cell wall degredation; fruit softeningopLeV0100003541 SGN-U228980 -2.324 5.0 unknownopLeV0100011604 SGN-U212922 -2.296 4.9 pathogenesis-related protein, ethylene-induced, defense responses; senescenceopLeV0100010369 SGN-U219412 -2.201 4.6 thylakoid membrane one helix protein (OHP), PS.lightreaction.photosystem IIopLeV0100000499 SGN-U212696 -1.965 3.9 23.6 kDa mitochondrial small heat shock protein (HSP23.6-M)opLeV0100006726 BT012912 -1.887 3.7 RNA.regulation of transcription.MYB-related transcription factor family, unknownopLeV0100008850 SGN-U215385 -1.876 3.7 peroxidase 12 (PER12) (P12) (PRXR6), cellulose and pectin-containing cell wallopLeV0100004108 SGN-U215329 -1.812 3.5 glutathione S-transferase, putativeopLeV0100000299 SGN-U213431 -1.706 3.3 cytochrome P450 72A1, CYPLXXII, secologanin synthase, monooxygenaseopLeV0100009043 SGN-U217418 -1.687 3.2 heat shock protein 81-1 (HSP81-1)opLeV0100011496 SGN-U213187 -1.599 3.0 pectin methylesterase, putative, cell wall.pectin*esterases.PMEopLeV0100004421 SGN-U219963 -1.513 2.9 DNA repair; DNA-3-methyladenine glycosylase I activityopLeV0100003157 SGN-U212665 -1.447 2.7 kinase, calcium-dependent protein kinase, signal transduction; CDPK; calcium signalingopLeV0100007302 SGN-U213680 -1.405 2.6 unknownopLeV0100005772 SGN-U216469 -1.378 2.6 17.6 kDa class II heat shock protein (HSP17.6-CII)opLeV0100008764 SGN-U226517 -1.376 2.6 Bet v I allergen family protein, molecular_function_unknown; nucleusopLeV0100001707 U72396 -1.326 2.5 stress.abiotic.heat, unknown
Up regulatedopLeV0100008761 SGN-U213016 2.912 7.5 serine-type protease inhibitor, response to wounding or fungusopLeV0100009813 SGN-U213785 2.559 5.9 receptor-like protein kinase 4, putative; serine/threonine receptor kinaseopLeV0100000194 SGN-U218283 2.536 5.8 SKP1 interacting partner 3-related, lectin, phloem-specific lectinopLeV0100000853 X51904 2.275 4.8 unknownopLeV0100004133 SGN-U213338 2.196 4.6 trypsin and protease inhibitor family protein, mitochondrion;endopeptidase inhibitor activityopLeV0100000545 SGN-U213120 2.180 4.5 oxidoreductase, 2OG-Fe(II) oxygenase family protein, unknownopLeV0100003599 SGN-U219846 2.140 4.4 DNAJ heat shock N-terminal domain-containing protein, protein folding
5

opLeV0100008820 SGN-U218282 2.143 4.4 SKP1 interacting partner 3-related, lectin, phloem-specific lectinopLeV0100009119 SGN-U213772 2.110 4.3 ribonuclease T2 family protein, RNA.processing.ribonucleasesopLeV0100003464 SGN-U214192 2.063 4.2 omega-6 fatty acid desaturase, endoplasmic reticulum (FAD2)opLeV0100010319 SGN-U213295 1.971 3.9 C2 domain-containing protein, molecular_function_unknown;biological_process_unknownopLeV0100001040 SGN-U226043 1.853 3.6 aspartate-glutamate racemase family, racemase and epimerase activityopLeV0100004368 SGN-U215259 1.759 3.4 heat shock transcription factor family protein, RNA.regulation of transcriptionopLeV0100006200 SGN-U230985 1.765 3.4 glutaredoxin family proteinopLeV0100011500 SGN-U215067 1.672 3.2 inositol polyphosphate 5-phosphatase II (IP5PII)opLeV0100010455 SGN-U214486 1.619 3.1 serine decarboxylase; histidine catabolism; histamine biosynthesis; ripening relatedopLeV0100007279 SGN-U213854 1.629 3.1 nodulin MtN3 family protein, biological_process_unknown; membraneopLeV0100009414 SGN-U223492 1.644 3.1 F-box family protein (FKF1), circadian rhythm; ubiquitin-protein ligase activityopLeV0100007413 SGN-U231481 1.652 3.1 DEAD/DEAH box helicase, putative, ATP-dependent helicase activityopLeV0100007412 SGN-U226639 1.609 3.0 cysteine protease, papain-like (XBCP3), protein degredation; thiol proteaseopLeV0100001629 SGN-U223591 1.523 2.9 In2-1 protein, putative, glutathione transferase activity; metabolic process; cytoplasmopLeV0100004216 SGN-U214560 1.533 2.9 unknownopLeV0100002467 SGN-U214470 1.479 2.8 hydrolase, alpha/beta fold family proteinopLeV0100010950 SGN-U215748 1.487 2.8 expansin-related, elastin, cell structure; structural protein; extracellular matrixopLeV0100007141 SGN-U219218 1.434 2.7 cysteine protease, papain-like (XBCP3)opLeV0100009734 SGN-U218586 1.362 2.6 calmodulin-related protein, putative, signalling.calciumopLeV0100009863 SGN-U214471 1.369 2.6 unknownopLeV0100008436 SGN-U213489 1.390 2.6 protochlorophyllide reductase B, chloroplast
6

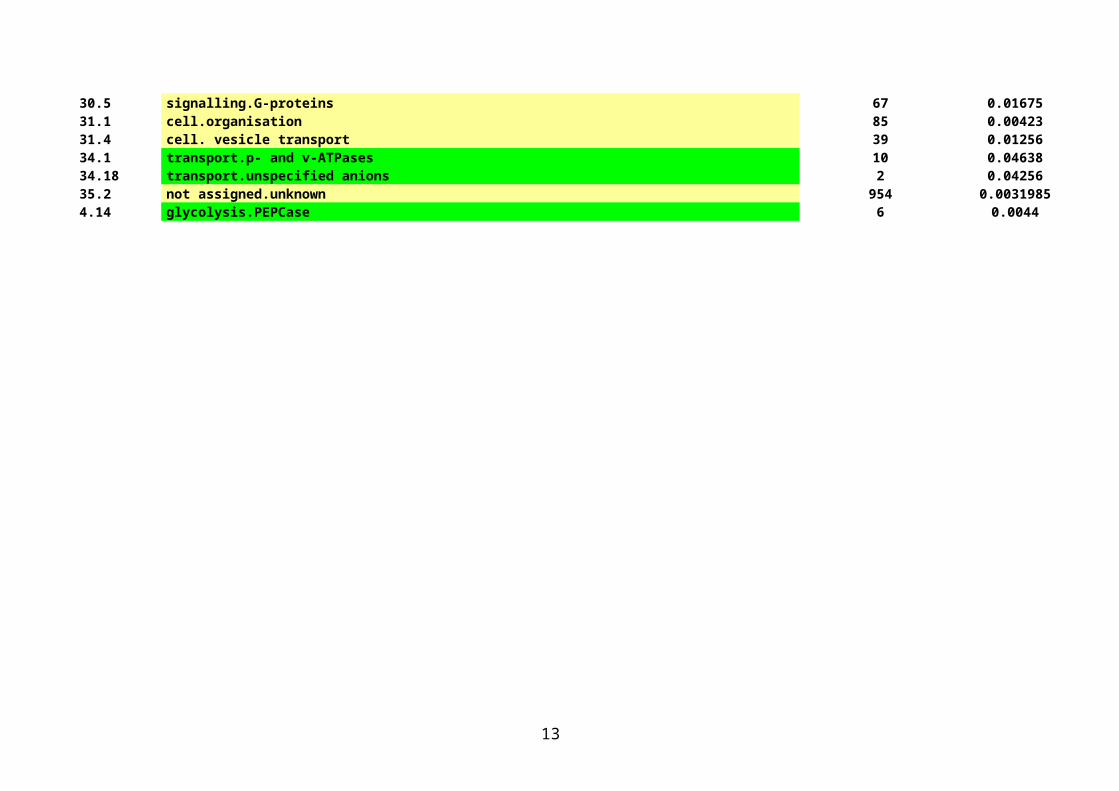
Suppl Table SIV. Wilcoxon rank sum test for transcripts of pericarp samples taken from immature green fruits (22-25DPA), line aGSA4. Bins assignement see MapMan description. Highlighted bins are those with significantly altered transcripts: green – down regulated, red – up regulated, yellow – both up and down.
Bin ID Bin name Number of elements P-value1.1.1.1 PS.lightreaction.photosystem II.LHC-II 14 7.82E-051.1.1.2 PS.lightreaction.photosystem II.PSII polypeptide subunits 15 4.86E-051.1.2 PS.lightreaction.photosystem I 21 3.83E-101.1.2.1 PS.lightreaction.photosystem I.LHC-I 9 2.55E-041.1.2.2 PS.lightreaction.photosystem I.PSI polypeptide subunits 12 3.30E-071.1.3 PS.lightreaction.cytochrome b6/f 2 0.0490681.1.4 PS.lightreaction.ATP synthase 7 2.08E-041.3.2 PS.calvin cyle.rubisco small subunit 5 4.66E-0410.1.6 cell wall.precursor synthesis.GAE 2 0.0307710.2 cell wall.cellulose synthesis 10 0.0353810.2.1 cell wall.cellulose synthesis.cellulose synthase 5 0.0140510.6.3 cell wall.degradation.pectate lyases and polygalacturonases 8 0.0151810.7 cell wall.modification 11 0.010834411.8.1 lipid metabolism.exotics (steroids, squalene etc).sphingolipids 7 0.0357313.1.2 amino acid metabolism.synthesis.glutamate family 4 0.0486113.1.2.3 amino acid metabolism.synthesis.glutamate family.arginine 3 0.04215413.1.3.4 amino acid metabolism.synthesis.aspartate family.methionine 9 0.0037813.1.3.4.11 amino acid metabolism.synthesis.aspartate family.methionine.S-adenosylmethionine synthetase 6 0.00260823113.2.6 amino acid metabolism.degradation.aromatic aa 8 0.0132913.2.6.3 amino acid metabolism.degradation.aromatic aa.tryptophan 7 0.0378916.1 secondary metabolism.isoprenoids 45 0.03608316.2.1.6 secondary metabolism.phenylpropanoids.lignin biosynthesis.CCoAOMT 2 0.0194917.2.1 hormone metabolism.auxin.synthesis-degradation 8 0.0298519.14 tetrapyrrole synthesis.protochlorophyllide reductase 3 0.005640219.20 tetrapyrrole synthesis.ferrochelatase 3 0.0429719.3 tetrapyrrole synthesis.GSA 2 0.0145219.30 tetrapyrrole synthesis.urogen III methylase 2 0.0145220.1 stress.biotic 41 0.0053120.1.1 stress.biotic.respiratory burst 2 0.04681220.2.4 stress.abiotic.touch/wounding 8 0.024833
7

22.1 polyamine metabolism.synthesis 17 0.0280926.10 misc.cytochrome P450 39 0.0248326.22 misc.short chain dehydrogenase/reductase (SDR) 15 0.04175126.3 misc.gluco-, galacto- and mannosidases 16 0.0286727.3.22 RNA.regulation of transcription.HB,Homeobox transcription factor family 13 0.00256666727.3.23 RNA.regulation of transcription.HSF,Heat-shock transcription factor family 8 0.003157327.3.26 RNA.regulation of transcription.MYB-related transcription factor family 9 0.0378927.3.29 RNA.regulation of transcription.TCP transcription factor family 4 0.039427.3.54 RNA.regulation of transcription.Histone acetyltransferases 5 0.0336727.3.65 RNA.regulation of transcription.Polycomb Group (PcG) 2 0.0353827.3.66 RNA.regulation of transcription.Psudo ARR transcription factor family 2 0.02382229.2.1.1 protein.synthesis.mito/plastid ribosomal protein.plastid 19 2.32E-0729.2.1.99 protein.synthesis.chloroplast/mito - plastid ribosomal protein.unknown 8 0.002997529.2.2 protein.synthesis.misc ribososomal protein 154 3.42E-0629.3.4.99 protein.targeting.secretory pathway.unspecified 22 0.003229.4 protein.postranslational modification 140 0.0063829.5.11.1 protein.degradation.ubiquitin.ubiquitin 18 0.0134429.5.11.20 protein.degradation.ubiquitin.proteasom 26 0.0027729.5.11.4.3.3 protein.degradation.ubiquitin.E3.SCF.cullin 7 0.0243229.5.4 protein.degradation.aspartate protease 7 0.0233329.5.7 protein.degradation.metalloprotease 10 0.01928429.6 protein.folding 24 0.01621729.8 protein assembly and cofactor ligation 7 0.04681230.2.17 signalling.receptor kinases.DUF 26 4 0.02099930.3 signalling.calcium 65 2.50E-0430.5 signalling.G-proteins 67 0.0167531.1 cell.organisation 85 0.0042331.4 cell. vesicle transport 39 0.0125634.1 transport.p- and v-ATPases 10 0.0463834.18 transport.unspecified anions 2 0.0425635.2 not assigned.unknown 954 0.00319854.14 glycolysis.PEPCase 6 0.0044
8

Suppl Table SV. Wilcoxon rank sum test for transcripts of pericarp samples taken from immature green fruits (22-25DPA), line aGSA8. Bins assignement see MapMan description. Highlighted bins are those with significantly altered transcripts: green – down regulated, red – up regulated, yellow – both up and down.
Bin ID Bin name Number of elements P-value1.1.4 PS.lightreaction.ATP synthase 7 0.02931.1.40 PS.lightreaction.cyclic electron flow-chlororespiration 2 0.02811.2.2 PS.photorespiration.glycolate oxydase 5 0.00651.3.13 PS.calvin cyle.rubisco interacting 6 0.00201.3.7 PS.calvin cyle.FBPase 4 0.021910.1.6 cell wall.precursor synthesis.GAE 2 0.049510.2.1 cell wall.cellulose synthesis.cellulose synthase 5 0.036410.5.2 cell wall.cell wall proteins.proline rich proteins 2 0.053411.3.1 lipid metabolism.Phospholipid synthesis.1-acylglycerol-3-phosphate O-acyltransferase 3 0.050012.3.1 N-metabolism.N-degradation.glutamate dehydrogenase 3 0.050513.1.1.1.1 amino acid metabolism.synthesis.central amino acid metabolism.GABA.Glutamate decarboxylase 3 0.022113.1.2.3 amino acid metabolism.synthesis.glutamate family.arginine 3 0.048213.1.6 amino acid metabolism.synthesis.aromatic aa 22 0.051416.1 secondary metabolism.isoprenoids 45 0.027516.2.1.6 secondary metabolism.phenylpropanoids.lignin biosynthesis.CCoAOMT 2 0.018516.8 secondary metabolism.flavonoids 22 0.018917.2.3 hormone metabolism.auxin.induced-regulated-responsive-activated 26 0.011017.6.3 hormone metabolism.gibberelin.induced-regulated-responsive-activated 2 0.024618.3.2 Co-factor and vitamine metabolism.riboflavin.riboflavin synthase 2 0.031719.14 tetrapyrrole synthesis.protochlorophyllide reductase 3 0.026119.20 tetrapyrrole synthesis.ferrochelatase 3 0.027019.3 tetrapyrrole synthesis.GSA 2 0.01452.2.1.4 major CHO metabolism.degradation.sucrose.hexokinase 2 0.03792.2.2.2 major CHO metabolism.degradation.starch.starch phosphorylase 4 0.040620.1.1 stress.biotic.respiratory burst 2 0.018920.2.1 stress.abiotic.heat 61 0.000020.2.2 stress.abiotic.cold 7 0.048221 redox.regulation 96 0.050521.2 redox.ascorbate and glutathione 36 0.011521.4 redox.glutaredoxins 11 0.0168
9

22.1.3 polyamine metabolism.synthesis.arginine decarboxylase 3 0.007623 nucleotide metabolism 47 0.006723.1.3 nucleotide metabolism.synthesis.PRS-PP 4 0.020126.21 misc.protease inhibitor/seed storage/lipid transfer protein (LTP) family protein 7 0.046826.22 misc.short chain dehydrogenase/reductase (SDR) 15 0.026127.1 RNA.processing 66 0.011327.1.20 RNA.processing.degradation dicer 4 0.014927.3.23 RNA.regulation of transcription.HSF,Heat-shock transcription factor family 8 0.021227.3.40 RNA.regulation of transcription.Aux/IAA family 6 0.025428.1 DNA.synthesis/chromatin structure 60 0.002728.1.3 DNA.synthesis/chromatin structure.histone 31 0.000029.1 protein.aa activation 22 0.005829.2.1.1 protein.synthesis.mito/plastid ribosomal protein.plastid 19 0.007929.2.1.99 protein.synthesis.chloroplast/mito - plastid ribosomal protein.unknown 8 0.005129.2.2 protein.synthesis.misc ribososomal protein 154 0.011529.5 protein.degradation 296 0.041729.5.11.1 protein.degradation.ubiquitin.ubiquitin 18 0.051429.5.11.20 protein.degradation.ubiquitin.proteasom 26 0.025129.5.11.4.3.3 protein.degradation.ubiquitin.E3.SCF.cullin 7 0.025329.5.3 protein.degradation.cysteine protease 15 0.04303.2 minor CHO metabolism.trehalose 4 0.051430.10 signalling.phosphorelay 3 0.045530.11 signalling.light, both, more down 30 0.004530.2.24 signalling.receptor kinases.S-locus glycoprotein like 4 0.006830.2.8.2 signalling.receptor kinases.leucine rich repeat VIII-2 3 0.021931.1 cell.organisation 85 0.004634.19.1 transport.Major Intrinsic Proteins.PIP 8 0.036834.8 transport.metabolite transporters at the envelope membrane 5 0.033034.9 transport.metabolite transporters at the mitochondrial membrane 18 0.01404.14 glycolysis.PEPCase 6 0.04308.1.3 TCA / org. transformation.TCA.aconitase 2 0.02848.3 TCA / org. transformation.carbonic anhydrases 3 0.0446
10

Suppl Table SI. Metabolite contents of pericarp samples taken from immature green
fruits (22-25 DPA). Normalised to the wild type fold difference values are presented
as mean ± SE of determinations from six independent samples, those determined by
the t-test to be significantly different from wild type are set in bold type
WT antiGSA4 antiGSA8Amino acidsAlanine 1.0
0 0.1
71.39
0.28
0.72
0.25
Asparagine 1.00
0.12
1.16
0.32
0.99
0.37
Aspartate 1.00
0.10
4.64
0.10
2.66
0.17
Beta-alanine 1.00
0.19
1.09
0.17
0.70
0.33
GABA 1.00
0.18
1.08
0.16
0.87
0.33
Glutamate 1.00
0.19
1.14
0.33
0.70
0.28
Glutamine 1.00
0.19
0.82
0.29
0.54
0.30
Glycine 1.00
0.15
1.24
0.21
1.20
0.26
Isoleucine 1.00
0.21
1.40
0.32
1.21
0.40
Leucine 1.00
0.24
1.16
0.29
0.83
0.42
Lysine 1.00
0.19
0.81
0.30
0.83
0.55
Methionine 1.00
0.14
1.26
0.23
1.11
0.34
Phenylalanine 1.00
0.22
1.24
0.22
0.64
0.38
Proline 1.00
0.21
1.11
0.16
0.93
0.27
Serine 1.00
0.09
1.48
0.22
1.32
0.28
Threonine 1.00
0.16
1.03
0.17
1.14
0.38
Tyrosine 1.00
0.14
1.06
0.18
0.88
0.40
Valine 1.00
0.17
1.24
0.23
1.23
0.36
Organic acidsCitrate 1.0
0 0.1
00.90
0.09
1.17
0.16
Dehydroascorbate 1.00
0.06
1.03
0.10
0.95
0.06
Fumarate 1.00
0.10
0.92
0.06
1.45
0.23
Galacturonate 1.00
0.32
1.04
0.14
0.82
0.23
Malate 1.00
0.10
1.59
0.07
1.29
0.18
Succinate 1.00
0.18
0.74
0.05
0.92
0.09
Threonate 1.0 0.1 0.9 0.0 0.9 0.0
11

0 0 0 3 7 6OthersBenzoate 1.0
0 0.1
01.21
0.12
1.12
0.11
Fructose 1.00
0.02
0.99
0.01
1.01
0.03
Galactinol 1.00
0.12
0.78
0.08
0.67
0.04
Glucose 1.00
0.02
0.99
0.02
1.04
0.02
Glycerol 1.00
0.07
1.03
0.11
1.07
0.09
Hexadecanoate 1.00
0.03
1.06
0.04
1.04
0.02
Inositol 1.00
0.08
1.11
0.05
1.44
0.15
Octadecanoic acid 1.00
0.02
1.03
0.03
1.01
0.02
Phosphoric acid 1.00
0.11
1.05
0.10
1.02
0.16
Putrescine 1.00
0.13
0.96
0.07
1.05
0.12
Quinate, 3-caffeoyl-, trans- 1.00
0.10
0.79
0.18
0.86
0.14
Sucrose 1.00
0.12
0.78
0.17
0.93
0.14
Urea 1.00
0.09
0.77
0.06
0.87
0.14
12
Suppl Table SII. Significantly altered transcripts of pericarp samples taken from immature green fruits (22-25DPA), line aGSA4. Cut-off 3-fold changes.
TOM2 ID SGN log2 Fold changes DescriptionDown regulated
opLeV0100003178 SGN-U215328 -5.090 34.1 glutathione S-transferase, putativeopLeV0100003541 SGN-U228980 -3.154 8.9 unknownopLeV0100002010 SGN-U226185 -3.102 8.6 unknownopLeV0100002789 SGN-U222105 -2.906 7.5 unknownopLeV0100009763 L39279 -2.566 5.9 glutamate-1-semialdehyde 2,1-aminomutase 1 (GSA 1)opLeV0100003434 SGN-U215474 -2.411 5.3 glutamate-1-semialdehyde 2,1-aminomutase 1 (GSA 1)opLeV0100006717 SGN-U213668 -2.379 5.2 BURP domain-containing protein, polygalacturonase, cell wall degredation; fruit softeningopLeV0100004108 SGN-U215329 -2.183 4.5 glutathione S-transferase, putativeopLeV0100004421 SGN-U219963 -2.085 4.2 DNA repair;DNA-3-methyladenine glycosylase I activityopLeV0100000299 SGN-U213431 -1.821 3.5 cytochrome P450 72A1, CYPLXXII, secologanin synthase, monooxygenaseopLeV0100010759 SGN-U231320 -1.792 3.5 transcription factor, homeobox, BEL1, DNA transcription; transcriptional regulationopLeV01C0000016 SGN-U213363 -1.684 3.2 unknownopLeV0100011496 SGN-U213187 -1.579 3.0 pectin methylesterase, putative, cell wall.pectin*esterases.PMEopLeV0100004772 SGN-U213363 -1.576 3.0 unknownopLeV0100009117 SGN-U226976 -1.559 2.9 ubiquitin-conjugating enzyme, putative, ubiquitin-conjugating enzyme E2opLeV0100004321 SGN-U217210 -1.478 2.8 zinc finger (C2H2 type) family protein, RNA.regulation of transcription.C2H2 zinc finger family
opLeV0100008243 SGN-U213790 -1.415 2.7basic endochitinase, chitinase (endo-), acidic, 26 kD, cell wall; cell wall protein; defense responsess
opLeV0100008172 SGN-U212621 -1.404 2.6AMP-dependent synthetase and ligase family protein, acyl-CoA synthetase, fatty acid biosynthesis
opLeV0100009734 SGN-U218586 -1.399 2.6 calmodulin-related protein, putative, signalling.calciumopLeV0100009709 SGN-U218305 -1.386 2.6 1-phosphatidylinositol phosphodiesterase-related, lipid degradation.lysophospholipasesopLeV0100003621 SGN-U212876 -1.370 2.6 protease inhibitor type II, CEVI57, protein degredation; protease inhibitoropLeV0100000339 SGN-U212845 -1.337 2.5 unknownopLeV0100008684 SGN-U222358 -1.336 2.5 kinase, serine/threonine kinase, signal transduction; phosphorylation; unknownopLeV0100009239 SGN-U212847 -1.328 2.5 elongation factor 1-alpha, EF-1, alpha, protein biosynthesis; peptide chain elongation
Up regulatedopLeV0100009418 SGN-U230999 2.340 5.1 ATP synthase CF0 A chain, PS.lightreaction.ATP synthaseopLeV0100008436 SGN-U213489 2.179 4.5 protochlorophyllide reductase B, chloroplastopLeV0100011617 SGN-U222903 2.013 4.0 arginine/serine-rich splicing factor SC35, glutamate permease; glutamate transport
13

opLeV0100003464 SGN-U214192 1.788 3.5 omega-6 fatty acid desaturase, endoplasmic reticulum (FAD2)opLeV0100000194 SGN-U218283 1.650 3.1 SKP1 interacting partner 3-related, lectin, phloem-specific lectinopLeV0100002614 SGN-U213218 1.563 3.0 no apical meristem (NAM) family protein, transcription factor, NAC domainopLeV0100005186 SGN-U213488 1.584 3.0 protochlorophyllide reductase B, chloroplastopLeV0100008005 SGN-U212570 1.560 2.9 photosystem I reaction center subunit VI, chloroplast, putativeopLeV0100001770 SGN-U240424 1.506 2.8 nodulin MtN3 family protein; development.unspecifiedopLeV0100000322 SGN-U216443 1.432 2.7 membrane transport; membrane protein; glutamate permease; glutamate transport; unknownopLeV0100008911 SGN-U213070 1.445 2.7 12S seed storage protein (CRA1); globulin, 11SopLeV0100010455 SGN-U214486 1.445 2.7 serine decarboxylase; histidine catabolism; histamine biosynthesis; ripening relatedopLeV0100009813 SGN-U213785 1.362 2.6 receptor-like protein kinase 4, putative; serine/threonine receptor kinaseopLeV0100005210 SGN-U213301 1.340 2.5 chlorophyll A-B binding protein; PS.lightreaction.photosystem I.LHC-I
14

Suppl Table SIII. Significantly altered transcripts of pericarp samples taken from immature green fruits (22-25DPA), line aGSA8. Cut-off 3-fold changes.
TOM ID SGN log2 Fold changes DescriptionDown regulated
opLeV0100003178 SGN-U215328 -5.734 53.2 glutathione S-transferase T3, putativeopLeV0100009763 L39279 -3.546 11.7 glutamate-1-semialdehyde 2,1-aminomutase 1 (GSA 1)opLeV0100003434 SGN-U215474 -3.368 10.3 glutamate-1-semialdehyde 2,1-aminomutase 1 (GSA 1)opLeV0100002789 SGN-U222105 -2.784 6.9 unknownopLeV0100002010 SGN-U226185 -2.657 6.3 unknownopLeV0100006717 SGN-U213668 -2.559 5.9 BURP domain-containing protein, polygalacturonase, cell wall degredation; fruit softeningopLeV0100003541 SGN-U228980 -2.324 5.0 unknownopLeV0100011604 SGN-U212922 -2.296 4.9 pathogenesis-related protein, ethylene-induced, defense responses; senescenceopLeV0100010369 SGN-U219412 -2.201 4.6 thylakoid membrane one helix protein (OHP), PS.lightreaction.photosystem IIopLeV0100000499 SGN-U212696 -1.965 3.9 23.6 kDa mitochondrial small heat shock protein (HSP23.6-M)opLeV0100006726 BT012912 -1.887 3.7 RNA.regulation of transcription.MYB-related transcription factor family, unknownopLeV0100008850 SGN-U215385 -1.876 3.7 peroxidase 12 (PER12) (P12) (PRXR6), cellulose and pectin-containing cell wallopLeV0100004108 SGN-U215329 -1.812 3.5 glutathione S-transferase, putativeopLeV0100000299 SGN-U213431 -1.706 3.3 cytochrome P450 72A1, CYPLXXII, secologanin synthase, monooxygenaseopLeV0100009043 SGN-U217418 -1.687 3.2 heat shock protein 81-1 (HSP81-1)opLeV0100011496 SGN-U213187 -1.599 3.0 pectin methylesterase, putative, cell wall.pectin*esterases.PMEopLeV0100004421 SGN-U219963 -1.513 2.9 DNA repair; DNA-3-methyladenine glycosylase I activityopLeV0100003157 SGN-U212665 -1.447 2.7 kinase, calcium-dependent protein kinase, signal transduction; CDPK; calcium signalingopLeV0100007302 SGN-U213680 -1.405 2.6 unknownopLeV0100005772 SGN-U216469 -1.378 2.6 17.6 kDa class II heat shock protein (HSP17.6-CII)opLeV0100008764 SGN-U226517 -1.376 2.6 Bet v I allergen family protein, molecular_function_unknown; nucleusopLeV0100001707 U72396 -1.326 2.5 stress.abiotic.heat, unknown
Up regulatedopLeV0100008761 SGN-U213016 2.912 7.5 serine-type protease inhibitor, response to wounding or fungusopLeV0100009813 SGN-U213785 2.559 5.9 receptor-like protein kinase 4, putative; serine/threonine receptor kinaseopLeV0100000194 SGN-U218283 2.536 5.8 SKP1 interacting partner 3-related, lectin, phloem-specific lectinopLeV0100000853 X51904 2.275 4.8 unknownopLeV0100004133 SGN-U213338 2.196 4.6 trypsin and protease inhibitor family protein, mitochondrion;endopeptidase inhibitor activityopLeV0100000545 SGN-U213120 2.180 4.5 oxidoreductase, 2OG-Fe(II) oxygenase family protein, unknownopLeV0100003599 SGN-U219846 2.140 4.4 DNAJ heat shock N-terminal domain-containing protein, protein folding
15

opLeV0100008820 SGN-U218282 2.143 4.4 SKP1 interacting partner 3-related, lectin, phloem-specific lectinopLeV0100009119 SGN-U213772 2.110 4.3 ribonuclease T2 family protein, RNA.processing.ribonucleasesopLeV0100003464 SGN-U214192 2.063 4.2 omega-6 fatty acid desaturase, endoplasmic reticulum (FAD2)opLeV0100010319 SGN-U213295 1.971 3.9 C2 domain-containing protein, molecular_function_unknown;biological_process_unknownopLeV0100001040 SGN-U226043 1.853 3.6 aspartate-glutamate racemase family, racemase and epimerase activityopLeV0100004368 SGN-U215259 1.759 3.4 heat shock transcription factor family protein, RNA.regulation of transcriptionopLeV0100006200 SGN-U230985 1.765 3.4 glutaredoxin family proteinopLeV0100011500 SGN-U215067 1.672 3.2 inositol polyphosphate 5-phosphatase II (IP5PII)opLeV0100010455 SGN-U214486 1.619 3.1 serine decarboxylase; histidine catabolism; histamine biosynthesis; ripening relatedopLeV0100007279 SGN-U213854 1.629 3.1 nodulin MtN3 family protein, biological_process_unknown; membraneopLeV0100009414 SGN-U223492 1.644 3.1 F-box family protein (FKF1), circadian rhythm; ubiquitin-protein ligase activityopLeV0100007413 SGN-U231481 1.652 3.1 DEAD/DEAH box helicase, putative, ATP-dependent helicase activityopLeV0100007412 SGN-U226639 1.609 3.0 cysteine protease, papain-like (XBCP3), protein degredation; thiol proteaseopLeV0100001629 SGN-U223591 1.523 2.9 In2-1 protein, putative, glutathione transferase activity; metabolic process; cytoplasmopLeV0100004216 SGN-U214560 1.533 2.9 unknownopLeV0100002467 SGN-U214470 1.479 2.8 hydrolase, alpha/beta fold family proteinopLeV0100010950 SGN-U215748 1.487 2.8 expansin-related, elastin, cell structure; structural protein; extracellular matrixopLeV0100007141 SGN-U219218 1.434 2.7 cysteine protease, papain-like (XBCP3)opLeV0100009734 SGN-U218586 1.362 2.6 calmodulin-related protein, putative, signalling.calciumopLeV0100009863 SGN-U214471 1.369 2.6 unknownopLeV0100008436 SGN-U213489 1.390 2.6 protochlorophyllide reductase B, chloroplast
16

Suppl Table SIV. Wilcoxon rank sum test for transcripts of pericarp samples taken from immature green fruits (22-25DPA), line aGSA4. Bins assignement see MapMan description. Highlighted bins are those with significantly altered transcripts: green – down regulated, red – up regulated, yellow – both up and down.
Bin ID Bin name Number of elements P-value1.1.1.1 PS.lightreaction.photosystem II.LHC-II 14 7.82E-051.1.1.2 PS.lightreaction.photosystem II.PSII polypeptide subunits 15 4.86E-051.1.2 PS.lightreaction.photosystem I 21 3.83E-101.1.2.1 PS.lightreaction.photosystem I.LHC-I 9 2.55E-041.1.2.2 PS.lightreaction.photosystem I.PSI polypeptide subunits 12 3.30E-071.1.3 PS.lightreaction.cytochrome b6/f 2 0.0490681.1.4 PS.lightreaction.ATP synthase 7 2.08E-041.3.2 PS.calvin cyle.rubisco small subunit 5 4.66E-0410.1.6 cell wall.precursor synthesis.GAE 2 0.0307710.2 cell wall.cellulose synthesis 10 0.0353810.2.1 cell wall.cellulose synthesis.cellulose synthase 5 0.0140510.6.3 cell wall.degradation.pectate lyases and polygalacturonases 8 0.0151810.7 cell wall.modification 11 0.010834411.8.1 lipid metabolism.exotics (steroids, squalene etc).sphingolipids 7 0.0357313.1.2 amino acid metabolism.synthesis.glutamate family 4 0.0486113.1.2.3 amino acid metabolism.synthesis.glutamate family.arginine 3 0.04215413.1.3.4 amino acid metabolism.synthesis.aspartate family.methionine 9 0.0037813.1.3.4.11 amino acid metabolism.synthesis.aspartate family.methionine.S-adenosylmethionine synthetase 6 0.00260823113.2.6 amino acid metabolism.degradation.aromatic aa 8 0.0132913.2.6.3 amino acid metabolism.degradation.aromatic aa.tryptophan 7 0.0378916.1 secondary metabolism.isoprenoids 45 0.03608316.2.1.6 secondary metabolism.phenylpropanoids.lignin biosynthesis.CCoAOMT 2 0.0194917.2.1 hormone metabolism.auxin.synthesis-degradation 8 0.0298519.14 tetrapyrrole synthesis.protochlorophyllide reductase 3 0.005640219.20 tetrapyrrole synthesis.ferrochelatase 3 0.0429719.3 tetrapyrrole synthesis.GSA 2 0.0145219.30 tetrapyrrole synthesis.urogen III methylase 2 0.0145220.1 stress.biotic 41 0.0053120.1.1 stress.biotic.respiratory burst 2 0.04681220.2.4 stress.abiotic.touch/wounding 8 0.024833
17

22.1 polyamine metabolism.synthesis 17 0.0280926.10 misc.cytochrome P450 39 0.0248326.22 misc.short chain dehydrogenase/reductase (SDR) 15 0.04175126.3 misc.gluco-, galacto- and mannosidases 16 0.0286727.3.22 RNA.regulation of transcription.HB,Homeobox transcription factor family 13 0.00256666727.3.23 RNA.regulation of transcription.HSF,Heat-shock transcription factor family 8 0.003157327.3.26 RNA.regulation of transcription.MYB-related transcription factor family 9 0.0378927.3.29 RNA.regulation of transcription.TCP transcription factor family 4 0.039427.3.54 RNA.regulation of transcription.Histone acetyltransferases 5 0.0336727.3.65 RNA.regulation of transcription.Polycomb Group (PcG) 2 0.0353827.3.66 RNA.regulation of transcription.Psudo ARR transcription factor family 2 0.02382229.2.1.1 protein.synthesis.mito/plastid ribosomal protein.plastid 19 2.32E-0729.2.1.99 protein.synthesis.chloroplast/mito - plastid ribosomal protein.unknown 8 0.002997529.2.2 protein.synthesis.misc ribososomal protein 154 3.42E-0629.3.4.99 protein.targeting.secretory pathway.unspecified 22 0.003229.4 protein.postranslational modification 140 0.0063829.5.11.1 protein.degradation.ubiquitin.ubiquitin 18 0.0134429.5.11.20 protein.degradation.ubiquitin.proteasom 26 0.0027729.5.11.4.3.3 protein.degradation.ubiquitin.E3.SCF.cullin 7 0.0243229.5.4 protein.degradation.aspartate protease 7 0.0233329.5.7 protein.degradation.metalloprotease 10 0.01928429.6 protein.folding 24 0.01621729.8 protein assembly and cofactor ligation 7 0.04681230.2.17 signalling.receptor kinases.DUF 26 4 0.02099930.3 signalling.calcium 65 2.50E-0430.5 signalling.G-proteins 67 0.0167531.1 cell.organisation 85 0.0042331.4 cell. vesicle transport 39 0.0125634.1 transport.p- and v-ATPases 10 0.0463834.18 transport.unspecified anions 2 0.0425635.2 not assigned.unknown 954 0.00319854.14 glycolysis.PEPCase 6 0.0044
18

Suppl Table SV. Wilcoxon rank sum test for transcripts of pericarp samples taken from immature green fruits (22-25DPA), line aGSA8. Bins assignement see MapMan description. Highlighted bins are those with significantly altered transcripts: green – down regulated, red – up regulated, yellow – both up and down.
Bin ID Bin name Number of elements P-value1.1.4 PS.lightreaction.ATP synthase 7 0.02931.1.40 PS.lightreaction.cyclic electron flow-chlororespiration 2 0.02811.2.2 PS.photorespiration.glycolate oxydase 5 0.00651.3.13 PS.calvin cyle.rubisco interacting 6 0.00201.3.7 PS.calvin cyle.FBPase 4 0.021910.1.6 cell wall.precursor synthesis.GAE 2 0.049510.2.1 cell wall.cellulose synthesis.cellulose synthase 5 0.036410.5.2 cell wall.cell wall proteins.proline rich proteins 2 0.053411.3.1 lipid metabolism.Phospholipid synthesis.1-acylglycerol-3-phosphate O-acyltransferase 3 0.050012.3.1 N-metabolism.N-degradation.glutamate dehydrogenase 3 0.050513.1.1.1.1 amino acid metabolism.synthesis.central amino acid metabolism.GABA.Glutamate decarboxylase 3 0.022113.1.2.3 amino acid metabolism.synthesis.glutamate family.arginine 3 0.048213.1.6 amino acid metabolism.synthesis.aromatic aa 22 0.051416.1 secondary metabolism.isoprenoids 45 0.027516.2.1.6 secondary metabolism.phenylpropanoids.lignin biosynthesis.CCoAOMT 2 0.018516.8 secondary metabolism.flavonoids 22 0.018917.2.3 hormone metabolism.auxin.induced-regulated-responsive-activated 26 0.011017.6.3 hormone metabolism.gibberelin.induced-regulated-responsive-activated 2 0.024618.3.2 Co-factor and vitamine metabolism.riboflavin.riboflavin synthase 2 0.031719.14 tetrapyrrole synthesis.protochlorophyllide reductase 3 0.026119.20 tetrapyrrole synthesis.ferrochelatase 3 0.027019.3 tetrapyrrole synthesis.GSA 2 0.01452.2.1.4 major CHO metabolism.degradation.sucrose.hexokinase 2 0.03792.2.2.2 major CHO metabolism.degradation.starch.starch phosphorylase 4 0.040620.1.1 stress.biotic.respiratory burst 2 0.018920.2.1 stress.abiotic.heat 61 0.000020.2.2 stress.abiotic.cold 7 0.048221 redox.regulation 96 0.050521.2 redox.ascorbate and glutathione 36 0.011521.4 redox.glutaredoxins 11 0.0168
19

22.1.3 polyamine metabolism.synthesis.arginine decarboxylase 3 0.007623 nucleotide metabolism 47 0.006723.1.3 nucleotide metabolism.synthesis.PRS-PP 4 0.020126.21 misc.protease inhibitor/seed storage/lipid transfer protein (LTP) family protein 7 0.046826.22 misc.short chain dehydrogenase/reductase (SDR) 15 0.026127.1 RNA.processing 66 0.011327.1.20 RNA.processing.degradation dicer 4 0.014927.3.23 RNA.regulation of transcription.HSF,Heat-shock transcription factor family 8 0.021227.3.40 RNA.regulation of transcription.Aux/IAA family 6 0.025428.1 DNA.synthesis/chromatin structure 60 0.002728.1.3 DNA.synthesis/chromatin structure.histone 31 0.000029.1 protein.aa activation 22 0.005829.2.1.1 protein.synthesis.mito/plastid ribosomal protein.plastid 19 0.007929.2.1.99 protein.synthesis.chloroplast/mito - plastid ribosomal protein.unknown 8 0.005129.2.2 protein.synthesis.misc ribososomal protein 154 0.011529.5 protein.degradation 296 0.041729.5.11.1 protein.degradation.ubiquitin.ubiquitin 18 0.051429.5.11.20 protein.degradation.ubiquitin.proteasom 26 0.025129.5.11.4.3.3 protein.degradation.ubiquitin.E3.SCF.cullin 7 0.025329.5.3 protein.degradation.cysteine protease 15 0.04303.2 minor CHO metabolism.trehalose 4 0.051430.10 signalling.phosphorelay 3 0.045530.11 signalling.light, both, more down 30 0.004530.2.24 signalling.receptor kinases.S-locus glycoprotein like 4 0.006830.2.8.2 signalling.receptor kinases.leucine rich repeat VIII-2 3 0.021931.1 cell.organisation 85 0.004634.19.1 transport.Major Intrinsic Proteins.PIP 8 0.036834.8 transport.metabolite transporters at the envelope membrane 5 0.033034.9 transport.metabolite transporters at the mitochondrial membrane 18 0.01404.14 glycolysis.PEPCase 6 0.04308.1.3 TCA / org. transformation.TCA.aconitase 2 0.02848.3 TCA / org. transformation.carbonic anhydrases 3 0.0446
20

21
Related Documents