Running Head: Technical Business Report Technical Business Report-Enterprise Information Management Systems Thomas Ortiz Bus 4200 Enterprise Management Information Systems Instructor: Dr. Rodney Heisterberg August 13, 2017 1

Welcome message from author
This document is posted to help you gain knowledge. Please leave a comment to let me know what you think about it! Share it to your friends and learn new things together.
Transcript

Running Head: Technical Business Report
Technical Business Report-Enterprise Information Management Systems
Thomas Ortiz
Bus 4200 Enterprise Management Information Systems
Instructor: Dr. Rodney Heisterberg
August 13, 2017
1
Technical Business Report
Introduction
Information Technology has created a new world for business to operate in. A business
can no longer afford to stay within its physical infrastructure of a brick and mortar building.
Cloud technology, big data, social, mobility, and video are a few of the tool leading to the
change in the new digital world. Using these tools businesses have adopted and adjsted their
business model to become customer centric. A customer centric business model is where a
business focuses on a positive customer experience prior, during, and after a transition. A
positive experience will lead to repeat customers and customer loyalty (MacDonald 2017).
A business must leverage Information Technology and tools created by cloud based
software developers in order to stay competitive. The following areas will be covered within the
sections below: understanding Web 2.0, background information on a business ecosystem, trends
with in a business ecosystem, core functions of an enterprise information management systems,
business intelligence and analytics, collaborative marketing campaign management, and use of
social media. By covering the sections listed the technical paper is intended to translate
theoretical research on enterprise information management systems into specific implications for
general business ecosystem management issues and concerns.
Web 2.0
Web 2.0 can be defined as the second generation of the World Wide Web. This new
generation allows websites to move from static pages to dynamic user generated content. Web
2.0 is built on the idea that focuses on collaboration and sharing. Characteristic of Web2.0 are
listed below (Baltzan 2015).
Content sharing through open sourcing User contributed content Collaboration inside an organization Collaboration outside and organization
2

Technical Business Report
In the pasts businesses were only capable with one-way communication via the web, now
communication can happen live through chat, instant messaging and even video. Web 2.0 has
also opened the door for business to participate on social media and become part of a customer’s
“network”. In a later section the benefits and effects of social media will discussed.
Business Ecosystem
Before the advancement of the internet businesses used IT for internal tasks and limited
functions. As the internet has advanced the term collaborative commerce was created to describe
business that used technology for internal and external use to grow and strengthen relationships
(Chen, Zhang, Zhou, 2007). The top five information technology trends used by collaborative
commerce include cloud, big data, social, mobility, and video. Through the growth of these
trends businesses began to use the internet to make business transactions with external users,
these businesses are now known as E- Commerce.
A business ecosystem is a group of organizations connected through a common product,
service or industry. An ecosystem may include but not limited to suppliers, distributers,
customers and competitors (Investopedia). Members of the ecosystem interact through
competition and cooperation which allow the ecosystem to stay agile and strengthen over time.
Collaborative commerce or C-Commerce within an ecosystem use the internet and cloud
technology to create business agility with the hopes of becoming efficient, cutting down costs
and lead times while increasing profits (Heisterberg & Verma 2014). To get a visual
understanding of components within a business ecosystem see Figure 1, as shown there are many
layers within an ecosystem.
3

Technical Business Report
Figure 1:
Business Ecosystem
Trends in a business Ecosystem
In the attempt to gain a competitive advantage C-Commerce need to capitalize on the
technology advancement avalible in the market place and must be willing to stay agile by
adapting to new technology as it becomes available. As information technology has advanced
members of a business ecosystem must adjust. The problem then arises “How do C-Commerce
trend drive enterprise management systems development, implantation and operations” within an
ecosystem. In the previous section the history and definition of an ecosystem was explored. In
this section we will examine how managers responded the problems, what were the lessons
learned from the problem and the impact they have on an ecosystem.
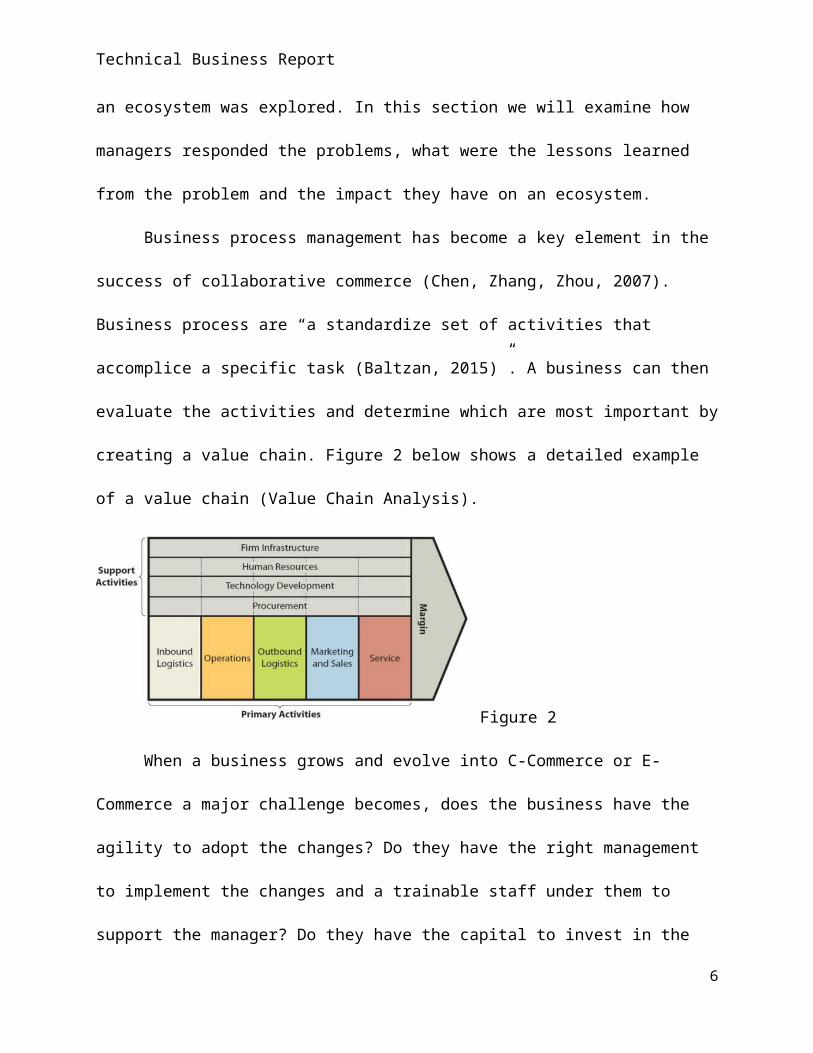
Business process management has become a key element in the success of collaborative
commerce (Chen, Zhang, Zhou, 2007). Business process are “a standardize set of activities that
accomplice a specific task (Baltzan, 2015)”. A business can then evaluate the activities and
4

Technical Business Report
determine which are most important by creating a value chain. Figure 2 below shows a detailed
example of a value chain (Value Chain Analysis).
Figure 2
When a business grows and evolve into C-Commerce or E-Commerce a major challenge
becomes, does the business have the agility to adopt the changes? Do they have the right
management to implement the changes and a trainable staff under them to support the manager?
Do they have the capital to invest in the tools such as software or training for employees? All
these questions must be answered when a company when a business becomes C-Commerce or E-
Commerce because the business must realign its core competencies to fit the new business
model.
In order to be successful C-Commerce must develop a plan to address the top five IT
trends- cloud, big data, social, mobile, and video. New Executive Management positions have
been created to lead the company’s growth in IT. Some examples of the new positions are:
Chief Information Officer Chief Technology Officer Chief Digital Officer
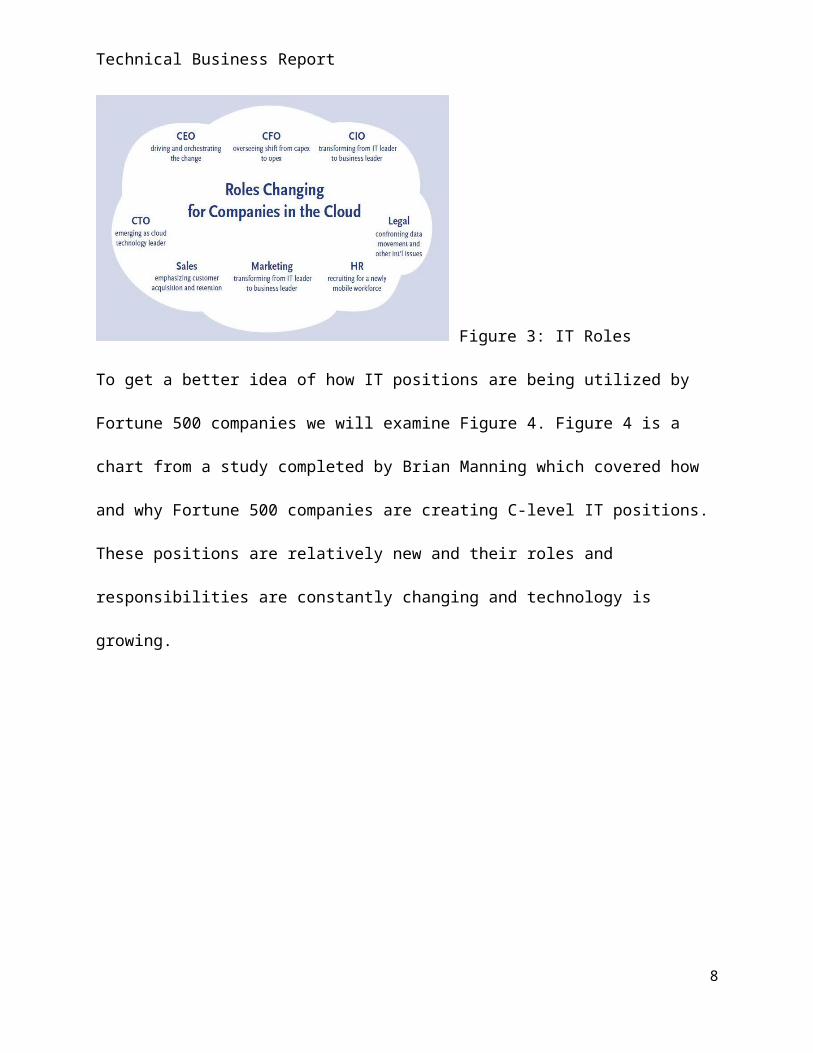
Figure 3 gives a visual example of a cloud based company who has created IT related
departments. As you can see the company has two executive positions that relate to IT (Hancock
2011). This trend is now becoming the norm.
5
Technical Business Report
Figure 3: IT Roles
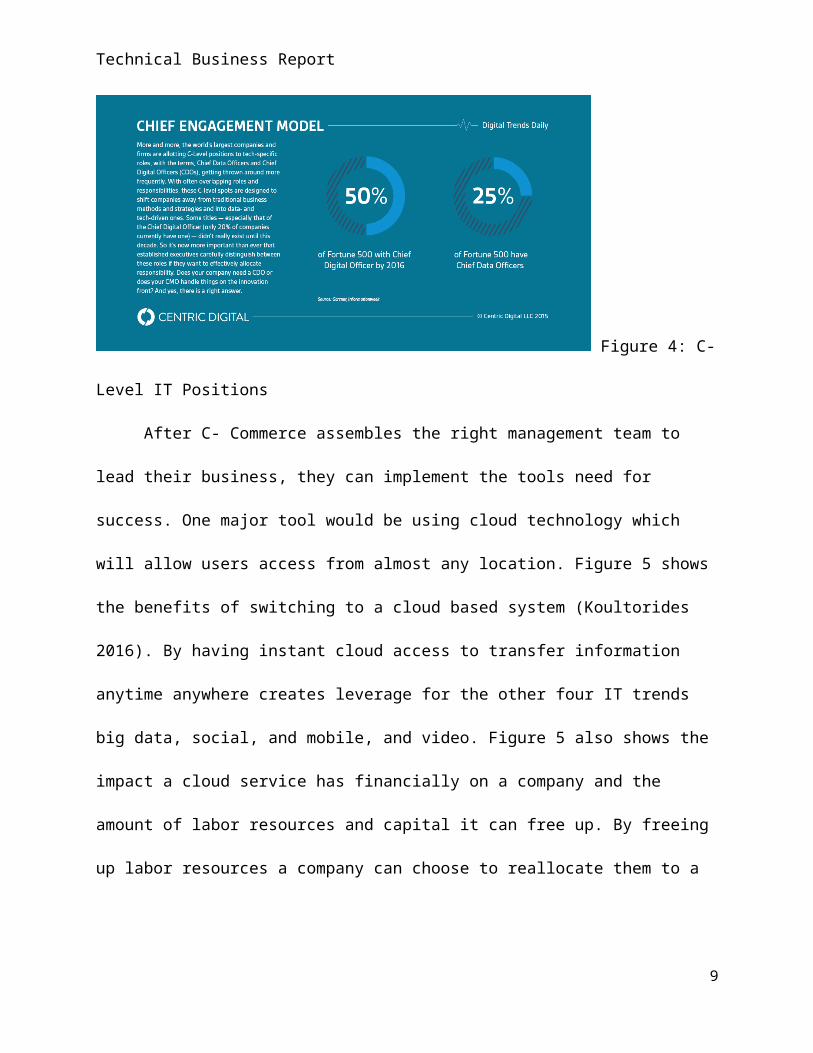
To get a better idea of how IT positions are being utilized by Fortune 500 companies we will
examine Figure 4. Figure 4 is a chart from a study completed by Brian Manning which covered
how and why Fortune 500 companies are creating C-level IT positions. These positions are
relatively new and their roles and responsibilities are constantly changing and technology is
growing.
Figure 4: C-Level
IT Positions
After C- Commerce assembles the right management team to lead their business, they can
implement the tools need for success. One major tool would be using cloud technology which
will allow users access from almost any location. Figure 5 shows the benefits of switching to a
6

Technical Business Report
cloud based system (Koultorides 2016). By having instant cloud access to transfer information
anytime anywhere creates leverage for the other four IT trends big data, social, and mobile, and
video. Figure 5 also shows the impact a cloud service has financially on a company and the
amount of labor resources and capital it can free up. By freeing up labor resources a company
can choose to reallocate them to a new location to improve business process in other areas or
eliminate the positions and save money.
Figure 5: Benefits of Cloud Computing
C-commerce understand it is important to remain agile in order to stay competitive with
in a business ecosystem. They also know an ecosystem needs expand and be able to renew itself
or it could become extinct (Heisterberg & Verma 2014). Competition is healthy for an ecosystem
and can be good for the ecosystem as a whole because it can motivate businesses to look at its
business process and value chain to become more efficient. The effects of the changes can then
be measured by the ability to convert the change in efficient into a reduction in costs or increase
7
Technical Business Report
in profits. Even market leaders should be constantly adjusting their strategy in order to keep their
competitive advantage. They must also find continue new ways to leverage Enterprise
Information Management Systems.
Core Enterprise Information Management Systems
As stated in the previous sections advancement in cloud, social, mobile, video and big
data technology has allowed software development companies to take Enterprise Information
Management Systems (EIMS) to the next level (Heisterberg & Verma, 2014). Gartner, a research
advisory firm that specializes in information technology, defines an Enterprise Information
Management Systems as “an integrative discipline for structuring, describing and governing
information assets across organizational and technological boundaries to improve efficiency,
promote transparency and enable business insight.” Figure 6 from scholarsu.com shows the
information cycle within an Enterprise Information Management System. As we can see from
the Figure 6, information flows from one area to the next highlighting the importance of each
individual function and the importance of collaboration with in the system.
Figure 6: Enterprise Information Management
Businesses investing resources into integrating an EIMS software package understand the
importance of cloud computing. Businesses are using EIMS software package to also create
competitive advantages within their business ecosystem, by leveraging real time data provided
8
Technical Business Report
by the software to make faster and better decisions (Information Resources Management
Association).
An EIMS software package contains three core functions Customer Relations
Management (CRM), Enterprise Resource Planning (ERP), and Supply Chain Management
(SCM). Software developers are responding to the need businesses have for a collaborative cloud
based EIMS. Some developers provide a wide range of packages that cover all three core
functions and others focus on a small niche segment. Businesses have many software options in
the market place and must invest the resources and do their due diligence when finding the right
software to fit their industry, business size, and the needs of the business.
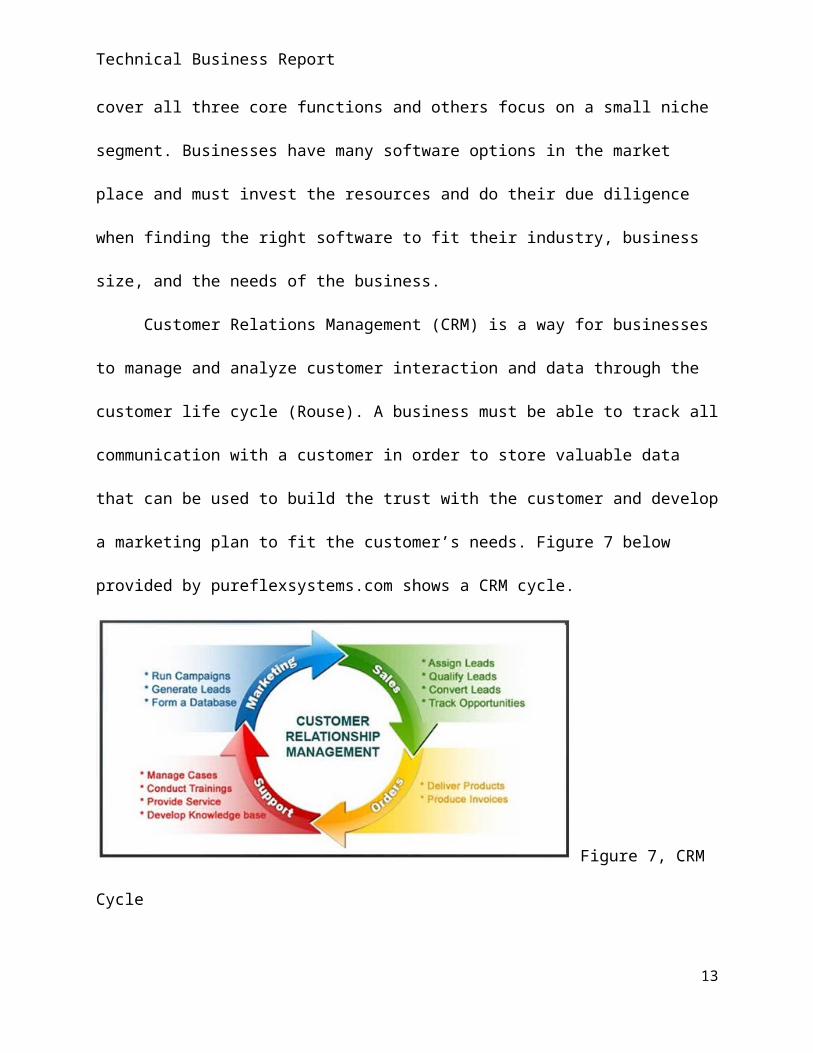
Customer Relations Management (CRM) is a way for businesses to manage and analyze
customer interaction and data through the customer life cycle (Rouse). A business must be able
to track all communication with a customer in order to store valuable data that can be used to
build the trust with the customer and develop a marketing plan to fit the customer’s needs. Figure
7 below provided by pureflexsystems.com shows a CRM cycle.
Figure 7, CRM Cycle
The cycle shows how sales, orders, customer support and marketing are all needed to build a
long-lasting relationship with a customer.
9

Technical Business Report
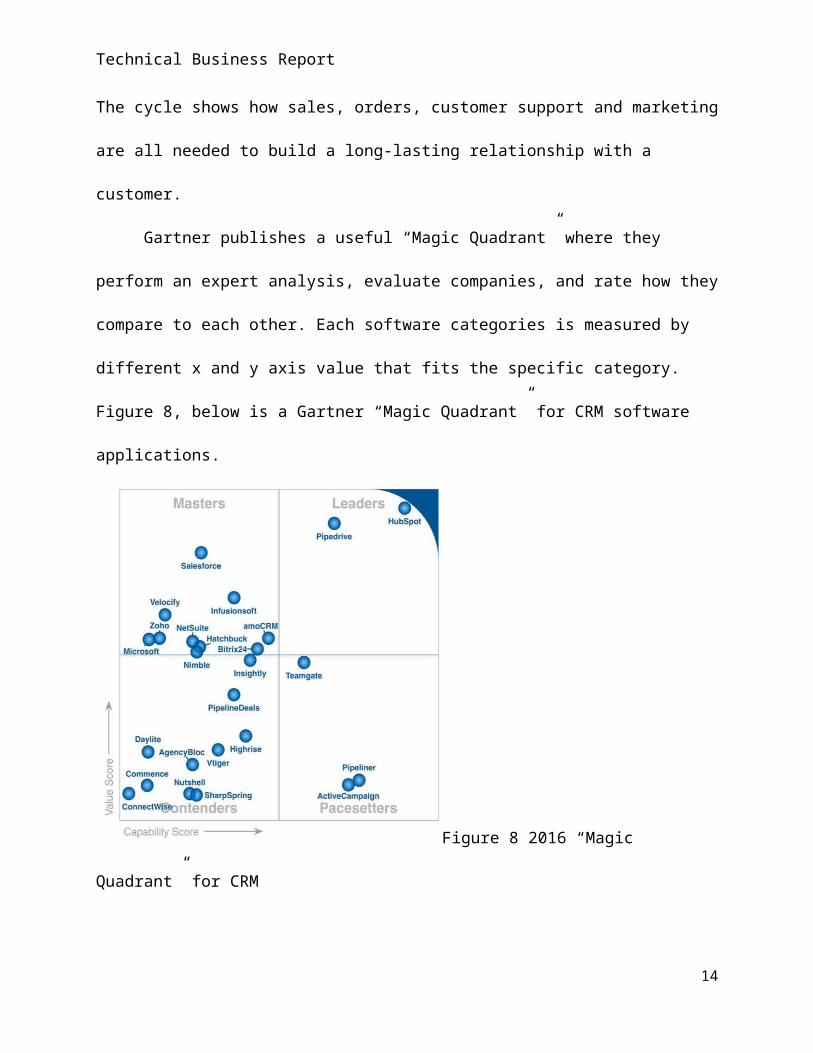
Gartner publishes a useful “Magic Quadrant” where they perform an expert analysis,
evaluate companies, and rate how they compare to each other. Each software categories is
measured by different x and y axis value that fits the specific category. Figure 8, below is a
Gartner “Magic Quadrant” for CRM software applications.
Figure 8 2016 “Magic Quadrant” for CRM
As shown on the graph, each software application is plotted based on their capabilities vs value.
When evaluating CRM software a business should look for the following key features.
Call Logging Contact Management Customer Support Document Management Email Marketing Campaign Management Interaction Tracking Lead Management Lead Scoring List Management Marketing Automation Referral Tracking
These key features will allow users to get the most of out the software package.
10

Technical Business Report
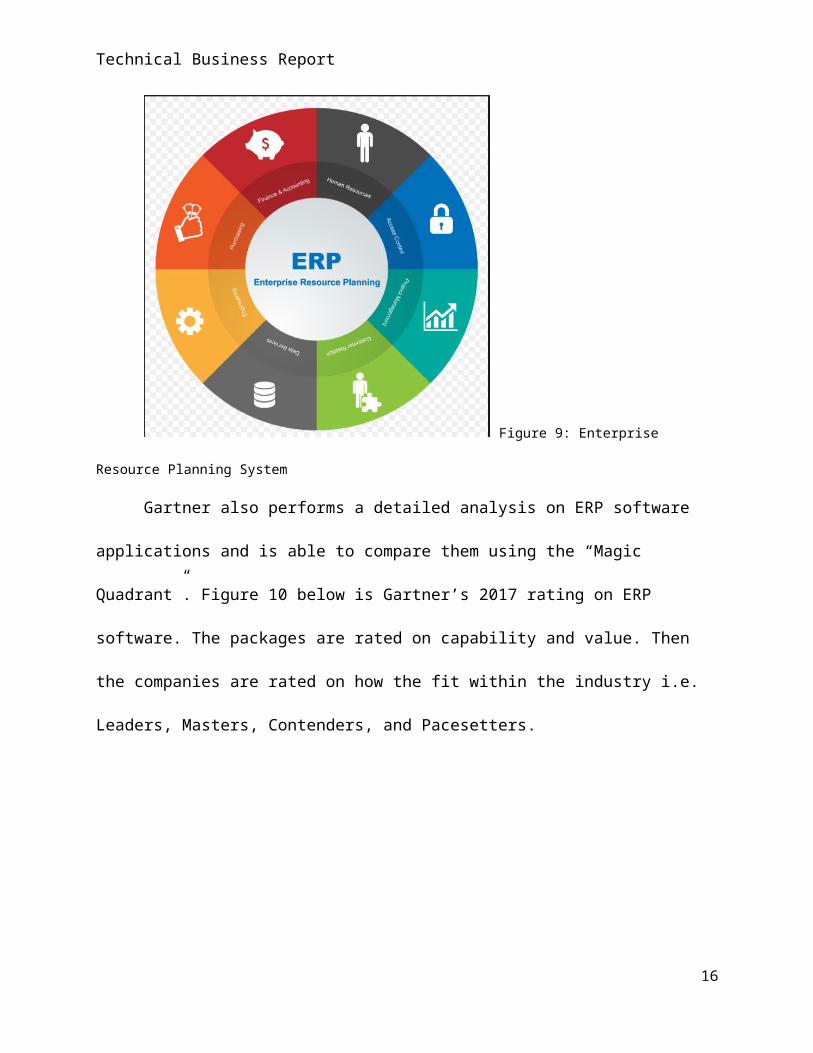
The second core function of an EIMS is an Enterprise Resource Planning (ERP) system.
ERP is software that allows a business to use a system of integrated applications to manage the
back office of a business and business processes. The back office includes Finance and
Accounting, Human Resources, Access Control, Program Management, Customer Relations,
Data Services, Engineering, and Purchasing. Figure 9 below visually shows how all parts of an
ERP system are connected (one point hosting).
Figure 9: Enterprise Resource Planning
System
Gartner also performs a detailed analysis on ERP software applications and is able to
compare them using the “Magic Quadrant”. Figure 10 below is Gartner’s 2017 rating on ERP
software. The packages are rated on capability and value. Then the companies are rated on how
the fit within the industry i.e. Leaders, Masters, Contenders, and Pacesetters.
11

Technical Business Report
Figure10: Gartner 2017 “Magic Quadrant” for ERP
Each of the top companies listed in the “Magic Quadrant” offer many different features
within their packages. When evaluating an ERP system it is importing to ensure that the package
includes core features to maximize the use and performance of the software. Below is a list of the
core features:
Accounting Management CRM Dashboard Distribution Management Enterprise Asset Management Financial Management HR Management Inventory Management Project Management Purchasing Sales Management Warehouse Management
These key futures listed ensure that information business can organize and transfer
information within the company. Getting the right information in the right hand within the
company is needed to stay competitive and reduce waste.
12
Technical Business Report
The third core EIMS function is Supply Chain Management (SCM). Most businesses use
SCM in order to create integration and link information between different functions within a
business. This allows a business to synchronize flow of both information and product to
customers, suppliers, and transportation providers across the supply chain (Baltzan 2015). SCM
helps link Supply/Demand Planning, Logistic Management, Assets Management, Procurement,
and Information Management. SCM also link a business to external users like Suppliers,
Manufacturing, Warehouses, Stores, and Customers.
Data integrity is important in a SCM system the without it a company can experience a
bullwhip effect. The bullwhip effect is when bad data gets loaded in the system which causes
another user with in the system to act on the bad data, causing a chain reaction of wrong actions.
For example if a demand planner loads demand of the wrong part, it can lead a buyer to go out
and buy the wrong part. Buying the wrong part can lead excess inventory and not having the
correct parts to delivery to a customer. Excess inventory leads to a waste in capital and not
delivering to a customer on time can lead to a loss in revenue (Baltzan 2015).
Key features that a SCM software package are: Demand Planning Electronic Data Interchange Import/Export Management Inventory Management Order Management Sales and Operation Planning Shipment Management Supplier Management Transport Management Warehouse Management
The research provided highlights how difficult it can be to implement an EIMS software
application package, due to the many options available in the market place. Managers must allow
time to research and evaluate all possible options. When selecting a package it is important to
13
Technical Business Report
find a solution that will work best for the business. It should also be compatible to work together
with the three core functions of enterprise management: CRM, ERP, and SCM. Having synergy
between the CRM, ERP, and SCM software packages can reduce waste and increase employee
workflow. Providing employees the right tools for the right job gives them a chance to grow and
become more efficient. If a company is considering a new cloud based software package it
should be evaluated by multiple departments within a company and a trail version should be
implements as a test before converting the whole company over.
Business Intelligence and Analytics
To enhance a strong EIMS software package a business should consider integrating a
business intelligence, business analytics, and predictive analytics software package. Adding one
or all thee can increase communication and collaboration within the company along with giving
the business a chance to use data to make better decisions. Collaboration between these three
packages is important to management when making decision at a managerial or strategic level.
Heisterberg & Verma stated “The power of collaborative management and use if collaborative
tools cannot be understated in driving business.” Management must be able to consolidate, drill-
down, and slice-and dice the data that is produced by the EIMS software (Baltzan, 2015).
Business intelligence (BI), business analytics (BA), and predictive analytics (PA)
software offers users the ability to dive deeper into data to help improve process, reduce wastes
and creates a competitive advantage. The ability for a business to visually see data from across
the enterprise can lead to better decision making. Also it allows businesses to reduce risks when
forecasting by making their decisions based on historical data and the ability to spot trends.
Within this section we will explore and identify key functions of BI, BA, and PA software
packages.
14
Technical Business Report
The words “Business intelligence” can be used to characterize products and approaches
aimed at making a desired result a reality. Many of those desired results include securing a
competitive advantage, improving operational efficiency, and increasing profitability (Vitt,
Luckevich & Misner,2002).
Gartner also publishes its “Magic Quadrant” analysis for BI software. Figure 11 was
published by Gartner in February 2017. The “Magic Quadrant” compares software packages by
completeness of version vs. ability to execute. The packages are also measured by where the
developer rates within the ecosystem, the categories for these measurements are: Leader,
Challengers, Visionaries, and Niche Players.
Figure 11: Gartner Magic Quadrant BI 2017
As show in Figure 11 there are many well equipped software packages available in the market. Below is a list of many key features a BI package should include:
Ad hoc Analysis Ad hoc Query Ad Hoc Reports Benchmarking Budgeting & Forecasting Dashboard
15
Technical Business Report
Data Analysis Data Visualization Key Performance Indicators OLAP Performance Metrics Predictive Analytics Profitability Analysis Strategic Planning Trend / Problem Indicator
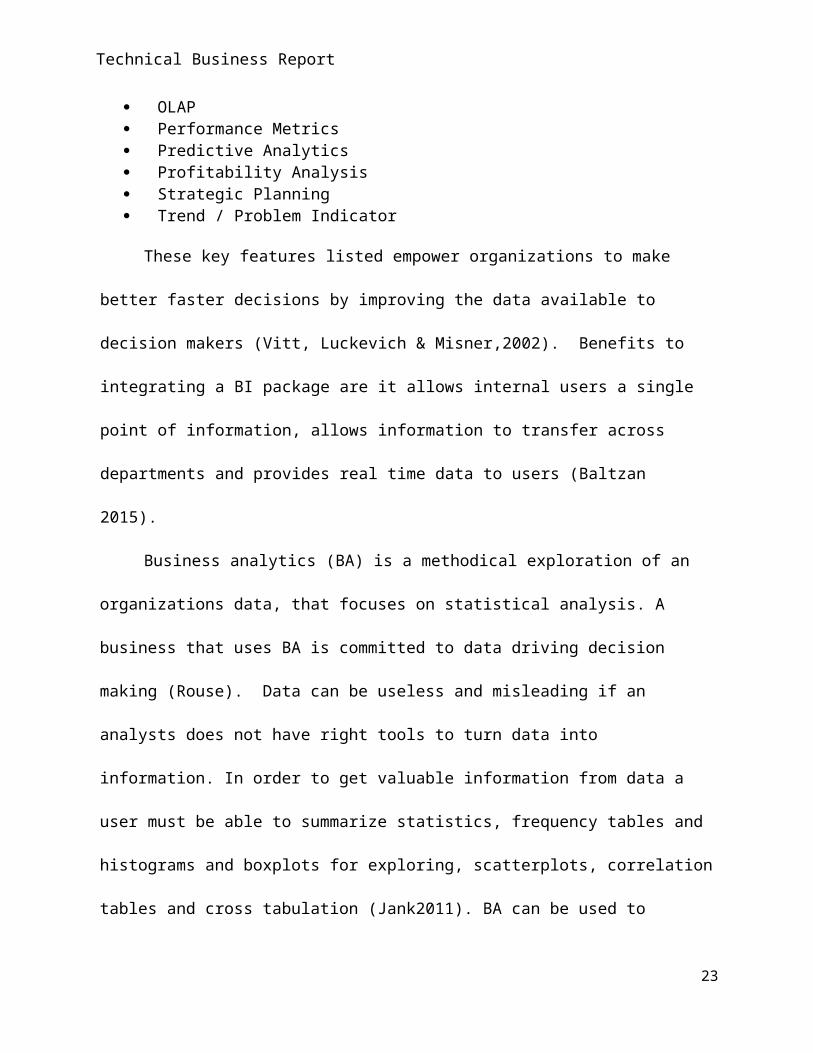
These key features listed empower organizations to make better faster decisions by
improving the data available to decision makers (Vitt, Luckevich & Misner,2002). Benefits to
integrating a BI package are it allows internal users a single point of information, allows
information to transfer across departments and provides real time data to users (Baltzan 2015).
Business analytics (BA) is a methodical exploration of an organizations data, that focuses
on statistical analysis. A business that uses BA is committed to data driving decision making
(Rouse). Data can be useless and misleading if an analysts does not have right tools to turn data
into information. In order to get valuable information from data a user must be able to
summarize statistics, frequency tables and histograms and boxplots for exploring, scatterplots,
correlation tables and cross tabulation (Jank2011). BA can be used to examine internal
processes in order to create efficiency in those processes.
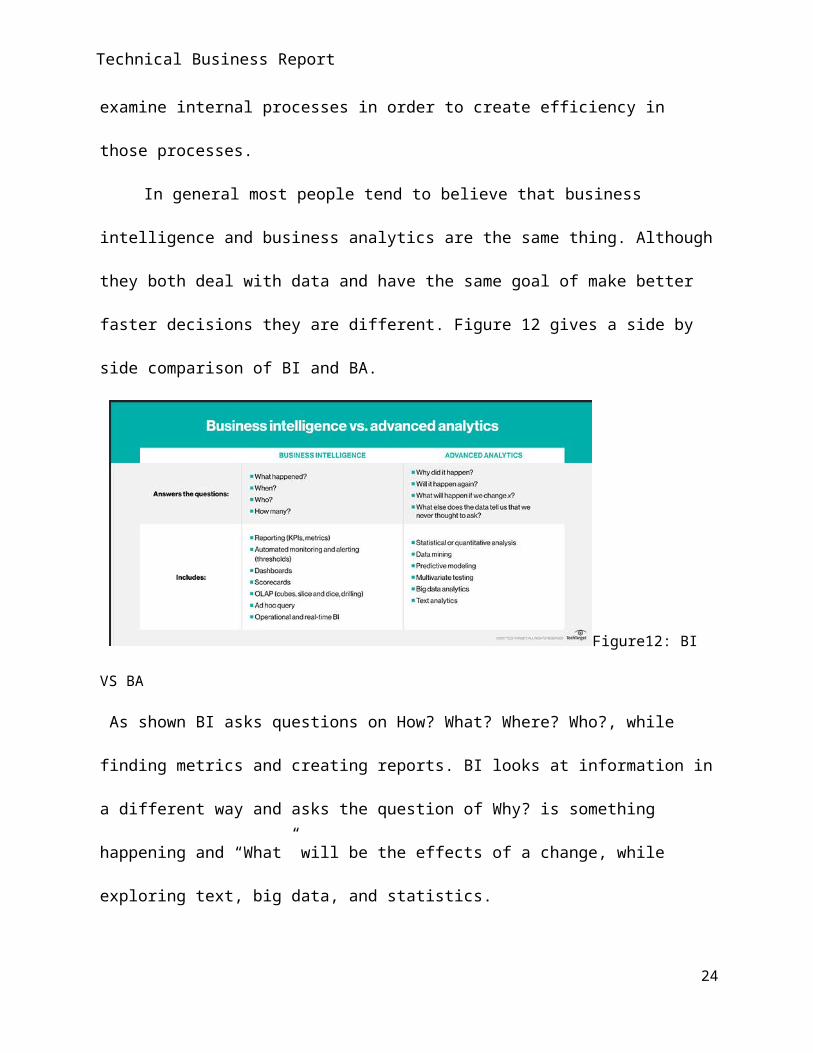
In general most people tend to believe that business intelligence and business analytics
are the same thing. Although they both deal with data and have the same goal of make better
faster decisions they are different. Figure 12 gives a side by side comparison of BI and BA.
16

Technical Business Report
Figure12: BI VS BA
As shown BI asks questions on How? What? Where? Who?, while finding metrics and creating
reports. BI looks at information in a different way and asks the question of Why? is something
happening and “What” will be the effects of a change, while exploring text, big data, and
statistics.
When a business is evaluating BA software packages they should look for the following
key features in order to get the most out of the investment:
Data visualization tools Self-service analytics platforms Statistical analysis tools Big data platforms Mobile Exploration and Authoring Collaboration & Social BI Ease of use to deploy and administer Analytics Dashboards Publishing Analytic Content Embedded Advanced Analytics Governance and Metadata Management Timeliness of Vendor Response Optimize your entire organization: Get customized, interactive business apps tailored to
meet your unique business needs.
By having the above features incorporated with in a software package business can start to turn
data into information.
17

Technical Business Report
Predictive analytics is the art and science of using data to make better informed decisions,
by uncovering hidden patterns and relationships within data. Predictive analytics helps to build
confidence it understanding trends and understand what might happen it the future (Bari,
Chaouchi & Jung 2014). Predictive analytics software takes BI and BA one step further by
allowing uses view predicted future out comes of a given scenario. The main difference between
BI and PA is:
PA- Shows what the future may have instoreBI-What happened and what’s going on
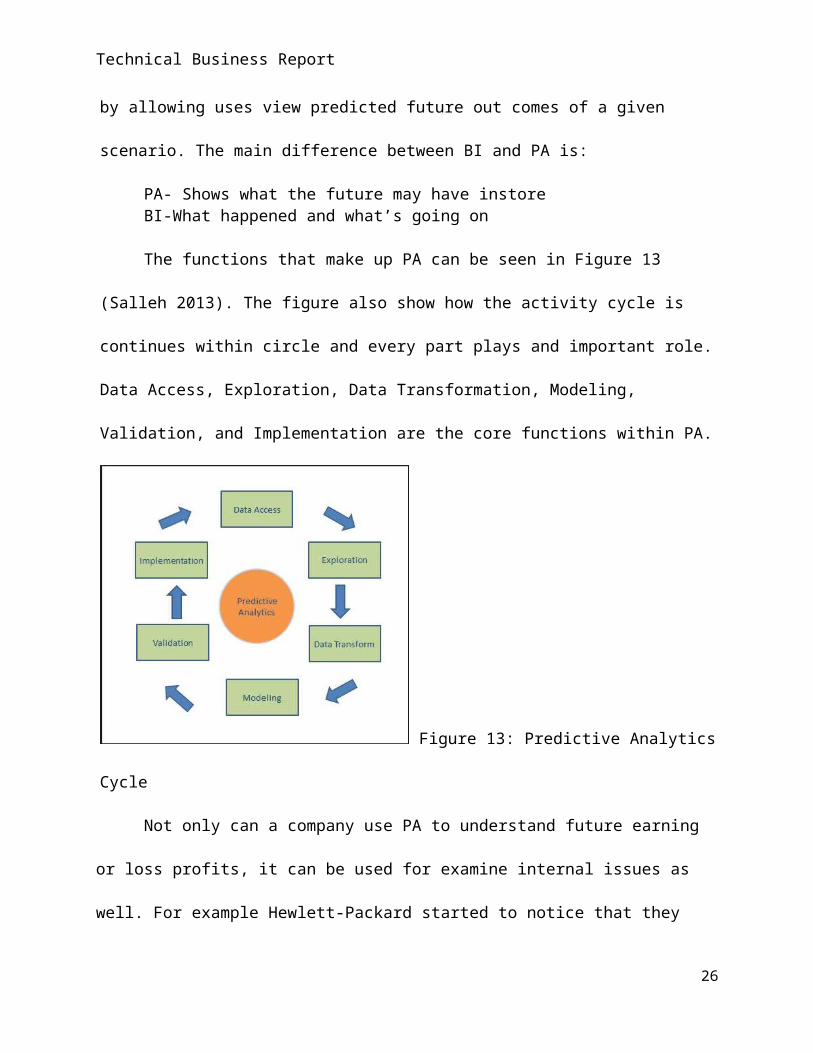
The functions that make up PA can be seen in Figure 13 (Salleh 2013). The figure also
show how the activity cycle is continues within circle and every part plays and important role.
Data Access, Exploration, Data Transformation, Modeling, Validation, and Implementation are
the core functions within PA.
Figure 13: Predictive Analytics Cycle
Not only can a company use PA to understand future earning or loss profits, it can be
used for examine internal issues as well. For example Hewlett-Packard started to notice that they
were losing productivity when employees left the company and HP had little time to train a
18

Technical Business Report
backup. So HP developed a PA tool to monitor employees’ habits and was able to start
forecasting the probability of an employee leaving (Salleh 2013).
When a business is looking into a PA software package they should be look for the key
features listed below:
Analytic Data Preparation Data Exploration and data discovery Machine Learning and Predictive Algorithms Automated Model Tournaments Batch or Real-Time Scoring Model Validation and Assessments Automated and Governed Decision Flows
It is clear from the research provided when used correctly business intelligence, business
analytics, and predictive analytics software adds tremendous value to users. In most industries
the ability to identify trends and forecast correctly will allow a business to make faster smarter
decisions, which can create a competitive advantage for your business. Software developers in
this industry are constantly improving their products and integrating new technology as it
becomes available. With so many software options available managers from multiple business
areas within a company need to do the proper research and evaluation prior to purchasing and
implementing a new application.
Collaborative Marketing Campaign Management
After evaluating the and highlighting the importance of the core functions of an EMIS
software packages, we then evaluated business intelligence (BI), business analytics (BA), and
predictive analytics packages. These alone are powerful tool that when used right they can
change the landscape for a company, but these packages focus on running a business and
analyzing data to make better strategic decisions. To connect with customers in the Web 2.0 era
business must do more to understand a customer and reach out to a customer.
19
Technical Business Report
In order to follow through on a business’s customer centric business model they must
invest the resource in developing a collaborative marketing campaign. A collaborative marketing
package should include three key marketing management functions: Marketing Planning,
Campaign Management, and Customer Analytics.
Marketing can be simply described as attracting and retaining customers, but for a
business it is much more than that. A marketing team must make strategic moves in order to
deliver the right information or product to the right customer at the right time. In order to identify
what collaborative marketing package to invest in a business must first research and understand
the capabilities of each application and identify the key functions.
Marketing planning software provides surveys, knowledge center, idea crowdsourcing,
and expenses tracking. Marketing planning software should provide a cloud based solution for
the following areas:
Budgeting & Forecasting Collaboration Flowchart Goal Setting / Tracking- sets goals in a cloud based system allowing employees to see
where they stand Marketing Calendar Media Planning Predictive Analytics- project what the outcome will be from prior to making a decision. Presentation Tools- allows customers to present data direct from the platform Spend Management-tracks where the money is going
Figure 14 below is from Percolate.com, who is a marketing planning software developer.
The figure shows the cycle of information that the software package includes: Planning,
Briefing, Production, Distribution, Monitoring, and Analysis. With the core of the cycle being:
Channels, Branding, Objective, and Audience. All of these tools are necessary in order for a
business to stay competitive and sever a customer’s needs.
20
Technical Business Report
Figure 14: Cycle of Work within Planning Software
A campaign management system is designed to measure the elements and individual
components of a marketing campaign. Techopedia.com describes “a typical campaign
management system splits out different screens and presentations for social media platforms like
Facebook, Twitter and others”, showing at a glance how each one of these campaign parts is
different. A campaign management software package can analyzed based on the following
features:
Deployment method- Cloud based? Mobile? Analytics/ROI tracking- Input investment made by marketing and track sales produced
by investment. Content/Blogging Platform- Can the system link directly to blogging accounts Email Drip Campaigns- a set of marketing emails that will be sent out automatically on a
schedule. Landing Pages/Web Form- Web page customers are directed to after clicking on
advertisement link. Lead Management- Manage customer’s leads that develop from other platforms. Multivariate Testing- determine which combination of variations performs the best out of
all of the possible combinations. Social Marketing- develop activities aimed at changing or maintaining people's behavior
21

Technical Business Report
By ensuring that the package has a majority of the key features a business can determine
what their ROI is per campaigns and develop effective strategies to increase sales and cut
marketing costs.
Customer analytics allows businesses to segment markets, as well as track and predict
customer behavior. By tracking customer data trends and segmentation can then occurs, this
allows business deploy the right marketing plan for the right location with the right pricing. The
software also allows a business to discover methods and metrics to improve a customer’s
experience with a product, service or brand (Sauro 2015). Customer analytics software should
have the following key features.
Access Control- customize security to their specific needs Data –discovery, mapping, and profiling Finding the right channels to connect with a customer Maximize customer lifetime value through personalized up-sell and cross-sell offers
NG Data is a customer analytics software developer and has provided Figure 15, which
shows the customer life cycle and how implementing customer analytics software can change the
curve of results as it relates to margin (NG Data.com). By understanding a customer needs better
a business can provide the right sales campaign to the right customer. This allows for a business
to upsell customers which will increase their margins.
22
Technical Business Report
Figure 15:
Customer Life vs Margin
A business must be diligent when researching and evaluating a collaborative marketing
package. The package should be able to connect to a business’s social media platforms to
recorded, track, and disperse data. Overall the implementation should add value to the company
while increasing a company’s ROI as it relates to marketing campaigns.
Use of Social Media
As discussed in the previous section businesses are investing in Collaborative Marketing
Campaign Management Systems that connect directly to a business’s social media platforms.
These social media platforms such as Facebook and Youtube allow businesses to have direct
access to customers and customer feedback. In the past business worried about collecting
customer feedback, so they offered incentives and discounts to fill out a survey form. Now with
social media businesses need to focus how to gather all the data, how to sort it, and how to
respond to it.
23
Technical Business Report
Social media sites have led the way for users to connect with each other and creating
social networking. Social networking sites allow users the ability to create and maintain a profile
that acts as an online identity with in the network (Baltzan 2015).
Commerce’s are able to gather tons of valuable data from Social Networking sites. C-
Commerce’s understand that their best “sales people” are their customers and their “network” of
friends. C-Commerces are also able to track and monitor social networking sites to gather data
on their customers. Businesses are now creating accounts on the networking sites in order to
instantly reach customers and let them know about promotions, sales,and new items. This also
allows business to get instant feedback from customers. Social networking sites provide
businesses with a better and faster way to hear the customers. Networking sites created a
platform for users to have their voice hear and share information with their friends “following”
them.
It is now a common practice for C-Commers to reach out to customers directly via a
social networking site. If a customer posts a negative comment on a social networking site about
a business it can be available for their whole network to see. It can also be reposted over and
over again, which means bad news can spread like a wild fire. It is important that a business be
proactive and address negative feedback posted on social networking sites.
Social Networking sites can also be a great spot for business to post positive thing they
are doing. For example, if a business is sponsoring an event or doing good things for a
community they can post detail on a social media site. After the event they can even post pictures
and videos of the event which is a good PR move. Social media sites also let a user feel like they
are a part of a business. With these platforms businesses are able to get closer to customers; it
can help them find out areas of improvements a lot faster than traditional ways. A customer can
24

Technical Business Report
feel like their personal view and morals are the same as a company which creates brand
awareness and brand loyalty that translates in to more sales and profits.
Many social media sites are realizing the power and control they have with connecting
customers to businesses. Shopping online is becoming even easier. In the past buying items
online took time, you had to set up an account enter all your information and had to remember
your password. All of these obstacles can discourage potential customers and also gave
customers time to back out of ordering something. Social media sites have stepped in and created
a solution, they allow customers to uses their existing social media account to login to an E-
commerce websites. Figure 16 is a typical example how a business offers a customer to login
using social media.
Figure 16: Logging in using Social Media
This is a win, win, win situation for everyone and highlights the importance of a customer centric
business model:
Social Media- allows them to track users spending and searching habits for better add
placements and keeps users connected to their sites longer.
Businesses- are able close a transactions faster and they can buy effective ad space from
social media site.
25
Technical Business Report
Customers- gives customer access to deals or new items they are interested in and makes
shopping online easier/ faster.
Social media and social networking sites will continue to push technology to the next
level and develop new tool to help better link customers and businesses. It is up to consumers
and business to make the most of these available tools in order to keep improving the customer
experience management life cycle.
Conclusion
In concluding it is important that businesses stay agile and embrace and utilize
Information Technology as it advances and changes. This technical paper is has translate
theoretical research on enterprise information management systems into specific implications for
general business ecosystem management issues and concerns. The areas below were researched
and covered with in the sections above: understanding Web 2.0, background information on a
business ecosystem, trends with in a business ecosystem, core functions of an enterprise
information management systems, business intelligence and analytics, collaborative marketing
campaign management, and use of social media.
Advancement in cloud technology, big data, social, mobility, and video has opened up
new opportunities for businesses to connect and better understand a customer’s needs. A
business must create the appropriate positions to manage their Enterprise Information
Management System, along with providing them with the software and tools to be successful,
remain agile, and create a competitive advantage.
26

Technical Business Report
References
Baltzan, P. (2015). Business driven technology (SIXTH edition. ed.). New York: McGraw-Hill
Education.
Bari, A., Chaouchi, M., & Jung, T. (2014). Predictive analytics for dummies. Retrieved from
https://ebookcentral.proquest.com
Chen, M., Zhang, D., & Zhou, L. (2007). Empowering collaborative commerce with web
services enabled business process management systems. Decision Support Systems,
43(2), 530-546. doi:10.1016/j.dss.2005.05.014
Gartner- http://www.gartner.com/it-glossary/enterprise-information-management-eim
Hancock, J. C. (2011, July). Leadership in the Cloud Computing Era. Retrieved July 09, 2017,
from https://www.spencerstuart.com/research-and-insight/leadership-in-the-cloud-
computing-era
Heisterberg, R., & Verma, A. (2014). Creating business agility : How convergence of cloud,
social, mobile, video, and big data enables competitive advantage. New Jersey: John
Wiley & Sons
Information Resources Management Association. (2011). Enterprise information systems :
Concepts, methodologies, tools and applications. Hershey: Business Science Reference.
Investopedia-http://www.investopedia.com/terms/b/business-ecosystem.asp
Jank, W. (2011). Business analytics for managers (Use r!). New York: Springer.
doi:10.1007/978-1-4614-0406-4
MacDonald, Steven . "How to Create a Customer Centric Strategy For Your Business." CRM
Blog: Articles, Tips and Strategies by SuperOffice. N.p., 02 Aug. 2017. Web. 13 Aug.
2017.
27

Technical Business Report
Manning, B. (2015, May 19). Too Many Chiefs? How CDOs, CIOs, CTOs, and CMOs Must
Work Together. Retrieved July 09, 2017, from https://centricdigital.com/blog/digital-
trends/cdos-cio-cto-cmo/
NG Data- https://www.ngdata.com/s/customer-analytics-software/
One point hosting: Http://www.onepointhosting.co.za/enterprise-resource-planning/.
Pureflex systems -http://www.pureflexsystems.com/
Rouse, M. (n.d.). What is customer relationship management (CRM) ? - Definition from
WhatIs.com. Retrieved July 16, 2017, from
http://searchcrm.techtarget.com/definition/CRM
Salleh, S. (2013, June 26). Applying Predictive Analytics in Enterprise Decision-making.
Retrieved August 11, 2017, from http://www.lumina.com/blog/applying-predictive-
analytics-in-enterprise-decision-making
Sauro, Jeff. Customer Analytics For Dummies, Wiley, 2015. ProQuest Ebook Central,
https://ebookcentral.proquest.com/lib/nddn-ebooks/detail.action?docID=1895772.
Techhopedia- https://www.techopedia.com/definition/30994/campaign-management-system-cms
Vitt, E., Luckevich, M., & Misner, S. (2002). Business intelligence: Making better decisions
faster. Redmond, Wash.: Microsoft Press.
28
Related Documents