Welcome message from author
This document is posted to help you gain knowledge. Please leave a comment to let me know what you think about it! Share it to your friends and learn new things together.
Transcript

copy Vlerick Business School
STARTING POINT
PAPER CONTRIBUTION
Context (Jones et al 2018)
RES-E peaks expected by 2030
Power-to-gas one of the solutions to reduce spillages
Modelling work that inspired us
Misaligned incentives (Saguan and Meeus 2014)
Power-to-gas electricity market price-setting and erosion of profits (Vandewalle et al 2015 Green et al 2011)
Gas market (del Valle 2017)
KEY REFERENCES
Jones CW Piebalgs A Glachant J-M 2018 Energy Priorities for the Von der Leyen Commission European University Institute
Saguan M Meeus L 2014 Impact of the regulatory framework for transmission investments on the cost of renewable energy in the EU Energy Econ 43 185ndash194
Vandewalle J Bruninx K DrsquohaeseleerW 2015 Effects of large-scale power to gas conversion on the power gas and carbon sectors and their interactions Energy Convers Manag 94 28ndash39
Green R Hu H Vasilakos N 2011 Turning the wind into hydrogen the long-run impact on electricity prices and generating capacity Energy Policy 39 3992ndash3998
del Valle A Duentildeas PWogrin S Reneses J 2017 A fundamental analysis on the implementation and development of virtual natural gas hubs Energy Econ 67 520ndash532
copy Vlerick Business School
ELECTRICITY AND GAS MARKET MODEL
copy Vlerick Business School
RESULTS
SENSITIVITIES
RES investment costs
CO2 price
H2 blendinginjection limits
Power system characteristics
Shape of load duration curve
RES generation availability
copy Vlerick Business School
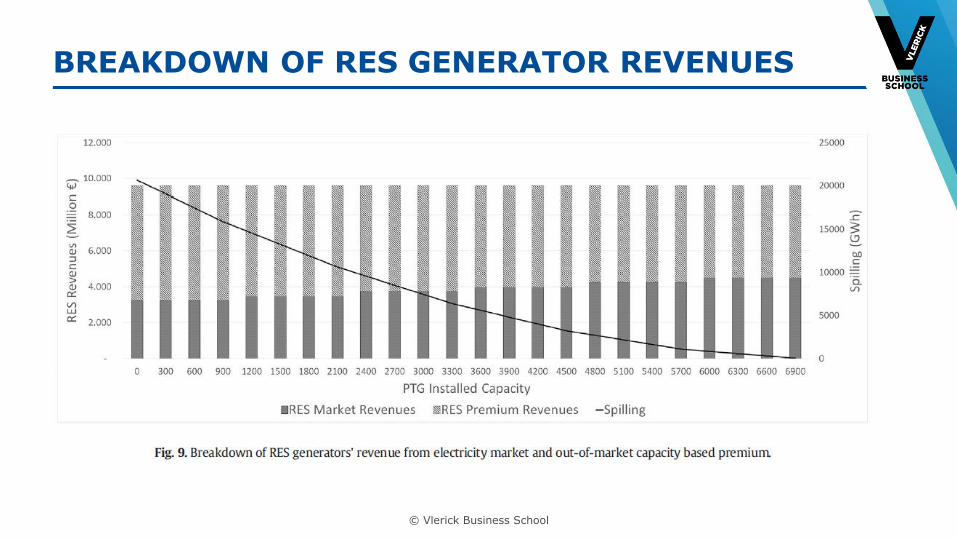
BREAKDOWN OF RES GENERATOR REVENUES
copy Vlerick Business School
CONCLUSIONS AND FUTURE WORK
1) PTG can play a price-setting role in the electricity market but this erodes profit in arbitrage opportunity
2) Misaligned incentives limited between the electricity and gas sector but in some instances PTG is welfare enhancing but is loss-making for the PTG actor
Model 20
Increase detail of electricity and gas system
Study the interaction between renewable electricity and gas targets and support schemes
MARTIN ROACH
LEONARDO MEEUS
03032021
SUPPORTING GREEN GASES WITH RENEWABLE ENERGY POLICIES
copy Vlerick Business School
RELEVANCE OF THE PAPER
Show the impact of some of the possible tools the European Commission is considering to support green gases
RES-Electricity and RES-Gas target
Anticipating interactions between gas electricity and CO2 pricing
copy Vlerick Business School
POSITIONING IN THE ACADEMIC LITERATURE
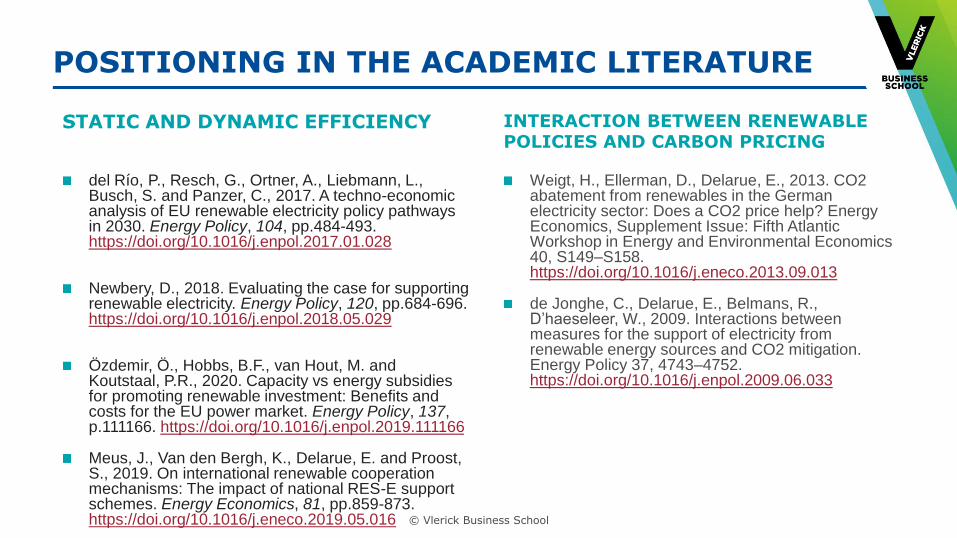
del Riacuteo P Resch G Ortner A Liebmann L Busch S and Panzer C 2017 A techno-economic analysis of EU renewable electricity policy pathways in 2030 Energy Policy 104 pp484-493 httpsdoiorg101016jenpol201701028
Newbery D 2018 Evaluating the case for supporting renewable electricity Energy Policy 120 pp684-696 httpsdoiorg101016jenpol201805029
Oumlzdemir Ouml Hobbs BF van Hout M and Koutstaal PR 2020 Capacity vs energy subsidies for promoting renewable investment Benefits and costs for the EU power market Energy Policy 137 p111166 httpsdoiorg101016jenpol2019111166
Meus J Van den Bergh K Delarue E and Proost S 2019 On international renewable cooperation mechanisms The impact of national RES-E support schemes Energy Economics 81 pp859-873 httpsdoiorg101016jeneco201905016
Weigt H Ellerman D Delarue E 2013 CO2 abatement from renewables in the German electricity sector Does a CO2 price help Energy Economics Supplement Issue Fifth Atlantic Workshop in Energy and Environmental Economics 40 S149ndashS158 httpsdoiorg101016jeneco201309013
de Jonghe C Delarue E Belmans R Drsquohaeseleer W 2009 Interactions between measures for the support of electricity from renewable energy sources and CO2 mitigation Energy Policy 37 4743ndash4752 httpsdoiorg101016jenpol200906033
STATIC AND DYNAMIC EFFICIENCY INTERACTION BETWEEN RENEWABLE POLICIES AND CARBON PRICING
copy Vlerick Business School
MATHEMATICAL FORMULATIONSUPPLY AND DEMAND SEGMENTS
copy Vlerick Business School
STYLIZED APPROACH NUMERICAL EXAMPLE
Actors are perfectly competitive and have complete information
4 representative days (demand and res generator availability)
Danish Energy Agency technology data as input data for investment costs (equivalent annualized costs) and efficiency
Biogas plant basic configuration + biogas upgrading Large offshore wind Alkaline Electrolyser Heat pump air-to-water existing one family house
Gas turbine combined cycle Natural gas boiler existing one family house Steam Methane Reformer
Assume shippers have access to natural gas at fixed variable costs of 20 euroMWh and biogas producers have a limited cost-competitive feedstock supply ndash increasing variable costs
The RES targets are modelled as certificate markets
Formulated and solved as a mixed complementarity problem
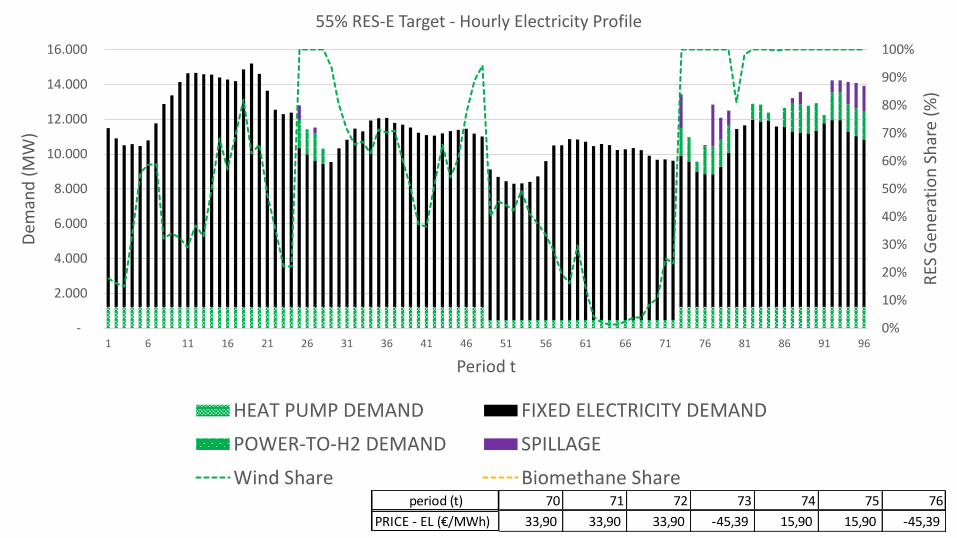
period (t) 70 71 72 73 74 75 76
PRICE - EL (euroMWh) 3390 3390 3390 -4539 1590 1590 -4539
0
10
20
30
40
50
60
70
80
90
100
-
2000
4000
6000
8000
10000
12000
14000
16000
1 6 11 16 21 26 31 36 41 46 51 56 61 66 71 76 81 86 91 96
RES
Gen
erat
ion
Sh
are
()
Dem
and
(M
W)
Period t
55 RES-E Target - Hourly Electricity Profile
HEAT PUMP DEMAND FIXED ELECTRICITY DEMAND
POWER-TO-H2 DEMAND SPILLAGE
Wind Share Biomethane Share
-
20000
40000
60000
80000
100000
120000
Electricitydemand
Electricity supply Heat demand Heat supply H2 demand H2 supply
GW
h
Demand amp Supply per segment
55 RES-Overall Target
FIXED DEMAND NATURAL GAS RES ELECTRICITY SPILLAGE BIOMETHANE
IMPACT OF RES-G SUBSIDY DEFINITION ON BIOMETHANE UNDER 25 RES-E AND 10 RES-G TARGETS
-
50000
100000
150000
ELECTRICITY DEMAND
GW
h WIND
GAS GENERATOR (BIO)
GAS GENERATOR (NG)
-
10000
20000
30000
40000
50000
H2 DEMAND
GW
h POWER-TO-H2
SMR (BIO)
SMR (NG)
-
10000
20000
30000
40000
50000
HEAT DEMAND
GW
h HEAT PUMP
GAS BOILER (BIO)
GAS BOILER (NG)
Electricity FIP
Cases How biomethane used for electricity generation is subsidized
Gas FIP Either FIP If bio vc too high
25 RES-E 10 RES-G25 RES-E(no HeatPump)
10 RES-G(no HeatPump)
50 RES-E 10 RES-G 25 RES-E 20 RES-g 60 RES-E 10 RES-G
POWER-TO-H2 - 5846 8903 175 21785 3780
GAS GENERATOR (BIO) - -9038 -9747 -7193 -10617 -2272
GAS GENERATOR (BIO) 5333 0 5751 4244 6264 1341
BIOMETHANE - 10791 10791 12648 11009 6952
HEAT PUMP -9042 0 - -9042 -9038 -9042
POWER-TO-H2 -9191 0 -13999 -275 -34254 -5943
WIND 35150 0 30497 49571 59277 67042
-60000
-40000
-20000
-
20000
40000
60000
GW
hRenewable Electricity and Biomethane Output Changing RES Target Ambitions
WIND POWER-TO-H2 HEAT PUMP BIOMETHANE GAS GENERATOR (BIO)
copy Vlerick Business School
CONCLUSIONS
Technology neutral targets are more difficult to formulate given the range of technologies available ndash at different stages of maturity ndash and in the end relate back to the policy objectives in mind static and dynamic efficiency
Emerging technologies which present sector coupling dynamics may increase market and policy interactions
MARTINROACHVLERICKCOM
QampA

copy Vlerick Business School
ELECTRICITY AND GAS MARKET MODEL
copy Vlerick Business School
RESULTS
SENSITIVITIES
RES investment costs
CO2 price
H2 blendinginjection limits
Power system characteristics
Shape of load duration curve
RES generation availability
copy Vlerick Business School
BREAKDOWN OF RES GENERATOR REVENUES
copy Vlerick Business School
CONCLUSIONS AND FUTURE WORK
1) PTG can play a price-setting role in the electricity market but this erodes profit in arbitrage opportunity
2) Misaligned incentives limited between the electricity and gas sector but in some instances PTG is welfare enhancing but is loss-making for the PTG actor
Model 20
Increase detail of electricity and gas system
Study the interaction between renewable electricity and gas targets and support schemes
MARTIN ROACH
LEONARDO MEEUS
03032021
SUPPORTING GREEN GASES WITH RENEWABLE ENERGY POLICIES
copy Vlerick Business School
RELEVANCE OF THE PAPER
Show the impact of some of the possible tools the European Commission is considering to support green gases
RES-Electricity and RES-Gas target
Anticipating interactions between gas electricity and CO2 pricing
copy Vlerick Business School
POSITIONING IN THE ACADEMIC LITERATURE
del Riacuteo P Resch G Ortner A Liebmann L Busch S and Panzer C 2017 A techno-economic analysis of EU renewable electricity policy pathways in 2030 Energy Policy 104 pp484-493 httpsdoiorg101016jenpol201701028
Newbery D 2018 Evaluating the case for supporting renewable electricity Energy Policy 120 pp684-696 httpsdoiorg101016jenpol201805029
Oumlzdemir Ouml Hobbs BF van Hout M and Koutstaal PR 2020 Capacity vs energy subsidies for promoting renewable investment Benefits and costs for the EU power market Energy Policy 137 p111166 httpsdoiorg101016jenpol2019111166
Meus J Van den Bergh K Delarue E and Proost S 2019 On international renewable cooperation mechanisms The impact of national RES-E support schemes Energy Economics 81 pp859-873 httpsdoiorg101016jeneco201905016
Weigt H Ellerman D Delarue E 2013 CO2 abatement from renewables in the German electricity sector Does a CO2 price help Energy Economics Supplement Issue Fifth Atlantic Workshop in Energy and Environmental Economics 40 S149ndashS158 httpsdoiorg101016jeneco201309013
de Jonghe C Delarue E Belmans R Drsquohaeseleer W 2009 Interactions between measures for the support of electricity from renewable energy sources and CO2 mitigation Energy Policy 37 4743ndash4752 httpsdoiorg101016jenpol200906033
STATIC AND DYNAMIC EFFICIENCY INTERACTION BETWEEN RENEWABLE POLICIES AND CARBON PRICING
copy Vlerick Business School
MATHEMATICAL FORMULATIONSUPPLY AND DEMAND SEGMENTS
copy Vlerick Business School
STYLIZED APPROACH NUMERICAL EXAMPLE
Actors are perfectly competitive and have complete information
4 representative days (demand and res generator availability)
Danish Energy Agency technology data as input data for investment costs (equivalent annualized costs) and efficiency
Biogas plant basic configuration + biogas upgrading Large offshore wind Alkaline Electrolyser Heat pump air-to-water existing one family house
Gas turbine combined cycle Natural gas boiler existing one family house Steam Methane Reformer
Assume shippers have access to natural gas at fixed variable costs of 20 euroMWh and biogas producers have a limited cost-competitive feedstock supply ndash increasing variable costs
The RES targets are modelled as certificate markets
Formulated and solved as a mixed complementarity problem
period (t) 70 71 72 73 74 75 76
PRICE - EL (euroMWh) 3390 3390 3390 -4539 1590 1590 -4539
0
10
20
30
40
50
60
70
80
90
100
-
2000
4000
6000
8000
10000
12000
14000
16000
1 6 11 16 21 26 31 36 41 46 51 56 61 66 71 76 81 86 91 96
RES
Gen
erat
ion
Sh
are
()
Dem
and
(M
W)
Period t
55 RES-E Target - Hourly Electricity Profile
HEAT PUMP DEMAND FIXED ELECTRICITY DEMAND
POWER-TO-H2 DEMAND SPILLAGE
Wind Share Biomethane Share
-
20000
40000
60000
80000
100000
120000
Electricitydemand
Electricity supply Heat demand Heat supply H2 demand H2 supply
GW
h
Demand amp Supply per segment
55 RES-Overall Target
FIXED DEMAND NATURAL GAS RES ELECTRICITY SPILLAGE BIOMETHANE
IMPACT OF RES-G SUBSIDY DEFINITION ON BIOMETHANE UNDER 25 RES-E AND 10 RES-G TARGETS
-
50000
100000
150000
ELECTRICITY DEMAND
GW
h WIND
GAS GENERATOR (BIO)
GAS GENERATOR (NG)
-
10000
20000
30000
40000
50000
H2 DEMAND
GW
h POWER-TO-H2
SMR (BIO)
SMR (NG)
-
10000
20000
30000
40000
50000
HEAT DEMAND
GW
h HEAT PUMP
GAS BOILER (BIO)
GAS BOILER (NG)
Electricity FIP
Cases How biomethane used for electricity generation is subsidized
Gas FIP Either FIP If bio vc too high
25 RES-E 10 RES-G25 RES-E(no HeatPump)
10 RES-G(no HeatPump)
50 RES-E 10 RES-G 25 RES-E 20 RES-g 60 RES-E 10 RES-G
POWER-TO-H2 - 5846 8903 175 21785 3780
GAS GENERATOR (BIO) - -9038 -9747 -7193 -10617 -2272
GAS GENERATOR (BIO) 5333 0 5751 4244 6264 1341
BIOMETHANE - 10791 10791 12648 11009 6952
HEAT PUMP -9042 0 - -9042 -9038 -9042
POWER-TO-H2 -9191 0 -13999 -275 -34254 -5943
WIND 35150 0 30497 49571 59277 67042
-60000
-40000
-20000
-
20000
40000
60000
GW
hRenewable Electricity and Biomethane Output Changing RES Target Ambitions
WIND POWER-TO-H2 HEAT PUMP BIOMETHANE GAS GENERATOR (BIO)
copy Vlerick Business School
CONCLUSIONS
Technology neutral targets are more difficult to formulate given the range of technologies available ndash at different stages of maturity ndash and in the end relate back to the policy objectives in mind static and dynamic efficiency
Emerging technologies which present sector coupling dynamics may increase market and policy interactions
MARTINROACHVLERICKCOM
QampA

copy Vlerick Business School
BREAKDOWN OF RES GENERATOR REVENUES
copy Vlerick Business School
CONCLUSIONS AND FUTURE WORK
1) PTG can play a price-setting role in the electricity market but this erodes profit in arbitrage opportunity
2) Misaligned incentives limited between the electricity and gas sector but in some instances PTG is welfare enhancing but is loss-making for the PTG actor
Model 20
Increase detail of electricity and gas system
Study the interaction between renewable electricity and gas targets and support schemes
MARTIN ROACH
LEONARDO MEEUS
03032021
SUPPORTING GREEN GASES WITH RENEWABLE ENERGY POLICIES
copy Vlerick Business School
RELEVANCE OF THE PAPER
Show the impact of some of the possible tools the European Commission is considering to support green gases
RES-Electricity and RES-Gas target
Anticipating interactions between gas electricity and CO2 pricing
copy Vlerick Business School
POSITIONING IN THE ACADEMIC LITERATURE
del Riacuteo P Resch G Ortner A Liebmann L Busch S and Panzer C 2017 A techno-economic analysis of EU renewable electricity policy pathways in 2030 Energy Policy 104 pp484-493 httpsdoiorg101016jenpol201701028
Newbery D 2018 Evaluating the case for supporting renewable electricity Energy Policy 120 pp684-696 httpsdoiorg101016jenpol201805029
Oumlzdemir Ouml Hobbs BF van Hout M and Koutstaal PR 2020 Capacity vs energy subsidies for promoting renewable investment Benefits and costs for the EU power market Energy Policy 137 p111166 httpsdoiorg101016jenpol2019111166
Meus J Van den Bergh K Delarue E and Proost S 2019 On international renewable cooperation mechanisms The impact of national RES-E support schemes Energy Economics 81 pp859-873 httpsdoiorg101016jeneco201905016
Weigt H Ellerman D Delarue E 2013 CO2 abatement from renewables in the German electricity sector Does a CO2 price help Energy Economics Supplement Issue Fifth Atlantic Workshop in Energy and Environmental Economics 40 S149ndashS158 httpsdoiorg101016jeneco201309013
de Jonghe C Delarue E Belmans R Drsquohaeseleer W 2009 Interactions between measures for the support of electricity from renewable energy sources and CO2 mitigation Energy Policy 37 4743ndash4752 httpsdoiorg101016jenpol200906033
STATIC AND DYNAMIC EFFICIENCY INTERACTION BETWEEN RENEWABLE POLICIES AND CARBON PRICING
copy Vlerick Business School
MATHEMATICAL FORMULATIONSUPPLY AND DEMAND SEGMENTS
copy Vlerick Business School
STYLIZED APPROACH NUMERICAL EXAMPLE
Actors are perfectly competitive and have complete information
4 representative days (demand and res generator availability)
Danish Energy Agency technology data as input data for investment costs (equivalent annualized costs) and efficiency
Biogas plant basic configuration + biogas upgrading Large offshore wind Alkaline Electrolyser Heat pump air-to-water existing one family house
Gas turbine combined cycle Natural gas boiler existing one family house Steam Methane Reformer
Assume shippers have access to natural gas at fixed variable costs of 20 euroMWh and biogas producers have a limited cost-competitive feedstock supply ndash increasing variable costs
The RES targets are modelled as certificate markets
Formulated and solved as a mixed complementarity problem
period (t) 70 71 72 73 74 75 76
PRICE - EL (euroMWh) 3390 3390 3390 -4539 1590 1590 -4539
0
10
20
30
40
50
60
70
80
90
100
-
2000
4000
6000
8000
10000
12000
14000
16000
1 6 11 16 21 26 31 36 41 46 51 56 61 66 71 76 81 86 91 96
RES
Gen
erat
ion
Sh
are
()
Dem
and
(M
W)
Period t
55 RES-E Target - Hourly Electricity Profile
HEAT PUMP DEMAND FIXED ELECTRICITY DEMAND
POWER-TO-H2 DEMAND SPILLAGE
Wind Share Biomethane Share
-
20000
40000
60000
80000
100000
120000
Electricitydemand
Electricity supply Heat demand Heat supply H2 demand H2 supply
GW
h
Demand amp Supply per segment
55 RES-Overall Target
FIXED DEMAND NATURAL GAS RES ELECTRICITY SPILLAGE BIOMETHANE
IMPACT OF RES-G SUBSIDY DEFINITION ON BIOMETHANE UNDER 25 RES-E AND 10 RES-G TARGETS
-
50000
100000
150000
ELECTRICITY DEMAND
GW
h WIND
GAS GENERATOR (BIO)
GAS GENERATOR (NG)
-
10000
20000
30000
40000
50000
H2 DEMAND
GW
h POWER-TO-H2
SMR (BIO)
SMR (NG)
-
10000
20000
30000
40000
50000
HEAT DEMAND
GW
h HEAT PUMP
GAS BOILER (BIO)
GAS BOILER (NG)
Electricity FIP
Cases How biomethane used for electricity generation is subsidized
Gas FIP Either FIP If bio vc too high
25 RES-E 10 RES-G25 RES-E(no HeatPump)
10 RES-G(no HeatPump)
50 RES-E 10 RES-G 25 RES-E 20 RES-g 60 RES-E 10 RES-G
POWER-TO-H2 - 5846 8903 175 21785 3780
GAS GENERATOR (BIO) - -9038 -9747 -7193 -10617 -2272
GAS GENERATOR (BIO) 5333 0 5751 4244 6264 1341
BIOMETHANE - 10791 10791 12648 11009 6952
HEAT PUMP -9042 0 - -9042 -9038 -9042
POWER-TO-H2 -9191 0 -13999 -275 -34254 -5943
WIND 35150 0 30497 49571 59277 67042
-60000
-40000
-20000
-
20000
40000
60000
GW
hRenewable Electricity and Biomethane Output Changing RES Target Ambitions
WIND POWER-TO-H2 HEAT PUMP BIOMETHANE GAS GENERATOR (BIO)
copy Vlerick Business School
CONCLUSIONS
Technology neutral targets are more difficult to formulate given the range of technologies available ndash at different stages of maturity ndash and in the end relate back to the policy objectives in mind static and dynamic efficiency
Emerging technologies which present sector coupling dynamics may increase market and policy interactions
MARTINROACHVLERICKCOM
QampA
copy Vlerick Business School
CONCLUSIONS AND FUTURE WORK
1) PTG can play a price-setting role in the electricity market but this erodes profit in arbitrage opportunity
2) Misaligned incentives limited between the electricity and gas sector but in some instances PTG is welfare enhancing but is loss-making for the PTG actor
Model 20
Increase detail of electricity and gas system
Study the interaction between renewable electricity and gas targets and support schemes
MARTIN ROACH
LEONARDO MEEUS
03032021
SUPPORTING GREEN GASES WITH RENEWABLE ENERGY POLICIES
copy Vlerick Business School
RELEVANCE OF THE PAPER
Show the impact of some of the possible tools the European Commission is considering to support green gases
RES-Electricity and RES-Gas target
Anticipating interactions between gas electricity and CO2 pricing
copy Vlerick Business School
POSITIONING IN THE ACADEMIC LITERATURE
del Riacuteo P Resch G Ortner A Liebmann L Busch S and Panzer C 2017 A techno-economic analysis of EU renewable electricity policy pathways in 2030 Energy Policy 104 pp484-493 httpsdoiorg101016jenpol201701028
Newbery D 2018 Evaluating the case for supporting renewable electricity Energy Policy 120 pp684-696 httpsdoiorg101016jenpol201805029
Oumlzdemir Ouml Hobbs BF van Hout M and Koutstaal PR 2020 Capacity vs energy subsidies for promoting renewable investment Benefits and costs for the EU power market Energy Policy 137 p111166 httpsdoiorg101016jenpol2019111166
Meus J Van den Bergh K Delarue E and Proost S 2019 On international renewable cooperation mechanisms The impact of national RES-E support schemes Energy Economics 81 pp859-873 httpsdoiorg101016jeneco201905016
Weigt H Ellerman D Delarue E 2013 CO2 abatement from renewables in the German electricity sector Does a CO2 price help Energy Economics Supplement Issue Fifth Atlantic Workshop in Energy and Environmental Economics 40 S149ndashS158 httpsdoiorg101016jeneco201309013
de Jonghe C Delarue E Belmans R Drsquohaeseleer W 2009 Interactions between measures for the support of electricity from renewable energy sources and CO2 mitigation Energy Policy 37 4743ndash4752 httpsdoiorg101016jenpol200906033
STATIC AND DYNAMIC EFFICIENCY INTERACTION BETWEEN RENEWABLE POLICIES AND CARBON PRICING
copy Vlerick Business School
MATHEMATICAL FORMULATIONSUPPLY AND DEMAND SEGMENTS
copy Vlerick Business School
STYLIZED APPROACH NUMERICAL EXAMPLE
Actors are perfectly competitive and have complete information
4 representative days (demand and res generator availability)
Danish Energy Agency technology data as input data for investment costs (equivalent annualized costs) and efficiency
Biogas plant basic configuration + biogas upgrading Large offshore wind Alkaline Electrolyser Heat pump air-to-water existing one family house
Gas turbine combined cycle Natural gas boiler existing one family house Steam Methane Reformer
Assume shippers have access to natural gas at fixed variable costs of 20 euroMWh and biogas producers have a limited cost-competitive feedstock supply ndash increasing variable costs
The RES targets are modelled as certificate markets
Formulated and solved as a mixed complementarity problem
period (t) 70 71 72 73 74 75 76
PRICE - EL (euroMWh) 3390 3390 3390 -4539 1590 1590 -4539
0
10
20
30
40
50
60
70
80
90
100
-
2000
4000
6000
8000
10000
12000
14000
16000
1 6 11 16 21 26 31 36 41 46 51 56 61 66 71 76 81 86 91 96
RES
Gen
erat
ion
Sh
are
()
Dem
and
(M
W)
Period t
55 RES-E Target - Hourly Electricity Profile
HEAT PUMP DEMAND FIXED ELECTRICITY DEMAND
POWER-TO-H2 DEMAND SPILLAGE
Wind Share Biomethane Share
-
20000
40000
60000
80000
100000
120000
Electricitydemand
Electricity supply Heat demand Heat supply H2 demand H2 supply
GW
h
Demand amp Supply per segment
55 RES-Overall Target
FIXED DEMAND NATURAL GAS RES ELECTRICITY SPILLAGE BIOMETHANE
IMPACT OF RES-G SUBSIDY DEFINITION ON BIOMETHANE UNDER 25 RES-E AND 10 RES-G TARGETS
-
50000
100000
150000
ELECTRICITY DEMAND
GW
h WIND
GAS GENERATOR (BIO)
GAS GENERATOR (NG)
-
10000
20000
30000
40000
50000
H2 DEMAND
GW
h POWER-TO-H2
SMR (BIO)
SMR (NG)
-
10000
20000
30000
40000
50000
HEAT DEMAND
GW
h HEAT PUMP
GAS BOILER (BIO)
GAS BOILER (NG)
Electricity FIP
Cases How biomethane used for electricity generation is subsidized
Gas FIP Either FIP If bio vc too high
25 RES-E 10 RES-G25 RES-E(no HeatPump)
10 RES-G(no HeatPump)
50 RES-E 10 RES-G 25 RES-E 20 RES-g 60 RES-E 10 RES-G
POWER-TO-H2 - 5846 8903 175 21785 3780
GAS GENERATOR (BIO) - -9038 -9747 -7193 -10617 -2272
GAS GENERATOR (BIO) 5333 0 5751 4244 6264 1341
BIOMETHANE - 10791 10791 12648 11009 6952
HEAT PUMP -9042 0 - -9042 -9038 -9042
POWER-TO-H2 -9191 0 -13999 -275 -34254 -5943
WIND 35150 0 30497 49571 59277 67042
-60000
-40000
-20000
-
20000
40000
60000
GW
hRenewable Electricity and Biomethane Output Changing RES Target Ambitions
WIND POWER-TO-H2 HEAT PUMP BIOMETHANE GAS GENERATOR (BIO)
copy Vlerick Business School
CONCLUSIONS
Technology neutral targets are more difficult to formulate given the range of technologies available ndash at different stages of maturity ndash and in the end relate back to the policy objectives in mind static and dynamic efficiency
Emerging technologies which present sector coupling dynamics may increase market and policy interactions
MARTINROACHVLERICKCOM
QampA

copy Vlerick Business School
RELEVANCE OF THE PAPER
Show the impact of some of the possible tools the European Commission is considering to support green gases
RES-Electricity and RES-Gas target
Anticipating interactions between gas electricity and CO2 pricing
copy Vlerick Business School
POSITIONING IN THE ACADEMIC LITERATURE
del Riacuteo P Resch G Ortner A Liebmann L Busch S and Panzer C 2017 A techno-economic analysis of EU renewable electricity policy pathways in 2030 Energy Policy 104 pp484-493 httpsdoiorg101016jenpol201701028
Newbery D 2018 Evaluating the case for supporting renewable electricity Energy Policy 120 pp684-696 httpsdoiorg101016jenpol201805029
Oumlzdemir Ouml Hobbs BF van Hout M and Koutstaal PR 2020 Capacity vs energy subsidies for promoting renewable investment Benefits and costs for the EU power market Energy Policy 137 p111166 httpsdoiorg101016jenpol2019111166
Meus J Van den Bergh K Delarue E and Proost S 2019 On international renewable cooperation mechanisms The impact of national RES-E support schemes Energy Economics 81 pp859-873 httpsdoiorg101016jeneco201905016
Weigt H Ellerman D Delarue E 2013 CO2 abatement from renewables in the German electricity sector Does a CO2 price help Energy Economics Supplement Issue Fifth Atlantic Workshop in Energy and Environmental Economics 40 S149ndashS158 httpsdoiorg101016jeneco201309013
de Jonghe C Delarue E Belmans R Drsquohaeseleer W 2009 Interactions between measures for the support of electricity from renewable energy sources and CO2 mitigation Energy Policy 37 4743ndash4752 httpsdoiorg101016jenpol200906033
STATIC AND DYNAMIC EFFICIENCY INTERACTION BETWEEN RENEWABLE POLICIES AND CARBON PRICING
copy Vlerick Business School
MATHEMATICAL FORMULATIONSUPPLY AND DEMAND SEGMENTS
copy Vlerick Business School
STYLIZED APPROACH NUMERICAL EXAMPLE
Actors are perfectly competitive and have complete information
4 representative days (demand and res generator availability)
Danish Energy Agency technology data as input data for investment costs (equivalent annualized costs) and efficiency
Biogas plant basic configuration + biogas upgrading Large offshore wind Alkaline Electrolyser Heat pump air-to-water existing one family house
Gas turbine combined cycle Natural gas boiler existing one family house Steam Methane Reformer
Assume shippers have access to natural gas at fixed variable costs of 20 euroMWh and biogas producers have a limited cost-competitive feedstock supply ndash increasing variable costs
The RES targets are modelled as certificate markets
Formulated and solved as a mixed complementarity problem
period (t) 70 71 72 73 74 75 76
PRICE - EL (euroMWh) 3390 3390 3390 -4539 1590 1590 -4539
0
10
20
30
40
50
60
70
80
90
100
-
2000
4000
6000
8000
10000
12000
14000
16000
1 6 11 16 21 26 31 36 41 46 51 56 61 66 71 76 81 86 91 96
RES
Gen
erat
ion
Sh
are
()
Dem
and
(M
W)
Period t
55 RES-E Target - Hourly Electricity Profile
HEAT PUMP DEMAND FIXED ELECTRICITY DEMAND
POWER-TO-H2 DEMAND SPILLAGE
Wind Share Biomethane Share
-
20000
40000
60000
80000
100000
120000
Electricitydemand
Electricity supply Heat demand Heat supply H2 demand H2 supply
GW
h
Demand amp Supply per segment
55 RES-Overall Target
FIXED DEMAND NATURAL GAS RES ELECTRICITY SPILLAGE BIOMETHANE
IMPACT OF RES-G SUBSIDY DEFINITION ON BIOMETHANE UNDER 25 RES-E AND 10 RES-G TARGETS
-
50000
100000
150000
ELECTRICITY DEMAND
GW
h WIND
GAS GENERATOR (BIO)
GAS GENERATOR (NG)
-
10000
20000
30000
40000
50000
H2 DEMAND
GW
h POWER-TO-H2
SMR (BIO)
SMR (NG)
-
10000
20000
30000
40000
50000
HEAT DEMAND
GW
h HEAT PUMP
GAS BOILER (BIO)
GAS BOILER (NG)
Electricity FIP
Cases How biomethane used for electricity generation is subsidized
Gas FIP Either FIP If bio vc too high
25 RES-E 10 RES-G25 RES-E(no HeatPump)
10 RES-G(no HeatPump)
50 RES-E 10 RES-G 25 RES-E 20 RES-g 60 RES-E 10 RES-G
POWER-TO-H2 - 5846 8903 175 21785 3780
GAS GENERATOR (BIO) - -9038 -9747 -7193 -10617 -2272
GAS GENERATOR (BIO) 5333 0 5751 4244 6264 1341
BIOMETHANE - 10791 10791 12648 11009 6952
HEAT PUMP -9042 0 - -9042 -9038 -9042
POWER-TO-H2 -9191 0 -13999 -275 -34254 -5943
WIND 35150 0 30497 49571 59277 67042
-60000
-40000
-20000
-
20000
40000
60000
GW
hRenewable Electricity and Biomethane Output Changing RES Target Ambitions
WIND POWER-TO-H2 HEAT PUMP BIOMETHANE GAS GENERATOR (BIO)
copy Vlerick Business School
CONCLUSIONS
Technology neutral targets are more difficult to formulate given the range of technologies available ndash at different stages of maturity ndash and in the end relate back to the policy objectives in mind static and dynamic efficiency
Emerging technologies which present sector coupling dynamics may increase market and policy interactions
MARTINROACHVLERICKCOM
QampA
copy Vlerick Business School
MATHEMATICAL FORMULATIONSUPPLY AND DEMAND SEGMENTS
copy Vlerick Business School
STYLIZED APPROACH NUMERICAL EXAMPLE
Actors are perfectly competitive and have complete information
4 representative days (demand and res generator availability)
Danish Energy Agency technology data as input data for investment costs (equivalent annualized costs) and efficiency
Biogas plant basic configuration + biogas upgrading Large offshore wind Alkaline Electrolyser Heat pump air-to-water existing one family house
Gas turbine combined cycle Natural gas boiler existing one family house Steam Methane Reformer
Assume shippers have access to natural gas at fixed variable costs of 20 euroMWh and biogas producers have a limited cost-competitive feedstock supply ndash increasing variable costs
The RES targets are modelled as certificate markets
Formulated and solved as a mixed complementarity problem
period (t) 70 71 72 73 74 75 76
PRICE - EL (euroMWh) 3390 3390 3390 -4539 1590 1590 -4539
0
10
20
30
40
50
60
70
80
90
100
-
2000
4000
6000
8000
10000
12000
14000
16000
1 6 11 16 21 26 31 36 41 46 51 56 61 66 71 76 81 86 91 96
RES
Gen
erat
ion
Sh
are
()
Dem
and
(M
W)
Period t
55 RES-E Target - Hourly Electricity Profile
HEAT PUMP DEMAND FIXED ELECTRICITY DEMAND
POWER-TO-H2 DEMAND SPILLAGE
Wind Share Biomethane Share
-
20000
40000
60000
80000
100000
120000
Electricitydemand
Electricity supply Heat demand Heat supply H2 demand H2 supply
GW
h
Demand amp Supply per segment
55 RES-Overall Target
FIXED DEMAND NATURAL GAS RES ELECTRICITY SPILLAGE BIOMETHANE
IMPACT OF RES-G SUBSIDY DEFINITION ON BIOMETHANE UNDER 25 RES-E AND 10 RES-G TARGETS
-
50000
100000
150000
ELECTRICITY DEMAND
GW
h WIND
GAS GENERATOR (BIO)
GAS GENERATOR (NG)
-
10000
20000
30000
40000
50000
H2 DEMAND
GW
h POWER-TO-H2
SMR (BIO)
SMR (NG)
-
10000
20000
30000
40000
50000
HEAT DEMAND
GW
h HEAT PUMP
GAS BOILER (BIO)
GAS BOILER (NG)
Electricity FIP
Cases How biomethane used for electricity generation is subsidized
Gas FIP Either FIP If bio vc too high
25 RES-E 10 RES-G25 RES-E(no HeatPump)
10 RES-G(no HeatPump)
50 RES-E 10 RES-G 25 RES-E 20 RES-g 60 RES-E 10 RES-G
POWER-TO-H2 - 5846 8903 175 21785 3780
GAS GENERATOR (BIO) - -9038 -9747 -7193 -10617 -2272
GAS GENERATOR (BIO) 5333 0 5751 4244 6264 1341
BIOMETHANE - 10791 10791 12648 11009 6952
HEAT PUMP -9042 0 - -9042 -9038 -9042
POWER-TO-H2 -9191 0 -13999 -275 -34254 -5943
WIND 35150 0 30497 49571 59277 67042
-60000
-40000
-20000
-
20000
40000
60000
GW
hRenewable Electricity and Biomethane Output Changing RES Target Ambitions
WIND POWER-TO-H2 HEAT PUMP BIOMETHANE GAS GENERATOR (BIO)
copy Vlerick Business School
CONCLUSIONS
Technology neutral targets are more difficult to formulate given the range of technologies available ndash at different stages of maturity ndash and in the end relate back to the policy objectives in mind static and dynamic efficiency
Emerging technologies which present sector coupling dynamics may increase market and policy interactions
MARTINROACHVLERICKCOM
QampA

copy Vlerick Business School
STYLIZED APPROACH NUMERICAL EXAMPLE
Actors are perfectly competitive and have complete information
4 representative days (demand and res generator availability)
Danish Energy Agency technology data as input data for investment costs (equivalent annualized costs) and efficiency
Biogas plant basic configuration + biogas upgrading Large offshore wind Alkaline Electrolyser Heat pump air-to-water existing one family house
Gas turbine combined cycle Natural gas boiler existing one family house Steam Methane Reformer
Assume shippers have access to natural gas at fixed variable costs of 20 euroMWh and biogas producers have a limited cost-competitive feedstock supply ndash increasing variable costs
The RES targets are modelled as certificate markets
Formulated and solved as a mixed complementarity problem
period (t) 70 71 72 73 74 75 76
PRICE - EL (euroMWh) 3390 3390 3390 -4539 1590 1590 -4539
0
10
20
30
40
50
60
70
80
90
100
-
2000
4000
6000
8000
10000
12000
14000
16000
1 6 11 16 21 26 31 36 41 46 51 56 61 66 71 76 81 86 91 96
RES
Gen
erat
ion
Sh
are
()
Dem
and
(M
W)
Period t
55 RES-E Target - Hourly Electricity Profile
HEAT PUMP DEMAND FIXED ELECTRICITY DEMAND
POWER-TO-H2 DEMAND SPILLAGE
Wind Share Biomethane Share
-
20000
40000
60000
80000
100000
120000
Electricitydemand
Electricity supply Heat demand Heat supply H2 demand H2 supply
GW
h
Demand amp Supply per segment
55 RES-Overall Target
FIXED DEMAND NATURAL GAS RES ELECTRICITY SPILLAGE BIOMETHANE
IMPACT OF RES-G SUBSIDY DEFINITION ON BIOMETHANE UNDER 25 RES-E AND 10 RES-G TARGETS
-
50000
100000
150000
ELECTRICITY DEMAND
GW
h WIND
GAS GENERATOR (BIO)
GAS GENERATOR (NG)
-
10000
20000
30000
40000
50000
H2 DEMAND
GW
h POWER-TO-H2
SMR (BIO)
SMR (NG)
-
10000
20000
30000
40000
50000
HEAT DEMAND
GW
h HEAT PUMP
GAS BOILER (BIO)
GAS BOILER (NG)
Electricity FIP
Cases How biomethane used for electricity generation is subsidized
Gas FIP Either FIP If bio vc too high
25 RES-E 10 RES-G25 RES-E(no HeatPump)
10 RES-G(no HeatPump)
50 RES-E 10 RES-G 25 RES-E 20 RES-g 60 RES-E 10 RES-G
POWER-TO-H2 - 5846 8903 175 21785 3780
GAS GENERATOR (BIO) - -9038 -9747 -7193 -10617 -2272
GAS GENERATOR (BIO) 5333 0 5751 4244 6264 1341
BIOMETHANE - 10791 10791 12648 11009 6952
HEAT PUMP -9042 0 - -9042 -9038 -9042
POWER-TO-H2 -9191 0 -13999 -275 -34254 -5943
WIND 35150 0 30497 49571 59277 67042
-60000
-40000
-20000
-
20000
40000
60000
GW
hRenewable Electricity and Biomethane Output Changing RES Target Ambitions
WIND POWER-TO-H2 HEAT PUMP BIOMETHANE GAS GENERATOR (BIO)
copy Vlerick Business School
CONCLUSIONS
Technology neutral targets are more difficult to formulate given the range of technologies available ndash at different stages of maturity ndash and in the end relate back to the policy objectives in mind static and dynamic efficiency
Emerging technologies which present sector coupling dynamics may increase market and policy interactions
MARTINROACHVLERICKCOM
QampA
-
20000
40000
60000
80000
100000
120000
Electricitydemand
Electricity supply Heat demand Heat supply H2 demand H2 supply
GW
h
Demand amp Supply per segment
55 RES-Overall Target
FIXED DEMAND NATURAL GAS RES ELECTRICITY SPILLAGE BIOMETHANE
IMPACT OF RES-G SUBSIDY DEFINITION ON BIOMETHANE UNDER 25 RES-E AND 10 RES-G TARGETS
-
50000
100000
150000
ELECTRICITY DEMAND
GW
h WIND
GAS GENERATOR (BIO)
GAS GENERATOR (NG)
-
10000
20000
30000
40000
50000
H2 DEMAND
GW
h POWER-TO-H2
SMR (BIO)
SMR (NG)
-
10000
20000
30000
40000
50000
HEAT DEMAND
GW
h HEAT PUMP
GAS BOILER (BIO)
GAS BOILER (NG)
Electricity FIP
Cases How biomethane used for electricity generation is subsidized
Gas FIP Either FIP If bio vc too high
25 RES-E 10 RES-G25 RES-E(no HeatPump)
10 RES-G(no HeatPump)
50 RES-E 10 RES-G 25 RES-E 20 RES-g 60 RES-E 10 RES-G
POWER-TO-H2 - 5846 8903 175 21785 3780
GAS GENERATOR (BIO) - -9038 -9747 -7193 -10617 -2272
GAS GENERATOR (BIO) 5333 0 5751 4244 6264 1341
BIOMETHANE - 10791 10791 12648 11009 6952
HEAT PUMP -9042 0 - -9042 -9038 -9042
POWER-TO-H2 -9191 0 -13999 -275 -34254 -5943
WIND 35150 0 30497 49571 59277 67042
-60000
-40000
-20000
-
20000
40000
60000
GW
hRenewable Electricity and Biomethane Output Changing RES Target Ambitions
WIND POWER-TO-H2 HEAT PUMP BIOMETHANE GAS GENERATOR (BIO)
copy Vlerick Business School
CONCLUSIONS
Technology neutral targets are more difficult to formulate given the range of technologies available ndash at different stages of maturity ndash and in the end relate back to the policy objectives in mind static and dynamic efficiency
Emerging technologies which present sector coupling dynamics may increase market and policy interactions
MARTINROACHVLERICKCOM
QampA

MARTINROACHVLERICKCOM
QampA
Related Documents