™ Transforming the Cost Base: 2009 Update 22 October 2009 Finance and Strategy Practice Economic Analysis and Decision Support Group

™ Transforming the Cost Base: 2009 Update 22 October 2009 Finance and Strategy Practice Economic Analysis and Decision Support Group.
Dec 25, 2015
Welcome message from author
This document is posted to help you gain knowledge. Please leave a comment to let me know what you think about it! Share it to your friends and learn new things together.
Transcript

™
Transforming the Cost Base: 2009 Update
22 October 2009
Finance and Strategy Practice
Economic Analysis and Decision Support Group
™
Executive Summary
ROAD MAP FOR THE PRESENTATION
Performance of All Elite Cost Cutters (S&P & Global)
Performance of S&P Elite Cost Cutters
Performance of Industry Leading Cost Cutters
© 2009 The Corporate Executive Board Company. All Rights Reserved. 3Economic Analysis and Decision Support Group
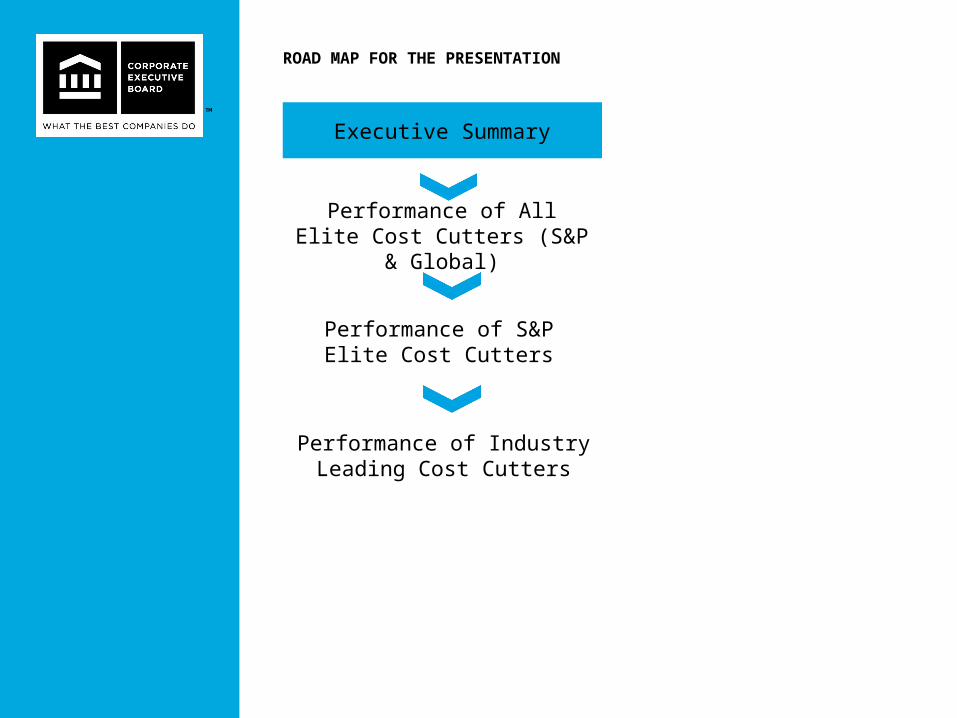
EXECUTIVE SUMMARY
Based on a comprehensive analysis of cost ratios and performance of 480 S&P as well as global companies, we believe that a strategy of aggressive cost management may have run its course. Companies ought to re-focus on generating top-line growth while maintaining cost agility.
I. Declining ability to take costs out the system: Despite the nearly 2% annual reduction in costs they managed over the 1994 to 2004 period, the pace of cost reductions by elite cost cutters has significantly slowed over the recent past. In fact, elite cost cutters within the S&P have seen their COGS levels increase, albeit slightly, over the last year. As a result, elite cost cutters are currently generating cost reductions by lowering SG&A.
We believe the potential for consistent reductions in SG&A to be very limited. Taken together with the flattening of COGS, it suggests a declining ability on the part of elite cost cutters to take more cost out of the system.
II. Focus on cost agility: However, elite cost cutters, whether defined globally, within the S&P, or in terms of industry-specific cost metrics, have significantly lower costs relative to their non-elite peers, and have managed to lower the share of costs even in recessionary environments. This suggests that elite cost cutters are more agile, smoothing out the volatility in costs during turbulent economic times due to better sensing mechanisms as well as better response capabilities such as resource flexibility and decision-making autonomy.
III. Avoid cost cutting at the expense of growth: While elite cost cutters are rewarded in terms of return-based financial metrics (such as return on investment, return on equity and total shareholder return), they are at a significant disadvantage in terms of revenue growth, growing almost 3.5 percentage points slower than their non-elite peers. This result holds even when revenue growth is measured relative to industry in order to control for varying degree of market maturity across companies.
The days of over-relying on cost cutting strategies may be over. Mandates for cost reduction can be especially dangerous when they limit a company’s ability to adequately fund growth initiatives. We recommend that companies avoid a race to the bottom in terms of cost reductions and instead emphasize investments that generate profitable growth.

© 2009 The Corporate Executive Board Company. All Rights Reserved. 4Economic Analysis and Decision Support Group
Elite cost cutters generate significantly higher TSR but also significantly lower revenue growth relative to other companies
• Companies that minimize the growth or volatility of expenses to sales generally have higher ROI relative to other companies.
• However, elite cost cutters are also at a significant disadvantage relative to other companies in terms of revenue growth.
DEFINITIONS
• Elite Cost Cutters refers to companies with negative average annual growth of expense to sales over both the 1994-2000 and the 2001-2008 periods.
• S&P Elite Cost Cutters refers to S&P 500 companies who saw negative average annual growth of expense to sales over both the 1994-2000 and the 2001-2008 periods.
• Industry Cost-Cutting Leaders are companies that experienced below- industry average growth in expense to sales over the 1994-2000 as well as the 2001-2008 period.
Comparison of Elite Cost ManagersBy Financial Performance (all companies)
Return on Equity
Revenue CAGR
Return on Investment TSR
All Elite Cost Cutters Significantly higher
than other
companies
Significantly
lower than other
companies
Significantly higher
than other
companies N/A
S&P 500 Elite Cost
Cutters
Statistically
indistinguishable
from other
companies
Statistically
indistinguishable
from other
companies
Significantly higher
than other
companies
Significantly higher
than other
companies
Industry Cost Cutting
Leaders
Statistically
indistinguishable
from other
companies
Significantly
lower than other
companies
Significantly higher
than other
companies
Significantly higher
than other
companies
Financial
MetricDefinition
Of Elite
** Statistically significant differences were assessed using a 95% threshold level of significance in a two-sample t-test.
™
Executive Summary
ROAD MAP FOR THE PRESENTATION
Performance of All Elite Cost Cutters (S&P & Global)
Performance of S&P Elite Cost Cutters
Performance of Industry Leading Cost Cutters
© 2009 The Corporate Executive Board Company. All Rights Reserved. 6Economic Analysis and Decision Support Group
Other Companies79%
Elite Cost Cutters21%
Energy11%
Materials10%
Industrials16%
Consumer Discretionary15%
Consumer Staples19%
Health Care14%
Financials2%
Information Technology12%
Telecommunications0%
Utilities1%
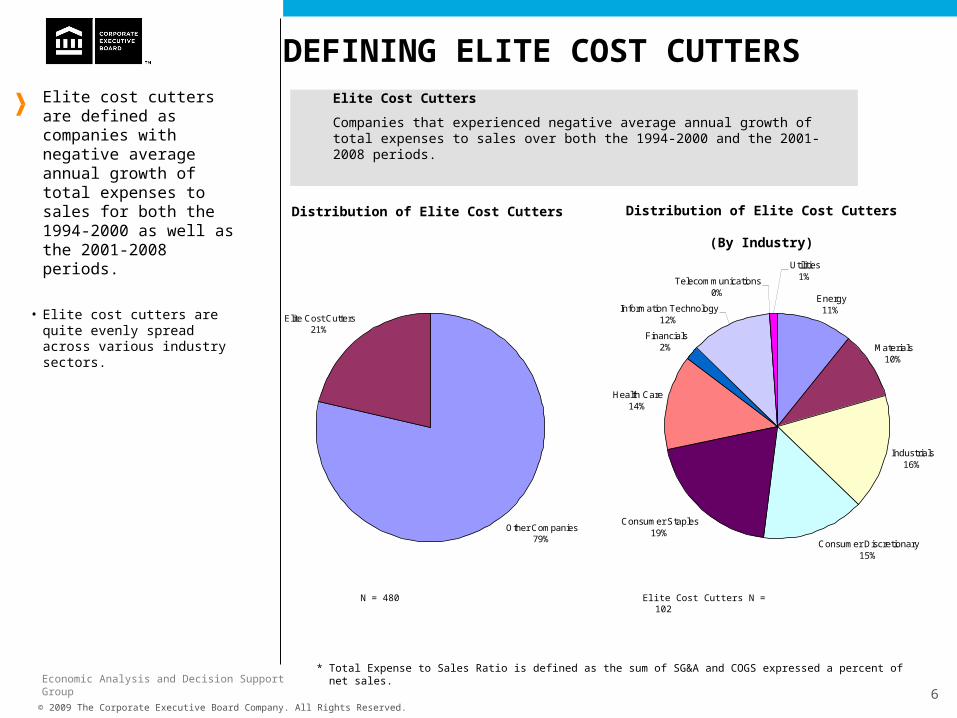
DEFINING ELITE COST CUTTERSElite cost cutters are defined as companies with negative average annual growth of total expenses to sales for both the 1994-2000 as well as the 2001-2008 periods.
• Elite cost cutters are quite evenly spread across various industry sectors.
Elite Cost Cutters N = 102
* Total Expense to Sales Ratio is defined as the sum of SG&A and COGS expressed a percent of net sales.
Elite Cost Cutters
Companies that experienced negative average annual growth of total expenses to sales over both the 1994-2000 and the 2001-2008 periods.
Distribution of Elite Cost Cutters Distribution of Elite Cost Cutters
(By Industry)
N = 480
© 2009 The Corporate Executive Board Company. All Rights Reserved. 7Economic Analysis and Decision Support Group
65%
70%
75%
80%
85%
90%
1994 1995 1996 1997 1998 1999 2000 2001 2002 2003 2004 2005 2006 2007 2008
All Elite CostCutters
OtherCompanies
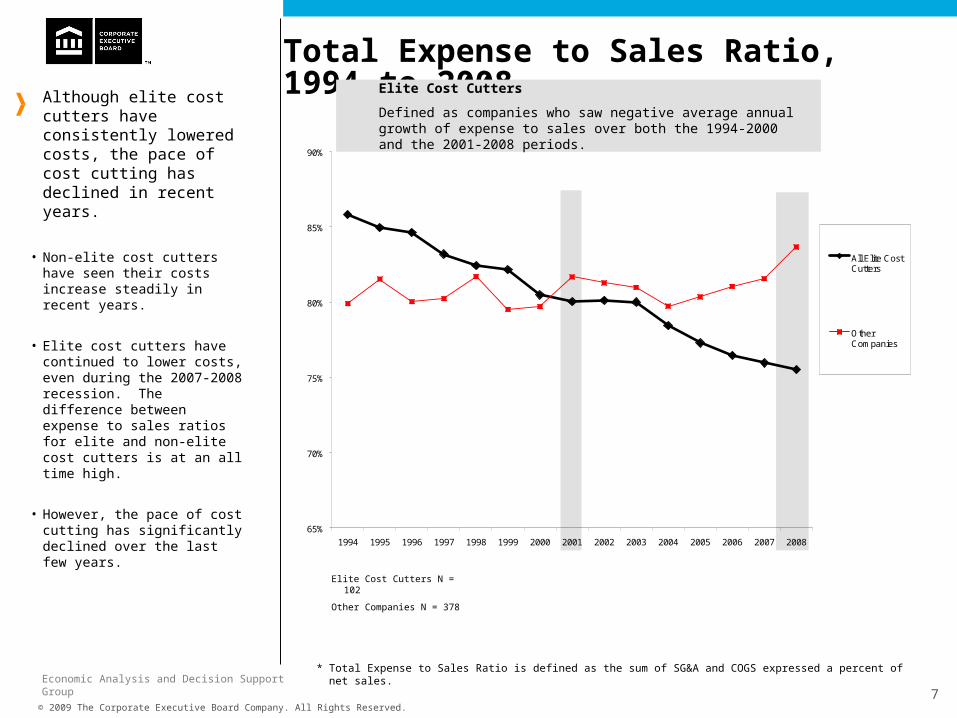
Total Expense to Sales Ratio, 1994 to 2008Although elite cost cutters
have consistently lowered costs, the pace of cost cutting has declined in recent years.
• Non-elite cost cutters have seen their costs increase steadily in recent years.
• Elite cost cutters have continued to lower costs, even during the 2007-2008 recession. The difference between expense to sales ratios for elite and non-elite cost cutters is at an all time high.
• However, the pace of cost cutting has significantly declined over the last few years.
Elite Cost Cutters N = 102
Other Companies N = 378
Elite Cost Cutters
Defined as companies who saw negative average annual growth of expense to sales over both the 1994-2000 and the 2001-2008 periods.
* Total Expense to Sales Ratio is defined as the sum of SG&A and COGS expressed a percent of net sales.
© 2009 The Corporate Executive Board Company. All Rights Reserved. 8Economic Analysis and Decision Support Group
45.0%
50.0%
55.0%
60.0%
65.0%
1994 1995 1996 1997 1998 1999 2000 2001 2002 2003 2004 2005 2006 2007 2008
Elite Cost Cutters
Other Companies
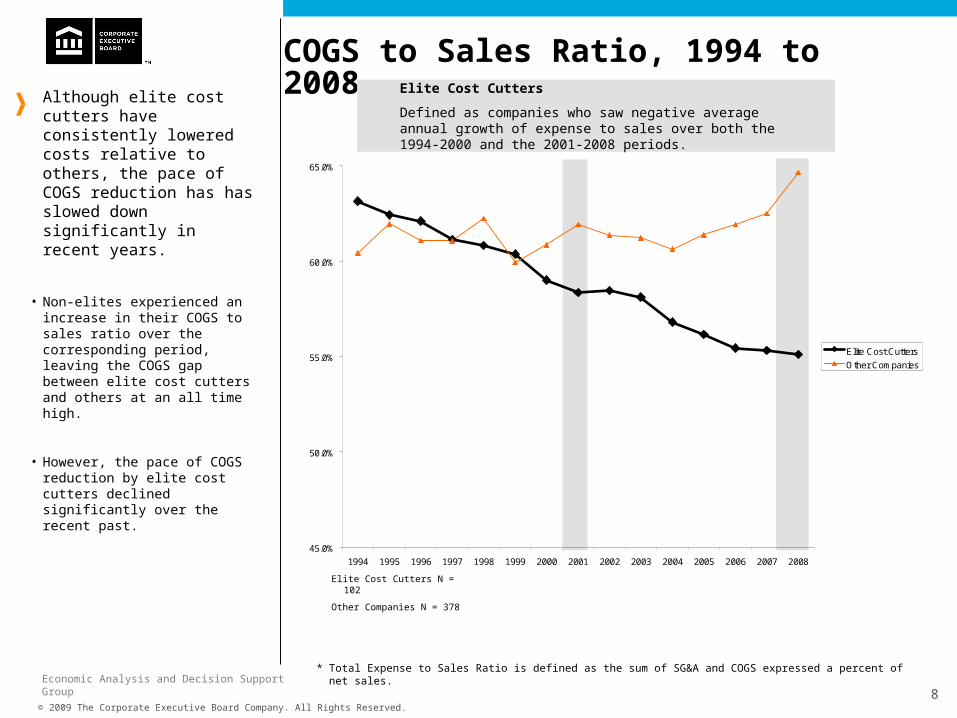
COGS to Sales Ratio, 1994 to 2008Although elite cost cutters have consistently lowered costs relative to others, the pace of COGS reduction has has slowed down significantly in recent years.
• Non-elites experienced an increase in their COGS to sales ratio over the corresponding period, leaving the COGS gap between elite cost cutters and others at an all time high.
• However, the pace of COGS reduction by elite cost cutters declined significantly over the recent past.
Elite Cost Cutters N = 102
Other Companies N = 378
Elite Cost Cutters
Defined as companies who saw negative average annual growth of expense to sales over both the 1994-2000 and the 2001-2008 periods.
* Total Expense to Sales Ratio is defined as the sum of SG&A and COGS expressed a percent of net sales.

© 2009 The Corporate Executive Board Company. All Rights Reserved. 9Economic Analysis and Decision Support Group
SG&A to Sales Ratio, 1994 to 2008Elite Cost Cutters have slightly reduced their SG&A to sales ratio over the last 5 year period.
• Other companies have seen their SG&A to sales ratios remain relatively constant over the past few years.
• The potential for further reductions
in SG&A may be limited.
Elite Cost Cutters N = 102
Other Companies N = 378
Elite Cost Cutters
Defined as companies who saw negative average annual growth of expense to sales over both the 1994-2000 and the 2001-2008 periods.
* Total Expense to Sales Ratio is defined as the sum of SG&A and COGS expressed a percent of net sales.
15%
20%
25%
1994 1995 1996 1997 1998 1999 2000 2001 2002 2003 2004 2005 2006 2007 2008
Elite Cost Cutters
Other Companies

© 2009 The Corporate Executive Board Company. All Rights Reserved. 10Economic Analysis and Decision Support Group
11.5%
15.1%
All Elite Cost Cutters Other Companies
18.4%
13.2%
All Elite Cost Cutters Other Companies
Average Return on Equity, ’94-’08Elite cost cutters have higher return on equity but significantly lower revenue growth relative to other companies.
• Not surprisingly, elite cost cutters have more than a 5 percentage point advantage in terms of return on equity relative to other companies.
• However, elite cost cutters have significantly lower revenue growth compared to other companies.
Revenue CAGR, ’94-’08
T-Test for Differences in Means
Result: Elite cost cutters have significantly higher ROE relative to others.
T-Statistic: 2.20
P-value*: 0.030
T-Test for Differences in Means
Result: Elite cost cutters have significantly lower revenue growth relative to others.
T-Statistic: -3.17
P-value*: 0.002
Elite Cost Cutters N = 102
Other Companies N = 378
<
>
* P-values of .1 or less represent statistically significant differences at the 90% threshold level of significance.

© 2009 The Corporate Executive Board Company. All Rights Reserved. 11Economic Analysis and Decision Support Group
12.0%
9.0%
All Elite Cost Cutters Other Companies
Average ROI, 1994-2008Elite cost cutters generate a significantly higher return on investment relative to other companies.
T-Test for Differences in Means
Result: Elite cost cutters have significantly higher ROI.
T-Statistic: 2.46
P-value*: 0.014
Elite Cost Cutters N = 102
Other Companies N = 378
>
* P-values of .1 or less represent statistically significant differences at the 90% threshold level of significance.

™
Executive Summary
ROAD MAP FOR THE PRESENTATION
Performance of All Elite Cost Cutters (S&P & Global)
Performance of S&P Elite Cost Cutters
Performance of Industry Leading Cost Cutters

© 2009 The Corporate Executive Board Company. All Rights Reserved. 13Economic Analysis and Decision Support Group
S&P Elite Cost Cutters25%
Other S&P Companies75%
Energy14%
Materials7%
Industrials9%
Consumer Discretionary17%Consumer Staples
20%
Health Care14%
Financials3%
Information Technology16%
Telecommunications0%
Utilities0%
DEFINING ELITE COST CUTTERSThe Board also examined the behavior and performance of elite cost cutters within the S&P 500.
• S&P elite cost cutters are fairly evenly distributed across various industry sectors.
S&P Elite Cost Cutters N = 69
* Total Expense to Sales Ratio is defined as the sum of SG&A and COGS expressed a percent of net sales.
S&P Elite Cost Cutters
S&P companies that experienced negative average annual growth of total expenses to sales over both the 1994-2000 and the 2001-2008 periods.
Distribution of S&P Elite Cost Cutters Distribution of S&P Elite Cost Cutters
(By Industry)
S&P Companies N = 275

© 2009 The Corporate Executive Board Company. All Rights Reserved. 14Economic Analysis and Decision Support Group
65%
70%
75%
80%
85%
90%
1994 1995 1996 1997 1998 1999 2000 2001 2002 2003 2004 2005 2006 2007 2008
S&P Non-Elite
S&P Elite
Total Expense to Sales Ratio, 1994 to 2008(S&P 500 Companies Only)
Although S&P 500 elite cost cutters significantly reduced costs, the pace of cost reductions has slowed significantly in recent years.
• Other S&P 500 companies witnessed an increase in their expense to sales ratios over the corresponding period, leaving the gap between S&P 500 companies and others at an all-time high.
• However, the pace of cost reductions by elite cost cutters has declined significantly relative to to 2002-2005 period.
S&P Non-Elite N = 206
S&P Elite N = 69
S&P Elite cost cutters have lowered their expense to sales ratios even during the current recession.
S&P Elite Cost Cutters
Defined as S&P companies who saw negative average annual growth of expense to sales over both the 1994-2000 and the 2001-2008 periods.

© 2009 The Corporate Executive Board Company. All Rights Reserved. 15Economic Analysis and Decision Support Group
COGS to Sales Ratio, 1994 to 2008(S&P 500 Companies Only)
After a long period of consistent increase in gross margins, the rate of COGS-to-Sales reduction experienced by S&P 500 Elite Cost Cutters has declined in recent years and even shown signs of increase between 2007 and 2008.
• S&P 500 companies witnessed an increase in their COGS to sales ratio over the last five years.
• The long-term strategy of COGS reduction by S&P elites appears to be loosing momentum.
S&P Non-Elite N = 206
S&P Elite N = 69
S&P Elite Cost Cutters
Defined as S&P companies who saw negative average annual growth of expense to sales over both the 1994-2000 and the 2001-2008 periods.
45%
50%
55%
60%
65%
1994 1995 1996 1997 1998 1999 2000 2001 2002 2003 2004 2005 2006 2007 2008
S&P Non-Elite
S&P Elite
© 2009 The Corporate Executive Board Company. All Rights Reserved. 16Economic Analysis and Decision Support Group
15%
20%
25%
30%
1994 1995 1996 1997 1998 1999 2000 2001 2002 2003 2004 2005 2006 2007 2008
S&P Non-Elite
S&P Elite
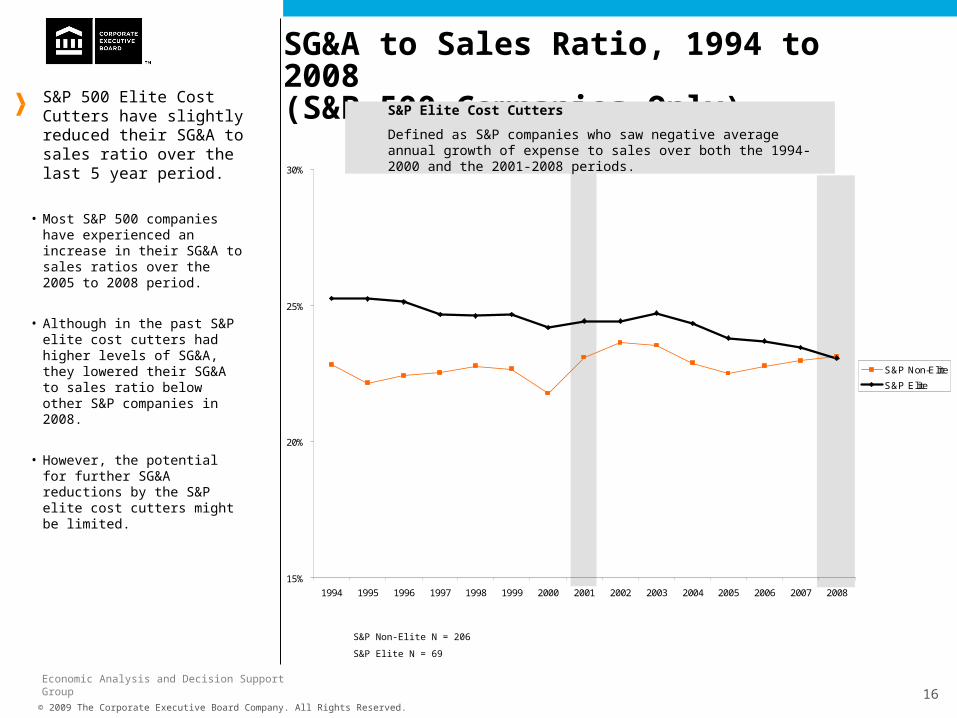
SG&A to Sales Ratio, 1994 to 2008(S&P 500 Companies Only)
S&P 500 Elite Cost Cutters have slightly reduced their SG&A to sales ratio over the last 5 year period.
• Most S&P 500 companies have experienced an increase in their SG&A to sales ratios over the 2005 to 2008 period.
• Although in the past S&P elite cost cutters had higher levels of SG&A, they lowered their SG&A to sales ratio below other S&P companies in 2008.
• However, the potential for further SG&A reductions by the S&P elite cost cutters might be limited.
S&P Elite Cost Cutters
Defined as S&P companies who saw negative average annual growth of expense to sales over both the 1994-2000 and the 2001-2008 periods.
S&P Non-Elite N = 206
S&P Elite N = 69

© 2009 The Corporate Executive Board Company. All Rights Reserved. 17Economic Analysis and Decision Support Group
21.5%
16.4%
S&P Elite Other S&P Companies
21.5%
16.4%
S&P Elite Other S&P Companies
Average Return on Equity, 1994-2008S&P elite cost cutters have
equivalent levels of return on equity and revenue growth relative to other S&P companies.
• Although S&P elite cost cutters generate somewhat higher return on equity, the difference between their ROE and that of other S&P companies is not statistically significant.
• While S&P elite cost cutters have experienced lower growth in revenue compared to other S&P peers, this difference is not statistically significant.
T-Test for Differences in Means
Result: S&P Elite cost cutters do not significantly differ from others in terms of ROE.
T-Statistic: 1.573
P-value*: 0.118
S&P Elite N = 69
Other Companies N = 206* P-values of .1 or less represent statistically significant differences at the 90% threshold
level of significance.
11.8%12.7%
S&P Elite Other S&P Companies
Revenue CAGR, 1994-2008T-Test for Differences in
Means
Result: S&P Elite cost cutters do not significantly differ from others in their revenue CAGR.
T-Statistic: -0.64
P-value*: 0.534
≈
≈

© 2009 The Corporate Executive Board Company. All Rights Reserved. 18Economic Analysis and Decision Support Group
7.9%
1.8%
S&P Elite Other S&P Companies
13.7%
10.4%
S&P Elite Other S&P Companies
Average ROI, 1994-2008Over the last ten years, the Wall Street has rewarded the S&P elite cost cutters with significantly higher TSR and return on investment relative to other S&P companies.
• S&P elite companies have more than a 3 percentage point advantage over other S&P companies in terms of return on investment.
• They have almost 4.5 times higher shareholder return relative to other S&P companies. 10-Year TSR, 1994-2008
T-Test for Differences in Means
Result: S&P elite cost cutters have significantly higher ROI.
T-Statistic: 2.38
P-value*: 0.012
T-Test for Differences in Means
Result: S&P elite cost cutters have significantly higher TSR.
T-Statistic: 4.62
P-value*: 0.000
S&P Elite N = 69
Other Companies N = 206
>
>
* P-values of .1 or less represent statistically significant differences at the 90% threshold level of significance.
™
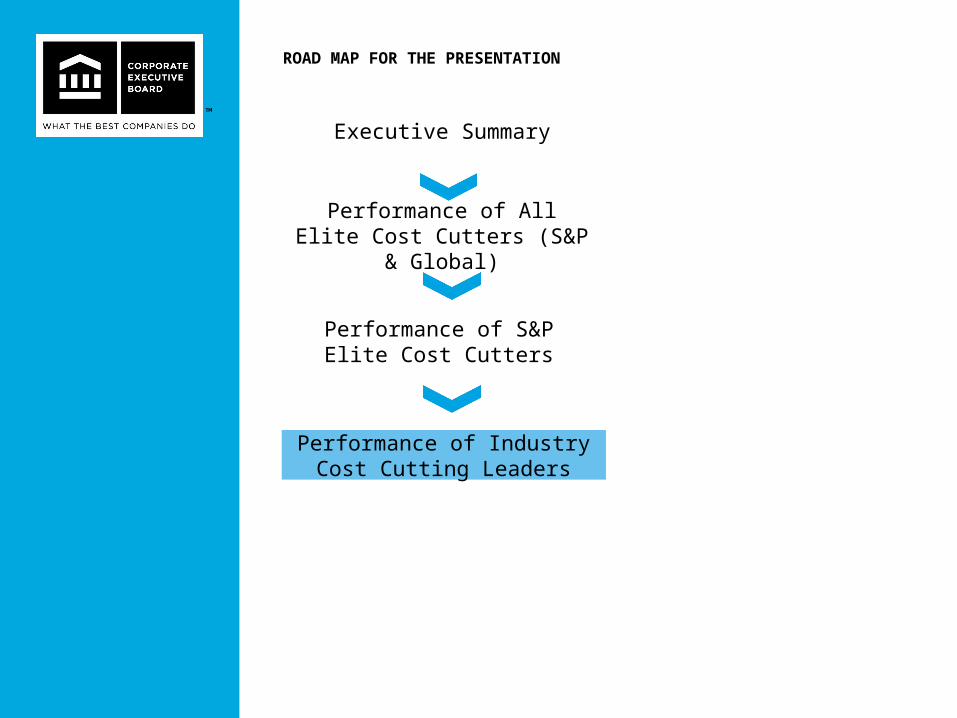
Executive Summary
ROAD MAP FOR THE PRESENTATION
Performance of All Elite Cost Cutters (S&P & Global)
Performance of S&P Elite Cost Cutters
Performance of Industry Cost Cutting Leaders

© 2009 The Corporate Executive Board Company. All Rights Reserved. 20Economic Analysis and Decision Support Group
Other Companies75%
Industry Cost Cutting Leaders
25%
Energy6%
Materials16%
Industrials24%
Consumer Discretionary20%
Consumer Staples8%
Health Care8%
Financials6%
Information Technology9%
Telecommunications1%
Utilities2%
DEFINING AN INDUSTRY COST CUTTING LEADERIndustry cost cutting leaders
are defined as the companies whose cost grew at below-average levels relative to their industry during 994-2000 as well as 2001-2008.
• Industry cost cutting leaders represent a variety of industry sectors.
Distribution of Industry Cost
Cutting Leaders
N = 480
Distribution of Industry Cost Cutting
Leaders
By Industry
Industry Cost Cutting Leaders N = 119
Industry Cost-Cutting Leaders
Defined as companies that experienced below- industry average growth in expense to sales over the 1994-2000 as well as the 2001-2008 period.

© 2009 The Corporate Executive Board Company. All Rights Reserved. 21Economic Analysis and Decision Support Group
Total Expense to Sales Ratio, 1994 to 2008(Industry Cost Cutting Leaders)
Although industry cost cutting leaders have consistently lowered costs over the last decade, the pace of cost cutting has declined in recent years.
• Most companies have experienced steady increases in costs, leaving the gap between them and cost cutting leaders at an all-time high.
• However, the pace of cost cutting has declined relative to previous years.
Other Companies N = 361
Industry Cost Cutting Leaders N = 119
Industry Cost-Cutting Leaders
Defined as companies that experienced below- industry average growth in expense to sales over the 1994-2000 as well as the 2001-2008 period.
65.0%
70.0%
75.0%
80.0%
85.0%
90.0%
1994 1995 1996 1997 1998 1999 2000 2001 2002 2003 2004 2005 2006 2007 2008
Industry Cost Cutting Leaders
Other Companies

© 2009 The Corporate Executive Board Company. All Rights Reserved. 22Economic Analysis and Decision Support Group
45.0%
50.0%
55.0%
60.0%
65.0%
70.0%
1994 1995 1996 1997 1998 1999 2000 2001 2002 2003 2004 2005 2006 2007 2008
Industry Cost Cutting Leaders
Other Companies
COGS to Sales Ratio, 1994 to 2008(Industry Cost Cutting Leaders vs Other)
Industry cost cutting leaders have significantly lower COGS than other companies, but the pace of COGS reduction are slowed significantly.
• Most companies have experienced a steady increase in COGS over the last 5 years.
• Although industry cost cutting leaders continue to have much lower COGS to sales, they have significantly slowed the pace of COGS reduction over the last five years.
Industry Cost-Cutting Leaders
Defined as companies that experienced below- industry average growth in expense to sales over the 1994-2000 as well as the 2001-2008 period.
Other Companies N = 361
Industry Cost Cutting Leaders N = 119
© 2009 The Corporate Executive Board Company. All Rights Reserved. 23Economic Analysis and Decision Support Group
0.0%
5.0%
10.0%
15.0%
20.0%
25.0%
30.0%
1994 1995 1996 1997 1998 1999 2000 2001 2002 2003 2004 2005 2006 2007 2008
Industry Cost Cutting Leaders
Other Companies
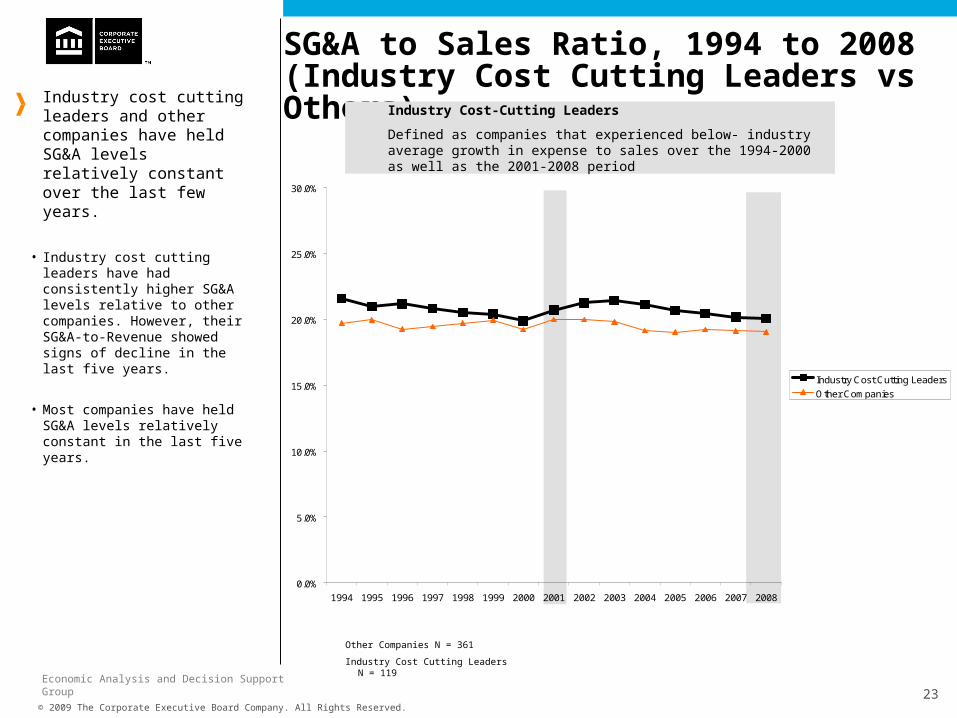
SG&A to Sales Ratio, 1994 to 2008(Industry Cost Cutting Leaders vs Others)
Industry cost cutting leaders and other companies have held SG&A levels relatively constant over the last few years.
• Industry cost cutting leaders have had consistently higher SG&A levels relative to other companies. However, their SG&A-to-Revenue showed signs of decline in the last five years.
• Most companies have held SG&A levels relatively constant in the last five years.
Industry Cost-Cutting Leaders
Defined as companies that experienced below- industry average growth in expense to sales over the 1994-2000 as well as the 2001-2008 period
Other Companies N = 361
Industry Cost Cutting Leaders N = 119
© 2009 The Corporate Executive Board Company. All Rights Reserved. 24Economic Analysis and Decision Support Group
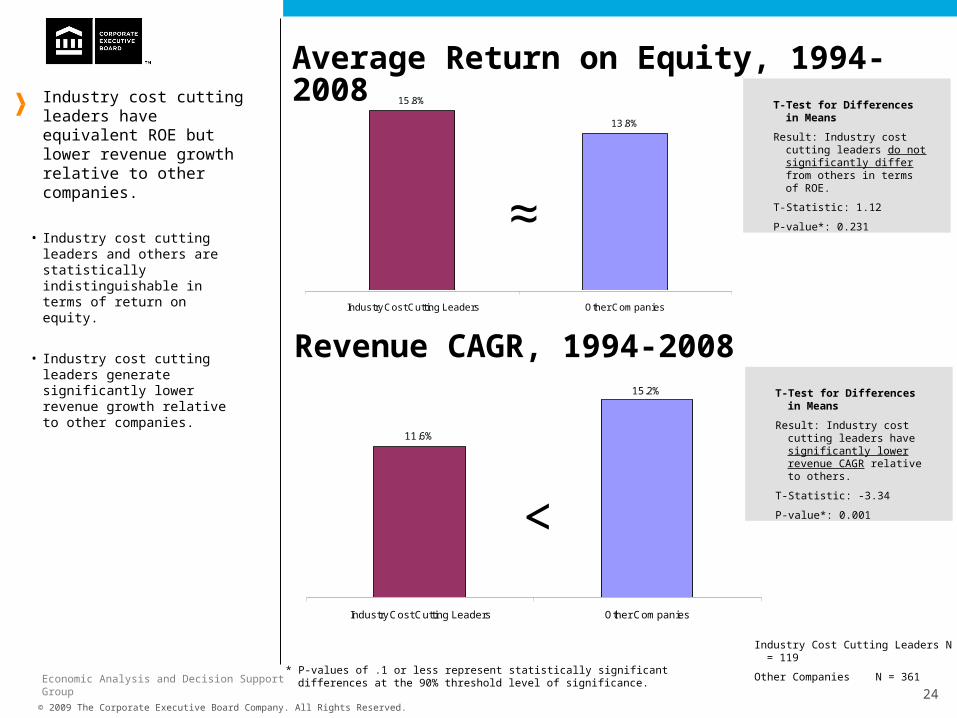
11.6%
15.2%
Industry Cost Cutting Leaders Other Companies
15.8%
13.8%
Industry Cost Cutting Leaders Other Companies
Average Return on Equity, 1994-2008Industry cost cutting leaders
have equivalent ROE but lower revenue growth relative to other companies.
• Industry cost cutting leaders and others are statistically indistinguishable in terms of return on equity.
• Industry cost cutting leaders generate significantly lower revenue growth relative to other companies.
T-Test for Differences in Means
Result: Industry cost cutting leaders do not significantly differ from others in terms of ROE.
T-Statistic: 1.12
P-value*: 0.231
* P-values of .1 or less represent statistically significant differences at the 90% threshold level of significance.
Revenue CAGR, 1994-2008T-Test for Differences in
Means
Result: Industry cost cutting leaders have significantly lower revenue CAGR relative to others.
T-Statistic: -3.34
P-value*: 0.001<
≈
Industry Cost Cutting Leaders N = 119
Other Companies N = 361
© 2009 The Corporate Executive Board Company. All Rights Reserved. 25Economic Analysis and Decision Support Group
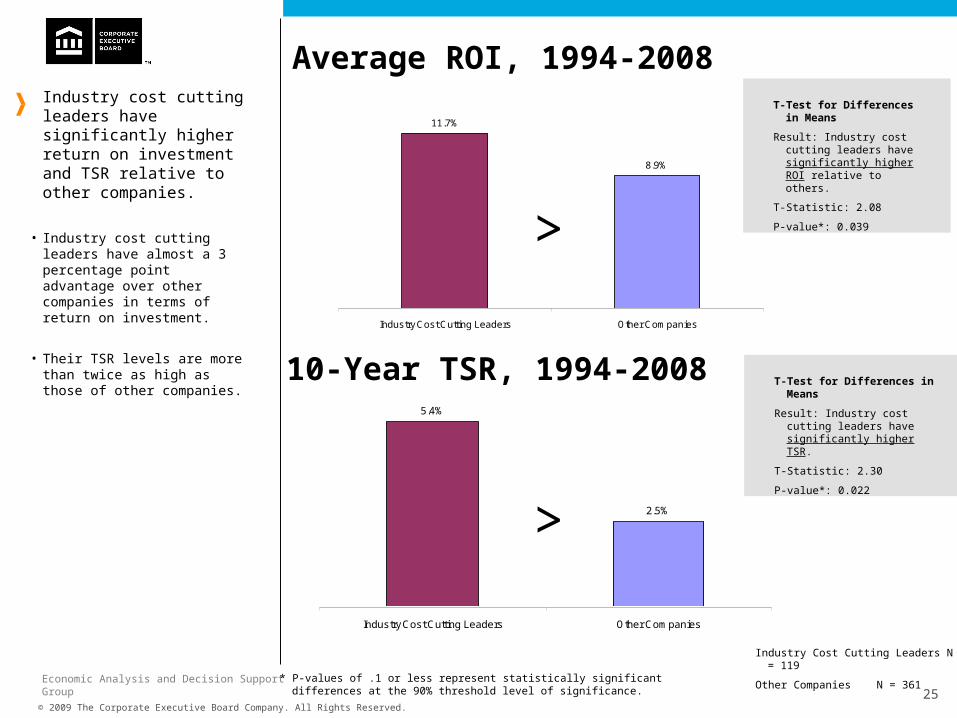
5.4%
2.5%
Industry Cost Cutting Leaders Other Companies
11.7%
8.9%
Industry Cost Cutting Leaders Other Companies
Average ROI, 1994-2008Industry cost cutting leaders have significantly higher return on investment and TSR relative to other companies.
• Industry cost cutting leaders have almost a 3 percentage point advantage over other companies in terms of return on investment.
• Their TSR levels are more than twice as high as those of other companies.
10-Year TSR, 1994-2008
T-Test for Differences in Means
Result: Industry cost cutting leaders have significantly higher ROI relative to others.
T-Statistic: 2.08
P-value*: 0.039
T-Test for Differences in Means
Result: Industry cost cutting leaders have significantly higher TSR.
T-Statistic: 2.30
P-value*: 0.022
>
>
* P-values of .1 or less represent statistically significant differences at the 90% threshold level of significance.
Industry Cost Cutting Leaders N = 119
Other Companies N = 361

CORPORATE EXECUTIVE BOARD
WWW.EXECUTIVEBOARD.COM
™
Economic Analysis and Decision Support Group
Randeep Rathindran Director
Oleg Polishchuk Senior DirectorAnil Prahlad Managing Director
EADS contact information:
571.303.6257
Related Documents