Indonesia’s PNPM Generasi Program: Benjamin A. Olken, M.I.T. Department of Economics Junko Onishi, The World Bank Susan Wong, The World Bank January 2010 Interim Impact Evaluation Report Public Disclosure Authorized Public Disclosure Authorized Public Disclosure Authorized Public Disclosure Authorized Public Disclosure Authorized Public Disclosure Authorized Public Disclosure Authorized Public Disclosure Authorized

Welcome message from author
This document is posted to help you gain knowledge. Please leave a comment to let me know what you think about it! Share it to your friends and learn new things together.
Transcript

Indonesia’s PNPM Generasi Program:
Benjamin A. Olken, M.I.T. Department of EconomicsJunko Onishi, The World BankSusan Wong, The World Bank
January 2010
Interim Impact Evaluation Report
Pub
lic D
iscl
osur
e A
utho
rized
Pub
lic D
iscl
osur
e A
utho
rized
Pub
lic D
iscl
osur
e A
utho
rized
Pub
lic D
iscl
osur
e A
utho
rized
Pub
lic D
iscl
osur
e A
utho
rized
Pub
lic D
iscl
osur
e A
utho
rized
Pub
lic D
iscl
osur
e A
utho
rized
Pub
lic D
iscl
osur
e A
utho
rized
wb370910
Typewritten Text
59567

THE WORLD BANKJakarta Stock Exchange Building Tower II/12th Fl.Jl. Jend. Sudirman Kav. 52-53Jakarta 12910Tel: (6221) 5299-3000Fax: (6221) 5299-3111
Printed in January 2010. This volume is a product of staff of the World Bank. The fi ndings, interpretations, and conclusions expressed herein do not necessarily refl ect the views of the Board of Executive Directors of the World Bank or the governments they represent.
The World Bank does not guarantee the accuracy of the data included in this work. The boundaries, colors, denominations, and other information shown on any map in this work do not imply any judgment on the part of the World Bank concerning the legal status of any territory or the endorsement of acceptance of such boundaries.

Indonesia’s PNPM Generasi Program:
Benjamin A. Olken, M.I.T. Department of EconomicsJunko Onishi, The World BankSusan Wong, The World Bank
Interim Impact Evaluation Report

ii Indonesia’s PNPM Generasi Program: Interim Impact Evaluation Report
Table of Contents
Acknowledgments vGlossary viExecutive Summary 71. Introduction 11 1.1 Background 11 1.2 The Generasi project 12 1.3 Experimental Design 17 1.4 Survey Design and Implementation 192. Evaluation Methodology 23 2.1 Regression Specifi cations 23 2.2 Balance Tests 253. Main Results 27 3.1 Impact on the Twelve Main Health and Education Indicators 27 3.1.1 Overall effects 27 3.1.2 Robustness Tests 30 3.1.3 Regional Differences 32 3.2 Impact on Long-Term Final Outcomes 34 3.2.1 All Provinces 34 3.2.2 Regional Breakdown 36 3.3 Impact on Non-Targeted Indicators 37 3.3.1 All Provinces 37 3.3.2 Regional Breakdown 384. Where Were Generasi Effects Largest? 41 4.1 Areas 41 4.1.1 All Provinces 41 4.1.2 Regional Breakdown 42 4.2 Individuals 43 4.2.1 All Provinces 43 4.2.2 Regional Breakdown 44 4.3 Direct Benefi ts of Generasi Funds 45 4.3.1 All Provinces 45 4.3.2 Regional Breakdown 465. How and Why did the Generasi Project Work? 47 5.1 Changes in Provider Quantities 48 5.1.1 All Provinces 48 5.1.2 Regional Breakdown 48 5.2 Changes in Provider Inputs 48 5.2.1 All Provinces 49 5.2.2 Regional Breakdown 49 5.3 Changes in Provider Effort 49 5.3.1 All Provinces 49 5.3.2 Regional Breakdown 50 5.4 Changes in Community Effort 51

Indonesia’s PNPM Generasi Program: Interim Impact Evaluation Report iii
5.4.1 All Provinces 52 5.4.2 Regional Breakdown 52 5.5 Quantities from Provider Data 53 5.5.1 All Provinces 53 5.5.2 Regional Breakdown 546. Discussion 557. Policy Implications and Conclusion 59References 61Annex 63 Annex I: Randomization and Implementation of Generasi in 2007 63
List of TablesTable 1. Performance metrics and weights 16Table 2. Questionnaire modules and sample size 20Table 3. Generasi implementation and randomization results 64Table 4. Baseline regressions, 12 main indicators * 65Table 5. Baseline regressions, long-term fi nal outcomes 66Table 6. Results for main indicators, all provinces (baseline as control variable) 67Table 7. Results for main indicators, all provinces (robustness to alternative specifi cations) 69Table 8. Results for main indicators, Java (baseline as control variable) 70Table 9. Results for main indicators, East Nusa Tenggara (baseline as control variable) 72Table 10. Results for main indicators, Sulawesi /Gorontalo (baseline as control variable) 74Table 11. Results for fi nal outcomes, all provinces (baseline as control variable) 76Table 12. Results for fi nal outcomes, Java (baseline as control variable) 77Table 13. Results for fi nal outcomes, East Nusa Tenggara (baseline as control variable) 78Table 14. Results for fi nal outcomes, Sulawesi /Gorontalo (baseline as control variable) 79Table 15. Results for non-targeted outcomes, all provinces (baseline as control variable) 80Table 16. Results for non-targeted outcomes, Java (baseline as control variable) 82Table 17. Results for non-targeted outcomes, East Nusa Tenggara (baseline as control variable) 84Table 18. Results for non-targeted outcomes, Sulawesi /Gorontalo (baseline as control variable) 86Table 19. Results for main indicators, all provinces (interaction with pre-period level of outcome variable, model 1) 88Table 20. Results for main indicators, all provinces (interaction with pre-period level of outcome variable, model 2) 89Table 21. Results for main indicators, Java (interaction with pre-period level of outcome variable, model 1) 90Table 22. Results for main indicators, Java (interaction with pre-period level of outcome variable, model 2) 91Table 23. Results for main indicators, East Nusa Tenggara (interaction with pre-period level of outcome variable, model 1) 92Table 24. Results for main indicators, East Nusa Tenggara (interaction with pre-period level of outcome variable, model 2) 93Table 25. Results for main indicators, Sulawesi (interaction with pre-period level of outcome variable, model 1) 94Table 26. Results for main indicators, Sulawesi (interaction with pre-period level of outcome variable, model 2) 95Table 27. Results for main indicators, all provinces (split by per-capita consumption quintile, model 1) 96Table 28. Results for main indicators, all provinces (split by per-capita consumption quintile, model 2) 97Table 29. Results for main indicators, Java (split by per-capita consumption quintile, model 1) 98

iv Indonesia’s PNPM Generasi Program: Interim Impact Evaluation Report
Table 30. Results for main indicators, Java (split by per-capita consumption quintile, model 2) 99Table 31. Results for main indicators, East Nusa Tenggara (split by per-capita consumption quintile, model 1) 100Table 32. Results for main indicators, East Nusa Tenggara (split by per-capita consumption quintile, model 2) 101Table 33. Results for main indicators, Sulawesi (split by per-capita consumption quintile, model 1) 102Table 34. Results for main indicators, Sulawesi (split by per-capita consumption quintile, model 2) 103Table 35. Direct benefi ts, all provinces (baseline as control variable) 104Table 36. Direct benefi ts, Java (baseline as control variable) 105Table 37. Direct benefi ts, East Nusa Tenggara (baseline as control variable) 106Table 38. Direct benefi ts, Sulawesi /Gorontalo (baseline as control variable) 107Table 39. Results for service provider quantities, all provinces (baseline as control variable) 108Table 40. Results for service provider quantities, Java (baseline as control variable) 109Table 41. Results for service provider quantities, East Nusa Tenggara (baseline as control variable) 110Table 42. Results for service provider quantities, Sulawesi /Gorontalo (baseline as control variable) 111Table 43. Results for service provider inputs, all provinces (baseline as control variable) 112Table 44. Results for service provider inputs, Java (baseline as control variable) 113Table 45. Results for service provider inputs, East Nusa Tenggara (baseline as control variable) 114Table 46. Results for service provider inputs, Sulawesi /Gorontalo (baseline as control variable) 115Table 47. Results for service provider efforts, all provinces (baseline as control variable) 116Table 48. Results for service provider efforts, Java (baseline as control variable) 117Table 49. Results for service provider efforts, East Nusa Tenggara (baseline as control variable) 118Table 50. Results for service provider efforts, Sulawesi /Gorontalo (baseline as control variable) 119Table 51. Community effort, all provinces (baseline as control variable) 120Table 52. Community effort, Java (baseline as control variable) 122Table 53. Community effort, East Nusa Tenggara (baseline as control variable) 124Table 54. Community effort, North Sulawesi/Gorontalo (baseline as control variable) 126Table 55. Results for service-provider-based quantities, all provinces (baseline as control variable) 128Table 56. Results for service-provider-based quantities, Java (baseline as control variable) 133Table 57. Results for service-provider-based quantities, East Nusa Tenggara (baseline as control variable) 139Table 58. Results for service-provider-based quantities, Sulawesi /Gorontalo (baseline as control variable) 144Table 59. Detail of mortality vis-à-vis baseline (neonatal mortality) 149Table 60. Detail of mortality vis-à-vis baseline (infant mortality) 150
List of BoxesBox 1. Generasi Program Target Indicators 14

Indonesia’s PNPM Generasi Program: Interim Impact Evaluation Report v
AcknowledgmentsThe authors wish to thank the members of the PNPM Generasi Team including: Sadwanto Purnomo, Gerda Gulo, Juliana Wilson, Sally-Anne Henfry, Scott Guggenheim, John Victor Bottini, Threesia Mariana Siregar, Sentot Satria, Joey Neggers, Yulia Herawati, Gregorius Pattinasarany, Gregorius Endarso, Nur Cahyadi, Soeroso Yosoetomo, Zejd Muhamad, Christine Panjaitan, Soenoe Widjajanti, Suhartini B. Rianto, and Erni Yanti Siregar.
The government of Indonesia through the Ministry of Planning (Bappenas), the Coordinating Ministry for Economy and Social Welfare (Menkokesra), and the Ministry of Home Affairs has provided tremendous support to the program and its evaluations over the past three years. Special thanks to Sujana Royat (Menkokesra); Prasetijono Widjojo, Endah Murniningtyas, Pungky Sumadi, Vivi Yulaswati, (Bappenas); and Ayip Mufl ich, Eko Sri Haryanto, and Bito Wikantosa (Ministry of Home Affairs) for their generous support of the CCT program.
The University of Gadjah Mada (UGM), Center for Public Policy Studies, implemented the fi eld surveys over the last two rounds. SMERU, the Indonesian independent research organization, collaborated with the program to provide qualitative studies. The authors are grateful to both institutions for their critical work, which informed the program design as it evolved.
This interim evaluation report drew from the 2007 baseline survey report written by Robert Sparrow, Jossy Moeis, Arie Damayanti and Yulia Herawati.
This report benefi ted enormously from the insightful comments of peer reviewers: Dandan Chen, Emmanuela Galasso, Claudia Rokx, and Emmanuel Skoufi as (World Bank); and Rachel Glennerster (JPAL, MIT).
Financial support for the overall PNPM Generasi program and the evaluation series has come from the Government of Indonesia, the World Bank Decentralization Support Facility, the Netherlands Embassy, and the PNPM Support Facility, which consists of donors from Australia, the United Kingdom, the Netherlands, and Denmark.
This report was edited by Robert Livernash, with additional editing by Juliana Wilson.

vi Indonesia’s PNPM Generasi Program: Interim Impact Evaluation Report
Glossary ANC Antenatal careARI Acute respiratory infectionBuku KIA Mother and child health bookCCT Conditional cash transfersGotong royong Semi-volunteer public labor service at the village or community levelKDP Kecamatan Subdistrict Development ProjectMIT Massachusetts Institute of TechnologyNTT East Nusa Tenggara provincePKH Program Keluarga Harapan (Hopeful Family Program)PNC Postnatal carePNPM Program Nasional Pemberdayaan Masyarakat (National Program for Community
Empowerment)PNPM Generasi Sehat dan Cerdas
PNPM Healthy and Smart Generation
PODES Village potential statisticsPosyandu Village integrated health post (monthly community weighing post)Puskesmas Community health centerSUSENAS National Socioeconomic SurveySD Sekolah Dasar (primary school)SD Standard deviationsSMP Sekolah Menengah Pertama (junior secondary school)SPADA Support for Poor and Disadvantaged Areas ProjectUPP Urban Poverty Project
Notes:All $ = U.S. dollars, unless otherwise noted

7Indonesia’s PNPM Generasi Program: Interim Impact Evaluation Report
Executive Summary
Over the past decades, Indonesia has made remarkable strides in key human development indicators. Primary school enrollment is close to universal for both boys and girls, and the child mortality rate has declined rapidly. Nevertheless, infant mortality, child malnutrition, maternal mortality, and junior secondary school enrollment have all remained problematic in Indonesia compared to other countries in the region. Furthermore, achievements in these indicators reveal large geographical disparities, with poorer outcomes in rural and remote provinces and districts. These indicators are strongly associated with levels of poverty, suggesting that a program providing the poor with the means to access basic health and education services could be a key component of a poverty strategy for Indonesia.
In 2007, the government of Indonesia launched two large-scale pilots of programs designed to tackle these issues: (1) conditional cash transfers (CCTs) to households, known as the Hopeful Family Project (Keluarga Harapan Project or PKH), and (2) an incentivized community block grant program, known as the National Community Empowerment Program—Healthy and Smart Generation (Program National Pemberdayaan Masyarakat—Generasi Sehat dan Cerdas, or PNPM Generasi). These two pilot projects are being implemented in six provinces and are designed to target the same health and education indicators. They are consistent with both the Indonesian government’s priorities and the Millennium Development Goals: to reduce poverty, maternal mortality, and child mortality, and to ensure universal coverage of basic education. This study reports on the interim evaluation of the incentivized community block grant program, PNPM Generasi. The household CCT program (PKH) will be the subject of a separate evaluation in 2010.
PNPM Generasi, the incentivized community block grant program, differs from a traditional household CCT (and therefore from the PKH program) in that block grants are allocated to communities rather than to individual targeted households. The Generasi project began in mid-2007 in rural areas of fi ve Indonesian provinces selected by the government: West Java, East Java, North Sulawesi, Gorontalo, and East Nusa Tenggara. In 2007, the Generasi project covered 1,605 villages in 129 subdistricts, with a total budget of $20 million. Under the program, villages received an annual block grant, which each village could allocate to any activity that supported one of 12 indicators of health and education service

8 Indonesia’s PNPM Generasi Program: Interim Impact Evaluation Report
Executive Summary
delivery. To give communities incentives to focus on the most effective policies, the government bases the size of the village’s Generasi block grant for the subsequent year partly on the village’s performance on each of the twelve targeted health and education indicators. The Generasi project thereby takes the idea of performance incentives from conditional cash transfer programs and applies it in a way that allows communities the fl exibility to address supply constraints, demand constraints, or some combination. To the best of our knowledge, the Generasi project is the fi rst health and education program worldwide that combines community block grants with explicit performance bonuses for communities.
To allow for a rigorous, randomized evaluation of Generasi, the government of Indonesia incorporated random assignment into the selection of Generasi locations. Each Generasi location was further randomly allocated to one of two versions of the program: one “incentivized” treatment with the pay-for-performance component (treatment A) described above, and a second, otherwise identical “non-incentivized” treatment without the pay-for-performance incentives (treatment B).
This document describes the fi ndings from the interim evaluation survey conducted between October and December 2007, after 15 to 18 months of Generasi implementation in 129 treatment subdistricts. Since one full year’s project cycle had been completed, we refer to this survey as the one-year interim evaluation survey. A fi nal evaluation survey is planned for October–December 2009, after the program will have been in operation for 27–30 months.
The main fi ndings of the one-year interim Generasi impact evaluation are as follows:The Generasi program improved health indicators1. . The strongest improvements were in the frequency of weight checks for young children and use of iron tablets for pregnant women. The program also appears to have improved the frequency of deliveries by trained midwives (particularly in Java and Sulawesi). These improvements were supported by dramatic increases in coverage of all types of maternal and child health services through village health post (posyandu) activities. The Generasi program may have cut infant mortality by as much as half, and appears to have reduced malnutrition in both NTT and Sulawesi.
PNPM Generasi led to no improvements in education, and appeared to have reduced enrollments 2. for certain groups. In contrast to health, the fi rst 15–18 months of Generasi has led to no improvement in education. In fact, the program shows negative impacts on enrollment and attendance of 13–15 year olds who would otherwise have been completing primary school.
In interpreting this result, it is important to note that junior secondary gross enrollments were increasing in this period in both treatment and control areas. In control areas, junior secondary gross enrollment increased from 82 percent at baseline to 91 percent in the interim survey just 18 months later. School participation rates for 13–15 year olds actually increased in Generasi areas, from 82 percent at baseline to 87 percent in the interim survey; it just increased at a slower rate than in the control areas. There may be several reasons for these rather surprising results, especially on the junior secondary indicators. First, overall government expenditures for education during that period were undergoing rapid changes, so it was a fl uctuating situation. Over the past few years, the government has signifi cantly increased overall public spending on education, from 17.2 percent of the total national budget in 2007 (World Bank 2007) to an estimated 20 percent in 2009. Second,

Indonesia’s PNPM Generasi Program: Interim Impact Evaluation Report 9
Executive Summary
the program missed the registration period for the school year and Generasi funds only were released to communities halfway through the school year, making new enrollments for the ongoing school year diffi cult. Third, there may be issues regarding the Generasi’s targeting only 13–15 year olds and not other age groups. Since Generasi’s junior secondary school enrollment indicator was age-specifi c, one hypothesis is that communities prioritized their support for children in the 13-to-15 year age range who had already graduated from primary schools and thus could potentially enroll in junior secondary school, and did not support 13-to-15 year olds who were still in primary school. Fourth, in the fi rst year of implementation, fi eld and supervision reports were fi nding that communities were favoring more assistance toward children already in school, rather than focusing on out-of-school children who proved to be more diffi cult to reach. Supervision missions indicate that during the fi rst year especially, communities chose to benefi t the majority who were already in school and therefore easier to assist, rather than pursue the minority of children who were not yet enrolled in school. Community incentives were effective in improving the health indicators as well as health 3. outcomes, as evidenced by the incentivized version of PNPM Generasi (Treatment A) consistently outperforming the non-incentivized version of the program (Treatment B). The incentivized version of the program had higher levels of prenatal visits, postnatal visits, and weight checks. The incentivized version of the project also had larger reductions in acute morbidity (acute respiratory infections and malnourishment). The incentivized version translated into increased work effort on outreach and public services on the part of midwives. The incentivized version of the program also resulted in increased targeting of program impacts to poorer households.
Regional heterogeneity in PNPM Generasi4. impacts suggest that the program allowed communities to adapt to different local needs. In NTT province, seven of the eight targeted health indicators showed little change. However, the project led to large reductions in malnutrition and in neonatal mortality. The focus on malnutrition in NTT is consistent with the fact that the province had the highest malnutrition rates, and was experiencing a surge in malnutrition in the time period of the study (malnutrition in control areas in NTT increased from 24.7 percent at baseline to 35.3 percent in control areas by Wave II). In Java, where there is more heterogeneity in service levels at baseline, stronger impacts were found in places where baseline levels were weakest. In Sulawesi, which had moderate-to-low baseline levels for all indicators but no acute malnutrition problem like NTT, strong effects were seen across the board.
PNPM Generasi5. affects service provider work effort. Midwives who are the frontline workers in the provision of maternal, neonatal, and child health services increased their working hours, most notably in Sulawesi. Particularly in Java, midwives spent considerably more time providing outreach services.
The program also signifi cantly increased community engagement.6. The evaluation found that PNPM Generasi increased the number of volunteers at village health post activities and the number of parents participating in health education meetings. We also found greater participation in monitoring meetings and spillover effects on participation in community groups and village activities more generally. On average, Generasi had positive impacts on community efforts, mostly due to its effects on community activities related to health activities.

10 Indonesia’s PNPM Generasi Program: Interim Impact Evaluation Report
Executive Summary
The aforementioned results are preliminary and much more data will be forthcoming in the next round of evaluation scheduled for 2009–10. However, these fi ndings already point to several policy implications to explore further in the coming years.
First, PNPM Generasi piggybacked on the Kecamatan Development Program/PNPM, a community-driven development program that had already been in place in Indonesia since 1998. Unlike in Mexico and other countries, it was not clear that Indonesia had the administrative capacity and supply-side services to make an individual CCT program work in certain areas of the country. Generasi thus provides a unique example of how an established national community program can be adapted to address certain education and health targets using a community approach. Building the evaluation into the design of the program from the outset has been critical to learn lessons from the program for possible expansion in the future. To allow for a rigorous, randomized evaluation of Generasi, the government incorporated random assignment into the selection of the locations. Each location was further randomly allocated to an incentivized versus non-incentivized treatment, thus allowing for comparison of effects. As this is a pilot program, it was important that the evaluation prove robust and provide empirical evidence as to whether the intervention was having its desired impact.
Preliminary results from the interim evaluation reveal signifi cant impacts in health and little impact in education. The evidence from this interim survey points to community mobilization as potentially a signifi cant factor in explaining these dramatic improvements in health. Further studies and rigorous evaluations are needed to assess how Generasi compares with other child and maternal health interventions in attaining these targets. For education, the lack of overall impact raises questions regarding Generasi’s investments in this area and whether the education targets for primary and junior secondary education were the correct ones. Indonesia already has reached high primary school enrollment levels. Over the past few years, it has increased its spending on education signifi cantly. During the second and third years of implementation, the program increased efforts to focus more on non-users rather than those already in school. The program is also currently considering the possibility of revising education indicators in Year 4 (beginning in mid-2010) to focus more on quality and student achievement, in addition to the original enrollment and attendance targets.
This study provides strong evidence that in this context, community incentives work and are more effective for focusing impacts on the poorest quintiles and increasing providers’ efforts. The policy implications are that poverty programs may wish to experiment more with embedding incentives into their designs.
The next round of evaluation in 2009–10—using both quantitative and qualitative methods—should reveal much more about the impacts of Generasi. These interim fi ndings provide some preliminary insights into the direction this program is heading.

Indonesia’s PNPM Generasi Program: Interim Impact Evaluation Report 11
1.1 BackgroundOver the past decades, Indonesia has made remarkable strides in key human development indicators. Primary school enrollment is close to universal for both boys and girls and the child mortality rate has declined rapidly (World Bank 2006; World Bank 2008). Nevertheless, infant mortality, child malnutrition, maternal mortality, and junior secondary school enrollment are lower in Indonesia than in other countries in the region (World Bank 2006; World Bank 2008). Furthermore, there are substantial geographical disparities in these outcomes, with poorer outcomes in rural and remote provinces and districts. Poor performance on these indicators is also strongly associated with levels of poverty, particularly in eastern Indonesia, suggesting that a program providing the poor with the means to access basic health and education services could be a key component of a poverty strategy for Indonesia.
Improving the health and education of children is considered critical to economic development and forms an important component of the Millennium Development Goals. Faced with these challenges, many developing countries have sought to stimulate demand for maternal and child health services and education through conditional cash transfer programs. For example, Mexico’s Progresa program (Gertler 2004; Schultz 2004; Rawlings and Rubio 2005) links cash payments to behaviors such as immunization, growth monitoring, school enrollment, and school attendance. However, these types of demand-side interventions may be inappropriate in many developing world contexts, where benefi ciaries do not have adequate access to health and education services (Schubert and Slater 2006; Lagarde, Haines, and Palmer 2007). In such environments, programs that address both the supply- and demand-side constraints directly may be more appropriate.
In 2007, the government of Indonesia launched two large-scale pilots of programs designed to tackle these issues: conditional cash transfers to households and an incentivized community block grant program. These two pilot projects are being implemented in six provinces and are designed to achieve the same objectives and goals. These goals are consistent with the Indonesian government’s priorities and the
Introduction
01

12 Indonesia’s PNPM Generasi Program: Interim Impact Evaluation Report
Introduction
Millennium Development Goals: to reduce poverty, maternal mortality, and child mortality, as well as ensure universal coverage of basic education.
The Household CCT—the Keluarga Harapan Project (PKH)—applies the traditional CCT design with quarterly cash transfers to poor individual households identifi ed through statistical means. CCT recipient households receive regular cash transfers through the post offi ce as long as they meet the requirements of using specifi ed health and education services.
The Incentivized Community Block Grant Program, known as PNPM Generasi, differs from the Household CCT in that block grants are allocated to communities rather than to individual targeted households. Under the program, over 1,600 villages received an annual block grant. Each village can use the grant for any activity that supported one of 12 indicators of health and education service delivery (such as prenatal and postnatal care, childbirth assisted by trained personnel, immunization, school enrollment, and school attendance). To give communities incentives to focus on the most effective policies, the government bases the size of the village’s Generasi block grant for the subsequent year partly on the village’s performance on each of the 12 targeted health and education indicators. The Generasi project thus takes the idea of performance incentives from conditional cash transfer programs and applies it in a way that allows communities the fl exibility to address supply constraints, demand constraints, or some combination. To the best of our knowledge, the Generasi project is the fi rst health and education program worldwide that combines community block grants with explicit performance bonuses for communities.
To allow for a rigorous, randomized evaluation of Generasi, the government of Indonesia incorporated random assignment into the selection of Generasi locations. Unlike evaluations of conditional cash transfer programs, which cannot separately identify the impact of the incentives from the impact of the additional cash provided (Gertler 2004), the Generasi evaluation was designed to separate out these two effects. Specifi cally, each Generasi location was further randomly allocated to one of two versions of the program: (1) an “incentivized” treatment with the pay-for-performance component (treatment A) described above; and (2) an otherwise identical “non-incentivized” treatment without the pay-for-performance incentives (treatment B). This study focuses on the Generasi program. It describes the fi ndings from the interim evaluation survey conducted between October and December 2008 after 15 to 18 months of Generasi implementation in 129 treatment subdistricts.
1.2 The Generasi projectThis section describes the Generasi project, the Indonesian community block grant program that is the focus of this study. PNPM Generasi—known in full as the National Community Empowerment Program–Healthy and Smart Generation (Program National Pemberdayaan Masyarakat–Generasi Sehat dan Cerdas)—is to the best of our knowledge the fi rst health and education program worldwide that combines community block grants with explicit performance bonuses for communities.

Indonesia’s PNPM Generasi Program: Interim Impact Evaluation Report 13
Introduction
The Generasi project began in mid-2007 in rural areas of fi ve Indonesian provinces selected by the government: West Java, East Java, North Sulawesi, Gorontalo, and East Nusa Tenggara.1 In 2007, the project covered 1,605 villages in 129 subdistricts, with a total budget of $20 million. In the project’s second year, which began in mid-2008, the project expanded to cover a total of 2,120 villages in 176 subdistricts, with a total budget of $44 million. The project is currently continuing for a third project year (beginning in mid-2009) in these 176 subdistricts, with possible expansion to other provinces in 2010.
The Generasi project is focused on 12 indicators of maternal and child health behavior and educational behavior (see Box 1). These indicators were chosen by the government of Indonesia to be as similar as possible to the conditions for the individual household conditional cash transfer program being piloted at the same time as Generasi (but in different locations). They are in the same spirit as the conditions used by conditional cash transfer programs in other countries, such as Progresa in Mexico (Levy 2006). These 12 indicators respond to those seeking health and educational services that are within the direct control of villagers—such as the number of children who receive immunization, prenatal and postnatal care, and the number of children enrolled and attending school—rather than long-term outcomes, such as test scores or infant mortality.
In Generasi, all participating villages receive a block grant each year to improve maternal health, child health, and education in their villages. Block grants are usable for a wide variety of purposes, including, but not limited to, hiring extra midwives for the village, subsidizing the costs of prenatal and postnatal care, providing supplementary feeding, hiring extra teachers, opening a branch school in the village (kelas jauh or satellite classrooms, or sekolah terbuka or formal part-time junior secondary schooling), providing scholarships, providing school uniforms, providing transportation funds for health care or school attendance, improving health or school buildings, or even building a road or path through the forest to improve access to health and education facilities.
To decide on the allocation of the funds within a village, trained facilitators help each village elect an 11-member village management team, as well as select local facilitators and volunteers. Through social mapping and in-depth discussion groups, villagers identify problems and bottlenecks in reaching the 12 indicators. Inter-village meetings and consultation workshops with local health and education service providers allow community leaders to obtain information, technical assistance, and support from the local health and education offi ces as well as to coordinate the use of Generasi funds for multi-village projects. Following these discussions, the 11-member management team makes the fi nal Generasi budget allocation.
1 An initial test of the Generasi concept was run in three villages in Gorontalo province from 2006 to 2008. Those villages are not included in the main Generasi project or analysis.

14 Indonesia’s PNPM Generasi Program: Interim Impact Evaluation Report
Introduction
Box 1. Generasi Program Target Indicators
Health IndicatorsFour prenatal care visits 1. Taking iron tablets during pregnancy2. Delivery assisted by a trained professional3. Two postnatal care visits4. Complete childhood immunizations 5. Adequate monthly weight increases for infants 6. Monthly weighing for children under three and biannually for children under fi ve 7. Vitamin A twice a year for children under fi ve 8.
Education IndicatorsPrimary school enrollment of children 6-to-12 years old9. Minimum attendance rate of 85 percent for primary school-aged children 10. Junior secondary school enrollment of children 13-to-15 years old11. Minimum attendance rate of 85 percent for junior secondary school-aged children12.
Performance incentives are a critical (and unique) element of the Generasi approach: the size of a village’s block grant depends in part on its performance on the 12 targeted indicators. The purpose of the performance bonus is to increase the village’s effort at achieving the targeted indicators (Holmstrom 1979), both by encouraging a more effective allocation of Generasi funds and by stimulating village outreach efforts to encourage mothers and children to obtain appropriate health care and increase educational enrollment and attendance.
The performance bonus is structured as a relative competition among villages within the same subdistrict (kecamatan). By making the performance bonuses relative to other villages in the subdistrict, the government sought to minimize the impact of unobserved differences in the capabilities of different areas on the performance bonuses (Lazear and Rosen 1981; Mookherjee 1984; Gibbons and Murphy 1990). The fi xed allocation to each subdistrict also ensures that the performance bonus system would not result in an unequal geographic distribution of funds.2
The specifi c rule for allocating Generasi funds to villages within the subdistrict is as follows. The size of overall Generasi allocation for the entire subdistrict is predetermined by the subdistrict’s population and poverty level.3 Within a subdistrict, in year 1 of the project funds are divided among villages in proportion to the number of target benefi ciaries in each village (that is, the number of children of varying ages and the expected number of pregnant women). Starting in year 2 of project implementation, 80 percent of the subdistrict’s funds continue to be divided among villages in proportion to the number of target benefi ciaries; the remaining 20 percent of the subdistrict’s funds form a performance bonus pool, to be
2 As discussed by Gibbons and Murphy (1990) and others, one potential pitfall of relative performance incentives is that agents may have an incentive to either sabotage or collude with other agents. With an average of 12 villages per subdistrict, in this case villages face a much greater return from increasing their own performance than from sabotaging that of other villagers. Nevertheless, this possibility remains, and therefore makes the equilibrium implications of the incentives an important em-pirical question.
3 In 2007 the average block grant for each subdistrict was $112,300 per subdistrict; in 2008, the average block grant was raised to $200,000 per subdistrict. A subdistrict contains roughly between 15,000 and 50,000 individuals and 10 to 20 villages.

Indonesia’s PNPM Generasi Program: Interim Impact Evaluation Report 15
Introduction
divided among villages based on their performance on the 12 Generasi indicators.4
The performance bonus pool is allocated to villages in proportion to a weighted sum of each village’s performance above a predicted minimum achievement level. Specifi cally, each village’s share of the performance bonus pool is determined by:
ShareOfBonusv = P
v / ( P
j)
whereP
v= [ w
i (y
vi - m
vi)]
In this formula, yvi represents village v’s performance on indicator i, w
i represents the weight for
indicator i, mvi represents the predicted minimum achievement level for village v and indicator i, and P
v
is the total number of bonus “points” earned by village v.
Generasi uses performance relative to a constant predicted minimum attainment level, rather than improvements over an actual baseline, to avoid the ratchet effect (Weitzman 1980), as well as to avoid the problems inherent in collecting reliable baseline data on performance on all indicators in all villages before the program began. For each of the 12 Generasi indicators i, the project set the predicted minimum attainment level, m
vi, in village v to be equal to 70 percent of the average achievement level for villages
with similar levels of access to health and education providers and numbers of benefi ciaries. These minimum achievement levels were estimated by combining data on levels of each indicator from the 2004 SUSENAS household survey and 2003 PODES census of villages.5 The weights for each indicator, w
i,
were set by the government to be approximately proportional to the marginal cost of having an additional individual complete that indicator. The weights, along with the specifi c performance metric for each indicator i, are shown in Table 1.
4 Starting in year 2, for allocating the non-incentivized portion of the block grant (i.e., 80 percent of the subdistrict alloca-tion in incentivized areas and 100 percent of the subdistrict allocation in non-incentivized areas), the number of target benefi ciaries is weighted depending on a village’s access to facilities. This calculation is identical in both incentivized and non-incentivized areas.
5 For all health indicators except monthly weighing, access to providers was divided into three categories: 1) having a midwife practicing in the village, 2) not having a midwife in the village but having a midwife practicing within 4km from the center of the village, or 3) not having a midwife practicing within 4km of the village center. For middle school, access was divided into three categories: 1) having a middle school located in the village or within 4km of the village center, 2) having a middle school located between 5 and 9km of the village center, or 3) having a middle school located 10km or more from the village center. For monthly weighing and primary school, all villages were assumed to have the same level of access, since weighing of children is always conducted in the village at monthly posyandu meetings and since virtually all villages in Indonesia have a primary school.
16 Indonesia’s PNPM Generasi Program: Interim Impact Evaluation Report
Introduction
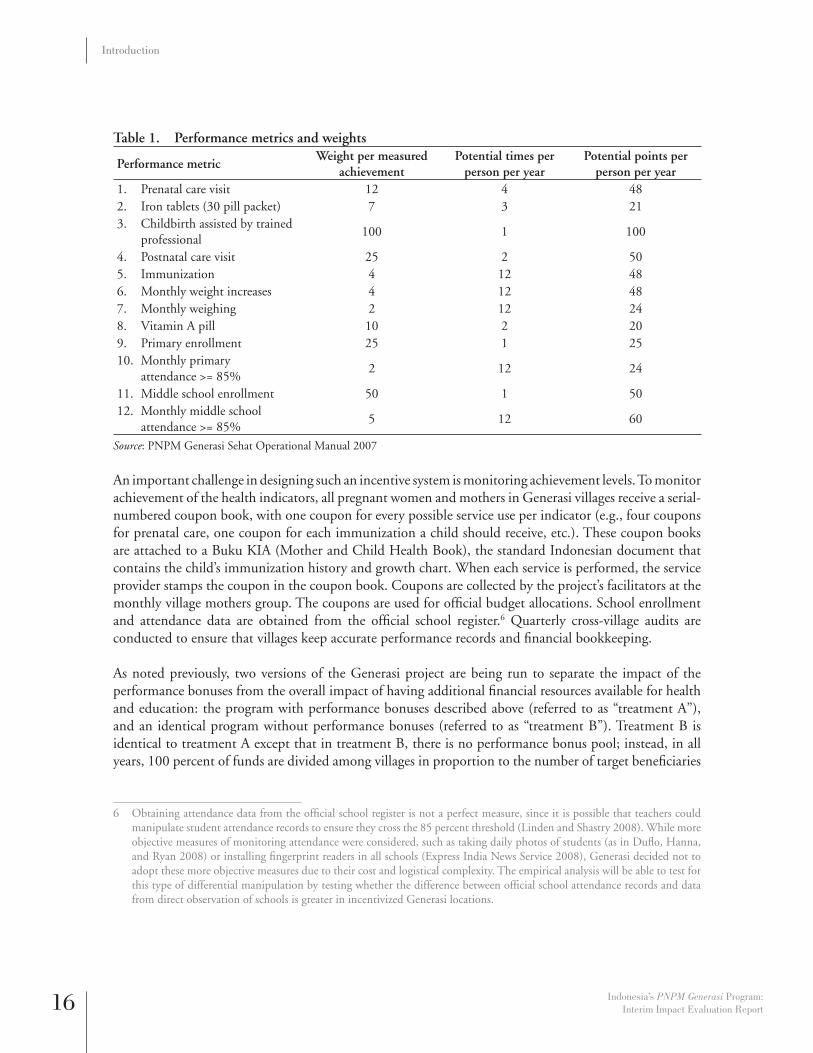
Table 1. Performance metrics and weights
Performance metricWeight per measured
achievementPotential times per
person per yearPotential points per
person per yearPrenatal care visit1. 12 4 48Iron tablets (30 pill packet)2. 7 3 21Childbirth assisted by trained 3. professional
100 1 100
Postnatal care visit4. 25 2 50Immunization 5. 4 12 48Monthly weight increases 6. 4 12 48Monthly weighing 7. 2 12 24Vitamin A pill8. 10 2 20Primary enrollment9. 25 1 25Monthly primary 10. attendance >= 85%
2 12 24
Middle school enrollment11. 50 1 50Monthly middle school 12. attendance >= 85%
5 12 60
Source: PNPM Generasi Sehat Operational Manual 2007
An important challenge in designing such an incentive system is monitoring achievement levels. To monitor achievement of the health indicators, all pregnant women and mothers in Generasi villages receive a serial-numbered coupon book, with one coupon for every possible service use per indicator (e.g., four coupons for prenatal care, one coupon for each immunization a child should receive, etc.). These coupon books are attached to a Buku KIA (Mother and Child Health Book), the standard Indonesian document that contains the child’s immunization history and growth chart. When each service is performed, the service provider stamps the coupon in the coupon book. Coupons are collected by the project’s facilitators at the monthly village mothers group. The coupons are used for offi cial budget allocations. School enrollment and attendance data are obtained from the offi cial school register.6 Quarterly cross-village audits are conducted to ensure that villages keep accurate performance records and fi nancial bookkeeping.
As noted previously, two versions of the Generasi project are being run to separate the impact of the performance bonuses from the overall impact of having additional fi nancial resources available for health and education: the program with performance bonuses described above (referred to as “treatment A”), and an identical program without performance bonuses (referred to as “treatment B”). Treatment B is identical to treatment A except that in treatment B, there is no performance bonus pool; instead, in all years, 100 percent of funds are divided among villages in proportion to the number of target benefi ciaries
6 Obtaining attendance data from the offi cial school register is not a perfect measure, since it is possible that teachers could manipulate student attendance records to ensure they cross the 85 percent threshold (Linden and Shastry 2008). While more objective measures of monitoring attendance were considered, such as taking daily photos of students (as in Dufl o, Hanna, and Ryan 2008) or installing fi ngerprint readers in all schools (Express India News Service 2008), Generasi decided not to adopt these more objective measures due to their cost and logistical complexity. The empirical analysis will be able to test for this type of differential manipulation by testing whether the difference between offi cial school attendance records and data from direct observation of schools is greater in incentivized Generasi locations.

Indonesia’s PNPM Generasi Program: Interim Impact Evaluation Report 17
Introduction
in each village. In all other respects, the two versions of the program are identical: the total amount of funds allocated to each subdistrict is the same in both treatments, the same socialization materials and indicators are used, the same procedures are used to pick village budget allocations, and the same monitoring tools and scoring system are used. Even the village’s annual points score P
v is also calculated
in treatment B areas; the only difference is that in treatment B villages the points are used simply as an end-of-year monitoring and evaluation tool, and have no relationship to the allocation of funds. Within a given subdistrict, all villages participate in the same treatment of the program; that is, either all villages received treatment A or all villages received treatment B.
The Generasi project design builds on the Indonesian government’s existing community-driven development program, known as the National Community Empowerment Program (PNPM), which, along with its predecessor programs (Kecamatan Development Project), have funded over $1 billion in local infrastructure and microcredit programs in some 70,000 Indonesian villages over the past decade. The Generasi project is implemented by the government of Indonesia’s Ministry of Home Affairs, and is funded in part with loans from the World Bank and grants from the Netherlands Embassy. Technical assistance and evaluations were supported by a multidonor trust fund with contributions from the World Bank, Netherlands Embassy, Australia, UK’s Department for International Development (DFID), and the Danish Embassy.
1.3 Experimental DesignIn order to evaluate the overall impact of Generasi, as well as to separately identify the impact of Generasi’s performance incentives, Generasi locations were selected by lottery to form a randomized, controlled fi eld experiment. The use of randomized evaluation techniques is considered the gold standard for impact evaluation of clinical and public health interventions (Gordis 2004), as well as development programs more generally (Dufl o, Glennerster, and Kremer 2007). It has formed the basis of a number of high-profi le social policy experiments in the United States (see Newhouse 1993; Kling, Liebman, and Katz 2007) and internationally (see Gertler 2004; Miguel and Kremer 2004; Schultz 2004; Skoufi as 2005). The Generasi randomization was conducted at the subdistrict (kecamatan) level, so that all villages within the subdistrict either received the same treatment of Generasi (treatment A or treatment B) or were in the control group. Randomizing at the subdistrict level is important since many health and education services, such as community health centers (Puskesmas) and junior secondary schools, provide services to multiple villages within a subdistrict. Increased demand for services from one village within a subdistrict could potentially therefore crowd out the services provided to other villages within the same subdistrict; alternatively, an effort by one village to improve service provision at the community health center could also benefi t other villages in the same subdistrict. By randomizing at the subdistrict level, so that all villages in the subdistrict receive the same treatment status, the evaluation design ensures that we capture the total net effect of the program, since any within-subdistrict spillovers would also be captured in other

18 Indonesia’s PNPM Generasi Program: Interim Impact Evaluation Report
Introduction
treatment villages.7 This type of cluster-randomized design is common in program evaluations where there might be local spillovers from the treatment (Miguel and Kremer 2004; Olken 2007).
The Generasi locations were selected through the following procedure. First, 300 target subdistricts were identifi ed, targeting poor, rural areas that had an existing community-driven development infrastructure.
8,9 Each subdistrict was then randomly assigned by computer into one of three equal-sized groups: treatment A, incentivized (100 subdistricts); treatment B, non-incentivized (100 subdistricts); or control (100 subdistricts). Within a subdistrict, all villages received the same treatment. The randomization was stratifi ed by district (kabupaten), to ensure a balanced randomization across the 20 different districts in the study. The tests for balance confi rm that the three groups of subdistricts appear similar on pre-period characteristics (World Bank 2008).
After the randomization was conducted, some subdistricts randomly selected for Generasi were not funded. In 2007, budget restrictions meant that out of the 200 subdistricts randomly selected to receive Generasi grants, 129 actually received them. In 2008, the budget was increased, and 176 subdistricts received grants. The reason that 24 out of the original 200 subdistricts were not funded in 2008 is that several subdistricts had been selected (prior to the randomization) for other programs, such as SPADA and PNPM-Urban, and several other subdistricts had unresolved fi nancial and accountability problems with PNPM-rural. We have obtained lists of all of these categories of subdistricts dated prior to the randomization for both treatment and control locations. These lists are dated prior to the randomization and are exogenous with respect to the randomization, so we can use these lists in the analysis to increase our statistical power (see Section 2.1 for more details).
Although not all subdistricts were funded, the randomization was still strictly followed: no subdistricts randomly selected to be control areas ever received Generasi funding. Conditional on getting Generasi, whether a subdistrict received treatment A or treatment B always followed the randomization results. Data collection surveys are being conducted in all 300 subdistricts that were initially included in the randomization, regardless of the fi nal allocation of funds.10 This allowed us to use intent-to-treat analysis (Imbens and Angrist 1994) based on the original 300-subdistrict randomization to confi rm that the changes described above were not materially affecting our results (for details on Generasi implementation in 2007 post-randomization, see Annex I, page 75).
7 Spillovers to other subdistricts are much less likely to be a problem, since the health service providers (Subdistrict Health Centers and midwifes), primary schools, and junior secondary schools that are the focus of this survey primarily provide services within a single subdistrict. Nevertheless, by using GIS information on the location of service providers, we will be able to test empirically for the presence of these cross-subdistrict spillovers.
8 To identify the 300 target subdistricts, we began by eliminating the wealthiest 20 percent of districts (kabupaten) within the fi ve target provinces identifi ed by the government, determined by the district’s poverty rate, malnutrition rate, and junior secondary school transition rate. Districts where the PNPM program was not scheduled to operate in 2007 were also ineli-gible. Twenty districts were randomly selected from the remaining eligible districts, stratifi ed by island group. Within the twenty selected districts, subdistricts were eligible for Generasi if they had previously received the PNPM program or were considered less than 67 percent urban by the Central Statistics Offi ce.
9 Since Generasi is implemented through the national PNPM program, it could only be implemented in districts that were already included in the PNPM program. Prior experience with PNPM at the subdistrict level also simplifi ed Generasi imple-mentation, since the relevant legal structures for disbursing Generasi funds had already been established in these locations.
10 When the baseline survey was conducted, one of the 300 subdistricts could not be surveyed due to an avian fl u quarantine. That subdistrict will, however, be included in all future survey rounds.

Indonesia’s PNPM Generasi Program: Interim Impact Evaluation Report 19
Introduction
An important consideration for the analysis is the potential for differential provision of other programs in control groups (Dufl o, Glennerster, and Kremer 2007). To ensure a fair allocation of funds, the Ministry of Home Affairs decided that no subdistrict would receive both the Generasi project and other PNPM programs, which typically fund local infrastructure (roads, bridges, etc.) and microcredit. In 2007, 18 (out of 100) control subdistricts received other PNPM programs, while no treatment subdistricts did. In addition, it is possible that local governments differentially targeted resources to control districts, since they did not receive Generasi. Detailed information on all programs received by the village is collected in the survey to investigate this possibility. Since regular PNPM programs tend to focus on basic infrastructure, not health and education, it is unlikely that the differential provision of other PNPM programs in control areas will have substantial impacts on the results. To the extent there are increases in other health and education performance in control areas due to regular PNPM or other programs, this would lead to an understatement of the true impacts of Generasi, but would not affect the comparison of treatment A and treatment B. By collecting detailed data on these additional programs, we can control for any differential placement (should it occur) to estimate the degree to which these programs are downwardly biasing our main results.
1.4 Survey Design and ImplementationThe main data for the impact analysis is from a set of surveys of households, village offi cials, health service providers, and schools being conducted by the World Bank. A detailed list of the contents of each survey module, as well as the sample size for each module, can be found in Table 2.
Three waves of the survey were planned as part of the evaluation series. Wave I, the baseline round, was conducted from June to August 2007. Wave II, the fi rst follow-up survey round, was conducted from October to December 2008. Wave III, a longer-term follow-up survey round, will be conducted from October to December 2009. These surveys were designed by the World Bank and the government of Indonesia and are being conducted by the Center for Population and Policy Studies (CPPS) of the University of Gadjah Mada, Yogyakarta, Indonesia. The interim evaluation is based on data collected through the Wave I and Wave II surveys, which were funded by the World Bank (through the Decentralization Support Facility and PNPM multidonor trust fund). The sample for the surveys covers each of the 300 subdistricts that were included in the original Generasi randomization. In each subdistrict, eight villages were randomly selected (unless the subdistrict had fewer than eight villages, in which case all were selected). This resulted in a total of 2,313 villages that will be sampled in each of the three survey waves. The sampling design for the household component of the Generasi surveys was chosen to ensure adequate coverage in the key Generasi demographic groups: mothers who recently were pregnant or gave birth, children under age 3, and children of school age. Within each village, one hamlet (dusun) was randomly selected, and a list of all households was obtained from the head of the hamlet. Five households were randomly sampled from that list to be interviewed. These households were stratifi ed so that two selected households had at least one child under age 2, two selected households had a child under age 15 but no children under age 2, and one household had no children under age 15.

20 Indonesia’s PNPM Generasi Program: Interim Impact Evaluation Report
Introduction
For some of the analysis (e.g., for examining how the incentives affect the differential targeting of Generasi benefi ts and increments in service provision), it is useful to have baseline and follow-up characteristics for the same individuals. Therefore, in the follow-up surveys, in half of the randomly selected villages (four villages out of the eight villages sampled in every subdistrict), the same households sampled in Wave I were contacted again in subsequent waves to form an individual level panel. Teams tracked and re-interviewed migrated or split households who provided information for any of the married women or children modules, as long as they were within the same subdistrict. In the other half of villages, a new cross-section of households are drawn from in each survey wave. The combination of panel households and non-panel households allows us to investigate heterogeneous treatment effects based on pre-period income levels and other characteristics, while at the same time ensuring that suffi cient respondents with recent births and young children are enrolled in the survey sample in every round.
Health facilities and schools were also contacted again to form a panel. For midwives, a randomly selected 75 percent of the midwife sample will be re-contacted to form a panel, and 25 percent of the midwives will be newly sampled in each wave to ensure the sample captures potential in-migration of midwives in response to Generasi.
Data from these surveys are supplemented with detailed administrative data from the Generasi project’s internal management information system. This includes detailed budget allocations for the block grants, performance data on the twelve Generasi indicators, and data on participation levels in Generasi village meetings.
Table 2. Questionnaire modules and sample size
Module ContentsSample Size
(Wave I)
Panel/Non-Panel
(Waves II/III)Household core(Respondent: female household head or spouse of a male household head)
Household roster, deaths in previous 12 months, migration, water/sanitation, receipt of government poverty programs, participation in non-formal education, consumption, assets, economic shocks, health insurance, morbidity, outpatient care use, social capital, knowledge and participation in PNPM/KDP activities (Wave II)
11,920
50% panel, 50%
non-panel
Married women age 16–49
Fertility history, use of health services during pregnancy, inspection of Generasi coupons (Wave II), family planning, health and education knowledge
10,794
Children age 6–15 (Respondent: mother of the child)
School enrollment, attendance, grade repetition, cost of schooling, scholarships, child labor
9,491
Children age < 3 (Respondent: mother of the child)
Growth monitoring (posyandu), immunization records, inspection of the Generasi coupons (Wave II), motor development (Wave III), breastfeeding and nutritional intake, weight measurement, height measurement (Waves I & III)
4,746
Home-based tests(Respondent: children age 6–15)
Test of math and reading skills administered at home (separate test for age 6–12 and age 13–15) (Waves I & III)
4,793

Indonesia’s PNPM Generasi Program: Interim Impact Evaluation Report 21
Introduction
Module ContentsSample Size
(Wave I)
Panel/Non-Panel
(Waves II/III)Village characteristics(Respondent: Village Head)
Demography of the village, hamlet information, access to health services and schools, economic shocks, access to media, community participation, daily laborer wage rate, development projects in the village (Waves II & III)
2,313 100% panel
Community health center(Puskesmas)
Head of facility background, coverage area, budget, staff roster, time allocation of head doctor and midwife coordinator, service hours, services provided, fee schedule, number of patients per service during the previous month, medical and vaccine stock, data on posyandu, participation in Generasi (Waves II & III), direct observation regarding cleanliness
300 100% panel
Village midwives Personal background, location of duty and condition of facility, time allocation, income, services provided, fee schedule (public and private), experiences during past three deliveries, number of patients seen per service during the previous month, equipment and tools, medical supplies and stock, posyandu management, participation in Generasi (Waves II & III), structure of subsidies received
1,157 75% panel, 25%
non-panel
Primary school(Waves II & III)
Principal background, principal time allocation, teacher roster, school facilities, teaching hours, enrollment records, attendance records, offi cial test scores, scholarships, fees, budget, participation in Generasi (Wave II), direct observation of classrooms, including random check on classroom attendance
N/A 50% panel 50% non-
panel
Junior secondary school
Same questionnaire for primary school 847 66% panel, 33% non-
panel
Posyandu cadre(Waves II & III)
Respondent characteristics, posyandu characteristics, service providers, cadre roster, tools and equipment, participation in Generasi (Wave II)
N/A 50% panel 50% non-
panel
Source: Terms of Reference for Baseline survey 2007 and Terms of Reference for Wave II survey 2008.
Some 35,500 household members, village heads, and school and health facility staff were respondents for this interim round (Wave II) survey.


Indonesia’s PNPM Generasi Program: Interim Impact Evaluation Report 23
Evaluation Methodology
2.1 Regression Specifi cationsSince the Generasi program was designed as a randomized experiment, the evaluation is econometrically straightforward: essentially, we compare outcomes in those subdistricts randomized to be treatments with those subdistricts randomized to be control areas, controlling for the level of the outcome at baseline.
In practice, since not all subdistricts randomized to receive Generasi funds actually received the program in year 1, comparing those subdistricts randomized to be treatments with those randomized to be controls would yield an intent-to-treat estimator, and while this estimator would be consistent, the estimated effects would be lower than the true treatment effect of the program. Fortunately, as described below, we know precisely how subdistricts were prioritized to receive Generasi grants in year 1. Since all prioritization was done based on information available before the randomization took place, we can incorporate that information into the evaluation design in order to improve the power of our estimates. (Note that we will also report the pure intent-to-treat results as a robustness check in Section 3.1.2 below; as one would expect, the intent-to-treat results are qualitatively similar to the main results, but the point estimates are smaller and the estimation is noisier). Note that all of the analysis outlined below (regression specifi cations, outcome variables, and aggregate effects) follows an analysis plan that was fi nalized on April 8, 2009, before we examined any of the Wave II data. The only variables we examine that were not in the original analysis plan are some additional variables related to exploring the negative education result: these variables are separately marked in the table as “Additional Education Indicators.”
In particular, the rule the government used for year 1 of the program is as follows. First, the government fi rst dropped all subdistricts that had previously received the Urban Poverty Project (UPP), were scheduled to receive the Support for Poor and Disadvantaged Areas Project (SPADA), or were on a “problem subdistrict” list defi ned by the project implementation agency of the Kecamatan Development Project (KDP). Since these lists were available prior to the randomization, they are exogenous with respect to the randomization, and so we drop the 36 subdistricts on these ex-ante lists, leaving 264 subdistricts
02

24 Indonesia’s PNPM Generasi Program: Interim Impact Evaluation Report
Evaluation Methodology
remaining.11 Second, the government divided subdistricts based on their previous experience with the KDP program, with those that had previous KDP experience in the P (priority) group and those without it in the NP (non-priority) group. The government fi rst funded all 105 subdistricts in the P group that had been randomly selected to receive Generasi grants in the original lottery, and then held an additional computerized lottery (stratifi ed by province) to select an additional 21 subdistricts in the NP group from among the subdistricts in the NP group that had been originally randomized to receive Generasi. Whether a subdistrict received Generasi funding in year 1 is therefore randomly assigned once (a) we drop all subdistricts in the ex-ante drop list, and (b) we condition on group P interacted with province dummies, to take into account the different probability of receiving Generasi in P and NP areas and the fact that the NP lottery was stratifi ed by province. Note that once a subdistrict was assigned to receive Generasi, whether it received treatment A or treatment B always followed the original randomization results.
In running the regressions, we take advantage of the baseline data by controlling for the average level of the outcome variable in the subdistrict in the baseline survey. Since we also have individual-specifi c panel data for half our sample, we include the pre-period value for those who have it, as well as a dummy variable that corresponds to having non-missing pre-period values. Since households came from one of three different samples (those with a child under age 2, those with a child age 2–15 but not in the fi rst group, and all others), we include dummies for those three sample types, interacted with whether a household came from a panel or non-panel village. Finally, since many of the indicators for children vary naturally as the child ages, for all child-level variables we include age dummies.
To examine the overall impact of Generasi treatment, for each indicator of interest, we estimate the following regression on the 264 subdistricts that remain after we drop the ex-ante drop subdistrict list:
{ } pdsisppdsidsgmisypdsipdsipdsdpdsi PSAMPLEyyYGENERASIy εαγγγβα +×++++++= ≠ 03sin020111 11_
where p is a person, d is a district, s is a subdistrict, 1pdsiy is the outcome in Wave II, dá is a district fi xed
effect, 0pdsiy is the baseline value for individual i (assuming that this is a panel household, and 0 if it
is not a panel household), { }gmisydsi sin01 ≠ is a dummy for being a panel household, 0dsy is the average baseline value for the subdistrict, SAMPLE are dummies for how the household was sampled interacted
with being a panel or cross-section household, and sp Pá × are province-specifi c dummies for being in the previous-KDP sample. Standard errors are clustered at the subdistrict level.
To examine the additional impact of the incentives (treatment A compared to treatment B), we estimate the same regression, but with an additional variable that captures the additional effect of incentives:
11 The ex-ante list is not a perfect predictor of who would be dropped, as 2 subdistricts on the ex-ante list to be dropped actu-ally received Generasi. However, we drop all subdistricts on the ex-ante list to be dropped so that we can drop the identical subdistricts in the control group as well.

Indonesia’s PNPM Generasi Program: Interim Impact Evaluation Report 25
Evaluation Methodology
{ }
pdsippdsipds
gmisypdsipdsipdspdsdpdsi
åPáSAMPLEyã
ãyãYGENERASIâINCENTIVESYGENERASIèáy
+×+++
++++= ≠
03
sin0201111 11__1_
(2)
Using the estimates from this regression we can also calculate the total impact of the treatment A program by adding the coeffi cients on GENERASI_Y1_INCENTIVES and GENERASI_Y1. We also examine a wide variety of additional specifi cations as robustness tests; these specifi cations are discussed in more detail in Section 3.1.2. Since we have a large number of indicators, in order to calculate joint signifi cance we will calculate average standardized effects for each family of indicators, following Kling, Liebman, and Katz (2007). Specifi cally, for each indicator i, defi ne 2
i to be the variance of i. We then estimate (1) for each indicator, but run the
regressions jointly, clustering the standard errors by subdistrict to allow for arbitrary correlation among the errors within subdistricts both between and across indicators. We then defi ne the average standardized effect as
∑i i
i
óâ
. (3) As described above, note also that all variable defi nitions, regressions, and families of indicators reported in this document were specifi ed by the authors before examining any of the Wave II (post-program) data. The only variables we examine not in the original analysis plan are some additional variables related to exploring the negative education result: these variables are separately marked in the table as “Additional Education Indicators.” This hypothesis document was registered with the Abdul Latif Jameel Poverty Action Lab at MIT and is available on request.
2.2 Balance TestsThis section examines the balance of key child health and education indicators using data from the interviews of mothers in the baseline household surveys and the same estimation procedure shown in equation (1). We examine all of the twelve major indicators that are the focus of the program (these indicators are discussed in more detail in Section 3.1 below). The results are shown in Table 4. Column (1) shows the mean of each variable in the control group. Column (2) shows the “Generasi Effect”, i.e., the difference between Generasi project areas and controls from estimating equation (1). Since this is a balance check, one would expect no signifi cant differences between treatment and controls. Column (3) and column (4) show the coeffi cients from estimating equation (2), with column (4) showing the effect of Generasi in Treatment B (non-incentivized) areas and column (3) showing the additional effect of the incentives (i.e., the difference between Treatment A and Treatment B). Column (5) shows the total effect of Generasi in the incentivized areas, and is the sum of columns (3) and (4). Column (6) shows the total number of observations.

26 Indonesia’s PNPM Generasi Program: Interim Impact Evaluation Report
Evaluation Methodology
Looking across columns (2) through (5), we fi nd that of the forty-eight coeffi cients estimated, fi ve are statistically signifi cant at the 10 percent level or higher, which is precisely what would be predicted by random chance. Similarly, three of forty-eight coeffi cients are statistically signifi cant at the 5 percent level or higher, which is also what one would predict based on random chance. These results confi rm that the randomization was indeed carried out properly and that the treatment and control groups are balanced.
The fi nal rows of Table 4 consider the average standardized effects, computed via equation (3). We report average standardized effects for all twelve of the main indicators, and then separately report average standardized effects for the eight health indicators and four education indicators. One of the sixteen coeffi cients is statistically signifi cant at the 10 percent level, once again consistent with what would expect based on random chance. This confi rms that the sample is indeed balanced. Table 5 reports the same baseline regressions for the long-term health indicators, neonatal mortality, infant mortality, acute disease, malnourishment, and severe malnourishment. Two of the twenty coeffi cients are statistically signifi cant at the 10 percent level, once again consistent with a balanced sample and random chance. None of the average standardized effects show any differences. Thus, along a wide variety of measures, the sample appears balanced at baseline.

Indonesia’s PNPM Generasi Program: Interim Impact Evaluation Report 27
Main Results
3.1 Impact on the Twelve Main Health and Education Indicators
This section presents the impact on the twelve main indicators after one year of full Generasi project implementation. The twelve health and education indicators refl ect the target indicators treatment villages were required to work to improve as a condition for their participation in the project. Section 3.1.1 discusses the main results, Section 3.1.2 discusses the robustness to alternative evaluation methodologies, and 3.1.3 discusses how the results vary in each of the three main Generasi project regions: Java, NTT, and North Sulawesi/Gorontalo.
3.1.1 Overall effectsTable 6 presents the main results after one year of Generasi implementation, using the main specifi cation discussed in Section 2.1. Each row reports the results for a different variable. As with the baseline tables, column (1) of Table 6 (and all subsequent tables) shows the mean level of the variable in the baseline survey, and column (2) shows the mean level of the variable in the control group in the Wave II survey. Column (3) reports the coeffi cient on the GENERASI variable from estimating equation (1), and is interpretable as the average impact of the Generasi on the variable.12 Columns (4), (5), and (6) report the results from estimating equation (2), where column (4) is the coeffi cient on GENERASI_A (the additional effect of incentives relative to the non-incentivized treatment of Generasi), column (5) is the coeffi cient on GENERASI (the effect of the non-incentivized treatment of Generasi), and column (6) is the total effect of incentivized Generasi, computed by adding GENERASI_A to GENERASI. The
12 As described above, all regressions include district fi xed effects, Group P interacted with province fi xed effects, dummy variables for how the household was sampled, and (for child indicators) age dummies. The main regressions also include the average baseline value of the variable in the subdistrict and, for panel respondents, that individual’s baseline value.
03

28 Indonesia’s PNPM Generasi Program: Interim Impact Evaluation Report
Main Results
number of observations is in the fi nal column. Average standardized effects, computed using equation (3), are shown at the bottom of the table.
HealthLooking fi rst at the overall program effects in column (3), the results in Table 6 show generally positive effects on health variables and negative effects on education variables. Assessing the impact on health indicators one-by-one, participation in monthly growth monitoring for children under 3 was the only main health indicator to show statistically signifi cant positive impact overall, indicating increased participation of an average child under 3 in the monthly growth monitoring by 0.1 sessions in the previous three months. Looking across all eight health indicators, Generasi resulted in a statistically signifi cant average improvement of 0.03 standard deviations. The estimates of impact using baseline controls for all twelve primary indicators and the estimates using fi rst differences (both shown in Table 7) both show stronger program impacts than those estimated using the baseline as a control variable (as shown in Table 6); these estimates will be discussed in more detail in the robustness section (3.1.2) below.
EducationTurning to the education indicators, Generasi resulted in no change in primary school enrollment or attendance, but appears to have resulted in reductions in junior secondary school age enrollment and attendance rates. Specifi cally, junior secondary school participation, which we defi ne as the percentage of children age 13–15 enrolled in any school (either primary or junior secondary), was 3 percentage points lower (signifi cant at 10 percent level), and junior secondary age gross attendance, defi ned as the percentage of school days in the past two weeks children age 13–15 attended in any school (either primary or junior secondary), was 5 percentage points lower (signifi cant at 5 percent level). (Note that this latter variable counts unenrolled children as having zero attendance.) Due to these negative impacts seen in junior secondary education indicators, the average impact on the four main education indicators (primary and junior secondary school gross participation and attendance) was a statistically signifi cant negative 0.07 standard deviations.
In our ex-ante specifi cation of variables, we used gross attendance and school participation as the main education variables of interest, since they are defi ned based on age ranges and are thus the least sensitive to potentially endogenous changes in schooling practices, such as holding children back for additional years of primary school. However, to further clarify the results we also examined two other variables for middle school students. First, since gross attendance counts those children not enrolled in school as having zero attendance, we also compute “junior secondary school age conditional attendance,” which is identical to gross attendance for children age 13–15 but is limited to those children actually enrolled in school. Junior secondary school conditional attendance was also 1 percentage point lower in Generasi areas relative to control (signifi cant at 5 percent level). Second, since gross participation rates include older children participating in primary school as well as junior secondary school, we also examined junior secondary school net enrollment, which is the share of children age 13–15 enrolled in a junior secondary school. We fi nd no statistically signifi cant changes in junior secondary school net enrollment due to Generasi. This implies that the reductions in junior secondary school gross participation rates were due to declines in the share of children age 13–15 participating in primary school.

Indonesia’s PNPM Generasi Program: Interim Impact Evaluation Report 29
Main Results
Since Generasi’s junior secondary school enrollment indicator was age specifi c, targeted to improve “junior secondary school enrollment of children 13-to-15 years old,” a possible hypothesis is that communities prioritized their support for children 13-to-15 years old who had already graduated from primary school—and thus could potentially enroll in junior secondary school—and did not support 13-to-15-year-olds who were still in primary school.
In interpreting these results, it is important to note that there were dramatic improvements overall in Indonesia in junior secondary age school enrollment and attendance between the baseline (column 1) and the interim evaluation (column 2) surveys, even in control areas. In particular, in control areas junior secondary gross enrollment increased from 82 percent at baseline to 91 percent in the interim survey just 18 months later. School participation rates for 13-to-15-year-olds actually increased in Generasi areas, from 82 percent at baseline to 87 percent in the interim survey; it just increased at a slower rate than in the control areas. Thus communities might have diverted resources away from junior secondary because they saw success in improving enrollment rates—they just did not know that increases in enrollments were going up everywhere in the country.13 Nevertheless, the fact that Generasi dampened the increases in enrollment happening elsewhere in the country remains a surprise. The study team is working to understand why this may have occurred. See Section 6 discussion for several hypotheses.
Impact of incentivesThe second set of results in Table 6 (columns 4-6) examines the impact separately for the two versions of Generasi: treatment A (with incentives) and treatment B (without incentives). The results show substantially higher levels of achievement on health indicators in incentivized locations: pregnant women had 0.56 more prenatal visits (signifi cant at 5 percent level), and children had 0.1 more weight checks (signifi cant at 10 percent level) in incentivized relative to non-incentivized areas. The average standardized health effects (averaged across all eight indicators) were a statistically signifi cant 0.06 standard deviations higher in treatment A than treatment B locations (signifi cant at 1 percent level).
Looking at the total effects in treatment A (column 6), the point estimates for health indicators are positive in seven of the eight indicators (all except Vitamin A capsules) with children in treatment A areas statistically signifi cantly participating in 0.17 more growth monitoring sessions in the previous three months. The average standardized effect for all eight health indicators in treatment A was 0.07 standard deviations, statistically signifi cant at the 1 percent level. By contrast, the average standardized effect for all eight health indicators was 0.02 (and not signifi cant) in treatment B. Although the education indicators were not signifi cantly different between the two treatments, the negative and statistically signifi cant effects for junior secondary schools appear more pronounced in treatment B, with only one indicator (junior secondary school gross participation rates) showing negative impact in treatment A. All told, the evidence strongly suggests that the incentivized treatment of the program performed better than the non-incentivized treatment.
13 To assess whether local governments provided additional resources to schools in control areas to compensate for Generasi, junior secondary school budgets were compared but no differences were found (data not shown).
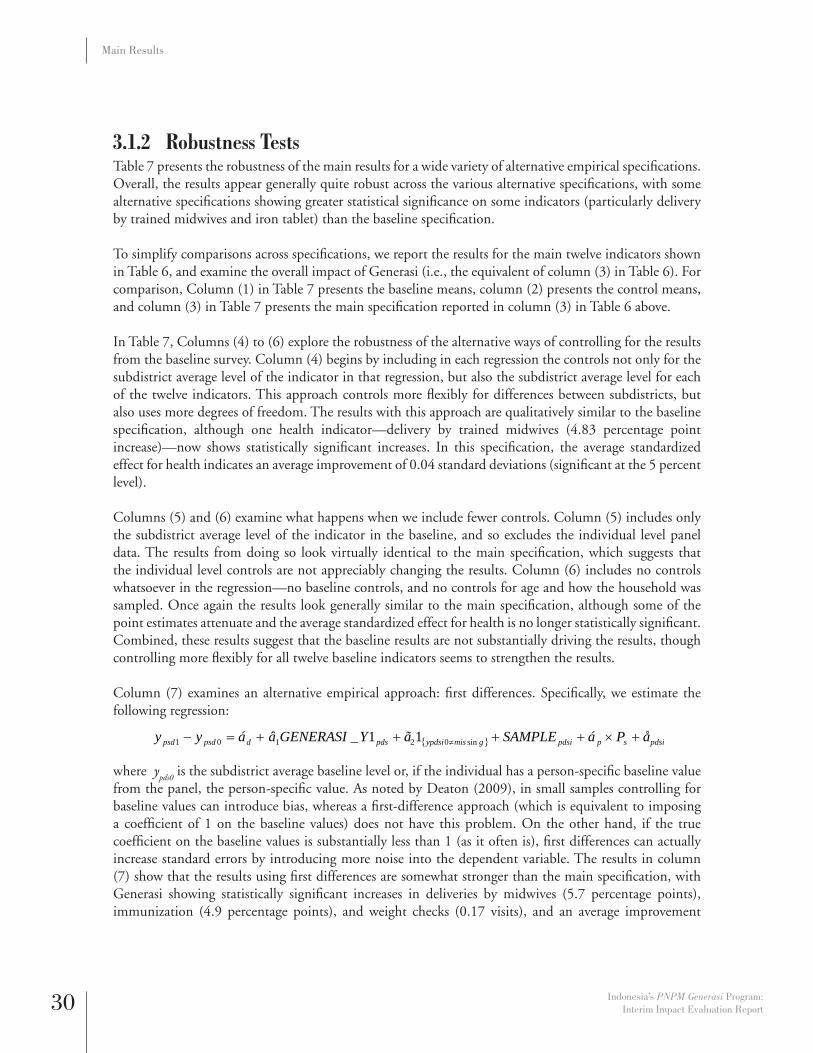
30 Indonesia’s PNPM Generasi Program: Interim Impact Evaluation Report
Main Results
3.1.2 Robustness TestsTable 7 presents the robustness of the main results for a wide variety of alternative empirical specifi cations. Overall, the results appear generally quite robust across the various alternative specifi cations, with some alternative specifi cations showing greater statistical signifi cance on some indicators (particularly delivery by trained midwives and iron tablet) than the baseline specifi cation.
To simplify comparisons across specifi cations, we report the results for the main twelve indicators shown in Table 6, and examine the overall impact of Generasi (i.e., the equivalent of column (3) in Table 6). For comparison, Column (1) in Table 7 presents the baseline means, column (2) presents the control means, and column (3) in Table 7 presents the main specifi cation reported in column (3) in Table 6 above.
In Table 7, Columns (4) to (6) explore the robustness of the alternative ways of controlling for the results from the baseline survey. Column (4) begins by including in each regression the controls not only for the subdistrict average level of the indicator in that regression, but also the subdistrict average level for each of the twelve indicators. This approach controls more fl exibly for differences between subdistricts, but also uses more degrees of freedom. The results with this approach are qualitatively similar to the baseline specifi cation, although one health indicator—delivery by trained midwives (4.83 percentage point increase)—now shows statistically signifi cant increases. In this specifi cation, the average standardized effect for health indicates an average improvement of 0.04 standard deviations (signifi cant at the 5 percent level).
Columns (5) and (6) examine what happens when we include fewer controls. Column (5) includes only the subdistrict average level of the indicator in the baseline, and so excludes the individual level panel data. The results from doing so look virtually identical to the main specifi cation, which suggests that the individual level controls are not appreciably changing the results. Column (6) includes no controls whatsoever in the regression—no baseline controls, and no controls for age and how the household was sampled. Once again the results look generally similar to the main specifi cation, although some of the point estimates attenuate and the average standardized effect for health is no longer statistically signifi cant. Combined, these results suggest that the baseline results are not substantially driving the results, though controlling more fl exibly for all twelve baseline indicators seems to strengthen the results.
Column (7) examines an alternative empirical approach: fi rst differences. Specifi cally, we estimate the following regression:
{ } pdsisppdsigmisypdsipdsdpsdpsd åPáSAMPLEãYGENERASIâáyy +×++++=− ≠ sin02101 11_
where ypds0
is the subdistrict average baseline level or, if the individual has a person-specifi c baseline value from the panel, the person-specifi c value. As noted by Deaton (2009), in small samples controlling for baseline values can introduce bias, whereas a fi rst-difference approach (which is equivalent to imposing a coeffi cient of 1 on the baseline values) does not have this problem. On the other hand, if the true coeffi cient on the baseline values is substantially less than 1 (as it often is), fi rst differences can actually increase standard errors by introducing more noise into the dependent variable. The results in column (7) show that the results using fi rst differences are somewhat stronger than the main specifi cation, with Generasi showing statistically signifi cant increases in deliveries by midwives (5.7 percentage points), immunization (4.9 percentage points), and weight checks (0.17 visits), and an average improvement
Indonesia’s PNPM Generasi Program: Interim Impact Evaluation Report 31
Main Results
in health indicators of 0.061 standard deviations, which is statistically signifi cant at the 1 percent level. The negative effects on education indicators (-5.9 percentage points for age 13–15 gross enrollment and -6.8 percentage points for age 13–15 gross attendance) are still present and statistically signifi cant, but in this specifi cation there is also a positive and statistically signifi cant 4.1 percentage point increase in age 7–12 gross attendance. On balance, this specifi cation shows stronger impacts of Generasi than the main specifi cation.
All of the regressions so far used data at the individual level. Since the treatment is at the subdistrict level (i.e., all individuals in the same subdistrict are either treated or controls), one can repeat the analysis by fi rst aggregating to the subdistrict level, and then running regressions with only 263 observations—one per subdistrict—estimating the following regression
dsispsddsdsd åPáyYGENERASIâáy +×+++= 011 1_
where 1sdy denotes the subdistrict-level average value of y.
The results from estimating this regression at the subdistrict level are shown in column (8). The results are virtually identical to the main specifi cation, except that the increase in deliveries assisted by trained midwives (4.8 percentage points) is now statistically signifi cant (at the 5 percent level) in this specifi cation.
Finally, as discussed in Section 1.3, all of the analysis so far is (a) restricted to the 264 subdistricts that were not eliminated because they were on the ex-ante lists (scheduled to receive other PNPM grants) and (b) treats subdistricts scheduled to receive Generasi in year 2 of the program as part of the control group. An alternate specifi cation is simply to revert to the full set of 300 subdistricts originally used in the randomization (that is, not dropping any subdistricts), and compare all 200 subdistricts randomly chosen to receive Generasi against the 100 subdistricts randomly chosen to be part of the control group. This is the intent-to-treat estimate, and it will be substantially lower than the estimates above since only 129 of the 200 subdistricts identifi ed as treatment actually received Generasi in year 1 of the program, but it is conservative in that it is based solely on the randomization we carried out by computer. The estimates using the full 300 subdistricts are in column (9). They show qualitatively similar patterns to the main specifi cation, with statistically signifi cant increases in iron tablets (0.10 sachets containing 30 tablets in a sachet) and weight checks (0.075 weight checks), and negative and statistically signifi cant impacts on age 13–15 gross enrollment and 13–15 gross attendance. The only main change is that the point estimate on deliveries by trained midwives is actually negative, but it is not statistically signifi cant.
On balance, the results presented in Table 7 show substantial robustness: the qualitative patterns in the results are quite similar across specifi cations; if anything, alternative specifi cations tend to show larger and more statistically signifi cant results than our main, preferred specifi cation.

32 Indonesia’s PNPM Generasi Program: Interim Impact Evaluation Report
Main Results
3.1.3 Regional DifferencesUsing a regional breakdown of the fi ndings on the impact of the twelve main indicators, we fi nd dramatic differences among the regions. Based on the twelve key indicators, Generasi had the largest impact in North Sulawesi/Gorontalo, small positive impacts in Java, and essentially no impact in NTT. Java
Table 8 begins by repeating the analysis shown in Table 6, but restricted to Java. The overall results in Java show a statistically signifi cant improvement in safe deliveries by trained midwives, which improved 5.0 percentage points (signifi cant at the 5 percent level) above and beyond the control group mean of 84.3 percent. This is despite the fact that safe deliveries generally increased during this period in Java, with the mean at baseline (Wave I, column 1) and mean of the control group in Wave II (column 2) increasing by about 7 percentage points. No other health indicators show statistically signifi cant effects, though point estimates are positive for prenatal visits, iron tablets, growth monitoring, and Vitamin A. The point estimates suggest an average improvement in health of 0.04 standard deviations, statistically signifi cant at the 10 percent level. On education, none of the four main education indicators show any statistically signifi cant change in Java. The only statistically signifi cant change (at the 10 percent level) is attendance at school for 13–15 year olds enrolled in school (“conditional attendance”), which declined by 1 percentage point. Average education effects show no statistically signifi cant impacts.
In interpreting the small effects on Java, it is important to note that twelve indicators have generally improved during the period between Wave I (column 1) and Wave II (column 2)—except for antenatal and prenatal care visits—with control means (column 2) considerably higher in Java than in the other two regions for virtually all main indicators. The single exception is Vitamin A, which was slightly higher in Sulawesi than in Java; otherwise, control areas in Java were higher than Sulawesi in all eleven other main indicators and higher than NTT in all twelve indicators. The high baseline levels in Java may have meant that it was harder to obtain improvements.
The differences between the incentivized (treatment A) and non-incentivized (treatment B) versions were less pronounced in Java than in the national sample. Increased probability of safe delivery was only observed in treatment B areas (by 8.2 percentage points at 1 percent signifi cance level, column 5) and an increase in children’s participation in growth monitoring was observed only in treatment A areas (increased participation by 0.12 sessions in previous 3 months, signifi cant at 10 percent level, column 6). The average impact on health indicators of 0.05 standard deviations (signifi cant at 10 percent level) was observed only in treatment A areas but not in treatment B areas, although the difference in average standardized effects between treatment A and treatment B was not statistically signifi cant.
NTT Table 9 shows the results for NTT. In general, in NTT the point estimates of four of the eight health indicators suggest negative impact, with two of the eight indicators (prenatal visits and Vitamin A) negative and statistically signifi cant and none of the indicators positive and statistically signifi cant. In education, the point estimates point to positive primary school enrollment and attendance effects and negative effects on junior secondary school. The estimates show a positive and statistically signifi cant improvement in primary school age attendance of 2 percentage points and a statistically signifi cant reduction of 6.2

Indonesia’s PNPM Generasi Program: Interim Impact Evaluation Report 33
Main Results
percentage points for junior secondary age attendance. The average effects for both education and health are negative but not statistically signifi cant.
Although Generasi had no effect overall, the estimates suggest that the average effect was actually negative in treatment B (non-incentivized areas), while it was positive in treatment A areas. In particular, in treatment A areas pregnant women had 0.68 more prenatal visits (signifi cant at the 10 percent level), 0.63 more postnatal visits (signifi cant at the 5 percent level), and 0.25 more sachets of iron tablets (signifi cant at the 5 percent level). Most impressively, treatment A reduced malnutrition by a statistically signifi cant 0.6 percentage points (from 35 percent in the control areas). In treatment B, the average standardized effect for health was 0.077 standard deviations (statistically signifi cant at the 10 percent level); in treatment A, the average standardized effect for health was 0.024 standard deviations (not statistically signifi cant). The average effects for education were not statistically signifi cant in either treatment.
One potential explanation for the difference in Generasi performance between NTT and elsewhere is that villagers may have focused more intensively on nutritional supplements. During the period between the baseline and Wave II surveys, there was a surge in the malnutrition rate of children under 3 in NTT from the baseline of 24.7 percent in 2007 to 35.3 percent in control areas in Wave II in 2008, while in the other two regions malnutrition rates were relatively stable. Given this large increase in malnutrition in NTT and considerable media attention on malnutrition in NTT during the period of evaluation,14,15 it is not surprising that communities focused more on nutritional intervention in NTT. The Generasi impact—in particular in treatment A areas—shows a strong preventive effect of malnutrition; nevertheless, even with the large treatment effect in treatment A areas, it could not completely negate the surge in malnutrition during this period. We will explore this issue in discussing fund allocation decisions below.
SulawesiTable 10 shows the results for the provinces of North Sulawesi and Gorontalo, and we fi nd that Generasi had the largest effects in these two provinces. All but two health indicators indicated positive impacts, although all education indicators did worse in Generasi areas than control areas. Most impressively, Generasi increased the probability of delivery by trained midwives by 11.7 percentage points (signifi cant at the 5 percent level). The average impact on health indicators for the Generasi project was 0.08 standard deviations (signifi cant at the 10 percent level).
As for the impact on children’s schooling, all main schooling indicators were negative. One indicator—13-to-15-year-old gross attendance—fell by a statistically signifi cant 9.5 percentage points (signifi cant at the 10 percent level). Another statistically signifi cant change was a 2.8 percentage point reduction in junior secondary school attendance conditional being enrolled (signifi cant at the 10 percent level). The average impact on education indicators in the North Sulawesi was a negative 0.15 standard deviations (signifi cant at the 5 percent level).
14 “Five People die of malnutrition in NTT”, March 8, 2008, Jakarta Post (http://www.thejakartapost.com/news/2008/03/07/fi ve-people-die-malnutrition-ntt-html?1)
15 “23 Anak Meninggal di NTT (23 children die in NTT)”, June 17, 2008, KOMPAS (http://koran.kompas.com/read/xml/2008/06/17/0144580/23.anak.meninggal.di.ntt)

34 Indonesia’s PNPM Generasi Program: Interim Impact Evaluation Report
Main Results
The positive average impact on health indicators in Sulawesi was predominantly found in improvements of health indicators in treatment A areas (column 6): a 15.8 percentage point increase in the probability of safe delivery (signifi cant at the 1 percent level); an 11.5 percentage point increase in childhood immunization completion (signifi cant at the 10 percent level); and an increased children’s participation in the monthly growth monitoring sessions by 0.37 sessions in the previous three months (signifi cant at the 10 percent level). In treatment B areas (column 5), the only indicator that improved was safe delivery, which increased by 8.5 percentage points (signifi cant at the 10 percent level). In education, treatment B areas fared worse than controls in junior secondary school gross enrollment by 13.6 percentage points and junior secondary school gross attendance by 17.0 percentage points (both signifi cant at the 1 percent level); and junior secondary school attendance among those who were enrolled in one by 4.3 percentage points (signifi cant at the 5 percent level). These statistically signifi cant negative impacts in indicators related to junior secondary schooling were not observed in treatment A areas (column 6). In net terms, treatment A increased the health indicators by 0.17 standard deviations (signifi cant at the 1 percent level). Moreover, treatment A in Sulawesi was the only area to achieve a statistically signifi cant average increase across all twelve main indicators (0.13 standard deviations, signifi cant at the 5 percent level.)
3.2 Impact on Long-Term Final OutcomesIn this interim survey we only studied long-term health outcomes, but not for education.16 The health outcomes studied were neonatal (deaths within 28 days) and infant mortality (deaths within the fi rst year), morbidity of childhood diseases (acute respiratory infection (ARI) and diarrhea) among children under 3 in the previous one month, and malnutrition (defi ned by < -2 SD weight-for-age) and severe malnutrition (<-3 SD weight-for-age) also among children under 3. We present the results from all provinces fi rst and then by region. The two-year analysis will also include test scores to measure impacts on education as well as other measures of malnutrition such as height-for-age and weight-for-height.
3.2.1 All ProvincesTable 11 shows the Generasi’s interim impact on fi nal health outcomes. We observe positive impacts in all of the long-term fi nal health outcomes studied in Wave II, with signifi cantly lower mortality. Compared to the control areas, Generasi areas had 5.2 fewer neonatal deaths (deaths within 28 days of birth) per 1,000 live births during the 18 months prior to the survey (signifi cant at the 10 percent level) and 7.6 fewer infant deaths per 1,000 live births (deaths within one year of birth) during the previous 24 months (signifi cant at the 5 percent level). These effects are very large: they imply that Generasi reduced neonatal mortality by 47 percent from the level in the control group, and reduced infant mortality by 28 percent from the level in the control group.17 Although such effects are large, other community-based
16 The reason we chose not to include long-term education outcomes is that the best way to measure long-term education outcomes is test scores. Since these indicators are costly to collect, and we did not expect an impact on test scores in the short run, we elected to collect test score data only at baseline and at the follow-up wave.
17 Given the small sample size in this province (only 531 infants), it is useful to examine the raw numbers: of 531 infants in the 0–24 month sample in this province, 10 out of 300 (3.33 percent) died in control areas, whereas only 3 out of 231 (1.3 percent) died in Generasi treatment areas. The raw data with no fi xed effects or other corrections thus suggests a reduction of 20 deaths per thousand. Once one splits the data into Group P and Group NP, the differences are 5.59 percent vs. 1.56 percent (group P, fi sher’s exact p-value of 0.060) and 1.27 percent vs. 0 percent (group NP, fi sher’s exact p-value N/A).

Indonesia’s PNPM Generasi Program: Interim Impact Evaluation Report 35
Main Results
interventions have also reduced infant mortality by similar orders of magnitude (Bjorkman and Svensson 2009).
In interpreting the infant mortality results, it is important to note that, although the baseline was balanced in general (see Section 2.2), the one variable where there may have been some pre-period differences (by pure random chance) is infant mortality, though not neonatal mortality. In particular, the baseline regressions to test the balance resulting from randomization suggest (Table 5 discussed above) that the Generasi treatment areas had lower infant mortality of 8.8 deaths per 1,000 live births at the baseline of the project implementation (signifi cant at the 10 percent level). Neonatal mortality, on the other hand, did not have statistically signifi cant imbalance detected between project implementation and control areas. Moreover, we found reductions in neonatal and infant mortality even in provinces where there were no differences at baseline (see Table 59 and Table 60). Of course, these regressions control for the baseline infant mortality rate in each subdistrict, and the regression results controlling for these baseline levels statistically signifi cantly indicate that Generasi considerably reduced neonatal and infant mortality in 18 months. Nevertheless, the differences in baseline value for infant mortality suggest that some caution should be used in interpreting these results.
Point estimates for morbidity of childhood diseases and malnutrition both suggest reductions from the Generasi project, although the estimates are not statistically signifi cant. The average impact on fi nal health outcomes indicates an improvement in health outcomes of 0.03 standard deviations (signifi cant at the 5 percent level). Without neonatal and infant mortality, however, the average impact on childhood diseases and malnutrition suggest an improvement of 0.02 standard deviations, but is not statistically signifi cant.Comparing treatment A and treatment B, we found no difference between the two treatments on mortality, but we do fi nd that treatment A with community incentives did better on morbidity and malnourishment. In particular, the average standardized effects—excluding the mortality indicators—were 0.05 standard deviations better in treatment A (signifi cant at the 5 percent level).
Examining the mortality indicators, the reductions in infant mortality were virtually identical in both treatment A and treatment B locations (a statistically signifi cant reduction of 8.0 deaths per thousand in treatment B and a statistically signifi cant reduction of 7.2 deaths per thousand in treatment A). There was also a neonatal mortality reduction of 5.6 deaths per 1,000 live births in treatment A. A similar point estimate of 5.0 deaths per 1,000 live births was observed in treatment B, but it was not statistically signifi cant. Comparing these estimates to the baseline (Table 60), while the baseline showed a statistically signifi cant reduction in infant mortality in treatment A, it showed no such impact in treatment B. Combined, the fact that we are controlling for the baseline mortality rates and the mortality reduction appears in treatment B—where there was no difference at baseline—as well as treatment A suggests that these are real infant mortality reductions rather than mere artifacts of the data. It is also worth noting that none of the average standardized effects show statistically signifi cant differences at baseline, whereas the differences in the post-period are statistically signifi cant.
3.2.2 Regional BreakdownWhen Generasi’s impact on long-term fi nal health outcomes is broken down into regions, Java has the smallest impacts (Table 12), with somewhat larger impacts detected in NTT (Table 13), and very large impacts in North Sulawesi/Gorontalo (Table 14). The fact that the largest impacts are found in Sulawesi is consistent with the fact that the impact on the twelve main indicators was also largest in Sulawesi, as discussed above.

36 Indonesia’s PNPM Generasi Program: Interim Impact Evaluation Report
Main Results
In Java, no statistically signifi cant positive impacts were found on long-term health outcome indicators (Table 12). The only statistically signifi cant effect is a reduction in infant mortality in Java in treatment A, which fell by 5.8 deaths per 1,000 births, or a 45 percent reduction from the level observed in the control group. No impact was detected in treatment B, and none of the other indicators in Java showed statistically signifi cant changes. The average standardized effects in Java were not statistically signifi cant.In NTT, all but one health outcome indicator suggests positive impacts of Generasi implementation, with a signifi cant reduction in neonatal mortality of 14.3 deaths per 1,000 live births, a reduction of 65 percent from the mean level in the control group (signifi cant at the 5 percent level, Table 13, column 3). The one health outcome indicator not suggesting positive impact was morbidity of childhood illnesses of diarrhea or ARI. Both treatment A and treatment B reduced neonatal mortality at statistically signifi cant levels, with similar sized reductions in both treatments (a reduction of 14.6 deaths per 1,000 live births in treatment B areas, as shown in Table 13, column 5) and 14.1 deaths per 1,000 live births in treatment A areas (column 6). Generasi also led to increases in breastfeeding in NTT, which may be related to the improvements in neonatal mortality rates. There was some indication that a reduction in infant mortality was also observed in treatment B areas only, with 14.5 fewer deaths per 1,000 live births (signifi cant at the 10 percent level). The average standardized effects are statistically signifi cant (at the 10 percent level) in treatment A (0.06 standard deviations), but not in treatment B (0.02 standard deviations).
NTT also saw substantial reductions in malnourishment in treatment A areas. This occurred during a period characterized by a large surge in malnutrition, from 24.7 percent at baseline in 2007 to 35.3 percent in the control areas in 2008, as discussed above in Section 3.1.3. Generasi treatment A prevented malnutrition of children under 3 (defi ned as more than 2 standard deviations below the weight-for-age mean) by a statistically signifi cant 6.2 percentage points from a control group mean of 35.3 percent, a prevention of 17.6 percent. As discussed in Section 4.3.2, supplementary feeding at village health posts increased dramatically in NTT—by about 21 percentage points. This may be related to the decline in malnutrition, although the increase in supplementary feeding occurred in both treatment A and treatment B locations.
One partial explanation for why malnutrition appears to have declined only in treatment A in NTT is that in treatment B, infant mortality also declined. Given that malnutrition is a likely cause of infant death in NTT, it is likely that the marginal children who survived in treatment B in NTT were very malnourished. Thus, precisely because of the reduction in infant mortality in treatment B, the sample of children in treatment B includes these additional very small and malnourished children who in treatment A (or control) would have died and not been in the sample. The reduction in mortality and the survivorship of these malnourished children in treatment B may be masking the actual greater reduction in malnutrition in treatment B, and suggests that in fact malnutrition was reduced in both treatment A and B in NTT. By far the largest impacts in health outcomes were observed in North Sulawesi/Gorontalo. In particular, in North Sulawesi/Gorontalo, infant mortality declined by 42 births per 1,000 live births. Compared to control areas in North Sulawesi/Gorontalo, Generasi project areas were also found to have less severe malnutrition among children under 3 by 3.6 percentage points, a 32.8 percent reduction from the baseline level (signifi cant at the 10 percent level, column 3). The mortality impacts were found equally in treatment A and treatment B areas; the observed malnourishment effects were slightly larger in treatment B than treatment A, but the difference between them was not statistically signifi cant. Overall, the project improved health indicators in Sulawesi by a statistically signifi cant 0.09 standard deviations (signifi cant at the 10 percent level).

Indonesia’s PNPM Generasi Program: Interim Impact Evaluation Report 37
Main Results
3.3 Impact on Non-Targeted IndicatorsThis section discusses Generasi’s positive and negative spillovers and the program’s effects beyond the targeted health and education indicators. Since the program supports community mobilization for increased use of basic health and education services and promotes provider-community collaboration, it is possible that there would be positive spillovers on non-targeted indicators. On the other hand, if Generasi diverted effort toward targeted indicators and away from non-targeted indicators, it is theoretically possible that spillover effects could have been negative. In general, spillovers were very small but positive for health and negative for education.
For health, the main spillovers we expected were increases in quality of services, a possible decline in the use of non-targeted health services, and improved parental knowledge and parenting practices. In education, spillovers were expected in reduced child labor, increased high school enrollment, reduced school dropout rates, higher primary to junior secondary school transition rates, and an increased number of school hours attended by those enrolled in school. We examine these impacts in detail in the following sections.
3.3.1 All ProvincesWe did not fi nd changes in the quality of prenatal care services measured by the completeness of services mothers received during their fi rst antenatal care visit (column 3, Table 15) but the quality of village integrated health posts seems to have improved measured by the content of services mothers received during the village health post sessions. Facility-based (versus home) deliveries increased by 4 percentage points in the incentivized (Group A) areas; however, we did not fi nd changes in the use of non-targeted health services or changes in health behaviors, such as use of modern family planning devices, use of curative outpatient care, timing of initiation of breastfeeding, or lengths of exclusive breastfeeding. Nor did we fi nd changes in the mothers’ knowledge of good parenting practices, measured as a combined indicator of mothers’ knowledge on breastfeeding practices and management of diarrhea. The fertility rate also was not affected by the project. During this fi rst year of Generasi, spillovers on health were observed indicators that were not targeted by the project, but communities invested in them as the means to reach the target indicators. Many Generasi communities invested their community block grants on improving village health post equipment, furniture, and incentives for the cadres. Spillovers to other indicators that require changes in behaviors—such as use of non-targeted health services, or better parenting and feeding practices—may take longer than 15–18 months, the period of time currently being studied.
As for non-targeted indicators in education, we found increases in hours spent by school-age children on work for wages and non-waged household work. School-aged children in Generasi treatment areas worked 12 minutes more for wages and 39 minutes more on household chores (both signifi cant at the 1 percent level). This is consistent with the fi nding reported earlier that enrollment rates for the 13–15 age range grew more slowly in Generasi areas than in controls. Children enrolled in school actually spent less time (about half an hour less) in Generasi areas compared to control areas, consistent with the lower attendance. We did not fi nd impacts in high school enrollment, primary and junior secondary school dropout rates, or primary school to junior secondary school transition rates.

38 Indonesia’s PNPM Generasi Program: Interim Impact Evaluation Report
Main Results
Refl ecting the positive changes in non-targeted health indicators, the average improvement across all nine health indicators was estimated to be 0.03 standard deviations (signifi cant at the 5 percent level). Average change in the nine non-targeted education indicators, on the other hand, was a negative 0.07 standard deviations (signifi cant at the 5 percent level).
The negative spillover effects were all found to be most strongly present in treatment B areas, where communities were not given fi nancial incentives (column 5, Table 15). Only one additional non-targeted indicator was found signifi cant in treatment A: a 4 percentage point increase in institutional deliveries (i.e., childbirth in a facility, rather than at home) in treatment A areas compared to controls (signifi cant at the 10 percent level), although the same effect was not found in treatment B areas. On average, a negative change in non-targeted education (-0.08 standard deviation, signifi cant at the 5 percent level) was found in Generasi treatment areas, although the negative impact was more pronounced in treatment B areas (-0.09 standard deviation, signifi cant at the 5 percent level) than in treatment A areas (-0.06 standard deviations, signifi cant at the 10 percent level). In contrast, non-targeted health indicators showed improvement in treatment A only (a 0.04 standard deviation, signifi cant at the 5 percent level).
3.3.2 Regional BreakdownMirroring the fi ndings on the main indicators, spillover effects were strongest in Sulawesi, and only a few were detected in Java and NTT. The spillovers on educational indicators were varying, with impacts observed in different directions. This did not allow us to draw a consistent picture across the regions.
We found improvements in village health post quality in Java (Table 16) and Sulawesi (Table 18) by 6 and 13.3 percent respectively. These are areas where communities invested their efforts as the means to improve the target indicators. We did not fi nd other effects on quality of services. Changes in parenting behaviors were mixed: the time period when mothers exclusively breastfed their children increased on average by about 2.5 days in NTT (only seen in treatment A areas, column 6, Table 17, signifi cant at the 10 percent level), but decreased by 3.8 days in Sulawesi (in both treatment A and B areas, signifi cant at the 1 percent level). There is also a slight indication that the use of outpatient curative care increased in NTT, but only in treatment B areas (an increase of 0.05 percentage points, signifi cant at the 10 percent level). There was also an increase in institutional deliveries in Sulawesi, but only in treatment A areas (by 0.06 percentage points, signifi cant at the 10 percent level). We observed reductions in fertility rates in treatment A areas in Sulawesi by 0.047 percentage points (signifi cant at the 10 percent level). In general, although not statistically signifi cant, the point estimates indicate a decline in fertility rates in NTT and Sulawesi, and no change in Java. This is very encouraging given the potential perverse incentives for communities to increase the number of pregnancies and deliveries, particularly in treatment A areas.
In both NTT and Sulawesi, school-age children spent on average 90 more minutes on household chores in the previous one week in both regions compared to children in control areas (signifi cant at the 1 percent level in NTT and 5 percent level in Sulawesi). In addition, in Sulawesi school-age children worked 68 more minutes for waged labor in the past one week (signifi cant at the 5 percent level), which was predominantly observed in treatment B areas. This contrasts with Java, where school-age children spent on average 11 minutes less on waged labor (signifi cant at the 5 percent level), although only in treatment

Indonesia’s PNPM Generasi Program: Interim Impact Evaluation Report 39
Main Results
A areas. In sum, average standard effects in health indicate that improvements were observed in Java (Table 16), in NTT (Table 17), and in treatment A areas in Sulawesi (Table 18), although only reaching statistical signifi cance in Java. In contrast, statistically signifi cantly negative impacts in the average non-targeted education indicators were observed only in treatment A and treatment B areas in NTT and treatment B areas in Sulawesi.


Indonesia’s PNPM Generasi Program: Interim Impact Evaluation Report 41
Where Were Generasi Effects Largest?
4.1 AreasIn this section we examine the type of environments in which Generasi is most effective. As an indicator of project effectiveness in areas with different levels of pre-existing service delivery systems, an interaction term with baseline levels of service coverage was included in the models. Column 3 of Table 19 shows the changes of the coeffi cients found in Column 3 of Table 6 with a one-unit increase in the subdistricts’ average baseline levels. A positive coeffi cient in column 3 of Table 19 implies larger effect sizes in areas with higher baseline levels, whereas a negative coeffi cient implies larger project effect in areas with lower baseline levels. To help interpret the magnitude of the interactions, column 4 shows the effect of one year of Generasi implementation on subdistricts at the 10th percentile in terms of baseline performance on the specifi c outcome variable at the baseline period.
4.1.1 All ProvincesIn general, Column 3 in Table 19 shows negative changes in coeffi cients with increased average baseline levels, suggesting that Generasi had a larger impact in those subdistricts with lower baseline performance. There were two indicators with statistically signifi cant differential impact: complete childhood immunization and malnutrition. In subdistricts with a lower baseline average coverage of childhood immunization, we found greater project impact on immunization. Likewise, in subdistricts with a higher baseline malnutrition rate, we observed greater reduction of malnutrition as a result of Generasi treatment. The fact that Generasi’s impact on health was greater in areas with lower pre-period coverage is intuitive, given that these areas had greater room for improvement.
Subdistricts at the lowest 10th percentile at baseline levels had larger project impact (column 4, Table 19) than for average subdistricts (column 3, Table 6). Looking at the 10th percentile at baseline, we observed statistically signifi cant improvements in three health indicators when compared to controls at the 10th percentile: (1) pregnant mothers received 0.19 more sachets of iron pills (signifi cant at the 10 percent level); (2) one-year-olds were 6 percent more likely to have received complete childhood immunization;
04

42 Indonesia’s PNPM Generasi Program: Interim Impact Evaluation Report
Where Were Generasi Effects Largest?
and (3) children under 3 attended 0.17 more growth monitoring sessions in the preceding three months (both signifi cant at the 5 percent level). There were no statistically signifi cant differences in the average effects for health or education indicators among the different poverty groups. The average impact on health was larger among those in subdistricts at the lowest 10th percentile at baseline by 0.07 standard deviations (signifi cant at the 5 percent level).
Table 20 shows the difference in Generasi impacts by treatment A and treatment B. Columns 4 and 5 in Table 20 suggest that in general larger treatment effects were observed in both in treatment A and treatment B subdistricts with lower baseline levels. We only found two statistically signifi cant differences in treatment A areas: (1) greater project impact on immunization coverage in subdistricts with lower baseline immunization coverage, and (2) larger reduction in malnutrition in subdistricts with higher baseline levels of malnutrition. Refl ecting insignifi cant differences between treatment A and treatment B, no difference was observed in the average effects of health and education indicators by the baseline wealth levels in treatment A or treatment B areas.
4.1.2 Regional BreakdownThere are important regional differences in the impact when considering the baseline level of outcomes. Larger impacts were observed in subdistricts in Java with lower baseline outcome levels, while project impacts do not seem to be affected by baseline levels of outcome in NTT and Sulawesi. This likely refl ects the fact that baseline levels of service provision were low enough in NTT and Sulawesi for the program to have an effect throughout the province, whereas in Java, there were some subdistricts where service provision was high enough that the program was unlikely to have an additional impact.
In Java, four of the eight main health indicators showed a statistically signifi cant difference in the levels of Generasi impact according to the subdistrict’s level of outcome indicator at baseline (Table 21). Project impacts were larger in subdistricts with lower baseline levels of safe delivery by trained professionals (signifi cant at the 10 percent level), receipt of iron tablets, and childhood immunization coverage (both signifi cant at the 5 percent level) than those presented in Column 3 of Table 8. Subdistricts with higher malnutrition rates at baseline levels in Java were found to have larger Generasi impact than the average. All the education indicators suggest that project impacts were smaller in subdistricts with higher outcome level at baseline, although none of them were statistically signifi cant. The results show that, for the 10th percentile subdistrict in Java, the Generasi program increased all eight health indicators by a statistically signifi cant 0.14 standard deviations and increased all twelve program indicators by a statistically signifi cant 0.09 standard deviations.
We found that the differential impact on health indicators was more prominent in treatment B areas (Table 22), with only one (immunization) of the four indicators’ differential impacts found in treatment A areas. On average, however, there was no signifi cant difference between treatment A and treatment B in Java in terms of standardized effects on health or on education by baseline service coverage level.
In NTT (Table 23) and Sulawesi (Table 25), Generasi impacts seem not to be affected by the levels of outcome indicators at baseline. Although small differences are observed between treatment A and treatment B areas in NTT (Table 24) and Sulawesi (Table 26), they cancel out. Perhaps the only noteworthy differentials between treatment A and B in Sulawesi is the positive differential (larger impact in subdistricts

Indonesia’s PNPM Generasi Program: Interim Impact Evaluation Report 43
Where Were Generasi Effects Largest?
with higher baseline level) in treatment B areas and negative differential (smaller impact in subdistricts with higher baseline level) in primary school enrollment and attendance. Although these differences in impact between treatment A and treatment B are highly statistically signifi cant, they too cancel out for Generasi impact as a whole in Sulawesi for these indicators. The interaction between treatment and baseline coverage levels on the average standardized effects across education indicators revealed opposite effects in the two regions of NTT and Sulawesi. In treatment B areas in NTT, subdistricts with higher baseline levels had smaller average impact on education indicators (by -0.87 standard deviation, signifi cant at the 5 percent level). In contrast, in treatment B areas in Sulawesi, larger impacts were observed on average for education indicators in subdistricts with higher baseline levels (by 0.93 standard deviations, signifi cant at the 5 percent level), while in treatment A areas smaller average impacts were observed in subdistricts with higher baseline levels (by -1.88 standard deviations, signifi cant at the 1 percent level). This suggests that in Sulawesi, at least for education, community incentives made Generasi work better for subdistricts whose indicators for education were lagging behind at baseline. In NTT, however, treatment B was more effective in improving education indicators in trailing subdistricts at baseline.
4.2 IndividualsOne of the unique features of Generasi is that communities conduct their own needs assessment and targeting of benefi ciaries. As part of the government’s poverty alleviation program, it is important to understand whether Generasi communities are able to appropriately target the poor and the vulnerable. In this section we explore whether the Generasi project is effective on the poor relative to the better-off, and how different community incentives affect the two groups. To investigate the heterogeneity in project impacts by the individual’s baseline level of per capita consumption, interaction terms were included to split the project effects for the poor (defi ned as being in the bottom two quintiles according to the baseline household consumption per capita) and the relatively better-off (defi ned as being in the top three quintiles).
For the program as a whole, on average there were no statistically signifi cant differences between the bottom two quintiles and the top three quintiles. However, this average masks important differences between the two versions of the programs: treatment A (the incentivized version of the program) had larger impacts for the bottom two quintiles, whereas treatment B (the non-incentivized version of the program) had larger impacts for the top three quintiles. The incentives in the program therefore played an important role in encouraging communities to focus their efforts on the poor.
4.2.1 All Provinces Columns 3 and 5 of Table 27—which show the project’s impact on the twelve main indicators for poor individuals (column 3) and for the relatively better-off (column 5)—suggest small heterogeneities in Generasi’s impact on individuals in different wealth groups, with no striking differences in the project’s impact on the two groups. Increased participation in growth monitoring was equally observed in both wealth groups; the poor attended 0.18 more sessions, while the relatively better-off attended 0.15 more sessions in the previous three months compared to those in the control areas. A statistically signifi cant reduction in school attendance by 13–15 year olds (by 5 percentage points) was observed among the

44 Indonesia’s PNPM Generasi Program: Interim Impact Evaluation Report
Where Were Generasi Effects Largest?
poor (signifi cant at the 10 percent level). Although a similar level of reduction was observed among the better-off group, it was not statistically signifi cant. On average, the point estimates suggest larger impacts among the better-off than among the poor for health indicators, though these differences are not statistically signifi cant; in education, the better-off were met with larger negative effects of the project than the poor.
The community incentives seem to have moved the locus of treatment effects from the better off to the poor. For example, column 4 of Table 28 shows that the poor did 14 percentage points worse on delivery than the rich; by contrast, the poor did 16 percentage points better than the rich on safe delivery in treatment A. Likewise, treatment B reduced malnutrition rates by 7.2 percentage points more for the rich than the poor, whereas treatment A reduced malnutrition rates by 13 percentage points more for the poor than for the rich. On average, treatment A improved health indicators among the poor (0.12 standard deviations, signifi cant at the 5 percent level) while treatment B improved health indicators of the better-off (0.08 standard deviations, signifi cant at the 5 percent level). As for education indicators, although none of the groups had a signifi cant effect, the impact on both wealth groups in treatment A was positive, while the impact on both wealth groups in treatment B was negative.
4.2.2 Regional BreakdownAlthough there were few indicators that show different impacts on the poor and the better-off, in general both the poor and relatively better-off fared equally in Java and Sulawesi. In NTT, the poor fared better in treatment A, whereas the better-off fared better in treatment B.
No notable differences in impact for the poor and the relatively better-off were observed in Java (Table 29) or in Sulawesi (Table 33). Both treatment A and B seem to have worked equally in Java for the poor as well as the better-off (Table 30). In Sulawesi, treatment A resulted in more pro-poor impacts for the health indicators and the education indicators (Table 34). Among the poor, treatment A in Sulawesi resulted in positive impacts only in antenatal care, malnutrition, and junior secondary school gross enrollment and attendance. In treatment B areas in Sulawesi, although primary school enrollment increased by 4 percentage points among the poor, both junior secondary school enrollment and attendance worsened for the poor. The poor in treatment A areas of Sulawesi were the only ones who statistically signifi cantly benefi ted both for the average across main health indicators (by 0.38 standard deviations, signifi cant at the 5 percent level) and for the average across main education indicators (by 0.30 standard deviations, signifi cant at the 5 percent level). In contrast, in treatment B areas in Sulawesi, the poor were impacted negatively by Generasi, resulting in a negative 0.27 standard deviation in education (signifi cant at the 5 percent level).
In NTT, Generasi seems to have favored those in the relatively better-off group than the poor, with immunization coverage improving only for the better-off (Table 31). Looking at the impacts in treatment A and treatment B separately, we found large differences in how the two treatments worked in NTT (Table 32). In general, treatment B only affected the poor negatively, with specifi c negative impacts on antenatal care, safe delivery, and postnatal care visits (signifi cant at the 10 percent level, 1 percent level, and 5 percent level respectively). On average, the poor in treatment B areas were 0.25 standard deviations worse off in the standardized effects for health compared to controls. On the other hand, the poor in treatment A areas benefi ted more than the better-off with receiving more postnatal care and iron tablets.

Indonesia’s PNPM Generasi Program: Interim Impact Evaluation Report 45
Where Were Generasi Effects Largest?
The average improvement of the main health indicators for the poor in treatment A in NTT was 0.16 standard deviations (statistically signifi cant at the 10 percent level), much larger than the benefi ts the better-off saw in their average of the health indicators (0.04 standard deviations).
4.3 Direct Benefi ts of Generasi FundsIn addition to the communities’ ability to target individuals, communities must also be able to design appropriate village-level projects that will address common and shared hurdles in accessing target health and education services. This section explores the types and quantities of direct benefi ts received by children under 3, school-aged children, and pregnant mothers.
In general, Generasi hugely increased provision of school uniforms, school supplies, supplementary feeding, cash subsidies for schooling, and antenatal/postnatal care and fees for delivery assistance. Cash subsidies for schooling were mostly found in Java and treatment A areas in Sulawesi, while intensive supplementary feeding was only found in treatment B areas in NTT.
4.3.1 All Provinces Generasi substantially increased the probability that pregnant mothers, children under 3, and school-age children received materials and cash subsidies related to health and education (Table 35). In general, statistically signifi cantly more 6-to-15-year-old children in Generasi areas received scholarships (by 1.1 percentage points, a 46 percent increase); school uniforms (by 9 percentage points, an eleven-fold increase, or 1,173 percent); school supplies (by 5.7 percentage points, a six-fold increase, or 632 percent); transportation subsidies (by 1 percentage point); and supplementary feeding at school (by 0.4 percentage points). More children under 3 in Generasi areas received supplementary feeding (by 15.5 percentage points, a 32 percent increase) and intensive supplementary feeding (by 1.7 percentage points, a 59 percent increase). Similarly, statistically signifi cantly more mothers received fi nancial subsidies to receive antenatal care and postnatal care (by 3 percentage points, a seven-fold increase, or 758 percent) and for childbirth (by 11.6 percentage points, a four-fold increase, or 385 percent).
In comparing treatment A and treatment B (Table 35, column 5 and 6), particularly in education more fi nancial subsidies such as scholarships and transport subsidies were provided in treatment A than in treatment B. In terms of support for use of health services, more children in treatment B areas received intensive supplementary feeding than in treatment A.
Given all the positive impacts Generasi has had in the provision of fi nancial and material support for children under 3 and school-age children, large average impacts were observed for direct benefi ts received in health and education: an improvement of 0.19 standard deviations for health benefi ts and 0.23 standard deviations for education benefi ts (both statistically signifi cant at the 1 percent level). On average, however, treatment A areas seem to have favored education benefi ts compared to treatment B (0.28 standard deviations and 0.18 standard deviation respectively, both signifi cant at the 1 percent level).

46 Indonesia’s PNPM Generasi Program: Interim Impact Evaluation Report
Where Were Generasi Effects Largest?
4.3.2 Regional BreakdownA few notable differences were found in the three regions. Scholarships increased only in Java (Table 36, column 3) and in treatment A areas in Sulawesi (Table 38, column 6), but not in NTT (Table 37, column 3). Supplementary feeding at village health post sessions was observed in all three regions. These monthly supplementary feeding activities at village health posts are popular among village health post cadres, and provide incentives for mothers and children to participate in village health posts. Villages also conducted more intensive supplementary feeding activities targeted specifi cally at malnourished children. NTT was the only region where a statistically signifi cant increase in intensive supplementary feeding was observed (3.9 percentage points increase, signifi cant at the 5 percent level), most of which happened in treatment B areas (6.3 percentage points increase, signifi cant at the 5 percent level), which also experienced the largest reductions in infant mortality. The average impact across health benefi ts and education benefi ts in the two treatment areas differed by region. In treatment A areas in Java and Sulawesi, both saw a larger impact on education direct benefi ts than health benefi ts. In treatment B areas on the other hand, in Java health benefi ts and education benefi ts were about the same, health benefi ts were larger than education in NTT, and education benefi ts were larger than health in Sulawesi.

Indonesia’s PNPM Generasi Program: Interim Impact Evaluation Report 47
How and Why did the Generasi Project Work?
This section explores the mechanisms through which Generasi—as a whole and the incentives in particular—altered the changes in coverage of basic health and education services. We fi rst examined changes on the provider supply side: the quantity of providers (Section 5.1), the inputs used by providers (Section 5.2), and the effort put in by providers (5.3). We found some increases in access to education, with the particular type of indicator affected varying by province (e.g., more junior secondary schools in Java, more primary schools in NTT, more junior secondary school teachers overall). However, by far the most pronounced change was in provider effort—in particular, we found that midwives in treatment A locations were spending substantially more time providing services, particularly outreach activities and public services. We then examined effort on the part of the community in Section 5.4. We found substantial increases in community effort: Generasi increased the number of cadre (volunteers) at village health posts and increased the number of school committee members for primary schools. We also found greater participation in monitoring meetings, and—perhaps surprisingly—greater participation in community groups in the village more generally and in semi-volunteer public labor service (gotong royong) activities.
Finally, in Section 5.5, we examine quantities of services using data from providers. The main fi nding was a dramatic increase in all types of health services provided at village health posts. We found statistically signifi cant increases in the quantity of children weighed, nutritional supplements, immunization, ANC visits, iron pills, and Vitamin A. The provider data also confi rmed the small declines in junior secondary school enrollment in Generasi treatment B areas, with the declines larger (and only statistically signifi cant) in the 2007–08 school year.
Taken together, the results in this section tell a consistent story: Generasi increased health performance in large part through increased community engagement, particularly through service provision at the village health posts.
05

48 Indonesia’s PNPM Generasi Program: Interim Impact Evaluation Report
How and Why did the Generasi Project Work?
5.1 Changes in Provider QuantitiesThe fi rst question in examining the impact of Generasi on supply is the quantity of providers. We examined changes in six types of providers at the village level: for health, we examined the presence of midwives and the number of active village health posts; for education, we examined the presence of primary school and junior secondary school in the village and the number of teachers at primary school and junior secondary school.
5.1.1 All ProvincesOverall, the estimates show that Generasi had no impact on the quantity of health providers, but may have had various impacts on access to education that varied by region. Looking across all provinces, we found increases in the number of junior secondary school teachers (by about one teacher in every two schools), but only in treatment B (non-incentivized) areas (Table 39). Although none of the other individual effects are statistically signifi cant, the point estimates for all four education indicators are positive, resulting in an average improvement of 0.04 standard deviations (signifi cant at the 10 percent level).
5.1.2 Regional BreakdownExamined province by province, the estimates reveal that Generasi did affect the presence of schools in the village—but because the type of school affected varied by province, the average effect across the entire program is not large enough to be detectable. Specifi cally, in Java, Generasi increased the probability that a village had a junior secondary school by 3.6 percentage points (an increase of 7 percent of the control mean level, signifi cant at the 10 percent level) (Table 40). In NTT, where not all villages had primary schools, the program increased by 2 percentage points the probability that a village had a primary school (signifi cant at the 10 percent level, Table 41). Since 96 percent of villages in NTT had primary schools in the control group, this implies that Generasi created primary schools in half of the villages that did not previously have one. The fact that primary schools increased in NTT—the only area where they were not likely to be universal before the program—confi rms that the fl exibility of the Generasi block grants allowed a very different use of funds in NTT, commensurate with local needs. Moreover, the point estimates for the effect on junior secondary school presence in NTT, at 3.6 percentage points, were virtually identical to the impact in Java, although the effect was not statistically signifi cant. Neither of these effects was present in Sulawesi, which is why we fi nd no effect on average in the program as a whole (Table 42). Java was the only region with a statistically signifi cant average impact on education (0.09 standard deviations; columns 3 and 6, Table 40 , signifi cant at the 5 percent level), while we did not fi nd signifi cant average impact in the other two regions.
5.2 Changes in Provider InputsThis section describes Generasi’s impact on the inputs providers use. Specifi cally, we examine the quality of the midwife’s facility (water and electricity), the midwife’s availability of medical supplies and tools, the number of school classrooms, the condition of the school building, and the presence of latrines at school. Overall, we found no clear impact of Generasi on these variables.

Indonesia’s PNPM Generasi Program: Interim Impact Evaluation Report 49
How and Why did the Generasi Project Work?
5.2.1 All ProvincesSpecifi cally, column 3 of Table 43 shows Generasi’s impact on the quality of infrastructure. The project did not signifi cantly improve the infrastructure for midwives or at schools, with none of the variables showing statistically signifi cant effects. When comparing the impact of treatment A (column 6) and treatment B (column 5), the only indicator with a statistically signifi cant change was the improved midwives’ access to clean water in treatment B areas (an improvement of 0.05 percentage points, signifi cant at the 5 percent level). There were no such improvements observed in treatment A areas.
5.2.2 Regional BreakdownLooking region by region, in Java (Table 44), the only statistically signifi cant effect of Generasi detected was the improved midwives’ access to clean water (an improvement of 5 percentage points, signifi cant at the 5 percent level), which came from treatment B locations. The effects on other indicators were not statistically signifi cant, and the effect sizes were also very small (column 3). In NTT (Table 45), no signifi cant overall impact was observed in provider infrastructures (column 3). When treatment A and treatment B effects are assessed separately, one signifi cant improvement was observed in midwives’ access to electricity, a 10.4 percentage point improvement in treatment A areas (signifi cant at the 10 percent level, column 6). No such improvement was found in treatment B areas (column 5). In Sulawesi (Table 46), the only signifi cant effect observed was on the availability of student latrines at junior secondary schools (an increase of 9.1 percentage points, signifi cant at the 10 percent level). Declines were observed in midwives’ access to water and number of junior secondary school classrooms in treatment B, and in the condition of junior secondary school buildings in treatment A. In net terms, however, these effects show no clear pattern and little overall signifi cance, as evidenced by the minimal changes on the standardized average effects.
5.3 Changes in Provider EffortThis section examines the third component of supply: provider effort. Specifi cally, we examine midwife labor supply, midwife participation in village health post activities, teacher absence, and teacher teaching behavior. We found that Generasi was associated with midwives spending more time working, with more total time spent in outreach observed in treatment A areas and more time spent per village health post overall. We found no impact on teacher attendance or teaching behavior.
5.3.1 All ProvincesThe overall results are shown in Table 47. According to midwives’ self-reports, midwives in Generasi areas spent more time at each village health post session providing various health services for mothers and their children (Table 47, column 3). An average midwife in Generasi areas reported spending 0.19 hours (about 11 minutes) more per village health post session compared to control areas (signifi cant at the 10 percent level). This may be a refl ection of the very large increase in the number of mothers and children receiving services at village health posts in Generasi areas, as seen below in section 5.5. We did not fi nd other midwife indicators to be statistically signifi cant for the program as a whole. As for teacher efforts, we did not fi nd statistically signifi cant effects either in the proportions present or engaged in teaching at the time of the survey teams’ visits.

50 Indonesia’s PNPM Generasi Program: Interim Impact Evaluation Report
How and Why did the Generasi Project Work?
In treatment A areas (column 6), midwives reported spending 0.79 more hours (about 47 minutes) providing outreach services during the previous three working days (signifi cant at the 10 percent level). Although no other midwife indicator refl ecting their efforts was statistically signifi cant, all of the point estimates suggest midwives spent increased amounts of time providing services in treatment A areas than in control areas. For example, midwives spent 0.89 more hours in the previous three days providing outreach in treatment A than in treatment B, 1.7 hours more in the previous three days providing all public services in treatment A than in treatment B, and 3.1 more hours working in treatment A than in treatment B (column 4). These results are consistent with the main results showing that the increase in weight checks at village health posts, prenatal visits, and postnatal visits was higher in incentivized areas than in non-incentivized areas. This suggests that the increase in midwife hours is driven by the increased demand for their services, which in turn is spurred on by the incentives. The standardized average effect for health was only statistically signifi cant in treatment A areas, with an improvement of 0.09 standard deviations (Column 6, signifi cant at the 10 percent level), but was not signifi cant for Generasi treatment as a whole (Column 3). We did not fi nd positive or negative impacts on school teacher’s efforts either in treatment A or treatment B areas.
5.3.2 Regional BreakdownExamining the results regionally, we found generally positive effects in the provision of midwives’ services in Java and Sulawesi, but not in NTT. Teachers, particularly in NTT, seem to have responded negatively, but were generally more positive in Sulawesi, and mixed in Java. In general, we found more positive effects on provider quantity in treatment A areas and more negative effects in treatment B areas, except in NTT, where we found no positive effects on provider efforts.
Specifi cally, column 3 in Table 48 shows changes in provider efforts in Generasi areas in Java. Midwives in Java reported spending 0.87 more hours (about 52 minutes) on outreach services (signifi cant at the 1 percent level), which was observed predominantly in treatment A areas. Midwives in Java generally increased the amount of time spent working as a result of Generasi, but may have reduced the amount of time working in their public capacity. The only positive fi nding regarding school teachers as a result of Generasi was found in Java: primary school teachers were 2.4 percentage points more likely to be present (at the 10 percent signifi cance level) at the time of the survey, which generally was unannounced.
In treatment B areas in Java (Table 48, column 5), midwives spent on average 36 minutes more on outreach services but about 74 minutes less on public services at the health facility in the previous three days as a result of Generasi (both signifi cant at the 10 percent level). Midwives in treatment A areas in Java (column 6), on the other hand, in general (although also not statistically signifi cant) spent more time working, on average 68 minutes more on outreach services during the previous three days (signifi cant at the 1 percent level). The point estimates of all other midwife effort indicators in treatment A areas suggest an increased amount of time spent providing services overall. As a result, the standardized average impact in Java was statistically signifi cant for health in treatment A areas, with an improvement of 0.10 standard deviations (column 6, Table 48).
The effect of Generasi on midwives and teachers in NTT was largely more negative than positive (Table 49, column 3). Although none of the midwife effort indicators were statistically signifi cant, the point estimates suggest that midwives spent less time working overall. Primary and junior secondary school

Indonesia’s PNPM Generasi Program: Interim Impact Evaluation Report 51
How and Why did the Generasi Project Work?
teachers were 7 percentage points less likely to be present at school and 17.5 percentage points less likely to be engaged in teaching at the time of the observation (both signifi cant at the 10 percent level). These negative effects found on midwives and teachers were more pronounced in treatment B (columns 5) areas in NTT than in treatment A areas (columns 6). The standardized average effects in NTT were highly statistically signifi cantly negative, particularly for education, with negative 0.32 standard deviations in Generasi locations overall in NTT (signifi cant at the 1 percent level). Although average effects on health indicators were not statistically signifi cant, average standardized effects combined for health and education indicators were negative at -0.17 standard deviations in NTT (signifi cant at the 1 percent level).
In Sulawesi, midwives spent about 53 more minutes per village health post session in Generasi areas (signifi cant at the 5 percent level, Table 50, column 3). No other midwife effort indicators were statistically signifi cant. As for school teachers, although none of the indicators were statistically signifi cant, the point estimates suggest a more positive impact on teachers’ attendance and time spent teaching than in the other two regions.
Midwives in treatment B areas in Sulawesi (Table 50, column 5) reported spending more time per village health post session, although in general—according to the point estimates—they seem to have spent less time working in the previous three days as a result of Generasi. In contrast, in treatment A areas (column 6), midwives not only spent more time per village health post session by about 48 minutes, but also on average reported spending 4.59 more hours working in the previous three days (signifi cant at the 10 percent level). Point estimates of all other midwife effort indicators suggest positive effects of treatment A on midwives; the average standardized effect in treatment A areas showed a highly signifi cantly positive effect of 0.26 standard deviations (column 6, signifi cant at the 1 percent level). Teachers, on the other hand, seem to have responded better to treatment B than to treatment A, although none of the indicators were statistically signifi cant, nor were the average standardized effects for education in Sulawesi.
5.4 Changes in Community EffortThe analysis above explored the impact of Generasi on providers, primarily midwives and schools. This section explores the impact of Generasi on the community’s effort. In this section, we examine three types of community effort: (1) community effort at direct service provision, such as the number of active village health post sessions and the number of cadres at the village health post; (2) community effort at outreach, such as health sweepings and school committee meetings with parents; and (3) community effort at monitoring, such as the number of school committee meetings. We also examine spillovers of Generasi to other types of community activities, such as the semi-volunteer public labor service (gotong royong), government service, and other community groups.
Overall, we fi nd scattered bits of evidence that Generasi increased community effort, particularly on the number of cadres at village health post meetings, the number of junior secondary school students, and the number of parents participating in health education meetings. On average, Generasi had positive impacts on community efforts, mostly due to its effects on community efforts related to health activities.

52 Indonesia’s PNPM Generasi Program: Interim Impact Evaluation Report
How and Why did the Generasi Project Work?
5.4.1 All ProvincesTable 51 shows the results for all provinces. We found that Generasi did not change the number of active village health posts or the frequency with which they met; it did, however, increase the number of village health post cadres by 0.24 people, or about 5 percent of the control group mean. The effects on the number of cadres were equally present in treatment A and treatment B locations. The increase in the number of cadres is consistent with the very large increase in the number of services delivered at village health posts; see Section 5.5 below. Consistent with the increased number of participants receiving services at village health posts, in both treatments A and B areas, the number of times mothers participated in health education sessions increased by 0.1 times in the past 15 months.
Turning to community outreach, we found no effects of Generasi—either treatment A or treatment B—on any of our metrics of community outreach. Specifi cally, we found no impact on the number of village health post sweepings, where the village health post cadres go door-to-door to make sure all households are receiving services, and we found no impact on the number of school committee meetings with parents for either primary or junior secondary schools.
We did, however, fi nd an impact on one metric of community effort at monitoring: in treatment A locations, the number of primary school committee members increased by 0.75. We found no impact in treatment B, nor on any of the other community monitoring effort variables.
Perhaps the most striking result is that we saw positive spillovers from Generasi to other types of community activities—in Generasi communities, the average household spent 3.2 more hours over the past three months doing semi-volunteer public labor service, a 11 percent increase..
Generasi’s overall average impact on community efforts was a positive change of 0.1 standard deviation, most of which was due to the impact on community efforts related to health, with a standardized average positive impact of 0.19 standard deviations (both statistically signifi cant at the 1 percent level). No average impact was observed on community efforts related to education.
5.4.2 Regional BreakdownWe found some regional differences on community efforts as a result of the Generasi program. Village health post cadres’ efforts on outreach seem to have increased only in Sulawesi, while they remained the same in Java and decreased in NTT, which we predominantly observe in treatment B areas.
Improvements in community efforts in monitoring schools through school committees were only observed in Java, where the number of primary school committee members increased by about one member per school in treatment A areas. In NTT and in Sulawesi although the numbers of school committee members may have not changes, a small increase in the number of meetings were observed: an average number of junior secondary school committee meetings in the previous school year increased by 1.3 times in Generasi areas in Sulawesi, and 1.5 times in treatment B areas in NTT (signifi cant at 5 percent and 10 percent levels, respectively).

Indonesia’s PNPM Generasi Program: Interim Impact Evaluation Report 53
How and Why did the Generasi Project Work?
Household members’ participation in other community activities increased only in Java and in treatment B areas in NTT, but not in Sulawesi. The baseline mean (column 1) and control mean (column 2) suggest the community members in NTT already spent considerably more time on semi-voluntary public labor activities than in the other two regions.
Overall, Generasi had positive impacts on community efforts in all three regions, with all three regions indicating positive standardized average impacts on health activities but no impact on community efforts associated with education.
5.5 Quantities from Provider DataThis section explores the changes in quantities and prices from the provider data. First, the quantities of services reported by services providers (midwives, health centers, village health post, and primary and junior secondary schools) are discussed. This is followed by the analysis of the impact on fees charged for maternal health services by health facilities, midwives, and cost of education. By analyzing prices and quantities together, we can begin to understand the incidence of Generasi benefi ts, as well as the degree to which Generasi shifted demand curves, supply curves, or both.
5.5.1 All ProvincesThe results for all provinces are shown in Table 55. The table shows quantities and fees for a variety of services provided by midwives (childbirths at private and government practice, ante-natal care, post-natal care, family planning), childbirth at Puskesmas, school enrollment and school fees, and village health post services and fees.
Several results are worth noting. First, the results show a dramatic increase in all maternal and child health services offered at village health posts: the quantity of children weighed increased by 8.3 (20 percent increase); the quantity of children receiving nutritional supplements increased by 13.9 (40 percent increase); the quantity of children immunized increased by 3.1 (27 percent increase); the quantity of pregnant mothers receiving ante-natal care increased by 1.9 (42 percent increase); the quantity of pregnant mothers receiving iron pills increased by 2.3 (48 percent increase); and the quantity of children receiving Vitamin A increased by 8.8 (20 percent increase). These substantial increases do not appear to be due to record keeping—family planning services at village health post, for example, remained unchanged. The results were similar in treatments A and B. These results suggest that a major contribution of Generasi was a revitalization of the village health post system, bringing more mothers and children into the health care net. The fact that so many more mothers and children were being brought into the modern health care net may be a major reason why the Generasi program succeeded in reducing infant mortality—with such regular contact with health professionals, many at-risk children might have been saved.
Second, the data from midwives suggest that there were increases in fees charged for delivery services, even though the total number of services delivered did not change substantially. Fees charged by midwives increased by Rp. 15,500 in private practice (4.6 percent), and fees charged for government delivery
54 Indonesia’s PNPM Generasi Program: Interim Impact Evaluation Report
How and Why did the Generasi Project Work?
increased by Rp. 22,000 (12.9 percent). This suggests that Generasi led to an outward shift in the demand for childbirths, and that the incidence of this shift in demand took the form of higher payments received by midwives.
Third, the data show that Generasi led to lower junior secondary school enrollments in the 2007–08 school year. Enrollments from school-based data were 15 students lower (5 percent), which is consistent with the fi ndings shown in the household survey.
The average standardized effects confi rm that there were increases in health quantities—an increase of 0.11 standard deviations. These were driven largely by the increases at village health posts, which increased by 0.27 standard deviations. The average standardized effects for fees were not statistically signifi cant.
5.5.2 Regional BreakdownThere is relatively little regional heterogeneity in the effects in this section. The price impacts for childbirth are virtually identical for the three provinces considered, with the exception that in Sulawesi the fee increase is disproportionately for private deliveries. The quantity increases at village health posts are felt everywhere, though they are weaker in NTT than in the other provinces. The junior secondary school enrollment declines are equally seen in NTT and Java, but do not appear in Sulawesi. Sulawesi is the only province to show reductions in fees paid by mothers for births at the health center, with commensurate increases in the quantity that take place at the health center (thus evidence of a supply increase).

Indonesia’s PNPM Generasi Program: Interim Impact Evaluation Report 55
Discussion
This interim report describes the impact these Generasi subdistricts had against the project’s target indicators after 15–18 months of project implementation. At the time this follow-up survey was conducted in late 2008, all 129 Generasi subdistricts had successfully completed the fi rst project cycle.
The interim survey showed that the program improved health. The eight main health indicators showed improvements, but the most striking impact was on fi nal health outcome indicators, particularly the very large reductions in neonatal and infant mortality.
We found stark regional differences that correspond with different local conditions. Sulawesi demonstrated the largest overall average improvements in the eight main health indicators as well as health outcome indicators, with infant mortality declining by as much as 71 percent. In NTT, there was only improvement in one of the twelve main indicators—malnourishment—and only in treatment A locations. However, NTT had the largest reduction in neonatal mortality (an estimated 65 percent reduction) and the largest reduction in malnutrition (an estimated 18 percent reduction, although limited to treatment A areas). The focus on reducing malnutrition in NTT is consistent with the fact that NTT had the largest malnutrition problem to start with, and suggests that communities may have adjusted the focus of the program to match local needs. In contrast, Java was able to demonstrate small improvements in the average of the eight health indicators, although no drastic improvements in health outcome indicators were observed as in the other two regions. With relatively high levels of service coverage and low levels of mortality and malnutrition observed at the baseline, communities in Java had a harder time improving their indicators. But even within Java, Generasi substantially improved health indicators in those communities with low pre-period levels of service provision. Thus, the project is seeing some of the strongest health effects in those areas with the lowest pre-period levels of service. Also, in the next survey round, the project will explore further the extent to which communities respond in a more targeted way to specifi c issues and gaps.
The large improvements in neonatal mortality and infant mortality observed in Generasi project areas are comparable to those achieved by other community-based programs (Bjorkman and Svensson 2009). All health services promoted by Generasi are services included in Indonesia’s Ministry of Health protocols for maternal, neonatal, and child health, and are services regularly provided throughout the country. Therefore, Generasi suggests that large improvements in health outcomes are possible through community
06

56 Indonesia’s PNPM Generasi Program: Interim Impact Evaluation Report
Discussion
mobilization toward improved coverage of regular health programs. Although biological causality of how Generasi’s project inputs lead to improvements in child health cannot be proved through this study, the study demonstrates that increasing community mobilization toward targeted results does lead to improved child health. As seen in this study, Generasi has been most effective in increasing service delivery at village health posts. These are village-level (or often hamlet-level) monthly health posts managed by volunteers, the village health post cadres. All maternal and child health services targeted by Generasi other than delivery and antenatal care (depending on whether privacy can be ensured at the village health post) are provided at the village health post, usually a midwife. Generasi increased community collective efforts in the provision of services through increasing the number of village health post cadres and increasing participation in health education. Generasi also changed health provider behaviors, increasing their time spent on public services and on the provision of outreach services in particular, which most likely resulted in a pro-poor shift in their service provision. So far, Generasi’s effects are limited to service provision at the village-level and behaviors of individual service providers assigned to village-level service delivery. No impact has been found yet on services provided beyond the village level, such as services provided at subdistrict health facilities.
The differences in the degree of success in mobilizing communities and providers may provide some clues to understand the reasons behind the differences in the fi ndings in the three regions. Generasi in Sulawesi has been considerably more effective in mobilizing community efforts than in NTT. In addition, health providers in Sulawesi responded positively, increasing their work hours and providing more outreach services. In contrast, the impacts on health providers in NTT were very small and mostly negative. Interestingly, in NTT only child health services—such as growth monitoring and vitamin A— increased through village health posts, while none of the maternal health service provision increased through village health posts, even though in other regions service provision of both maternal health services and child health services increased. Other social and cultural factors affecting the use of maternal health services in NTT may be at play, such as the practice of seclusion of the mother and her infant child during the fi rst 40 days after birth (Se’i) found in North Central Timor (TTU) district in NTT (Rahayu, Toyamah, Hutagalung, Rosfadhila, and Syukri 2008).
In contrast, the fi rst 15 to 18 months of Generasi led to no improvements in education, and in fact the program shows negative impacts on enrollment and attendance of 13–15 year olds who would have otherwise been completing primary school. Consistent with lower enrollment in this cohort, there were also signs of increased child labor, particularly in NTT and Sulawesi. There may be several reasons for this. First, it is noteworthy that junior secondary gross enrollment increased overall in both treatment and control areas. In control areas, junior secondary gross enrollment increased from 83 percent at baseline to 91 percent in the interim survey just 18 months later. School participation for 13–15 year olds actually increased in Generasi areas, from 83 percent at baseline to 87 percent in the interim survey; it just increased at a slower rate than in the control areas. The period between 2007 and 2009 has seen major increases in overall government expenditures for education. Over the past few years, the government has signifi cantly increased overall public spending on education, from 17.2 percent of total national budget in 2007 (World Bank 2007) to an estimated 20 percent in 2009. 18 At both the national and district levels, the government was spending much more on free schooling and school-based management, thus
18 The Constitutional Court obliges the government to meet the “20 percent rule,” whereby at least 20 percent of the national budget (both central and subnational) allocation is expected to be allocated for education.

Indonesia’s PNPM Generasi Program: Interim Impact Evaluation Report 57
Discussion
it was a period of great fl ux. Given the secular improvements in enrollment that were taking place during this period, many Generasi communities may have thought they were having an impact on enrollments, not realizing that enrollments also were increasing in communities without Generasi. Second, there may be issues regarding the Generasi’s targeting only 13–15 year olds and not other age groups. The specifi c Generasi target indicator called for improvements in junior secondary school enrollment of children 13 to 15 years old. Field reports indicate that communities and facilitators may have interpreted this age conditionality strictly while allocating funds. Third, the program missed the registration period for the school year and Generasi funds were available for communities to fund activities only halfway through the school year, making new enrollments for the ongoing school year extremely diffi cult. Lastly, in the fi rst year of implementation, fi eld and supervision reports were fi nding that communities were favoring more assistance toward children already in school, rather than focusing on out-of-school children. It is not just the lack of positive impact on the four target indicators observed for education, but Generasi did not have effects on community mobilization for education or change teacher behaviors. According to the Generasi project’s management systems information data, communities on average spent 56 percent of their block grant allocation for activities related to education, demonstrating that it is not that communities placed lower priority to education than health. Unlike for the health sector, at least in the fi rst 15–18 months, Generasi was unable to increase community participation in school committees. Nor did the project have any impact on teacher behavior, at least in terms of their presence and involvement in pedagogical activities at the time of the impact evaluation survey teams’ visits. Since community mobilization seems to have been critical to improving health, the lack of community mobilization in education might help explain the stark differences in the fi ndings.
This study provides strong evidence that with clear and measurable target indicators, community incentives work and communities with incentives consistently outperform those without community incentives. Overall, community incentives had the following effects: they made Generasi more effective for the poor, and increased provider efforts. Surprisingly, community incentives did not have effects on the level of community efforts. Throughout the evaluation, we found consistently that the incentives improved performance, and little evidence that they made performance worse.


Indonesia’s PNPM Generasi Program: Interim Impact Evaluation Report 59
Policy Implications and Conclusion
It would be premature to draw any defi nitive conclusions from a new pilot program that has only been in operation for 15 to 18 months. This interim evaluation provides some initial insights into the program’s direction thus far, but much more will be revealed during the follow-up impact survey round scheduled for 2009–10. Additional cost comparisons and cost-benefi t analyses will also be conducted next year. However, some preliminary refl ections are warranted at this juncture.
Generasi piggybacked on KDP/PNPM-Rural, a community-driven development program that was already in place in Indonesia since 1998. When the government of Indonesia decided in 2007 to move from an unconditional cash transfer scheme to a conditional transfer scheme, they opted to try two different approaches, one the traditional individual household approach as proven successful in many countries of Latin America, and the other, an incentivized community block grant program, taking into consideration the success and architecture already in place under KDP. Unlike in Mexico and other countries, it was not clear that Indonesia had the administrative capacity and supply-side services to make an individual CCT program work in certain areas of the country. Thus, Generasi provides one unique example of how an established government program can be adapted to address certain education and health targets using a community approach. Building upon an already existing national program, which covered most of the poorest areas of the country, also facilitated a much faster start-up of the pilot. Building the evaluation into the design of the program from the outset has been critical to learn lessons from the program for possible expansion in the future. To allow for a rigorous, randomized evaluation of Generasi, the government incorporated random assignment into the selection of the locations. Each location was further randomly allocated to an incentivized versus non-incentivized treatment allowing for comparison of effects. As this is a pilot program, it was important that the evaluation prove robust and provide empirical evidence as to whether the intervention was having its desired impact. Discussions from the earliest stages included evaluation in the design.
Preliminary results from the interim evaluation point to signifi cant impacts in health. The main eight health indicators showed some improvements, but the most marked impact is on fi nal health outcome indicators, particularly the very large reductions in neonatal and infant mortality. The evidence from this
07

60 Indonesia’s PNPM Generasi Program: Interim Impact Evaluation Report
Policy Implications and Conclusion
interim survey points to community mobilization as potentially a signifi cant factor in explaining these dramatic improvements. These activities include increasing the number of village health post cadres and enhancing participation in health education, along with shifts in health provider behaviors. Further studies and rigorous evaluations are needed to assess how Generasi compares with other child and maternal health interventions in attaining these targets.
For education, the lack of overall impact raises questions regarding Generasi’s investments in this area. Several hypotheses were proposed earlier in the paper to explain the dynamics. In light of the fact that enrollment in primary education has already reached 95 percent nationally and Indonesia is experiencing signifi cant gains on the junior secondary enrollment front (7 to 8 percent increases in both treatment and control areas), there is a risk that Generasi will be “crowded out” by other larger education expenditures. In fact, fi eld supervision and monitoring reports were already questioning the effi cacy of the targets at the primary school level. The program is currently considering the possibility of revising education indicators in Year 3 to focus more upon quality and student achievement rather than the enrollment and attendance targets as originally designed.
Community incentives have proven to be more effective for focusing impacts on the poorest quintiles and increasing providers’ efforts. This fi nding was surprising given fi eld reports that there was a wide range of understanding by facilitators and villagers about the scoring and incentives system during the fi rst year. The policy implications are that poverty programs may wish to experiment more with embedding incentives into the designs. However, these fi ndings will need to be monitored and evaluated over time. One possibility is that the conditionalities may work less well over time, as there may be more “gaming” of the system as the program progresses and the rules become more familiar. Alternatively, the program may work better over time as it continues to incentivize communities to work harder toward the specifi ed targets.
The next round of evaluation in 2009–10—using both quantitative and qualitative methods—should reveal much more about the effi cacy and effectiveness of Generasi. These interim fi ndings provide some preliminary insight into the direction this program is heading.

Indonesia’s PNPM Generasi Program: Interim Impact Evaluation Report 61
References
Bjorkman, A., and P. Svensson. 2009. “Power to the People: Evidence from a Randomized Experiment of a Community Based Monitoring Project in Uganda.” Quarterly Journal of Economics 124(2): 735-769.
Dufl o, E., R. Glennerster, and M. Kremer. 2007. “Using Randomization in Development Economics Research: A Toolkit.” In T. P. Schultz and J. Strauss, eds. Handbook of Development Economics. North Holland: Elsevier Science Ltd. Vol. 4: 3895-62.
Gertler, P. 2004. “Do Conditional Cash Transfers Improve Child Health? Evidence from PROGRESA’s Control Randomized Experiment.” American Economic Review (Papers Proceedings) 94 (2): 336–341.Paul Do Conditional Cash Transfers Improve Child Health? Evidence from PRO Review (Papers and) 94(2): Gibbons, R., and K. J. Murphy. 1990. “Relative performance evaluation for chief executive offi cers.” Industrial and Labor Relations Review 43 (Special Issue): 30–51.
Gordis, L. 2004. Epidemiology. Philadelphia: W. B. Saunders Company.
Imbens, G., and J. Angrist. 1994. “Identifi cation and Estimation of Local Average Treatment Effects.” Econometrica 61 (2): 467–476.
Kling, J.R., J.B.Liebman, and L.F. Katz. 2007. “Experimental Analysis of Neighborhood Effects.” Econometrica 75 (1): 83–119.
Lagarde, M., A. Haines, and N. Palmer. 2007. “Conditional Cash Transfers for Improving Uptake of Health Interventions in Low- and Middle-Income Countries: A Systematic Review.” Journal of the American Medical Association 298(16):1900–1910.
Lazear, E.P., and S. Rosen. 1981. “Rank-order tournaments as optimum labor contracts.” Journal of Political Economy 89: 841–864.
Levy, S. 2006. Progress Against Poverty: Sustaining Mexico’s Progresa-Oportunidades Program. Washington, DC: Brookings Institution Press.

62 Indonesia’s PNPM Generasi Program: Interim Impact Evaluation Report
References
Miguel, E., and M. Kremer. 2004. “Worms: Identifying Impacts on Education and Health in the Presence of Treatment Externalities.” Econometrica 72: 159–217.
Ministry of Home Affairs, Government of Indonesia. 2007. Petunjuk Teknis Operasional PNPM Generasi Sehat dan Cerdas (Versi A). Jakarta, Indonesia.
Mookherjee, D. 1984. “Optimal Incentive Schemes with Many Agents.” Review of Economic Studies 51: 433–446.
Newhouse J.P., et al. 1993. Free For All? Lessons from the Rand Health Insurance Experiment. Cambridge, MA: Harvard University Press.
Olken, B. A. 2007. “Monitoring Corruption: Evidence from a Field Experiment in Indonesia.” Quarterly Journal of Economics, 115 (2): 200–249.
Rahayu, S., N. Toyamah, S. Hutagalung, M. Rosfadhila, and M. Syukri. 2008. “Qualitative Baseline Study for PNPM Generasi and PKH: The Availability and Use of Maternal and Child Health Services and Basic Education Services in the Provinces of West Java and East Nusa Tenggara.” Jakarta, Indonesia: SMERU Research Institute.
Rawlings, L., and G. Rubio. 2005. “Evaluating the Impact of Conditional Cash Transfer programs.” The World Bank Research Observer 20(1): 29–55.
Schubert, B., and R. Slater. 2006. “Social Cash Transfers in Low-Income African Countries: Conditional or Unconditional?” Development Policy Review 24(5): 571–578
Schultz, T. P. 2004. “School Subsidies for the Poor: Evaluating the Mexican Progresa Poverty Program.” Journal of Development Economics 74 (1): 199–250.
Skoufi as, E. 2005. “PROGRESA and Its Impacts on the Welfare of Rural Households in Mexico.” IFPRI Research Report No. 139. Washington, DC: International Food Policy Research Institute.
Sparrow, R., J. Moeis, A. Damayanti, Y. Herawati. 2008. “Conditional Cash Transfers in Indonesia: Baseline Survey Report for Program Keluarga Harapan and PNPM Generasi.” Jakarta Indonesia.
Weitzman, M.L. 1980. “The ‘Ratchet Principle’ and Performance Incentives.” Bell Journal of Economics (The RAND Corporation) 11(1): 302–308.
World Bank. 2006. Making the New Indonesia Work for the Poor. Jakarta, Indonesia and Washington, DC: World Bank.
___________. 2008. Investing in Indonesia’s Health: Challenges and Opportunities for Future Public Spending. Jakarta, Indonesia, and Washington, DC: World Bank.

Indonesia’s PNPM Generasi Program: Interim Impact Evaluation Report 63
Annex
Annex I: Randomization and Implementation of Generasi in 2007
The primary reason that some (not all) 200 subdistricts received Generasi was that the 2007 supplemental budget allocation for Generasi was cut by the national parliament, so that in 2007, funding was only available for 129 Generasi subdistricts.19 In choosing which 129 of the 200 randomly selected subdistricts should be funded, the Ministry of Home Affairs prioritized those locations that had already participated in the PNPM program, since those locations already had the legal infrastructure for distributing PNPM program funds and it was easier to re-budget other monies to fund Generasi in those areas.
The fi nal allocation of Generasi is shown in Table 3. The 300 Generasi sample subdistricts are subdivided into two groups: the 170 subdistricts that had received the PNPM program in previous years (denoted group P, the prioritized group), and the 130 subdistricts that had not previously received the PNPM program in previous years (denoted group NP, the non-prioritized group).20 In Group P, Generasi was funded according to the randomization results in a total of 106 subdistricts in 2007, or 92 percent of the Group P subdistricts that had been chosen according to the randomization.21 The 2008 allocation for Group P was similar.22 In Group NP, Generasi was funded in 23 subdistricts, or 27 percent of the Group
19 Funding for 108 subdistricts came from World Bank loans; funding for the remaining 21 subdistricts came from a grant from the Dutch government. Both funding sources were channeled through the government budget, and were implemented identically in the fi eld.
20 The randomization results are statistically unrelated to whether a subdistrict is in Group P or Group NP. Specifi cally, the p-value from a Fisher exact test of the two-way relationship between the three randomization categories (incentivized, non-incentivized, control) and a group P dummy is 0.739.
21 Four categories of subdistricts were deemed ineligible for Generasi in 2007: (1) they had been identifi ed as “problematic” PNPM subdistricts, i.e., there were allegations of improper use of PNPM funds; (2) they had been identifi ed as eligible for the urban version of PNPM; (3) they had been identifi ed as eligible for the SPADA (confl ict areas) version of PNPM; or (4) they were the one subdistrict where a three-village Generasi pilot was being run from 2006 to 2008. Which subdistricts fell into which categories were determined based on information obtained prior to the date of the randomization, and is available for all subdistricts regardless of the results of the randomization.
22 The only difference between 2007 and 2008 in Group P is that two Group P subdistricts funded in 2007 were identifi ed as “problematic” and were dropped from 2008, and one subdistrict that had previously been identifi ed as “problematic” resolved its fi nancial problems and was allowed to resume.

64 Indonesia’s PNPM Generasi Program: Interim Impact Evaluation Report
Annex
NP subdistricts that had been chosen according to the randomization. Of these 23 subdistricts, 21 were chosen randomly by computer, stratifi ed by province, in a second lottery among Group NP locations; the remaining 2 subdistricts were chosen by the ministry. In 2008, additional funding became available, and a total of 71 (84 percent) of the 85 Group NP subdistricts randomly selected for Generasi received the program.
Table 3. Generasi implementation and randomization results Randomization results
IncentivizedGenerasi
Non-incentivized Generasi
Control Total
P NP P NP P NPTotal subdistricts 60 40 55 45 55 45 300Received Generasi in: 2007 57 11 49 12 0 0 129 2008 55 35 50 36 0 0 176
Since the share of subdistricts randomly selected to Generasi that were subsequently funded is much higher in Group P, and since Group P/NP status is predetermined with respect to the randomization (it depends only on whether a subdistrict had received the PNPM program in previous years), we can improve the statistical power beyond intent-to-treat estimates by incorporating this information into the analysis.

Indonesia’s PNPM Generasi Program: Interim Impact Evaluation Report 65
Annex
Tab
le 4
. Bas
elin
e re
gres
sion
s, 1
2 m
ain
indi
cato
rs *
Mod
el 1
Mod
el 2
Indi
cato
rC
ontr
ol m
ean
Tota
lG
ener
asi Y
ear
1 E
ffec
tV
ersi
A a
ddit
iona
l ef
fect
Tota
lV
ersi
B im
pact
Tota
lV
ersi
A im
pact
Num
ber
obse
rvat
ions
(1)
(2)
(3)
(4)
(5)
(6)
Num
ber
pren
atal
vis
its
7.80
8-0
.255
-0.1
98-0
.159
-0.3
5637
08(0
.130
)(0
.229
)(0
.257
)(0
.262
)(0
.262
)D
eliv
ery
by tr
aine
d m
idw
ife0.
691
-0.0
200.
003
-0.0
22-0
.018
2810
(0.0
16)
(0.0
25)
(0.0
31)
(0.0
30)
(0.0
29)
Num
ber
of p
ostn
atal
vis
its
3.01
20.
073
-0.1
890.
166
-0.0
2328
10(0
.111
)(0
.176
)(0
.198
)(0
.209
)(0
.195
)Ir
on ta
blet
sac
hets
1.59
1-0
.048
-0.0
51-0
.023
-0.0
7436
76(0
.038
)(0
.064
)(0
.072
)(0
.076
)(0
.070
)Pe
rcen
t of i
mm
uniz
atio
n0.
680
-0.0
378*
*-0
.002
-0.0
369*
-0.0
387*
3316
(0.0
11)
(0.0
19)
(0.0
23)
(0.0
22)
(0.0
21)
Num
ber
of w
eigh
t che
cks
2.14
0-0
.066
-0.0
46-0
.042
-0.0
8940
45(0
.033
)(0
.056
)(0
.064
)(0
.068
)(0
.060
)N
umbe
r V
itam
in A
sup
plem
ents
1.52
10.
028
0.13
03**
-0.0
360.
094
2284
(0.0
44)
(0.0
53)
(0.0
65)
(0.0
62)
(0.0
61)
Perc
ent m
alno
uris
hed
0.17
30.
015
0.01
50.
007
0.02
239
77(0
.011
)(0
.013
)(0
.016
)(0
.015
)(0
.016
)SD
age
gro
ss e
nrol
lmen
t0.
950
0.00
00.
012
-0.0
060.
006
5137
(0.0
05)
(0.0
07)
(0.0
08)
(0.0
08)
(0.0
09)
SMP
age
gros
s en
rollm
ent
0.82
50.
009
0.01
70.
001
0.01
717
54(0
.016
)(0
.023
)(0
.027
)(0
.027
)(0
.027
)SD
age
gro
ss a
tten
danc
e0.
910
-0.0
160.
022
-0.0
280*
*-0
.006
4397
(0.0
07)
(0.0
12)
(0.0
16)
(0.0
14)
(0.0
14)
SMP
age
gros
s at
tend
ance
0.75
20.
020
0.03
20.
004
0.03
715
11(0
.019
)(0
.027
)(0
.033
)(0
.032
)(0
.031
)
Ave
rage
sta
ndar
dize
d ef
fect
-0.0
230.
013
-0.0
30-0
.016
(0.0
20)
(0.0
23)
(0.0
24)
(0.0
23)
Ave
rage
sta
ndar
dize
d ef
fect
hea
lth-0
.036
-0.0
13-0
.030
-0.0
426*
(0.0
23)
(0.0
26)
(0.0
28)
(0.0
24)
Ave
rage
sta
ndar
dize
d ef
fect
edu
cati
on0.
004
0.06
5-0
.029
0.03
6(0
.042
)(0
.048
)(0
.049
)(0
.047
)
*Not
e th
at th
ese
are
in th
e ba
selin
e, s
o w
e pr
edic
t no
effe
ct.

66 Indonesia’s PNPM Generasi Program: Interim Impact Evaluation Report
Annex
Tab
le 5
. Bas
elin
e re
gres
sion
s, lo
ng-t
erm
fi na
l out
com
es
Mod
el 1
Mod
el 2
Indi
cato
rC
ontr
ol m
ean
Tota
lG
ener
asi Y
ear
1 E
ffec
tV
ersi
A a
ddit
iona
l ef
fect
Tota
lV
ersi
B im
pact
Tota
lV
ersi
A im
pact
Num
ber
obse
rvat
ions
(1)
(2)
(3)
(4)
(5)
(6)
Mor
talit
y 0-
28 d
ays
0.01
4-0
.003
-0.0
080.
001
-0.0
0728
47(b
irth
s in
pas
t 18
mon
ths)
(0.0
04)
(0.0
05)
(0.0
06)
(0.0
05)
(0.0
06)
Mor
talit
y 0-
11 m
onth
s0.
024
-0.0
088*
-0.0
10-0
.004
-0.0
137*
*35
08(o
f bir
ths
in p
ast 2
4 m
onth
s)(0
.005
)(0
.005
)(0
.006
)(0
.006
)(0
.006
)D
iarr
hea
or A
RI
0.34
8-0
.013
-0.0
250.
000
-0.0
2540
83(0
.013
)(0
.017
)(0
.022
)(0
.021
)(0
.019
)M
alno
uris
hed
0.17
30.
015
0.01
50.
007
0.02
239
77(<
-2
SD d
evia
tion
s)(0
.011
)(0
.013
)(0
.016
)(0
.015
)(0
.016
)Se
vere
mal
nour
ishe
d0.
046
0.00
9-0
.009
0.01
40.
004
3977
(< -
3 SD
dev
iati
ons)
(0.0
06)
(0.0
09)
(0.0
10)
(0.0
11)
(0.0
10)
Ave
rage
sta
ndar
dize
d ef
fect
hea
lth0.
007
0.03
9-0
.012
0.02
7(0
.021
)(0
.027
)(0
.026
)(0
.025
)A
vera
ge s
tand
ardi
zed
effe
ct h
ealth
-0.0
180.
019
-0.0
27-0
.005
excl
udin
g m
orta
lity
(0.0
27)
(0.0
33)
(0.0
33)
(0.0
19)
Not
e: a
vera
ge s
tand
ardi
zed
effe
ct r
ows
are
alw
ays
defi n
ed s
o th
at p
osit
ive
is a
n im
prov
emen
t (i.e
., lo
wer
mor
talit
y, lo
wer
mal
nour
ishm
ent)

Indonesia’s PNPM Generasi Program: Interim Impact Evaluation Report 67
Annex
Tab
le 6
. Res
ults
for
mai
n in
dica
tors
, all
prov
ince
s (b
asel
ine
as c
ontr
ol v
aria
ble)
M
odel
1M
odel
2
Indi
cato
rB
asel
ine
mea
nC
ontr
ol m
ean
Tota
l Gen
eras
i Ye
ar 1
Eff
ect
Ver
si A
ad
diti
onal
eff
ect
Tota
l Ver
si B
im
pact
Tota
l Ver
si A
im
pact
Num
ber
obse
rvat
ions
(1)
(2)
(3)
(4)
(5)
(6)
(7)
Mai
n 12
indi
cato
rsN
umbe
r pr
enat
al v
isit
s7.
647
7.51
0-0
.006
0.60
80**
*-0
.311
0.29
738
37(0
.072
)(0
.141
)(0
.189
)(0
.224
)(0
.201
)(0
.236
)D
eliv
ery
by tr
aine
d m
idw
ife0.
670
0.75
50.
035
-0.0
040.
037
0.03
327
61(0
.009
)(0
.017
)(0
.023
)(0
.025
)(0
.026
)(0
.026
)N
umbe
r of
pos
tnat
al v
isit
s3.
036
2.83
1-0
.047
0.38
07*
-0.2
480.
133
2761
(0.0
64)
(0.1
29)
(0.1
48)
(0.2
14)
(0.1
70)
(0.1
93)
Iron
tabl
et s
ache
ts1.
588
1.97
70.
091
0.08
00.
051
0.13
137
88(0
.021
)(0
.049
)(0
.071
)(0
.081
)(0
.080
)(0
.084
)Pe
rcen
t of i
mm
uniz
atio
n0.
653
0.69
30.
016
0.01
70.
008
0.02
435
21(0
.006
)(0
.013
)(0
.015
)(0
.018
)(0
.017
)(0
.018
)N
umbe
r of
wei
ght c
heck
s2.
126
2.19
20.
1109
***
0.09
92*
0.06
20.
1607
***
4804
(0.0
19)
(0.0
40)
(0.0
43)
(0.0
53)
(0.0
49)
(0.0
52)
Num
ber
Vit
amin
A s
uppl
emen
ts1.
529
1.56
0-0
.002
-0.0
120.
004
-0.0
0827
58(0
.024
)(0
.044
)(0
.044
)(0
.058
)(0
.053
)(0
.052
)Pe
rcen
t mal
nour
ishe
d0.
168
0.19
9-0
.004
-0.0
260.
009
-0.0
1647
49(0
.006
)(0
.014
)(0
.013
)(0
.016
)(0
.015
)(0
.016
)A
ge 7
–12
gros
s en
rollm
ent
0.94
80.
982
0.00
2-0
.004
0.00
30.
000
4962
(0.0
03)
(0.0
05)
(0.0
05)
(0.0
06)
(0.0
06)
(0.0
05)
Age
13–
15 g
ross
enr
ollm
ent
0.82
20.
906
-0.0
408*
*0.
015
-0.0
479*
*-0
.033
3*18
56(0
.009
)(0
.019
)(0
.018
)(0
.024
)(0
.022
)(0
.020
)A
ge 7
–12
gros
s at
tend
ance
0.90
40.
956
0.00
10.
000
0.00
10.
001
4952
(0.0
04)
(0.0
06)
(0.0
05)
(0.0
06)
(0.0
05)
(0.0
05)
Age
13–
15 g
ross
att
enda
nce
0.76
80.
884
-0.0
516*
**0.
023
-0.0
629*
**-0
.039
6*18
53A
dditi
onal
Edu
catio
n In
dica
tors
(0.0
11)
(0.0
19)
(0.0
18)
(0.0
25)
(0.0
23)
(0.0
21)
Age
13–
15 c
ondi
tion
al a
tten
danc
e0.
958
0.97
6-0
.012
2**
0.00
5-0
.014
9**
-0.0
1016
24(0
.005
)(0
.007
)(0
.005
)(0
.007
)(0
.006
)(0
.006
)A
ge 1
3–15
enr
olle
d in
SM
P0.
593
0.67
2-0
.013
0.04
0-0
.033
0.00
718
56(0
.012
)(0
.030
)(0
.027
)(0
.031
)(0
.034
)(0
.029
)A
ge 7
–12
enro
lled
in S
D0.
886
0.90
50.
001
-0.0
040.
003
-0.0
0149
62

68 Indonesia’s PNPM Generasi Program: Interim Impact Evaluation Report
Annex
M
odel
1M
odel
2
Indi
cato
rB
asel
ine
mea
nC
ontr
ol m
ean
Tota
l Gen
eras
i Ye
ar 1
Eff
ect
Ver
si A
ad
diti
onal
eff
ect
Tota
l Ver
si B
im
pact
Tota
l Ver
si A
im
pact
Num
ber
obse
rvat
ions
(1)
(2)
(3)
(4)
(5)
(6)
(7)
(0.0
04)
(0.0
11)
(0.0
08)
(0.0
10)
(0.0
10)
(0.0
10)
Age
13–
15 e
nrol
led
othe
r th
an S
MP
0.22
90.
234
-0.0
29-0
.026
-0.0
16-0
.043
1856
(0.0
10)
(0.0
27)
(0.0
25)
(0.0
29)
(0.0
29)
(0.0
30)
Kec
amat
an S
D g
ross
enr
ollm
ent
0.93
40.
943
-0.0
06-0
.012
0.00
0-0
.012
263
(0.0
07)
(0.0
17)
(0.0
14)
(0.0
16)
(0.0
16)
(0.0
17)
Kec
amat
an S
MP
gros
s en
rollm
ent
0.86
10.
997
-0.0
640.
072
-0.0
994*
-0.0
2826
2(0
.029
)(0
.077
)(0
.055
)(0
.062
)(0
.059
)(0
.067
)
Ave
rage
sta
ndar
dize
d ef
fect
-0.0
020.
0493
**-0
.027
0.02
3
(0.0
18)
(0.0
22)
(0.0
21)
(0.0
21)
Ave
rage
sta
ndar
dize
d ef
fect
hea
lth0.
0344
*0.
0614
***
0.00
30.
0646
***
(0.0
19)
(0.0
22)
(0.0
22)
(0.0
22)
Ave
rage
sta
ndar
dize
d ef
fect
edu
cati
on-0
.074
2**
0.02
5-0
.086
3**
-0.0
61(0
.035
)(0
.045
)(0
.044
)(0
.039
)

Indonesia’s PNPM Generasi Program: Interim Impact Evaluation Report 69
Annex
Tab
le 7
. Res
ults
for
mai
n in
dica
tors
, all
prov
ince
s (r
obus
tnes
s to
alt
erna
tive
spe
cifi c
atio
ns)
In
dica
tor
Bas
elin
e m
ean
Con
trol
m
ean
Mai
n sp
ecifi
cati
onB
asel
ine
cont
rols
fo
r al
l 12
indi
cato
rs
Bas
elin
e co
ntro
ls fo
r ke
cam
atan
ave
rage
s on
ly (
no in
divi
dual
pa
nel)
No
cont
rols
Firs
t di
ffer
ence
sK
ecam
atan
le
vel
regr
essi
on,
wit
h ba
selin
e co
ntro
l
Full
Inte
nt-t
o-tr
eat o
n 30
0 ke
cam
atan
, co
ntro
lling
for
keca
mat
an a
vg(1
)(2
)(3
)(4
)(5
)(6
)(7
)(8
)(9
)N
umbe
r pr
enat
al v
isit
s7.
647
7.51
0-0
.006
0.03
8-0
.007
-0.0
640.
158
0.02
6-0
.057
(0.0
72)
(0.1
41)
(0.1
89)
(0.1
92)
(0.1
90)
(0.2
03)
(0.2
47)
(0.2
07)
(0.1
66)
Del
iver
y by
trai
ned
mid
wife
0.67
00.
755
0.03
50.
0483
**0.
037
0.01
90.
0573
**0.
048*
*-0
.015
(0.0
09)
(0.0
17)
(0.0
23)
(0.0
21)
(0.0
23)
(0.0
24)
(0.0
28)
(0.0
24)
(0.0
20)
Num
ber
of p
ostn
atal
vis
its
3.03
62.
831
-0.0
47-0
.035
-0.0
40-0
.032
-0.1
55-0
.074
0.13
6(0
.064
)(0
.129
)(0
.148
)(0
.158
)(0
.148
)(0
.147
)(0
.224
)(0
.158
)(0
.137
)Ir
on ta
blet
sac
hets
1.58
81.
977
0.09
10.
113
0.09
20.
079
0.13
10.
090
0.10
2*(0
.021
)(0
.049
)(0
.071
)(0
.071
)(0
.071
)(0
.070
)(0
.089
)(0
.072
)(0
.056
)Pe
rcen
t of i
mm
uniz
atio
n0.
653
0.69
30.
016
0.01
60.
016
0.00
60.
0488
**0.
021
0.02
1(0
.006
)(0
.013
)(0
.015
)(0
.015
)(0
.015
)(0
.017
)(0
.021
)(0
.017
)(0
.013
)N
umbe
r of
wei
ght c
heck
s2.
126
2.19
20.
1109
***
0.11
27**
0.10
94**
0.08
99**
0.17
19**
*0.
111*
*0.
075*
(0.0
19)
(0.0
40)
(0.0
43)
(0.0
45)
(0.0
43)
(0.0
44)
(0.0
60)
(0.0
48)
(0.0
41)
Num
ber
Vit
amin
A s
uppl
emen
ts1.
529
1.56
0-0
.002
0.00
8-0
.001
0.01
5-0
.019
0.01
90.
012
(0.0
24)
(0.0
44)
(0.0
44)
(0.0
41)
(0.0
45)
(0.0
48)
(0.0
65)
(0.0
51)
(0.0
42)
Perc
ent m
alno
uris
hed
0.16
80.
199
-0.0
04-0
.006
-0.0
06-0
.004
-0.0
10-0
.005
0.00
0(0
.006
)(0
.014
)(0
.013
)(0
.013
)(0
.013
)(0
.013
)(0
.020
)(0
.014
)(0
.012
)SD
age
gro
ss e
nrol
lmen
t0.
948
0.98
20.
002
0.00
20.
002
0.00
20.
000
0.00
10.
000
(0.0
03)
(0.0
05)
(0.0
05)
(0.0
05)
(0.0
05)
(0.0
05)
(0.0
08)
(0.0
04)
(0.0
04)
SMP
age
gros
s en
rollm
ent
0.82
20.
906
-0.0
408*
*-0
.033
2*-0
.045
2**
-0.0
485*
*-0
.059
4**
-0.0
50**
*-0
.046
***
(0.0
09)
(0.0
19)
(0.0
18)
(0.0
18)
(0.0
19)
(0.0
19)
(0.0
27)
(0.0
19)
(0.0
14)
SD a
ge g
ross
att
enda
nce
0.90
40.
956
0.00
10.
002
0.00
20.
000
0.04
02**
0.00
1-0
.004
(0.0
04)
(0.0
06)
(0.0
05)
(0.0
05)
(0.0
05)
(0.0
05)
(0.0
17)
(0.0
05)
(0.0
04)
SMP
age
gros
s at
tend
ance
0.76
80.
884
-0.0
516*
**-0
.046
7**
-0.0
535*
**-0
.057
3***
-0.0
687*
*-0
.059
***
-0.0
48**
*(0
.011
)(0
.019
)(0
.018
)(0
.019
)(0
.019
)(0
.019
)(0
.033
)(0
.019
)(0
.015
)A
vera
ge s
tand
ardi
zed
effe
ct-0
.002
0.00
7-0
.002
-0.0
130.
024
(0.0
18)
(0.0
18)
(0.0
19)
(0.0
20)
(0.0
23)
Ave
rage
sta
ndar
dize
d ef
fect
hea
lth0.
0344
*0.
0448
**0.
0357
*0.
024
0.06
14**
*(0
.019
)(0
.020
)(0
.019
)(0
.022
)(0
.021
)A
vera
ge
stan
dard
ized
ef
fect
ed
ucat
ion
-0.0
742*
*-0
.067
7*-0
.077
7**
-0.0
861*
*-0
.051
(0.0
35)
(0.0
39)
(0.0
37)
(0.0
38)
(0.0
55)

70 Indonesia’s PNPM Generasi Program: Interim Impact Evaluation Report
Annex
Tab
le 8
. Res
ults
for
mai
n in
dica
tors
, Jav
a (b
asel
ine
as c
ontr
ol v
aria
ble)
M
odel
1M
odel
2
Indi
cato
rB
asel
ine
mea
nC
ontr
ol m
ean
Tota
l Gen
eras
i Ye
ar 1
Eff
ect
Ver
si A
ad
diti
onal
ef
fect
Tota
l Ver
si B
im
pact
Tota
l Ver
si A
im
pact
Num
ber
obse
rvat
ions
(1)
(2)
(3)
(4)
(5)
(6)
(7)
Mai
n 12
indi
cato
rsN
umbe
r pr
enat
al v
isit
s8.
080
7.98
20.
221
0.38
10.
025
0.40
625
34(0
.081
)(0
.171
)(0
.225
)(0
.250
)(0
.241
)(0
.269
)D
eliv
ery
by tr
aine
d m
idw
ife0.
764
0.84
30.
0504
**-0
.058
8**
0.08
21**
*0.
023
1787
(0.0
10)
(0.0
19)
(0.0
25)
(0.0
29)
(0.0
30)
(0.0
28)
Num
ber
of p
ostn
atal
vis
its
3.60
53.
587
-0.0
590.
275
-0.2
070.
068
1787
(0.0
81)
(0.1
72)
(0.2
07)
(0.3
08)
(0.2
41)
(0.2
72)
Iron
tabl
et s
ache
ts1.
639
2.07
10.
131
-0.0
570.
161
0.10
425
04(0
.025
)(0
.061
)(0
.100
)(0
.107
)(0
.110
)(0
.115
)Pe
rcen
t of i
mm
uniz
atio
n0.
701
0.73
6-0
.006
0.01
2-0
.012
-0.0
0122
80(0
.007
)(0
.014
)(0
.016
)(0
.023
)(0
.022
)(0
.018
)N
umbe
r of
wei
ght c
heck
s2.
213
2.37
70.
074
0.09
20.
027
0.11
89*
3062
(0.0
23)
(0.0
47)
(0.0
55)
(0.0
65)
(0.0
67)
(0.0
61)
Num
ber
Vit
amin
A s
uppl
emen
ts1.
488
1.44
40.
046
0.06
00.
014
0.07
418
09(0
.028
)(0
.053
)(0
.054
)(0
.071
)(0
.070
)(0
.059
)Pe
rcen
t mal
nour
ishe
d0.
126
0.11
80.
008
0.00
00.
008
0.00
730
27(0
.007
)(0
.015
)(0
.015
)(0
.018
)(0
.017
)(0
.018
)A
ge 7
–12
gros
s en
rollm
ent
0.95
90.
993
-0.0
01-0
.005
0.00
2-0
.003
2991
(0.0
04)
(0.0
04)
(0.0
04)
(0.0
06)
(0.0
05)
(0.0
05)
Age
13–
15 g
ross
enr
ollm
ent
0.83
30.
943
-0.0
24-0
.019
-0.0
14-0
.033
1173
(0.0
11)
(0.0
20)
(0.0
23)
(0.0
31)
(0.0
30)
(0.0
26)
Age
7–1
2 gr
oss
atte
ndan
ce0.
914
0.96
90.
001
-0.0
060.
004
-0.0
0229
83(0
.005
)(0
.006
)(0
.005
)(0
.006
)(0
.006
)(0
.006
)A
ge 1
3–15
gro
ss a
tten
danc
e0.
783
0.92
6-0
.032
-0.0
17-0
.023
-0.0
4011
70A
dditi
onal
Edu
catio
n In
dica
tors
(0.0
13)
(0.0
21)
(0.0
23)
(0.0
33)
(0.0
30)
(0.0
27)
Age
13–
15 c
ondi
tion
al a
tten
danc
e0.
960
0.98
2-0
.010
5*-0
.003
-0.0
09-0
.012
1037
(0.0
06)
(0.0
08)
(0.0
06)
(0.0
10)
(0.0
08)
(0.0
07)
Age
13–
15 e
nrol
led
in S
MP
0.66
60.
743
-0.0
13-0
.008
-0.0
09-0
.017
1173
(0.0
14)
(0.0
37)
(0.0
35)
(0.0
42)
(0.0
48)
(0.0
33)

Indonesia’s PNPM Generasi Program: Interim Impact Evaluation Report 71
Annex
M
odel
1M
odel
2
Indi
cato
rB
asel
ine
mea
nC
ontr
ol m
ean
Tota
l Gen
eras
i Ye
ar 1
Eff
ect
Ver
si A
ad
diti
onal
ef
fect
Tota
l Ver
si B
im
pact
Tota
l Ver
si A
im
pact
Num
ber
obse
rvat
ions
(1)
(2)
(3)
(4)
(5)
(6)
(7)
Age
7–1
2 en
rolle
d in
SD
0.88
20.
894
-0.0
05-0
.003
-0.0
04-0
.007
2991
(0.0
06)
(0.0
15)
(0.0
10)
(0.0
12)
(0.0
13)
(0.0
11)
Age
13–
15 e
nrol
led
othe
r th
an S
MP
0.16
70.
200
-0.0
13-0
.012
-0.0
07-0
.018
1173
(0.0
11)
(0.0
34)
(0.0
32)
(0.0
41)
(0.0
37)
(0.0
40)
Kec
amat
an S
D g
ross
enr
ollm
ent
0.91
30.
920
-0.0
02-0
.011
0.00
4-0
.008
178
(0.0
08)
(0.0
19)
(0.0
17)
(0.0
19)
(0.0
21)
(0.0
19)
Kec
amat
an S
MP
gros
s en
rollm
ent
0.98
21.
115
-0.0
69-0
.013
-0.0
62-0
.075
177
(0.0
35)
(0.1
07)
(0.0
70)
(0.0
81)
(0.0
74)
(0.0
87)
Ave
rage
sta
ndar
dize
d ef
fect
0.01
0-0
.007
0.01
30.
006
(0.0
24)
(0.0
32)
(0.0
30)
(0.0
27)
Ave
rage
sta
ndar
dize
d ef
fect
hea
lth0.
0421
*0.
021
0.03
10.
0523
*(0
.024
)(0
.027
)(0
.029
)(0
.027
)A
vera
ge s
tand
ardi
zed
effe
ct e
duca
tion
-0.0
56-0
.063
-0.0
23-0
.086
(0.0
52)
(0.0
71)
(0.0
66)
(0.0
60)

72 Indonesia’s PNPM Generasi Program: Interim Impact Evaluation Report
Annex
Tab
le 9
. Res
ults
for
mai
n in
dica
tors
, Eas
t N
usa
Teng
gara
(ba
selin
e as
con
trol
var
iabl
e)
Mod
el 1
Mod
el 2
Indi
cato
rB
asel
ine
mea
nC
ontr
ol m
ean
Tota
l Gen
eras
i Ye
ar 1
Eff
ect
Ver
si A
ad
diti
onal
ef
fect
Tota
l Ver
si B
im
pact
Tota
l Ver
si A
im
pact
Num
ber
obse
rvat
ions
(1)
(2)
(3)
(4)
(5)
(6)
(7)
Mai
n 12
indi
cato
rsN
umbe
r pr
enat
al v
isit
s6.
822
7.01
2-0
.770
8*0.
6762
*-1
.116
8**
-0.4
4181
0(0
.170
)(0
.323
)(0
.410
)(0
.389
)(0
.459
)(0
.452
)D
eliv
ery
by tr
aine
d m
idw
ife0.
427
0.65
9-0
.054
0.08
4-0
.100
-0.0
1660
0(0
.021
)(0
.042
)(0
.061
)(0
.059
)(0
.067
)(0
.069
)N
umbe
r of
pos
tnat
al v
isit
s1.
444
1.35
7-0
.074
0.62
71**
-0.3
880.
239
600
(0.0
92)
(0.1
96)
(0.2
51)
(0.3
00)
(0.2
52)
(0.3
46)
Iron
tabl
et s
ache
ts1.
589
1.97
60.
039
0.24
89*
-0.0
900.
159
798
(0.0
48)
(0.1
17)
(0.1
15)
(0.1
34)
(0.1
37)
(0.1
28)
Perc
ent o
f im
mun
izat
ion
0.54
90.
586
0.04
4-0
.009
0.04
90.
040
763
(0.0
15)
(0.0
33)
(0.0
30)
(0.0
36)
(0.0
29)
(0.0
40)
Num
ber
of w
eigh
t che
cks
2.23
72.
347
0.10
90.
068
0.07
70.
145
1091
(0.0
37)
(0.0
82)
(0.0
80)
(0.1
00)
(0.0
98)
(0.0
90)
Num
ber
Vit
amin
A s
uppl
emen
ts1.
586
1.73
6-0
.173
5*-0
.138
-0.1
03-0
.240
7**
571
(0.0
53)
(0.0
84)
(0.0
93)
(0.0
90)
(0.1
02)
(0.1
08)
Perc
ent m
alno
uris
hed
0.24
70.
353
-0.0
28-0
.070
8**
0.00
8-0
.062
3*10
77(0
.014
)(0
.035
)(0
.032
)(0
.031
)(0
.033
)(0
.035
)A
ge 7
–12
gros
s en
rollm
ent
0.92
90.
952
0.01
50.
004
0.01
30.
018
1291
(0.0
07)
(0.0
17)
(0.0
11)
(0.0
12)
(0.0
13)
(0.0
12)
Age
13–
15 g
ross
enr
ollm
ent
0.81
00.
893
-0.0
53-0
.019
-0.0
44-0
.063
410
(0.0
20)
(0.0
42)
(0.0
33)
(0.0
36)
(0.0
35)
(0.0
40)
Age
7–1
2 gr
oss
atte
ndan
ce0.
892
0.93
10.
0165
*0.
013
0.01
00.
0230
**12
90(0
.009
)(0
.018
)(0
.010
)(0
.011
)(0
.012
)(0
.011
)A
ge 1
3–15
gro
ss a
tten
danc
e0.
746
0.86
0-0
.061
8*-0
.012
-0.0
57-0
.068
3*41
0A
dditi
onal
Edu
catio
n In
dica
tors
(0.0
24)
(0.0
44)
(0.0
32)
(0.0
38)
(0.0
37)
(0.0
37)
Age
13–
15 c
ondi
tion
al a
tten
danc
e0.
949
0.96
3-0
.006
-0.0
01-0
.006
-0.0
0635
8(0
.013
)(0
.020
)(0
.011
)(0
.014
)(0
.010
)(0
.015
)A
ge 1
3–15
enr
olle
d in
SM
P0.
431
0.58
90.
023
0.06
4-0
.007
0.05
741
0(0
.026
)(0
.066
)(0
.057
)(0
.050
)(0
.061
)(0
.063
)A
ge 7
–12
enro
lled
in S
D0.
907
0.91
70.
023
0.00
30.
022
0.02
412
91

Indonesia’s PNPM Generasi Program: Interim Impact Evaluation Report 73
Annex
M
odel
1M
odel
2
Indi
cato
rB
asel
ine
mea
nC
ontr
ol m
ean
Tota
l Gen
eras
i Ye
ar 1
Eff
ect
Ver
si A
ad
diti
onal
ef
fect
Tota
l Ver
si B
im
pact
Tota
l Ver
si A
im
pact
Num
ber
obse
rvat
ions
(1)
(2)
(3)
(4)
(5)
(6)
(7)
(0.0
08)
(0.0
21)
(0.0
15)
(0.0
19)
(0.0
17)
(0.0
19)
Age
13–
15 e
nrol
led
othe
r th
an S
MP
0.38
00.
304
-0.0
838*
-0.0
65-0
.050
-0.1
146*
*41
0(0
.025
)(0
.062
)(0
.045
)(0
.048
)(0
.054
)(0
.048
)K
ecam
atan
SD
gro
ss e
nrol
lmen
t1.
007
1.00
8-0
.018
0.00
5-0
.021
-0.0
1651
(0.0
15)
(0.0
52)
(0.0
37)
(0.0
35)
(0.0
38)
(0.0
46)
Kec
amat
an S
MP
gros
s en
rollm
ent
0.54
90.
761
-0.0
040.
141
-0.0
700.
070
51(0
.039
)(0
.116
)(0
.116
)(0
.111
)(0
.118
)(0
.136
)
Ave
rage
sta
ndar
dize
d ef
fect
-0.0
330.
0665
*-0
.067
3*-0
.001
(0.0
35)
(0.0
39)
(0.0
37)
(0.0
45)
Ave
rage
sta
ndar
dize
d ef
fect
hea
lth-0
.025
0.10
11**
-0.0
770*
0.02
4(0
.040
)(0
.042
)(0
.045
)(0
.046
)A
vera
ge s
tand
ardi
zed
effe
ct e
duca
tion
-0.0
48-0
.003
-0.0
48-0
.050
(0.0
54)
(0.0
63)
(0.0
58)
(0.0
67)

74 Indonesia’s PNPM Generasi Program: Interim Impact Evaluation Report
Annex
Tab
le 1
0. R
esul
ts fo
r m
ain
indi
cato
rs, S
ulaw
esi /
Gor
onta
lo (
base
line
as c
ontr
ol v
aria
ble)
M
odel
1M
odel
2
Indi
cato
rB
asel
ine
mea
nC
ontr
ol
mea
nTo
tal G
ener
asi
Year
1 E
ffec
t
Ver
si A
ad
diti
onal
ef
fect
Tota
l Ver
si B
im
pact
Tota
l Ver
si A
im
pact
Num
ber
obse
rvat
ions
(1)
(2)
(3)
(4)
(5)
(6)
(7)
Mai
n 12
indi
cato
rsN
umbe
r pr
enat
al v
isit
s6.
607
6.28
80.
161
1.39
0-0
.456
0.93
449
3(0
.242
)(0
.360
)(0
.535
)(0
.927
)(0
.531
)(0
.864
)D
eliv
ery
by tr
aine
d m
idw
ife0.
559
0.58
50.
1174
**0.
073
0.08
49*
0.15
77**
*37
4(0
.027
)(0
.046
)(0
.048
)(0
.047
)(0
.050
)(0
.056
)N
umbe
r of
pos
tnat
al v
isit
s2.
586
2.07
60.
163
0.65
2-0
.109
0.54
337
4(0
.188
)(0
.288
)(0
.432
)(0
.610
)(0
.493
)(0
.533
)Ir
on ta
blet
sac
hets
1.31
71.
621
-0.0
370.
3744
*-0
.206
0.16
948
6(0
.054
)(0
.115
)(0
.151
)(0
.193
)(0
.146
)(0
.202
)Pe
rcen
t of i
mm
uniz
atio
n0.
577
0.67
40.
073
0.08
00.
035
0.11
48*
478
(0.0
18)
(0.0
31)
(0.0
53)
(0.0
58)
(0.0
51)
(0.0
66)
Num
ber
of w
eigh
t che
cks
1.53
41.
451
0.22
40.
261
0.10
80.
3687
*65
1(0
.056
)(0
.099
)(0
.133
)(0
.190
)(0
.094
)(0
.205
)N
umbe
r V
itam
in A
sup
plem
ents
1.63
51.
723
-0.0
16-0
.151
0.04
1-0
.110
378
(0.0
73)
(0.1
18)
(0.1
00)
(0.2
02)
(0.1
13)
(0.1
67)
Perc
ent m
alno
uris
hed
0.23
40.
268
-0.0
08-0
.055
0.01
7-0
.038
645
(0.0
19)
(0.0
35)
(0.0
34)
(0.0
59)
(0.0
34)
(0.0
54)
Age
7–1
2 gr
oss
enro
llmen
t0.
935
0.98
6-0
.008
-0.0
07-0
.005
-0.0
1268
0(0
.010
)(0
.010
)(0
.013
)(0
.022
)(0
.014
)(0
.020
)A
ge 1
3–15
gro
ss e
nrol
lmen
t0.
793
0.81
3-0
.071
0.19
75**
*-0
.135
8***
0.06
227
3(0
.024
)(0
.057
)(0
.044
)(0
.055
)(0
.042
)(0
.047
)A
ge 7
–12
gros
s at
tend
ance
0.88
20.
949
-0.0
22-0
.006
-0.0
19-0
.025
679
(0.0
12)
(0.0
12)
(0.0
13)
(0.0
24)
(0.0
15)
(0.0
21)
Age
13–
15 g
ross
att
enda
nce
0.74
10.
788
-0.0
950*
0.22
37**
*-0
.169
8***
0.05
427
3A
dditi
onal
Edu
catio
n In
dica
tors
(0.0
27)
(0.0
57)
(0.0
48)
(0.0
55)
(0.0
45)
(0.0
47)
Age
13–
15 c
ondi
tion
al a
tten
danc
e0.
958
0.97
0-0
.028
4*0.
035
-0.0
425*
*-0
.008
229
(0.0
12)
(0.0
16)
(0.0
15)
(0.0
24)
(0.0
18)
(0.0
18)
Age
13–
15 e
nrol
led
in S
MP
0.52
40.
563
-0.0
610.
2113
**-0
.133
7**
0.07
827
3(0
.030
)(0
.072
)(0
.069
)(0
.079
)(0
.063
)(0
.097
)

Indonesia’s PNPM Generasi Program: Interim Impact Evaluation Report 75
Annex
M
odel
1M
odel
2
Indi
cato
rB
asel
ine
mea
nC
ontr
ol
mea
nTo
tal G
ener
asi
Year
1 E
ffec
t
Ver
si A
ad
diti
onal
ef
fect
Tota
l Ver
si B
im
pact
Tota
l Ver
si A
im
pact
Num
ber
obse
rvat
ions
(1)
(2)
(3)
(4)
(5)
(6)
(7)
Age
7–1
2 en
rolle
d in
SD
0.86
10.
924
-0.0
24-0
.022
-0.0
14-0
.036
680
(0.0
13)
(0.0
22)
(0.0
24)
(0.0
33)
(0.0
26)
(0.0
34)
Age
13–
15 e
nrol
led
othe
r th
an S
MP
0.26
90.
250
-0.0
08-0
.010
-0.0
05-0
.015
273
(0.0
26)
(0.0
63)
(0.0
74)
(0.0
63)
(0.0
83)
(0.0
74)
Kec
amat
an S
D g
ross
enr
ollm
ent
0.90
40.
961
-0.0
03-0
.050
0.02
0-0
.031
34(0
.022
)(0
.028
)(0
.036
)(0
.043
)(0
.041
)(0
.041
)K
ecam
atan
SM
P gr
oss
enro
llmen
t0.
819
0.85
5-0
.099
0.39
16**
-0.2
982*
0.09
334
(0.0
68)
(0.1
49)
(0.1
55)
(0.1
61)
(0.1
73)
(0.1
64)
Ave
rage
sta
ndar
dize
d ef
fect
0.00
50.
2012
***
-0.0
746*
0.12
66**
(0.0
45)
(0.0
59)
(0.0
42)
(0.0
54)
Ave
rage
sta
ndar
dize
d ef
fect
hea
lth0.
0838
*0.
1665
**0.
008
0.17
46**
*(0
.048
)(0
.067
)(0
.047
)(0
.061
)A
vera
ge s
tand
ardi
zed
effe
ct e
duca
tion
-0.1
528*
*0.
2708
***
-0.2
402*
**0.
031
(0.0
72)
(0.0
91)
(0.0
80)
(0.0
62)
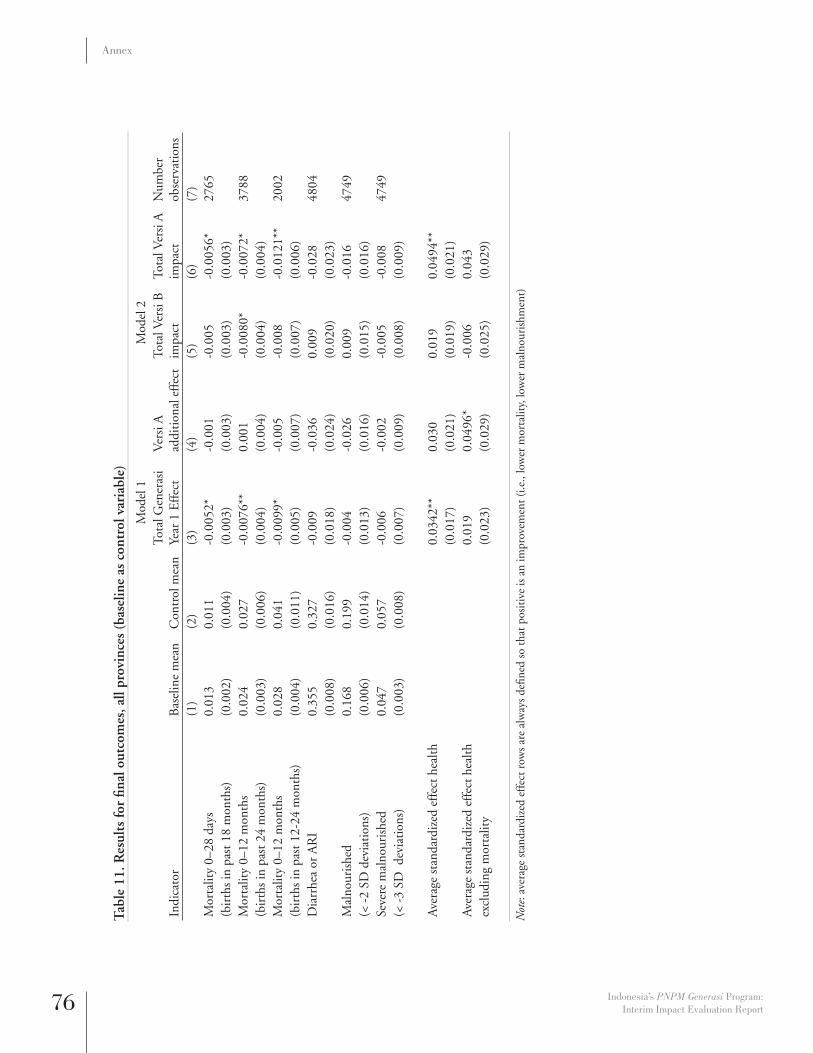
76 Indonesia’s PNPM Generasi Program: Interim Impact Evaluation Report
Annex
Tab
le 1
1. R
esul
ts fo
r fi n
al o
utco
mes
, all
prov
ince
s (b
asel
ine
as c
ontr
ol v
aria
ble)
M
odel
1M
odel
2
Indi
cato
rB
asel
ine
mea
nC
ontr
ol m
ean
Tota
l Gen
eras
i Ye
ar 1
Eff
ect
Ver
si A
ad
diti
onal
eff
ect
Tota
l Ver
si B
im
pact
Tota
l Ver
si A
im
pact
Num
ber
obse
rvat
ions
(1)
(2)
(3)
(4)
(5)
(6)
(7)
Mor
talit
y 0–
28 d
ays
0.01
30.
011
-0.0
052*
-0.0
01-0
.005
-0.0
056*
2765
(bir
ths
in p
ast 1
8 m
onth
s)(0
.002
)(0
.004
)(0
.003
)(0
.003
)(0
.003
)(0
.003
)M
orta
lity
0–12
mon
ths
0.02
40.
027
-0.0
076*
*0.
001
-0.0
080*
-0.0
072*
3788
(bir
ths
in p
ast 2
4 m
onth
s)(0
.003
)(0
.006
)(0
.004
)(0
.004
)(0
.004
)(0
.004
)M
orta
lity
0–12
mon
ths
0.02
80.
041
-0.0
099*
-0.0
05-0
.008
-0.0
121*
*20
02(b
irth
s in
pas
t 12-
24 m
onth
s)(0
.004
)(0
.011
)(0
.005
)(0
.007
)(0
.007
)(0
.006
)D
iarr
hea
or A
RI
0.35
50.
327
-0.0
09-0
.036
0.00
9-0
.028
4804
(0.0
08)
(0.0
16)
(0.0
18)
(0.0
24)
(0.0
20)
(0.0
23)
Mal
nour
ishe
d 0.
168
0.19
9-0
.004
-0.0
260.
009
-0.0
1647
49(<
-2
SD d
evia
tion
s)(0
.006
)(0
.014
)(0
.013
)(0
.016
)(0
.015
)(0
.016
)Se
vere
mal
nour
ishe
d0.
047
0.05
7-0
.006
-0.0
02-0
.005
-0.0
0847
49(<
-3
SD d
evia
tion
s)(0
.003
)(0
.008
)(0
.007
)(0
.009
)(0
.008
)(0
.009
)
Ave
rage
sta
ndar
dize
d ef
fect
hea
lth0.
0342
**0.
030
0.01
90.
0494
**(0
.017
)(0
.021
)(0
.019
)(0
.021
)A
vera
ge s
tand
ardi
zed
effe
ct h
ealth
0.01
90.
0496
*-0
.006
0.04
3ex
clud
ing
mor
talit
y(0
.023
)(0
.029
)(0
.025
)(0
.029
)
N
ote:
ave
rage
sta
ndar
dize
d ef
fect
row
s ar
e al
way
s de
fi ned
so
that
pos
itiv
e is
an
impr
ovem
ent (
i.e.,
low
er m
orta
lity,
low
er m
alno
uris
hmen
t)

Indonesia’s PNPM Generasi Program: Interim Impact Evaluation Report 77
Annex
Tab
le 1
2. R
esul
ts fo
r fi n
al o
utco
mes
, Jav
a (b
asel
ine
as c
ontr
ol v
aria
ble)
M
odel
1M
odel
2
Indi
cato
rB
asel
ine
mea
nC
ontr
ol m
ean
Tota
l Gen
eras
i Ye
ar 1
Eff
ect
Ver
si A
ad
diti
onal
eff
ect
Tota
l Ver
si B
im
pact
Tota
l Ver
si A
im
pact
Num
ber
obse
rvat
ions
(1)
(2)
(3)
(4)
(5)
(6)
(7)
Mor
talit
y 0–
28 d
ays
0.01
20.
008
-0.0
01-0
.003
0.00
0-0
.003
1775
(bir
ths
in p
ast 1
8 m
onth
s)(0
.003
)(0
.005
)(0
.003
)(0
.004
)(0
.004
)(0
.004
)M
orta
lity
0–12
mon
ths
0.01
90.
013
-0.0
02-0
.007
9*0.
002
-0.0
058*
2431
(bir
ths
in p
ast 2
4 m
onth
s)(0
.003
)(0
.005
)(0
.004
)(0
.004
)(0
.005
)(0
.003
)M
orta
lity
0–12
mon
ths
0.02
30.
019
-0.0
03-0
.012
9*0.
004
-0.0
092*
*13
21(b
irth
s in
pas
t 12–
24 m
onth
s)(0
.005
)(0
.010
)(0
.005
)(0
.007
)(0
.008
)(0
.005
)D
iarr
hea
or A
RI
0.33
00.
307
-0.0
15-0
.043
0.00
7-0
.036
3063
(0.0
09)
(0.0
21)
(0.0
24)
(0.0
32)
(0.0
26)
(0.0
32)
Mal
nour
ishe
d 0.
126
0.11
80.
008
0.00
00.
008
0.00
730
27(<
-2
SD d
evia
tion
s)(0
.007
)(0
.015
)(0
.015
)(0
.018
)(0
.017
)(0
.018
)Se
vere
mal
nour
ishe
d0.
029
0.02
60.
003
0.00
00.
003
0.00
330
27(<
-3
SD d
evia
tion
s)(0
.003
)(0
.007
)(0
.007
)(0
.009
)(0
.009
)(0
.008
)
Ave
rage
sta
ndar
dize
d ef
fect
hea
lth0.
007
0.04
5-0
.017
0.02
8(0
.024
)(0
.030
)(0
.030
)(0
.028
)A
vera
ge s
tand
ardi
zed
effe
ct h
ealth
-0.0
030.
031
-0.0
190.
013
excl
udin
g m
orta
lity
(0.0
34)
(0.0
40)
(0.0
39)
(0.0
40)
Not
e: a
vera
ge s
tand
ardi
zed
effe
ct r
ows
are
alw
ays
defi n
ed s
o th
at p
osit
ive
is a
n im
prov
emen
t (i.e
., lo
wer
mor
talit
y, lo
wer
mal
nour
ishm
ent)

78 Indonesia’s PNPM Generasi Program: Interim Impact Evaluation Report
Annex
Tab
le 1
3. R
esul
ts fo
r fi n
al o
utco
mes
, Eas
t N
usa
Teng
gara
(ba
selin
e as
con
trol
var
iabl
e)
M
odel
1M
odel
2
Indi
cato
rB
asel
ine
mea
nC
ontr
ol m
ean
Tota
l Gen
eras
i Ye
ar 1
Eff
ect
Ver
si A
ad
diti
onal
eff
ect
Tota
l Ver
si B
im
pact
Tota
l Ver
si A
im
pact
Num
ber
obse
rvat
ions
(1)
(2)
(3)
(4)
(5)
(6)
(7)
Mor
talit
y 0–
28 d
ays
0.01
60.
022
-0.0
143*
*0.
001
-0.0
146*
*-0
.014
1**
607
(bir
ths
in p
ast 1
8 m
onth
s)(0
.005
)(0
.013
)(0
.007
)(0
.003
)(0
.007
)(0
.007
)M
orta
lity
0–12
mon
ths
0.02
90.
035
-0.0
060.
0165
*-0
.014
5*0.
002
826
(bir
ths
in p
ast 2
4 m
onth
s)(0
.006
)(0
.014
)(0
.009
)(0
.009
)(0
.008
)(0
.011
)M
orta
lity
0–12
mon
ths
0.02
70.
069
-0.0
180.
011
-0.0
23-0
.013
390
(bir
ths
in p
ast 1
2-24
mon
ths)
(0.0
09)
(0.0
30)
(0.0
15)
(0.0
16)
(0.0
17)
(0.0
18)
Dia
rrhe
a or
AR
I0.
357
0.25
80.
014
-0.0
580.
039
-0.0
1810
90(0
.016
)(0
.032
)(0
.038
)(0
.046
)(0
.044
)(0
.044
)M
alno
uris
hed
0.24
70.
353
-0.0
28-0
.070
8**
0.00
8-0
.062
3*10
77(<
-2
SD d
evia
tion
s)(0
.014
)(0
.035
)(0
.032
)(0
.031
)(0
.033
)(0
.035
)Se
vere
mal
nour
ishe
d0.
086
0.09
1-0
.005
-0.0
130.
002
-0.0
1110
77(<
-3
SD d
evia
tion
s)(0
.009
)(0
.021
)(0
.018
)(0
.023
)(0
.021
)(0
.021
)
Ave
rage
sta
ndar
dize
d ef
fect
hea
lth0.
038
0.04
10.
019
0.06
07*
(0.0
29)
(0.0
32)
(0.0
29)
(0.0
35)
Ave
rage
sta
ndar
dize
d ef
fect
hea
lth0.
013
0.10
65**
-0.0
380.
069
excl
udin
g m
orta
lity
(0.0
38)
(0.0
52)
(0.0
39)
(0.0
46)
Not
e: a
vera
ge s
tand
ardi
zed
effe
ct r
ows
are
alw
ays
defi n
ed s
o th
at p
osit
ive
is a
n im
prov
emen
t (i.e
., lo
wer
mor
talit
y, lo
wer
mal
nour
ishm
ent)

Indonesia’s PNPM Generasi Program: Interim Impact Evaluation Report 79
Annex
Tab
le 1
4. R
esul
ts fo
r fi n
al o
utco
mes
, Sul
awes
i /G
oron
talo
(ba
selin
e as
con
trol
var
iabl
e)
M
odel
1M
odel
2
Indi
cato
rB
asel
ine
mea
nC
ontr
ol m
ean
Tota
l Gen
eras
i Ye
ar 1
Eff
ect
Ver
si A
ad
diti
onal
eff
ect
Tota
l Ver
si B
im
pact
Tota
l Ver
si A
im
pact
Num
ber
obse
rvat
ions
(1)
(2)
(3)
(4)
(5)
(6)
(7)
Mor
talit
y 0–
28 d
ays
0.01
00.
008
-0.0
040.
008
-0.0
070.
001
383
(bir
ths
in p
ast 1
8 m
onth
s)(0
.005
)(0
.008
)(0
.007
)(0
.012
)(0
.006
)(0
.013
)M
orta
lity
0–12
mon
ths
0.03
90.
059
-0.0
417*
**-0
.007
-0.0
391*
**-0
.045
8***
531
(bir
ths
in p
ast 2
4 m
onth
s)(0
.009
)(0
.018
)(0
.009
)(0
.017
)(0
.010
)(0
.015
)M
orta
lity
0–12
mon
ths
0.04
80.
071
-0.0
470*
**-0
.016
-0.0
396*
*-0
.055
1**
291
(bir
ths
in p
ast 1
2–24
mon
ths)
(0.0
14)
(0.0
28)
(0.0
14)
(0.0
24)
(0.0
16)
(0.0
21)
Dia
rrhe
a or
AR
I0.
474
0.47
0-0
.036
0.02
3-0
.046
-0.0
2365
1(0
.021
)(0
.039
)(0
.040
)(0
.066
)(0
.036
)(0
.066
)M
alno
uris
hed
0.23
40.
268
-0.0
08-0
.055
0.01
7-0
.038
645
(< -
2 SD
dev
iati
ons)
(0.0
19)
(0.0
35)
(0.0
34)
(0.0
59)
(0.0
34)
(0.0
54)
Seve
re m
alno
uris
hed
0.06
40.
110
-0.0
361*
0.01
2-0
.041
3**
-0.0
3064
5(<
-3
SD d
evia
tion
s)(0
.011
)(0
.025
)(0
.021
)(0
.031
)(0
.020
)(0
.033
)
Ave
rage
sta
ndar
dize
d ef
fect
hea
lth0.
0933
*-0
.007
0.09
64**
0.09
0(0
.046
)(0
.076
)(0
.038
)(0
.078
)A
vera
ge s
tand
ardi
zed
effe
ct h
ealth
0.06
80.
013
0.06
10.
075
excl
udin
g m
orta
lity
(0.0
55)
(0.0
98)
(0.0
45)
(0.0
98)
Not
e: a
vera
ge s
tand
ardi
zed
effe
ct r
ows
are
alw
ays
defi n
ed s
o th
at p
osit
ive
is a
n im
prov
emen
t (i.e
., lo
wer
mor
talit
y, lo
wer
mal
nour
ishm
ent)

80 Indonesia’s PNPM Generasi Program: Interim Impact Evaluation Report
Annex
Tab
le 1
5. R
esul
ts fo
r no
n-ta
rget
ed o
utco
mes
, all
prov
ince
s (b
asel
ine
as c
ontr
ol v
aria
ble)
M
odel
1M
odel
2
Indi
cato
rB
asel
ine
mea
nC
ontr
ol m
ean
Tota
l Gen
eras
i Ye
ar 1
Eff
ect
Ver
si A
add
itio
nal
effe
ctTo
tal V
ersi
B
impa
ctTo
tal V
ersi
A
impa
ctN
umbe
r ob
serv
atio
ns(1
)(2
)(3
)(4
)(5
)(6
)(7
)Q
ualit
y of
pre
nata
l car
e se
rvic
es0.
546
0.57
70.
010
0.01
70.
002
0.01
938
36(0
.004
)(0
.008
)(0
.010
)(0
.013
)(0
.013
)(0
.012
)Fa
cilit
y-ba
sed
vs. h
ome
deliv
erie
s0.
397
0.44
10.
031
0.02
20.
019
0.04
15*
2761
(0.0
09)
(0.0
20)
(0.0
20)
(0.0
26)
(0.0
23)
(0.0
25)
Use
of f
amily
pla
nnin
g0.
528
0.53
2-0
.001
0.01
7-0
.010
0.00
783
05(0
.006
)(0
.014
)(0
.014
)(0
.014
)(0
.014
)(0
.016
)U
se o
f hea
lth s
ervi
ces
cura
tive
car
e.
0.58
7-0
.004
-0.0
080.
000
-0.0
0975
21(.
)(0
.013
)(0
.016
)(0
.018
)(0
.019
)(0
.018
)Q
ualit
y of
pos
yand
u.
0.33
00.
0595
***
-0.0
190.
0694
***
0.05
00*
4112
(.)
(0.0
18)
(0.0
22)
(0.0
27)
(0.0
25)
(0.0
26)
Age
7–1
5 ho
urs
wag
e w
ork
0.43
10.
156
0.20
53**
-0.3
841*
**0.
3959
***
0.01
268
10(0
.047
)(0
.048
)(0
.099
)(0
.125
)(0
.141
)(0
.078
)A
ge 7
–15
hour
s ho
useh
old
wor
k3.
915
3.28
70.
6525
***
-0.4
941*
0.89
75**
*0.
4034
*68
09(0
.081
)(0
.181
)(0
.220
)(0
.286
)(0
.285
)(0
.226
)A
ge 7
–15
wag
e w
ork
dum
my
0.03
10.
021
0.00
7-0
.014
4**
0.01
45**
0.00
068
10(0
.002
)(0
.005
)(0
.005
)(0
.006
)(0
.007
)(0
.005
)A
ge 7
–15
hous
ehol
d w
ork
dum
my
0.72
80.
673
0.00
80.
010
0.00
40.
013
6809
(0.0
05)
(0.0
15)
(0.0
13)
(0.0
18)
(0.0
16)
(0.0
16)
Gro
ss h
igh
scho
ol e
nrol
lmen
t.
0.38
3-0
.027
-0.0
11-0
.022
-0.0
3214
79(.
)(0
.033
)(0
.037
)(0
.045
)(0
.043
)(0
.044
)D
ropo
ut r
ates
0.02
60.
011
0.00
66*
-0.0
010.
007
0.00
666
30(0
.002
)(0
.003
)(0
.004
)(0
.005
)(0
.005
)(0
.004
)SD
to S
MP
tran
siti
on0.
885
0.97
6-0
.005
-0.0
080.
000
-0.0
0964
1(0
.013
)(0
.017
)(0
.011
)(0
.013
)(0
.010
)(0
.014
)SD
to S
MP
tran
siti
on a
lt. d
ef.
0.86
90.
954
0.00
30.
013
-0.0
040.
009
645
(0.0
14)
(0.0
23)
(0.0
14)
(0.0
18)
(0.0
16)
(0.0
17)
Num
ber
of h
ours
att
ende
d sc
hool
17.1
1225
.882
-0.6
629*
*0.
146
-0.7
355*
-0.5
900*
6795
(0.1
66)
(0.2
57)
(0.3
08)
(0.4
39)
(0.4
11)
(0.3
42)
Init
iati
on o
f bre
astf
eedi
ng0.
575
0.63
20.
013
0.01
80.
004
0.02
247
98(0
.008
)(0
.017
)(0
.019
)(0
.023
)(0
.022
)(0
.023
)

Indonesia’s PNPM Generasi Program: Interim Impact Evaluation Report 81
Annex
M
odel
1M
odel
2
Indi
cato
rB
asel
ine
mea
nC
ontr
ol m
ean
Tota
l Gen
eras
i Ye
ar 1
Eff
ect
Ver
si A
add
itio
nal
effe
ctTo
tal V
ersi
B
impa
ctTo
tal V
ersi
A
impa
ctN
umbe
r ob
serv
atio
ns(1
)(2
)(3
)(4
)(5
)(6
)(7
)E
xclu
sive
bre
astf
eedi
ng0.
472
0.40
10.
016
-0.0
070.
020
0.01
248
06(0
.008
)(0
.017
)(0
.021
)(0
.026
)(0
.025
)(0
.024
)M
othe
r’s k
now
ledg
e.
0.60
20.
006
-0.0
050.
008
0.00
445
58(.
)(0
.007
)(0
.007
)(0
.010
)(0
.009
)(0
.009
)Fe
rtili
ty r
ate
0.34
40.
326
-0.0
100.
017
-0.0
18-0
.002
8325
(0.0
05)
(0.0
13)
(0.0
10)
(0.0
12)
(0.0
11)
(0.0
12)
Num
bers
hrs
. sch
ool (
enro
ll on
ly)
18.4
0126
.776
-0.5
215*
*0.
208
-0.6
260*
*-0
.418
6493
(0.1
67)
(0.2
12)
(0.2
35)
(0.3
36)
(0.3
08)
(0.2
69)
Ave
rage
sta
ndar
dize
d ef
fect
-0.0
110.
021
-0.0
22-0
.001
(0.0
16)
(0.0
21)
(0.0
20)
(0.0
19)
Ave
rage
sta
ndar
dize
d ef
fect
hea
lth0.
0317
**0.
014
0.02
50.
0385
**(0
.015
)(0
.020
)(0
.018
)(0
.018
)A
vera
ge
stan
dard
ized
ef
fect
ed
ucat
ion
-0.0
760*
*0.
032
-0.0
916*
*-0
.059
4*
(0
.031
)(0
.038
)(0
.038
)(0
.035
)

82 Indonesia’s PNPM Generasi Program: Interim Impact Evaluation Report
Annex
Tab
le 1
6. R
esul
ts fo
r no
n-ta
rget
ed o
utco
mes
, Jav
a (b
asel
ine
as c
ontr
ol v
aria
ble)
M
odel
1M
odel
2
Indi
cato
rB
asel
ine
mea
nC
ontr
ol m
ean
Tota
l Gen
eras
i Ye
ar 1
Eff
ect
Ver
si A
add
itio
nal
effe
ctTo
tal V
ersi
B
impa
ctTo
tal V
ersi
A
impa
ctN
umbe
r ob
serv
atio
ns(1
)(2
)(3
)(4
)(5
)(6
)(7
)Q
ualit
y of
pre
nata
l car
e se
rvic
es0.
575
0.60
40.
012
0.01
80.
003
0.02
125
34-0
.005
(0.0
10)
(0.0
14)
(0.0
15)
(0.0
16)
(0.0
15)
Faci
lity-
base
d vs
. hom
e de
liver
ies
0.49
6 0.
546
0.03
8-0
.002
0.03
90.
037
1787
-0.0
12(0
.026
)(0
.027
)(0
.037
)(0
.029
)(0
.035
)U
se o
f fam
ily p
lann
ing
0.58
4 0.
572
-0.0
090.
007
-0.0
13-0
.006
5609
-0.0
07(0
.017
)(0
.017
)(0
.016
)(0
.018
)(0
.019
)U
se o
f hea
lth s
ervi
ces
cura
tive
car
e.
0.60
8-0
.010
0.01
9-0
.020
-0.0
0150
96(.
)(0
.016
)(0
.020
)(0
.020
)(0
.023
)(0
.021
)Q
ualit
y of
pos
yand
u.
0.27
40.
0568
**-0
.029
0.07
19**
0.04
326
64(.
)(0
.021
)(0
.024
)(0
.035
)(0
.031
)(0
.030
)A
ge 7
–15
hour
s w
age
wor
k0.
231
0.06
2-0
.042
-0.1
876*
*0.
056
-0.1
321*
*41
59-0
.041
(0.0
31)
(0.0
68)
(0.0
88)
(0.0
94)
(0.0
66)
Age
7–1
5 ho
urs
hous
ehol
d w
ork
3.38
1 2.
678
0.02
2-0
.288
0.17
1-0
.117
4160
-0.0
94(0
.183
)(0
.208
)(0
.251
)(0
.250
)(0
.232
)A
ge 7
–15
wag
e w
ork
dum
my
0.01
9 0.
009
0.00
3-0
.002
0.00
40.
002
4159
-0.0
02(0
.004
)(0
.005
)(0
.006
)(0
.005
)(0
.006
)A
ge 7
–15
hous
ehol
d w
ork
dum
my
0.68
0 0.
613
-0.0
120.
029
-0.0
270.
002
4160
-0.0
07(0
.021
)(0
.019
)(0
.025
)(0
.023
)(0
.022
)G
ross
hig
h sc
hool
enr
ollm
ent
.0.
397
0.01
10.
038
-0.0
080.
030
960
(.)
(0.0
44)
(0.0
40)
(0.0
50)
(0.0
45)
(0.0
49)
Dro
pout
rat
es0.
025
0.00
70.
007
0.00
90.
002
0.01
18**
4078
-0.0
02(0
.004
)(0
.005
)(0
.006
)(0
.006
)(0
.005
)SD
to S
MP
tran
siti
on0.
880
0.96
3-0
.003
-0.0
210.
009
-0.0
1239
3-0
.016
(0.0
26)
(0.0
17)
(0.0
14)
(0.0
14)
(0.0
21)
SD to
SM
P tr
ansi
tion
alt.
def
.0.
860
0.96
30.
000
-0.0
190.
011
-0.0
0839
3-0
.017
(0.0
26)
(0.0
16)
(0.0
15)
(0.0
13)
(0.0
21)
Num
ber
of h
ours
att
ende
d sc
hool
16.9
27
25.5
78-0
.546
-0.4
18-0
.331
-0.7
487*
4148
-0.2
02(0
.312
)(0
.338
)(0
.503
)(0
.437
)(0
.408
)In
itia
tion
of b
reas
tfee
ding
0.57
9 0.
665
0.00
70.
011
0.00
20.
013
3057
-0.0
10(0
.021
)(0
.020
)(0
.029
)(0
.023
)(0
.026
)

Indonesia’s PNPM Generasi Program: Interim Impact Evaluation Report 83
Annex
M
odel
1M
odel
2
Indi
cato
rB
asel
ine
mea
nC
ontr
ol m
ean
Tota
l Gen
eras
i Ye
ar 1
Eff
ect
Ver
si A
add
itio
nal
effe
ctTo
tal V
ersi
B
impa
ctTo
tal V
ersi
A
impa
ctN
umbe
r ob
serv
atio
ns(1
)(2
)(3
)(4
)(5
)(6
)(7
)E
xclu
sive
bre
astf
eedi
ng0.
440
0.38
10.
022
-0.0
400.
042
0.00
230
65-0
.010
(0.0
22)
(0.0
27)
(0.0
35)
(0.0
33)
(0.0
31)
Mot
her’s
kno
wle
dge
.0.
651
0.00
5-0
.012
0.01
1-0
.001
2973
(.)
(0.0
07)
(0.0
09)
(0.0
12)
(0.0
11)
(0.0
11)
Fert
ility
rat
e0.
345
0.30
30.
002
0.02
80*
-0.0
130.
016
5620
-0.0
07(0
.016
)(0
.013
)(0
.015
)(0
.015
)(0
.015
)N
umbe
rs h
rs. s
choo
l (en
roll
only
)17
.952
25
.961
-0.3
320.
092
-0.3
80-0
.288
3993
-0.2
03(0
.286
)(0
.287
)(0
.417
)(0
.349
)(0
.360
)
Ave
rage
sta
ndar
dize
d ef
fect
0.01
3-0
.001
0.01
40.
013
(0.0
22)
(0.0
25)
(0.0
25)
(0.0
25)
Ave
rage
sta
ndar
dize
d ef
fect
hea
lth0.
0339
*0.
001
0.03
30.
035
(0.0
20)
(0.0
26)
(0.0
24)
(0.0
24)
Ave
rage
sta
ndar
dize
d ef
fect
edu
cati
on-0
.018
-0.0
04-0
.015
-0.0
19
(0
.040
)(0
.041
)(0
.044
)(0
.045
)

84 Indonesia’s PNPM Generasi Program: Interim Impact Evaluation Report
Annex
Tab
le 1
7. R
esul
ts fo
r no
n-ta
rget
ed o
utco
mes
, Eas
t N
usa
Teng
gara
(ba
selin
e as
con
trol
var
iabl
e)
Mod
el 1
Mod
el 2
Indi
cato
rB
asel
ine
mea
nC
ontr
ol m
ean
Tota
l Gen
eras
i Ye
ar 1
Eff
ect
Ver
si A
add
itio
nal
effe
ctTo
tal V
ersi
B
impa
ctTo
tal V
ersi
A
impa
ctN
umbe
r ob
serv
atio
ns(1
)(2
)(3
)(4
)(5
)(6
)(7
)Q
ualit
y of
pre
nata
l car
e se
rvic
es0.
486
0.55
6-0
.020
-0.0
05-0
.018
-0.0
2280
9(0
.010
)(0
.022
)(0
.018
)(0
.025
)(0
.023
)(0
.021
)Fa
cilit
y-ba
sed
vs. h
ome
deliv
erie
s0.
191
0.32
60.
011
0.07
80*
-0.0
320.
046
600
(0.0
16)
(0.0
41)
(0.0
51)
(0.0
44)
(0.0
60)
(0.0
52)
Use
of f
amily
pla
nnin
g0.
285
0.27
70.
041
0.06
98*
0.00
80.
0775
*15
67(0
.012
)(0
.030
)(0
.037
)(0
.036
)(0
.036
)(0
.045
)U
se o
f hea
lth s
ervi
ces
cura
tive
car
e.
0.60
00.
014
-0.0
750*
*0.
0490
*-0
.026
1326
(.)
(0.0
30)
(0.0
27)
(0.0
37)
(0.0
25)
(0.0
37)
Qua
lity
of p
osya
ndu
.0.
518
0.02
9-0
.070
0.06
4-0
.006
984
(.)
(0.0
39)
(0.0
53)
(0.0
45)
(0.0
53)
(0.0
57)
Age
7–1
5 ho
urs
wag
e w
ork
0.51
90.
085
0.15
3-0
.259
0.28
02*
0.02
116
99(0
.111
)(0
.064
)(0
.140
)(0
.158
)(0
.166
)(0
.150
)A
ge 7
–15
hour
s ho
useh
old
wor
k5.
077
4.10
31.
5252
***
-0.6
211.
8304
***
1.20
96**
1698
(0.1
96)
(0.3
73)
(0.5
12)
(0.6
39)
(0.6
22)
(0.5
50)
Age
7–1
5 w
age
wor
k du
mm
y0.
032
0.01
8-0
.003
-0.0
160.
005
-0.0
1116
99(0
.004
)(0
.009
)(0
.008
)(0
.011
)(0
.010
)(0
.010
)A
ge 7
–15
hous
ehol
d w
ork
dum
my
0.81
50.
786
0.02
6-0
.011
0.03
10.
020
1698
(0.0
09)
(0.0
28)
(0.0
19)
(0.0
29)
(0.0
22)
(0.0
27)
Gro
ss h
igh
scho
ol e
nrol
lmen
t.
0.38
3-0
.107
-0.0
79-0
.061
-0.1
4130
9(.
)(0
.072
)(0
.097
)(0
.118
)(0
.121
)(0
.106
)D
ropo
ut r
ates
0.02
70.
009
0.00
2-0
.011
0.00
7-0
.004
1642
(0.0
04)
(0.0
07)
(0.0
08)
(0.0
08)
(0.0
08)
(0.0
09)
SD to
SM
P tr
ansi
tion
0.84
61.
000
0.00
00.
000
0.00
00.
000
140
(0.0
40)
0.00
0 0.
000
0.00
0 0.
000
0.00
0 SD
to S
MP
tran
siti
on a
lt. d
ef.
0.83
50.
938
0.01
60.
039
-0.0
020.
037
142
(0.0
41)
(0.0
63)
(0.0
35)
(0.0
29)
(0.0
38)
(0.0
34)
Num
ber
of h
ours
att
ende
d sc
hool
17.6
9526
.614
-0.6
490.
343
-0.8
34-0
.491
1696
(0.3
54)
(0.6
07)
(0.6
43)
(0.9
50)
(0.8
70)
(0.7
35)
Init
iati
on o
f bre
astf
eedi
ng0.
666
0.67
90.
030
0.05
40.
003
0.05
710
90(0
.016
)(0
.034
)(0
.043
)(0
.042
)(0
.048
)(0
.045
)

Indonesia’s PNPM Generasi Program: Interim Impact Evaluation Report 85
Annex
M
odel
1M
odel
2
Indi
cato
rB
asel
ine
mea
nC
ontr
ol m
ean
Tota
l Gen
eras
i Ye
ar 1
Eff
ect
Ver
si A
add
itio
nal
effe
ctTo
tal V
ersi
B
impa
ctTo
tal V
ersi
A
impa
ctN
umbe
r ob
serv
atio
ns(1
)(2
)(3
)(4
)(5
)(6
)(7
)E
xclu
sive
bre
astf
eedi
ng0.
652
0.55
30.
0849
*0.
034
0.06
70.
1006
**10
91(0
.016
)(0
.036
)(0
.045
)(0
.046
)(0
.053
)(0
.049
)M
othe
r’s k
now
ledg
e.
0.54
50.
009
0.00
40.
007
0.01
197
0(.
)(0
.016
)(0
.018
)(0
.021
)(0
.018
)(0
.022
)Fe
rtili
ty r
ate
0.37
30.
427
-0.0
26-0
.016
-0.0
18-0
.033
1574
(0.0
13)
(0.0
33)
(0.0
23)
(0.0
23)
(0.0
22)
(0.0
28)
Num
bers
hrs
sch
ool (
enro
ll on
ly)
19.3
4028
.388
-1.1
893*
*0.
428
-1.4
226*
-0.9
943*
1615
(0.3
60)
(0.4
22)
(0.5
15)
(0.7
50)
(0.7
62)
(0.5
09)
Ave
rage
sta
ndar
dize
d ef
fect
-0.0
190.
023
-0.0
30-0
.007
(0.0
27)
(0.0
35)
(0.0
32)
(0.0
33)
Ave
rage
sta
ndar
dize
d ef
fect
hea
lth0.
040
0.01
80.
029
0.04
7(0
.031
)(0
.036
)(0
.035
)(0
.036
)A
vera
ge
stan
dard
ized
ef
fect
ed
ucat
ion
-0.1
232*
*0.
033
-0.1
369*
*-0
.103
7*
(0
.054
)(0
.065
)(0
.065
)(0
.060
)

86 Indonesia’s PNPM Generasi Program: Interim Impact Evaluation Report
Annex
Tab
le 1
8. R
esul
ts fo
r no
n-ta
rget
ed o
utco
mes
, Sul
awes
i /G
oron
talo
(ba
selin
e as
con
trol
var
iabl
e)
Mod
el 1
Mod
el 2
Indi
cato
rB
asel
ine
mea
nC
ontr
ol m
ean
Tota
l Gen
eras
i Ye
ar 1
Eff
ect
Ver
si A
ad
diti
onal
eff
ect
Tota
l Ver
si B
im
pact
Tota
l Ver
si A
im
pact
Num
ber
obse
rvat
ions
(1)
(2)
(3)
(4)
(5)
(6)
(7)
Qua
lity
of p
rena
tal c
are
serv
ices
0.47
90.
495
0.04
60.
0641
*0.
019
0.08
26**
493
(0.0
12)
(0.0
21)
(0.0
28)
(0.0
36)
(0.0
33)
(0.0
36)
Faci
lity-
base
d vs
hom
e de
liver
ies
0.20
00.
237
0.04
89**
0.02
40.
038
0.06
20*
374
(0.0
22)
(0.0
39)
(0.0
24)
(0.0
37)
(0.0
30)
(0.0
31)
Use
of f
amily
pla
nnin
g0.
582
0.62
7-0
.027
-0.0
07-0
.024
-0.0
3011
29(0
.015
)(0
.031
)(0
.027
)(0
.040
)(0
.030
)(0
.038
)U
se o
f hea
lth s
ervi
ces
cura
tive
car
e.
0.50
7-0
.006
-0.0
230.
004
-0.0
1810
99(.
)(0
.030
)(0
.046
)(0
.068
)(0
.063
)(0
.051
)Q
ualit
y of
pos
yand
u.
0.27
60.
1330
**0.
1930
**0.
046
0.23
94**
*46
4(.
)(0
.042
)(0
.056
)(0
.088
)(0
.059
)(0
.077
)A
ge 7
–15
hour
s w
age
wor
k1.
153
0.50
51.
1440
**-1
.375
0**
1.74
78**
*0.
373
952
(0.1
97)
(0.2
06)
(0.4
34)
(0.6
60)
(0.5
92)
(0.3
49)
Age
7–1
5 ho
urs
hous
ehol
d w
ork
4.11
84.
065
1.52
91**
-0.7
051.
8275
**1.
1226
*95
1(0
.207
)(0
.592
)(0
.610
)(0
.830
)(0
.803
)(0
.572
)A
ge 7
–15
wag
e w
ork
dum
my
0.08
70.
057
0.03
81*
-0.0
641*
*0.
0656
**0.
002
952
(0.0
09)
(0.0
17)
(0.0
21)
(0.0
27)
(0.0
24)
(0.0
18)
Age
7–1
5 ho
useh
old
wor
k du
mm
y0.
776
0.71
40.
049
-0.0
190.
057
0.03
895
1(0
.014
)(0
.033
)(0
.035
)(0
.048
)(0
.042
)(0
.042
)G
ross
hig
h sc
hool
enr
ollm
ent
.0.
342
-0.0
72-0
.112
-0.0
16-0
.127
210
(.)
(0.0
75)
(0.0
88)
(0.0
87)
(0.0
79)
(0.1
13)
Dro
pout
rat
es0.
030
0.02
10.
005
-0.0
240.
016
-0.0
0891
0(0
.006
)(0
.011
)(0
.009
)(0
.016
)(0
.012
)(0
.013
)SD
to S
MP
tran
siti
on0.
960
1.00
00.
001
0.05
5-0
.023
0.03
310
8(0
.022
)0.
000
(0.0
10)
(0.0
49)
(0.0
21)
(0.0
35)
SD to
SM
P tr
ansi
tion
alt.
def
.0.
960
0.93
80.
009
0.12
0-0
.040
0.08
011
0(0
.022
)(0
.063
)(0
.040
)(0
.078
)(0
.055
)(0
.053
)N
umbe
r of
hou
rs a
tten
ded
scho
ol16
.834
25.8
86-1
.108
2.41
40*
-1.9
430.
471
951
(0.4
69)
(0.6
04)
(1.0
56)
(1.3
38)
(1.2
32)
(1.1
04)
Init
iati
on o
f bre
astf
eedi
ng0.
402
0.47
6-0
.010
-0.0
520.
014
-0.0
3965
1(0
.021
)(0
.039
)(0
.060
)(0
.079
)(0
.069
)(0
.075
)E
xclu
sive
bre
astf
eedi
ng0.
320
0.28
7-0
.127
1***
0.00
9-0
.130
6***
-0.1
216*
**65
0

Indonesia’s PNPM Generasi Program: Interim Impact Evaluation Report 87
Annex
M
odel
1M
odel
2
Indi
cato
rB
asel
ine
mea
nC
ontr
ol m
ean
Tota
l Gen
eras
i Ye
ar 1
Eff
ect
Ver
si A
ad
diti
onal
eff
ect
Tota
l Ver
si B
im
pact
Tota
l Ver
si A
im
pact
Num
ber
obse
rvat
ions
(1)
(2)
(3)
(4)
(5)
(6)
(7)
(0.0
20)
(0.0
35)
(0.0
33)
(0.0
50)
(0.0
39)
(0.0
44)
Mot
her’s
kno
wle
dge
.0.
509
0.00
60.
016
-0.0
010.
016
615
(.)
(0.0
16)
(0.0
15)
(0.0
25)
(0.0
17)
(0.0
22)
Fert
ility
rat
e0.
299
0.31
4-0
.033
-0.0
27-0
.020
-0.0
470*
1131
(0.0
14)
(0.0
29)
(0.0
20)
(0.0
26)
(0.0
23)
(0.0
24)
Num
bers
hrs
. sch
ool (
enro
ll on
ly)
18.6
8927
.308
-0.2
280.
581
-0.4
350.
146
885
(0.4
79)
(0.4
37)
(0.5
66)
(1.0
15)
(0.7
49)
(0.7
72)
Ave
rage
sta
ndar
dize
d ef
fect
-0.0
370.
1104
*-0
.081
9**
0.02
9(0
.027
)(0
.062
)(0
.038
)(0
.043
)A
vera
ge s
tand
ardi
zed
effe
ct h
ealth
0.01
50.
065
-0.0
130.
051
(0.0
31)
(0.0
49)
(0.0
31)
(0.0
46)
Ave
rage
st
anda
rdiz
ed
effe
ct
educ
atio
n-0
.114
4***
0.17
9-0
.184
8**
-0.0
06
(0
.044
)(0
.115
)(0
.074
)(0
.071
)

88 Indonesia’s PNPM Generasi Program: Interim Impact Evaluation Report
Annex
Tab
le 1
9. R
esul
ts fo
r m
ain
indi
cato
rs, a
ll pr
ovin
ces
(int
erac
tion
wit
h pr
e-pe
riod
leve
l of o
utco
me
vari
able
, mod
el 1
)M
odel
1
Indi
cato
rB
asel
ine
mea
nC
ontr
ol m
ean
Gen
eras
i Yea
r 1
* Pr
e Pe
riod
Lev
elG
ener
asi Y
ear
1 ev
alua
ted
at 1
0th p
ctile
Num
ber
obse
rvat
ions
(1)
(2)
(3)
(4)
(5)
Mai
n 12
indi
cato
rsN
umbe
r pr
enat
al v
isit
s7.
647
7.51
00.
144
-0.3
9238
37(0
.072
)(0
.141
)(0
.112
)(0
.342
)D
eliv
ery
by tr
aine
d m
idw
ife0.
670
0.75
5-0
.031
0.04
927
61(0
.009
)(0
.017
)(0
.062
)(0
.043
)N
umbe
r of
pos
tnat
al v
isit
s3.
036
2.83
1-0
.055
0.06
627
61(0
.064
)(0
.129
)(0
.081
)(0
.215
)Ir
on ta
blet
sac
hets
1.58
81.
977
-0.1
700.
1888
*37
88(0
.021
)(0
.049
)(0
.103
)(0
.098
)Pe
rcen
t of i
mm
uniz
atio
n0.
653
0.69
3-0
.144
3**
0.05
58**
3521
(0.0
06)
(0.0
13)
(0.0
70)
(0.0
27)
Num
ber
of w
eigh
t che
cks
2.12
62.
192
-0.0
770.
1666
**48
04(0
.019
)(0
.040
)(0
.083
)(0
.082
)N
umbe
r V
itam
in A
sup
plem
ents
1.52
91.
560
-0.0
270.
011
2758
(0.0
24)
(0.0
44)
(0.0
93)
(0.0
61)
Perc
ent m
alno
uris
hed
0.16
80.
199
-0.1
780*
-0.0
3047
49(0
.006
)(0
.014
)(0
.097
)(0
.021
)A
ge 7
–12
gros
s en
rollm
ent
0.94
80.
982
-0.0
660.
006
4962
(0.0
03)
(0.0
05)
(0.0
75)
(0.0
09)
Age
13–
15 g
ross
enr
ollm
ent
0.82
20.
906
-0.0
60-0
.027
1856
(0.0
09)
(0.0
19)
(0.0
95)
(0.0
28)
Age
7–1
2 gr
oss
atte
ndan
ce0.
904
0.95
6-0
.049
0.00
749
52(0
.004
)(0
.006
)(0
.035
)(0
.006
)A
ge 1
3–15
gro
ss a
tten
danc
e0.
768
0.88
4-0
.024
-0.0
4518
53(0
.011
)(0
.019
)(0
.087
)(0
.031
)A
vera
ge s
tand
ardi
zed
effe
ct-0
.107
0.03
3(0
.084
)(0
.030
)A
vera
ge s
tand
ardi
zed
effe
ct h
ealth
-0.0
300.
0696
**(0
.048
)(0
.031
)A
vera
ge
stan
dard
ized
ef
fect
ed
ucat
ion
-0.2
60-0
.039
(0.2
24)
(0.0
56)

Indonesia’s PNPM Generasi Program: Interim Impact Evaluation Report 89
Annex
Tab
le 2
0. R
esul
ts fo
r m
ain
indi
cato
rs, a
ll pr
ovin
ces
(int
erac
tion
wit
h pr
e-pe
riod
leve
l of o
utco
me
vari
able
, mod
el 2
)
Indi
cato
rB
asel
ine
mea
nC
ontr
ol
mea
n
Ver
si A
add
itio
nal
effe
ct
* pr
e-pe
riod
leve
l
Gen
eras
i Ver
si B
to
tal e
ffec
t*
pre-
peri
od le
vel
Gen
eras
i Ver
si A
to
tal e
ffec
t*
pre-
peri
od le
vel
Ver
si A
add
itio
nal
effe
ct a
t 10th
pct
ile
of p
re-p
erio
dN
umbe
r ob
serv
atio
ns(1
)(2
)(3
)(4
)(5
)(6
)(7
)M
ain
12 in
dica
tors
Num
ber
pren
atal
vis
its
7.64
77.
510
0.01
00.
143
0.15
30.
590
3837
(0.0
72)
(0.1
41)
(0.1
35)
(0.1
18)
(0.1
38)
(0.3
67)
Del
iver
y by
trai
ned
mid
wife
0.67
00.
755
-0.1
255*
0.03
6-0
.090
0.05
027
61(0
.009
)(0
.017
)(0
.071
)(0
.070
)(0
.074
)(0
.046
)N
umbe
r of
pos
tnat
al v
isit
s3.
036
2.83
1-0
.057
-0.0
22-0
.080
0.48
13*
2761
(0.0
64)
(0.1
29)
(0.1
10)
(0.1
06)
(0.0
87)
(0.2
55)
Iron
tabl
et s
ache
ts1.
588
1.97
70.
063
-0.2
07-0
.144
0.04
737
88(0
.021
)(0
.049
)(0
.151
)(0
.130
)(0
.125
)(0
.110
)Pe
rcen
t of i
mm
uniz
atio
n0.
653
0.69
3-0
.101
-0.0
88-0
.189
2**
0.04
135
21(0
.006
)(0
.013
)(0
.087
)(0
.078
)(0
.085
)(0
.029
)N
umbe
r of
wei
ght c
heck
s2.
126
2.19
20.
012
-0.0
81-0
.069
0.09
048
04(0
.019
)(0
.040
)(0
.106
)(0
.098
)(0
.098
)(0
.107
)N
umbe
r V
itam
in A
sup
plem
ents
1.52
91.
560
-0.0
07-0
.023
-0.0
30-0
.008
2758
(0.0
24)
(0.0
44)
(0.1
54)
(0.1
15)
(0.1
28)
(0.0
95)
Perc
ent m
alno
uris
hed
0.16
80.
199
-0.1
58-0
.097
-0.2
554*
*-0
.047
3*47
49(0
.006
)(0
.014
)(0
.138
)(0
.113
)(0
.129
)(0
.027
)A
ge 7
–12
gros
s en
rollm
ent
0.94
80.
982
0.04
3-0
.084
-0.0
41-0
.007
4962
(0.0
03)
(0.0
05)
(0.1
27)
(0.1
05)
(0.0
90)
(0.0
12)
Age
13–
15 g
ross
enr
ollm
ent
0.82
20.
906
0.00
6-0
.066
-0.0
600.
014
1856
(0.0
09)
(0.0
19)
(0.1
48)
(0.1
19)
(0.1
19)
(0.0
44)
Age
7–1
2 gr
oss
atte
ndan
ce0.
904
0.95
6-0
.005
-0.0
46-0
.051
0.00
049
52(0
.004
)(0
.006
)(0
.033
)(0
.039
)(0
.039
)(0
.006
)A
ge 1
3–15
gro
ss a
tten
danc
e0.
768
0.88
4-0
.027
-0.0
23-0
.050
0.03
218
53(0
.011
)(0
.019
)(0
.132
)(0
.106
)(0
.111
)(0
.048
)A
vera
ge s
tand
ardi
zed
effe
ct0.
003
-0.1
09-0
.105
0.07
09*
(0.1
36)
(0.1
13)
(0.1
00)
(0.0
41)
Ave
rage
sta
ndar
dize
d ef
fect
hea
lth-0
.020
-0.0
17-0
.037
0.09
26**
(0.0
65)
(0.0
54)
(0.0
62)
(0.0
36)
Ave
rage
sta
ndar
dize
d ef
fect
edu
cati
on0.
050
-0.2
91-0
.242
0.02
8(0
.369
)(0
.310
)(0
.254
)(0
.086
)

90 Indonesia’s PNPM Generasi Program: Interim Impact Evaluation Report
Annex
Tab
le 2
1. R
esul
ts fo
r m
ain
indi
cato
rs, J
ava
(in
tera
ctio
n w
ith
pre-
peri
od le
vel o
f out
com
e va
riab
le, m
odel
1)
Mod
el 1
Indi
cato
rB
asel
ine
mea
nC
ontr
ol m
ean
Gen
eras
i Yea
r 1
* Pr
e Pe
riod
Le
vel
Gen
eras
i Yea
r 1
eval
uate
d at
10
th p
ctile
Num
ber
obse
rvat
ions
(1)
(2)
(3)
(4)
(5)
Mai
n 12
indi
cato
rsN
umbe
r pr
enat
al v
isit
s8.
080
7.98
20.
091
-0.0
1125
34(0
.081
)(0
.171
)(0
.134
)(0
.392
)D
eliv
ery
by tr
aine
d m
idw
ife0.
764
0.84
3-0
.139
4*0.
1128
**17
87(0
.010
)(0
.019
)(0
.076
)(0
.050
)N
umbe
r of
pos
tnat
al v
isit
s3.
605
3.58
7-0
.152
0.27
717
87(0
.081
)(0
.172
)(0
.115
)(0
.337
)Ir
on ta
blet
sac
hets
1.63
92.
071
-0.3
138*
*0.
3324
**25
04(0
.025
)(0
.061
)(0
.138
)(0
.144
)Pe
rcen
t of i
mm
uniz
atio
n0.
701
0.73
6-0
.190
7**
0.04
422
80(0
.007
)(0
.014
)(0
.082
)(0
.028
)N
umbe
r of
wei
ght c
heck
s2.
213
2.37
70.
029
0.05
530
62(0
.023
)(0
.047
)(0
.114
)(0
.101
)N
umbe
r V
itam
in A
sup
plem
ents
1.48
81.
444
-0.0
800.
083
1809
(0.0
28)
(0.0
53)
(0.1
13)
(0.0
70)
Perc
ent m
alno
uris
hed
0.12
60.
118
-0.2
549*
-0.0
3130
27(0
.007
)(0
.015
)(0
.151
)(0
.029
)A
ge 7
–12
gros
s en
rollm
ent
0.95
90.
993
-0.1
030.
008
2991
(0.0
04)
(0.0
04)
(0.0
76)
(0.0
08)
Age
13–
15 g
ross
enr
ollm
ent
0.83
30.
943
-0.0
63-0
.010
1173
(0.0
11)
(0.0
20)
(0.1
24)
(0.0
34)
Age
7–1
2 gr
oss
atte
ndan
ce0.
914
0.96
9-0
.049
0.00
929
83(0
.005
)(0
.006
)(0
.050
)(0
.010
)A
ge 1
3–15
gro
ss a
tten
danc
e0.
783
0.92
6-0
.022
-0.0
2511
70(0
.013
)(0
.021
)(0
.117
)(0
.041
)A
vera
ge s
tand
ardi
zed
effe
ct-0
.202
0.09
38**
(0.1
25)
(0.0
39)
Ave
rage
sta
ndar
dize
d ef
fect
hea
lth-0
.065
0.13
70**
*(0
.070
)(0
.042
)A
vera
ge s
tand
ardi
zed
effe
ct e
duca
tion
-0.4
770.
008
(0.3
49)
(0.0
84)

Indonesia’s PNPM Generasi Program: Interim Impact Evaluation Report 91
Annex
Tab
le 2
2. R
esul
ts fo
r m
ain
indi
cato
rs, J
ava
(int
erac
tion
wit
h pr
e-pe
riod
leve
l of o
utco
me
vari
able
, mod
el 2
)
Indi
cato
rB
asel
ine
mea
nC
ontr
ol
mea
n
Ver
si A
addi
tion
al e
ffec
t*
pre-
peri
od le
vel
Gen
eras
i Ver
si B
to
tal e
ffec
t*
pre-
peri
od le
vel
Gen
eras
i Ver
si A
to
tal e
ffec
t * p
re-
peri
od le
vel
Ver
si A
add
itio
nal
effe
ct a
t 10th
pct
ile
of p
re-p
erio
dN
umbe
r ob
serv
atio
ns(1
)(2
)(3
)(4
)(5
)(6
)(7
)M
ain
12 in
dica
tors
Num
ber
pren
atal
vis
its
8.08
07.
982
-0.1
310.
175
0.04
40.
752
2534
(0.0
81)
(0.1
71)
(0.1
90)
(0.1
74)
(0.1
55)
(0.5
00)
Del
iver
y by
trai
ned
mid
wife
0.76
40.
843
0.17
91*
-0.2
120*
**-0
.033
-0.1
384*
*17
87(0
.010
)(0
.019
)(0
.099
)(0
.076
)(0
.096
)(0
.067
)N
umbe
r of
pos
tnat
al v
isit
s3.
605
3.58
7-0
.038
-0.1
31-0
.169
0.33
717
87(0
.081
)(0
.172
)(0
.160
)(0
.145
)(0
.128
)(0
.424
)Ir
on ta
blet
sac
hets
1.63
92.
071
0.23
5-0
.445
2**
-0.2
10-0
.200
2504
(0.0
25)
(0.0
61)
(0.2
12)
(0.1
73)
(0.1
74)
(0.1
58)
Perc
ent o
f im
mun
izat
ion
0.70
10.
736
-0.1
09-0
.127
-0.2
360*
*0.
041
2280
(0.0
07)
(0.0
14)
(0.1
23)
(0.1
01)
(0.1
02)
(0.0
38)
Num
ber
of w
eigh
t che
cks
2.21
32.
377
0.05
00.
000
0.05
00.
058
3062
(0.0
23)
(0.0
47)
(0.1
80)
(0.1
65)
(0.1
28)
(0.1
54)
Num
ber
Vit
amin
A s
uppl
emen
ts1.
488
1.44
4-0
.010
-0.0
77-0
.087
0.06
518
09(0
.028
)(0
.053
)(0
.173
)(0
.162
)(0
.119
)(0
.104
)Pe
rcen
t mal
nour
ishe
d0.
126
0.11
80.
066
-0.2
882*
-0.2
220.
010
3027
(0.0
07)
(0.0
15)
(0.2
29)
(0.1
66)
(0.2
07)
(0.0
40)
Age
7–1
2 gr
oss
enro
llmen
t0.
959
0.99
30.
191
-0.1
539*
0.03
7-0
.020
2991
(0.0
04)
(0.0
04)
(0.1
24)
(0.0
81)
(0.1
17)
(0.0
13)
Age
13–
15 g
ross
enr
ollm
ent
0.83
30.
943
0.12
0-0
.097
0.02
2-0
.044
1173
(0.0
11)
(0.0
20)
(0.1
94)
(0.1
45)
(0.1
70)
(0.0
53)
Age
7–1
2 gr
oss
atte
ndan
ce0.
914
0.96
90.
007
-0.0
56-0
.049
-0.0
0729
83(0
.005
)(0
.006
)(0
.054
)(0
.068
)(0
.050
)(0
.010
)A
ge 1
3–15
gro
ss a
tten
danc
e0.
783
0.92
6-0
.067
0.00
5-0
.062
0.00
511
70(0
.013
)(0
.021
)(0
.172
)(0
.138
)(0
.150
)(0
.064
)A
vera
ge s
tand
ardi
zed
effe
ct0.
211
-0.2
557*
-0.0
45-0
.040
(0.1
76)
(0.1
45)
(0.1
53)
(0.0
57)
Ave
rage
sta
ndar
dize
d ef
fect
hea
lth0.
011
-0.0
62-0
.051
-0.0
01(0
.104
)(0
.084
)(0
.090
)(0
.055
)A
vera
ge
stan
dard
ized
ef
fect
ed
ucat
ion
0.61
2-0
.644
-0.0
32-0
.120
(0.4
89)
(0.4
16)
(0.4
25)
(0.1
23)

92 Indonesia’s PNPM Generasi Program: Interim Impact Evaluation Report
Annex
Tab
le 2
3. R
esul
ts fo
r m
ain
indi
cato
rs, E
ast
Nus
a Te
ngga
ra (
inte
ract
ion
wit
h pr
e-pe
riod
leve
l of o
utco
me
vari
able
, mod
el 1
)M
odel
1
Indi
cato
rB
asel
ine
mea
nC
ontr
ol m
ean
Gen
eras
i Yea
r 1
* Pr
e Pe
riod
Lev
elG
ener
asi Y
ear
1 ev
alua
ted
at 1
0th p
ctile
Num
ber
obse
rvat
ions
(1)
(2)
(3)
(4)
(5)
Mai
n 12
indi
cato
rsN
umbe
r pr
enat
al v
isit
s6.
822
7.01
2-0
.078
-0.5
5381
0(0
.170
)(0
.323
)(0
.192
)(0
.731
)D
eliv
ery
by tr
aine
d m
idw
ife0.
427
0.65
90.
141
-0.1
0260
0(0
.021
)(0
.042
)(0
.228
)(0
.093
)N
umbe
r of
pos
tnat
al v
isit
s1.
444
1.35
70.
329
-0.4
8460
0(0
.092
)(0
.196
)(0
.252
)(0
.422
)Ir
on ta
blet
sac
hets
1.58
91.
976
0.09
9-0
.026
798
(0.0
48)
(0.1
17)
(0.1
67)
(0.1
68)
Perc
ent o
f im
mun
izat
ion
0.54
90.
586
0.13
90.
003
763
(0.0
15)
(0.0
33)
(0.1
43)
(0.0
61)
Num
ber
of w
eigh
t che
cks
2.23
72.
347
-0.4
790.
3658
*10
91(0
.037
)(0
.082
)(0
.301
)(0
.194
)N
umbe
r V
itam
in A
sup
plem
ents
1.58
61.
736
-0.1
35-0
.117
571
(0.0
53)
(0.0
84)
(0.1
68)
(0.1
17)
Perc
ent m
alno
uris
hed
0.24
70.
353
0.02
4-0
.024
1077
(0.0
14)
(0.0
35)
(0.2
19)
(0.0
45)
Age
7–1
2 gr
oss
enro
llmen
t0.
929
0.95
2-0
.136
0.02
512
91(0
.007
)(0
.017
)(0
.176
)(0
.019
)A
ge 1
3–15
gro
ss e
nrol
lmen
t0.
810
0.89
3-0
.052
-0.0
4241
0(0
.020
)(0
.042
)(0
.144
)(0
.039
)A
ge 7
–12
gros
s at
tend
ance
0.89
20.
931
0.05
50.
013
1290
(0.0
09)
(0.0
18)
(0.0
72)
(0.0
09)
Age
13–
15 g
ross
att
enda
nce
0.74
60.
860
-0.1
04-0
.027
410
(0.0
24)
(0.0
44)
(0.1
42)
(0.0
62)
Ave
rage
sta
ndar
dize
d ef
fect
-0.0
61-0
.004
(0.1
29)
(0.0
48)
Ave
rage
sta
ndar
dize
d ef
fect
hea
lth0.
022
0.00
7(0
.096
)(0
.062
)A
vera
ge s
tand
ardi
zed
effe
ct e
duca
tion
-0.2
26-0
.025
(0.3
20)
(0.0
63)

Indonesia’s PNPM Generasi Program: Interim Impact Evaluation Report 93
Annex
Tab
le 2
4. R
esul
ts fo
r m
ain
indi
cato
rs, E
ast
Nus
a Te
ngga
ra (
inte
ract
ion
wit
h pr
e-pe
riod
leve
l of o
utco
me
vari
able
, mod
el 2
)
Indi
cato
rB
asel
ine
mea
nC
ontr
ol
mea
n
Ver
si A
addi
tion
al e
ffec
t*
pre-
peri
od le
vel
Gen
eras
i Ver
si B
to
tal e
ffec
t * p
re-
peri
od le
vel
Gen
eras
i Ver
si A
tota
l eff
ect
* pr
e-pe
riod
leve
l
Ver
si A
add
itio
nal
effe
ct a
t 10th
pct
ile
of p
re-p
erio
dN
umbe
r ob
serv
atio
ns(1
)(2
)(3
)(4
)(5
)(6
)(7
)M
ain
12 in
dica
tors
Num
ber
pren
atal
vis
its
6.82
27.
012
0.19
0-0
.143
0.04
70.
230
810
(0.1
70)
(0.3
23)
(0.1
39)
(0.1
94)
(0.2
16)
(0.5
07)
Del
iver
y by
trai
ned
mid
wife
0.42
70.
659
-0.3
265*
0.32
80.
002
0.17
68**
600
(0.0
21)
(0.0
42)
(0.1
70)
(0.2
51)
(0.2
46)
(0.0
70)
Num
ber
of p
ostn
atal
vis
its
1.44
41.
357
0.52
90.
291
0.82
03**
0.23
760
0(0
.092
)(0
.196
)(0
.336
)(0
.245
)(0
.388
)(0
.329
)Ir
on ta
blet
sac
hets
1.58
91.
976
0.08
20.
051
0.13
30.
196
798
(0.0
48)
(0.1
17)
(0.2
08)
(0.2
00)
(0.2
07)
(0.1
81)
Perc
ent o
f im
mun
izat
ion
0.54
90.
586
-0.0
590.
165
0.10
60.
007
763
(0.0
15)
(0.0
33)
(0.1
01)
(0.1
43)
(0.1
61)
(0.0
40)
Num
ber
of w
eigh
t che
cks
2.23
72.
347
0.16
3-0
.590
5*-0
.428
-0.0
1110
91(0
.037
)(0
.082
)(0
.252
)(0
.343
)(0
.312
)(0
.171
)N
umbe
r V
itam
in A
sup
plem
ents
1.58
61.
736
0.16
1-0
.190
-0.0
28-0
.213
571
(0.0
53)
(0.0
84)
(0.2
47)
(0.1
66)
(0.2
58)
(0.1
42)
Perc
ent m
alno
uris
hed
0.24
70.
353
-0.0
240.
001
-0.0
23-0
.074
1077
(0.0
14)
(0.0
35)
(0.3
08)
(0.2
19)
(0.3
34)
(0.0
51)
Age
7–1
2 gr
oss
enro
llmen
t0.
929
0.95
20.
4060
*-0
.415
-0.0
09-0
.029
1291
(0.0
07)
(0.0
17)
(0.2
28)
(0.2
53)
(0.1
68)
(0.0
20)
Age
13–
15 g
ross
enr
ollm
ent
0.81
00.
893
0.32
88*
-0.1
710.
158
-0.1
160*
410
(0.0
20)
(0.0
42)
(0.1
89)
(0.1
57)
(0.1
80)
(0.0
65)
Age
7–1
2 gr
oss
atte
ndan
ce0.
892
0.93
10.
066
0.02
20.
088
0.00
612
90(0
.009
)(0
.018
)(0
.094
)(0
.077
)(0
.096
)(0
.014
)A
ge 1
3–15
gro
ss a
tten
danc
e0.
746
0.86
00.
5118
***
-0.3
188*
0.19
3-0
.229
6***
410
(0.0
24)
(0.0
44)
(0.1
61)
(0.1
73)
(0.1
69)
(0.0
76)
Ave
rage
sta
ndar
dize
d ef
fect
0.39
92**
-0.2
530.
146
-0.0
19(0
.175
)(0
.153
)(0
.168
)(0
.050
)A
vera
ge s
tand
ardi
zed
effe
ct h
ealth
-0.0
170.
056
0.04
00.
0789
*(0
.115
)(0
.103
)(0
.138
)(0
.046
)A
vera
ge s
tand
ardi
zed
effe
ct e
duca
tion
1.23
12**
*-0
.871
9**
0.35
9-0
.213
3**
(0.4
44)
(0.4
24)
(0.3
81)
(0.0
92)

94 Indonesia’s PNPM Generasi Program: Interim Impact Evaluation Report
Annex
Tab
le 2
5. R
esul
ts fo
r m
ain
indi
cato
rs, S
ulaw
esi
(int
erac
tion
wit
h pr
e-pe
riod
leve
l of o
utco
me
vari
able
, mod
el 1
)M
odel
1
Indi
cato
rB
asel
ine
mea
nC
ontr
ol m
ean
Gen
eras
i Yea
r 1
* Pr
e Pe
riod
Lev
elG
ener
asi Y
ear
1 ev
alua
ted
at 1
0th p
ctile
Num
ber
obse
rvat
ions
(1)
(2)
(3)
(4)
(5)
Mai
n 12
indi
cato
rsN
umbe
r pr
enat
al v
isit
s6.
607
6.28
80.
410
-0.9
5149
3(0
.242
)(0
.360
)(0
.324
)(0
.863
)D
eliv
ery
by tr
aine
d m
idw
ife0.
559
0.58
50.
012
0.11
337
4(0
.027
)(0
.046
)(0
.192
)(0
.087
)N
umbe
r of
pos
tnat
al v
isit
s2.
586
2.07
60.
364
-0.3
7437
4(0
.188
)(0
.288
)(0
.272
)(0
.663
)Ir
on ta
blet
sac
hets
1.31
71.
621
-0.1
360.
020
486
(0.0
54)
(0.1
15)
(0.5
04)
(0.2
54)
Perc
ent o
f im
mun
izat
ion
0.57
70.
674
-0.0
800.
091
478
(0.0
18)
(0.0
31)
(0.2
84)
(0.1
00)
Num
ber
of w
eigh
t che
cks
1.53
41.
451
-0.0
850.
285
651
(0.0
56)
(0.0
99)
(0.2
09)
(0.1
96)
Num
ber
Vit
amin
A s
uppl
emen
ts1.
635
1.72
30.
164
-0.1
3237
8(0
.073
)(0
.118
)(0
.241
)(0
.183
)Pe
rcen
t mal
nour
ishe
d0.
234
0.26
8-0
.311
-0.0
5164
5(0
.019
)(0
.035
)(0
.266
)(0
.055
)A
ge 7
–12
gros
s en
rollm
ent
0.93
50.
986
-0.0
50-0
.004
680
(0.0
10)
(0.0
10)
(0.2
17)
(0.0
23)
Age
13–
15 g
ross
enr
ollm
ent
0.79
30.
813
-0.0
75-0
.056
273
(0.0
24)
(0.0
57)
(0.2
39)
(0.0
72)
Age
7–1
2 gr
oss
atte
ndan
ce0.
882
0.94
9-0
.131
-0.0
0667
9(0
.012
)(0
.012
)(0
.095
)(0
.016
)A
ge 1
3–15
gro
ss a
tten
danc
e0.
741
0.78
80.
020
-0.1
0027
3(0
.027
)(0
.057
)(0
.254
)(0
.087
)A
vera
ge s
tand
ardi
zed
effe
ct-0
.034
-0.0
07(0
.221
)(0
.072
)A
vera
ge s
tand
ardi
zed
effe
ct h
ealth
0.08
60.
050
(0.1
58)
(0.0
68)
Ave
rage
sta
ndar
dize
d ef
fect
edu
cati
on-0
.272
-0.1
20(0
.563
)(0
.135
)

Indonesia’s PNPM Generasi Program: Interim Impact Evaluation Report 95
Annex
Tab
le 2
6. R
esul
ts fo
r m
ain
indi
cato
rs, S
ulaw
esi (
inte
ract
ion
wit
h pr
e-pe
riod
leve
l of o
utco
me
vari
able
, mod
el 2
)
Indi
cato
rB
asel
ine
mea
nC
ontr
ol
mea
n
Ver
si A
addi
tion
al e
ffec
t*
pre-
peri
od le
vel
Gen
eras
i Ver
si B
tota
l eff
ect
* pr
e-pe
riod
leve
l
Gen
eras
i Ver
si A
tota
l eff
ect
* pr
e-pe
riod
leve
l
Ver
si A
add
itio
nal
effe
ct a
t 10th
pct
ile
of p
re-p
erio
dN
umbe
r ob
serv
atio
ns(1
)(2
)(3
)(4
)(5
)(6
)(7
)M
ain
12 in
dica
tors
Num
ber
pren
atal
vis
its
6.59
26.
288
0.06
80.
344
0.41
21.
134
493
(0.2
42)
(0.3
60)
(0.4
45)
(0.2
28)
(0.4
18)
(1.2
28)
Del
iver
y by
trai
ned
mid
wife
0.56
00.
585
0.06
6-0
.008
0.05
90.
054
374
(0.0
27)
(0.0
46)
(0.2
52)
(0.1
99)
(0.2
53)
(0.0
95)
Num
ber
of p
ostn
atal
vis
its
2.58
12.
076
-0.4
650.
4534
*-0
.012
1.58
537
4(0
.188
)(0
.288
)(0
.454
)(0
.239
)(0
.468
)(1
.373
)Ir
on ta
blet
sac
hets
1.31
31.
621
-0.1
910.
038
-0.1
530.
4437
*48
6(0
.054
)(0
.115
)(0
.801
)(0
.524
)(0
.615
)(0
.256
)Pe
rcen
t of i
mm
uniz
atio
n0.
579
0.67
4-0
.482
0.07
2-0
.410
0.15
547
8(0
.018
)(0
.031
)(0
.498
)(0
.226
)(0
.527
)(0
.114
)N
umbe
r of
wei
ght c
heck
s1.
517
1.45
10.
228
-0.1
240.
104
0.11
665
1(0
.056
)(0
.099
)(0
.329
)(0
.189
)(0
.341
)(0
.181
)N
umbe
r V
itam
in A
sup
plem
ents
1.64
11.
723
0.75
60.
199
0.95
5-1
.006
378
(0.0
73)
(0.1
18)
(0.7
22)
(0.2
08)
(0.6
91)
(0.6
73)
Perc
ent m
alno
uris
hed
0.24
80.
268
-0.3
84-0
.018
-0.4
02-0
.094
645
(0.0
19)
(0.0
35)
(0.3
98)
(0.3
28)
(0.3
00)
(0.0
66)
Age
7–1
2 gr
oss
enro
llmen
t0.
941
0.98
6-1
.383
2***
0.38
93**
*-0
.993
9***
0.09
02**
*68
0(0
.009
)(0
.010
)(0
.226
)(0
.114
)(0
.216
)(0
.015
)A
ge 1
3–15
gro
ss e
nrol
lmen
t0.
809
0.81
3-0
.146
0.31
40.
168
0.24
33**
*27
3(0
.024
)(0
.057
)(0
.367
)(0
.198
)(0
.351
)(0
.066
)A
ge 7
–12
gros
s at
tend
ance
0.89
50.
949
-0.6
429*
**-0
.054
-0.6
970*
**0.
0593
***
679
(0.0
12)
(0.0
12)
(0.1
80)
(0.0
85)
(0.1
95)
(0.0
20)
Age
13–
15 g
ross
att
enda
nce
0.75
00.
788
-0.0
390.
3844
**0.
345
0.26
40**
*27
3(0
.026
)(0
.057
)(0
.340
)(0
.176
)(0
.345
)(0
.069
)A
vera
ge s
tand
ardi
zed
effe
ct-0
.912
2***
0.35
48**
-0.5
575*
*0.
2642
**(0
.250
)(0
.156
)(0
.242
)(0
.101
)A
vera
ge s
tand
ardi
zed
effe
ct h
ealth
0.03
50.
067
0.10
20.
138
(0.2
31)
(0.1
55)
(0.2
28)
(0.1
31)
Ave
rage
sta
ndar
dize
d ef
fect
edu
cati
on-2
.807
2***
0.93
10**
-1.8
762*
**0.
5177
***
(0.5
26)
(0.3
60)
(0.5
64)
(0.0
91)

96 Indonesia’s PNPM Generasi Program: Interim Impact Evaluation Report
Annex
Tab
le 2
7. R
esul
ts fo
r m
ain
indi
cato
rs, a
ll pr
ovin
ces
(sp
lit b
y pe
r-ca
pita
con
sum
ptio
n qu
inti
le, m
odel
1)
Mod
el 1
Indi
cato
rB
asel
ine
mea
nC
ontr
ol
mea
nG
ener
asi Y
ear
1 fo
r B
otto
m 2
Qui
ntile
s
Gen
eras
i Yea
r 1
Top
3 Q
uint
ile A
ddit
iona
l E
ffec
t
Gen
eras
i Yea
r 1
Tota
l Eff
ect f
or T
op
3 Q
uint
iles
Num
ber
obse
rvat
ions
(1)
(2)
(3)
(4)
(5)
(6)
Mai
n 12
indi
cato
rsN
umbe
r pr
enat
al v
isit
s7.
700
7.67
10.
363
-0.3
060.
057
1020
(0.1
06)
(0.2
39)
(0.4
40)
(0.5
43)
(0.3
92)
Del
iver
y by
trai
ned
mid
wife
0.66
50.
742
-0.0
780.
075
-0.0
0381
2(0
.013
)(0
.028
)(0
.048
)(0
.060
)(0
.044
)N
umbe
r of
pos
tnat
al v
isit
s2.
989
2.97
2-0
.447
0.77
70*
0.33
081
2(0
.092
)(0
.212
)(0
.344
)(0
.451
)(0
.326
)Ir
on ta
blet
sac
hets
1.60
61.
939
0.14
4-0
.008
0.13
610
02(0
.030
)(0
.082
)(0
.162
)(0
.170
)(0
.138
)Pe
rcen
t of i
mm
uniz
atio
n0.
651
0.69
90.
022
0.02
40.
045
1190
(0.0
09)
(0.0
19)
(0.0
31)
(0.0
38)
(0.0
28)
Num
ber
of w
eigh
t che
cks
2.12
82.
189
0.17
60**
-0.0
280.
1481
*20
84(0
.028
)(0
.046
)(0
.080
)(0
.103
)(0
.083
)N
umbe
r V
itam
in A
sup
plem
ents
1.52
21.
745
-0.0
180.
092
0.07
410
79(0
.036
)(0
.054
)(0
.096
)(0
.113
)(0
.085
)Pe
rcen
t mal
nour
ishe
d0.
166
0.22
20.
000
-0.0
06-0
.006
2049
(0.0
09)
(0.0
17)
(0.0
27)
(0.0
37)
(0.0
25)
Age
7–1
2 gr
oss
enro
llmen
t0.
951
0.97
60.
010
-0.0
15-0
.005
2689
(0.0
04)
(0.0
05)
(0.0
08)
(0.0
10)
(0.0
07)
Age
13–
15 g
ross
enr
ollm
ent
0.81
40.
908
-0.0
400.
020
-0.0
2011
04(0
.014
)(0
.016
)(0
.029
)(0
.037
)(0
.026
)A
ge 7
–12
gros
s at
tend
ance
0.90
10.
953
0.00
7-0
.014
-0.0
0826
82(0
.006
)(0
.006
)(0
.008
)(0
.011
)(0
.008
)A
ge 1
3–15
gro
ss a
tten
danc
e0.
758
0.88
7-0
.054
6*0.
011
-0.0
4411
01(0
.016
)(0
.016
)(0
.031
)(0
.038
)(0
.027
)A
vera
ge s
tand
ardi
zed
effe
ct-0
.013
0.03
40.
021
(0.0
39)
(0.0
44)
(0.0
29)
Ave
rage
sta
ndar
dize
d ef
fect
hea
lth0.
008
0.06
00.
0679
**(0
.046
)(0
.052
)(0
.034
)A
vera
ge s
tand
ardi
zed
effe
ct e
duc.
-0.0
56-0
.018
-0.0
74(0
.058
)(0
.068
)(0
.049
)

Indonesia’s PNPM Generasi Program: Interim Impact Evaluation Report 97
Annex
Tab
le 2
8. R
esul
ts fo
r m
ain
indi
cato
rs, a
ll pr
ovin
ces
(spl
it b
y pe
r-ca
pita
con
sum
ptio
n qu
inti
le, m
odel
2)
Indi
cato
rC
ontr
ol
mea
n
Gen
eras
i Ver
si
B b
otto
m 2
qu
inti
les
Gen
eras
i Ver
si B
to
p 3
quin
tile
s ad
diti
onal
eff
ect
Gen
eras
i V
ersi
B to
p 3
quin
tile
s to
tal
Gen
eras
i Ver
si
A b
otto
m 2
qu
inti
les
Gen
eras
i Ver
si A
to
p 3
quin
tile
s ad
diti
onal
eff
ect
Gen
eras
i V
ersi
A to
p 3
quin
tile
s to
tal
Num
ber
obse
rvat
ions
(1)
(2)
(3)
(4)
(5)
(6)
(7)
(8)
(9)
Mai
n 12
indi
cato
rsN
umbe
r pr
enat
al v
isit
s7.
700
7.67
1-0
.262
0.29
90.
038
1.14
95*
-1.0
860.
063
1020
(0.1
06)
(0.2
39)
(0.5
31)
(0.7
26)
(0.4
69)
(0.6
22)
(0.8
39)
(0.5
11)
Del
iver
y by
mid
wife
0.66
50.
742
-0.1
026*
0.16
04**
0.05
80.
041
-0.1
631*
*-0
.122
0**
812
(0.0
13)
(0.0
28)
(0.0
56)
(0.0
71)
(0.0
51)
(0.0
61)
(0.0
78)
(0.0
53)
Num
ber
of p
ostn
atal
vis
its
2.98
92.
972
-0.6
030.
603
0.00
00.
300
0.36
50.
666
812
(0.0
92)
(0.2
12)
(0.4
15)
(0.5
52)
(0.3
87)
(0.4
40)
(0.5
78)
(0.4
23)
Iron
tabl
et s
ache
ts1.
606
1.93
90.
019
0.18
50.
204
0.22
5-0
.355
5*-0
.131
1002
(0.0
30)
(0.0
82)
(0.1
80)
(0.2
01)
(0.1
50)
(0.1
70)
(0.2
15)
(0.1
66)
Perc
ent o
f im
mun
izat
ion
0.65
10.
699
-0.0
050.
049
0.04
50.
047
-0.0
440.
003
1190
(0.0
09)
(0.0
19)
(0.0
39)
(0.0
48)
(0.0
34)
(0.0
43)
(0.0
53)
(0.0
35)
Num
ber
of w
eigh
t che
cks
2.12
82.
189
0.13
6-0
.063
0.07
30.
082
0.08
30.
1648
*20
84(0
.028
)(0
.046
)(0
.100
)(0
.133
)(0
.097
)(0
.112
)(0
.144
)(0
.099
)N
umbe
r V
itam
in A
su
pple
men
ts1.
522
1.74
5-0
.014
0.06
50.
051
-0.0
050.
051
0.04
610
79(0
.036
)(0
.054
)(0
.117
)(0
.161
)(0
.111
)(0
.128
)(0
.182
)(0
.128
)Pe
rcen
t mal
nour
ishe
d0.
166
0.22
20.
038
-0.0
72-0
.034
-0.0
683*
0.12
69**
0.05
86*
2049
(0.0
09)
(0.0
17)
(0.0
33)
(0.0
44)
(0.0
25)
(0.0
36)
(0.0
51)
(0.0
34)
Age
7–1
2 gr
oss
enro
llmen
t0.
951
0.97
60.
009
-0.0
14-0
.005
0.00
3-0
.002
0.00
126
89(0
.004
)(0
.005
)(0
.010
)(0
.011
)(0
.009
)(0
.009
)(0
.013
)(0
.011
)A
ge 1
3–15
gro
ss e
nrol
lmen
t0.
814
0.90
8-0
.065
0.03
5-0
.029
0.04
8-0
.025
0.02
311
04(0
.014
)(0
.016
)(0
.042
)(0
.057
)(0
.035
)(0
.045
)(0
.061
)(0
.033
)A
ge 7
–12
gros
s at
tend
ance
0.90
10.
953
0.00
2-0
.012
-0.0
090.
008
-0.0
040.
004
2682
(0.0
06)
(0.0
06)
(0.0
10)
(0.0
14)
(0.0
11)
(0.0
11)
(0.0
16)
(0.0
12)
Age
13–
15 g
ross
att
enda
nce
0.75
80.
887
-0.0
840*
0.03
0-0
.054
0.05
8-0
.032
0.02
511
01(0
.016
)(0
.016
)(0
.044
)(0
.057
)(0
.034
)(0
.046
)(0
.060
)(0
.036
)A
vera
ge s
tand
ardi
zed
effe
ct-0
.076
0.09
48*
0.01
90.
1162
**-0
.108
7*0.
008
(0.0
46)
(0.0
57)
(0.0
34)
(0.0
51)
(0.0
63)
(0.0
37)
Ave
rage
sta
ndar
dize
d H
ealth
-0.0
580.
1337
**0.
0754
**0.
1211
**-0
.133
7*-0
.013
(0.0
53)
(0.0
64)
(0.0
38)
(0.0
59)
(0.0
71)
(0.0
39)
Ave
rage
sta
ndar
dize
d ef
fect
ed
ucat
ion
-0.1
110.
017
-0.0
940.
107
-0.0
590.
048
(0.0
80)
(0.0
99)
(0.0
61)
(0.0
83)
(0.1
07)
(0.0
67)

98 Indonesia’s PNPM Generasi Program: Interim Impact Evaluation Report
Annex
Tab
le 2
9. R
esul
ts fo
r m
ain
indi
cato
rs, J
ava
(spl
it b
y pe
r-ca
pita
con
sum
ptio
n qu
inti
le, m
odel
1)
Mod
el 1
Indi
cato
rB
asel
ine
mea
nC
ontr
ol
mea
nG
ener
asi Y
ear
1 fo
r B
otto
m 2
Qui
ntile
s
Gen
eras
i Yea
r 1
Top
3 Q
uint
ile
Add
itio
nal E
ffec
t
Gen
eras
i Yea
r 1
Tota
l Eff
ect f
or T
op
3 Q
uint
iles
Num
ber
obse
rvat
ions
(1)
(2)
(3)
(4)
(5)
(6)
Mai
n 12
indi
cato
rsN
umbe
r pr
enat
al v
isit
s8.
100
7.91
90.
878
-0.3
080.
510
648
(0.1
19)
(0.2
81)
(0.6
10)
(0.6
49)
(0.3
83)
Del
iver
y by
trai
ned
mid
wife
0.76
40.
813
-0.0
020.
015
0.02
452
3(0
.014
)(0
.033
)(0
.061
)(0
.069
)(0
.048
)N
umbe
r of
pos
tnat
al v
isit
s3.
626
3.44
6-0
.352
0.76
60.
336
523
(0.1
18)
(0.2
86)
(0.5
58)
(0.6
53)
(0.3
74)
Iron
tabl
et s
ache
ts1.
630
2.14
40.
367
-0.2
860.
146
638
(0.0
36)
(0.1
09)
(0.2
50)
(0.2
34)
(0.1
65)
Perc
ent o
f im
mun
izat
ion
0.70
40.
731
0.04
4-0
.051
-0.0
1477
1(0
.011
)(0
.023
)(0
.039
)(0
.046
)(0
.029
)N
umbe
r of
wei
ght c
heck
s2.
228
2.26
50.
2364
**-0
.060
0.20
26**
1357
(0.0
34)
(0.0
57)
(0.1
07)
(0.1
24)
(0.0
91)
Num
ber
Vit
amin
A s
uppl
emen
ts1.
466
1.75
2-0
.036
0.05
40.
022
729
(0.0
43)
(0.0
65)
(0.1
15)
(0.1
39)
(0.0
97)
Perc
ent m
alno
uris
hed
0.11
70.
148
0.01
8-0
.012
0.01
113
36(0
.010
)(0
.018
)(0
.033
)(0
.044
)(0
.023
)A
ge 7
–12
gros
s en
rollm
ent
0.95
80.
992
0.00
6-0
.007
0.00
116
21(0
.005
)(0
.004
)(0
.006
)(0
.010
)(0
.007
)A
ge 1
3–15
gro
ss e
nrol
lmen
t0.
824
0.93
0-0
.013
0.01
10.
008
714
(0.0
17)
(0.0
18)
(0.0
49)
(0.0
53)
(0.0
30)
Age
7–1
2 gr
oss
atte
ndan
ce0.
905
0.97
00.
003
-0.0
050.
000
1616
(0.0
08)
(0.0
06)
(0.0
08)
(0.0
12)
(0.0
09)
Age
13–
15 g
ross
att
enda
nce
0.76
00.
906
-0.0
280.
007
-0.0
0871
1(0
.020
)(0
.018
)(0
.049
)(0
.053
)(0
.030
)A
vera
ge s
tand
ardi
zed
effe
ct0.
046
-0.0
140.
044
(0.0
60)
(0.0
64)
(0.0
36)
Ave
rage
sta
ndar
dize
d ef
fect
hea
lth0.
078
-0.0
160.
066
(0.0
68)
(0.0
71)
(0.0
40)
Ave
rage
sta
ndar
dize
d ef
fect
edu
cati
on-0
.017
-0.0
120.
002
(0.1
02)
(0.1
10)
(0.0
67)

Indonesia’s PNPM Generasi Program: Interim Impact Evaluation Report 99
Annex
Tab
le 3
0. R
esul
ts fo
r m
ain
indi
cato
rs, J
ava
(spl
it b
y pe
r-ca
pita
con
sum
ptio
n qu
inti
le, m
odel
2)
Indi
cato
rC
ontr
ol
mea
n
Gen
eras
i Ver
si
B b
otto
m 2
qu
inti
les
Gen
eras
i Ver
si B
to
p 3
quin
tile
s ad
diti
onal
eff
ect
Gen
eras
i Ver
si B
to
p 3
quin
tile
s to
tal
Gen
eras
i Ver
si
A b
otto
m 2
qu
inti
les
Gen
eras
i Ver
si A
to
p 3
quin
tile
s ad
diti
onal
eff
ect
Gen
eras
i V
ersi
A to
p 3
quin
tile
s to
tal
Num
ber
obse
rvat
ions
(1)
(2)
(3)
(4)
(5)
(6)
(7)
(8)
(9)
Mai
n 12
indi
cato
rsN
umbe
r pr
enat
al v
isit
s8.
100
7.91
90.
450
0.11
70.
566
0.81
8-0
.802
0.01
664
8(0
.119
)(0
.281
)(0
.648
)(0
.807
)(0
.488
)(0
.719
)(0
.874
)(0
.583
)D
eliv
ery
by tr
aine
d m
idw
ife0.
764
0.81
30.
027
0.05
20.
079
-0.0
62-0
.058
-0.1
204*
523
(0.0
14)
(0.0
33)
(0.0
62)
(0.0
82)
(0.0
67)
(0.0
81)
(0.1
05)
(0.0
65)
Num
ber
of p
ostn
atal
vis
its
3.62
63.
446
-0.2
400.
355
0.11
4-0
.175
0.71
60.
541
523
(0.1
18)
(0.2
86)
(0.7
01)
(0.8
54)
(0.4
67)
(0.8
30)
(0.9
23)
(0.5
11)
Iron
tabl
et s
ache
ts1.
630
2.14
40.
415
-0.2
720.
143
-0.0
98-0
.017
-0.1
1563
8(0
.036
)(0
.109
)(0
.271
)(0
.288
)(0
.186
)(0
.302
)(0
.330
)(0
.194
)Pe
rcen
t of i
mm
uniz
atio
n0.
704
0.73
10.
048
-0.0
49-0
.001
-0.0
08-0
.004
-0.0
1277
1(0
.011
)(0
.023
)(0
.053
)(0
.065
)(0
.040
)(0
.058
)(0
.069
)(0
.042
)N
umbe
r of
wei
ght c
heck
s2.
228
2.26
50.
213
-0.1
500.
064
0.05
20.
174
0.22
63*
1357
(0.0
34)
(0.0
57)
(0.1
34)
(0.1
61)
(0.1
19)
(0.1
42)
(0.1
75)
(0.1
16)
Num
ber
Vit
amin
A
supp
lem
ents
1.46
61.
752
-0.0
800.
023
-0.0
570.
081
0.05
40.
135
729
(0.0
43)
(0.0
65)
(0.1
42)
(0.2
04)
(0.1
35)
(0.1
66)
(0.2
28)
(0.1
54)
Perc
ent m
alno
uris
hed
0.11
70.
148
0.06
0-0
.097
8*-0
.038
-0.0
710.
1570
**0.
0863
**13
36(0
.010
)(0
.018
)(0
.045
)(0
.055
)(0
.025
)(0
.049
)(0
.064
)(0
.036
)A
ge 7
–12
gros
s en
rollm
ent
0.95
80.
992
0.00
4-0
.006
-0.0
010.
003
-0.0
030.
000
1621
(0.0
05)
(0.0
04)
(0.0
08)
(0.0
11)
(0.0
11)
(0.0
09)
(0.0
12)
(0.0
12)
Age
13–
15 g
ross
enr
ollm
ent
0.82
40.
930
-0.0
280.
028
-0.0
010.
032
-0.0
33-0
.001
714
(0.0
17)
(0.0
18)
(0.0
71)
(0.0
82)
(0.0
41)
(0.0
76)
(0.0
90)
(0.0
38)
Age
7–1
2 gr
oss
atte
ndan
ce0.
905
0.97
00.
006
-0.0
08-0
.003
-0.0
050.
007
0.00
216
16(0
.008
)(0
.006
)(0
.011
)(0
.014
)(0
.012
)(0
.012
)(0
.016
)(0
.013
)A
ge 1
3–15
gro
ss a
tten
danc
e0.
760
0.90
6-0
.039
0.01
6-0
.022
0.02
2-0
.018
0.00
471
1(0
.020
)(0
.018
)(0
.070
)(0
.079
)(0
.040
)(0
.075
)(0
.086
)(0
.041
)A
vera
ge s
tand
ardi
zed
effe
ct0.
026
0.01
20.
038
0.03
7-0
.048
-0.0
11(0
.070
)(0
.081
)(0
.043
)(0
.084
)(0
.093
)(0
.050
)A
vera
ge s
tand
ardi
zed
effe
ct
heal
th0.
060
0.01
30.
073
0.03
1-0
.050
-0.0
19(0
.072
)(0
.085
)(0
.044
)(0
.090
)(0
.100
)(0
.047
)A
vera
ge s
tand
ardi
zed
effe
ct
educ
atio
n-0
.041
0.01
0-0
.031
0.05
0-0
.043
0.00
7(0
.148
)(0
.162
)(0
.085
)(0
.156
)(0
.177
)(0
.093
)

100 Indonesia’s PNPM Generasi Program: Interim Impact Evaluation Report
Annex
Tab
le 3
1. R
esul
ts fo
r m
ain
indi
cato
rs, E
ast
Nus
a Te
ngga
ra (
split
by
per-
capi
ta c
onsu
mpt
ion
quin
tile
, mod
el 1
)M
odel
1
Indi
cato
rB
asel
ine
mea
nC
ontr
ol m
ean
Gen
eras
i Yea
r 1
for
Bot
tom
2
Qui
ntile
s
Gen
eras
i Yea
r 1
Top
3 Q
uint
ile A
ddit
iona
l E
ffec
t
Gen
eras
i Yea
r 1
Tota
l Eff
ect f
or T
op
3 Q
uint
iles
Num
ber
obse
rvat
ions
(1)
(2)
(3)
(4)
(5)
(6)
Mai
n 12
indi
cato
rsN
umbe
r pr
enat
al v
isit
s6.
783
7.52
9-1
.100
8*-1
.108
-2.2
0923
4(0
.256
)(0
.551
)(0
.644
)(1
.470
)(1
.354
)D
eliv
ery
by tr
aine
d m
idw
ife0.
423
0.61
8-0
.192
3*0.
232
0.03
917
8(0
.030
)(0
.066
)(0
.098
)(0
.190
)(0
.153
)N
umbe
r of
pos
tnat
al v
isit
s1.
425
1.89
1-0
.470
0.23
1-0
.239
178
(0.1
29)
(0.3
69)
(0.4
77)
(0.6
70)
(0.6
57)
Iron
tabl
et s
ache
ts1.
663
1.75
4-0
.153
0.30
10.
149
228
(0.0
74)
(0.1
80)
(0.2
44)
(0.4
09)
(0.3
87)
Perc
ent o
f im
mun
izat
ion
0.54
60.
687
-0.0
450.
2976
***
0.25
28**
*26
3(0
.021
)(0
.040
)(0
.055
)(0
.087
)(0
.076
)N
umbe
r of
wei
ght c
heck
s2.
236
2.62
3-0
.064
0.20
70.
142
455
(0.0
53)
(0.0
72)
(0.1
33)
(0.2
75)
(0.2
40)
Num
ber
Vit
amin
A s
uppl
emen
ts1.
594
1.79
7-0
.296
0.49
52**
0.20
021
8(0
.073
)(0
.147
)(0
.190
)(0
.227
)(0
.200
)Pe
rcen
t mal
nour
ishe
d0.
257
0.39
5-0
.018
-0.0
98-0
.116
447
(0.0
21)
(0.0
43)
(0.0
54)
(0.0
98)
(0.0
85)
Age
7–1
2 gr
oss
enro
llmen
t0.
930
0.96
50.
016
-0.0
110.
005
707
(0.0
10)
(0.0
12)
(0.0
15)
(0.0
20)
(0.0
14)
Age
13–
15 g
ross
enr
ollm
ent
0.81
60.
874
-0.0
53-0
.049
-0.1
0224
1(0
.030
)(0
.036
)(0
.041
)(0
.081
)(0
.074
)A
ge 7
–12
gros
s at
tend
ance
0.89
30.
942
0.01
70.
002
0.01
970
6(0
.013
)(0
.013
)(0
.015
)(0
.029
)(0
.023
)A
ge 1
3–15
gro
ss a
tten
danc
e0.
774
0.85
3-0
.052
-0.1
19-0
.171
4**
241
(0.0
36)
(0.0
36)
(0.0
46)
(0.0
88)
(0.0
75)
Ave
rage
sta
ndar
dize
d ef
fect
-0.1
236*
*0.
143
0.01
9(0
.050
)(0
.089
)(0
.085
)A
vera
ge s
tand
ardi
zed
effe
ct h
ealth
-0.1
678*
**0.
2827
**0.
115
(0.0
62)
(0.1
22)
(0.1
12)
Ave
rage
sta
ndar
dize
d ef
fect
edu
cati
on-0
.035
-0.1
37-0
.173
(0.0
71)
(0.1
32)
(0.1
08)

Indonesia’s PNPM Generasi Program: Interim Impact Evaluation Report 101
Annex
Tab
le 3
2. R
esul
ts fo
r m
ain
indi
cato
rs, E
ast
Nus
a Te
ngga
ra (
split
by
per-
capi
ta c
onsu
mpt
ion
quin
tile
, mod
el 2
)
Indi
cato
rC
ontr
ol
mea
n
Gen
eras
i Ver
si
B b
otto
m 2
qu
inti
les
Gen
eras
i Ver
si B
to
p 3
quin
tile
s ad
diti
onal
eff
ect
Gen
eras
i V
ersi
B to
p 3
quin
tile
s to
tal
Gen
eras
i Ver
si
A b
otto
m 2
qu
inti
les
Gen
eras
i Ver
si A
to
p 3
quin
tile
s ad
diti
onal
eff
ect
Gen
eras
i V
ersi
A to
p 3
quin
tile
s to
tal
Num
ber
obse
rvat
ions
(1)
(2)
(3)
(4)
(5)
(6)
(7)
(8)
(9)
Mai
n 12
indi
cato
rsN
umbe
r pr
enat
al v
isit
s6.
783
7.52
9-1
.476
5*-0
.741
-2.2
170.
656
-0.5
810.
075
234
(0.2
56)
(0.5
51)
(0.8
76)
(1.8
19)
(1.5
53)
(0.8
83)
(1.7
37)
(1.2
49)
Del
iver
y by
trai
ned
mid
wife
0.42
30.
618
-0.2
869*
**0.
4061
**0.
119
0.15
7-0
.371
4*-0
.215
178
(0.0
30)
(0.0
66)
(0.1
04)
(0.1
82)
(0.1
46)
(0.0
97)
(0.2
00)
(0.1
86)
Num
ber
of p
ostn
atal
vis
its
1.42
51.
891
-1.1
159*
*0.
568
-0.5
481.
1966
**-0
.206
0.99
117
8(0
.129
)(0
.369
)(0
.503
)(0
.755
)(0
.791
)(0
.490
)(0
.976
)(0
.865
)Ir
on ta
blet
sac
hets
1.66
31.
754
-0.4
040.
637
0.23
30.
4194
**-0
.612
-0.1
9222
8(0
.074
)(0
.180
)(0
.269
)(0
.459
)(0
.393
)(0
.199
)(0
.469
)(0
.432
)Pe
rcen
t of i
mm
uniz
atio
n0.
546
0.68
7-0
.082
0.28
62**
*0.
2039
***
0.07
90.
057
0.13
62**
263
(0.0
21)
(0.0
40)
(0.0
61)
(0.0
90)
(0.0
75)
(0.0
69)
(0.1
03)
(0.0
68)
Num
ber
of w
eigh
t che
cks
2.23
62.
623
-0.0
420.
180
0.13
7-0
.044
0.05
30.
009
455
(0.0
53)
(0.0
72)
(0.1
83)
(0.3
35)
(0.2
66)
(0.1
93)
(0.2
98)
(0.2
32)
Num
ber
Vit
amin
A
supp
lem
ents
1.59
41.
797
-0.1
880.
388
0.20
1-0
.189
0.18
0-0
.010
218
(0.0
73)
(0.1
47)
(0.2
42)
(0.3
49)
(0.2
31)
(0.1
89)
(0.3
80)
(0.2
69)
Perc
ent m
alno
uris
hed
0.25
70.
395
-0.0
05-0
.095
-0.1
01-0
.026
-0.0
14-0
.040
447
(0.0
21)
(0.0
43)
(0.0
60)
(0.1
10)
(0.0
87)
(0.0
51)
(0.0
94)
(0.0
83)
Age
7–1
2 gr
oss
enro
llmen
t0.
930
0.96
50.
005
-0.0
010.
004
0.02
0-0
.013
0.00
870
7(0
.010
)(0
.012
)(0
.019
)(0
.027
)(0
.018
)(0
.018
)(0
.023
)(0
.017
)A
ge 1
3–15
gro
ss e
nrol
lmen
t0.
816
0.87
4-0
.040
-0.1
74-0
.214
0*-0
.002
0.23
00.
228
241
(0.0
30)
(0.0
36)
(0.0
49)
(0.1
47)
(0.1
23)
(0.0
53)
(0.1
55)
(0.1
38)
Age
7–1
2 gr
oss
atte
ndan
ce0.
893
0.94
20.
001
0.02
00.
020
0.02
9-0
.029
0.00
070
6(0
.013
)(0
.013
)(0
.020
)(0
.036
)(0
.026
)(0
.019
)(0
.030
)(0
.022
)A
ge 1
3–15
gro
ss a
tten
danc
e0.
774
0.85
3-0
.057
-0.1
99-0
.256
3*0.
026
0.14
80.
174
241
(0.0
36)
(0.0
36)
(0.0
63)
(0.1
69)
(0.1
33)
(0.0
66)
(0.1
79)
(0.1
56)
Ave
rage
sta
ndar
dize
d ef
fect
6.78
3-0
.191
6***
0.15
6-0
.036
0.13
13**
-0.0
050.
127
(0.0
63)
(0.1
32)
(0.1
07)
(0.0
65)
(0.1
40)
(0.1
06)
Ave
rage
sta
ndar
dize
d ef
fect
he
alth
-0.2
549*
**0.
3610
**0.
106
0.15
58*
-0.1
210.
035
(0.0
79)
(0.1
52)
(0.1
24)
(0.0
86)
(0.1
56)
(0.1
07)
Ave
rage
sta
ndar
dize
d ef
fect
ed
ucat
ion
-0.0
65-0
.255
-0.3
197*
0.08
20.
228
0.31
0
(0.0
84)
(0.2
20)
(0.1
77)
(0.0
91)
(0.2
31)
(0.2
11)
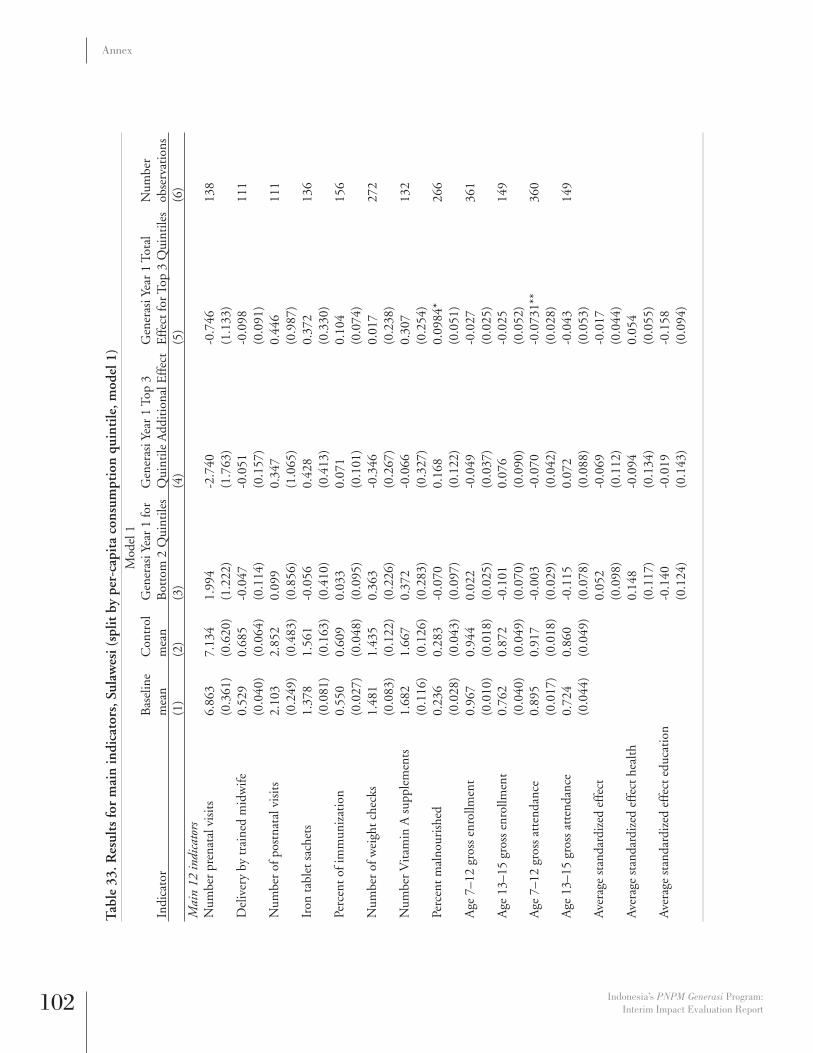
102 Indonesia’s PNPM Generasi Program: Interim Impact Evaluation Report
Annex
Tab
le 3
3. R
esul
ts fo
r m
ain
indi
cato
rs, S
ulaw
esi (
split
by
per-
capi
ta c
onsu
mpt
ion
quin
tile
, mod
el 1
)M
odel
1
Indi
cato
rB
asel
ine
mea
nC
ontr
ol
mea
nG
ener
asi Y
ear
1 fo
r B
otto
m 2
Qui
ntile
sG
ener
asi Y
ear
1 To
p 3
Qui
ntile
Add
itio
nal E
ffec
tG
ener
asi Y
ear
1 To
tal
Eff
ect f
or T
op 3
Qui
ntile
sN
umbe
r ob
serv
atio
ns(1
)(2
)(3
)(4
)(5
)(6
)M
ain
12 in
dica
tors
Num
ber
pren
atal
vis
its
6.86
37.
134
1.99
4-2
.740
-0.7
4613
8(0
.361
)(0
.620
)(1
.222
)(1
.763
)(1
.133
)D
eliv
ery
by tr
aine
d m
idw
ife0.
529
0.68
5-0
.047
-0.0
51-0
.098
111
(0.0
40)
(0.0
64)
(0.1
14)
(0.1
57)
(0.0
91)
Num
ber
of p
ostn
atal
vis
its
2.10
32.
852
0.09
90.
347
0.44
611
1(0
.249
)(0
.483
)(0
.856
)(1
.065
)(0
.987
)Ir
on ta
blet
sac
hets
1.37
81.
561
-0.0
560.
428
0.37
213
6(0
.081
)(0
.163
)(0
.410
)(0
.413
)(0
.330
)Pe
rcen
t of i
mm
uniz
atio
n0.
550
0.60
90.
033
0.07
10.
104
156
(0.0
27)
(0.0
48)
(0.0
95)
(0.1
01)
(0.0
74)
Num
ber
of w
eigh
t che
cks
1.48
11.
435
0.36
3-0
.346
0.01
727
2(0
.083
)(0
.122
)(0
.226
)(0
.267
)(0
.238
)N
umbe
r V
itam
in A
sup
plem
ents
1.68
21.
667
0.37
2-0
.066
0.30
713
2(0
.116
)(0
.126
)(0
.283
)(0
.327
)(0
.254
)Pe
rcen
t mal
nour
ishe
d0.
236
0.28
3-0
.070
0.16
80.
0984
*26
6(0
.028
)(0
.043
)(0
.097
)(0
.122
)(0
.051
)A
ge 7
–12
gros
s en
rollm
ent
0.96
70.
944
0.02
2-0
.049
-0.0
2736
1(0
.010
)(0
.018
)(0
.025
)(0
.037
)(0
.025
)A
ge 1
3–15
gro
ss e
nrol
lmen
t0.
762
0.87
2-0
.101
0.07
6-0
.025
149
(0.0
40)
(0.0
49)
(0.0
70)
(0.0
90)
(0.0
52)
Age
7–1
2 gr
oss
atte
ndan
ce0.
895
0.91
7-0
.003
-0.0
70-0
.073
1**
360
(0.0
17)
(0.0
18)
(0.0
29)
(0.0
42)
(0.0
28)
Age
13–
15 g
ross
att
enda
nce
0.72
40.
860
-0.1
150.
072
-0.0
4314
9(0
.044
)(0
.049
)(0
.078
)(0
.088
)(0
.053
)A
vera
ge s
tand
ardi
zed
effe
ct0.
052
-0.0
69-0
.017
(0.0
98)
(0.1
12)
(0.0
44)
Ave
rage
sta
ndar
dize
d ef
fect
hea
lth0.
148
-0.0
940.
054
(0.1
17)
(0.1
34)
(0.0
55)
Ave
rage
sta
ndar
dize
d ef
fect
edu
cati
on-0
.140
-0.0
19-0
.158
(0.1
24)
(0.1
43)
(0.0
94)

Indonesia’s PNPM Generasi Program: Interim Impact Evaluation Report 103
Annex
Tab
le 3
4. R
esul
ts fo
r m
ain
indi
cato
rs, S
ulaw
esi (
split
by
per-
capi
ta c
onsu
mpt
ion
quin
tile
, mod
el 2
)
Indi
cato
rB
asel
ine
Con
trol
m
ean
Gen
eras
i V
ersi
B
bott
om 2
qu
inti
les
Gen
eras
i V
ersi
B to
p 3
quin
tile
s ad
diti
onal
ef
fect
Gen
eras
i V
ersi
B to
p 3
quin
tile
s to
tal
Gen
eras
i V
ersi
A
bott
om 2
qu
inti
les
Gen
eras
i V
ersi
A to
p 3
quin
tile
s ad
diti
onal
ef
fect
Gen
eras
i V
ersi
A to
p 3
quin
tile
s to
tal
Num
ber
obse
rvat
ions
(1)
(2)
(3)
(4)
(5)
(6)
(7)
(8)
(9)
Mai
n 12
indi
cato
rsN
umbe
r pr
enat
al
6.86
37.
134
0.05
9-0
.175
-0.1
163.
8472
*-5
.455
2*-1
.608
138
(0.3
61)
(0.6
20)
(1.2
05)
(1.8
84)
(1.3
50)
(1.9
97)
(2.9
15)
(1.8
03)
Del
iver
y by
trai
ned
mid
wife
0.52
90.
685
-0.1
340.
033
-0.1
020.
164
-0.1
500.
014
111
(0.0
40)
(0.0
64)
(0.1
39)
(0.1
81)
(0.1
13)
(0.1
48)
(0.1
67)
(0.1
33)
Num
ber
of p
ostn
atal
vi
sits
2.10
32.
852
0.18
6-0
.071
0.11
5-0
.200
1.15
70.
957
111
(0.2
49)
(0.4
83)
(0.9
50)
(1.2
65)
(1.2
29)
(0.8
65)
(1.4
35)
(1.1
80)
Iron
tabl
et s
ache
ts1.
378
1.56
1-0
.371
0.79
97**
0.42
90.
599
-0.7
57-0
.158
136
(0.0
81)
(0.1
63)
(0.4
13)
(0.3
91)
(0.3
94)
(0.5
06)
(0.5
71)
(0.4
96)
Perc
ent o
f im
mun
izat
ion
0.55
00.
609
-0.0
670.
139
0.07
30.
173
-0.0
840.
088
156
(0.0
27)
(0.0
48)
(0.1
37)
(0.1
23)
(0.0
85)
(0.1
50)
(0.1
33)
(0.0
83)
Num
ber
of w
eigh
t 1.
481
1.43
50.
128
-0.0
800.
048
0.47
1-0
.557
-0.0
8727
2(0
.083
)(0
.122
)(0
.240
)(0
.326
)(0
.213
)(0
.311
)(0
.414
)(0
.412
)N
umbe
r V
itam
in A
1.
682
1.66
70.
175
0.30
70.
4810
*0.
263
-0.8
16-0
.554
132
(0.1
16)
(0.1
26)
(0.3
96)
(0.4
67)
(0.2
79)
(0.5
08)
(0.5
41)
(0.3
53)
Perc
ent
0.23
60.
283
0.04
50.
029
0.07
4-0
.220
0**
0.28
70.
067
266
(0.0
28)
(0.0
43)
(0.0
92)
(0.1
39)
(0.0
78)
(0.1
04)
(0.1
70)
(0.1
17)
Age
7–1
2 gr
oss
0.96
70.
944
0.03
80*
-0.0
692*
*-0
.031
-0.0
340.
041
0.00
736
1(0
.010
)(0
.018
)(0
.021
)(0
.026
)(0
.021
)(0
.039
)(0
.052
)(0
.040
)A
ge 1
3–15
gro
ss
enro
llmen
t0.
762
0.87
2-0
.192
5**
0.16
9-0
.023
0.21
29**
*-0
.144
0.06
914
9(0
.040
)(0
.049
)(0
.077
)(0
.124
)(0
.066
)(0
.072
)(0
.127
)(0
.074
)A
ge 7
–12
gros
s 0.
895
0.91
70.
004
-0.0
843*
-0.0
801*
*-0
.014
0.02
80.
014
360
(0.0
17)
(0.0
18)
(0.0
30)
(0.0
46)
(0.0
33)
(0.0
45)
(0.0
64)
(0.0
45)
Age
13–
15 g
ross
at
tend
ance
0.72
40.
860
-0.2
257*
**0.
164
-0.0
620.
2619
***
-0.1
280.
1337
*14
9(0
.044
)(0
.049
)(0
.076
)(0
.111
)(0
.062
)(0
.068
)(0
.110
)(0
.072
)A
vera
ge s
tand
ardi
zed
-0.1
290.
125
-0.0
050.
3554
***
-0.3
569*
*-0
.002
(0.1
11)
(0.1
29)
(0.0
55)
(0.1
23)
(0.1
48)
(0.0
82)
Ave
rage
sta
ndar
dize
d ef
fect
hea
lth-0
.061
0.14
60.
085
0.38
24**
-0.4
714*
**-0
.089
(0.1
42)
(0.1
41)
(0.0
69)
(0.1
58)
(0.1
64)
(0.0
98)
Ave
rage
sta
ndar
dize
d ef
fect
edu
cati
on-0
.265
4**
0.08
2-0
.183
0.30
13**
-0.1
280.
174
(0.1
24)
(0.1
91)
(0.1
12)
(0.1
37)
(0.2
31)
(0.1
69)
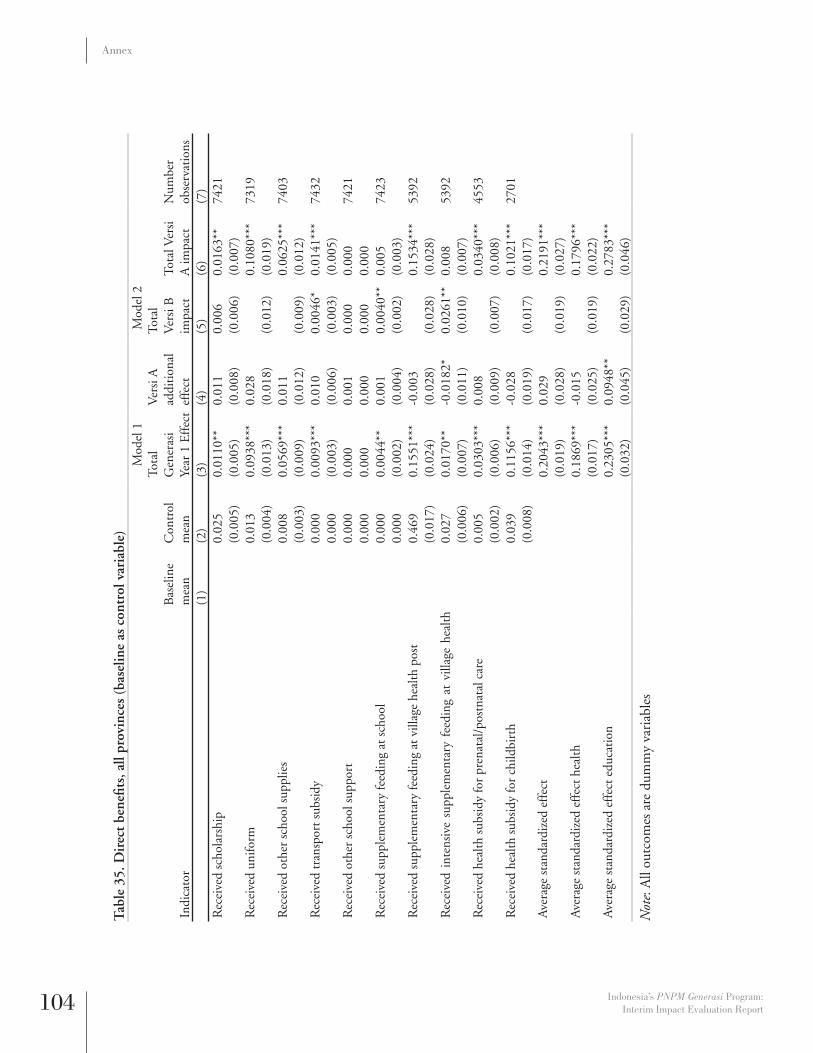
104 Indonesia’s PNPM Generasi Program: Interim Impact Evaluation Report
Annex
Tab
le 3
5. D
irec
t be
nefi t
s, a
ll pr
ovin
ces
(bas
elin
e as
con
trol
var
iabl
e)
Mod
el 1
Mod
el 2
Indi
cato
rB
asel
ine
mea
nC
ontr
ol
mea
n
Tota
l G
ener
asi
Year
1 E
ffec
t
Ver
si A
ad
diti
onal
ef
fect
Tota
l V
ersi
B
impa
ctTo
tal V
ersi
A
impa
ctN
umbe
r ob
serv
atio
ns(1
)(2
)(3
)(4
)(5
)(6
)(7
)R
ecei
ved
scho
lars
hip
0.02
50.
0110
**0.
011
0.00
60.
0163
**74
21(0
.005
)(0
.005
)(0
.008
)(0
.006
)(0
.007
)R
ecei
ved
unifo
rm0.
013
0.09
38**
*0.
028
0.10
80**
*73
19(0
.004
)(0
.013
)(0
.018
)(0
.012
)(0
.019
)R
ecei
ved
othe
r sc
hool
sup
plie
s0.
008
0.05
69**
*0.
011
0.06
25**
*74
03(0
.003
)(0
.009
)(0
.012
)(0
.009
)(0
.012
)R
ecei
ved
tran
spor
t sub
sidy
0.00
00.
0093
***
0.01
00.
0046
*0.
0141
***
7432
0.00
0 (0
.003
)(0
.006
)(0
.003
)(0
.005
)R
ecei
ved
othe
r sc
hool
sup
port
0.00
00.
000
0.00
10.
000
0.00
074
210.
000
0.00
0 0.
000
0.00
0 0.
000
Rec
eive
d su
pple
men
tary
feed
ing
at s
choo
l0.
000
0.00
44**
0.00
10.
0040
**0.
005
7423
0.00
0 (0
.002
)(0
.004
)(0
.002
)(0
.003
)R
ecei
ved
supp
lem
enta
ry fe
edin
g at
vill
age
heal
th p
ost
0.46
90.
1551
***
-0.0
030.
1534
***
5392
(0.0
17)
(0.0
24)
(0.0
28)
(0.0
28)
(0.0
28)
Rec
eive
d in
tens
ive
supp
lem
enta
ry f
eedi
ng a
t vi
llage
hea
lth
0.02
70.
0170
**-0
.018
2*0.
0261
**0.
008
5392
(0.0
06)
(0.0
07)
(0.0
11)
(0.0
10)
(0.0
07)
Rec
eive
d he
alth
sub
sidy
for
pren
atal
/pos
tnat
al c
are
0.00
50.
0303
***
0.00
80.
0340
***
4553
(0.0
02)
(0.0
06)
(0.0
09)
(0.0
07)
(0.0
08)
Rec
eive
d he
alth
sub
sidy
for
child
birt
h0.
039
0.11
56**
*-0
.028
0.10
21**
*27
01(0
.008
)(0
.014
)(0
.019
)(0
.017
)(0
.017
)A
vera
ge s
tand
ardi
zed
effe
ct0.
2043
***
0.02
90.
2191
***
(0.0
19)
(0.0
28)
(0.0
19)
(0.0
27)
Ave
rage
sta
ndar
dize
d ef
fect
hea
lth0.
1869
***
-0.0
150.
1796
***
(0.0
17)
(0.0
25)
(0.0
19)
(0.0
22)
Ave
rage
sta
ndar
dize
d ef
fect
edu
cati
on0.
2305
***
0.09
48**
0.27
83**
*
(0.0
32)
(0.0
45)
(0.0
29)
(0.0
46)
Not
e: A
ll ou
tcom
es a
re d
umm
y va
riab
les

Indonesia’s PNPM Generasi Program: Interim Impact Evaluation Report 105
Annex
Tab
le 3
6. D
irec
t be
nefi t
s, J
ava
(bas
elin
e as
con
trol
var
iabl
e)
Mod
el 1
Mod
el 2
Indi
cato
rB
asel
ine
mea
nC
ontr
ol
mea
n
Tota
l G
ener
asi
Year
1
Eff
ect
Ver
si A
ad
diti
onal
ef
fect
Tota
l Ver
si
B im
pact
Tota
l Ver
si
A im
pact
Num
ber
obse
rvat
ions
(1)
(2)
(3)
(4)
(5)
(6)
(7)
Rec
eive
d sc
hola
rshi
p0.
010
0.01
39**
-0.0
020.
0151
*0.
0128
*45
57(0
.004
)(0
.006
)(0
.010
)(0
.008
)(0
.007
)R
ecei
ved
unifo
rm0.
012
0.06
95**
*0.
0381
*0.
0498
***
0.08
79**
*45
22(0
.004
)(0
.016
)(0
.022
)(0
.013
)(0
.024
)R
ecei
ved
othe
r sc
hool
sup
plie
s0.
010
0.03
91**
*0.
016
0.03
06**
*0.
0470
***
4553
(0.0
04)
(0.0
11)
(0.0
15)
(0.0
10)
(0.0
15)
Rec
eive
d tr
ansp
ort s
ubsi
dy0.
000
0.00
46*
0.00
10.
004
0.00
545
660.
000
(0.0
03)
(0.0
04)
(0.0
03)
(0.0
04)
Rec
eive
d ot
her
scho
ol s
uppo
rt0.
000
0.00
00.
001
0.00
00.
001
4557
0.00
0 0.
000
(0.0
01)
0.00
0 (0
.001
)R
ecei
ved
supp
lem
enta
ry fe
edin
g at
sch
ool
0.00
00.
001
0.00
00.
001
0.00
145
650.
000
(0.0
01)
(0.0
01)
(0.0
01)
(0.0
01)
Rec
eive
d su
pple
men
tary
feed
ing
at v
illag
e he
alth
pos
t0.
604
0.10
76**
*0.
002
0.10
64**
*0.
1088
***
3385
(0.0
22)
(0.0
29)
(0.0
33)
(0.0
35)
(0.0
33)
Rec
eive
d in
tens
ive
supp
lem
enta
ry f
eedi
ng a
t vi
llage
he
alth
pos
t0.
026
0.01
2-0
.006
0.01
50.
010
3385
(0.0
07)
(0.0
09)
(0.0
13)
(0.0
12)
(0.0
10)
Rec
eive
d he
alth
sub
sidy
for
pren
atal
/pos
tnat
al c
are
0.00
70.
0208
**0.
001
0.02
02**
0.02
14**
3023
(0.0
03)
(0.0
08)
(0.0
09)
(0.0
09)
(0.0
10)
Rec
eive
d he
alth
sub
sidy
for
child
birt
h0.
060
0.12
96**
*-0
.027
0.14
41**
*0.
1167
***
1738
(0.0
13)
(0.0
19)
(0.0
26)
(0.0
22)
(0.0
24)
Ave
rage
sta
ndar
dize
d ef
fect
0.17
57**
*0.
028
0.16
16**
*0.
1891
***
(0.0
26)
(0.0
35)
(0.0
24)
(0.0
36)
Ave
rage
sta
ndar
dize
d ef
fect
hea
lth0.
1521
***
-0.0
090.
1571
***
0.14
78**
*(0
.019
)(0
.024
)(0
.021
)(0
.025
)A
vera
ge s
tand
ardi
zed
effe
ct e
duca
tion
0.21
11**
*0.
083
0.16
84**
*0.
2512
***
(0
.053
)(0
.071
)(0
.045
)(0
.074
)

106 Indonesia’s PNPM Generasi Program: Interim Impact Evaluation Report
Annex
Tab
le 3
7. D
irec
t be
nefi t
s, E
ast
Nus
a Te
ngga
ra (
base
line
as c
ontr
ol v
aria
ble)
M
odel
1M
odel
2
Indi
cato
rB
asel
ine
mea
nC
ontr
ol
mea
nTo
tal G
ener
asi
Year
1 E
ffec
tV
ersi
A
addi
tion
al e
ffec
tTo
tal V
ersi
B
impa
ctTo
tal V
ersi
A
impa
ctN
umbe
r ob
serv
atio
ns(1
)(2
)(3
)(4
)(5
)(6
)(7
)R
ecei
ved
scho
lars
hip
0.07
00.
002
0.02
2-0
.009
0.01
418
57(0
.016
)(0
.013
)(0
.015
)(0
.012
)(0
.017
)R
ecei
ved
unifo
rm0.
021
0.13
29**
*0.
014
0.12
60**
*0.
1404
***
1803
(0.0
09)
(0.0
27)
(0.0
38)
(0.0
25)
(0.0
39)
Rec
eive
d ot
her
scho
ol s
uppl
ies
0.00
40.
0766
***
0.00
60.
0736
***
0.07
99**
*18
48(0
.004
)(0
.016
)(0
.020
)(0
.016
)(0
.022
)R
ecei
ved
tran
spor
t sub
sidy
0.00
00.
0124
*0.
017
0.00
50.
021
1857
0.00
0 (0
.007
)(0
.017
)(0
.006
)(0
.014
)R
ecei
ved
othe
r sc
hool
sup
port
0.00
00.
000
0.00
00.
000
0.00
018
570.
000
0.00
0 0.
000
0.00
0 0.
000
Rec
eive
d su
pple
men
tary
feed
ing
at s
choo
l0.
000
0.01
48**
*0.
004
0.01
31**
0.01
718
500.
000
(0.0
06)
(0.0
13)
(0.0
06)
(0.0
11)
Rec
eive
d su
pple
men
tary
feed
ing
at v
illag
e he
alth
pos
t0.
349
0.20
85**
*-0
.059
0.23
88**
*0.
1801
***
1250
(0.0
35)
(0.0
47)
(0.0
57)
(0.0
58)
(0.0
52)
Rec
eive
d in
tens
ive
supp
lem
enta
ry
feed
ing
at
villa
ge
0.02
60.
0386
**-0
.048
0**
0.06
34**
0.01
512
50(0
.012
)(0
.018
)(0
.022
)(0
.025
)(0
.013
)R
ecei
ved
heal
th s
ubsi
dy fo
r pr
enat
al/p
ostn
atal
car
e0.
006
0.04
62**
*0.
037
0.02
79*
0.06
47**
*93
1(0
.006
)(0
.014
)(0
.024
)(0
.014
)(0
.022
)R
ecei
ved
heal
th s
ubsi
dy fo
r ch
ildbi
rth
0.00
00.
0633
***
0.02
50.
0499
*0.
0746
***
594
0.00
0 (0
.020
)(0
.025
)(0
.026
)(0
.021
)A
vera
ge s
tand
ardi
zed
effe
ct0.
2514
***
0.03
90.
2327
***
0.27
21**
*(0
.036
)(0
.058
)(0
.037
)(0
.054
)A
vera
ge s
tand
ardi
zed
effe
ct h
ealth
0.27
01**
*0.
004
0.26
87**
*0.
2722
***
(0.0
41)
(0.0
62)
(0.0
47)
(0.0
56)
Ave
rage
sta
ndar
dize
d ef
fect
edu
cati
on0.
2280
***
0.08
40.
1878
***
0.27
19**
*
(0.0
47)
(0.0
70)
(0.0
43)
(0.0
70)

Indonesia’s PNPM Generasi Program: Interim Impact Evaluation Report 107
Annex
Tab
le 3
8. D
irec
t be
nefi t
s, S
ulaw
esi /
Gor
onta
lo (
base
line
as c
ontr
ol v
aria
ble)
M
odel
1M
odel
2
Indi
cato
rB
asel
ine
mea
nC
ontr
ol
mea
n
Tota
l G
ener
asi
Year
1
Eff
ect
Ver
si A
ad
diti
onal
ef
fect
Tota
l Ver
si B
im
pact
Tota
l Ver
si
A im
pact
Num
ber
obse
rvat
ions
(1)
(2)
(3)
(4)
(5)
(6)
(7)
Rec
eive
d sc
hola
rshi
p0.
015
0.01
50.
0428
**-0
.004
0.03
88**
1007
(0.0
08)
(0.0
12)
(0.0
20)
(0.0
09)
(0.0
18)
Rec
eive
d un
iform
0.01
00.
1180
***
0.02
30.
1079
***
0.13
05**
*99
4(0
.007
)(0
.029
)(0
.043
)(0
.030
)(0
.041
)R
ecei
ved
othe
r sc
hool
sup
plie
s0.
005
0.09
08**
*0.
011
0.08
57**
*0.
0971
**10
02(0
.005
)(0
.029
)(0
.041
)(0
.026
)(0
.044
)R
ecei
ved
tran
spor
t sub
sidy
0.00
00.
0213
**0.
0358
**0.
005
0.04
10**
*10
090.
000
(0.0
09)
(0.0
15)
(0.0
05)
(0.0
14)
Rec
eive
d ot
her
scho
ol s
uppo
rt0.
000
0.00
00.
000
0.00
00.
000
1007
0.00
0 0.
000
0.00
0 0.
000
0.00
0 R
ecei
ved
supp
lem
enta
ry fe
edin
g at
sch
ool
0.00
00.
000
0.00
00.
000
0.00
010
080.
000
0.00
0 0.
000
0.00
0 0.
000
Rec
eive
d su
pple
men
tary
feed
ing
at v
illag
e he
alth
pos
t0.
204
0.23
85**
*0.
123
0.18
20**
*0.
3053
***
757
(0.0
31)
(0.0
62)
(0.0
81)
(0.0
64)
(0.0
78)
Rec
eive
d in
tens
ive
supp
lem
enta
ry f
eedi
ng a
t vi
llage
hea
lth
0.03
00.
000
-0.0
030.
001
-0.0
0275
7(0
.013
)(0
.009
)(0
.012
)(0
.012
)(0
.009
)R
ecei
ved
heal
th s
ubsi
dy fo
r pr
enat
al/p
ostn
atal
car
e0.
000
0.04
61**
*-0
.021
0.05
56**
*0.
0349
***
599
0.00
0 (0
.012
)(0
.020
)(0
.017
)(0
.012
)R
ecei
ved
heal
th s
ubsi
dy fo
r ch
ildbi
rth
0.01
70.
1463
***
-0.1
483*
**0.
2108
***
0.06
25**
*36
9(0
.012
)(0
.034
)(0
.043
)(0
.039
)(0
.022
)A
vera
ge s
tand
ardi
zed
effe
ct0.
3295
***
0.03
20.
3138
***
0.34
60**
*(0
.050
)(0
.071
)(0
.060
)(0
.062
)A
vera
ge s
tand
ardi
zed
effe
ct h
ealth
0.35
16**
*-0
.126
0.40
56**
*0.
2802
***
(0.0
57)
(0.0
84)
(0.0
82)
(0.0
44)
Ave
rage
sta
ndar
dize
d ef
fect
edu
cati
on0.
3073
***
0.18
97**
0.22
21**
*0.
4118
***
(0
.073
)(0
.094
)(0
.063
)(0
.095
)

108 Indonesia’s PNPM Generasi Program: Interim Impact Evaluation Report
Annex
Tab
le 3
9. R
esul
ts fo
r se
rvic
e pr
ovid
er q
uant
itie
s, a
ll pr
ovin
ces
(bas
elin
e as
con
trol
var
iabl
e)M
odel
1M
odel
2
Indi
cato
rB
asel
ine
mea
nC
ontr
ol
mea
n
Tota
lG
ener
asi Y
ear
1 E
ffec
t
Ver
si A
ad
diti
onal
ef
fect
Tota
lV
ersi
B
impa
ctTo
tal
Ver
si A
impa
ctN
umbe
r ob
serv
atio
ns(1
)(2
)(3
)(4
)(5
)(6
)(7
)M
idw
ife/P
olin
des
in v
illag
e0.
783
0.80
6-0
.010
0.02
1-0
.021
0.00
020
26(0
.009
)(0
.016
)(0
.019
)(0
.023
)(0
.023
)(0
.021
)N
umbe
r of
act
ive
villa
ge h
ealth
pos
ts in
vill
age
4.51
64.
222
-0.0
43-0
.098
0.00
6-0
.092
2027
(0.0
78)
(0.1
06)
(0.1
19)
(0.1
25)
(0.1
44)
(0.1
24)
SD lo
cate
d in
vill
age
0.99
10.
992
0.00
3-0
.001
0.00
40.
002
2027
(0.0
02)
(0.0
04)
(0.0
03)
(0.0
04)
(0.0
04)
(0.0
03)
SMP
loca
ted
in v
illag
e0.
457
0.46
50.
023
-0.0
060.
026
0.01
920
27(0
.011
)(0
.020
)(0
.016
)(0
.019
)(0
.019
)(0
.018
)N
umbe
r of
teac
hers
at S
D (
incl
udes
gur
u ho
nor)
.10
.445
0.17
70.
263
0.04
70.
310
1056
(.)
(0.1
72)
(0.2
50)
(0.3
46)
(0.2
81)
(0.3
25)
Num
ber
of te
ache
rs a
t SM
P (i
nclu
des
guru
hon
or)
22.5
6821
.949
0.30
4-0
.442
0*0.
5208
**0.
079
745
(0.4
30)
(0.7
04)
(0.2
13)
(0.2
54)
(0.2
48)
(0.2
50)
Ave
rage
sta
ndar
dize
d ef
fect
0.02
00.
005
0.01
70.
023
(0.0
20)
(0.0
25)
(0.0
24)
(0.0
23)
Ave
rage
sta
ndar
dize
d ef
fect
hea
lth-0
.021
0.00
8-0
.025
-0.0
17(0
.032
)(0
.035
)(0
.038
)(0
.035
)A
vera
ge s
tand
ardi
zed
effe
ct e
duca
tion
0.04
04*
0.00
40.
039
0.04
2(0
.023
)(0
.030
)(0
.028
)(0
.028
)

Indonesia’s PNPM Generasi Program: Interim Impact Evaluation Report 109
Annex
Tab
le 4
0. R
esul
ts fo
r se
rvic
e pr
ovid
er q
uant
itie
s, J
ava
(bas
elin
e as
con
trol
var
iabl
e)M
odel
1M
odel
2
Indi
cato
rB
asel
ine
mea
nC
ontr
ol
mea
n
Tota
lG
ener
asi Y
ear
1 E
ffec
tV
ersi
A
addi
tion
al e
ffec
tTo
tal
Ver
si B
impa
ctTo
tal
Ver
si A
impa
ctN
umbe
r ob
serv
atio
ns(1
)(2
)(3
)(4
)(5
)(6
)(7
)M
idw
ife/P
olin
des
in v
illag
e0.
870
0.89
40.
011
-0.0
300.
026
-0.0
0313
59(0
.009
)(0
.015
)(0
.019
)(0
.024
)(0
.024
)(0
.020
)N
umbe
r of
act
ive
villa
ge h
ealth
pos
ts in
vill
age
5.40
55.
198
-0.0
94-0
.108
-0.0
39-0
.147
1360
(0.1
03)
(0.1
36)
(0.1
81)
(0.1
90)
(0.2
23)
(0.1
83)
SD lo
cate
d in
vill
age
0.99
91.
000
-0.0
020.
003
-0.0
040.
000
1360
(0.0
01)
0.00
0 (0
.002
)(0
.003
)(0
.003
)(0
.001
)SM
P lo
cate
d in
vill
age
0.51
30.
499
0.03
59*
-0.0
150.
0439
*0.
029
1360
(0.0
14)
(0.0
25)
(0.0
20)
(0.0
23)
(0.0
24)
(0.0
22)
Num
ber
of te
ache
rs a
t SD
(in
clud
es g
uru
hono
r).
10.4
810.
495
0.31
90.
334
0.65
371
6(.
)(0
.204
)(0
.307
)(0
.394
)(0
.307
)(0
.412
)N
umbe
r of
teac
hers
at S
MP
(inc
lude
s gu
ru h
onor
)25
.031
24.5
100.
331
-0.4
610.
5645
*0.
103
519
(0.5
33)
(0.8
98)
(0.2
59)
(0.3
34)
(0.3
18)
(0.3
00)
Ave
rage
sta
ndar
dize
d ef
fect
0.05
40*
-0.0
200.
0645
**0.
045
(0.0
29)
(0.0
33)
(0.0
31)
(0.0
35)
Ave
rage
sta
ndar
dize
d ef
fect
hea
lth0.
001
-0.0
680.
035
-0.0
32(0
.044
)(0
.050
)(0
.054
)(0
.047
)A
vera
ge s
tand
ardi
zed
effe
ct e
duca
tion
0.08
96**
0.01
20.
0840
**0.
0957
**(0
.036
)(0
.044
)(0
.037
)(0
.046
)

110 Indonesia’s PNPM Generasi Program: Interim Impact Evaluation Report
Annex
Tab
le 4
1. R
esul
ts fo
r se
rvic
e pr
ovid
er q
uant
itie
s, E
ast
Nus
a Te
ngga
ra (
base
line
as c
ontr
ol v
aria
ble)
Mod
el 1
Mod
el 2
Indi
cato
rB
asel
ine
mea
nC
ontr
ol
mea
n
Tota
lG
ener
asi
Year
1 E
ffec
tV
ersi
A
addi
tion
al e
ffec
tTo
tal
Ver
si B
impa
ct
Tota
lV
ersi
A
impa
ctN
umbe
r ob
serv
atio
ns(1
)(2
)(3
)(4
)(5
)(6
)(7
)M
idw
ife/P
olin
des
in v
illag
e0.
582
0.65
8-0
.068
0.05
4-0
.095
1**
-0.0
4140
2(0
.025
)(0
.044
)(0
.043
)(0
.045
)(0
.045
)(0
.051
)N
umbe
r of
act
ive
villa
ge h
ealth
pos
ts in
vill
age
3.02
02.
958
0.09
1-0
.005
0.09
30.
088
402
(0.0
83)
(0.1
34)
(0.1
09)
(0.0
91)
(0.1
13)
(0.1
23)
SD lo
cate
d in
vill
age
0.97
30.
958
0.02
15*
-0.0
160.
0291
*0.
013
402
(0.0
08)
(0.0
18)
(0.0
13)
(0.0
11)
(0.0
15)
(0.0
12)
SMP
loca
ted
in v
illag
e0.
221
0.23
30.
036
0.02
20.
026
0.04
840
2(0
.021
)(0
.039
)(0
.029
)(0
.043
)(0
.040
)(0
.032
)N
umbe
r of
teac
hers
at S
D (
incl
udes
gur
u ho
nor)
.10
.850
-0.9
060.
000
-0.9
06-0
.906
204
(.)
(0.5
24)
(0.5
81)
(0.8
24)
(0.7
76)
(0.6
43)
Num
ber
of te
ache
rs a
t SM
P (i
nclu
des
guru
hon
or)
17.5
0818
.868
0.00
3-0
.473
0.22
7-0
.246
125
(0.7
39)
(1.1
95)
(0.4
60)
(0.4
53)
(0.5
14)
(0.4
98)
Ave
rage
sta
ndar
dize
d ef
fect
-0.0
180.
003
-0.0
21-0
.018
(0.0
43)
(0.0
53)
(0.0
56)
(0.0
44)
Ave
rage
sta
ndar
dize
d ef
fect
hea
lth-0
.040
0.05
5-0
.068
-0.0
13(0
.058
)(0
.054
)(0
.059
)(0
.068
)A
vera
ge s
tand
ardi
zed
effe
ct e
duca
tion
-0.0
08-0
.024
0.00
3-0
.020
(0.0
51)
(0.0
65)
(0.0
69)
(0.0
49)

Indonesia’s PNPM Generasi Program: Interim Impact Evaluation Report 111
Annex
Tab
le 4
2. R
esul
ts fo
r se
rvic
e pr
ovid
er q
uant
itie
s, S
ulaw
esi /
Gor
onta
lo (
base
line
as c
ontr
ol v
aria
ble)
Mod
el 1
Mod
el 2
Indi
cato
rB
asel
ine
mea
nC
ontr
ol
mea
n
Tota
lG
ener
asi Y
ear
1 E
ffec
tV
ersi
A
addi
tion
al e
ffec
tTo
tal
Ver
si B
impa
ctTo
tal
Ver
si A
impa
ctN
umbe
r ob
serv
atio
ns(1
)(2
)(3
)(4
)(5
)(6
)(7
)M
idw
ife/P
olin
des
in v
illag
e0.
642
0.64
90.
011
0.16
77*
-0.0
630.
105
265
(0.0
30)
(0.0
46)
(0.0
71)
(0.0
96)
(0.0
78)
(0.0
92)
Num
ber
of a
ctiv
e vi
llage
hea
lth p
osts
in v
illag
e2.
249
2.02
70.
011
-0.2
620.
127
-0.1
3526
5(0
.106
)(0
.124
)(0
.149
)(0
.233
)(0
.179
)(0
.202
)SD
loca
ted
in v
illag
e0.
974
1.00
0-0
.006
0.00
3-0
.008
-0.0
0526
5(0
.010
)0.
000
(0.0
10)
(0.0
14)
(0.0
10)
(0.0
15)
SMP
loca
ted
in v
illag
e0.
528
0.59
5-0
.051
-0.0
26-0
.039
-0.0
6526
5(0
.031
)(0
.047
)(0
.043
)(0
.050
)(0
.035
)(0
.063
)N
umbe
r of
teac
hers
at S
D (
incl
udes
gur
u ho
nor)
.9.
875
0.30
30.
502
0.07
70.
579
136
(.)
(0.3
17)
(0.6
08)
(1.0
03)
(0.7
27)
(0.8
55)
Num
ber
of te
ache
rs a
t SM
P (i
nclu
des
guru
hon
or)
16.2
3015
.405
0.61
60.
319
0.47
50.
794
101
(0.8
49)
(1.2
95)
(0.5
25)
(0.7
50)
(0.5
94)
(0.6
80)
Ave
rage
sta
ndar
dize
d ef
fect
0.02
60.
069
-0.0
050.
064
(0.0
75)
(0.1
23)
(0.0
92)
(0.1
01)
Ave
rage
sta
ndar
dize
d ef
fect
hea
lth0.
016
0.07
5-0
.017
0.05
8(0
.091
)(0
.137
)(0
.107
)(0
.122
)A
vera
ge s
tand
ardi
zed
effe
ct e
duca
tion
0.03
30.
065
0.00
30.
069
(0.0
93)
(0.1
42)
(0.1
06)
(0.1
28)

112 Indonesia’s PNPM Generasi Program: Interim Impact Evaluation Report
Annex
Tab
le 4
3. R
esul
ts fo
r se
rvic
e pr
ovid
er in
puts
, all
prov
ince
s (b
asel
ine
as c
ontr
ol v
aria
ble)
M
odel
1M
odel
2
Indi
cato
rB
asel
ine
mea
nC
ontr
ol
mea
nTo
tal G
ener
asi
Year
1 E
ffec
tV
ersi
A
addi
tion
al e
ffec
tTo
tal V
ersi
B
impa
ctTo
tal V
ersi
A
impa
ctN
umbe
r ob
serv
atio
ns(1
)(2
)(3
)(4
)(5
)(6
)(7
)M
idw
ives
Has
acc
ess
to w
ater
0.71
40.
785
0.02
6-0
.051
0.05
05**
0.00
093
6(0
.018
)(0
.030
)(0
.021
)(0
.031
)(0
.024
)(0
.028
)H
as a
cces
s to
ele
ctri
city
0.95
60.
995
0.00
20.
011
-0.0
040.
007
936
(0.0
08)
(0.0
05)
(0.0
12)
(0.0
19)
(0.0
15)
(0.0
17)
Perc
enta
ge o
f dru
gs in
sto
ck0.
610
0.79
1-0
.017
-0.0
29-0
.003
-0.0
3110
43(0
.010
)(0
.015
)(0
.017
)(0
.023
)(0
.021
)(0
.020
)Pe
rcen
tage
of t
ools
ava
ilabl
e0.
625
0.66
50.
005
0.01
4-0
.002
0.01
210
42Sc
hool
s(0
.010
)(0
.015
)(0
.013
)(0
.017
)(0
.016
)(0
.015
)N
umbe
r of
cla
ssro
oms
(SD
).
5.87
2-0
.089
0.19
9-0
.188
0.01
210
56(.
)(0
.072
)(0
.127
)(0
.164
)(0
.138
)(0
.162
)N
umbe
r of
cla
ssro
oms
(SM
P)8.
644
8.93
10.
117
0.20
90.
014
0.22
474
6(0
.217
)(0
.389
)(0
.230
)(0
.241
)(0
.272
)(0
.245
)C
ondi
tion
of s
choo
l bui
ldin
g (S
D, s
cale
0-1
).
0.86
9-0
.005
-0.0
290.
010
-0.0
1910
51(.
)(0
.011
)(0
.014
)(0
.018
)(0
.015
)(0
.017
)C
ondi
tion
of s
choo
l bui
ldin
g (S
MP,
sca
le 0
-1)
0.90
30.
916
-0.0
020.
002
-0.0
03-0
.001
742
(0.0
06)
(0.0
09)
(0.0
13)
(0.0
15)
(0.0
17)
(0.0
12)
Has
stu
dent
latr
ine
(SD
).
0.79
90.
011
0.01
80.
002
0.02
010
56(.
)(0
.022
)(0
.028
)(0
.037
)(0
.034
)(0
.033
)H
as s
tude
nt la
trin
e (S
MP)
0.92
80.
923
0.01
90.
015
0.01
20.
027
746
(0.0
10)
(0.0
18)
(0.0
20)
(0.0
28)
(0.0
25)
(0.0
23)
Has
stu
dent
latr
ine
wit
h w
ater
(SD
).
0.55
30.
032
-0.0
280.
046
0.01
810
32(.
)(0
.028
)(0
.036
)(0
.047
)(0
.043
)(0
.043
)H
as s
tude
nt la
trin
e w
ith
wat
er (
SMP)
0.66
20.
717
-0.0
530.
006
-0.0
56-0
.050
741
(0.0
18)
(0.0
30)
(0.0
35)
(0.0
48)
(0.0
44)
(0.0
41)
Ave
rage
sta
ndar
dize
d ef
fect
-0.0
02-0
.002
-0.0
01-0
.003
(0.0
27)
(0.0
36)
(0.0
34)
(0.0
31)
Ave
rage
sta
ndar
dize
d ef
fect
hea
lth0.
004
-0.0
320.
019
-0.0
13
(0.0
33)
(0.0
53)
(0.0
43)
(0.0
41)
Ave
rage
sta
ndar
dize
d ef
fect
edu
cati
on-0
.005
0.01
3-0
.012
0.00
2
(0.0
35)
(0.0
45)
(0.0
43)
(0.0
40)

Indonesia’s PNPM Generasi Program: Interim Impact Evaluation Report 113
Annex
Tab
le 4
4. R
esul
ts fo
r se
rvic
e pr
ovid
er in
puts
, Jav
a (b
asel
ine
as c
ontr
ol v
aria
ble)
M
odel
1M
odel
2
Indi
cato
rB
asel
ine
mea
nC
ontr
ol
mea
nTo
tal G
ener
asi
Year
1 E
ffec
tV
ersi
A a
ddit
iona
l ef
fect
Tota
l Ver
si B
im
pact
Tota
l Ver
si A
im
pact
Num
ber
obse
rvat
ions
(1)
(2)
(3)
(4)
(5)
(6)
(7)
Mid
wiv
esH
as a
cces
s to
wat
er0.
788
0.82
60.
0483
**-0
.044
0.07
00**
*0.
027
697
(0.0
19)
(0.0
32)
(0.0
23)
(0.0
33)
(0.0
25)
(0.0
31)
Has
acc
ess
to e
lect
rici
ty0.
998
1.00
0-0
.006
-0.0
03-0
.005
-0.0
0869
7(0
.002
)0.
000
(0.0
11)
(0.0
19)
(0.0
13)
(0.0
16)
Perc
enta
ge o
f dru
gs in
sto
ck0.
618
0.82
2-0
.004
-0.0
170.
004
-0.0
1371
3(0
.011
)(0
.017
)(0
.016
)(0
.022
)(0
.020
)(0
.018
)Pe
rcen
tage
of t
ools
ava
ilabl
e0.
677
0.70
70.
017
0.01
50.
010
0.02
571
2Sc
hool
s(0
.010
)(0
.014
)(0
.013
)(0
.016
)(0
.016
)(0
.015
)N
umbe
r of
cla
ssro
oms
(SD
).
5.76
40.
009
0.26
5-0
.124
0.14
071
6(.
)(0
.079
)(0
.155
)(0
.176
)(0
.139
)(0
.208
)N
umbe
r of
cla
ssro
oms
(SM
P)9.
332
9.54
3-0
.065
0.27
0-0
.202
0.06
852
0(0
.268
)(0
.517
)(0
.182
)(0
.312
)(0
.270
)(0
.206
)C
ondi
tion
of s
choo
l bui
ldin
g (S
D, s
cale
0-1
).
0.87
3-0
.008
-0.0
280.
006
-0.0
2271
4(.
)(0
.013
)(0
.017
)(0
.022
)(0
.020
)(0
.021
)C
ondi
tion
of s
choo
l bui
ldin
g (S
MP,
sca
le 0
-1)
0.90
30.
906
0.01
20.
007
0.00
80.
015
517
(0.0
07)
(0.0
12)
(0.0
15)
(0.0
19)
(0.0
20)
(0.0
14)
Has
stu
dent
latr
ine
(SD
).
0.79
30.
026
-0.0
020.
027
0.02
671
6(.
)(0
.028
)(0
.034
)(0
.043
)(0
.039
)(0
.041
)H
as s
tude
nt la
trin
e (S
MP)
0.93
20.
935
0.00
90.
012
0.00
30.
015
520
(0.0
11)
(0.0
20)
(0.0
24)
(0.0
37)
(0.0
33)
(0.0
28)
Has
stu
dent
latr
ine
wit
h w
ater
(SD
).
0.61
10.
051
-0.0
230.
062
0.03
970
2(.
)(0
.034
)(0
.042
)(0
.052
)(0
.049
)(0
.051
)H
as s
tude
nt la
trin
e w
ith
wat
er (
SMP)
0.74
30.
787
-0.0
510.
025
-0.0
63-0
.038
516
(0.0
20)
(0.0
34)
(0.0
42)
(0.0
57)
(0.0
52)
(0.0
49)
Ave
rage
sta
ndar
dize
d ef
fect
0.02
00.
007
0.01
70.
023
(0.0
33)
(0.0
41)
(0.0
39)
(0.0
38)
Ave
rage
sta
ndar
dize
d ef
fect
hea
lth0.
032
-0.0
370.
051
0.01
3
(0.0
39)
(0.0
61)
(0.0
49)
(0.0
49)
Ave
rage
sta
ndar
dize
d ef
fect
edu
cati
on0.
014
0.02
90.
000
0.02
9
(0.0
48)
(0.0
56)
(0.0
55)
(0.0
56)

114 Indonesia’s PNPM Generasi Program: Interim Impact Evaluation Report
Annex
Tab
le 4
5. R
esul
ts fo
r se
rvic
e pr
ovid
er in
puts
, Eas
t N
usa
Teng
gara
(ba
selin
e as
con
trol
var
iabl
e)
Mod
el 1
Mod
el 2
Indi
cato
rB
asel
ine
mea
nC
ontr
ol
mea
nTo
tal G
ener
asi
Year
1 E
ffec
tV
ersi
A
addi
tion
al e
ffec
tTo
tal V
ersi
B
impa
ctTo
tal V
ersi
A
impa
ctN
umbe
r ob
serv
atio
ns(1
)(2
)(3
)(4
)(5
)(6
)(7
)M
idw
ives
Has
acc
ess
to w
ater
0.35
40.
455
-0.0
23-0
.039
-0.0
07-0
.046
126
(0.0
45)
(0.1
09)
(0.0
73)
(0.1
37)
(0.0
93)
(0.1
07)
Has
acc
ess
to e
lect
rici
ty0.
788
0.95
50.
018
0.15
82*
-0.0
540.
1040
*12
6(0
.039
)(0
.046
)(0
.048
)(0
.081
)(0
.064
)(0
.057
)Pe
rcen
tage
of d
rugs
in s
tock
0.57
10.
661
-0.0
50-0
.105
0.00
0-0
.106
204
(0.0
34)
(0.0
52)
(0.0
58)
(0.0
71)
(0.0
66)
(0.0
70)
Perc
enta
ge o
f too
ls a
vaila
ble
0.42
40.
455
-0.0
250.
005
-0.0
27-0
.022
204
Scho
ols
(0.0
30)
(0.0
49)
(0.0
38)
(0.0
49)
(0.0
47)
(0.0
43)
Num
ber
of c
lass
room
s (S
D)
.6.
450
-0.2
92-0
.298
-0.1
44-0
.442
204
(.)
(0.2
16)
(0.3
28)
(0.4
51)
(0.4
38)
(0.3
53)
Num
ber
of c
lass
room
s (S
MP)
7.59
78.
842
0.05
4-0
.058
0.08
00.
022
125
(0.4
98)
(0.7
43)
(0.4
58)
(0.5
58)
(0.5
89)
(0.4
59)
Con
diti
on o
f sch
ool b
uild
ing
(SD
, sca
le 0
-1)
.0.
795
0.02
7-0
.031
0.04
20.
012
202
(.)
(0.0
28)
(0.0
36)
(0.0
44)
(0.0
35)
(0.0
47)
Con
diti
on o
f sch
ool b
uild
ing
(SM
P, s
cale
0-1
)0.
871
0.90
1-0
.031
-0.0
04-0
.029
-0.0
3312
4(0
.016
)(0
.027
)(0
.038
)(0
.035
)(0
.046
)(0
.036
)H
as s
tude
nt la
trin
e (S
D)
.0.
817
0.01
40.
102
-0.0
360.
066
204
(.)
(0.0
50)
(0.0
68)
(0.0
87)
(0.0
83)
(0.0
74)
Has
stu
dent
latr
ine
(SM
P)0.
952
0.97
4-0
.004
0.07
8-0
.040
0.03
812
5(0
.019
)(0
.026
)(0
.033
)(0
.050
)(0
.048
)(0
.030
)H
as s
tude
nt la
trin
e w
ith
wat
er (
SD)
.0.
362
0.07
9-0
.011
0.08
40.
074
199
(.)
(0.0
64)
(0.0
96)
(0.1
21)
(0.1
09)
(0.1
18)
Has
stu
dent
latr
ine
wit
h w
ater
(SM
P)0.
483
0.57
9-0
.084
-0.0
22-0
.074
-0.0
9612
4(0
.046
)(0
.081
)(0
.093
)(0
.103
)(0
.097
)(0
.119
)
Ave
rage
sta
ndar
dize
d ef
fect
-0.0
400.
029
-0.0
53-0
.024
(0.0
75)
(0.1
02)
(0.0
99)
(0.0
80)
Ave
rage
sta
ndar
dize
d ef
fect
hea
lth-0
.064
0.00
7-0
.068
-0.0
60
(0.0
94)
(0.1
62)
(0.1
29)
(0.1
20)
Ave
rage
sta
ndar
dize
d ef
fect
edu
cati
on-0
.027
0.04
0-0
.046
-0.0
06
(0.0
81)
(0.1
15)
(0.1
11)
(0.0
86)

Indonesia’s PNPM Generasi Program: Interim Impact Evaluation Report 115
Annex
Tab
le 4
6. R
esul
ts fo
r se
rvic
e pr
ovid
er in
puts
, Sul
awes
i /G
oron
talo
(ba
selin
e as
con
trol
var
iabl
e)
M
odel
1M
odel
2
Indi
cato
rB
asel
ine
mea
nC
ontr
ol
mea
nTo
tal G
ener
asi
Year
1 E
ffec
tV
ersi
A
addi
tion
al e
ffec
tTo
tal V
ersi
B
impa
ctTo
tal V
ersi
A
impa
ctN
umbe
r ob
serv
atio
ns(1
)(2
)(3
)(4
)(5
)(6
)(7
)M
idw
ives
Has
acc
ess
to w
ater
0.79
80.
829
-0.0
450.
012
-0.0
504*
-0.0
3911
3(0
.046
)(0
.065
)(0
.033
)(0
.050
)(0
.028
)(0
.053
)H
as a
cces
s to
ele
ctri
city
0.94
91.
000
0.02
8-0
.078
0.06
22*
-0.0
1611
3(0
.025
)0.
000
(0.0
29)
(0.0
55)
(0.0
36)
(0.0
43)
Perc
enta
ge o
f dru
gs in
sto
ck0.
620
0.78
1-0
.025
0.07
1-0
.055
0.01
712
6(0
.026
)(0
.032
)(0
.042
)(0
.063
)(0
.048
)(0
.055
)Pe
rcen
tage
of t
ools
ava
ilabl
e0.
608
0.67
8-0
.022
0.01
8-0
.031
-0.0
1212
6Sc
hool
s(0
.029
)(0
.039
)(0
.044
)(0
.065
)(0
.059
)(0
.049
)N
umbe
r of
cla
ssro
oms
(SD
).
5.66
1-0
.231
0.86
53**
*-0
.621
8**
0.24
413
6(.
)(0
.173
)(0
.261
)(0
.293
)(0
.273
)(0
.269
)N
umbe
r of
cla
ssro
oms
(SM
P)6.
420
6.78
6-0
.029
0.56
9-0
.269
0.30
010
1(0
.442
)(0
.737
)(0
.358
)(0
.350
)(0
.356
)(0
.436
)C
ondi
tion
of s
choo
l bui
ldin
g (S
D, s
cale
0-1
).
0.93
0-0
.033
-0.0
32-0
.018
-0.0
500*
*13
5(.
)(0
.017
)(0
.020
)(0
.034
)(0
.028
)(0
.024
)C
ondi
tion
of s
choo
l bui
ldin
g (S
MP,
sca
le 0
-1)
0.94
30.
967
0.00
0-0
.003
0.00
1-0
.002
101
(0.0
13)
(0.0
12)
(0.0
16)
(0.0
19)
(0.0
14)
(0.0
24)
Has
stu
dent
latr
ine
(SD
).
0.80
4-0
.058
-0.0
57-0
.032
-0.0
8913
6(.
)(0
.054
)(0
.069
)(0
.113
)(0
.098
)(0
.076
)H
as s
tude
nt la
trin
e (S
MP)
0.88
00.
833
0.09
06*
-0.0
380.
1061
**0.
068
101
(0.0
33)
(0.0
58)
(0.0
48)
(0.0
46)
(0.0
47)
(0.0
60)
Has
stu
dent
latr
ine
wit
h w
ater
(SD
).
0.52
7-0
.112
-0.1
02-0
.065
-0.1
670*
131
(.)
(0.0
68)
(0.0
93)
(0.1
20)
(0.1
25)
(0.0
85)
Has
stu
dent
latr
ine
wit
h w
ater
(SM
P)0.
469
0.59
50.
001
-0.0
050.
004
-0.0
0210
1(0
.051
)(0
.077
)(0
.087
)(0
.164
)(0
.130
)(0
.104
)
Ave
rage
sta
ndar
dize
d ef
fect
-0.0
650.
007
-0.0
68-0
.060
(0.0
47)
(0.0
72)
(0.0
63)
(0.0
53)
Ave
rage
sta
ndar
dize
d ef
fect
hea
lth-0
.051
0.01
6-0
.057
-0.0
41
(0.0
74)
(0.0
94)
(0.0
86)
(0.0
89)
Ave
rage
sta
ndar
dize
d ef
fect
edu
cati
on-0
.072
0.00
3-0
.073
-0.0
70
(0.0
64)
(0.1
02)
(0.0
94)
(0.0
65)

116 Indonesia’s PNPM Generasi Program: Interim Impact Evaluation Report
Annex
Tab
le 4
7. R
esul
ts fo
r se
rvic
e pr
ovid
er e
ffor
ts, a
ll pr
ovin
ces
(bas
elin
e as
con
trol
var
iabl
e)
M
odel
1M
odel
2
Indi
cato
rB
asel
ine
mea
nC
ontr
ol
mea
n
Tota
l G
ener
asi
Year
1 E
ffec
t
Ver
si A
ad
diti
onal
ef
fect
Tota
l Ver
si
B im
pact
Tota
l Ver
si
A im
pact
Num
ber
obse
rvat
ions
(1)
(2)
(3)
(4)
(5)
(6)
(7)
Mid
wiv
esH
ours
spe
nt in
out
reac
h ov
er p
ast 3
day
s3.
200
2.49
80.
339
0.88
38**
-0.0
980.
7858
*10
43(0
.175
)(0
.273
)(0
.308
)(0
.423
)(0
.331
)(0
.409
)H
ours
spe
nt p
rovi
ding
pub
lic s
ervi
ces
over
pas
t 3 d
ays
13.6
3512
.389
-0.3
701.
7021
**-1
.210
7**
0.49
110
43(0
.389
)(0
.535
)(0
.486
)(0
.721
)(0
.596
)(0
.610
)H
ours
spe
nt p
rovi
ding
pri
vate
ser
vice
s ov
er p
ast 3
day
s10
.693
9.99
50.
012
0.56
2-0
.266
0.29
610
43(0
.482
)(0
.769
)(0
.707
)(0
.893
)(0
.830
)(0
.842
)To
tal h
ours
spe
nt w
orki
ng o
ver
past
3 d
ays
27.5
7324
.882
-0.1
023.
1132
***
-1.6
351.
478
1043
(0.6
07)
(0.9
15)
(0.8
68)
(1.1
56)
(1.0
26)
(1.0
50)
Num
ber
of v
illag
e he
alth
pos
ts a
tten
ded
in p
ast m
onth
4.15
13.
754
0.10
00.
027
0.08
70.
114
1043
(0.1
32)
(0.2
16)
(0.2
18)
(0.3
40)
(0.2
42)
(0.3
08)
Num
ber
of h
ours
mid
wife
spe
nds
per
villa
ge h
ealth
pos
t3.
034
2.72
20.
1878
*-0
.073
0.22
37*
0.15
110
42Te
ache
rs(0
.067
)(0
.115
)(0
.110
)(0
.126
)(0
.124
)(0
.129
)Pe
rcen
t pre
sent
at t
ime
of in
terv
iew
(SD
).
0.86
30.
012
-0.0
070.
016
0.00
810
78(.
)(0
.009
)(0
.013
)(0
.017
)(0
.015
)(0
.016
)Pe
rcen
t pre
sent
at t
ime
of in
terv
iew
(SM
P).
0.88
1-0
.008
0.00
8-0
.012
-0.0
0472
3(.
)(0
.010
)(0
.012
)(0
.014
)(0
.014
)(0
.014
)Pe
rcen
t tea
chin
g at
tim
e of
cla
ss o
bser
vati
on (
SD)
.0.
667
-0.0
290.
029
-0.0
43-0
.014
1077
(.)
(0.0
26)
(0.0
34)
(0.0
43)
(0.0
42)
(0.0
38)
Perc
ent t
each
ing
at ti
me
of c
lass
obs
erva
tion
(SM
P).
0.60
3-0
.056
-0.0
02-0
.056
-0.0
5772
3(.
)(0
.032
)(0
.039
)(0
.048
)(0
.047
)(0
.044
)A
vera
ge s
tand
ardi
zed
effe
ct0.
001
0.07
60**
-0.0
360.
040
(0.0
25)
(0.0
35)
(0.0
30)
(0.0
32)
Ave
rage
sta
ndar
dize
d ef
fect
hea
lth0.
028
0.11
58**
-0.0
290.
0864
*(0
.034
)(0
.048
)(0
.038
)(0
.044
)A
vera
ge s
tand
ardi
zed
effe
ct e
duca
tion
-0.0
390.
016
-0.0
47-0
.031
(0
.040
)(0
.053
)(0
.048
)(0
.048
)

Indonesia’s PNPM Generasi Program: Interim Impact Evaluation Report 117
Annex
Tab
le 4
8. R
esul
ts fo
r se
rvic
e pr
ovid
er e
ffor
ts, J
ava
(bas
elin
e as
con
trol
var
iabl
e)
Mod
el 1
Mod
el 2
Indi
cato
rB
asel
ine
mea
nC
ontr
ol
mea
n
Tota
l G
ener
asi
Year
1 E
ffec
t
Ver
si A
ad
diti
onal
ef
fect
Tota
l Ver
si
B im
pact
Tota
l Ver
si
A im
pact
Num
ber
obse
rvat
ions
(1)
(2)
(3)
(4)
(5)
(6)
(7)
Mid
wiv
esH
ours
spe
nt in
out
reac
h ov
er p
ast 3
day
s3.
132
2.03
50.
8749
***
0.54
00.
6022
*1.
1426
***
713
(0.1
87)
(0.2
83)
(0.3
32)
(0.4
23)
(0.3
46)
(0.4
32)
Hou
rs s
pent
pro
vidi
ng p
ublic
ser
vice
s ov
er p
ast 3
day
s12
.868
12.3
59-0
.430
1.60
39*
-1.2
402*
0.36
471
3(0
.380
)(0
.570
)(0
.555
)(0
.898
)(0
.681
)(0
.752
)H
ours
spe
nt p
rovi
ding
pri
vate
ser
vice
s ov
er p
ast 3
day
s13
.502
12.5
210.
041
0.92
3-0
.425
0.49
871
3(0
.586
)(0
.992
)(0
.982
)(1
.299
)(1
.171
)(1
.184
)To
tal h
ours
spe
nt w
orki
ng o
ver
past
3 d
ays
29.5
0726
.916
0.43
83.
1032
**-1
.126
1.97
771
3(0
.684
)(1
.157
)(1
.109
)(1
.452
)(1
.313
)(1
.336
)N
umbe
r of
vill
age
heal
th p
osts
att
ende
d in
pas
t mon
th4.
535
4.02
10.
035
0.17
5-0
.053
0.12
271
3(0
.146
)(0
.266
)(0
.296
)(0
.495
)(0
.337
)(0
.431
)N
umbe
r of
hou
rs m
idw
ife s
pend
s pe
r vi
llage
hea
lth p
ost
2.75
52.
488
0.04
8-0
.109
0.10
4-0
.006
712
Teac
hers
(0.0
68)
(0.1
20)
(0.1
04)
(0.1
32)
(0.1
14)
(0.1
32)
Perc
ent p
rese
nt a
t tim
e of
inte
rvie
w (
SD)
.0.
880
0.02
40*
0.00
90.
019
0.02
87*
725
(.)
(0.0
11)
(0.0
15)
(0.0
17)
(0.0
18)
(0.0
16)
Perc
ent p
rese
nt a
t tim
e of
inte
rvie
w (
SMP)
.0.
905
0.00
50.
019
-0.0
050.
014
510
(.)
(0.0
11)
(0.0
13)
(0.0
14)
(0.0
15)
(0.0
15)
Perc
ent t
each
ing
at ti
me
of c
lass
obs
erva
tion
(SD
).
0.68
8-0
.032
0.02
8-0
.047
-0.0
1872
5(.
)(0
.032
)(0
.040
)(0
.049
)(0
.048
)(0
.046
)Pe
rcen
t tea
chin
g at
tim
e of
cla
ss o
bser
vati
on (
SMP)
.0.
623
-0.0
430.
032
-0.0
59-0
.027
510
(.)
(0.0
40)
(0.0
49)
(0.0
59)
(0.0
60)
(0.0
54)
Ave
rage
sta
ndar
dize
d ef
fect
0.03
00.
1013
**-0
.021
0.07
99**
(0.0
31)
(0.0
43)
(0.0
38)
(0.0
39)
Ave
rage
sta
ndar
dize
d ef
fect
hea
lth0.
045
0.11
48*
-0.0
130.
1018
*(0
.043
)(0
.062
)(0
.049
)(0
.057
)A
vera
ge s
tand
ardi
zed
effe
ct e
duca
tion
0.00
70.
081
-0.0
340.
047
(0
.045
)(0
.059
)(0
.056
)(0
.053
)

118 Indonesia’s PNPM Generasi Program: Interim Impact Evaluation Report
Annex
Tab
le 4
9. R
esul
ts fo
r se
rvic
e pr
ovid
er e
ffor
ts, E
ast
Nus
a Te
ngga
ra (
base
line
as c
ontr
ol v
aria
ble)
M
odel
1M
odel
2
Indi
cato
rB
asel
ine
mea
nC
ontr
ol
mea
n
Tota
l G
ener
asi
Year
1 E
ffec
t
Ver
si A
ad
diti
onal
ef
fect
Tota
l Ver
si
B im
pact
Tota
l Ver
si
A im
pact
Num
ber
obse
rvat
ions
(1)
(2)
(3)
(4)
(5)
(6)
(7)
Mid
wiv
esH
ours
spe
nt in
out
reac
h ov
er p
ast 3
day
s3.
254
3.96
8-0
.854
1.21
6-1
.445
-0.2
2920
4(0
.548
)(1
.084
)(0
.886
)(1
.229
)(0
.896
)(1
.230
)H
ours
spe
nt p
rovi
ding
pub
lic s
ervi
ces
over
pas
t 3 d
ays
15.6
4011
.807
-0.1
540.
832
-0.5
550.
277
204
(1.2
27)
(1.4
61)
(1.3
08)
(1.3
37)
(1.5
06)
(1.3
96)
Hou
rs s
pent
pro
vidi
ng p
riva
te s
ervi
ces
over
pas
t 3 d
ays
1.36
01.
613
-1.2
140.
274
-1.3
457*
-1.0
7220
4(0
.385
)(0
.709
)(0
.812
)(0
.653
)(0
.752
)(1
.002
)To
tal h
ours
spe
nt w
orki
ng o
ver
past
3 d
ays
20.4
3417
.387
-2.4
581.
977
-3.4
062*
-1.4
2920
4(1
.399
)(1
.323
)(1
.744
)(2
.118
)(1
.786
)(2
.257
)N
umbe
r of
vill
age
heal
th p
osts
att
ende
d in
pas
t mon
th2.
885
3.16
10.
028
0.01
00.
024
0.03
320
4(0
.179
)(0
.315
)(0
.191
)(0
.219
)(0
.194
)(0
.246
)N
umbe
r of
hou
rs m
idw
ife s
pend
s pe
r vi
llage
hea
lth p
ost
3.96
93.
871
0.23
9-0
.079
0.27
70.
199
204
Teac
hers
(0.1
91)
(0.2
97)
(0.2
79)
(0.2
98)
(0.2
97)
(0.3
36)
Perc
ent p
rese
nt a
t tim
e of
inte
rvie
w (
SD)
.0.
847
-0.0
28-0
.026
-0.0
15-0
.041
210
(.)
(0.0
18)
(0.0
29)
(0.0
43)
(0.0
36)
(0.0
35)
Perc
ent p
rese
nt a
t tim
e of
inte
rvie
w (
SMP)
.0.
887
-0.0
662*
0.00
5-0
.068
2*-0
.064
119
(.)
(0.0
20)
(0.0
33)
(0.0
41)
(0.0
35)
(0.0
43)
Perc
ent t
each
ing
at ti
me
of c
lass
obs
erva
tion
(SD
).
0.59
0-0
.077
0.06
9-0
.111
-0.0
4220
9(.
)(0
.064
)(0
.081
)(0
.088
)(0
.101
)(0
.086
)Pe
rcen
t tea
chin
g at
tim
e of
cla
ss o
bser
vati
on (
SMP)
.0.
676
-0.1
746*
-0.1
02-0
.127
-0.2
296*
119
(.)
(0.0
78)
(0.0
88)
(0.1
18)
(0.0
96)
(0.1
18)
Ave
rage
sta
ndar
dize
d ef
fect
-0.1
703*
**0.
028
-0.1
842*
**-0
.156
2**
(0.0
60)
(0.0
76)
(0.0
67)
(0.0
74)
Ave
rage
sta
ndar
dize
d ef
fect
hea
lth-0
.074
0.08
4-0
.114
-0.0
30(0
.081
)(0
.102
)(0
.082
)(0
.108
)A
vera
ge s
tand
ardi
zed
effe
ct e
duca
tion
-0.3
155*
**-0
.055
-0.2
896*
*-0
.344
9**
(0
.110
)(0
.142
)(0
.131
)(0
.131
)

Indonesia’s PNPM Generasi Program: Interim Impact Evaluation Report 119
Annex
Tab
le 5
0. R
esul
ts fo
r se
rvic
e pr
ovid
er e
ffor
ts, S
ulaw
esi /
Gor
onta
lo (
base
line
as c
ontr
ol v
aria
ble)
M
odel
1M
odel
2
Indi
cato
rB
asel
ine
mea
nC
ontr
ol
mea
n
Tota
l G
ener
asi Y
ear
1 E
ffec
t
Ver
si A
ad
diti
onal
ef
fect
Tota
l Ver
si B
im
pact
Tota
l Ver
si A
im
pact
Num
ber
obse
rvat
ions
(1)
(2)
(3)
(4)
(5)
(6)
(7)
Mid
wiv
esH
ours
spe
nt in
out
reac
h ov
er p
ast 3
day
s3.
519
3.02
6-0
.289
1.76
70*
-1.0
780.
689
126
(0.5
43)
(0.5
96)
(0.8
17)
(0.9
92)
(0.9
46)
(0.9
69)
Hou
rs s
pent
pro
vidi
ng p
ublic
ser
vice
s ov
er p
ast 3
day
s15
.228
12.9
74-0
.681
4.07
0-2
.492
1.57
712
6(1
.496
)(1
.721
)(1
.467
)(2
.540
)(2
.053
)(1
.907
)H
ours
spe
nt p
rovi
ding
pri
vate
ser
vice
s ov
er p
ast 3
day
s7.
734
7.39
52.
234
0.13
42.
174
2.30
712
6(1
.267
)(1
.377
)(1
.675
)(2
.382
)(2
.366
)(1
.591
)To
tal h
ours
spe
nt w
orki
ng o
ver
past
3 d
ays
26.4
8123
.395
1.25
96.
036
-1.4
484.
5878
*12
6(2
.020
)(2
.112
)(2
.247
)(3
.660
)(3
.193
)(2
.512
)N
umbe
r of
vill
age
heal
th p
osts
att
ende
d in
pas
t mon
th3.
722
3.23
70.
900
-0.4
241.
086
0.66
312
6(0
.597
)(0
.605
)(0
.563
)(0
.699
)(0
.703
)(0
.589
)N
umbe
r of
hou
rs m
idw
ife s
pend
s pe
r vi
llage
hea
lth p
ost
3.32
42.
658
0.88
87**
-0.0
240.
8994
*0.
8753
**12
6Te
ache
rs(0
.232
)(0
.338
)(0
.390
)(0
.444
)(0
.468
)(0
.424
)Pe
rcen
t pre
sent
at t
ime
of in
terv
iew
(SD
).
0.81
60.
008
-0.0
500.
031
-0.0
1914
3(.
)(0
.026
)(0
.038
)(0
.063
)(0
.035
)(0
.064
)Pe
rcen
t pre
sent
at t
ime
of in
terv
iew
(SM
P).
0.78
90.
009
-0.0
470.
031
-0.0
1694
(.)
(0.0
28)
(0.0
38)
(0.0
53)
(0.0
42)
(0.0
52)
Perc
ent t
each
ing
at ti
me
of c
lass
obs
erva
tion
(SD
).
0.66
70.
058
-0.0
540.
082
0.02
814
3(.
)(0
.063
)(0
.100
)(0
.150
)(0
.132
)(0
.119
)Pe
rcen
t tea
chin
g at
tim
e of
cla
ss o
bser
vati
on (
SMP)
.0.
463
0.00
9-0
.061
0.03
7-0
.024
94(.
)(0
.079
)(0
.088
)(0
.124
)(0
.110
)(0
.103
)A
vera
ge s
tand
ardi
zed
effe
ct0.
1113
*0.
051
0.08
90.
1399
*(0
.055
)(0
.084
)(0
.066
)(0
.074
)A
vera
ge s
tand
ardi
zed
effe
ct h
ealth
0.14
71*
0.20
93*
0.05
30.
2627
***
(0.0
78)
(0.1
18)
(0.1
08)
(0.0
89)
Ave
rage
sta
ndar
dize
d ef
fect
edu
c.0.
058
-0.1
870.
143
-0.0
44
(0.0
99)
(0.1
54)
(0.1
09)
(0.1
41)

120 Indonesia’s PNPM Generasi Program: Interim Impact Evaluation Report
Annex
Tab
le 5
1. C
omm
unit
y ef
fort
, all
prov
ince
s (b
asel
ine
as c
ontr
ol v
aria
ble)
Mod
el 1
Mod
el 2
Indi
cato
rB
asel
ine
mea
nC
ontr
ol
mea
n
Tota
l G
ener
asi Y
ear
1 E
ffec
t
Ver
si A
ad
diti
onal
ef
fect
Tota
l Ver
si
B im
pact
Tota
l Ver
si
A im
pact
Num
ber
obse
rvat
ions
(1)
(2)
(3)
(4)
(5)
(6)
(7)
Com
mun
ity e
ffort
at d
irec
t ser
vice
pro
visio
nN
umbe
r of
vill
age
heal
th p
osts
in v
illag
e4.
519
4.22
2-0
.041
-0.0
980.
008
-0.0
9020
27(0
.078
)(0
.106
)(0
.118
)(0
.125
)(0
.143
)(0
.123
)N
umbe
r of
vill
age
heal
th p
ost m
eeti
ngs
in p
ast y
ear
at s
elec
ted
villa
ge
heal
th p
ost
.11
.800
0.04
0-0
.085
0.08
2-0
.003
2103
(.)
(0.0
59)
(0.0
92)
(0.1
02)
(0.1
09)
(0.1
01)
Num
ber
of c
adre
s at
sel
ecte
d vi
llage
hea
lth p
osts
.4.
750
0.24
20*
-0.0
660.
2748
*0.
2084
*21
03C
omm
unity
effo
rt a
t out
reac
h(.
)(0
.073
)(0
.124
)(0
.142
)(0
.164
)(0
.116
)N
umbe
r of
sw
eepi
ngs
at s
elec
ted
villa
ge h
ealth
pos
ts in
last
yea
r.
5.96
5-0
.174
-0.2
99-0
.026
-0.3
2521
02(.
)(0
.233
)(0
.329
)(0
.388
)(0
.372
)(0
.392
)N
umbe
r of
SD
sch
ool c
omm
itte
e m
eeti
ngs
wit
h pa
rent
s in
pas
t yea
r.
2.21
7-0
.027
0.15
4-0
.102
0.05
210
48(.
)(0
.141
)(0
.120
)(0
.122
)(0
.134
)(0
.134
)N
umbe
r of
SM
P sc
hool
com
mit
tee
mee
ting
s w
ith
pare
nts
in p
ast
2.30
92.
178
-0.0
59-0
.141
0.01
1-0
.130
734
Com
mun
ity e
ffort
at m
onito
ring
(0.0
73)
(0.1
01)
(0.0
96)
(0.1
25)
(0.1
17)
(0.1
13)
Num
ber
of S
D s
choo
l com
mit
tee
mem
bers
.9.
049
0.10
41.
2784
***
-0.5
290.
7498
*10
52(.
)(0
.261
)(0
.324
)(0
.475
)(0
.402
)(0
.391
)N
umbe
r of
SM
P sc
hool
com
mit
tee
mem
bers
8.26
88.
944
-1.1
000.
546
-1.3
69-0
.822
745
(0.1
76)
(0.9
04)
(0.9
11)
(0.5
38)
(0.9
14)
(0.9
86)
Num
ber
of S
D s
choo
l com
mit
tee
mee
ting
s w
ith
teac
hers
in p
ast y
ear
.4.
112
-0.2
270.
228
-0.3
39-0
.111
1038
(.)
(0.2
95)
(0.3
07)
(0.3
52)
(0.3
50)
(0.3
57)
Num
ber
of S
MP
scho
ol c
omm
itte
e m
eeti
ngs
wit
h te
ache
rs in
yea
r4.
484
3.86
00.
290
0.35
40.
117
0.47
073
2Pa
rtic
ipat
ion
in h
ealth
/ ed
ucat
ion
prog
ram
s(0
.203
)(0
.303
)(0
.334
)(0
.453
)(0
.385
)(0
.422
)Pa
rtic
ipat
ion
in m
eeti
ngs
abou
t hea
lth e
duca
tion
.0.
281
0.11
08**
*-0
.009
0.11
50**
*0.
1058
***
3293
(.)
(0.0
15)
(0.0
34)
(0.0
25)
(0.0
34)
(0.0
39)
Prop
orti
on o
f kid
s un
der
3 w
ho o
wn
buku
kup
on.
0.16
70.
1172
***
0.02
80.
1052
***
0.13
27**
*28
18(.
)(0
.112
)(0
.022
)(0
.018
)(0
.022
)(0
.025
)Pr
opor
tion
of m
oms
who
ow
n bu
ku k
upon
.0.
455
0.16
65**
*0.
035
0.15
05**
*0.
1859
***
2204
(.)
(0.1
58)
(0.0
36)
(0.0
21)
(0.0
38)
(0.0
38)
Prop
orti
on o
f kid
s un
der
3 w
ho u
se b
uku
kupo
n.
0.08
30.
0643
***
0.02
32*
0.05
43**
*0.
0775
***
2730
(.)
(0.0
83)
(0.0
16)
(0.0
13)
(0.0
17)
(0.0
19)
Prop
orti
on o
f mom
s w
ho u
se b
uku
kupo
n.
0.20
00.
0840
***
0.00
50.
0817
***
0.08
66**
*21
47

Indonesia’s PNPM Generasi Program: Interim Impact Evaluation Report 121
Annex
M
odel
1M
odel
2
Indi
cato
rB
asel
ine
mea
nC
ontr
ol
mea
n
Tota
l G
ener
asi Y
ear
1 E
ffec
t
Ver
si A
ad
diti
onal
ef
fect
Tota
l Ver
si
B im
pact
Tota
l Ver
si
A im
pact
Num
ber
obse
rvat
ions
(1)
(2)
(3)
(4)
(5)
(6)
(7)
(.)
(0.1
33)
(0.0
20)
(0.0
14)
(0.0
22)
(0.0
21)
Prop
orti
on o
f kid
s un
der
3 w
ith
KIA
0.57
30.
474
-0.0
240.
0454
*-0
.046
7*-0
.001
4802
(0.0
08)
(0.0
17)
(0.0
22)
(0.0
26)
(0.0
26)
(0.0
26)
Prop
orti
on o
f kid
s un
der
3 w
ith
KM
S0.
385
0.52
20.
1254
***
-0.0
040.
1275
***
0.12
33**
*47
99Sp
illov
ers t
o ot
her
type
s of c
omm
unity
act
iviti
es(0
.008
)(0
.017
)(0
.018
)(0
.024
)(0
.023
)(0
.020
)Pa
rtic
ipat
ion
in g
oton
g ro
yong
(ho
urs
wor
ked
per
hous
ehol
d)37
.679
28.4
893.
245
-8.8
331*
*7.
6379
**-1
.195
1063
1(1
.024
)(1
.881
)(2
.144
)(3
.471
)(3
.167
)(2
.288
)W
omen
’s pa
rtic
ipat
ion
in g
over
nmen
t gro
ups
(RT
etc
)0.
021
0.02
00.
001
0.00
5-0
.002
0.00
369
80(0
.002
)(0
.004
)(0
.004
)(0
.006
)(0
.006
)(0
.005
)N
umbe
r of
gro
ups
hous
ehol
d pa
rtic
ipat
es in
2.
050
1.64
40.
080
0.12
02*
0.02
10.
1407
**10
642
(0.0
14)
(0.0
37)
(0.0
49)
(0.0
64)
(0.0
52)
(0.0
63)
Ave
rage
sta
ndar
dize
d ef
fect
0.10
07**
*0.
0309
*0.
0862
***
0.11
72**
*(0
.019
)(0
.018
)(0
.021
)(0
.020
)A
vera
ge s
tand
ardi
zed
effe
ct h
ealth
0.18
84**
*0.
019
0.18
05**
*0.
1992
***
(0.0
29)
(0.0
25)
(0.0
32)
(0.0
33)
Ave
rage
sta
ndar
dize
d ef
fect
edu
cati
on-0
.026
0.07
00*
-0.0
600.
010
(0
.035
)(0
.039
)(0
.040
)(0
.040
)

122 Indonesia’s PNPM Generasi Program: Interim Impact Evaluation Report
Annex
Tab
le 5
2. C
omm
unit
y ef
fort
, Jav
a (b
asel
ine
as c
ontr
ol v
aria
ble)
M
odel
1M
odel
2
Indi
cato
rB
asel
ine
mea
nC
ontr
ol
mea
n
Tota
l G
ener
asi Y
ear
1 E
ffec
t
Ver
si A
ad
diti
onal
ef
fect
Tota
l Ver
si
B im
pact
Tota
l Ver
si
A im
pact
Num
ber
obse
rvat
ions
(1)
(2)
(3)
(4)
(5)
(6)
(7)
Com
mun
ity e
ffort
at d
irec
t ser
vice
pro
visio
n
Num
ber
of v
illag
e he
alth
pos
ts in
vill
age
5.40
85.
198
-0.0
91-0
.108
-0.0
36-0
.144
1360
(0.1
03)
(0.1
36)
(0.1
80)
(0.1
90)
(0.2
22)
(0.1
82)
Num
ber o
f vill
age
heal
th p
ost m
eeti
ngs i
n pa
st y
ear a
t sel
ecte
d vi
llage
.11
.870
-0.1
26-0
.025
-0.1
13-0
.138
1427
(.)
(0.0
61)
(0.1
00)
(0.1
11)
(0.1
24)
(0.1
04)
Num
ber
of c
adre
s at
sel
ecte
d vi
llage
hea
lth p
osts
.4.
631
0.23
59*
-0.0
660.
269
0.20
314
27C
omm
unity
effo
rt a
t out
reac
h(.
)(0
.074
)(0
.140
)(0
.177
)(0
.187
)(0
.140
)N
umbe
r of
sw
eepi
ngs
at s
elec
ted
villa
ge h
ealth
pos
t in
last
yea
r.
5.33
6-0
.008
-0.5
060.
248
-0.2
5814
26(.
)(0
.263
)(0
.414
)(0
.491
)(0
.462
)(0
.501
)N
umbe
r of
SD
sch
ool
com
mit
tee
mee
ting
s w
ith
pare
nts
in p
ast
.2.
127
0.13
10.
157
0.05
30.
210
710
(.)
(0.1
08)
(0.1
34)
(0.1
47)
(0.1
53)
(0.1
50)
Num
ber
of S
MP
scho
ol c
omm
itte
e m
eeti
ngs
wit
h pa
rent
s in
pas
t 2.
337
2.31
8-0
.137
-0.2
40-0
.015
-0.2
550*
512
Com
mun
ity e
ffort
at m
onito
ring
(0.0
90)
(0.1
38)
(0.1
19)
(0.1
55)
(0.1
41)
(0.1
43)
Num
ber
of S
D s
choo
l com
mit
tee
mem
bers
.8.
745
0.16
81.
6052
***
-0.6
412*
0.96
39**
715
(.)
(0.2
75)
(0.3
18)
(0.3
78)
(0.3
54)
(0.3
71)
Num
ber
of S
MP
scho
ol c
omm
itte
e m
embe
rs7.
918
7.71
90.
118
0.88
79*
-0.3
330.
555
519
(0.2
04)
(0.3
04)
(0.3
46)
(0.4
63)
(0.3
70)
(0.4
53)
Num
ber
of S
D s
choo
l co
mm
itte
e m
eeti
ngs
wit
h te
ache
rs i
n pa
st .
4.64
1-0
.512
-0.0
16-0
.504
-0.5
2070
5(.
)(0
.372
)(0
.393
)(0
.402
)(0
.477
)(0
.405
)N
umbe
r of
SM
P sc
hool
com
mit
tee
mee
ting
s w
ith
teac
hers
in y
ear
4.76
84.
583
0.01
60.
928
-0.4
600.
468
510
Part
icip
atio
n in
hea
lth /
educ
atio
n pr
ogra
ms
(0.2
43)
(0.4
33)
(0.4
47)
(0.5
96)
(0.4
78)
(0.5
86)
Part
icip
atio
n in
mee
ting
s ab
out h
ealth
edu
cati
on.
0.24
40.
1101
***
-0.0
140.
1170
***
0.10
26**
*21
50(.
)(0
.019
)(0
.033
)(0
.032
)(0
.035
)(0
.038
)Pr
opor
tion
of k
ids
unde
r 3
who
ow
n bu
ku k
upon
.0.
167
0.10
56**
*0.
0546
**0.
0801
***
0.13
47**
*16
97(.
)(0
.112
)(0
.029
)(0
.022
)(0
.031
)(0
.033
)Pr
opor
tion
of m
oms
who
ow
n bu
ku k
upon
.0.
455
0.13
56**
*0.
0732
**0.
1011
**0.
1743
***
1395
(.)
(0.1
58)
(0.0
45)
(0.0
29)
(0.0
49)
(0.0
49)
Prop
orti
on o
f kid
s un
der
3 w
ho u
se b
uku
kupo
n.
0.08
30.
0606
***
0.03
10*
0.04
65**
0.07
74**
*16
51(.
)(0
.083
)(0
.022
)(0
.018
)(0
.023
)(0
.026
)Pr
opor
tion
of m
oms
who
ow
n bu
ku k
upon
.0.
200
0.07
45**
*0.
016
0.06
67**
0.08
31**
*13
57

Indonesia’s PNPM Generasi Program: Interim Impact Evaluation Report 123
Annex
Mod
el 1
Mod
el 2
Indi
cato
rB
asel
ine
mea
nC
ontr
ol
mea
n
Tota
l G
ener
asi Y
ear
1 E
ffec
t
Ver
si A
ad
diti
onal
ef
fect
Tota
l Ver
si
B im
pact
Tota
l Ver
si
A im
pact
Num
ber
obse
rvat
ions
(1)
(2)
(3)
(4)
(5)
(6)
(7)
(.)
(0.1
33)
(0.0
24)
(0.0
19)
(0.0
28)
(0.0
26)
Prop
orti
on o
f kid
s un
der
3 w
ith
KIA
0.62
00.
504
0.01
10.
044
-0.0
120.
033
3065
(0.0
10)
(0.0
23)
(0.0
28)
(0.0
35)
(0.0
35)
(0.0
31)
Prop
orti
on o
f kid
s un
der
3 w
ith
KM
S0.
415
0.57
20.
1161
***
-0.0
170.
1246
***
0.10
81**
*30
64Sp
illov
ers t
o ot
her
type
s of c
omm
unity
act
iviti
es(0
.010
)(0
.022
)(0
.024
)(0
.033
)(0
.033
)(0
.026
)Pa
rtic
ipat
ion
in g
oton
g ro
yong
(ho
urs
wor
ked
per
hous
ehol
d)36
.055
21.7
792.
350
-4.0
024.
359
0.35
871
84(1
.224
)(1
.838
)(1
.985
)(3
.089
)(2
.745
)(2
.297
)W
omen
’s pa
rtic
ipat
ion
in g
over
nmen
t gro
ups
(RT,
etc
)0.
012
0.01
3-0
.001
-0.0
050.
002
-0.0
0350
62
Num
ber
of g
roup
s ho
useh
old
part
icip
ates
in
(0.0
02)
(0.0
04)
(0.0
04)
(0.0
07)
(0.0
06)
(0.0
05)
2.07
11.
729
0.04
40.
2014
**-0
.057
0.14
47*
7191
(0.0
16)
(0.0
46)
(0.0
66)
(0.0
90)
(0.0
72)
(0.0
85)
Ave
rage
sta
ndar
dize
d ef
fect
0.09
71**
*0.
0652
***
0.06
53**
0.13
05**
*(0
.025
)(0
.025
)(0
.029
)(0
.027
)A
vera
ge s
tand
ardi
zed
effe
ct h
ealth
0.17
42**
*0.
042
0.15
48**
*0.
1972
***
(0.0
38)
(0.0
34)
(0.0
43)
(0.0
43)
Ave
rage
sta
ndar
dize
d ef
fect
edu
cati
on-0
.006
0.13
54**
-0.0
750.
061
(0
.044
)(0
.053
)(0
.048
)(0
.053
)

124 Indonesia’s PNPM Generasi Program: Interim Impact Evaluation Report
Annex
Tab
le 5
3. C
omm
unit
y ef
fort
, Eas
t N
usa
Teng
gara
(ba
selin
e as
con
trol
var
iabl
e)
M
odel
1M
odel
2
Indi
cato
rB
asel
ine
mea
nC
ontr
ol
mea
nTo
tal G
ener
asi
Year
1 E
ffec
t
Ver
si A
ad
diti
onal
ef
fect
Tota
l Ver
si
B im
pact
Tota
l Ver
si
A im
pact
Num
ber
obse
rvat
ions
(1)
(2)
(3)
(4)
(5)
(6)
(7)
Com
mun
ity e
ffort
at d
irec
t ser
vice
pro
visio
n
N
umbe
r of
vill
age
heal
th p
osts
in v
illag
e3.
020
2.95
80.
091
-0.0
050.
093
0.08
840
2(0
.083
)(0
.134
)(0
.109
)(0
.091
)(0
.113
)(0
.123
)N
umbe
r of v
illag
e he
alth
pos
t mee
ting
s in
past
yea
r at s
elec
ted
villa
ge .
11.7
250.
308
-0.2
540.
4334
*0.
180
408
(.)
(0.1
56)
(0.2
27)
(0.2
40)
(0.2
42)
(0.2
65)
Num
ber
of c
adre
s at
sel
ecte
d vi
llage
hea
lth p
osts
.4.
967
0.21
5-0
.383
5*0.
4055
*0.
022
408
Com
mun
ity e
ffort
at o
utre
ach
(.)
(0.1
50)
(0.1
89)
(0.2
26)
(0.2
25)
(0.2
08)
Num
ber
of s
wee
ping
s at
sel
ecte
d vi
llage
hea
lth p
ost i
n la
st y
ear
.6.
900
-1.4
290*
0.79
0-1
.820
9**
-1.0
3140
8(.
)(0
.731
)(0
.724
)(0
.722
)(0
.789
)(0
.814
)N
umbe
r of
SD
sch
ool c
omm
itte
e m
eeti
ngs
wit
h pa
rent
s in
pas
t yea
r.
2.20
0-0
.365
0.08
6-0
.406
-0.3
2120
3(.
)(0
.190
)(0
.263
)(0
.252
)(0
.300
)(0
.283
)N
umbe
r of
SM
P sc
hool
com
mit
tee
mee
ting
s w
ith
pare
nts
in p
ast
2.27
41.
895
-0.0
400.
018
-0.0
48-0
.030
125
Com
mun
ity e
ffort
at m
onito
ring
(0.1
86)
(0.1
68)
(0.2
47)
(0.2
88)
(0.2
88)
(0.2
84)
Num
ber
of S
D s
choo
l com
mit
tee
mem
bers
.9.
763
0.03
81.
2577
*-0
.580
0.67
720
2(.
)(0
.603
)(0
.665
)(0
.648
)(0
.630
)(0
.820
)N
umbe
r of
SM
P sc
hool
com
mit
tee
mem
bers
10.0
0010
.105
-0.7
11-0
.606
-0.4
32-1
.038
125
(0.4
41)
(0.8
15)
(0.7
81)
(0.8
58)
(0.9
37)
(0.8
43)
Num
ber
of S
D s
choo
l co
mm
itte
e m
eeti
ngs
wit
h te
ache
rs i
n pa
st .
2.72
90.
907
1.07
20.
387
1.45
920
1(.
)(0
.370
)(0
.698
)(0
.920
)(0
.655
)(0
.994
)N
umbe
r of
SM
P sc
hool
com
mit
tee
mee
ting
s w
ith
teac
hers
in y
ear
3.08
22.
763
0.97
7-1
.150
4*1.
5030
*0.
353
125
Part
icip
atio
n in
hea
lth /
educ
atio
n pr
ogra
ms
(0.2
32)
(0.3
34)
(0.6
58)
(0.6
40)
(0.8
39)
(0.5
25)
Part
icip
atio
n in
mee
ting
s ab
out h
ealth
edu
cati
on.
0.44
7-0
.028
-0.0
700.
005
-0.0
6477
1(.
)(0
.036
)(0
.154
)(0
.045
)(0
.137
)(0
.135
)Pr
opor
tion
of k
ids
unde
r 3
who
ow
n bu
ku k
upon
..
0.16
52**
*-0
.019
0.17
41**
*0.
1553
***
772
(.)
(.)
(0.0
36)
(0.0
38)
(0.0
46)
(0.0
47)
Prop
orti
on o
f mom
s w
ho o
wn
buku
kup
on.
.0.
3173
***
-0.0
310.
3313
***
0.30
06**
*55
2(.
)(.
)(0
.028
)(0
.040
)(0
.038
)(0
.040
)Pr
opor
tion
of k
ids
unde
r 3
who
use
buk
u ku
pon
..
0.06
86**
*0.
004
0.06
66**
*0.
0709
***
740
(.)
(.)
(0.0
15)
(0.0
22)
(0.0
18)
(0.0
21)
Prop
orti
on o
f mom
s w
ho o
wn
buku
kup
on.
.0.
1043
*-0
.021
0.11
36**
0.09
30*
537

Indonesia’s PNPM Generasi Program: Interim Impact Evaluation Report 125
Annex
M
odel
1M
odel
2
Indi
cato
rB
asel
ine
mea
nC
ontr
ol
mea
nTo
tal G
ener
asi
Year
1 E
ffec
t
Ver
si A
ad
diti
onal
ef
fect
Tota
l Ver
si
B im
pact
Tota
l Ver
si
A im
pact
Num
ber
obse
rvat
ions
(1)
(2)
(3)
(4)
(5)
(6)
(7)
(.)
(.)
(0.0
54)
(0.0
30)
(0.0
49)
(0.0
50)
Prop
orti
on o
f kid
s un
der
3 w
ith
KIA
0.55
90.
626
-0.1
310*
**0.
046
-0.1
541*
**-0
.108
3**
1086
(0.0
16)
(0.0
36)
(0.0
41)
(0.0
44)
(0.0
44)
(0.0
47)
Prop
orti
on o
f kid
s un
der
3 w
ith
KM
S0.
189
0.31
60.
1572
***
0.01
00.
1518
***
0.16
17**
*10
84Sp
illov
ers t
o ot
her
type
s of c
omm
unity
act
iviti
es(0
.013
)(0
.034
)(0
.029
)(0
.043
)(0
.038
)(0
.035
)Pa
rtic
ipat
ion
in g
oton
g ro
yong
(ho
urs
wor
ked
per
hous
ehol
d)48
.412
54.5
008.
139
-25.
0601
**20
.461
0*-4
.599
2067
(2.6
65)
(7.2
68)
(8.2
33)
(11.
230)
(11.
465)
(7.6
54)
Wom
en’s
part
icip
atio
n in
gov
ernm
ent g
roup
s (R
T e
tc)
0.05
70.
024
0.01
00.
027
-0.0
050.
023
1057
(0.0
08)
(0.0
12)
(0.0
15)
(0.0
19)
(0.0
13)
(0.0
20)
Num
ber
of g
roup
s ho
useh
old
part
icip
ates
in
1.99
21.
428
0.15
6-0
.092
0.20
52**
0.11
320
70(0
.032
)(0
.074
)(0
.097
)(0
.097
)(0
.102
)(0
.113
)A
vera
ge s
tand
ardi
zed
effe
ct0.
1154
***
-0.0
250.
1264
***
0.10
13**
(0.0
39)
(0.0
41)
(0.0
43)
(0.0
42)
Ave
rage
sta
ndar
dize
d ef
fect
hea
lth0.
1841
***
-0.0
420.
2041
***
0.16
17**
*(0
.049
)(0
.047
)(0
.048
)(0
.048
)A
vera
ge s
tand
ardi
zed
effe
ct e
duca
tion
0.01
00.
014
0.00
10.
015
(0
.097
)(0
.103
)(0
.110
)(0
.108
)

126 Indonesia’s PNPM Generasi Program: Interim Impact Evaluation Report
Annex
Tab
le 5
4. C
omm
unit
y ef
fort
, Nor
th S
ulaw
esi/
Gor
onta
lo (
base
line
as c
ontr
ol v
aria
ble)
Mod
el 1
Mod
el 2
Indi
cato
rB
asel
ine
mea
nC
ontr
ol
mea
n
Tota
l G
ener
asi
Year
1
Eff
ect
Ver
si A
ad
diti
onal
ef
fect
Tota
l Ver
si
B im
pact
Tota
l Ver
si
A im
pact
Num
ber
obse
rvat
ions
(1)
(2)
(3)
(4)
(5)
(6)
(7)
Com
mun
ity e
ffort
at d
irec
t ser
vice
pro
visio
n
N
umbe
r of
vill
age
heal
th p
osts
in v
illag
e2.
249
2.02
70.
011
-0.2
620.
127
-0.1
3526
5(0
.106
)(0
.124
)(0
.149
)(0
.233
)(0
.179
)(0
.202
)N
umbe
r of
vill
age
heal
th p
ost
mee
ting
s in
pas
t ye
ar a
t se
lect
ed .
11.6
160.
386
-0.0
030.
388
0.38
426
8(.
)(0
.197
)(0
.273
)(0
.322
)(0
.305
)(0
.331
)N
umbe
r of
cad
res
at s
elec
ted
villa
ge h
ealth
pos
ts.
4.96
40.
305
0.61
50.
028
0.64
31*
268
Com
mun
ity e
ffort
at o
utre
ach
(.)
(0.2
84)
(0.5
16)
(0.5
09)
(0.7
23)
(0.3
32)
Num
ber
of s
wee
ping
s at
sel
ecte
d vi
llage
hea
lth p
ost i
n la
st y
ear
.7.
339
0.85
2-1
.430
1.49
60.
066
268
(.)
(0.4
76)
(0.7
72)
(1.0
78)
(0.8
93)
(0.9
82)
Num
ber
of S
D s
choo
l co
mm
itte
e m
eeti
ngs
wit
h pa
rent
s in
pas
t .
2.57
1-0
.241
0.24
5-0
.350
-0.1
0513
5(.
)(0
.693
)(0
.390
)(0
.392
)(0
.413
)(0
.457
)N
umbe
r of
SM
P sc
hool
com
mit
tee
mee
ting
s w
ith
pare
nts
in p
ast
2.20
41.
927
0.20
10.
083
0.16
30.
247
97C
omm
unity
effo
rt a
t mon
itori
ng(0
.144
)(0
.189
)(0
.212
)(0
.353
)(0
.316
)(0
.218
)N
umbe
r of
SD
sch
ool c
omm
itte
e m
embe
rs.
9.44
6-0
.082
-0.4
340.
117
-0.3
1713
5(.
)(0
.915
)(1
.436
)(3
.108
)(2
.213
)(2
.010
)N
umbe
r of
SM
P sc
hool
com
mit
tee
mem
bers
7.91
012
.357
-6.7
04-1
.634
-5.9
80-7
.614
101
(0.4
90)
(4.8
40)
(5.5
78)
(3.2
30)
(5.2
36)
(6.4
85)
Num
ber
of S
D s
choo
l co
mm
itte
e m
eeti
ngs
wit
h te
ache
rs i
n pa
st .
3.58
2-0
.550
-0.2
05-0
.459
-0.6
6413
2(.
)(0
.894
)(0
.599
)(0
.568
)(0
.650
)(0
.684
)
Num
ber
of S
MP
scho
ol c
omm
itte
e m
eeti
ngs
wit
h te
ache
rs in
yea
r4.
755
2.17
51.
2980
**-0
.004
1.30
01.
2957
*97
Part
icip
atio
n in
hea
lth /
educ
atio
n pr
ogra
ms
(0.7
59)
(0.3
24)
(0.5
39)
(1.0
10)
(0.7
83)
(0.6
64)
Part
icip
atio
n in
mee
ting
s ab
out h
ealth
edu
cati
on.
0.20
00.
2375
**0.
1938
***
0.18
04**
*0.
3742
***
372
(.)
(0.0
31)
(0.0
94)
(0.0
54)
(0.0
55)
(0.0
74)
Prop
orti
on o
f kid
s un
der
3 w
ho o
wn
buku
kup
on.
.0.
1291
***
0.00
20.
1287
***
0.13
03**
*34
9(.
)(.
)(0
.010
)(0
.017
)(0
.012
)(0
.015
)Pr
opor
tion
of m
oms
who
ow
n bu
ku k
upon
..
0.19
53**
*-0
.010
0.19
86**
*0.
1883
***
257
(.)
(.)
(0.0
41)
(0.0
18)
(0.0
40)
(0.0
41)
Prop
orti
on o
f kid
s un
der
3 w
ho u
se b
uku
kupo
n.
.0.
0881
***
0.03
05*
0.08
01**
*0.
1106
***
339

Indonesia’s PNPM Generasi Program: Interim Impact Evaluation Report 127
Annex
M
odel
1M
odel
2
Indi
cato
rB
asel
ine
mea
nC
ontr
ol
mea
n
Tota
l G
ener
asi
Year
1
Eff
ect
Ver
si A
ad
diti
onal
ef
fect
Tota
l Ver
si
B im
pact
Tota
l Ver
si
A im
pact
Num
ber
obse
rvat
ions
(1)
(2)
(3)
(4)
(5)
(6)
(7)
(.)
(.)
(0.0
12)
(0.0
15)
(0.0
18)
(0.0
21)
Prop
orti
on o
f mom
s w
ho o
wn
buku
kup
on.
.0.
1270
***
0.00
20.
1265
***
0.12
80**
*25
3(.
)(.
)(0
.035
)(0
.011
)(0
.035
)(0
.036
)Pr
opor
tion
of k
ids
unde
r 3
wit
h K
IA0.
374
0.21
20.
021
0.03
60.
004
0.04
065
1(0
.021
)(0
.032
)(0
.044
)(0
.054
)(0
.042
)(0
.060
)Pr
opor
tion
of k
ids
unde
r 3
wit
h K
MS
0.57
30.
606
0.12
15**
0.00
00.
1216
**0.
1214
**65
1Sp
illov
ers t
o ot
her
type
s of c
omm
unity
act
iviti
es(0
.021
)(0
.038
)(0
.045
)(0
.054
)(0
.054
)(0
.051
)Pa
rtic
ipat
ion
in g
oton
g ro
yong
(ho
urs
wor
ked
per
hous
ehol
d)29
.934
25.6
72-1
.246
-6.4
271.
670
-4.7
5613
80(2
.339
)(2
.979
)(3
.218
)(4
.136
)(4
.223
)(3
.104
)W
omen
’s pa
rtic
ipat
ion
in g
over
nmen
t gro
ups
(RT
etc
)0.
032
0.04
1-0
.003
0.02
80*
-0.0
140.
014
861
(0.0
07)
(0.0
16)
(0.0
16)
(0.0
16)
(0.0
19)
(0.0
13)
Num
ber
of g
roup
s ho
useh
old
part
icip
ates
in
2.02
91.
561
0.10
90.
086
0.07
00.
156
1381
(0.0
44)
(0.1
01)
(0.0
78)
(0.1
34)
(0.0
80)
(0.1
25)
Ave
rage
sta
ndar
dize
d ef
fect
0.19
79**
*0.
023
0.19
23**
*0.
2157
***
(0.0
31)
(0.0
32)
(0.0
34)
(0.0
39)
Ave
rage
sta
ndar
dize
d ef
fect
hea
lth0.
3496
***
0.04
30.
3386
***
0.38
17**
*(0
.053
)(0
.043
)(0
.058
)(0
.064
)A
vera
ge s
tand
ardi
zed
effe
ct e
duca
tion
0.01
4-0
.004
0.01
60.
012
(0
.069
)(0
.106
)(0
.093
)(0
.080
)

128 Indonesia’s PNPM Generasi Program: Interim Impact Evaluation Report
Annex
Tab
le 5
5. R
esul
ts fo
r se
rvic
e-pr
ovid
er-b
ased
qua
ntit
ies,
all
prov
ince
s (b
asel
ine
as c
ontr
ol v
aria
ble)
M
odel
1M
odel
2
Indi
cato
rB
asel
ine
mea
nC
ontr
ol m
ean
Tota
l Gen
eras
i Ye
ar 1
Eff
ect
Ver
si A
ad
diti
onal
eff
ect
Tota
l Ver
si B
im
pact
Tota
l Ver
si A
im
pact
Num
ber
obse
rvat
ions
(1)
(2)
(3)
(4)
(5)
(6)
(7)
Mid
wife
Fe
e ch
arge
d fo
r ch
ild b
irth
at
priv
ate
prac
tice
2938
00.0
0034
0500
.000
1551
0.42
68**
-531
5.25
118
120.
8105
**12
805.
560
928
(567
8.00
6)(9
927.
995)
(621
6.39
8)(8
358.
456)
(707
6.40
9)(7
843.
922)
Num
ber
of c
hild
bir
ths
at
priv
ate
prac
tice
in la
st m
onth
2.95
32.
591
-0.1
440.
126
-0.2
07-0
.080
1042
(0.1
56)
(0.2
22)
(0.2
15)
(0.2
22)
(0.2
21)
(0.2
62)
Fee
char
ged
for
child
bir
th a
t go
v’t p
ract
ice
1382
00.0
0018
6500
.000
2218
1.31
84*
7503
.837
1853
7.27
526
041.
1133
*76
1(6
265.
318)
(135
68.7
87)
(125
22.9
59)
(156
76.9
78)
(147
22.4
40)
(148
10.5
08)
Num
ber
of c
hild
bir
ths
at g
ov’t
prac
tice
in la
st m
onth
6.98
93.
123
0.20
2-1
.166
0.77
3-0
.393
1043
(1.2
15)
(0.6
03)
(0.8
00)
(1.2
93)
(1.1
33)
(0.9
07)
Fee
char
ged
for
child
bir
th
(avg
. of p
riva
te &
gov
’t )
2497
00.0
0030
7800
.000
1691
8.81
84**
1254
2.71
010
604.
603
2314
7.31
25**
888
(620
0.27
7)(1
1603
.178
)(8
478.
320)
(104
17.0
96)
(105
84.0
39)
(921
6.40
6)To
tal n
umbe
r of
chi
ld b
irth
s in
la
st m
onth
9.94
25.
701
0.03
1-1
.035
0.53
7-0
.497
1043
(1.2
32)
(0.6
40)
(0.8
36)
(1.3
08)
(1.1
68)
(0.9
36)
Fee
paid
by
mot
her
for
norm
al
child
birt
h11
2100
0.00
012
8400
0.00
023
1100
0.00
091
8900
0.00
0-2
3530
00.0
0068
3600
0.00
032
6(1
0590
0.00
0)(2
2610
0.00
0)(2
4120
00.0
00)
(738
0000
.000
)(2
2940
00.0
00)
(581
3000
.000
)Fe
e ch
arge
d fo
r A
NC
at p
riva
te
prac
tice
1231
4.42
514
642.
106
86.3
96-9
86.1
0356
7.51
6-4
18.5
8792
2(3
26.1
96)
(536
.801
)(4
78.4
55)
(617
.815
)(5
68.2
79)
(564
.900
)N
umbe
r of
AN
C v
isit
s at
pr
ivat
e pr
acti
ce in
last
mon
th3.
283
4.12
8-0
.753
5**
-0.1
61-0
.674
3*-0
.835
6**
1043
(0.3
28)
(0.5
76)
(0.3
69)
(0.3
48)
(0.4
08)
(0.4
09)
Fee
char
ged
for
AN
C a
t gov
’t pr
acti
ce26
19.4
4027
15.9
7244
.274
-365
.377
214.
721
-150
.656
771
(244
.963
)(3
45.4
66)
(329
.965
)(3
99.4
44)
(428
.815
)(3
30.4
14)
Num
ber
of A
NC
vis
it a
t gov
’t pr
acti
ce in
last
mon
th12
.641
6.96
70.
471
0.46
30.
244
0.70
610
43(1
.450
)(0
.910
)(1
.366
)(1
.519
)(1
.424
)(1
.694
)Fe
e ch
arge
d fo
r A
NC
vis
it (
avg.
of
pri
vate
& g
ov’t)
6123
.070
8927
.499
-649
.444
-151
.425
-575
.475
-726
.900
963
(303
.025
)(5
56.4
59)
(513
.564
)(5
65.1
94)
(582
.405
)(5
89.9
40)
Tota
l num
ber
of A
NC
vis
its
in
last
mon
th15
.924
11.0
95-0
.325
0.36
2-0
.502
-0.1
4110
43(1
.545
)(1
.065
)(1
.470
)(1
.647
)(1
.544
)(1
.819
)Fe
e pa
id b
y m
othe
r fo
r A
NC
vi
sit
1733
8.51
019
562.
107
735.
403
-672
.743
1077
.310
404.
567
1330
(756
.967
)(1
714.
741)
(174
5.37
9)(3
067.
317)
(242
0.07
0)(2
221.
658)

Indonesia’s PNPM Generasi Program: Interim Impact Evaluation Report 129
Annex
M
odel
1M
odel
2
Indi
cato
rB
asel
ine
mea
nC
ontr
ol m
ean
Tota
l Gen
eras
i Ye
ar 1
Eff
ect
Ver
si A
ad
diti
onal
eff
ect
Tota
l Ver
si B
im
pact
Tota
l Ver
si A
im
pact
Num
ber
obse
rvat
ions
(1)
(2)
(3)
(4)
(5)
(6)
(7)
Fee
char
ged
for
fam
ily p
lann
ing
visi
t at p
riva
te p
ract
ice
.14
292.
106
370.
282
161.
293
291.
500
452.
793
915
(.)
(640
.344
)(2
93.5
46)
(448
.026
)(4
24.6
38)
(303
.004
)N
umbe
r of
fam
ily p
lann
ing
visi
ts a
t pri
vate
pra
ctic
e
.34
.320
0.50
5-4
.242
2.56
8-1
.673
869
(.)
(2.8
45)
(3.2
00)
(4.5
58)
(3.9
07)
(3.9
90)
Fee
char
ged
for
fam
ily p
lann
ing
visi
t at g
ov’t
prac
tice
.80
73.4
27-3
01.6
8867
1.95
9-6
12.4
3659
.523
732
(.)
(114
4.91
0)(6
39.9
35)
(780
.387
)(8
35.2
14)
(638
.801
)N
umbe
r of
fam
ily p
lann
ing
visi
ts a
t gov
’t pr
acti
ce.
15.9
581.
772
-11.
506
7.36
0-4
.146
745
(.)
(2.6
49)
(4.6
79)
(11.
636)
(8.4
33)
(6.3
63)
Fee
char
ged
for
fam
ily p
lann
ing
visi
t (av
g. p
riva
te &
gov
’t).
1265
8.75
0-1
26.3
3538
1.86
6-3
13.0
3368
.833
975
(.)
(668
.079
)(3
44.7
71)
(453
.066
)(4
80.4
57)
(328
.442
)To
tal n
umbe
r of
fam
ily
plan
ning
vis
its
in la
st m
onth
.41
.764
0.14
8-1
0.89
05.
498
-5.3
9210
15(.
)(3
.011
)(4
.455
)(8
.932
)(7
.066
)(5
.516
)Fe
e pa
id b
y m
othe
r fo
r fa
mily
pl
anni
ng v
isit
1373
4.92
115
526.
718
-29.
472
-166
.460
53.2
80-1
13.1
8059
0(1
59.6
61)
(400
.210
)(3
24.3
64)
(527
.520
)(4
16.4
11)
(420
.518
)Pu
skes
mas
Nor
mal
chi
ldbi
rth
at
Pusk
esm
as -
fee
char
ged
by
mid
wife
1400
00.0
0018
3900
.000
1722
6.80
5-1
4250
.000
2463
3.84
610
381.
356
193
(981
5.07
0)(2
1105
.691
)(2
1378
.611
)(2
3969
.926
)(2
3783
.584
)(2
5297
.057
)N
orm
al c
hild
birt
h at
Pu
skes
mas
– q
uant
ity
by
45.0
2343
.808
-11.
812
-10.
342
-6.8
33-1
7.17
525
6
(3.9
01)
(9.5
34)
(14.
703)
(11.
664)
(15.
803)
(15.
832)
Nor
mal
chi
ldbi
rth
at
Pusk
esm
as -
fee
paid
by
mot
her
3226
00.0
0032
8400
.000
-727
60.0
0098
196.
836
-119
900.
000
-217
10.0
0052
(257
13.8
73)
(602
68.7
11)
(847
04.5
78)
(731
69.3
75)
(957
17.4
38)
(839
97.1
80)
Scho
ols
SD -
Ann
ual c
ost o
f sch
ool f
or
TA
07/
08.
3395
8.29
7-1
0160
.000
8708
.418
-144
80.0
00-5
767.
267
1055
(.)
(839
2.98
1)(1
2897
.368
)(1
3183
.061
)(1
3192
.259
)(1
5677
.502
)
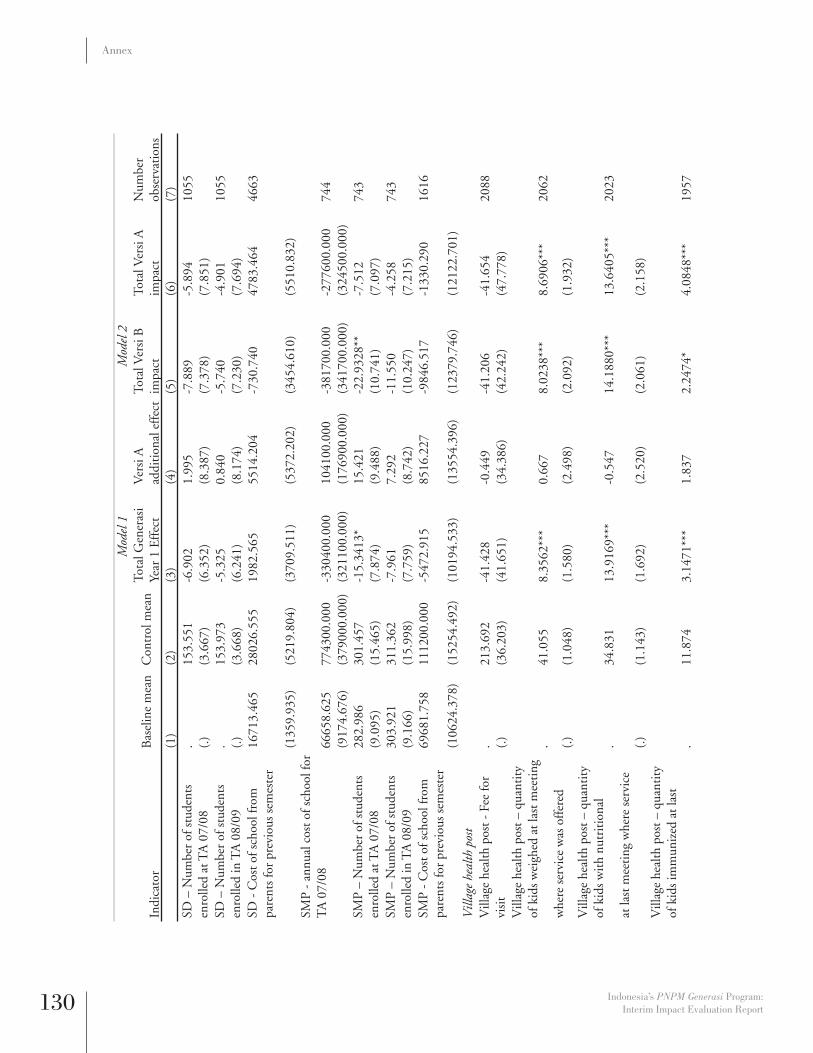
130 Indonesia’s PNPM Generasi Program: Interim Impact Evaluation Report
Annex
M
odel
1M
odel
2
Indi
cato
rB
asel
ine
mea
nC
ontr
ol m
ean
Tota
l Gen
eras
i Ye
ar 1
Eff
ect
Ver
si A
ad
diti
onal
eff
ect
Tota
l Ver
si B
im
pact
Tota
l Ver
si A
im
pact
Num
ber
obse
rvat
ions
(1)
(2)
(3)
(4)
(5)
(6)
(7)
SD –
Num
ber
of s
tude
nts
enro
lled
at T
A 0
7/08
.15
3.55
1-6
.902
1.99
5-7
.889
-5.8
9410
55(.
)(3
.667
)(6
.352
)(8
.387
)(7
.378
)(7
.851
)SD
– N
umbe
r of
stu
dent
s en
rolle
d in
TA
08/
09.
153.
973
-5.3
250.
840
-5.7
40-4
.901
1055
(.)
(3.6
68)
(6.2
41)
(8.1
74)
(7.2
30)
(7.6
94)
SD -
Cos
t of s
choo
l fro
m
pare
nts
for
prev
ious
sem
este
r16
713.
465
2802
6.55
519
82.5
6555
14.2
04-7
30.7
4047
83.4
6446
63
(135
9.93
5)(5
219.
804)
(370
9.51
1)(5
372.
202)
(345
4.61
0)(5
510.
832)
SMP
- an
nual
cos
t of s
choo
l for
T
A 0
7/08
6665
8.62
577
4300
.000
-330
400.
000
1041
00.0
00-3
8170
0.00
0-2
7760
0.00
074
4(9
174.
676)
(379
000.
000)
(321
100.
000)
(176
900.
000)
(341
700.
000)
(324
500.
000)
SMP
– N
umbe
r of
stu
dent
s en
rolle
d at
TA
07/
0828
2.98
630
1.45
7-1
5.34
13*
15.4
21-2
2.93
28**
-7.5
1274
3(9
.095
)(1
5.46
5)(7
.874
)(9
.488
)(1
0.74
1)(7
.097
)SM
P –
Num
ber
of s
tude
nts
enro
lled
in T
A 0
8/09
303.
921
311.
362
-7.9
617.
292
-11.
550
-4.2
5874
3(9
.166
)(1
5.99
8)(7
.759
)(8
.742
)(1
0.24
7)(7
.215
)SM
P -
Cos
t of s
choo
l fro
m
pare
nts
for
prev
ious
sem
este
r69
681.
758
1112
00.0
00-5
472.
915
8516
.227
-984
6.51
7-1
330.
290
1616
(106
24.3
78)
(152
54.4
92)
(101
94.5
33)
(135
54.3
96)
(123
79.7
46)
(121
22.7
01)
Vill
age
heal
th p
ost
Vill
age
heal
th p
ost -
Fee
for
visi
t.
213.
692
-41.
428
-0.4
49-4
1.20
6-4
1.65
420
88(.
)(3
6.20
3)(4
1.65
1)(3
4.38
6)(4
2.24
2)(4
7.77
8)V
illag
e he
alth
pos
t – q
uant
ity
of k
ids
wei
ghed
at l
ast m
eeti
ng.
41.0
558.
3562
***
0.66
78.
0238
***
8.69
06**
*20
62w
here
ser
vice
was
off
ered
(.)
(1.0
48)
(1.5
80)
(2.4
98)
(2.0
92)
(1.9
32)
Vill
age
heal
th p
ost –
qua
ntit
y of
kid
s w
ith
nutr
itio
nal
.34
.831
13.9
169*
**-0
.547
14.1
880*
**13
.640
5***
2023
at la
st m
eeti
ng w
here
ser
vice
(.
)(1
.143
)(1
.692
)(2
.520
)(2
.061
)(2
.158
)V
illag
e he
alth
pos
t – q
uant
ity
of k
ids
imm
uniz
ed a
t las
t .
11.8
743.
1471
***
1.83
72.
2474
*4.
0848
***
1957

Indonesia’s PNPM Generasi Program: Interim Impact Evaluation Report 131
Annex
M
odel
1M
odel
2
Indi
cato
rB
asel
ine
mea
nC
ontr
ol m
ean
Tota
l Gen
eras
i Ye
ar 1
Eff
ect
Ver
si A
ad
diti
onal
eff
ect
Tota
l Ver
si B
im
pact
Tota
l Ver
si A
im
pact
Num
ber
obse
rvat
ions
(1)
(2)
(3)
(4)
(5)
(6)
(7)
whe
re s
ervi
ce w
as o
ffer
ed(.
)(0
.651
)(0
.957
)(1
.459
)(1
.206
)(1
.176
)V
illag
e he
alth
pos
t – q
uant
ity
of m
oms
rece
ivin
g A
NC
vis
its
.4.
546
1.91
44**
*0.
810
1.51
50*
2.32
45**
*20
49at
last
mee
ting
whe
re s
ervi
ce
(.)
(0.3
59)
(0.5
74)
(0.8
96)
(0.8
22)
(0.6
03)
Vill
age
heal
th p
ost –
qua
ntit
y of
mom
s re
ceiv
ing
iron
pill
s.
4.80
42.
3030
***
1.03
11.
7937
*2.
8241
***
2011
at la
st m
eeti
ng w
here
ser
vice
w
as o
ffer
ed(.
)(0
.417
)(0
.655
)(1
.068
)(0
.918
)(0
.754
)V
illag
e he
alth
pos
t – q
uant
ity
of k
ids
rece
ivin
g V
itam
in A
.44
.068
8.81
03**
*4.
454
6.58
28**
11.0
373*
**19
58at
last
mee
ting
whe
re s
ervi
ce
was
off
ered
(.)
(1.5
65)
(2.4
48)
(3.2
92)
(2.8
49)
(3.0
29)
Vill
age
heal
th p
ost –
qua
ntit
y of
mom
s re
ceiv
ing
fam
ily
plan
ning
pill
s.
2.82
94.
282
9.01
9-0
.163
8.85
619
98at
last
mee
ting
whe
re s
ervi
ce
was
off
ered
(.)
(0.3
20)
(3.2
79)
(7.2
26)
(1.3
03)
(6.8
02)
Vill
age
heal
th p
ost –
qua
ntit
y .
2.80
7-0
.083
0.53
6-0
.347
0.18
919
98in
ject
ions
at l
ast m
eeti
ng w
here
se
rvic
e w
as o
ffer
ed(.
)(0
.381
)(0
.533
)(0
.787
)(0
.670
)(0
.650
)A
vera
ge s
tand
ardi
zed
effe
ct fe
es-0
.048
-0.2
220.
064
-0.1
58(0
.057
)(0
.159
)(0
.055
)(0
.127
)A
vera
ge s
tand
ardi
zed
effe
ct
heal
th fe
es-0
.070
-0.2
700.
066
-0.2
03(0
.071
)(0
.202
)(0
.068
)(0
.160
)A
vera
ge s
tand
ardi
zed
effe
ct
educ
atio
n fe
es0.
034
-0.0
440.
0559
*0.
012
(0.0
33)
(0.0
36)
(0.0
33)
(0.0
42)

132 Indonesia’s PNPM Generasi Program: Interim Impact Evaluation Report
Annex
M
odel
1M
odel
2
Indi
cato
rB
asel
ine
mea
nC
ontr
ol m
ean
Tota
l Gen
eras
i Ye
ar 1
Eff
ect
Ver
si A
ad
diti
onal
eff
ect
Tota
l Ver
si B
im
pact
Tota
l Ver
si A
im
pact
Num
ber
obse
rvat
ions
(1)
(2)
(3)
(4)
(5)
(6)
(7)
Ave
rage
sta
ndar
dize
d ef
fect
m
idw
ife fe
es-0
.107
-0.3
120.
052
-0.2
60(0
.086
)(0
.251
)(0
.083
)(0
.198
)A
vera
ge s
tand
ardi
zed
effe
ct
pusk
esm
as fe
es0.
094
-0.1
530.
166
0.01
2(0
.125
)(0
.121
)(0
.140
)(0
.129
)A
vera
ge s
tand
ardi
zed
effe
ct
scho
ol fe
es0.
034
-0.0
440.
0559
*0.
012
(0.0
33)
(0.0
36)
(0.0
33)
(0.0
42)
Ave
rage
sta
ndar
dize
d ef
fect
vi
llage
hea
lth p
ost f
ees
0.04
50.
001
0.04
50.
045
(0.0
45)
(0.0
37)
(0.0
46)
(0.0
52)
Ave
rage
sta
ndar
dize
d ef
fect
qu
anti
ties
0.07
68**
0.05
30.
051
0.09
90**
(0.0
32)
(0.0
58)
(0.0
35)
(0.0
47)
Ave
rage
sta
ndar
dize
d ef
fect
he
alth
qua
ntit
ies
0.10
92**
*0.
057
0.08
08**
0.13
80**
(0.0
36)
(0.0
66)
(0.0
38)
(0.0
57)
Ave
rage
sta
ndar
dize
d ef
fect
-0
.069
0.03
4-0
.086
-0.0
52(0
.050
)(0
.064
)(0
.058
)(0
.061
)A
vera
ge s
tand
ardi
zed
effe
ct
mid
wife
qua
ntit
ies
-0.0
09-0
.051
0.01
6-0
.035
(0.0
40)
(0.0
56)
(0.0
51)
(0.0
46)
Ave
rage
sta
ndar
dize
d ef
fect
pu
skes
mas
qua
ntit
ies
-0.1
41-0
.124
-0.0
82-0
.205
(0.1
66)
(0.1
31)
(0.1
78)
(0.1
78)
Ave
rage
sta
ndar
dize
d ef
fect
sc
hool
qua
ntit
ies
-0.0
690.
034
-0.0
86-0
.052
(0.0
50)
(0.0
64)
(0.0
58)
(0.0
61)
Ave
rage
sta
ndar
dize
d ef
fect
vi
llage
hea
lth p
ost q
uant
itie
s0.
2738
***
0.20
20.
1743
***
0.37
60**
*
(0.0
64)
(0.1
27)
(0.0
55)
(0.1
15)

Indonesia’s PNPM Generasi Program: Interim Impact Evaluation Report 133
Annex
Tab
le 5
6. R
esul
ts fo
r se
rvic
e-pr
ovid
er-b
ased
qua
ntit
ies,
Jav
a (b
asel
ine
as c
ontr
ol v
aria
ble)
M
odel
1M
odel
2
Indi
cato
rB
asel
ine
mea
nC
ontr
ol m
ean
Tota
l Gen
eras
i Ye
ar 1
Eff
ect
Ver
si A
ad
diti
onal
eff
ect
Tota
l Ver
si B
im
pact
Tota
l Ver
si A
impa
ctN
umbe
r ob
serv
atio
ns(1
)(2
)(3
)(4
)(5
)(6
)(7
)M
idw
ife
Fee
char
ged
for
child
birt
h at
pr
ivat
e pr
acti
ce35
1900
.000
4035
00.0
0011
478.
9863
*49
9.41
711
220.
440
1171
9.85
769
0(4
159.
818)
(686
3.08
1)(5
939.
805)
(885
0.00
0)(7
118.
613)
(768
0.30
5)N
umbe
r of
chi
ldbi
rths
at p
riva
te
prac
tice
in la
st m
onth
3.78
63.
184
-0.2
070.
441
-0.4
290.
012
712
(0.1
98)
(0.2
79)
(0.3
19)
(0.3
22)
(0.3
24)
(0.3
89)
Fee
char
ged
for
child
birt
h at
gov
’t pr
acti
ce15
6900
.000
2579
00.0
0027
318.
123
2202
7.21
516
353.
078
3838
0.29
30*
450
(834
9.87
5)(1
7925
.639
)(1
8564
.885
)(2
3253
.984
)(2
2020
.680
)(2
1691
.897
)N
umbe
r of
chi
ldbi
rths
at g
ov’t
prac
tice
in la
st m
onth
7.44
83.
606
-0.6
16-1
.555
0.16
3-1
.392
713
(1.6
73)
(0.8
79)
(1.0
19)
(1.3
47)
(1.3
66)
(1.0
59)
Fee
char
ged
for
child
birt
h (a
vg. o
f pr
ivat
e &
gov
’t )
3012
00.0
0037
5000
.000
1764
4.87
30*
2219
1.66
21*
6166
.756
2835
8.41
80**
*63
5(6
263.
445)
(999
7.45
9)(9
317.
905)
(122
52.3
56)
(119
23.3
25)
(102
93.0
46)
Tota
l num
ber
of c
hild
birt
hs in
la
st m
onth
11.2
346.
768
-0.7
23-1
.206
-0.1
18-1
.325
713
(1.6
93)
(0.9
17)
(1.0
64)
(1.3
67)
(1.4
12)
(1.0
99)
Fee
paid
by
mot
her
for
norm
al
child
birt
h11
9400
0.00
011
3700
0.00
028
1100
0.00
010
8000
00.0
00-2
9920
00.0
0078
1000
0.00
026
3(1
1990
0.00
0)(2
2100
0.00
0)(2
8160
00.0
00)
(864
6000
.000
)(3
0080
00.0
00)
(656
0000
.000
)Fe
e ch
arge
d fo
r A
NC
at p
riva
te
prac
tice
1465
1.31
516
318.
841
48.4
96-1
245.
0643
*68
7.75
6-5
57.3
0969
8(3
17.8
40)
(486
.894
)(5
22.2
09)
(659
.195
)(6
16.4
11)
(597
.064
)N
umbe
r of
AN
C v
isit
s at
pri
vate
pr
acti
ce in
last
mon
th4.
268
5.36
6-1
.001
0*0.
167
-1.0
845*
*-0
.918
713
(0.4
51)
(0.7
98)
(0.5
08)
(0.4
79)
(0.5
48)
(0.5
74)
Fee
char
ged
for
AN
C a
t gov
’t pr
acti
ce26
49.2
8929
02.3
2628
8.24
0-8
33.2
8167
2.80
2-1
60.4
7946
6(1
20.2
52)
(471
.650
)(4
49.8
04)
(544
.940
)(6
19.1
99)
(392
.765
)

134 Indonesia’s PNPM Generasi Program: Interim Impact Evaluation Report
Annex
M
odel
1M
odel
2
Indi
cato
rB
asel
ine
mea
nC
ontr
ol m
ean
Tota
l Gen
eras
i Ye
ar 1
Eff
ect
Ver
si A
ad
diti
onal
eff
ect
Tota
l Ver
si B
im
pact
Tota
l Ver
si A
impa
ctN
umbe
r ob
serv
atio
ns(1
)(2
)(3
)(4
)(5
)(6
)(7
)N
umbe
r of
AN
C v
isit
at g
ov’t
prac
tice
in la
st m
onth
13.7
107.
028
-0.1
981.
515
-0.9
540.
561
713
(1.9
98)
(1.2
59)
(1.6
69)
(1.5
90)
(1.4
16)
(2.1
74)
Fee
char
ged
for
AN
C v
isit
(av
g. o
f pr
ivat
e &
gov
’t)71
43.1
6010
590.
042
-235
.962
-433
.444
-15.
801
-449
.244
674
(262
.631
)(6
59.1
26)
(664
.926
)(7
87.9
74)
(777
.804
)(7
65.6
30)
Tota
l num
ber
of A
NC
vis
its
in
last
mon
th17
.978
12.3
94-1
.216
1.79
0-2
.105
-0.3
1671
3(2
.130
)(1
.478
)(1
.828
)(1
.810
)(1
.561
)(2
.400
)Fe
e pa
id b
y m
othe
r fo
r A
NC
vis
it18
087.
273
1964
2.73
454
4.14
1-6
.752
547.
664
540.
913
1204
(817
.291
)(1
574.
498)
(166
8.17
7)(2
857.
894)
(211
0.40
6)(2
271.
800)
Fee
char
ged
for
fam
ily p
lann
ing
visi
t at p
riva
te p
ract
ice
.14
684.
782
65.8
75-4
13.3
9527
8.40
3-1
34.9
9269
9(.
)(1
58.5
96)
(260
.349
)(3
92.7
05)
(375
.437
)(2
59.5
65)
Num
ber
of fa
mily
pla
nnin
g vi
sits
at
pri
vate
pra
ctic
e
.42
.095
0.42
6-5
.432
3.20
4-2
.229
684
in la
st m
onth
(.)
(3.4
31)
(4.2
01)
(5.8
35)
(5.2
83)
(5.0
23)
Fee
char
ged
for
fam
ily p
lann
ing
visi
t at g
ov’t
prac
tice
.79
45.1
2254
8.40
046
1.34
933
6.79
779
8.14
642
7(.
)(7
43.9
92)
(726
.618
)(1
005.
656)
(984
.657
)(7
54.5
01)
Num
ber
of fa
mily
pla
nnin
g vi
sits
at
gov
’t pr
acti
ce.
17.9
63-3
.536
-3.4
70-1
.803
-5.2
7344
5in
last
mon
th(.
)(4
.250
)(5
.016
)(6
.516
)(6
.578
)(5
.360
)Fe
e ch
arge
d fo
r fa
mily
pla
nnin
g vi
sit (
avg.
pri
vate
& g
ov’t)
.13
852.
502
192.
500
37.7
0517
3.39
821
1.10
468
6(.
)(2
45.1
72)
(320
.501
)(4
29.3
56)
(442
.365
)(3
22.3
36)
Tota
l num
ber
of fa
mily
pla
nnin
g vi
sits
in la
st m
onth
.51
.714
-4.2
49-6
.230
-1.0
78-7
.308
703
(.)
(3.9
16)
(5.1
37)
(6.6
11)
(6.6
88)
(5.5
89)
Fee
paid
by
mot
her
for
fam
ily
plan
ning
vis
it14
200.
355
1580
8.69
5-2
00.7
04-4
2.05
4-1
79.7
60-2
21.8
1452
9(1
37.5
59)
(400
.352
)(3
16.6
03)
(571
.903
)(4
27.7
84)
(425
.877
)

Indonesia’s PNPM Generasi Program: Interim Impact Evaluation Report 135
Annex
M
odel
1M
odel
2
Indi
cato
rB
asel
ine
mea
nC
ontr
ol m
ean
Tota
l Gen
eras
i Ye
ar 1
Eff
ect
Ver
si A
ad
diti
onal
eff
ect
Tota
l Ver
si B
im
pact
Tota
l Ver
si A
impa
ctN
umbe
r ob
serv
atio
ns(1
)(2
)(3
)(4
)(5
)(6
)(7
)Pu
skes
mas
Nor
mal
chi
ldbi
rth
at
Pusk
esm
as—
fee
char
ged
by
mid
wife
1755
00.0
0024
4500
.000
6140
.040
-442
90.0
0030
625.
551
-136
70.0
0011
9(1
3823
.153
)(2
9725
.004
)(3
1992
.010
)(3
5966
.238
)(3
5452
.707
)(3
8218
.539
)N
orm
al c
hild
birt
h at
Pu
skes
mas
—qu
anti
ty b
y m
idw
ife
53.7
1253
.412
-17.
563
-14.
867
-10.
223
-25.
091
174
(5.4
66)
(13.
800)
(22.
091)
(17.
597)
(24.
075)
(23.
491)
Nor
mal
chi
ldbi
rth
at
Pusk
esm
as—
fee
paid
by
mot
her
4155
00.0
0046
8200
.000
-135
5.63
117
206.
916
-100
20.0
0071
88.9
6529
(323
05.6
58)
(691
74.5
94)
(109
200.
000)
(100
100.
000)
(129
500.
000)
(117
800.
000)
Scho
ols
SD—
Ann
ual c
ost o
f sch
ool f
or
TA
07/
08.
3480
1.10
2-1
8890
.000
6757
.504
-223
00.0
00-1
5540
.000
716
(.)
(118
36.0
44)
(181
36.8
98)
(186
96.6
35)
(183
44.4
43)
(222
28.9
51)
SD—
Num
ber
of s
tude
nts
enro
lled
at T
A 0
7/08
.15
0.09
9-0
.240
5.40
9-2
.968
2.44
171
6(.
)(4
.543
)(7
.971
)(9
.475
)(8
.669
)(9
.861
)SD
—N
umbe
r of
stu
dent
s en
rolle
d in
TA
08/
09.
149.
576
-0.0
605.
620
-2.8
942.
726
716
(.)
(4.4
62)
(7.8
05)
(9.5
30)
(8.5
31)
(9.7
38)
SD—
Cos
t of s
choo
l fro
m p
aren
ts
for
prev
ious
sem
este
r22
237.
020
2822
4.16
048
3.16
550
96.2
76-2
111.
263
2985
.013
2737
(224
8.00
2)(8
621.
638)
(536
8.06
0)(8
965.
915)
(499
0.00
1)(8
518.
420)
SMP—
annu
al c
ost o
f sch
ool f
or
TA
07/
0857
393.
641
1001
000.
000
-860
10.0
0097
367.
961
-135
500.
000
-381
20.0
0051
9(8
539.
093)
(577
200.
000)
(161
900.
000)
(206
200.
000)
(185
100.
000)
(199
300.
000)
SMP—
Num
ber
of s
tude
nts
enro
lled
at T
A 0
7/08
321.
951
339.
993
-19.
7770
*20
.664
3*-3
0.25
90**
-9.5
9551
8(1
1.70
8)(2
0.80
8)(1
0.44
0)(1
1.89
0)(1
4.29
1)(9
.002
)SM
P—N
umbe
r of
stu
dent
s en
rolle
d in
TA
08/
0934
4.04
934
4.11
2-4
.999
10.8
16-1
0.48
30.
333
518

136 Indonesia’s PNPM Generasi Program: Interim Impact Evaluation Report
Annex
M
odel
1M
odel
2
Indi
cato
rB
asel
ine
mea
nC
ontr
ol m
ean
Tota
l Gen
eras
i Ye
ar 1
Eff
ect
Ver
si A
ad
diti
onal
eff
ect
Tota
l Ver
si B
im
pact
Tota
l Ver
si A
impa
ctN
umbe
r ob
serv
atio
ns(1
)(2
)(3
)(4
)(5
)(6
)(7
)(1
1.82
1)(2
1.58
0)(1
0.23
5)(1
2.60
0)(1
4.65
4)(8
.655
)SM
P—C
ost o
f sch
ool f
rom
pa
rent
s fo
r pr
evio
us s
emes
ter
6624
7.03
910
2100
.000
-773
8.81
811
974.
637
-140
00.0
00-2
024.
986
1096
(685
4.38
2)(1
4912
.148
)(1
0139
.580
)(1
5739
.694
)(1
2369
.708
)(1
3375
.269
)V
illag
e he
alth
pos
tV
illag
e he
alth
pos
t—Fe
e fo
r vi
sit
.18
0.28
5-6
7.44
3-2
6.31
1-5
4.12
2-8
0.43
314
19(.
)(4
9.33
7)(5
8.92
7)(4
2.09
9)(5
8.83
1)(6
5.80
0)V
illag
e he
alth
pos
t—qu
anti
ty o
f ki
ds w
eigh
ed a
t las
t mee
ting
.41
.427
8.67
60**
*0.
245
8.55
16**
*8.
7964
***
1404
whe
re s
ervi
ce w
as o
ffer
ed(.
)(1
.265
)(2
.048
)(3
.237
)(2
.659
)(2
.564
)V
illag
e he
alth
pos
t—qu
anti
ty o
f ki
ds w
ith
nutr
itio
nal s
uppl
emen
t.
37.8
5212
.200
8***
-0.2
6512
.335
3***
12.0
706*
**13
86at
last
mee
ting
whe
re s
ervi
ce w
as
offe
red
(.)
(1.4
39)
(2.2
14)
(3.2
90)
(2.8
01)
(2.7
17)
Vill
age
heal
th p
ost—
quan
tity
of
kids
imm
uniz
ed a
t las
t mee
ting
.10
.221
3.05
67**
-0.0
403.
0763
*3.
0368
**13
29w
here
ser
vice
was
off
ered
(.)
(0.7
39)
(1.2
57)
(1.9
74)
(1.7
05)
(1.4
84)
Vill
age
heal
th p
ost—
quan
tity
of
mom
s re
ceiv
ing
AN
C v
isit
s .
3.94
01.
9180
**-0
.156
1.99
67*
1.84
04**
1391
at la
st m
eeti
ng w
here
ser
vice
was
of
fere
d(.
)(0
.427
)(0
.740
)(1
.257
)(1
.147
)(0
.761
)V
illag
e he
alth
pos
t—qu
anti
ty o
f m
oms
rece
ivin
g ir
on p
ills
.3.
826
2.72
32**
*0.
744
2.34
87**
3.09
25**
*13
65at
last
mee
ting
whe
re s
ervi
ce w
as
offe
red
(.)
(0.4
54)
(0.7
83)
(1.3
63)
(1.1
67)
(0.8
82)
Vill
age
heal
th p
ost—
qua
ntit
y of
ki
ds r
ecei
ving
Vit
amin
A.
46.8
416.
3287
**3.
474
4.54
98.
0227
**13
39at
last
mee
ting
whe
re s
ervi
ce w
as
offe
red
(.)
(1.8
74)
(3.0
71)
(4.3
62)
(3.7
29)
(3.7
65)
Vill
age
heal
th p
ost—
quan
tity
of
mom
s re
ceiv
ing
fam
ily p
lann
ing
pills
.1.
883
6.29
812
.684
-0.0
5712
.627
1365

Indonesia’s PNPM Generasi Program: Interim Impact Evaluation Report 137
Annex
M
odel
1M
odel
2
Indi
cato
rB
asel
ine
mea
nC
ontr
ol m
ean
Tota
l Gen
eras
i Ye
ar 1
Eff
ect
Ver
si A
ad
diti
onal
eff
ect
Tota
l Ver
si B
im
pact
Tota
l Ver
si A
impa
ctN
umbe
r ob
serv
atio
ns(1
)(2
)(3
)(4
)(5
)(6
)(7
)at
last
mee
ting
whe
re s
ervi
ce w
as
offe
red
(.)
(0.2
59)
(4.9
97)
(11.
163)
(1.9
41)
(10.
370)
Vill
age
heal
th p
ost—
quan
tity
of
mom
s re
ceiv
ing
fam
ily p
lann
ing
.1.
528
0.26
10.
352
0.08
50.
437
1370
inje
ctio
ns a
t las
t mee
ting
whe
re
serv
ice
was
off
ered
(.)
(0.2
71)
(0.6
57)
(0.9
73)
(0.8
44)
(0.7
85)
Ave
rage
sta
ndar
dize
d ef
fect
fees
-0.1
06-0
.296
0.05
4-0
.243
(0.0
88)
(0.2
53)
(0.0
93)
(0.1
94)
Ave
rage
sta
ndar
dize
d ef
fect
hea
lth
fees
-0.1
45-0
.364
0.05
1-0
.313
(0.1
11)
(0.3
21)
(0.1
18)
(0.2
45)
Ave
rage
sta
ndar
dize
d ef
fect
ed
ucat
ion
fees
0.04
2-0
.043
0.06
43*
0.02
1(0
.037
)(0
.049
)(0
.037
)(0
.052
)A
vera
ge s
tand
ardi
zed
effe
ct
mid
wife
fees
-0.1
85-0
.471
0.06
9-0
.402
(0.1
36)
(0.3
99)
(0.1
46)
(0.3
04)
Ave
rage
sta
ndar
dize
d ef
fect
pu
skes
mas
fees
-0.0
140.
087
-0.0
640.
023
(0.1
68)
(0.1
70)
(0.1
91)
(0.1
87)
Ave
rage
sta
ndar
dize
d ef
fect
sch
ool
fees
0.04
2-0
.043
0.06
43*
0.02
1(0
.037
)(0
.049
)(0
.037
)(0
.052
)A
vera
ge s
tand
ardi
zed
effe
ct v
illag
e he
alth
pos
t fee
s0.
067
0.02
60.
054
0.08
0(0
.059
)(0
.042
)(0
.058
)(0
.065
)A
vera
ge s
tand
ardi
zed
effe
ct
quan
titi
es0.
1003
*0.
121
0.04
00.
154
(0.0
55)
(0.1
08)
(0.0
44)
(0.0
95)
Ave
rage
sta
ndar
dize
d ef
fect
hea
lth
quan
titi
es0.
1283
**0.
132
0.06
20.
1942
*(0
.065
)(0
.128
)(0
.049
)(0
.118
)

138 Indonesia’s PNPM Generasi Program: Interim Impact Evaluation Report
Annex
M
odel
1M
odel
2
Indi
cato
rB
asel
ine
mea
nC
ontr
ol m
ean
Tota
l Gen
eras
i Ye
ar 1
Eff
ect
Ver
si A
ad
diti
onal
eff
ect
Tota
l Ver
si B
im
pact
Tota
l Ver
si A
impa
ctN
umbe
r ob
serv
atio
ns(1
)(2
)(3
)(4
)(5
)(6
)(7
)A
vera
ge s
tand
ardi
zed
effe
ct
educ
atio
n qu
anti
ties
-0.0
250.
070
-0.0
610.
010
(0.0
63)
(0.0
76)
(0.0
72)
(0.0
75)
Ave
rage
sta
ndar
dize
d ef
fect
m
idw
ife q
uant
itie
s-0
.048
-0.0
14-0
.041
-0.0
54(0
.047
)(0
.056
)(0
.054
)(0
.056
)A
vera
ge s
tand
ardi
zed
effe
ct
pusk
esm
as q
uant
itie
s-0
.180
-0.1
52-0
.105
-0.2
57(0
.216
)(0
.172
)(0
.235
)(0
.229
)A
vera
ge s
tand
ardi
zed
effe
ct s
choo
l qu
anti
ties
-0.0
250.
070
-0.0
610.
010
(0.0
63)
(0.0
76)
(0.0
72)
(0.0
75)
Ave
rage
sta
ndar
dize
d ef
fect
vill
age
heal
th p
ost q
uant
itie
s0.
3646
***
0.33
20.
1983
**0.
5298
**
(0.1
33)
(0.2
82)
(0.0
89)
(0.2
57)

Indonesia’s PNPM Generasi Program: Interim Impact Evaluation Report 139
Annex
Tab
le 5
7. R
esul
ts fo
r se
rvic
e-pr
ovid
er-b
ased
qua
ntit
ies,
Eas
t N
usa
Teng
gara
(ba
selin
e as
con
trol
var
iabl
e)
Mod
el 1
Mod
el 2
Indi
cato
rB
asel
ine
mea
nC
ontr
ol
mea
nTo
tal G
ener
asi Y
ear
1 E
ffec
tV
ersi
A
addi
tion
al e
ffec
tTo
tal V
ersi
B
impa
ctTo
tal V
ersi
A
impa
ctN
umbe
r ob
serv
atio
ns(1
)(2
)(3
)(4
)(5
)(6
)(7
)M
idw
ifeFe
e ch
arge
d fo
r ch
ildbi
rth
at p
riva
te
prac
tice
3471
2.64
592
000.
000
1412
8.06
0-3
3540
.000
2837
9.76
0-5
163.
729
125
(674
7.71
4)(2
2900
.147
)(2
2027
.369
)(2
4412
.715
)(2
5893
.920
)(2
2921
.141
)N
umbe
r of
chi
ldbi
rths
at p
riva
te
prac
tice
in la
st m
onth
0.31
00.
419
-0.0
26-0
.173
0.05
7-0
.117
204
(0.0
91)
(0.1
90)
(0.1
98)
(0.2
14)
(0.2
32)
(0.2
16)
Fee
char
ged
for
child
birt
h at
gov
’t pr
acti
ce54
288.
992
4753
5.71
520
679.
451
-168
60.0
0028
740.
152
1188
1.31
319
4(6
589.
469)
(126
34.0
94)
(160
32.8
68)
(233
83.5
37)
(202
69.4
94)
(189
10.4
84)
Num
ber
of c
hild
birt
hs a
t gov
’t pr
acti
ce
in la
st m
onth
8.17
72.
194
1.45
8-2
.349
2.55
30.
205
204
(1.5
75)
(0.5
28)
(1.4
34)
(3.1
76)
(2.2
43)
(2.0
59)
Fee
char
ged
for
child
birt
h (a
vg. o
f pr
ivat
e &
gov
’t )
5622
4.16
464
500.
000
1996
6.17
6-2
2170
.000
3122
2.98
290
53.0
9515
0(7
054.
939)
(207
18.9
69)
(195
57.3
59)
(221
33.4
08)
(235
49.8
63)
(210
97.4
63)
Tota
l num
ber
of c
hild
birt
hs in
last
m
onth
8.48
72.
613
1.46
6-2
.590
2.67
20.
082
204
(1.5
92)
(0.5
26)
(1.4
39)
(3.2
56)
(2.2
93)
(2.0
73)
Fee
paid
by
mot
her
for
norm
al
child
birt
h52
5200
.000
2651
00.0
0016
1700
.000
2458
00.0
0011
598.
646
2574
00.0
0030
(561
10.1
91)
(241
200.
000)
(359
900.
000)
(347
100.
000)
(280
900.
000)
Fee
char
ged
for
AN
C a
t pri
vate
pra
ctic
e92
2.61
942
50.0
00-1
388.
814
-100
.331
-134
8.03
6-1
448.
367
114
(279
.267
)(1
507.
656)
(114
9.95
4)(1
459.
866)
(117
4.55
9)(1
594.
058)
Num
ber
of A
NC
vis
its
at p
riva
te
prac
tice
in la
st m
onth
0.22
10.
355
-0.2
95-0
.331
-0.1
37-0
.467
4*20
4(0
.077
)(0
.171
)(0
.279
)(0
.307
)(0
.373
)(0
.250
)Fe
e ch
arge
d fo
r A
NC
at g
ov’t
prac
tice
2616
.823
1423
.077
-368
.377
-313
.255
-218
.799
-532
.054
189
(128
1.32
7)(3
60.2
27)
(538
.416
)(5
54.9
67)
(714
.799
)(4
63.8
64)
Num
ber
of A
NC
vis
it a
t gov
’t pr
acti
ce
in la
st m
onth
11.4
076.
194
3.56
3-2
.060
4.54
22.
482
204
(1.6
87)
(1.6
01)
(3.4
54)
(3.9
90)
(4.1
09)
(3.7
86)
Fee
char
ged
for
AN
C v
isit
(av
g. o
f pr
ivat
e &
gov
’t)27
68.9
3723
51.4
29-8
99.7
17-2
30.1
00-7
97.2
04-1
027.
3043
*17
7

140 Indonesia’s PNPM Generasi Program: Interim Impact Evaluation Report
Annex
M
odel
1M
odel
2
Indi
cato
rB
asel
ine
mea
nC
ontr
ol
mea
nTo
tal G
ener
asi Y
ear
1 E
ffec
tV
ersi
A
addi
tion
al e
ffec
tTo
tal V
ersi
B
impa
ctTo
tal V
ersi
A
impa
ctN
umbe
r ob
serv
atio
ns(1
)(2
)(3
)(4
)(5
)(6
)(7
)(1
383.
104)
(692
.964
)(6
76.3
02)
(605
.334
)(8
34.3
87)
(606
.322
)To
tal n
umbe
r of
AN
C v
isit
s in
last
m
onth
11.6
286.
548
3.13
0-2
.425
4.28
21.
857
204
(1.7
00)
(1.5
88)
(3.5
07)
(4.0
64)
(4.2
55)
(3.7
40)
Fee
paid
by
mot
her
for
AN
C v
isit
6044
.484
6187
.500
1697
8.41
4-2
2250
.000
2757
7.83
053
29.6
7470
(167
4.31
5)(4
749.
753)
(177
94.2
07)
(304
63.7
93)
(288
63.1
07)
(153
92.8
64)
Fee
char
ged
for
fam
ily p
lann
ing
visi
t at
priv
ate
prac
tice
.26
11.1
1111
1.37
455
1.20
1-1
09.3
1644
1.88
510
4(.
)(9
83.9
86)
(808
.159
)(1
296.
153)
(886
.210
)(1
219.
587)
Num
ber
of fa
mily
pla
nnin
g vi
sits
at
priv
ate
prac
tice
.
1.13
3-1
.042
0.97
6-1
.442
-0.4
6681
in la
st m
onth
(.)
(0.5
06)
(1.2
04)
(1.5
87)
(1.1
82)
(1.7
24)
Fee
char
ged
for
fam
ily p
lann
ing
visi
t at
gov’
t pra
ctic
e.
1592
.593
-161
.075
99.2
77-2
07.1
38-1
07.8
6118
9(.
)(3
36.5
62)
(355
.054
)(4
53.0
24)
(383
.556
)(4
62.2
69)
Num
ber
of fa
mily
pla
nnin
g vi
sits
at
gov’
t pra
ctic
e.
12.0
7111
.142
-31.
557
25.9
91-5
.566
189
in la
st m
onth
(.)
(2.1
07)
(12.
163)
(34.
789)
(24.
052)
(18.
513)
Fee
char
ged
for
fam
ily p
lann
ing
visi
t (a
vg. p
riva
te &
gov
’t).
1987
.654
-525
.809
233.
201
-632
.852
-399
.651
176
(.)
(454
.648
)(4
08.8
52)
(482
.714
)(4
33.0
34)
(525
.614
)To
tal n
umbe
r of
fam
ily p
lann
ing
visi
ts
in la
st m
onth
.12
.679
10.0
38-3
1.20
624
.704
-6.5
0219
1(.
)(2
.029
)(1
2.18
1)(3
4.04
9)(2
3.74
4)(1
8.20
9)Fe
e pa
id b
y m
othe
r fo
r fa
mily
pla
nnin
g vi
sit
3125
.000
9000
.000
5000
.000
-184
2.10
557
89.4
736*
*39
47.3
684*
**19
(579
.423
)(5
567.
764)
0.00
0 (1
792.
710)
(222
7.79
7)(8
23.8
81)
Pusk
esm
asN
orm
al c
hild
birt
h at
Pus
kesm
as—
fee
char
ged
by m
idw
ife42
795.
453
9485
7.14
1-1
0760
.000
1044
6.59
4-1
5670
.000
-522
2.36
647
(952
8.39
2)(2
9567
.738
)(2
3502
.625
)(2
5136
.674
)(2
7751
.059
)(2
6035
.744
)N
orm
al c
hild
birt
h at
Pus
kesm
as—
quan
tity
by
mid
wife
24
.451
31.1
54-1
0.62
66.
977
-13.
833
-6.8
5648
(2.8
54)
(16.
350)
(16.
363)
(12.
515)
(16.
829)
(18.
737)
Nor
mal
chi
ldbi
rth
at P
uske
smas
—fe
e pa
id b
y m
othe
r17
4900
.000
1180
00.0
00-1
.500
e+04
***
3600
00.0
00-3
7500
0.00
0-1
5000
.000
12(2
5373
.746
)(4
1521
.078
)(0
.009
)0.
000
0.00
0 0.
000

Indonesia’s PNPM Generasi Program: Interim Impact Evaluation Report 141
Annex
M
odel
1M
odel
2
Indi
cato
rB
asel
ine
mea
nC
ontr
ol
mea
nTo
tal G
ener
asi Y
ear
1 E
ffec
tV
ersi
A
addi
tion
al e
ffec
tTo
tal V
ersi
B
impa
ctTo
tal V
ersi
A
impa
ctN
umbe
r ob
serv
atio
ns(1
)(2
)(3
)(4
)(5
)(6
)(7
)Sc
hool
sSD
—A
nnua
l cos
t of s
choo
l for
TA
07
/08
.21
991.
525
2311
6.35
018
527.
055
1388
6.04
132
413.
094
203
(.)
(105
11.2
31)
(224
28.0
61)
(212
69.4
90)
(251
72.9
86)
(245
86.0
82)
SD—
Num
ber
of s
tude
nts
enro
lled
at
TA
07/
08.
166.
915
-40.
6978
***
-25.
328
-28.
079
-53.
4070
***
203
(.)
(8.5
73)
(12.
838)
(20.
392)
(18.
014)
(14.
092)
SD—
Num
ber
of s
tude
nts
enro
lled
in
TA
08/
09.
171.
356
-35.
8940
***
-29.
515
-21.
190
-50.
7043
***
203
(.)
(9.2
11)
(12.
970)
(18.
894)
(17.
598)
(13.
698)
SD—
Cos
t of s
choo
l fro
m p
aren
ts fo
r pr
evio
us s
emes
ter
9034
.550
3232
5.00
0-7
55.8
6246
64.3
53-3
059.
726
1604
.627
1302
(968
.681
)(7
752.
840)
(528
6.64
8)(7
318.
863)
(552
2.47
0)(7
155.
377)
SMP—
annu
al c
ost o
f sch
ool f
or T
A
07/0
813
0500
.000
3123
00.0
0066
177.
969
2.68
5e+0
5*-5
7120
.000
2114
00.0
0012
5(4
0537
.965
)(9
9505
.328
)(9
5044
.609
)(1
5260
0.00
0)(1
0250
0.00
0)(1
2830
0.00
0)SM
P—N
umbe
r of
stu
dent
s en
rolle
d at
T
A 0
7/08
222.
379
294.
342
-24.
818
4.39
8-2
6.81
7-2
2.41
912
5(1
5.73
0)(2
6.76
6)(1
8.39
9)(2
2.20
6)(2
5.81
4)(1
4.65
1)SM
P—N
umbe
r of
stu
dent
s en
rolle
d in
T
A 0
8/09
241.
024
320.
368
-22.
9598
*-9
.406
-18.
706
-28.
1125
*12
5(1
5.65
8)(2
9.60
1)(1
3.45
5)(9
.662
)(1
3.38
1)(1
5.19
7)SM
P—C
ost o
f sch
ool f
rom
par
ents
for
prev
ious
sem
este
r12
4200
.000
1163
00.0
00-1
1090
.000
-159
70.0
00-2
985.
496
-189
50.0
0029
9(6
6527
.031
)(4
7143
.902
)(2
7736
.481
)(3
4934
.363
)(3
4407
.852
)(3
0730
.357
)V
illag
e he
alth
pos
tV
illag
e he
alth
pos
t—Fe
e fo
r vi
sit
.42
0.16
813
.964
63.2
41-1
7.26
445
.977
403
(.)
(83.
750)
(72.
025)
(76.
263)
(77.
919)
(82.
924)
Vill
age
heal
th p
ost—
quan
tity
of k
ids
wei
ghed
at l
ast m
eeti
ng w
here
ser
vice
w
as o
ffer
ed.
44.5
564.
904
5.28
52.
279
7.56
38**
398
(.)
(2.1
69)
(3.1
67)
(4.5
78)
(4.1
78)
(3.4
42)
Vill
age
heal
th p
ost—
quan
tity
of k
ids
wit
h nu
trit
iona
l sup
plem
ent
.28
.531
16.1
121*
**-0
.065
16.1
436*
**16
.078
9***
386
at la
st m
eeti
ng w
here
ser
vice
was
off
ered
(.)
(2.6
18)
(2.5
48)
(4.0
75)
(3.2
15)
(3.3
18)

142 Indonesia’s PNPM Generasi Program: Interim Impact Evaluation Report
Annex
M
odel
1M
odel
2
Indi
cato
rB
asel
ine
mea
nC
ontr
ol
mea
nTo
tal G
ener
asi Y
ear
1 E
ffec
tV
ersi
A
addi
tion
al e
ffec
tTo
tal V
ersi
B
impa
ctTo
tal V
ersi
A
impa
ctN
umbe
r ob
serv
atio
ns(1
)(2
)(3
)(4
)(5
)(6
)(7
)V
illag
e he
alth
pos
t—qu
anti
ty o
f kid
s im
mun
ized
at l
ast m
eeti
ng w
here
ser
vice
w
as o
ffer
ed.
12.1
271.
182
2.90
7-0
.232
2.67
537
5(.
)(1
.514
)(1
.571
)(1
.919
)(1
.751
)(1
.860
)V
illag
e he
alth
pos
t—qu
anti
ty o
f mom
s re
ceiv
ing
AN
C v
isit
s at
last
mee
ting
w
here
ser
vice
was
off
ered
.6.
470
1.28
21.
803
0.40
02.
202
396
(.)
(1.1
27)
(1.3
62)
(1.4
84)
(1.5
95)
(1.4
52)
Vill
age
heal
th p
ost—
quan
tity
of m
oms
rece
ivin
g ir
on p
ills
at la
st m
eeti
ng w
here
se
rvic
e w
as o
ffer
ed.
7.97
40.
816
0.44
10.
598
1.03
938
8(.
)(1
.457
)(1
.853
)(2
.438
)(2
.330
)(2
.099
)V
illag
e he
alth
pos
t—qu
anti
ty o
f kid
s re
ceiv
ing
Vit
amin
A a
t las
t mee
ting
w
here
ser
vice
was
off
ered
.30
.900
10.5
310*
**7.
229
6.99
75**
14.2
260*
**37
5(.
)(2
.532
)(2
.862
)(4
.633
)(3
.193
)(4
.160
)V
illag
e he
alth
pos
t—qu
anti
ty o
f mom
s re
ceiv
ing
fam
ily p
lann
ing
pills
at l
ast
mee
ting
whe
re s
ervi
ce.
4.08
7-0
.058
1.27
2-0
.680
0.59
238
2w
as o
ffer
ed(.
)(0
.880
)(0
.989
)(1
.310
)(1
.349
)(0
.961
)V
illag
e he
alth
pos
t—qu
anti
ty o
f mom
s re
ceiv
ing
fam
ily p
lann
ing
inje
ctio
ns a
t la
st m
eeti
ng.
4.91
0-0
.032
-0.0
860.
011
-0.0
7538
1w
here
ser
vice
was
off
ered
(.)
(0.9
38)
(1.1
88)
(1.5
29)
(1.4
97)
(1.3
28)
Ave
rage
sta
ndar
dize
d ef
fect
fees
-0.0
87-0
.146
0.08
7-0
.059
(0.0
79)
0.00
0 0.
000
0.00
0 A
vera
ge s
tand
ardi
zed
effe
ct h
ealth
fees
-0.0
89-0
.142
0.11
2-0
.030
(0.0
98)
0.00
0 0.
000
0.00
0 A
vera
ge s
tand
ardi
zed
effe
ct e
duca
tion
fe
es-0
.083
-0.1
63-0
.006
-0.1
69(0
.096
)0.
000
0.00
0 0.
000
Ave
rage
sta
ndar
dize
d ef
fect
mid
wife
fees
-0.1
300.
143
-0.1
92-0
.049

Indonesia’s PNPM Generasi Program: Interim Impact Evaluation Report 143
Annex
M
odel
1M
odel
2
Indi
cato
rB
asel
ine
mea
nC
ontr
ol
mea
nTo
tal G
ener
asi Y
ear
1 E
ffec
tV
ersi
A
addi
tion
al e
ffec
tTo
tal V
ersi
B
impa
ctTo
tal V
ersi
A
impa
ctN
umbe
r ob
serv
atio
ns(1
)(2
)(3
)(4
)(5
)(6
)(7
)(0
.115
)0.
000
0.00
0 0.
000
Ave
rage
sta
ndar
dize
d ef
fect
pus
kesm
as
fees
0.12
5-1
.882
1.98
20.
100
(0.0
96)
0.00
0 0.
000
0.00
0 A
vera
ge s
tand
ardi
zed
effe
ct s
choo
l fee
s-0
.083
-0.1
63-0
.006
-0.1
69(0
.096
)0.
000
0.00
0 0.
000
Ave
rage
sta
ndar
dize
d ef
fect
vill
age
heal
th
post
fees
-0.0
15-0
.069
0.01
9-0
.050
(0.0
80)
0.00
0 0.
000
0.00
0 A
vera
ge s
tand
ardi
zed
effe
ct q
uant
itie
s0.
027
-0.0
810.
066
-0.0
14(0
.066
)0.
000
0.00
0 0.
000
Ave
rage
sta
ndar
dize
d ef
fect
hea
lth
quan
titi
es0.
111
-0.0
530.
135
0.08
3(0
.076
)0.
000
0.00
0 0.
000
Ave
rage
sta
ndar
dize
d ef
fect
edu
cati
on
quan
titi
es-0
.350
4***
-0.2
07-0
.248
-0.4
54(0
.090
)0.
000
0.00
0 0.
000
Ave
rage
sta
ndar
dize
d ef
fect
mid
wife
qu
anti
ties
0.08
6-0
.228
0.19
4-0
.034
(0.1
23)
0.00
0 0.
000
0.00
0 A
vera
ge s
tand
ardi
zed
effe
ct p
uske
smas
qu
anti
ties
-0.1
800.
118
-0.2
35-0
.116
(0.2
59)
0.00
0 0.
000
0.00
0 A
vera
ge s
tand
ardi
zed
effe
ct s
choo
l qu
anti
ties
-0.3
504*
**-0
.207
-0.2
48-0
.454
(0.0
90)
0.00
0 0.
000
0.00
0 A
vera
ge s
tand
ardi
zed
effe
ct v
illag
e he
alth
po
st q
uant
itie
s0.
1761
**0.
123
0.11
60.
239
(0
.071
)0.
000
0.00
0 0.
000
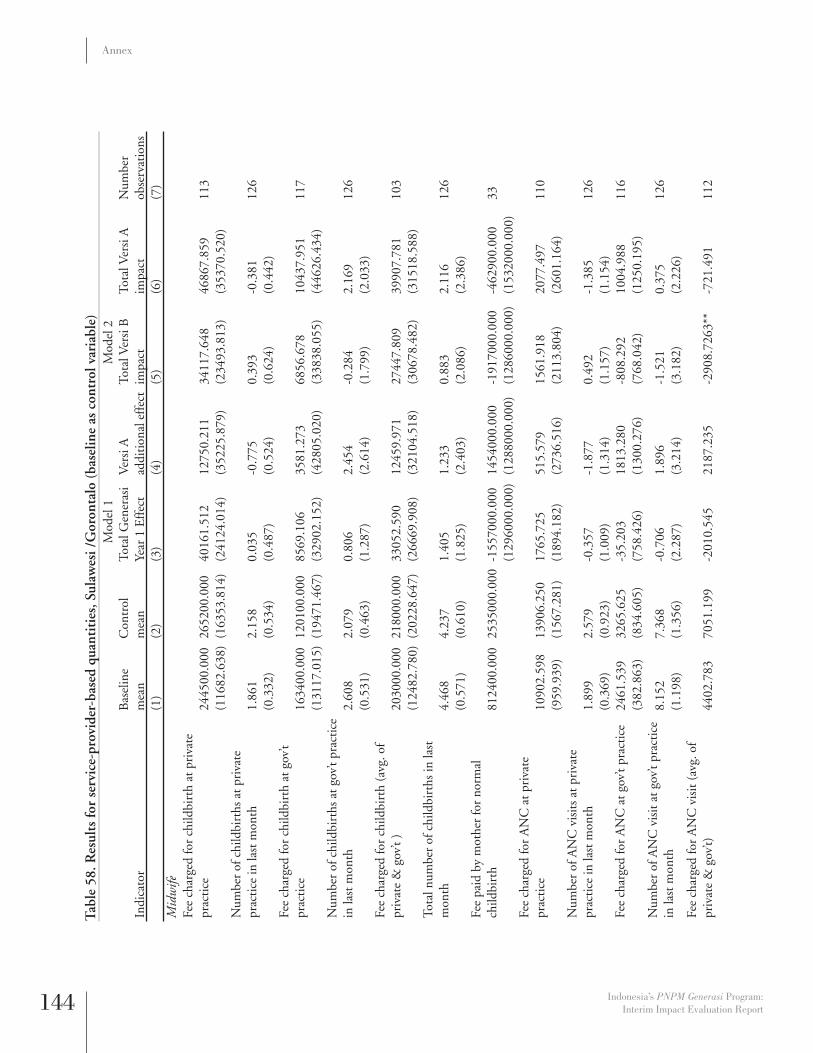
144 Indonesia’s PNPM Generasi Program: Interim Impact Evaluation Report
Annex
Tab
le 5
8. R
esul
ts fo
r se
rvic
e-pr
ovid
er-b
ased
qua
ntit
ies,
Sul
awes
i /G
oron
talo
(ba
selin
e as
con
trol
var
iabl
e)
Mod
el 1
Mod
el 2
Indi
cato
rB
asel
ine
mea
nC
ontr
ol
mea
nTo
tal G
ener
asi
Year
1 E
ffec
tV
ersi
A
addi
tion
al e
ffec
tTo
tal V
ersi
B
impa
ctTo
tal V
ersi
A
impa
ctN
umbe
r ob
serv
atio
ns(1
)(2
)(3
)(4
)(5
)(6
)(7
)M
idw
ifeFe
e ch
arge
d fo
r ch
ildbi
rth
at p
riva
te
prac
tice
2445
00.0
0026
5200
.000
4016
1.51
212
750.
211
3411
7.64
846
867.
859
113
(116
82.6
38)
(163
53.8
14)
(241
24.0
14)
(352
25.8
79)
(234
93.8
13)
(353
70.5
20)
Num
ber
of c
hild
birt
hs a
t pri
vate
pr
acti
ce in
last
mon
th1.
861
2.15
80.
035
-0.7
750.
393
-0.3
8112
6(0
.332
)(0
.534
)(0
.487
)(0
.524
)(0
.624
)(0
.442
)Fe
e ch
arge
d fo
r ch
ildbi
rth
at g
ov’t
prac
tice
1634
00.0
0012
0100
.000
8569
.106
3581
.273
6856
.678
1043
7.95
111
7(1
3117
.015
)(1
9471
.467
)(3
2902
.152
)(4
2805
.020
)(3
3838
.055
)(4
4626
.434
)N
umbe
r of
chi
ldbi
rths
at g
ov’t
prac
tice
in
last
mon
th2.
608
2.07
90.
806
2.45
4-0
.284
2.16
912
6(0
.531
)(0
.463
)(1
.287
)(2
.614
)(1
.799
)(2
.033
)Fe
e ch
arge
d fo
r ch
ildbi
rth
(avg
. of
priv
ate
& g
ov’t
)20
3000
.000
2180
00.0
0033
052.
590
1245
9.97
127
447.
809
3990
7.78
110
3(1
2482
.780
)(2
0228
.647
)(2
6669
.908
)(3
2104
.518
)(3
0678
.482
)(3
1518
.588
)To
tal n
umbe
r of
chi
ldbi
rths
in la
st
mon
th4.
468
4.23
71.
405
1.23
30.
883
2.11
612
6(0
.571
)(0
.610
)(1
.825
)(2
.403
)(2
.086
)(2
.386
)Fe
e pa
id b
y m
othe
r fo
r no
rmal
ch
ildbi
rth
8124
00.0
0025
3500
0.00
0-1
5570
00.0
0014
5400
0.00
0-1
9170
00.0
00-4
6290
0.00
033
(129
6000
.000
)(1
2880
00.0
00)
(128
6000
.000
)(1
5320
00.0
00)
Fee
char
ged
for
AN
C a
t pri
vate
pr
acti
ce10
902.
598
1390
6.25
017
65.7
2551
5.57
915
61.9
1820
77.4
9711
0(9
59.9
39)
(156
7.28
1)(1
894.
182)
(273
6.51
6)(2
113.
804)
(260
1.16
4)N
umbe
r of
AN
C v
isit
s at
pri
vate
pr
acti
ce in
last
mon
th1.
899
2.57
9-0
.357
-1.8
770.
492
-1.3
8512
6(0
.369
)(0
.923
)(1
.009
)(1
.314
)(1
.157
)(1
.154
)Fe
e ch
arge
d fo
r A
NC
at g
ov’t
prac
tice
2461
.539
3265
.625
-35.
203
1813
.280
-808
.292
1004
.988
116
(382
.863
)(8
34.6
05)
(758
.426
)(1
300.
276)
(768
.042
)(1
250.
195)
Num
ber
of A
NC
vis
it a
t gov
’t pr
acti
ce
in la
st m
onth
8.15
27.
368
-0.7
061.
896
-1.5
210.
375
126
(1.1
98)
(1.3
56)
(2.2
87)
(3.2
14)
(3.1
82)
(2.2
26)
Fee
char
ged
for
AN
C v
isit
(av
g. o
f pr
ivat
e &
gov
’t)44
02.7
8370
51.1
99-2
010.
545
2187
.235
-290
8.72
63**
-721
.491
112

Indonesia’s PNPM Generasi Program: Interim Impact Evaluation Report 145
Annex
M
odel
1M
odel
2
Indi
cato
rB
asel
ine
mea
nC
ontr
ol
mea
nTo
tal G
ener
asi
Year
1 E
ffec
tV
ersi
A
addi
tion
al e
ffec
tTo
tal V
ersi
B
impa
ctTo
tal V
ersi
A
impa
ctN
umbe
r ob
serv
atio
ns(1
)(2
)(3
)(4
)(5
)(6
)(7
)(5
19.8
26)
(128
6.24
6)(1
258.
373)
(158
2.21
1)(1
099.
843)
(193
4.35
7)To
tal n
umbe
r of
AN
C v
isit
s in
last
m
onth
10.0
519.
947
-0.9
911.
847
-1.7
850.
062
126
(1.2
91)
(1.5
25)
(2.5
42)
(3.7
73)
(3.7
80)
(2.1
93)
Fee
paid
by
mot
her
for
AN
C v
isit
1885
6.25
034
230.
770
-107
30.0
0014
023.
046
-139
10.0
0011
5.05
556
(358
3.90
8)(2
2502
.465
)(8
228.
656)
(946
1.52
8)(9
369.
263)
(888
3.44
6)Fe
e ch
arge
d fo
r fa
mily
pla
nnin
g vi
sit a
t pr
ivat
e pr
acti
ce.
1888
2.35
422
71.5
0728
38.5
3610
33.7
4538
72.2
805*
*11
2(.
)(3
096.
636)
(143
9.42
9)(2
757.
257)
(220
4.95
9)(1
592.
276)
Num
ber
of fa
mily
pla
nnin
g vi
sits
at
priv
ate
prac
tice
.
14.7
591.
811
-2.2
992.
780
0.48
110
4in
last
mon
th(.
)(3
.222
)(3
.465
)(4
.432
)(3
.716
)(4
.482
)Fe
e ch
arge
d fo
r fa
mily
pla
nnin
g vi
sit a
t go
v’t p
ract
ice
.13
529.
412
-272
8.80
925
65.4
91-3
902.
131
-133
6.64
111
6(.
)(4
296.
702)
(246
1.51
3)(3
911.
430)
(343
1.41
8)(2
787.
646)
Num
ber
of fa
mily
pla
nnin
g vi
sits
at
gov’
t pra
ctic
e.
14.2
190.
574
-2.8
471.
825
-1.0
2211
1in
last
mon
th(.
)(4
.058
)(5
.865
)(7
.170
)(6
.055
)(7
.649
)Fe
e ch
arge
d fo
r fa
mily
pla
nnin
g vi
sit
(avg
. pri
vate
& g
ov’t)
.16
357.
848
-789
.884
2628
.240
-193
7.88
369
0.35
811
3(.
)(3
304.
422)
(182
1.90
6)(3
431.
964)
(277
1.51
7)(1
970.
541)
Tota
l num
ber
of fa
mily
pla
nnin
g vi
sits
in
last
mon
th.
25.2
292.
498
-3.2
593.
884
0.62
612
1(.
)(4
.419
)(6
.463
)(8
.870
)(6
.853
)(8
.824
)Fe
e pa
id b
y m
othe
r fo
r fa
mily
pl
anni
ng v
isit
1464
4.73
714
538.
462
2629
.969
224.
971
2535
.160
2760
.131
42(6
22.2
83)
(136
5.15
9)(2
105.
814)
(145
6.91
6)(2
140.
703)
(239
1.58
7)Pu
skes
mas
Nor
mal
chi
ldbi
rth
at P
uske
smas
—fe
e ch
arge
d by
mid
wife
1627
00.0
00
1008
00.0
00
7501
2.97
7 55
695.
719
5097
5.46
1 10
6700
.000
27
-151
55.4
92-2
3691
.781
-635
03.5
04-7
3173
.781
-707
88.2
50-8
0263
.781
Nor
mal
chi
ldbi
rth
at P
uske
smas
—qu
anti
ty b
y m
idw
ife
30.6
47
20.5
71
10.7
653*
*(9
.628
)15
.091
9**
5.46
4 34
-6.4
64-4
.799
-5.1
39-6
.887
-6.0
28-6
.110
Nor
mal
chi
ldbi
rth
at P
uske
smas
—fe
e pa
id b
y m
othe
r28
9100
.000
16
6700
.000
-2
.505
e+05
***
0.00
0 -2
.505
e+05
***
-2.5
05e+
05**
*11
-650
93.7
03-1
6670
0.00
0-5
8925
.566
0.00
0-5
8925
.566
-589
25.5
66Sc
hool
sSD
—A
nnua
l cos
t of s
choo
l for
TA
07
/08
.43
375.
531
(181
30.0
00)
(154
5.53
8)(1
7430
.000
)(1
8980
.000
)13
6(.
)(1
6622
.525
)(1
6086
.063
)(1
2988
.986
)(1
5259
.040
)(1
9671
.299
)
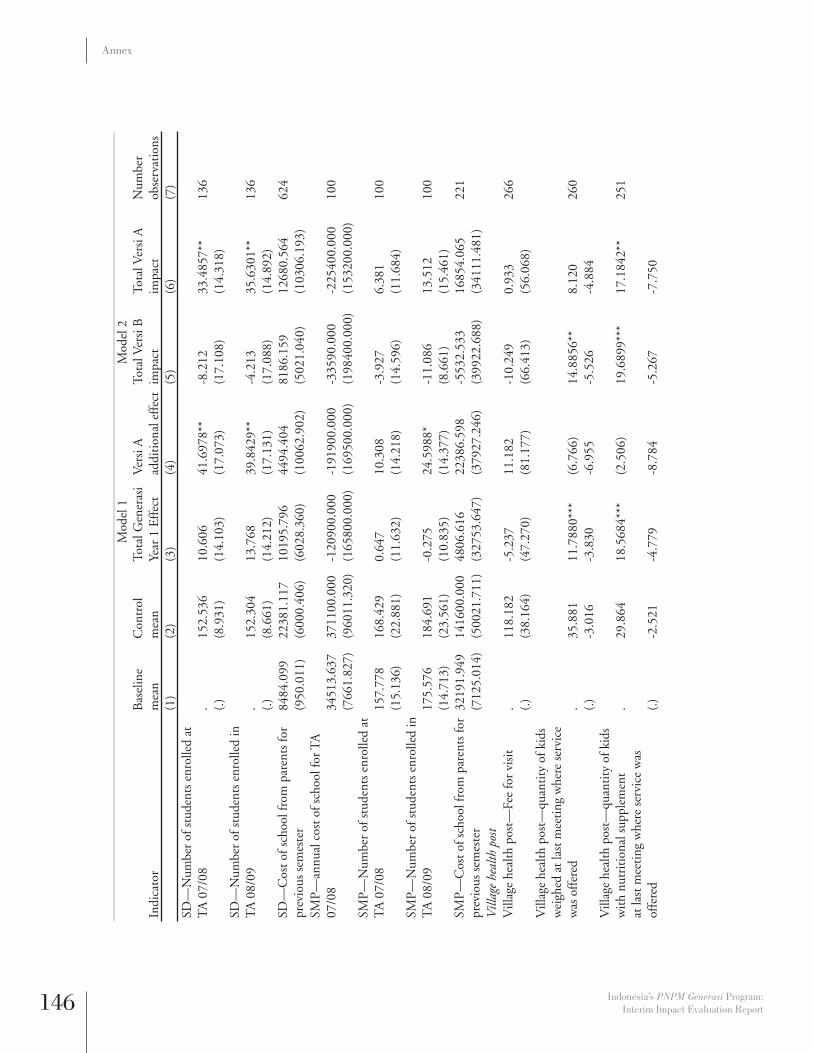
146 Indonesia’s PNPM Generasi Program: Interim Impact Evaluation Report
Annex
M
odel
1M
odel
2
Indi
cato
rB
asel
ine
mea
nC
ontr
ol
mea
nTo
tal G
ener
asi
Year
1 E
ffec
tV
ersi
A
addi
tion
al e
ffec
tTo
tal V
ersi
B
impa
ctTo
tal V
ersi
A
impa
ctN
umbe
r ob
serv
atio
ns(1
)(2
)(3
)(4
)(5
)(6
)(7
)SD
—N
umbe
r of
stu
dent
s en
rolle
d at
T
A 0
7/08
.15
2.53
610
.606
41.6
978*
*-8
.212
33.4
857*
*13
6(.
)(8
.931
)(1
4.10
3)(1
7.07
3)(1
7.10
8)(1
4.31
8)SD
—N
umbe
r of
stu
dent
s en
rolle
d in
T
A 0
8/09
.15
2.30
413
.768
39.8
429*
*-4
.213
35.6
301*
*13
6(.
)(8
.661
)(1
4.21
2)(1
7.13
1)(1
7.08
8)(1
4.89
2)SD
—C
ost o
f sch
ool f
rom
par
ents
for
prev
ious
sem
este
r84
84.0
9922
381.
117
1019
5.79
644
94.4
0481
86.1
5912
680.
564
624
(950
.011
)(6
000.
406)
(602
8.36
0)(1
0062
.902
)(5
021.
040)
(103
06.1
93)
SMP—
annu
al c
ost o
f sch
ool f
or T
A
07/0
834
513.
637
3711
00.0
00-1
2090
0.00
0-1
9190
0.00
0-3
3590
.000
-225
400.
000
100
(766
1.82
7)(9
6011
.320
)(1
6580
0.00
0)(1
6950
0.00
0)(1
9840
0.00
0)(1
5320
0.00
0)SM
P—N
umbe
r of
stu
dent
s en
rolle
d at
T
A 0
7/08
157.
778
168.
429
0.64
710
.308
-3.9
276.
381
100
(15.
136)
(22.
881)
(11.
632)
(14.
218)
(14.
596)
(11.
684)
SMP—
Num
ber
of s
tude
nts
enro
lled
in
TA
08/
0917
5.57
618
4.69
1-0
.275
24.5
988*
-11.
086
13.5
1210
0(1
4.71
3)(2
3.56
1)(1
0.83
5)(1
4.37
7)(8
.661
)(1
5.46
1)SM
P—C
ost o
f sch
ool f
rom
par
ents
for
prev
ious
sem
este
r32
191.
949
1416
00.0
0048
06.6
1622
386.
598
-553
2.53
316
854.
065
221
(712
5.01
4)(5
0021
.711
)(3
2753
.647
)(3
7927
.246
)(3
9922
.688
)(3
4111
.481
)V
illag
e he
alth
pos
tV
illag
e he
alth
pos
t—Fe
e fo
r vi
sit
.11
8.18
2-5
.237
11.1
82-1
0.24
90.
933
266
(.)
(38.
164)
(47.
270)
(81.
177)
(66.
413)
(56.
068)
Vill
age
heal
th p
ost—
quan
tity
of k
ids
wei
ghed
at l
ast m
eeti
ng w
here
ser
vice
w
as o
ffer
ed.
35.8
81
11.7
880*
**(6
.766
)14
.885
6**
8.12
0 26
0(.
)-3
.016
-3.8
30-6
.955
-5.5
26-4
.884
Vill
age
heal
th p
ost—
quan
tity
of k
ids
wit
h nu
trit
iona
l sup
plem
ent
.29
.864
18
.568
4***
(2.5
06)
19.6
899*
**17
.184
2**
251
at la
st m
eeti
ng w
here
ser
vice
was
of
fere
d(.
)-2
.521
-4.7
79-8
.784
-5.2
67-7
.750

Indonesia’s PNPM Generasi Program: Interim Impact Evaluation Report 147
Annex
M
odel
1M
odel
2
Indi
cato
rB
asel
ine
mea
nC
ontr
ol
mea
nTo
tal G
ener
asi
Year
1 E
ffec
tV
ersi
A
addi
tion
al e
ffec
tTo
tal V
ersi
B
impa
ctTo
tal V
ersi
A
impa
ctN
umbe
r ob
serv
atio
ns(1
)(2
)(3
)(4
)(5
)(6
)(7
)V
illag
e he
alth
pos
t—qu
anti
ty o
f kid
s im
mun
ized
at l
ast m
eeti
ng w
here
se
rvic
e w
as o
ffer
ed.
17.7
33
6.14
66**
9.86
87**
1.57
9 11
.448
1***
253
(.)
-1.9
11-2
.545
-4.3
37-2
.284
-3.9
11V
illag
e he
alth
pos
t—qu
anti
ty o
f mom
s re
ceiv
ing
AN
C v
isit
s at
last
mee
ting
w
here
ser
vice
was
off
ered
.4.
817
2.76
39**
4.00
87**
*0.
939
4.94
80**
*26
2(.
)-0
.574
-1.0
63-1
.293
-1.0
65-1
.167
Vill
age
heal
th p
ost—
quan
tity
of m
oms
rece
ivin
g ir
on p
ills
at la
st m
eeti
ng
whe
re s
ervi
ce w
as o
ffer
ed.
5.08
5 2.
5073
**3.
7763
**0.
790
4.56
58**
*25
8(.
)-0
.671
-1.1
07-1
.491
-1.2
81-1
.272
Vill
age
heal
th p
ost—
quan
tity
of k
ids
rece
ivin
g V
itam
in A
at l
ast m
eeti
ng
whe
re s
ervi
ce w
as.
47.6
37
17.4
946*
4.99
4 15
.191
20
.184
7*24
4 o
ffer
ed(.
)-4
.957
-8.8
43-1
1.86
4-9
.472
-11.
925
Vill
age
heal
th p
ost—
quan
tity
of m
oms
rece
ivin
g fa
mily
pla
nnin
g pi
lls a
t las
t m
eeti
ng w
here
.
5.17
3 1.
329
4.69
7 (0
.839
)3.
858
251
serv
ice
was
off
ered
(.)
-1.2
93-2
.020
-3.2
84-2
.151
-3.0
06V
illag
e he
alth
pos
t—qu
anti
ty o
f mom
s re
ceiv
ing
fam
ily p
lann
ing
inje
ctio
ns a
t la
st m
eeti
ng w
here
.5.
543
(1.7
31)
2.79
5 -3
.014
9**
(0.2
20)
247
serv
ice
was
off
ered
(.)
-1.6
93-1
.383
-2.5
12-1
.456
-2.2
83A
vera
ge s
tand
ardi
zed
effe
ct fe
es-0
.029
-0.1
390.
027
-0.1
12(0
.072
)0.
000
0.00
0 0.
000
Ave
rage
sta
ndar
dize
d ef
fect
hea
lth fe
es-0
.048
-0.1
880.
028
-0.1
60(0
.093
)0.
000
0.00
0 0.
000
Ave
rage
sta
ndar
dize
d ef
fect
edu
cati
on
fees
0.04
30.
041
0.02
40.
065
(0.0
69)
0.00
0 0.
000
0.00
0

148 Indonesia’s PNPM Generasi Program: Interim Impact Evaluation Report
Annex
M
odel
1M
odel
2
Indi
cato
rB
asel
ine
mea
nC
ontr
ol
mea
nTo
tal G
ener
asi
Year
1 E
ffec
tV
ersi
A
addi
tion
al e
ffec
tTo
tal V
ersi
B
impa
ctTo
tal V
ersi
A
impa
ctN
umbe
r ob
serv
atio
ns(1
)(2
)(3
)(4
)(5
)(6
)(7
)A
vera
ge s
tand
ardi
zed
effe
ct m
idw
ife
fees
-0.0
57-0
.179
0.01
2-0
.167
(0.0
96)
0.00
0 0.
000
0.00
0 A
vera
ge s
tand
ardi
zed
effe
ct p
uske
smas
fe
es-0
.023
-0.3
180.
123
-0.1
94(0
.329
)0.
000
0.00
0 0.
000
Ave
rage
sta
ndar
dize
d ef
fect
sch
ool f
ees
0.04
30.
041
0.02
40.
065
(0.0
69)
0.00
0 0.
000
0.00
0 A
vera
ge s
tand
ardi
zed
effe
ct v
illag
e he
alth
pos
t fee
s0.
013
-0.0
280.
026
-0.0
02(0
.121
)0.
000
0.00
0 0.
000
Ave
rage
sta
ndar
dize
d ef
fect
qua
ntit
ies
0.17
92**
0.14
80.
112
0.24
9(0
.068
)0.
000
0.00
0 0.
000
Ave
rage
sta
ndar
dize
d ef
fect
hea
lth
quan
titi
es0.
1982
**0.
100
0.15
30.
253
(0.0
82)
0.00
0 0.
000
0.00
0 A
vera
ge s
tand
ardi
zed
effe
ct e
duca
tion
qu
anti
ties
0.09
30.
367
-0.0
720.
296
(0.1
17)
0.00
0 0.
000
0.00
0 A
vera
ge s
tand
ardi
zed
effe
ct m
idw
ife
quan
titi
es0.
042
0.03
40.
029
0.06
3(0
.158
)0.
000
0.00
0 0.
000
Ave
rage
sta
ndar
dize
d ef
fect
pus
kesm
as
quan
titi
es0.
5995
**-0
.536
0.84
10.
304
(0.2
63)
0.00
0 0.
000
0.00
0 A
vera
ge s
tand
ardi
zed
effe
ct s
choo
l qu
anti
ties
0.09
30.
367
-0.0
720.
296
(0.1
17)
0.00
0 0.
000
0.00
0 A
vera
ge s
tand
ardi
zed
effe
ct v
illag
e he
alth
pos
t qua
ntit
ies
0.32
36**
*0.
253
0.20
80.
461
(0
.098
)0.
000
0.00
0 0.
000

Indonesia’s PNPM Generasi Program: Interim Impact Evaluation Report 149
Annex
Table 59. Detail of mortality vis-à-vis baseline (neonatal mortality) Model 1 Model 2
IndicatorControl mean
TotalGenerasi Year 1 Effect
Versi A additional effect
TotalVersi B impact
TotalVersi A impact
Number observations
(1) (2) (3) (4) (5) (6)Mortality 0-28 daysAll provincesTreatment 0.008 -0.0052* -0.001 -0.005 -0.0056* 2765
(0.003) (0.003) (0.003) (0.003) (0.003)Baseline 0.014 -0.003 -0.008 0.001 -0.007 2847
(0.004) (0.005) (0.006) (0.005) (0.006)JavaTreatment 0.006 -0.001 -0.003 0.000 -0.003 1775
(0.003) (0.003) (0.004) (0.004) (0.004)Baseline 0.011 -0.008 -0.004 -0.006 -0.010 1904
(0.004) (0.005) (0.007) (0.006) (0.007)NTTTreatment 0.016 -0.0143** 0.001 -0.0146** -0.0140** 607
(0.009) (0.007) (0.003) (0.007) (0.007)Baseline 0.027 0.006 -0.011 0.012 0.001 596
(0.012) (0.013) (0.011) (0.014) (0.013)SulawesiTreatment 0.006 -0.004 0.008 -0.007 0.001 383
(0.006) (0.007) (0.013) (0.006) (0.013)Baseline 0.014 0.006 -0.023 0.016 -0.007 347
(0.010) (0.011) (0.014) (0.015) (0.009)

150 Indonesia’s PNPM Generasi Program: Interim Impact Evaluation Report
Annex
Table 60. Detail of mortality vis-à-vis baseline (infant mortality)Model 1 Model 2
IndicatorControl mean
TotalGenerasi Year 1 Effect
Versi A additional effect
TotalVersi B impact
TotalVersi A impact
Number observations
(1) (2) (3) (4) (5) (6)Mortality 0-11 MonthsAll provincesTreatment 0.018 -0.0081** 0.000 -0.0083** -0.0079* 3788
(0.004) (0.004) (0.004) (0.004) (0.004)Baseline 0.024 -0.0088* -0.010 -0.004 -0.0137** 3508
(0.005) (0.005) (0.006) (0.006) (0.006)JavaTreatment 0.008 -0.002 -0.0082* 0.002 -0.0062* 2431
(0.003) (0.004) (0.004) (0.005) (0.004)Baseline 0.013 -0.006 -0.008 -0.002 -0.010 2297
(0.004) (0.006) (0.008) (0.008) (0.007)NTTTreatment 0.024 -0.006 0.0181* -0.0152* 0.003 826
(0.010) (0.009) (0.009) (0.009) (0.011)Baseline 0.044 -0.009 -0.011 -0.003 -0.015 758
(0.014) (0.011) (0.011) (0.013) (0.012)SulawesiTreatment 0.040 -0.0386*** -0.006 -0.0363*** 531
(0.012) (0.009) (0.016) (0.009) (0.014)Baseline 0.038 -0.015 -0.0287* -0.001 -0.0300** 453
(0.014) (0.013) (0.014) (0.016) (0.013)

Indonesia’s PNPM Generasi Program: Interim Impact Evaluation Report 151
Annex

Indonesia’s PNPM Generasi Program:
Benjamin A. Olken, M.I.T. Department of EconomicsJunko Onishi, The World BankSusan Wong, The World Bank
Interim Impact Evaluation Report
Related Documents