The Mayans Easter Island Mesopotamia Biosphere 2 1.3.
Dec 25, 2015
Welcome message from author
This document is posted to help you gain knowledge. Please leave a comment to let me know what you think about it! Share it to your friends and learn new things together.
Transcript
The Mayans Easter Island Mesopotamia Biosphere 2
1.3
1.4
In 2000:
Global population 6.1 billion, up from 2.5 billion in 1950
95% of population growth in developing countries
1.2 billion in severe poverty (<$1/day)
More than 1 billion people overweight (in the US, 61% adults overweight, 27% obese)
1.1 billion without access to safe water
3 million people died of AIDS (cumulative total now almost 22 million) and 58 million had HIV
On average a person was infected with HIV every six seconds
In Botswana, one in three adults was infected with HIV1.5
United States: Fordham University ‘index of social health’ 44% lower in 1996
than in 1973, despite stock market highs Now the world’s largest penal colony (nearly five million men in
the US awaiting trial, in prison, on probation or on parole) There is no cost difference between incarceration and an Ivy
League education
Australia: In 1996, 2 million lived below the poverty line Top 20 percent of households had 44 percent of private income
while the bottom 20 percent had just 3 percent Now one of the most unequal of all developed countries (having
slipped from 7th to 15th on the UN Index of Human Development)
(continued)
1.6
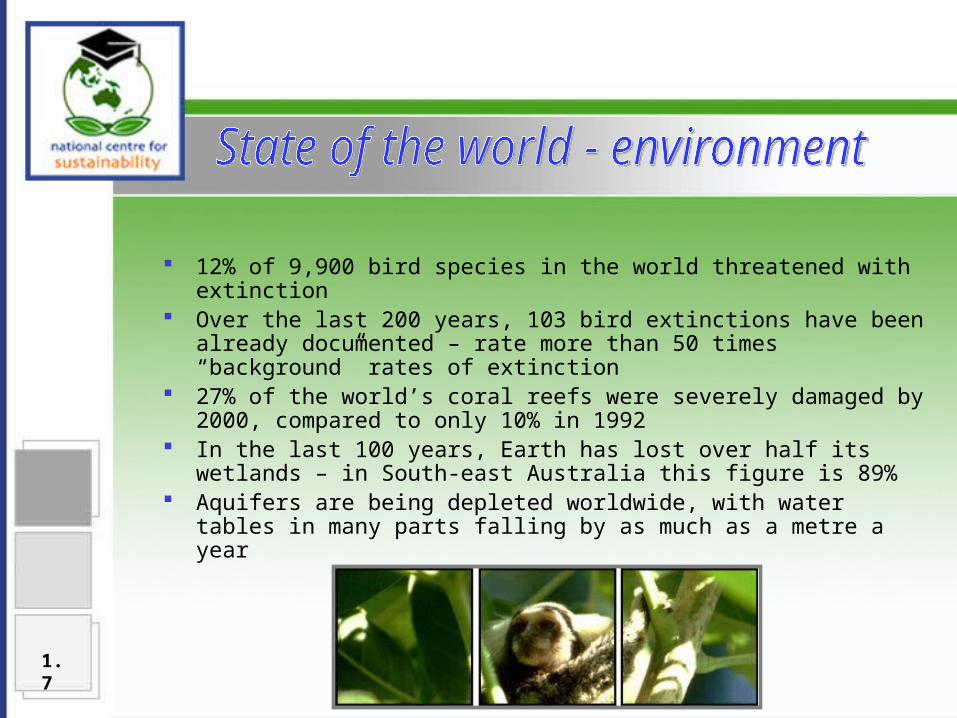
12% of 9,900 bird species in the world threatened with extinction Over the last 200 years, 103 bird extinctions have been already
documented – rate more than 50 times “background” rates of extinction
27% of the world’s coral reefs were severely damaged by 2000, compared to only 10% in 1992
In the last 100 years, Earth has lost over half its wetlands – in South-east Australia this figure is 89%
Aquifers are being depleted worldwide, with water tables in many parts falling by as much as a metre a year
1.7
Atmospheric carbon dioxide (a greenhouse gas) is 30% higher than pre-industrial times and highest in at least 420,000 years
Strong scientific consensus that most warming observed over the last 50 years is attributable to human activities
10% decrease in snow cover since the 1960s Global average sea level has risen 10-20 cm IPCC projections - by the year 2100:
globally averaged surface temperature will warm by 1.4 to 5.8ºC (relative to 1990)
global mean sea level will rise by 9 to 88cm (relative to 1990)
(continued)
1.8
In 2000, foreign debt of developing and former Eastern bloc nations stood at US$2.57 trillion ($2,570,000,000,000) (1999 dollars)
During the 1990’s the economic toll of natural disasters topped US$608 billion, more than the previous four decades combined
Of the US$9 trillion spent every year in the United States, US$2 trillion is wasted
1.9
Between 1996 and 2001:
Additional 500,000 hectares of land became salt affected (bringing total to at least 2.5 million hectares or 5% of our cultivated land
Further 5.7 million hectares identified as having a high potential for developing dryland salinity
Common cause of dryland salinity has been changes to water tables from inappropriate land use
1.10
Predicted that without significant action, within 20 years Adelaide’s drinking water would fail World Health Organisation standards in two days out of five
Predicted if nothing is done, salinity will cost $1 billion a year by 2100
Many coastal areas have poor water quality from sediment, resulting from soil erosion. 11.7 million tonnes/sediment/year enter Great Barrier Reef alone. In North Queensland, grazing lands product about 66% of estimated annual sediment to rivers
(continued)
1.11
Air quality generally improved or remained constant Threatening processes to biodiversity include salinisation, land
clearing, fragmentation of ecosystems, exotic organisms and changing hydrological conditions
Australia has 10% of world’s endangered species, second only to the US
Net loss in vegetative cover since 1996 In 1999, 469,000 hectares of woody vegetation cleared nationally
(425,000 ha in Queensland) Many heritage buildings damaged through inappropriate
development Decline in Indigenous languages
(continued)
1.12
Wealth is:
“something that that has real value in terms of meeting our needs and fulfilling our wants: the natural productive systems of the planet and physical things like factories, homes, farms, stores, actual transportation and communications facilities, as well as the people who work to produce the goods and services that sustain us. Modern money is only a number on a piece of paper or an electronic trace in a computer, that by a social convention gives its holder a claim on that real wealth. In our confusion, we’ve concentrated on the money, to the neglect of those things that actually sustain a good life.”
David Korten
1.13
‘Ecosystem services’ include: photosynthesis pollination nurseries for commercial fish species (in mangroves and coral
reefs in particular) regulation of climate soil production and protection storage and cycling of essential nutrients absorption, breakdown and dispersal of organic wastes and
pollutants control of crop and livestock pests through predation Services provided globally by the environment estimated at least
US$36 trillion annually. In Australia, services estimated at $1.3 billion annually
1.14
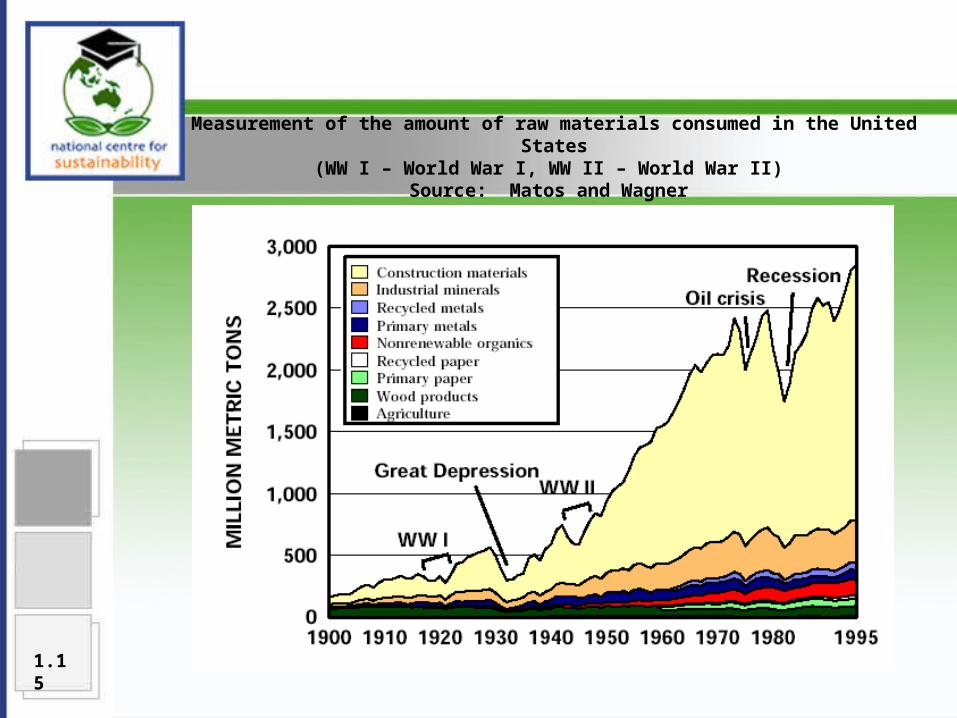
Measurement of the amount of raw materials consumed in the United States(WW I – World War I, WW II – World War II)
Source: Matos and Wagner
1.15
“Never doubt that a small group of thoughtful, committed citizens can change the world; indeed, it’s the only thing that ever has”.
- Margaret Mead
1.16
1.17
Atmosphere surrounding the earth a mixture of gases Greenhouse gases (eg water vapour, carbon dioxide and methane)
so called because they trap heat, leading to warming lower atmosphere. This process occurs naturally and is essential to sustaining life on earth
Human activities in last 200 years (e.g. burning fossil fuels) have increased concentration of greenhouse gases, resulting in increased warming of the lower atmosphere - the enhanced greenhouse effect
1.19
Some gases, e.g. those used in air conditioning, have strong global warming potential
Other sources of emissions include agriculture (methane from animals and rice paddies), and waste in landfills (methane)
Plants convert carbon dioxide to oxygen so land clearing
diminishes this potential
(continued)
1.20
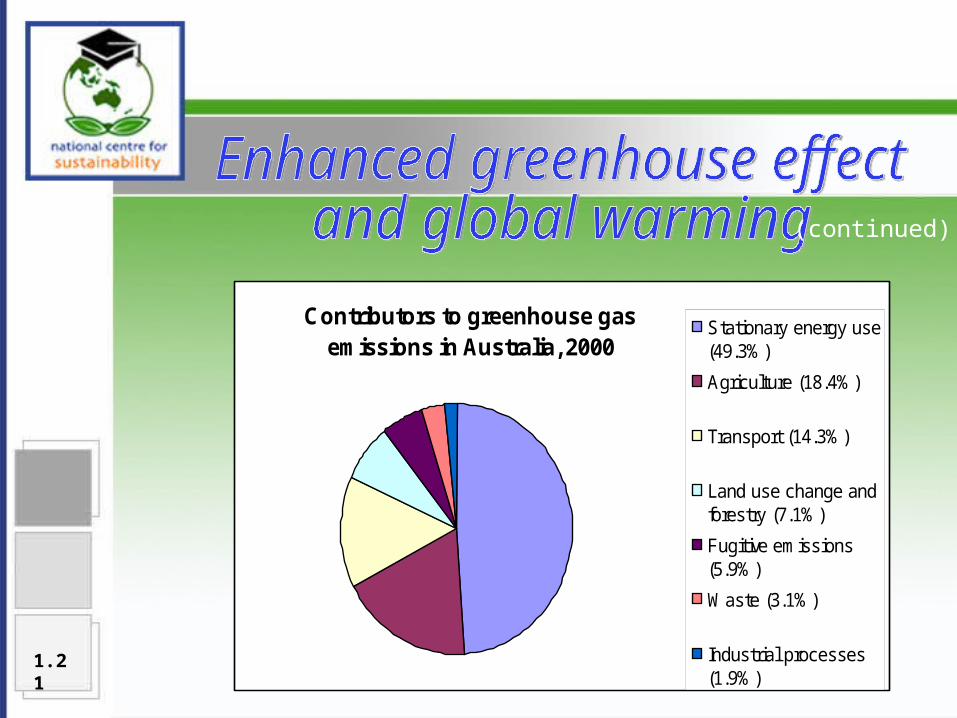
Contributors to greenhouse gasemissions in Australia, 2000
Stationary energy use(49.3%)
Agriculture (18.4%)
Transport (14.3%)
Land use change andforestry (7.1%)
Fugitive emissions(5.9%)
Waste (3.1%)
Industrial processes(1.9%)
(continued)
1.21
Ozone layer is a concentration of ozone molecules in the stratosphere (10-50km above earth’s surface)
Stratospheric ozone shields earth from sun’s ultraviolet (UV) rays, reducing radiation
Increased UV radiation causes skin cancer, cataracts, weakened immune systems, reduce crop yield and impacts on marine systems
Ozone molecules are attacked by ozone-depleting substances, such as chlorofluorocarbons (CFCs)
In the stratosphere, chlorine or bromine atoms split apart from ozone-depleting substances and destroy ozone molecules. One chlorine atom can break apart more than 100,000 ozone molecules
1.22
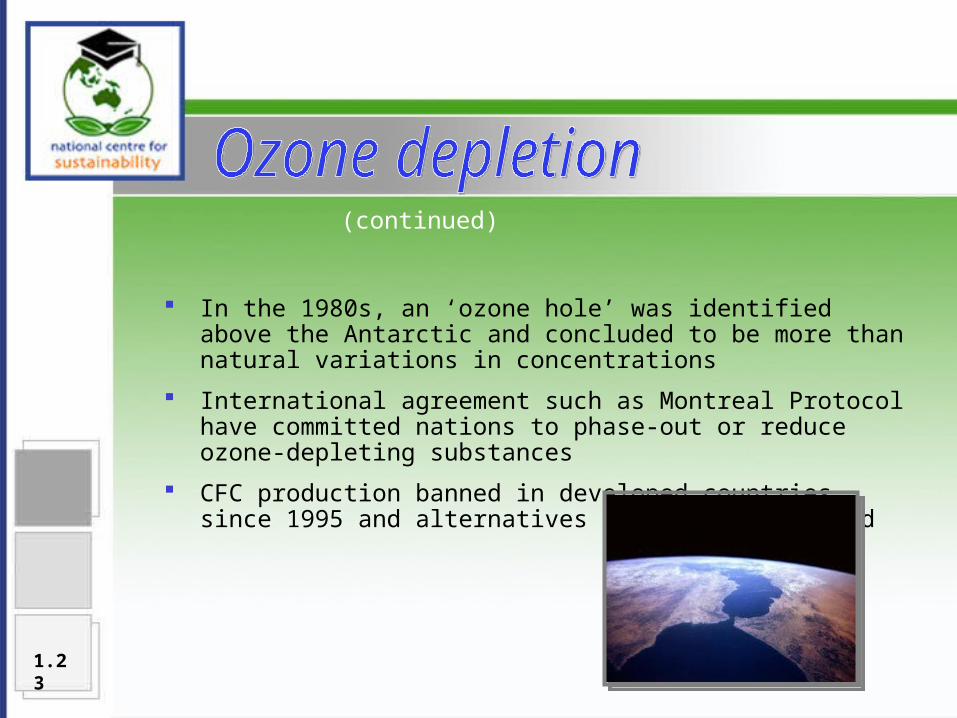
In the 1980s, an ‘ozone hole’ was identified above the Antarctic and concluded to be more than natural variations in concentrations
International agreement such as Montreal Protocol have committed nations to phase-out or reduce ozone-depleting substances
CFC production banned in developed countries since 1995 and alternatives have been developed
(continued)
1.23
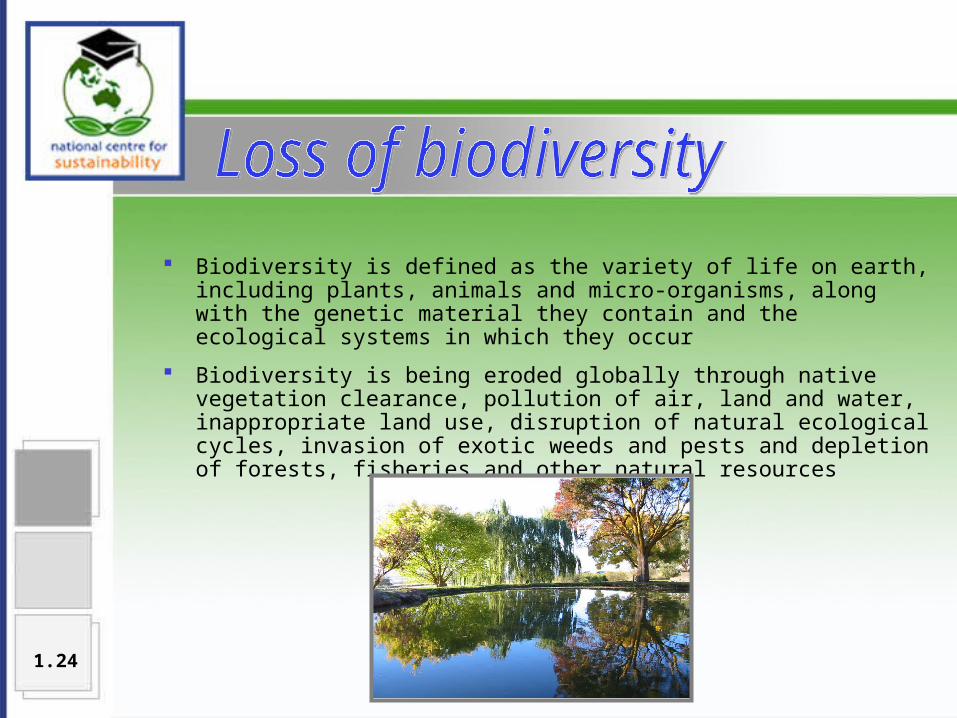
Biodiversity is defined as the variety of life on earth, including plants, animals and micro-organisms, along with the genetic material they contain and the ecological systems in which they occur
Biodiversity is being eroded globally through native vegetation clearance, pollution of air, land and water, inappropriate land use, disruption of natural ecological cycles, invasion of exotic weeds and pests and depletion of forests, fisheries and other natural resources
1.24
Australia is among the most biologically diverse nations in the world - 290,000 species of Australian flora and 200,000 species of Australian fauna. Currently 1,478 species and 27 ecological communities currently listed at the national level as either endangered or vulnerable
We do not even know all species we are endangering or their potential for humans
We do not know what overall impact steady degradation of ecosystems will have - the thin end of the wedge?
(continued)
1.25
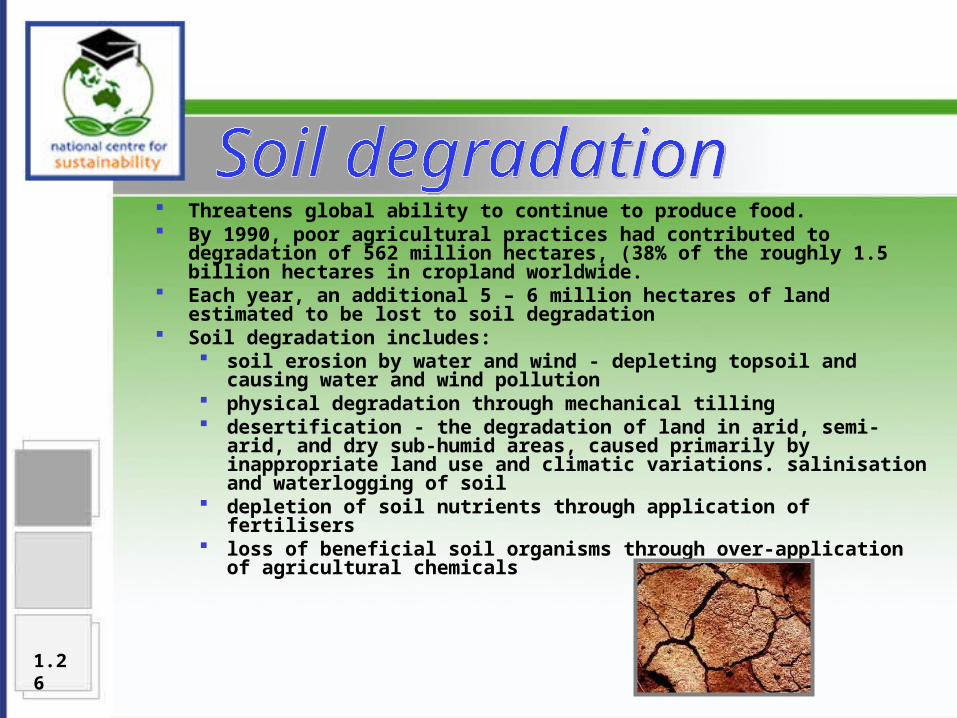
Threatens global ability to continue to produce food. By 1990, poor agricultural practices had contributed to degradation of
562 million hectares, (38% of the roughly 1.5 billion hectares in cropland worldwide.
Each year, an additional 5 – 6 million hectares of land estimated to be lost to soil degradation
Soil degradation includes: soil erosion by water and wind - depleting topsoil and causing water
and wind pollution physical degradation through mechanical tilling desertification - the degradation of land in arid, semi-arid, and dry
sub-humid areas, caused primarily by inappropriate land use and climatic variations. salinisation and waterlogging of soil
depletion of soil nutrients through application of fertilisers loss of beneficial soil organisms through over-application of
agricultural chemicals
1.26
Major causes of soil degradation include overworking soil mechanically, land clearing and deforestation, overgrazing, irrigation, and over-application of agricultural chemicals
Soil erosion is expected to severely reduce agricultural production in regions including southeast Nigeria, Haiti and the Himalayan foothills, and part of southern China, Southeast Asia and Central America
Over 250 million people are directly affected by desertification, with one billion people in over one hundred countries at risk
Salinity affecting enormous areas of land and water quality in rivers. Saline areas can result from natural processes, however, most newly salinised areas are the result of changes in land use and hydrological cycles. Most salinity results from rising groundwater. Types of salinity include dryland, irrigation, urban, river and industrial
(continued)
1.27
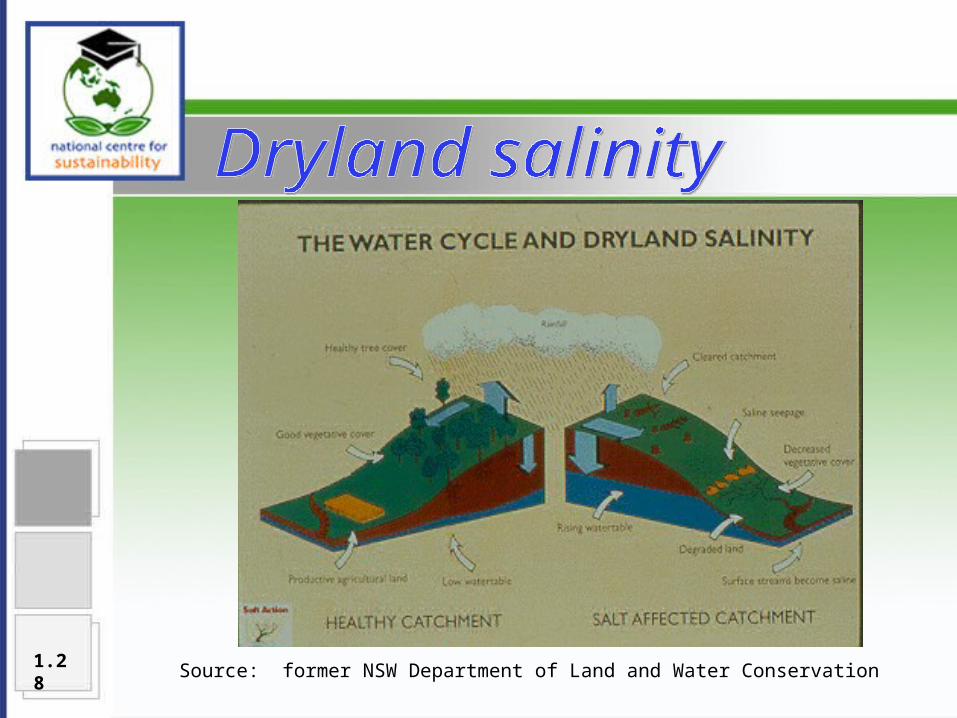
Source: former NSW Department of Land and Water Conservation1.28
We are steadily using up available non-renewable resources. Non-renewable resources = resources that are not replenished, or at least not replenished within hundreds of thousands of years, e.g. metals and fossil fuels
We are harvesting many renewable resources at rates greater than their rate of replenishment (e.g. many forests)
Use of energy from fossil fuels, which are effectively non-renewable, is of huge concern. Fossil fuels include petrol, diesel, natural gas, LPG, black and brown coal, oil, kerosene and aviation gasoline
Energy use and environmental impacts are closely linked, as the extraction, transport and use of fuels and the production of electricity impact the environment on local, regional and global levels, particularly the enhanced greenhouse effect and global warming
Global use of fossil fuel increased by over three and a half times between 1950 and 20001.29
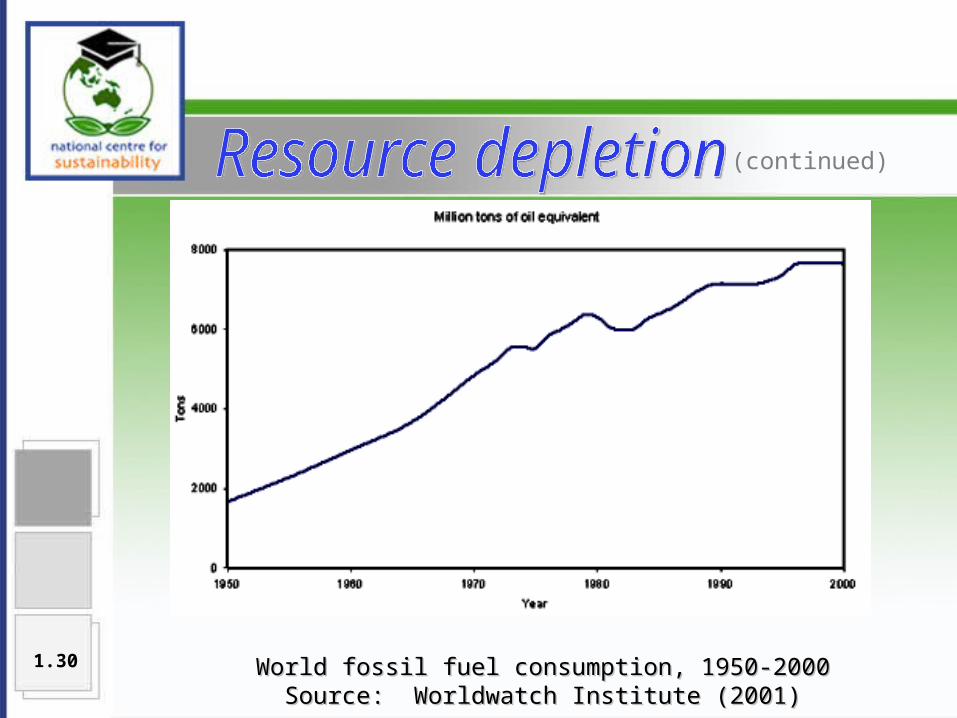
World fossil fuel consumption, 1950-2000World fossil fuel consumption, 1950-2000Source: Worldwatch Institute (2001)Source: Worldwatch Institute (2001)
(continued)
1.30

Australia, which compared to many countries has large reserves in comparison to annual use, is nonetheless facing a decline in crude oil production over the next decade, with estimates that self-sufficiency for this product will decline from 85 percent in 2001 to less than 40 percent in 2010
In Australia, the ultimate constraint to use of non-renewable energy resources may well be the environmental impacts of extraction and consumption, rather than availability
Potable water another critical resource being depleted, particularly in Australia. Australia is the world’s driest inhabited continent, yet in 1996/97 used 24,058 gigalitres (approx. 24 billion cubic metres) annually – an increase of 65 percent since 1985. There was a 75 percent increase in the annual volume of water used for irrigation between 1985 and 1996/97
(continued)
1.31
About one-third of the world’s population lives in regions with moderate to high water stress. If present consumption trends continue, two thirds of people in the world will live in water-stressed conditions by the year 2025
Extraction of non-renewable resources has many environmental impacts, but is also a social issue - current wasteful practices reduce the opportunities for future generations to access these resources to satisfy their own needs. Within current generations, there is enormous inequity in how resources are distributed, leading to increasing global tensions
(continued)
1.32
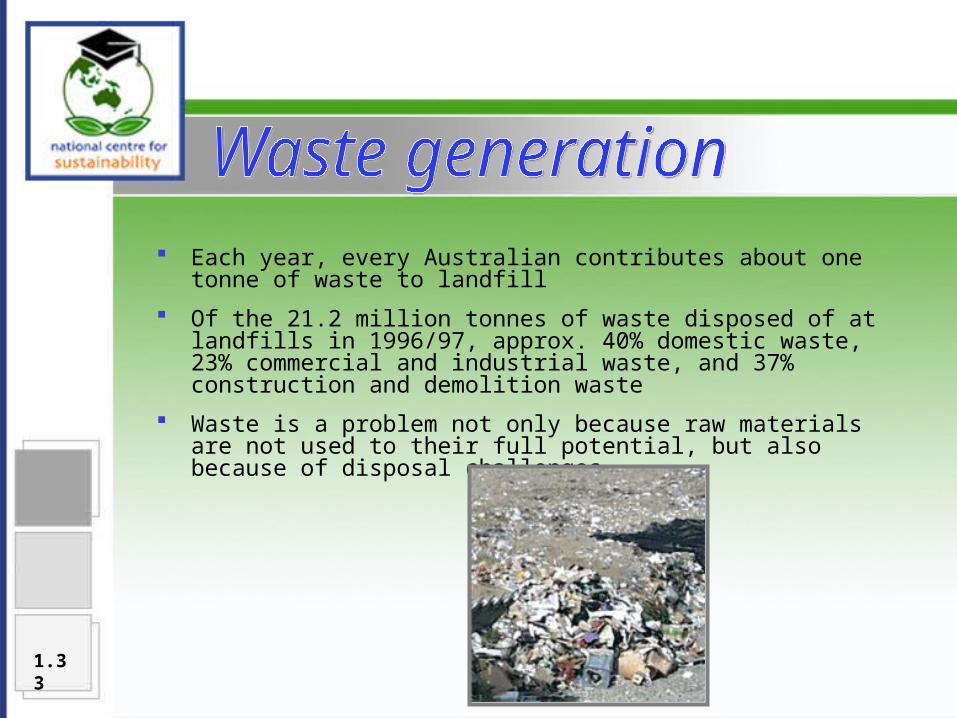
Each year, every Australian contributes about one tonne of waste to landfill
Of the 21.2 million tonnes of waste disposed of at landfills in 1996/97, approx. 40% domestic waste, 23% commercial and industrial waste, and 37% construction and demolition waste
Waste is a problem not only because raw materials are not used to their full potential, but also because of disposal challenges
1.33
Traditional approaches to waste management rely on the natural environment to absorb and assimilate unwanted by-products. Environmental impacts associated with waste disposal include land contamination, methane emissions, leachate discharges, odour, flammability, toxicity, and consumption of land resources
Landfill has been the most common method of dealing with solid waste in Australia. In large cities, and increasingly in towns, existing landfills are filling up and it is difficult to find new sites. Waste disposal costs have also risen substantially in recent decades
Hazardous waste creates additional problems, as it is difficult and costly to safely treat, or store, such materials
(continued)
1.34
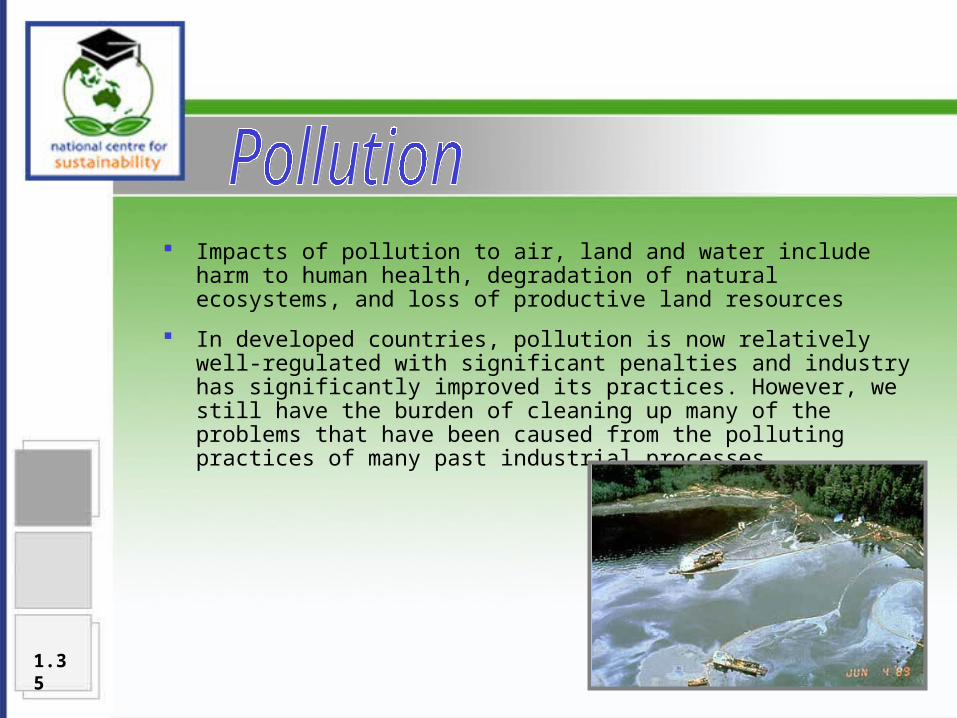
Impacts of pollution to air, land and water include harm to human health, degradation of natural ecosystems, and loss of productive land resources
In developed countries, pollution is now relatively well-regulated with significant penalties and industry has significantly improved its practices. However, we still have the burden of cleaning up many of the problems that have been caused from the polluting practices of many past industrial processes
1.35

Some pollutants are extremely persistent, and do not readily break down in the environment. As a consequence, they can ‘bioaccumulate’
Minamata in Japan suffered one of the worst cases of industrial pollution in history
Non-point source pollution, such as oil and litter in stormwater, still an environmental problem in Australia
In many developing countries, where env. legislation non-existent or not enforced, industrial pollution remains a serious problem
(continued)
1.36
1.37
“…development that meets the needs of the present without compromising the ability of future generations to meet their own needs”
- 1987 World Commission on Environment and Development Report Our Common Future (The Brundtland Report)
1.38
“using, conserving and enhancing the community’s resources so that ecological processes, on which life depends, are maintained and the total quality of life, now and in the future, can be increased”
National Strategy for Ecologically Sustainable Development (1992)
1.39
“in scientific terms, it means a system state that can endure indefinitely”
(AtKisson, 2001)
“…has come to mean long-term survival and well-being
in general, both for human civilization and the rest of nature”
(AtKisson, 2001)
1.40
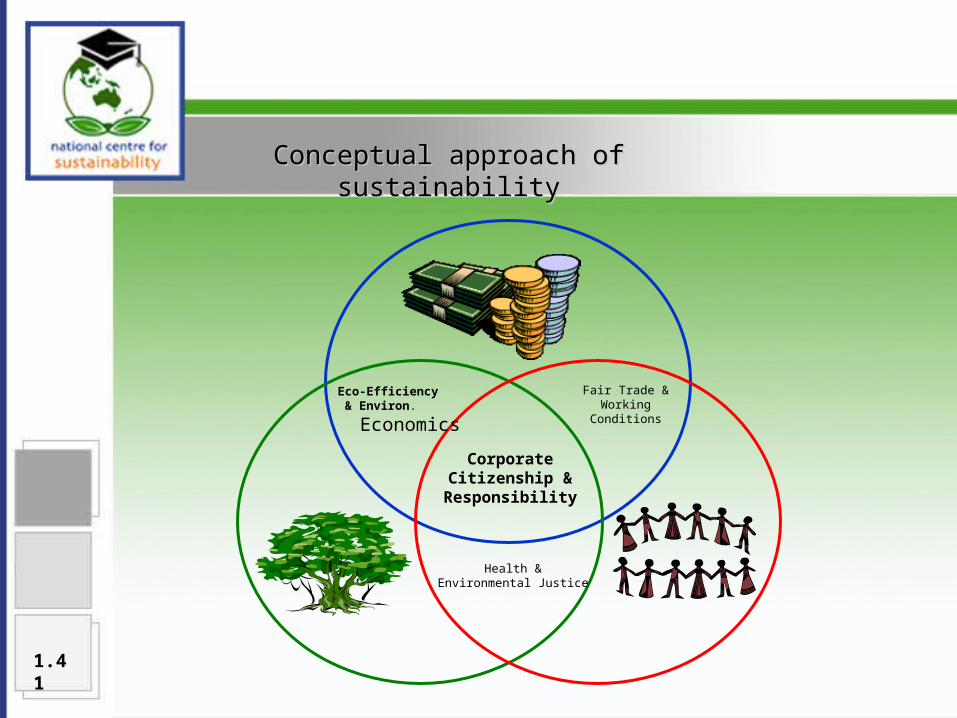
Conceptual approach of sustainabilityConceptual approach of sustainability
Eco-Efficiency & Environ.
Economics
Health & Environmental Justice
Fair Trade & Working Conditions
Corporate Citizenship & Responsibility
1.41
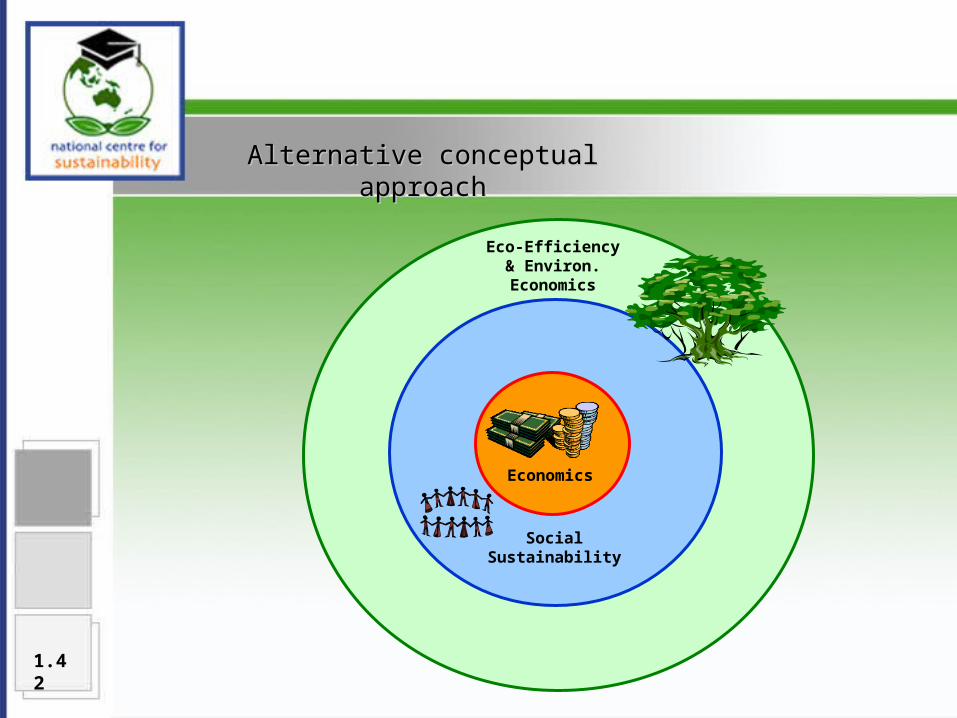
Alternative conceptual approachAlternative conceptual approach
Eco-Efficiency& Environ.Economics
Social Sustainability
Economics
1.42
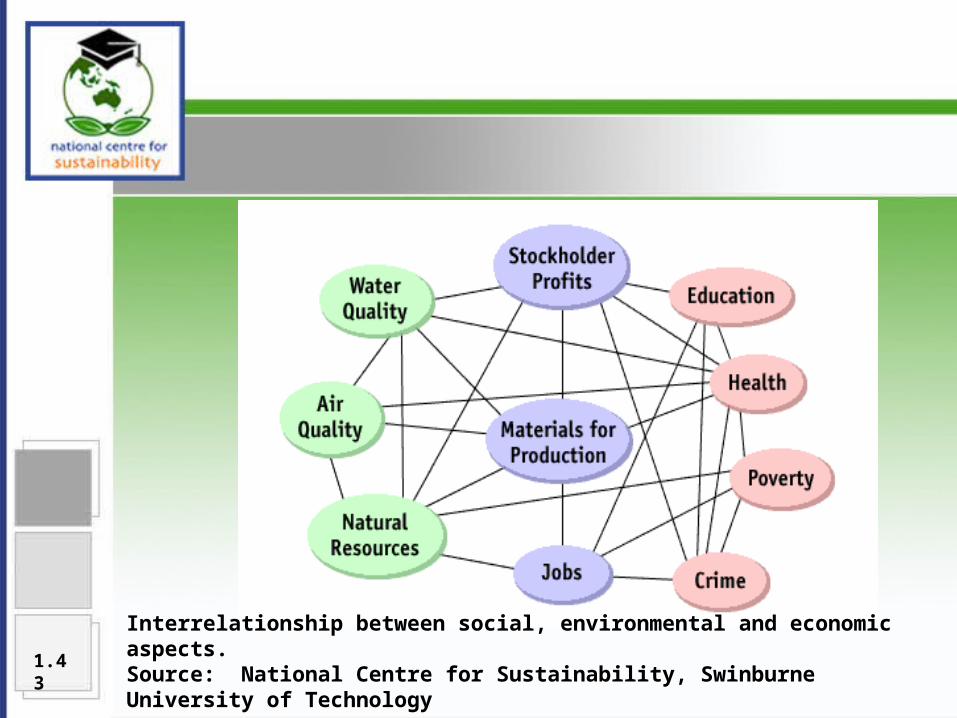
Interrelationship between social, environmental and economic aspects. Source: National Centre for Sustainability, Swinburne University of Technology
1.43
growth = “the increase in human population, resource use, and the emission of waste”
development = “improvements in human technology and advances in the human condition, including health, education, intelligence, wisdom, freedom, and the capacityto love”
(AtKisson, 1999)
1.44
“‘Sustainable development’ has become one of the politically-correct theses of our era. Everybody is in favour of it - and everybody defines the term, on Humpty Dumpty’s principle, to mean what they want it to mean”
- (Sir Martin Holdgate)
1.45
“Sustainable development – a term so misapplied as to be nearly beyond rescue – is not development-as-usual with a few green-looking additions or nods to social equity; but that is what is has often been reduced to in practice”
(AtKisson, 2001)
1.46
“…as a word…is dying because of misuse, and dryness, and reduction to buzzword. It is dying because it is attached to too many initiatives that are failing to achieve their stated goals – or even, in many cases, to make any significant progress in that direction.”
(AtKisson, 2001)
1.47
1.48
“The triple bottom line focuses corporations not just on the economic value they add, but also on the environmental and social value they add – and destroy. At its narrowest, the term ‘triple bottom line’ is used as a framework for measuring and reporting corporate performance against economic, social and environmental parameters.”
(Elkington, 1980)
1.49
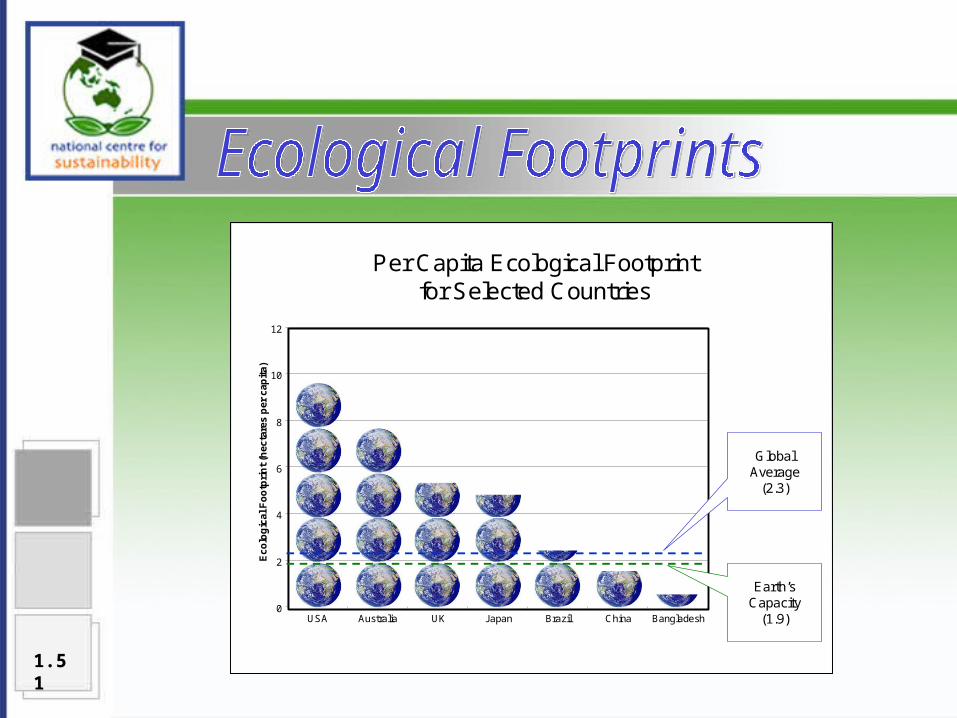
A means of quantifying the environmental impacts of various lifestyles
Summarises into a single value the level of sustainability of an individual, organisation, region, State or country
Allows for estimation of the area of land needed to support a household, a school, a business or society as they currently operate
Provides a simple way of identifying whether or not lifestyles and activities fit within the carrying capacity of the earth
If everyone else in the world consumed resources and energy and produced wastes the way Victorians currently do, we would need at least three earths to support such behaviours
1.50
0
2
4
6
8
10
12
USA Australia UK Japan Brazil China Bangladesh
Ec
olo
gic
al F
oo
tpri
nt
(hec
tare
s p
er c
apit
a)
GlobalAverage
(2.3)
Per Capita Ecological Footprintfor Selected Countries
Earth’sCapacity
(1.9)
1.51
A German concept defined by the European Environment Agency (1999) as:
“The material input of a product (service) minus the weight of the product itself. The material input is defined as the life cycle wide total quantity (in kg) of natural material moved (physically displaced) by humans in order to generate a good.”
A semiconductor chip generates over 100,000 times its weight in waste during production
A laptop computer generates close to 4,000 times its weight in waste
1.52
“…an overall approach to business management to reduce the use of energy, water and material resources and to minimise waste and pollution. It involves a shift in environmental protection from an ‘end-of-pipe’ approach where pollution is managed after it is created, to a ‘front-of-process’ approach where the creation of pollution is avoided or minimised at the source…[it] involves changing attitudes and rethinking products and processes. However, cleaner production is not only about manufacturing and production. It covers all processes, products and services and their impacts, including planning and design”
(former NSW Environment Protection Authority)
1.53
Sometimes called life cycle analysis A tool that assesses a range of environmental impacts of a
product or material across its whole life cycle – that is from the extraction of raw materials through to manufacturing, transportation, use and eventual disposal
Useful in making more informed decisions about appropriate choices of products and materials
1.54
States that the manufacturer of a particular product should be responsible for that product during its use and at the time of disposal
The rationale is that this will encourage manufacturers to design products that are less hazardous, easier to dismantle and recycle, and so forth
This concept has been most explored in Europe, where it has been considered for example for adoption by white goods and automobile manufacturers
1.55
A means of rating a product or service in terms of its environmental credentials according to agreed sets of guidelines and products. Most eco-labelling schemes require the use of a third-party to verify claims prior to certain labels being used
The energy-rating scheme for white goods is a form of eco-labelling
For more information see the Australian Environmental Labelling Association, Inc. at http://www.aela.org.au/StandardsDirections.htm
1.56
The term given to a claim that a product or service is environmentally-friendly or otherwise superior to its competitors, when in fact this is not the case
Greenwash hurts organisations that are legitimately trying to do the right thing, by making it harder for consumers to differentiate, while potentially also increasing consumer cynicism
It is hoped that as eco-labelling of products and services is increasingly adopted and refined, greenwash will be less of a problem
1.57
Coral reefs cover less than 0.2% of ocean area, but are among Earth’s most complex and productive ecosystems
In late 2000, 27% of the world’s coral reefs were severely damaged. In 1992 this figure was only 10% which demonstrates the speed with which the health of reefs is deteriorating
The greatest losses have occurred in the Indian Ocean, the Arabian Sea and Persian Gulf, and in Southeast Asia
1.59
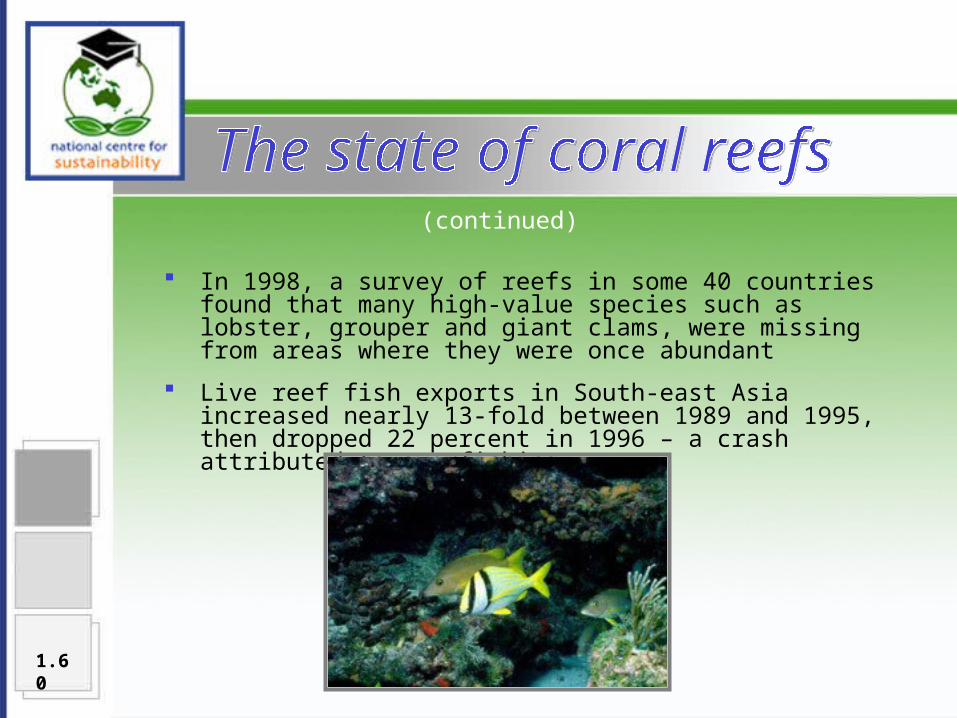
In 1998, a survey of reefs in some 40 countries found that many high-value species such as lobster, grouper and giant clams, were missing from areas where they were once abundant
Live reef fish exports in South-east Asia increased nearly 13-fold between 1989 and 1995, then dropped 22 percent in 1996 – a crash attributed to overfishing
(continued)
1.60
Coral reefs offer a number of essential goods and services that have been valued at some $375 billion per year. These goods and services include: shelter to coastlines from storm damage, erosion and flooding
(estimated to globally provide such protection for half a billion people)
habitat for as many as a million species, including more than a quarter of all known marine fish species
important feeding and breeding grounds for commercial fisheries, producing about a tenth of the global fish catch and a quarter of the catch in the developing world
significant tourism revenue, with the Carribean reefs alone estimated to bring in some $140 billion annually
potential medicines. Reef-derived molecules have been used to develop medicines from antibiotics to HIV drugs
(continued)
1.61
An estimated 11% of the world’s coral reefs have been lost, and a further 60% are threatened, as a result of direct human pressures, including: overfishing (for food and for aquariums) trawling, with a single pass removing up to a quarter of seabed life coral mining coastal development waste dumping vessel collision nutrients and sediments resulting from inland deforestation and
farming blasting of reefs, with up to 10 separate explosions to obtain 1 ton
of fish, shattering up to 20 square meters of reef per blast. This practice has degraded an estimated 75% of Indonesia’s reefs
cyanide injection. In the Philippines, more than a million kilograms of cyanide have been injected into reefs since the 1960s a procedure that stuns or kills many non-target species as well
(continued)
1.62
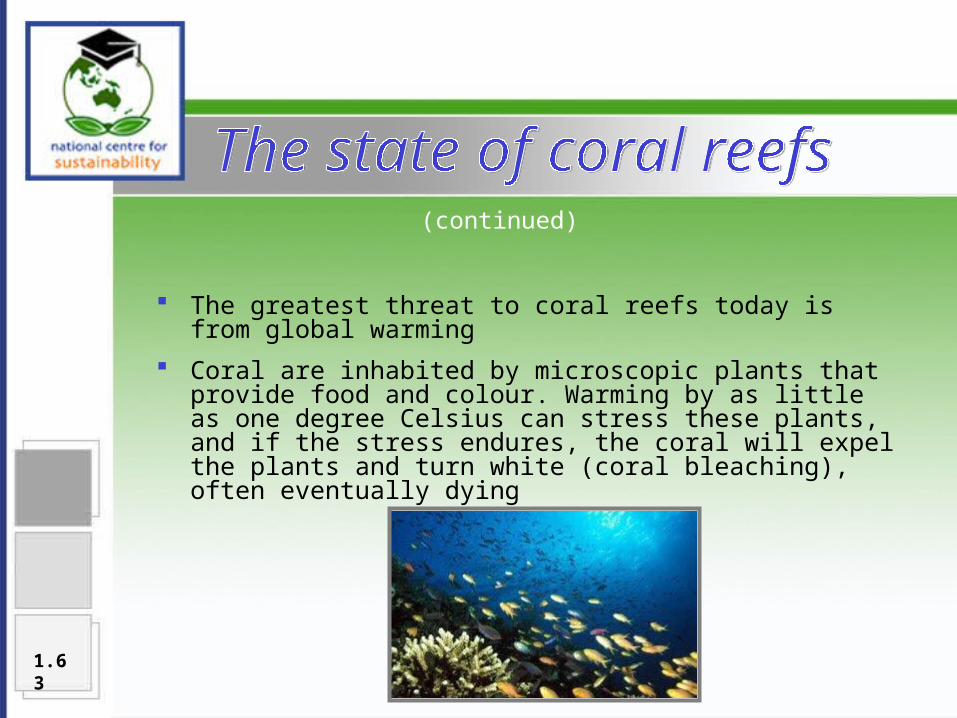
The greatest threat to coral reefs today is from global warming
Coral are inhabited by microscopic plants that provide food and colour. Warming by as little as one degree Celsius can stress these plants, and if the stress endures, the coral will expel the plants and turn white (coral bleaching), often eventually dying
(continued)
1.63
“Coral bleaching” events have increased in frequency and intensity since the early 1980s. 1997-98 saw the worst episode on record, affecting some 16% of the world’s reefs, in at least 60 countries. Indian Ocean reefs alone suffered damages estimated as high as $8.2 billion. In some areas, 1,000-year old corals died and losses neared 90%, at depths nearing 40 meters
It is estimated that about half of coral affected by bleaching could rebound in the next 20-50 years, but only if ocean temperatures remain steady and human pressures are low. If global warming continues it is predicted that as many as 60% of all reefs could be lost by 2030
(continued)
1.64
Related Documents