Revista de Economía Aplicada ISSN: 1133-455X [email protected] Universidad de Zaragoza España ÁLVAREZ, GEMA; CARRASCO, RAQUEL MEASURING THE IMPACT OF ON THE JOB TRAINING ON JOB MOBILITY Revista de Economía Aplicada, vol. XXIV, núm. 70, 2016, pp. 5-25 Universidad de Zaragoza Zaragoza, España Available in: http://www.redalyc.org/articulo.oa?id=96949057001 How to cite Complete issue More information about this article Journal's homepage in redalyc.org Scientific Information System Network of Scientific Journals from Latin America, the Caribbean, Spain and Portugal Non-profit academic project, developed under the open access initiative

Welcome message from author
This document is posted to help you gain knowledge. Please leave a comment to let me know what you think about it! Share it to your friends and learn new things together.
Transcript

Revista de Economía Aplicada
ISSN: 1133-455X
Universidad de Zaragoza
España
ÁLVAREZ, GEMA; CARRASCO, RAQUEL
MEASURING THE IMPACT OF ON THE JOB TRAINING ON JOB MOBILITY
Revista de Economía Aplicada, vol. XXIV, núm. 70, 2016, pp. 5-25
Universidad de Zaragoza
Zaragoza, España
Available in: http://www.redalyc.org/articulo.oa?id=96949057001
How to cite
Complete issue
More information about this article
Journal's homepage in redalyc.org
Scientific Information System
Network of Scientific Journals from Latin America, the Caribbean, Spain and Portugal
Non-profit academic project, developed under the open access initiative

5
Revista de Economía Aplicada Número 70 (vol. XXIV), 2016, págs. 5 a 25EA
MEASURING THE IMPACT OF ON THEJOB TRAINING ON JOB MOBILITY*
GEMA ÁLVAREZUniversidad de Vigo
RAQUEL CARRASCOUniversidad Carlos III de Madrid
This paper studies the effect of employer-provided training on the probabilityof subsequent job exit. Empirical evidence usually shows that the probabilityof receiving training by the employer is higher among those employees withthe lowest expected rates of turnover. Therefore, it seems that firms providetraining selectively. In this paper, we address the empirical question of towhat extent this endogeneity problem leads to a spurious correlation betweentraining receipt and job mobility. Using Spanish Data from the EuropeanCommunity Household Panel, we provide estimates that ignore the selec-tion bias and compare the results with the ones obtained when correcting forthe possible nonrandom selection between trainees and non-trainees. Over-all, our results show that there is a negative correlation between on the jobtraining and job mobility, but only for fired workers, and not for voluntarymovers. Nonetheless, once the endogeneity problem is accounted, the neg-ative effect becomes statistically nonsignificant for all types of movers.
Key words: on the job training, turnover, job mobility.
JEL Classification: M53.
This paper studies the effect of employer-provided training on the probability ofsubsequent job exit. It is a widely held view that firms’ provided training is cru-cial to improve long-term economic performance. Moreover, a significantamount of schooling takes place once the individual has entered in the labourmarket, so training is relevant both for employees and employers. Sieben
(2007) summarizes some of the reasons that explain the importance of firm-providedtraining. She emphasizes that training makes workers perform better in their jobs [Bar-tel (1995)], helps to adequate the skills acquired during initial education to skills re-quired at the job [De Grip et al. (1998)], is an instrument to prevent skills obsolescence[Bishop (1997)], and improves workers’ employability by increasing their career op-portunities both inside and outside the firm [Groot and Maasen van den Brink (2000)].
(*) We are grateful to Olympia Bover, Juan José Dolado, and two anonymous referees for commentson a previous draft of this paper. The second author acknowledges research funding from the Span-ish Ministry of Science and Innovation, Grant No. ECO2012-31358. All remaining errors are our own.

One of the main concerns with regards to the investment in training by firmsis that it can be under its optimal level. The argument commonly used to explain thisunder-investment is the so called “poaching problem”, that is, the probability thatemployees leave the firm after receiving the training and, thus, firms loose the op-portunity to recover their investment. According to this, standard human capital the-ory argues that firms will only bear the cost of firm-specific training and not of gen-eral training. Nonetheless, in practice, employers usually bear part of the costs ofgeneral training, which is consistent with recent training literature that assumes im-perfectly competitive labour markets. In any case, the absence of data on key theo-retical constructs of the theory –general training, specific training, or productivitygrowth– implies that the only predictions of the theory that can be accurately testedrelate to the effects of formal training on variables like wages or turnover. In this pa-per we focus on job mobility and our purpose is to address the empirical questionwhether those employees who receive training in their firm paid by the employer aremore prone to quit, rather than testing different theories.
To address this question it is important to note that firms typically provide train-ing to their employees selectively. This can be due to the above mentioned risk oflosing the returns of training or because employers are better at assessing the abil-ity of workers than the econometrician and provide training to those workers whoare highly able. This implies that participation in training is not distributed at ran-dom. Furthermore, there might be factors unobserved by the econometrician –likeaspirations, motivations and ambitions– that influence both training participation andjob mobility behavior. This is the so called “selection bias problem”, which impliesthat those workers who receive training would behave differently from those who donot, independently of any true causal effect of training on job mobility. In short, itis very likely that the probability of training receipt and the probability of subsequentjob exit are not independent one to another. This endogeneity may lead to a spuri-ous correlation between both variables.
Most of the empirical research on the effect of employer-provided training onsubsequent job mobility have adopted a sequential approach in which typically thequestion to answer is the following: if an individual receives training in period t, howdoes his probability to move from his job in period t+1 vary? A consistent findingof the empirical models which do not account for the previous endogeneity problemis that training has a negative effect on job mobility. However, this result only has acausal interpretation if it is assumed that there are not unobserved determinants ofmobility that also determine previous training participation. As emphasized before,this is difficult to maintain.
In this paper we present estimates that show the importance of accounting forthe selection problem, pointing out that lack of control of endogeneity could lead tomisleading policy recommendations. Using Spanish data from the European Com-munity Household Panel (ECHP), we focus on the effect of what the ECHP calls “vo-cational training”, because only in this case we have information on whether or notthe training has been paid by the employer. We present separate estimates for work-ers who leave the firm voluntarily and fired workers in order to account for the po-tential observed and unobserved differences between these two groups of “movers”.
Revista de Economía Aplicada
6

To quantify the causal effect of training receipt on job mobility we treat thesetwo variables as discrete. However, as opposed to the case of continuous variablemodels, instrumental variable methods are inappropriate for analyzing the relation-ship between two endogenous discrete variables [see Manski et al. (1992)]. Giventhis, we our preferred estimates are based on a switching probit model with endo -ge nous switching. Although there are also nonparametric alternatives to estimatethese types of models [see Manski (1990)], prior information assumptions are nec-essary if one is to do more than bound the probabilities. For that reason, our identi-fication strategy is based on assumptions about the probability distribution of the en-dogenous variables, and also on exclusion restrictions that will help to identify theparameters of the model. Specifically, we use lagged values of the training variablesas predetermined instruments and also information on whether or not the individualspeaks a second language as an external instrument.
Our results show when the endogeneity problem is not accounted for thatthere is a negative effect of employer-paid training on job mobility, although this ef-fect is only statistically significant for fired workers, and not for voluntary movers.However, once we account for the possible self-selection of the trainees, the nega-tive effect of training on job mobility becomes statistically non-significant in allcases. Therefore, we do not find evidence that the training itself reduces the likeli-hood of leaving the job. There are other unobserved characteristics potentially cor-related with training participation that need to be taken into account in order to haveuseful estimates of the effect of training on job mobility.
The organization of the paper is as follows. Section 1 reviews the related liter-ature; Section 2 presents the econometric model and the identification strategy; Sec-tion 3 describes the data set used; Section 4 contains the estimation results; and, Sec-tion 5 concludes.
1. EMPIRICAL RESEARCH ON THE EFFECT OF TRAINING ON JOB MOBILITY
There are a number of theories as to why workers change jobs. Many studieson training and job mobility take the Human Capital Theory [Becker (1964)] as astarting point. According to this theory, it is crucial the distinction between generaland firm-specific training. Specific training increases an individual’s productivityonly at the firm in which the individual is employed, while general training also in-creases his productivity in other firms. In this setting employees alone pay for thecosts of general training, while costs of firm-specific training are shared by both theworker and the firm. In this model investment on training is on its optimal level andspecific training should unambiguously be associated with lower turnover rates whileit is not expected any effect of general training on the employees’ inclination to quit.
This theory, however, is based on the assumption that labour market is perfectlycompetitive. Alternative theoretical models relax this assumption. According tothese models employers would be willing to bear part of the costs for general train-ing. This is the case, for example, of Stevens (1994), Katz and Ziderman (1990) orAcemoglu and Pischke (1998). The first one assumes imperfect competition in thelabour market while the others assume informational asymmetries. In these more re-alistic frameworks deviations from the optimal level of training are possible and bothgeneral and specific training could be related to job mobility.
Measuring the impact of on the job training on job mobility
7

From an empirical point of view, several papers have tried to analyze the rela-tionship between general or specific training and job mobility. Using data from callcentre agents in the Netherlands, Sieben and De Grip (2004) estimate logistic mod-els and obtain that only firm-specific training decreases inclination to quit for anotherjob inside the sector. Green et al. (2000), by the estimation of ordered probit mod-els, show that firm-specific training has a negative impact on job mobility in Britain,while general training has a non-significant impact.
It must be noted, however, that many available data sets do not distinguish betweengeneral and specific training. Moreover, in practice most of the training is a blend ofspecific and general training. For this reason many empirical studies focus on who payfor or/and organize the training offered to the employees. Some examples are Parent(2003), Zweimüller and Winter-Ebmer (2003), Elias (1994) and Lynch (1991).
Using Canadian data, Parent (2003) estimates a Cox proportional hazard modeland finds a negative relation between the receipt of employer supported training andthe breakdown of the labour relation. Zweimüller and Winter-Ebmer (2003), usingdata from Switzerland, distinguish between “employer-provided” and “self-fi-nanced” training. The first one is associated with firm-specific training and the sec-ond one is associated with general training. By the estimation of probit models theyfind that firm-specific training induces lower mobility for women, while there is nosignificant impact of general training. For Great Britain, Elias (1994) estimates logitmodels for the probability of a job completion. The results point to a negative effectof training on female labour mobility, while for males the effect is barely significant.In turn, Lynch (1991) focuses on the determinants of leaving an employer amongyoung workers in their first years of work in the United States. By the estimation ofCox proportional hazard models, the results show that those workers who had someformal “on-the-job training” were less likely to leave their employer, while those whoparticipated in some form of “off-the-job training” were more likely to leave.
One of the major drawbacks of some of the existing literature is that trainingis treated as an exogenous determinant of job mobility and the reverse-causationproblem is not controlled for. As pointed out by Card and Sullivan (1988), the mea-surement of training effects in the absence of random assignment into trainees andnon-trainees groups is extremely difficult. Some studies address this issue within aduration model framework and account for unobserved effects correlated with train-ing and mobility by modelling individual-specific baseline hazards [see, for instance,Korpi and Mertens (2003), Parent (2003) or Elias (1994)]. Some other authors, likeVeum (1997), account for the endogeneity problem using as instruments for train-ing variables related to institutional characteristics of the individual’s locality try-ing to reflect the individual’s potential access to training. By the estimation of Coxproportional hazard models, he provides only limited evidence that training reducesturnover. Nonetheless, the instruments used for identification in Veum’s paper areonly moderately successful in predicting training receipt. Within a different frame-work, Sieben (2007) studies the effect of training on search behavior by estimatinglogit models. She controls for selectivity by applying Heckman two-steep methodsusing as exclusion restrictions variables related to the previous educational level ofthe individual. Her results show that there is no significant self-selection for men,while for women she did not find any variable which affects training and not search
Revista de Economía Aplicada
8
behavior. Another possibility is to rule out the unobserved effects using a first-dif-ferences approach [see Greenhalgh and Stewart (1987)]. Nonetheless, this approachhas greater potential to further enhance any measurement errors present in the dataand moreover, it is not straightforward to apply in non-linear models.
In this paper we use an identification strategy based on the estimation of aswitching probit model with endogenous switching. As there is no obvious identify-ing restriction that could be used to perform over-identification tests, we use the non-linearity of the model as the minimum identifying assumption. Nevertheless, identi-fication based solely on arbitrary functional form assumptions is fragile. In this sense,the presence of a regressor in the training equation that does not directly affect the mo-bility decision could improve identification of the parameters of the model1. Altonjiand Shakotko (1987), in the context of the effect of tenure on wages, propose usingthe variation of tenure over a job match as instrumental variable for tenure. Parent(1999) extends this methodology to the study of the effect of training on wages. How-ever, given the discrete nature of our endogenous variables, this approach is not validfor us, since there is no enough variation in that instrument to explain the training vari-able. We have, therefore, relied on a distributional assumption element using in addi-tion some exclusion restrictions to identify the parameters of the model. Specifically,we try to capture certain aspects of the ability of the worker that could influence onthe training probability using information on whether or not the individual speaks asecond language. Moreover, we take advantage of the panel structure of the data anduse also two lagged values of the training variables as predetermined instruments.
2. THE ECONOMETRIC MODEL
The empirical question of interest is whether training causally affects job mobil-ity. To measure this effect it is useful to define two hypothetical mobility outcomes,M0 and M1. Each worker, i, is characterized by values of the variables (Mi1, Mi0, Ti, xi).Variable Mi1 indicates the outcome if the individual were to take the training course:Mi1 = 0 if the individual does not move and Mi1 = 1 otherwise. Similarly, Mi0 indi-cates the outcome if the individual were not to participate in the training program.Here x is a vector of individual and job characteristics. The binary variable T indi-cates training participation in the previous period and is defined as Ti = 1 if the in-dividual participates and Ti = 0 otherwise.
We can measure the effect of training on job mobility for a particular individualby the difference Pr(Mi1 = 1|xi)-Pr(Mi0 = 1|xi). It measures how a particular individ-ual would change job mobility behavior if his training behavior switched from Ti = 0to Ti = 1. However, for each individual we only observe the value of Mi1 or Mi0, andthe other value is censored. As pointed out by Manski et al. (1992), the samplingprocess generating the data only identifies the conditional probabilities Pr(Mi1 = 1|xi,Ti = 1) and Pr(Mi0 = 1|xi, Ti = 0). Therefore, in the absence of prior information, thedata cannot identify the parameters of interest, Pr(Mi1 = 1|xi) and Pr(Mi0 = 1|xi).
Measuring the impact of on the job training on job mobility
9
(1) As Dearden et al. (1996) recognize it is difficult to suggest variables which are correlated withtraining but not with mobility. Thus, in practice, identification would be through functional form as-sumptions.
One solution to this identification problem, typically used in linear models, is touse the standard two-stage or instrumental variables method. Nevertheless, the pres-ence of a dummy endogenous regressor in a binary choice model makes the analysisdiffer substantially from that in continuous variable models. More precisely, the stan-dard two-stage method leads to an inconsistency with the statistical assumptions of thenonlinear discrete models. Moreover, the alternative linear probability model is in-compatible with the observed data when dummy endogenous regressors are presentin a binary choice model [see Carrasco (2001) for a detailed discussion on this issue].
Given this problem, the identification of the effect of training on job mobilitydepends crucially on the available prior information to the econometrician. As in Car-rasco (2001), that prior information about the joint probability distribution of (Mi1,Mi0, Ti) is expressed through the formulation of a trivariate probit model.
Let us then consider the following switching probit model for N individuals:
Revista de Economía Aplicada
10
(2) This model is similar to the one estimated by Manski et al. (1992) in the context of the effect offamily structure during adolescence on high school graduation.
[1]α
α
( )( )
== Γ + ≥ =
= Γ + ≥ =
⎧⎨⎪
⎩⎪M
M x u T
M x u T
0 , 1;
0 , 0;i
i i i i
i i i i
1 1 1
0 0 0
[2]T q i N0 , ( 1,..., ),i i iβ ε( )= Γ + ≥ =
[3]
1
1
1
10 1
0∑ρ ρ
ρ=
⎛
⎝
⎜⎜⎜
⎞
⎠
⎟⎟⎟
ε
ε
and
where Γ is the indicator function, α1, α0 and β are vectors of coefficients which includea constant term, Mi is the observed job mobility outcome for individual i, and q is avector of variables which can include an exclusion restriction. We assume that (ui1, ui0,ε1) are jointly normally distributed with zero mean vector and covariance matrix.
We estimate several models which differ in their assumptions about the co-variance matrix of the disturbances. The most general one does not impose any re-strictions on the covariance matrix (ui1, ui0, ε1)2. This is a switching probit model withendogenous switching. This is our preferred model since training participation andjob mobility outcomes may be jointly determined by processes that cannot be directlyobserved. In the context of the latent-variable model previously presented, thismeans that the disturbances (ui1, ui0, ε1) are statistically dependent. Notice that thestandard bivariate probit arises as an especial case in which ρ0ε = ρ1ε.
As emphasized before, within this framework, the main problem we face isgiven by the fact that the data are not able to identify Pr(M1 = 1|x) and Pr(M0 = 1|x).Given that the two variables of interest, mobility and training, are discrete, one cannot apply the standard two stage IV approach as in continuous variable models. The

reason is that since training is a binary indicator its distribution cannot be normal,and as a consequence, two-stage or instrumental-variable methods are not valid al-ternatives for estimating this type of nonlinear models. Hence, as it is pointed outby Manski et al. (1992), the possibilities for inference depend critically on the as-sumptions about the distribution of the disturbances of the model, as well as on theavailable prior information about the process generating the outcomes of interest. Inthis paper, we assume that the disturbances are distributed trivariate normal and alsouse some exclusion restrictions to improve the identification of the causal effect ofinterest. In particular, we use an “external” instrument given by an indicator of whetheror not the individual speaks a second language. We also use as instruments laggedvalues of the training variable. Notice that by using predetermined instruments weaccount for the potential persistence in the training variable. The identifying as-sumption behind is that, once we account for current training, there is no a direct ef-fect on mobility between t and t+1 of having received training in t-1 and before. Theonly effect of training in t-1 and before is through its effect on training in t3.
Dropping out the individual subscripts, the log-likelihood function of the mo -del, from which maximum likelihood estimates can be obtained, is as follows:
Measuring the impact of on the job training on job mobility
11
(3) This assumption is standard in the panel data literature.(4) This data set has been also used, for instance, by Arulampalam et al. (2010) to study the effect oftraining for workers at different quantiles of the wage distribution in ten European Union countries.
[4]L P P P P, , , , log log log log ,M T M T M T M T
0 1 0 1 000, 0
010, 1
101, 0
111, 1
∑ ∑ ∑ ∑α α β ρ ρ( ) = + + +ε ε= = = = = = = =
[5]
P M T x q
P M T x x q
P M T q P
P M T q P P P P
Pr 0, 0 , ; ,
Pr 0, 1 , ; ,
Pr 1, 0 ,
Pr 1, 1 1 .
00 0 0
01 1 1 1
10 00
11 10 00 01 10
α β ρ
α α β ρ
β
β
( )( )( )
( )( )
( )( )( )( )
= = = = Φ − −
= = = = Φ − − Φ − −
= = = = Φ − −
= = = = Φ − − = − − −
ε
ε
where
Notice that the model which assumes that ε is statistically independent of (u1, u0),imposes that training is exogenous to job mobility (that is to say, ρ1ε = 0 and ρ0ε = 0).This assumption would mean that the unobserved factors that affect job mobility andtraining are uncorrelated. In that case, the sampling process would be able to iden-tify the probability of interest, Pr(M = 1|xi, Ti), and the parameters can be estimatedby maximizing the binary probit likelihood. This model is estimated as a benchmark.
3. DATA DESCRIPTION
The data come from the last two waves of the European Community HouseholdPanel (ECHP) corresponding to years 2000 and 2001 for Spain4. This is a longitu-dinal data set which allows us to measure the effect of training in one period on labour

market status in subsequent periods5. Every year the selected households are inter-viewed about issues relating to demographics and labour market behavior.
Our sample comprises individuals employed in the first wave. Specifically, weselect those employees who declare that are normally working 15 or more hours perweek in 2000. We focus on this group because some important variables for theanalysis, as tenure or firm size, are only available for individuals working 15 hoursor more. We eliminate those in self-employment and those working with an employerin paid apprenticeship. We also exclude employees in the agricultural sector and thoseover 60 years old (in order to mitigate the effect of job exit due to retirement). Thefinal sample size is 2,707 observations.
The dependent variable is an indicator of job mobility. It takes the value 1 forthose individuals that in the second wave are not in the same job held in the first one.This definition of the job mobility variable is adopted, for example, by Elias (1994)or Mincer and Jovanovic (1981), and implies that it takes value 1 also for individu-als who move to unemployment or inactivity. It must be noted, however, that the mostcommon movement is to another job (66.0% versus 13.4% who become unemployedand 20.6% who leave the labour market)6. On the other hand, in the case of the move-ments to another job, we have also used information on tenure in order to captureexits from the firm and not changes of job within the same firm, which are not rel-evant in this context. On the whole, 22.6% of the individuals change their labour sit-uation between the two waves. We have also performed separate estimates that ac-count for the reason why the workers leave the job. Specifically, we estimate a modelin which the mobility variable takes the value 1 for movers who have been fired (theseare 12.6% of the sample), and another model for those who have voluntarily left thefirm, who represent 9.8% of the sample.
With respect to the training variable, the ECHP distinguishes between “general”and “vocational” courses. We focus on vocational training because only in this casewe know if the training has been paid and/or organized by the employer7. We definetraining to take the value 1 if the individual has received such training since Janu-ary in the previous year, and 0 otherwise. About 10.3% of individuals in the total sam-ple have received vocational training paid or organized by their employer8, while thisfigure is 11.2% and 11.7% for the subsamples used to estimate the models for firedworkers and voluntary movers, respectively.
Revista de Economía Aplicada
12
(5) We restrict the analysis to the last two waves of the survey because the focus of our research isto analyze endogeneity issues, and we want to keep a homogeneous sample without the potential in-fluence of business cycle effects.(6) We have also considered a different measure of job mobility which excludes those individuals whomove to unemployment or inactivity. The results, available upon request, do not change.(7) The type of information on general training available in this data set does not allow us to analyze theeffect of this type of training. The definition of “general training” in this survey is just referred to sec-ondary and university education, and this is not the type of general training that it would be of interestfor us. We focus on the training received on the job and paid by the employer because we are interestedon the problem faced by the employers if they lose the returns to the investment on certain workers.(8) The distribution of the type of vocational training, according to the information in the survey, is thefollowing: (i) specific vocational training at a vocational school (24.6% of the total sample), (ii) specificvocational training within a system providing both work experience and a complementary instruction else-where (6.8%), (iii) specific vocational training in a working environment (60.7%), and (iv) other (7.9%).

The explanatory variables used in the estimation refer to socio-demographicvariables related to the individual and to variables related to the job and the firm inwhich the individual was employed in the first wave9. With respect to socio-demo-graphic characteristics we include dummy variables for gender, marital status, andfor the presence of children under the age of 12. We also take into account the age(4 dummies) and the educational level (3 dummies) of the individual according tothe International Standard Classification of Education. The characteristics of the jobheld in the first wave are included in terms of the type of contract (temporary or not),part-time or full-time employment, and tenure. We also account for the job status us-ing three dummies variables indicating if the job held by the employee is (i) super-visory; (ii) intermediate; or (iii) non-supervisory. Firm’s characteristics, such us pri-vate or public sector and service sector are also included. We capture the size of thefirm through three dummy variables which take the value 1 for small (less than 100employess), medium (between 100 and 500 employess), and large firms (with morethant 500 employess), respectively10.
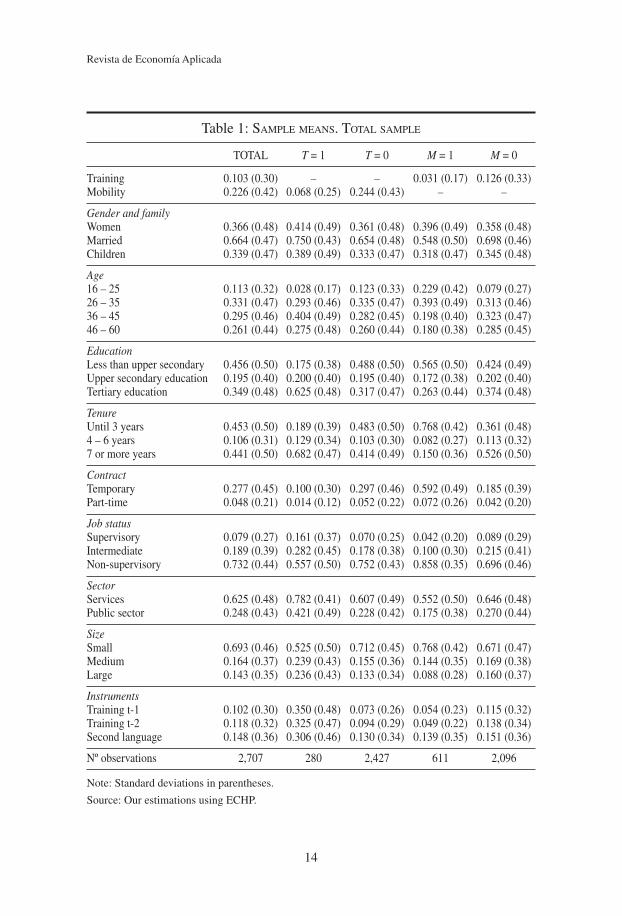
The sample characteristics are presented in Tables 1, 2, and 3. Table 1 offers de-scriptive information for what we called “total sample”, which is used for the esti-mations in which the mobility variable does not distinguish between fired workersand voluntary movers. Tables 2 and 3 correspond to the samples used to estimate themodels for fired workers and for voluntary movers, respectively11. Means are cal-culated for the whole sample and by sub-samples of trained and non-trained andworkers who have changed their labour situation and those who haven’t.
We observe that job change is more frequent among those that have not receivedtraining and that the percentage of trained is higher among those who have not changetheir labour situation. This points to a negative relationship between employer-pro-vided training and subsequent job exit, for the three samples considered. If we com-pare trained and non-trained sub-samples we can see that in the first group there arerelatively more women. Also, this group of individuals are relatively older, more ed-ucated and with more tenure in their current job. On the contrary, in the non-trainedsub-sample there are relatively more temporary workers. With respect to the job sta-tus, this is higher among the trained group as well as the percentage of public andservice sector and large firm employees. Comparing the employees who change theirlabour situation with those who haven’t changed it we see that “movers” are rela-tively younger, less educated and with less tenure. They are more often temporaryworkers and held lower positions in their firms which, also, tend to be smaller. Fi-nally, they are to a lesser extent employees in the public or service sectors.
Measuring the impact of on the job training on job mobility
13
(9) Other variables, like the quality of the training programs, could also be relevant to explain the ef-fect of training on job exit. Unfortunately, in our data set we do not have this information.(10) Notice that there could be other unobservable variables of the firm potentially correlated withthe error term of the model. Nonetheless, given the characteristics of the data set, it is difficult to dealwith them. One possibility could be to include firm’s specific fixed effects, but this would require hav-ing data in which the cross sectional unit was the firm and not the individual.(11) Notice that we do not use exactly the same individuals since for the last two samples we needinformation about the reason why the worker left the firm, which is missing for some individuals ofthe total sample and we have preferred to keep as many individuals as possible in the total sample.We have performed estimates usging exactly the same observations and the results do not change.
Revista de Economía Aplicada
14
Table 1: SAMPLE MEANS. TOTAL SAMPLE
TOTAL T = 1 T = 0 M = 1 M = 0
Training 0.103 (0.30) – – 0.031 (0.17) 0.126 (0.33)Mobility 0.226 (0.42) 0.068 (0.25) 0.244 (0.43) – –
Gender and familyWomen 0.366 (0.48) 0.414 (0.49) 0.361 (0.48) 0.396 (0.49) 0.358 (0.48)Married 0.664 (0.47) 0.750 (0.43) 0.654 (0.48) 0.548 (0.50) 0.698 (0.46)Children 0.339 (0.47) 0.389 (0.49) 0.333 (0.47) 0.318 (0.47) 0.345 (0.48)
Age16 – 25 0.113 (0.32) 0.028 (0.17) 0.123 (0.33) 0.229 (0.42) 0.079 (0.27)26 – 35 0.331 (0.47) 0.293 (0.46) 0.335 (0.47) 0.393 (0.49) 0.313 (0.46)36 – 45 0.295 (0.46) 0.404 (0.49) 0.282 (0.45) 0.198 (0.40) 0.323 (0.47)46 – 60 0.261 (0.44) 0.275 (0.48) 0.260 (0.44) 0.180 (0.38) 0.285 (0.45)
EducationLess than upper secondary 0.456 (0.50) 0.175 (0.38) 0.488 (0.50) 0.565 (0.50) 0.424 (0.49)Upper secondary education 0.195 (0.40) 0.200 (0.40) 0.195 (0.40) 0.172 (0.38) 0.202 (0.40)Tertiary education 0.349 (0.48) 0.625 (0.48) 0.317 (0.47) 0.263 (0.44) 0.374 (0.48)
TenureUntil 3 years 0.453 (0.50) 0.189 (0.39) 0.483 (0.50) 0.768 (0.42) 0.361 (0.48)4 – 6 years 0.106 (0.31) 0.129 (0.34) 0.103 (0.30) 0.082 (0.27) 0.113 (0.32)7 or more years 0.441 (0.50) 0.682 (0.47) 0.414 (0.49) 0.150 (0.36) 0.526 (0.50)
ContractTemporary 0.277 (0.45) 0.100 (0.30) 0.297 (0.46) 0.592 (0.49) 0.185 (0.39)Part-time 0.048 (0.21) 0.014 (0.12) 0.052 (0.22) 0.072 (0.26) 0.042 (0.20)
Job statusSupervisory 0.079 (0.27) 0.161 (0.37) 0.070 (0.25) 0.042 (0.20) 0.089 (0.29)Intermediate 0.189 (0.39) 0.282 (0.45) 0.178 (0.38) 0.100 (0.30) 0.215 (0.41)Non-supervisory 0.732 (0.44) 0.557 (0.50) 0.752 (0.43) 0.858 (0.35) 0.696 (0.46)
SectorServices 0.625 (0.48) 0.782 (0.41) 0.607 (0.49) 0.552 (0.50) 0.646 (0.48)Public sector 0.248 (0.43) 0.421 (0.49) 0.228 (0.42) 0.175 (0.38) 0.270 (0.44)
SizeSmall 0.693 (0.46) 0.525 (0.50) 0.712 (0.45) 0.768 (0.42) 0.671 (0.47)Medium 0.164 (0.37) 0.239 (0.43) 0.155 (0.36) 0.144 (0.35) 0.169 (0.38)Large 0.143 (0.35) 0.236 (0.43) 0.133 (0.34) 0.088 (0.28) 0.160 (0.37)
InstrumentsTraining t-1 0.102 (0.30) 0.350 (0.48) 0.073 (0.26) 0.054 (0.23) 0.115 (0.32)Training t-2 0.118 (0.32) 0.325 (0.47) 0.094 (0.29) 0.049 (0.22) 0.138 (0.34)Second language 0.148 (0.36) 0.306 (0.46) 0.130 (0.34) 0.139 (0.35) 0.151 (0.36)
Nº observations 2,707 280 2,427 611 2,096
Note: Standard deviations in parentheses.
Source: Our estimations using ECHP.

Measuring the impact of on the job training on job mobility
15
Table 2: SAMPLE MEANS. FIRED WORKERS
TOTAL T = 1 T = 0 M = 1 M = 0
Training 0.112 (0.31) – – 0.023 (0.15) 0.125 (0.33)Mobility 0.126 (0.33) 0.026 (0.16) 0.138 (0.35) – –
Gender and familyWomen 0.365 (0.48) 0.414 (0.49) 0.359 (0.48) 0.417 (0.49) 0.358 (0.48)Married 0.677 (0.47) 0.754 (0.43) 0.668 (0.47) 0.536 (0.50) 0.698 (0.46)Children 0.342 (0.47) 0.396 (0.49) 0.336 (0.47) 0.328 (0.47) 0.345 (0.48)
Age16 – 25 0.097 (0.30) 0.026 (0.16) 0.106 (0.31) 0.222 (0.42) 0.079 (0.27)26 – 35 0.324 (0.47) 0.287 (0.45) 0.328 (0.47) 0.397 (0.49) 0.313 (0.46)36 – 45 0.306 (0.46) 0.414 (0.49) 0.293 (0.46) 0.192 (0.39) 0.323 (0.47)46 – 60 0.273 (0.45) 0.273 (0.45) 0.273 (0.45) 0.189 (0.39) 0.285 (0.45)
EducationLess than upper secondary 0.449 (0.50) 0.176 (0.38) 0.483 (0.50) 0.619 (0.49) 0.424 (0.49)Upper secondary education 0.197 (0.40) 0.205 (0.40) 0.196 (0.40) 0.162 (0.37) 0.202 (0.40)Tertiary education 0.354 (0.48) 0.619 (0.49) 0.321 (0.47) 0.219 (0.41) 0.374 (0.48)
TenureUntil 3 years 0.420 (0.49) 0.179 (0.38) 0.451 (0.50) 0.834 (0.37) 0.361 (0.48)4 – 6 years 0.109 (0.31) 0.131 (0.34) 0.106 (0.31) 0.080 (0.27) 0.113 (0.32)7 or more years 0.471 (0.50) 0.690 (0.46) 0.443 (0.50) 0.086 (0.28) 0.526 (0.50)
ContractTemporary 0.247 (0.43) 0.090 (0.29) 0.267 (0.44) 0.682 (0.47) 0.185 (0.39)Part-time 0.043 (0.20) 0.011 (0.11) 0.047 (0.21) 0.056 (0.23) 0.042 (0.20)
Job statusSupervisory 0.081 (0.27) 0.153 (0.36) 0.072 (0.26) 0.023 (0.15) 0.089 (0.29)Intermediate 0.197 (0.40) 0.291 (0.46) 0.185 (0.39) 0.073 (0.26) 0.215 (0.41)Non-supervisory 0.722 (0.45) 0.556 (0.50) 0.743 (0.44) 0.904 (0.30) 0.696 (0.46)
SectorServices 0.631 (0.48) 0.784 (0.41) 0.612 (0.49) 0.523 (0.50) 0.646 (0.48)Public sector 0.259 (0.44) 0.422 (0.49) 0.238 (0.43) 0.182 (0.39) 0.270 (0.44)
SizeSmall 0.682 (0.47) 0.519 (0.50) 0.703 (0.46) 0.761 (0.43) 0.671 (0.47)Medium 0.166 (0.37) 0.246 (0.43) 0.156 (0.36) 0.146 (0.35) 0.169 (0.38)Large 0.152 (0.36) 0.235 (0.42) 0.141 (0.35) 0.093 (0.29) 0.160 (0.37)
InstrumentsTraining t-1 0.106 (0.31) 0.358 (0.48) 0.074 (0.26) 0.040 (0.20) 0.115 (0.32)Training t-2 0.126 (0.33) 0.328 (0.47) 0.100 (0.30) 0.043 (0.20) 0.138 (0.34)Second language 0.147 (0.35) 0.291(0.46) 0.129 (0.33) 0.119 (0.32) 0.151 (0.36)
Nº observations 2,398 268 2,130 302 2,096
Note: Standard deviations in parentheses.
Source: Our estimations using ECHP.

Revista de Economía Aplicada
16
Table 3: SAMPLE MEANS. VOLUNTARY EXITS
TOTAL T = 1 T = 0 M = 1 M = 0
Training 0.117 (0.32) – – 0.048 (0.21) 0.125 (0.33)Mobility 0.098 (0.30) 0.040 (0.20) 0.106 (0.31) – –
Gender and familyWomen 0.358 (0.48) 0.408 (0.49) 0.352 (0.48) 0.364 (0.48) 0.358 (0.48)Married 0.681 (0.47) 0.750 (0.43) 0.672 (0.47) 0.531 (0.50) 0.698 (0.46)Children 0.340 (0.47) 0.386 (0.49) 0.333 (0.47) 0.289 (0.45) 0.345 (0.48)
Age16 – 25 0.096 (0.29) 0.026 (0.16) 0.105 (0.31) 0.250 (0.43) 0.079 (0.27)26 – 35 0.321 (0.47) 0.279 (0.45) 0.327 (0.47) 0.399 (0.49) 0.313 (0.46)36 – 45 0.310 (0.46) 0.412 (0.49) 0.297 (0.46) 0.193 (0.40) 0.323 (0.47)46 – 60 0.273 (0.45) 0.283 (0.45) 0.271 (0.44) 0.158 (0.37) 0.285 (0.45)
EducationLess than upper secondary 0.435 (0.50) 0.177 (0.38) 0.469 (0.50) 0.531 (0.50) 0.424 (0.49)Upper secondary education 0.201 (0.40) 0.202 (0.40) 0.201 (0.40) 0.193 (0.40) 0.202 (0.40)Tertiary education 0.364 (0.48) 0.621 (0.49) 0.330 (0.47) 0.276 (0.45) 0.374 (0.48)
TenureUntil 3 years 0.399 (0.49) 0.184 (0.39) 0.428 (0.49) 0.754 (0.43) 0.361 (0.48)4 – 6 years 0.111 (0.31) 0.118 (0.32) 0.110 (0.31) 0.088 (0.28) 0.113 (0.32)7 or more years 0.490 (0.50) 0.698 (0.46) 0.462 (0.50) 0.158 (0.37) 0.526 (0.50)
ContractTemporary 0.220 (0.41) 0.092 (0.29) 0.237 (0.43) 0.548 (0.50) 0.185 (0.39)Part-time 0.045 (0.21) 0.015 (0.12) 0.049 (0.22) 0.075 (0.26) 0.042 (0.20)
Job statusSupervisory 0.087 (0.28) 0.158 (0.37) 0.078 (0.27) 0.062 (0.24) 0.089 (0.29)Intermediate 0.205 (0.40) 0.287 (0.45) 0.194 (0.40) 0.118 (0.32) 0.215 (0.41)Non-supervisory 0.708 (0.45) 0.555 (0.50) 0.728 (0.45) 0.820 (0.38) 0.696 (0.46)
SectorServices 0.636 (0.48) 0.756 (0.42) 0.618 (0.49) 0.544 (0.50) 0.646 (0.48)Public sector 0.256 (0.44) 0.415 (0.49) 0.235 (0.42) 0.136 (0.34) 0.270 (0.44)
SizeSmall 0.679 (0.47) 0.522 (0.50) 0.700 (0.46) 0.754 (0.43) 0.671 (0.47)Medium 0.168 (0.37) 0.243 (0.43) 0.158 (0.37) 0.158 (0.37) 0.169 (0.38)Large 0.153 (0.36) 0.235 (0.42) 0.142 (0.35) 0.088 (0.28) 0.160 (0.37)
InstrumentsTraining t-1 0.110 (0.31) 0.357 (0.48) 0.078 (0.27) 0.057 (0.23) 0.115 (0.32)Training t-2 0.128 (0.33) 0.324 (0.47) 0.102 (0.30) 0.035 (0.18) 0.138 (0.34)Second language 0.151 (0.36) 0.301 (0.46) 0.132 (0.34) 0.158 (0.37) 0.151 (0.36)
Nº observations 2,324 272 2,052 228 2,096
Note: Standard deviations in parentheses.
Source: Our estimations using ECHP.

With respect to the instruments used, and in particular to the second languageindicator, on the whole sample 14.8% of the individuals declare speaking a secondlanguage. As mentioned, we use this variable as an instrument in the estimation. There-fore, it should be desirable that it was correlated with the training but not with the mo-bility variable, once current training is taken into account. In this sense, if we com-pare the trained and non-trained sub-samples we can see that the percentage ofindividuals speaking a second language is higher among those who have receivedtraining (30.6% versus 13.0%). On the contrary, the percentage of individuals speak-ing a second language among employees who change their labour situation is quitesimilar to that for those who have not change it (13.9% versus 15.1%)12. As explained,with this instrument we try to capture certain aspects of the ability of the worker thatcould influence on the training probability. Finally, the sample means for the laggedvalues of the training variable, which complement the set of instruments, suggest ahigh persistence in this variable.
4. ESTIMATION RESULTS
In this section we report the estimates from the different models previously de-scribed. We present and compare two sets of estimates: one from the model that treatstraining as strictly exogenous and another one from the model that accounts for theendogeneity of training participation. We perform both set of estimates for the totalsample and for the sub-samples of fired workers and voluntary movers separately. Formodels in which endogeneity is accounted for, we cannot reject the null hypothesisρ1ε = ρ0ε, therefore we only report estimates imposing this restriction. In principle weallow all the parameters in the equation for M1 to differ from those in the equationfor M0 (α1 ≠ α0). Nonetheless, we do not obtain significant differences among them,except for the constant term, which measures the effect of training. For that reason,we only present the results for which only the constant differs in both equations.
The qualitative impact of the variables is discussed in terms of the sign and sta-tistical significance of the estimated coefficients. In order to assess the economic sig-nificance of the effects we also report predicted probabilities. Specifically, to eval-uate the effect of training participation on the exit probability, we calculate theaverage effect for all individuals. For each individual we compute
Measuring the impact of on the job training on job mobility
17
(12) The p-values associated with a test on the equality of means between groups are 0.000 for thetrained vs. non trained comparison and 0.476 for the “movers” vs. “stayers” comparison.
[6]
M E M x x
M E M x x
ˆ | ˆ , i 1, ..., N,
ˆ | ˆ , i 1, ..., N,
i i i i
i i i i
0 0 0
1 1 1
α
α
( ) ( )
( ) ( )
= = Φ =
= = Φ =
and
where N is the total number of individuals considered (the whole sample, or the sam-ple for fired workers and voluntary movers respectively). Then, the average effectof training participation is given by
Tables 4, 5, and 6 present maximum likelihood estimates for the three samplesconsidered. The results from the model that treats training participation as strictlyexogenous (Column 2) reproduce previous evidence based on simple correlation thatreceiving training reduces the probability of moving. Nonetheless, we only find thatthis effect is statistically significant for the whole sample and for the sample of firedworkers. For the sample of voluntary movers we do not find any significant corre-lation between training and mobility. The predicted probabilities, shown in Table 7,indicate that training participation reduces the probability of job turnover by ap-proximately 5.6 percentage points for those workers that have been fired. This ef-fect is consistent with the observation typically found in the literature that trainingparticipation is negatively correlated with job mobility, reflecting the fact that em-ployers wish to retain more highly trained workers, although our results only pointto a significant negative effect for the sample of fired workers.
However, at least part of this negative correlation could be due to an endoge-nous training participation effect. Column 4 in Tables 4, 5, and 6, and Table 7, showthat when endogeneity is accounted for, the effect of training participation becomesstatistically non-significant for all the samples considered. The contrast between thesetwo sets of estimates suggests that at least part of the negative relation between train-ing and job mobility is due to the effect of unobserved characteristics of the traineesthat are correlated with the unobserved variables that affect job mobility. In otherwords, once the possible spurious correlation is accounted for, we find that those whoacquire training are not more likely to leave the job13. This result is in line with Veum’s(1997), who find only limited evidence that company training reduces turnover.Therefore, we find evidence that the probability of mobility for trainees and non-trainees that does not account for the selection issue would be biased.
Regarding the rest of covariates, we obtain similar effects from exogenous andendogenous estimates. We find interesting to point out the differential effect of thevariables for gender, age, and education on the probability of receiving training andon the probability of being a voluntary mover. Tenure has also a negative effect onthe probability of leaving the firm, while the probability of receiving training is pos-itively related to job tenure. As pointed out by Vaum (1997) this positive relation-ship is inconsistent with the human capital model, which predicts that all trainingshould be concentrated at the start of the employment relationship. Nevertheless, itcould be the case that firms delay training until there is some certainty that the costof training can be recovered. Regarding the type of contract, those individuals witha fixed-term contract are less likely to be trained by the employer, and these indivi -duals are precisely the ones with a higher probability of job turnover, ceteris paribus.Individuals in the public and service sectors are more likely to receive training, butthere is no significant effect of these variables on the probability of moving jobs.Moreover, the size of the firm has a positive effect on training participation, althoughthis variable is not significant at explaining job mobility. Finally, family composi-tion is not significantly related to the acquisition of training.
Revista de Economía Aplicada
18
[7]N
M Mˆ1 ˆ ˆ .i i
i
N
1 01
∑π ( )= −=
(13) The estimates that do not include among the set of instruments the second language indicatorare very similar, although statistically less significant.

Measuring the impact of on the job training on job mobility
19
Table 4: ESTIMATED COEFFCIENTS. TOTAL SAMPLE
Training as exogenous Training as endogenous(ρ1ε = ρ10 = 0) (ρ1ε = ρ10)
(1) Training eq. (2) Mobility eq. (3) Training eq. (4) Mobility eq.
Coeff. t-ratio Coeff. t-ratio Coeff. t-ratio Coeff. t-ratio
Training -0.432 -3.27 -0.290 -0.58
Gender and familyWomen 0.034 0.41 0.074 1.12 0.032 0.40 0.073 1.07Married -0.022 -0.22 0.033 0.43 -0.022 -0.21 0.033 0.42Children 0.028 0.30 0.025 0.34 0.028 0.30 0.024 0.33
Age26 – 35 0.179 0.97 -0.186 -1.93 0.177 0.90 -0.187 -1.8936 – 45 0.266 1.35 -0.384 -3.46 0.261 1.24 -0.387 -3.4246 – 60 0.162 0.79 -0.240 -2.01 0.157 0.71 -0.241 -1.97
EducationUpper secondary education 0.272 2.45 -0.159 -1.90 0.270 2.39 -0.163 -1.89Tertiary education 0.487 4.90 -0.143 -1.85 0.487 4.90 -0.155 -1.80
Tenure4 – 6 years 0.349 2.56 -0.267 -2.61 0.354 2.39 -0.274 -2.657 or more years 0.358 3.17 -0.595 -6.91 0.363 3.00 -0.603 -6.44
ContractTemporary -0.164 -1.31 0.686 9.64 -0.164 -1.14 0.687 9.35Part-time -0.399 -1.65 0.021 0.16 -0.395 -1.60 0.028 0.21
Job statusIntermediate -0.169 -1.33 -0.257 -1.69 -0.173 -1.37 -0.250 -1.80Non-supervisory -0.255 -2.16 -0.016 -0.11 -0.260 -2.29 -0.007 -0.05
SectorServices 0.195 2.05 -0.045 -0.65 0.196 1.94 -0.047 -0.68Public sector 0.052 0.58 0.069 0.82 0.052 0.58 0.065 0.74
SizeMedium 0.287 3.02 0.012 0.14 0.284 2.85 0.007 0.08Large 0.173 1.75 -0.088 -0.88 0.171 1.71 -0.092 -0.89
InstrumentsTraining in t-1 0.684 7.28 – – 0.683 7.41 – –Training in t-2 0.417 4.49 – – 0.412 4.56 – –Second language 0.262 2.86 – – 0.267 2.86 – –
Constant -2.214 -9.69 -0.414 -2.36 -2.209 -9.53 -0.422 -2.55
Correlation coefficient – -0.078(t-ratio) (-0.31)
Log-likelihood -1,916.14 -1,916.07Nº observations 2,707 2,707
Source: Our estimations using ECHP.

Revista de Economía Aplicada
20
Table 5: ESTIMATED COEFFCIENTS FOR FIRED WORKERS
Training as exogenous Training as endogenous(ρ1ε = ρ10 = 0) (ρ1ε = ρ10)
(1) Training eq. (2) Mobility eq. (3) Training eq. (4) Mobility eq.
Coeff. t-ratio Coeff. t-ratio Coeff. t-ratio Coeff. t-ratio
Training -0.411 -1.61 -0.487 -0.72
Gender and familyWomen 0.040 0.48 0.163 1.91 0.041 0.49 0.163 1.82Married -0.026 -0.25 -0.048 -0.50 -0.026 -0.24 -0.047 -0.46Children 0.033 0.34 0.061 0.65 0.032 0.32 0.061 0.64
Age26 – 35 0.151 0.74 -0.081 -0.67 0.152 0.71 -0.080 -0.6636 – 45 0.235 1.10 -0.280 -1.99 0.236 1.05 -0.278 -1.9446 – 60 0.103 0.46 -0.012 -0.08 0.105 0.45 -0.011 -0.07
EducationUpper secondary education 0.278 2.44 -0.241 -2.16 0.279 2.41 -0.238 -2.01Tertiary education 0.480 4.67 -0.293 -2.69 0.480 4.66 -0.286 -2.35
Tenure4 – 6 years 0.358 2.53 -0.224 -1.73 0.355 2.28 -0.220 -1.657 or more years 0.349 2.96 -0.769 -6.38 0.346 2.69 -0.765 -5.42
ContractTemporary -0.197 -1.48 0.799 8.87 -0.198 -1.28 0.797 8.55Part-time -0.498 -1.80 -0.231 -1.32 -0.497 -1.79 -0.234 -1.28
Job statusIntermediate -0.160 -1.21 -0.118 -0.45 -0.160 -1.21 -0.121 -0.57Non-supervisory -0.263 -2.13 0.229 0.91 -0.262 -2.18 0.224 1.09
SectorServices 0.207 2.09 -0.052 -0.58 0.205 1.95 -0.051 -0.55Public sector 0.064 0.70 0.081 0.73 0.065 0.70 0.083 0.70
SizeMedium 0.308 3.14 0.087 0.79 0.308 3.00 0.089 0.78Large 0.173 1.69 -0.031 -0.24 0.173 1.68 -0.030 -0.21
InstrumentsTraining in t-1 0.732 7.54 – – 0.733 7.72 – –Training in t-2 0.393 4.11 – – 0.393 4.22 – –Second language 0.212 2.17 – – 0.212 2.15 – –
Constant -2.152 -8.88 -1.145 -3.44 -2.152 -8.83 -1.141 -4.71
Correlation coefficient – 0.042(t-ratio) (0.12)
Log-likelihood -1,373.42 -1,373.41Nº observations 2,398 2,398
Source: Our estimations using ECHP.

Measuring the impact of on the job training on job mobility
21
Table 6: ESTIMATED COEFFCIENTS FOR VOLUNTARY EXITS
Training as exogenous Training as endogenous(ρ1ε = ρ10 = 0) (ρ1ε = ρ10)
(1) Training eq. (2) Mobility eq. (3) Training eq. (4) Mobility eq.
Coeff. t-ratio Coeff. t-ratio Coeff. t-ratio Coeff. t-ratio
Training -0.183 -1.16 -0.352 -0.55
Gender and familyWomen 0.029 0.35 0.008 0.10 0.031 0.38 0.009 0.10Married -0.033 -0.34 0.037 0.36 -0.032 -0.30 0.036 0.35Children 0.018 0.19 -0.048 -0.49 0.017 0.18 -0.046 -0.46
Age26 – 35 0.206 1.03 -0.238 -1.94 0.207 0.98 -0.235 -1.8536 – 45 0.295 1.41 -0.419 -2.91 0.297 1.33 -0.412 -2.7346 – 60 0.191 0.88 -0.363 -2.31 0.190 0.81 -0.361 -2.20
EducationUpper secondary education 0.263 2.31 -0.041 -0.38 0.263 2.27 -0.035 -0.31Tertiary education 0.480 4.70 -0.088 -0.88 0.480 4.63 -0.072 -0.62
Tenure4 – 6 years 0.289 2.02 -0.257 -1.94 0.288 1.82 -0.249 -1.817 or more years 0.342 2.96 -0.547 -4.84 0.338 2.67 -0.534 -3.99
ContractTemporary -0.101 -0.76 0.518 5.62 -0.099 -0.65 0.516 5.38Part-time -0.374 -1.50 0.089 0.52 -0.380 -1.45 0.079 0.43
Job statusIntermediate -0.153 -1.18 -0.316 -1.83 -0.151 -1.16 -0.325 -1.80Non-supervisory -0.232 -1.92 -0.136 -0.89 -0.229 -1.94 -0.148 -0.90
SectorServices 0.189 1.94 -0.064 -0.71 0.191 1.86 -0.060 -0.65Public sector 0.043 0.47 -0.084 -0.72 0.043 0.46 -0.080 -0.64
SizeMedium 0.280 2.86 0.081 0.74 0.283 2.75 0.089 0.75Large 0.143 1.41 0.040 0.30 0.143 1.40 0.045 0.30
InstrumentsTraining in t-1 0.723 7.51 – – 0.722 7.68 – –Training in t-2 0.406 4.26 – – 0.413 4.45 – –Second language 0.278 2.89 – – 0.272 2.80 – –
Constant -2.191 -9.10 -0.730 -3.66 -2.194 -9.07 -0.721 -3.40
Correlation coefficient – 0.097(t-ratio) (0.28)
Log-likelihood -1,330.27 -1,330.21Nº observations 2,324 2,324
Source: Our estimations using ECHP.

5. CONCLUDING REMARKS
Understanding the relationship between on the job training and job turnover iscrucial for developing appropriate human resources policies aimed at increasing theskills of employees. A common finding in this literature is that training reducesturnover. However, most of the empirical research on the effect of employer-providedtraining on subsequent job mobility doesn’t take into account that firms provide train-ing selectively, in the sense that employers offer training courses to those workersthey wish to retain.
In this paper we argue that at least part of the negative relation between train-ing and job mobility could be due to the characteristics of trained employees insteadto a true causal effect of training on turnover. In statistical terms we argue that train-ing could be an endogenous variable in a job mobility equation and not a strictly ex-ogenous one. We have shown the importance of this question by the estimation ofdifferent models. Specifically, we present and compare two sets of estimates: onefrom a model that treats training as exogenous and another one from a model thataccounts for the endogeneity of training participation.
The main conclusion that emerges from our analysis is that there is a negativeeffect of training participation on job mobility when the endogeneity problem is notaccounted for, although it seems important to distinguish between the reasons whythe worker leaves the firm. Specifically, for those workers who abandon voluntarilythe firm, we do not find a statistically significant correlation between on the job train-ing and job mobility. Only for the sub-sample of fired workers there is a statisticallysignificant negative correlation between the two variables. Nonetheless, once we ac-count for the possible self-selection of the trainees, the negative effect of training onjob mobility disappears in all cases, and becomes statistically non-significant.
Our results that do not account neither for the endogeneity of training nor for thedistinction between voluntary or involuntary exits, are in line with Parent (2003), Dear-den et al. (1996), Loewenstein and Spletzer (1999), or Elias (1994). Nonetheless, insome of the previous works, the estimated effect is not significant [i.e. Loewensteinand Spletzer (1999)], or it is significant only for women [i.e. Elias (1994) or Lynch
Revista de Economía Aplicada
22
Table 7: AVERAGE ESTIMATED EFFECT OF TRAINING ON THE PROBABILITY OF JOB EXIT
Training as exogenous Training as endogenous
Total sample π̂ (t-ratio) -0.095 -0.066(-3.78) (-0.63)
Fired workers π̂ (t-ratio) -0.056 -0.065(-1.96) (-0.89)
Voluntary exits π̂ (t-ratio) -0.025 -0.045(-1.27) (-0.66)
Source: Our estimations using ECHP.

(1991)]. Our results on the lack of significance of the effect of training when self-se-lection is accounted for is in line with Veum (1997), although our results are nor di-rectly comparable, since he estimates a duration model and only find a significant ef-fect for highly educated workers with more than one year of tenure. Our estimates thataccount for the type of exit are in line with Sieben (2007), who uses the search be-havior as an indicator for the voluntary exits.
The complexity in the link between on the job training and job mobility sug-gests that one should be cautious when moving from the results to policy implica-tions. According to our results, it seems crucial to take into account the potential en-dogeneity between these two variables, otherwise one could attribute to training aneffect which is due to other unobserved characteristics of the workers and, therefore,propose misleading policy recommendations.
Our results should be complemented by further analyses. First, we have onlyconsidered binary indicators of training and mobility and analyze the impact of re-ceiving training on the probability of moving. Nonetheless, it could be the case thatit is the accumulation of training, rather than just a recent episode that affects jobturnover. Moreover, another measure of job mobility that could be considered is thenumber of jobs an individual has held at any point in time.
REFERENCESAcemoglu, D. and Pischke, J. (1998): “Why do firms train? Theory and evidence”, Quarterly
Journal of Economics, vol. 113, pp. 79-119.Altonji, J. and Shakotko, R. (1987): “Do wages rise with job seniority?”, Review of Economic
Studies, vol. 54, pp. 437-459.Arulampalam, W., Booth, A. and Bryan, M. (2010): “Are there asymmetries in the effects of
training on the Conditional Male Wage Distribution?”, Journal of Population Econom-ics, vol. 23, pp. 251-272.
Bartel, A. (1995): “Training, wage growth and job performance: evidence from a companydatabase”, Journal of Labor Economics, vol. 13, pp. 401-425.
Becker, G. (1964): Human capital: a theoretical and empirical analysis with special refer-ence to education, Columbia University Press for National Bureau of Economic Research.New York.
Bishop, J. (1997): “What we know about employer-provided training: a review of the litera-ture”, Research in Labor Economics, vol. 16, pp. 19-87.
Card, D. and Sullivan, D. (1988): “Measuring the effect of subsidized training programs onmovements in and out of employment”, Econometrica, vol. 56, pp. 497-530.
Carrasco, R. (2001): “Binary choice with binary endogenous regressors in panel data: esti-mating the effect of fertility on female labour participation”, Journal of Business and Eco-nomics Statistics, vol. 19, pp. 385-394.
De Grip, A., Heijke, H. and Willems, E. (1998): “Training and mobility”, The Netherlands’Journal of Social Sciences, vol. 34, pp. 78-98.
Dearden, L., Machin, S., Reed, H. and Wilkinson, D. (1996): Labour turnover and work-re-lated training, Report to the Department for Education and Employment. London.
Elias, P. (1994): “Job-related training, training union membership and labour mobility: a lon-gitudinal study”, Oxford Economic Papers, vol. 46, pp. 563-578.
Measuring the impact of on the job training on job mobility
23
EA

Green, F., Felstead, A., Mayhew, K. and Pack, A. (2000): “The impact of training on labourmobility: individual and firm-level evidence from Britain”, British Journal of IndustrialRelations, vol. 38, pp. 261-275.
Greenhalgh, C. and Stewart, M. (1987): “The effects and determinants of training”, OxfordBulletin of Economics and Statistics, vol. 49, pp. 171-190.
Groot, W. and Maassen van den Brink, H. (2000): “Education, training and employability”,Applied Economics, vol. 32, pp. 573-581.
Korpi, T. and Mertens, A. (2003): “Training systems and labor mobility: A comparison be-tween Germany and Sweden”, Scandinavian Journal of Economics, vol. 105, pp. 597-617.
Katz, E. and Ziderman, A. (1990): “Investment in general training: the role of information andlabour mobility”, Economic Journal, vol. 100, pp. 1147-1158.
Lynch, L. (1991): “The role of off-the-job vs. on-the-job training for the mobility of individualworkers”, American Economic Review, vol. 81, pp. 151-156.
Loewenstein, M. and Spletzer, J. (1999): “General and specific training. Evidence and im-plications”, The Journal of Human Resources, vol. 34, pp. 710-733.
Manski, C. (1990): “Nonparametric Bounds on Treatment Effects”, American Economic Re-view Papers and Proceedings, vol. 80, pp. 319-323.
Manski, C., Sandefur, G., McLanahan, S. and Powers, D. (1992): “Alternative estimates ofthe effect of family structure during adolescence on high school graduation”, Journal ofthe American Statistical Association, vol. 87, pp. 25-37.
Mincer, J. and Jovanovic, B. (1981): Labour mobility and wages, Studies in Labour Markets.University of Chicago Press, Chicago.
Parent, D. (1999): “Wages and mobility: The impact of employer-provided training”, Jour-nal of Labor Economics, vol. 17, pp. 298-317.
Parent, D. (2003): “Employer-supported training in Canada and its impact on mobility andwages”, Empirical Economics, vol. 28, pp. 431-459.
Sieben, I. (2007): “Does training trigger turnover or not? The impact of formal training onyoung men’s and women’s job search behavior”, Work, Employment & Society, vol. 21,pp. 397-416.
Sieben, I. and de Grip, A. (2004): “Training and expectations on job mobility in the call cen-tres sector”, Journal of European Industrial Training, vol. 28, pp. 257-271.
Stevens, M. (1994): “A theoretical model of on-the-job training with imperfect competition”,Oxford Economic Papers, vol. 46, pp. 537-562.
Veum, J. (1997): “Training and job mobility among young workers in the United States”, Jour-nal of Population Economics, vol. 10, pp. 219-233.
Zweimüller, J. and Winter-Ebmer, R. (2003): “On-the-job Training, Job Search, and Job Mo-bility”, Swiss Journal of Economics and Statistics, vol 139, pp. 563-576.
Fecha de recepción del original: mayo, 2013Versión final: enero, 2015
Revista de Economía Aplicada
24

RESUMENEste trabajo estudia el efecto de la formación ofrecida por el empleador so-bre la probabilidad de abandonar la empresa. Típicamente, la evidencia em-pírica muestra que la probabilidad de recibir formación en la empresa es ma-yor entre aquellos trabajadores con menor probabilidad esperada de salir deella. Por lo tanto, parece que las empresas ofrecen formación selectivamente.En este trabajo se analiza empíricamente en qué medida este problema deendogeneidad produce una correlación espuria entre formación y movilidadlaboral. Usando datos españoles del European Community Household Pa-nel, se presentan estimaciones que ignoran este sesgo de selección y se com-paran con los resultados obtenidos cuando dicho sesgo es tenido en cuenta.En general, los resultados muestran una correlación negativa entre forma-ción y movilidad laboral, aunque sólo para los trabajadores despedidos, nopara los que abandonan la empresa de manera voluntaria. Sin embargo, unavez que se tiene en cuenta el problema de endogeneidad, el efecto negativodeja de ser significativo en todos los casos.Palabras clave: formación en el trabajo, rotación laboral, movilidad la-boral.Clasificación JEL: M53.
Measuring the impact of on the job training on job mobility
25

Related Documents