Measurement of Pressure Distribution, Drag, Lift , and Velocity for an Airfoil Purpose Test design Measurement system and Procedures Uncertainty Analysis

Purpose Test design Measurement system and Procedures Uncertainty Analysis.
Dec 31, 2015
Welcome message from author
This document is posted to help you gain knowledge. Please leave a comment to let me know what you think about it! Share it to your friends and learn new things together.
Transcript

Measurement of Pressure Distribution, Drag, Lift , and Velocity for an Airfoil
Measurement of Pressure Distribution, Drag, Lift , and Velocity for an Airfoil
PurposeTest designMeasurement system and ProceduresUncertainty Analysis
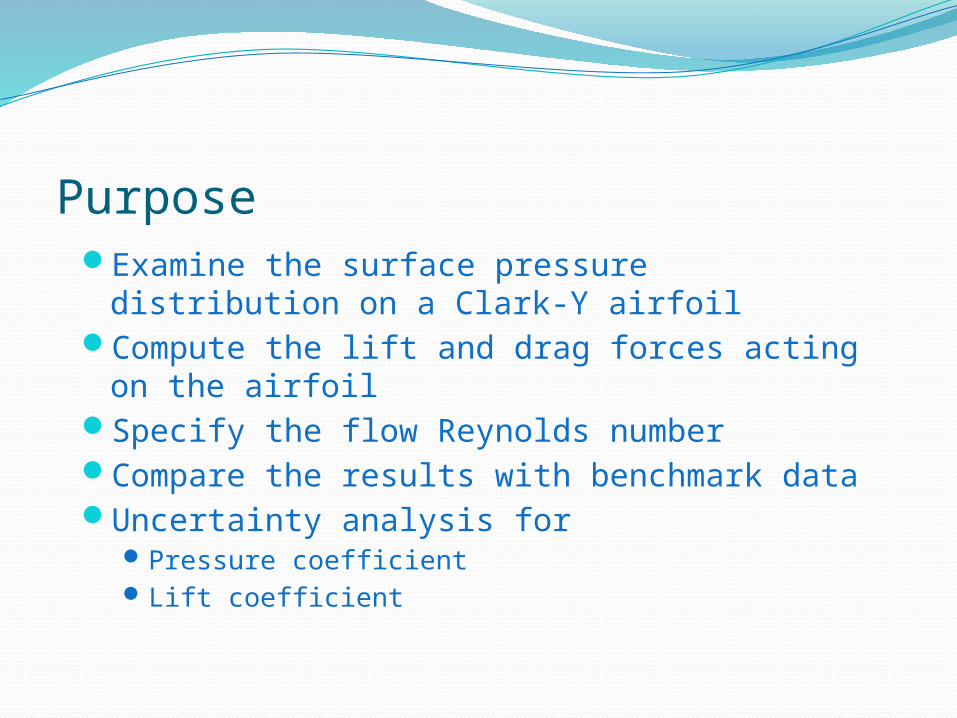
PurposeExamine the surface pressure distribution on a
Clark-Y airfoilCompute the lift and drag forces acting on the
airfoilSpecify the flow Reynolds numberCompare the results with benchmark dataUncertainty analysis for
Pressure coefficientLift coefficient
Test Design
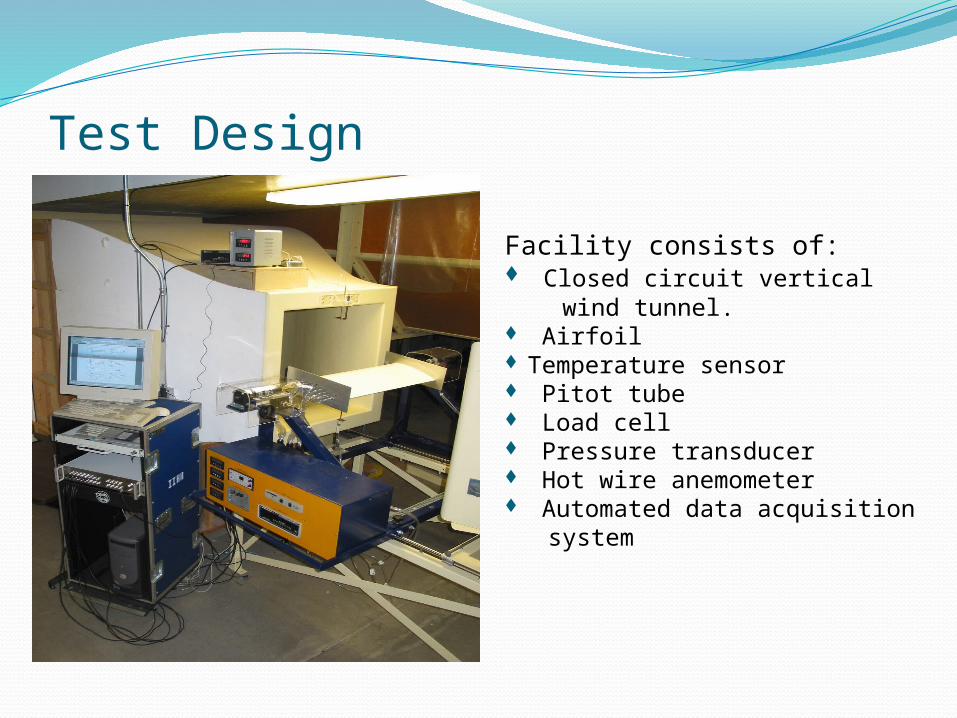
Facility consists of: Closed circuit vertical wind tunnel. Airfoil Temperature sensor Pitot tube Load cell Pressure transducer Hot wire anemometer Automated data acquisition system
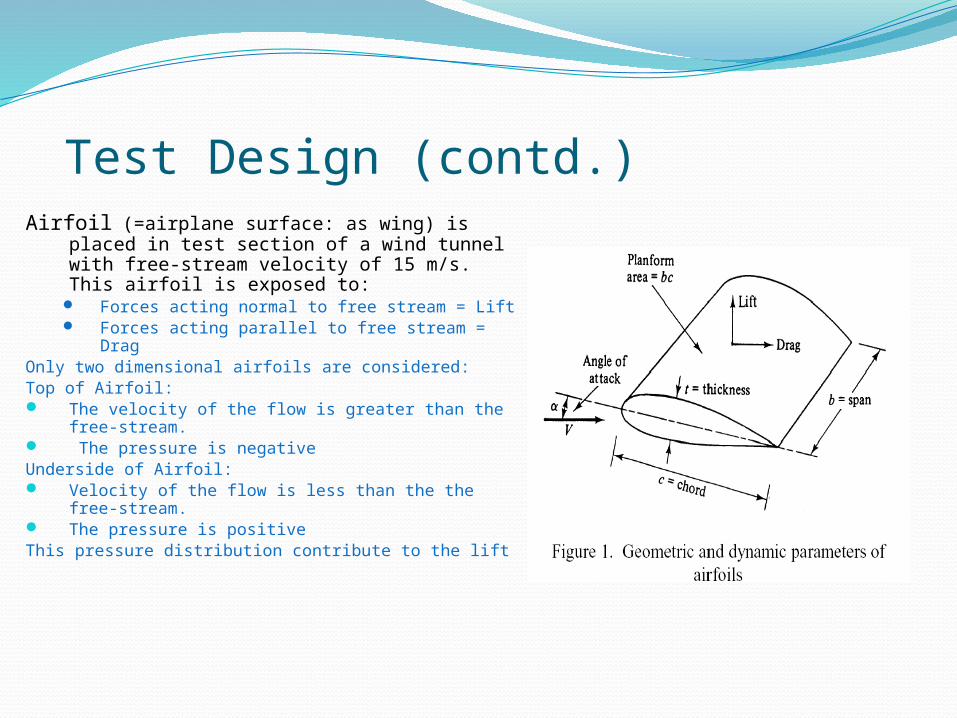
Test Design (contd.)Airfoil (=airplane surface: as wing) is placed
in test section of a wind tunnel with free-stream velocity of 15 m/s. This airfoil is exposed to: Forces acting normal to free stream = Lift Forces acting parallel to free stream =
Drag Only two dimensional airfoils are considered:Top of Airfoil: The velocity of the flow is greater than the
free-stream. The pressure is negativeUnderside of Airfoil: Velocity of the flow is less than the the free-
stream. The pressure is positiveThis pressure distribution contribute to the lift
Measurement systems
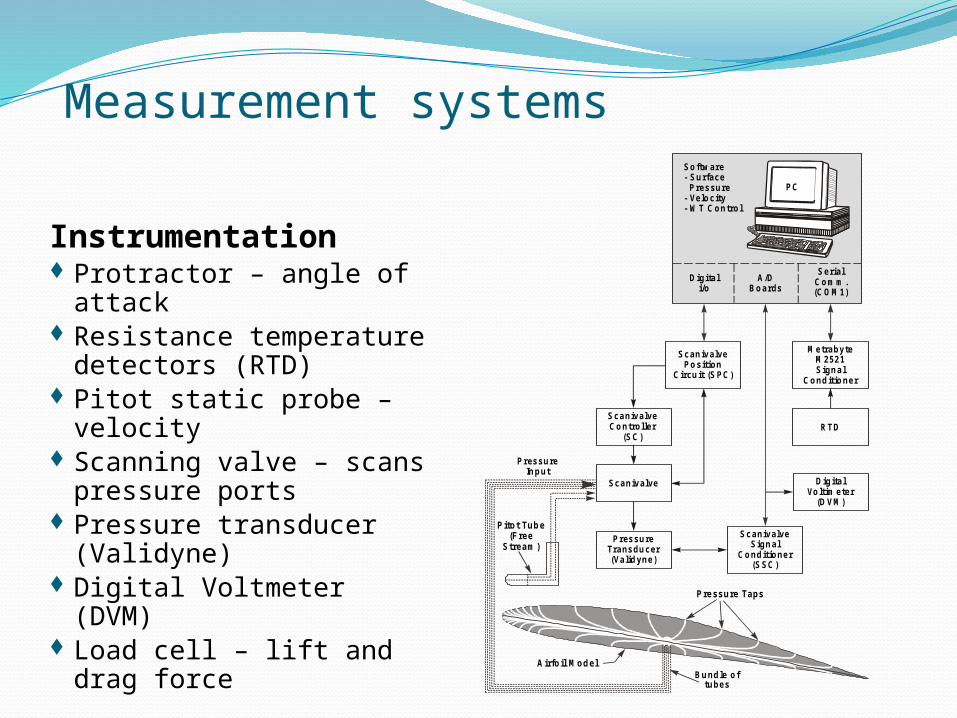
Instrumentation Protractor – angle of attack Resistance temperature detectors
(RTD) Pitot static probe – velocity Scanning valve – scans pressure
ports Pressure transducer (Validyne) Digital Voltmeter (DVM) Load cell – lift and drag force
Airfoil Model
Pitot Tube(Free
Stream)
Pressure Taps
Bundle o ftubes
Digita li/o
A/DBoards
SerialCom m .(C O M 1)
Softw are- Surface Pressure- Velocity- W T C ontro l
PC
ScanivalvePosition
Circu it (S PC)
RTD
M etrabyteM 2521Signal
Cond itioner
ScanivalveSignal
Cond itioner(S SC)
ScanivalveController
(S C)
Scanivalve
PressureTransducer(Validyne)
Digita lVo ltim eter
(D VM )
PressureInput
Measurement systemsMeasurement systems
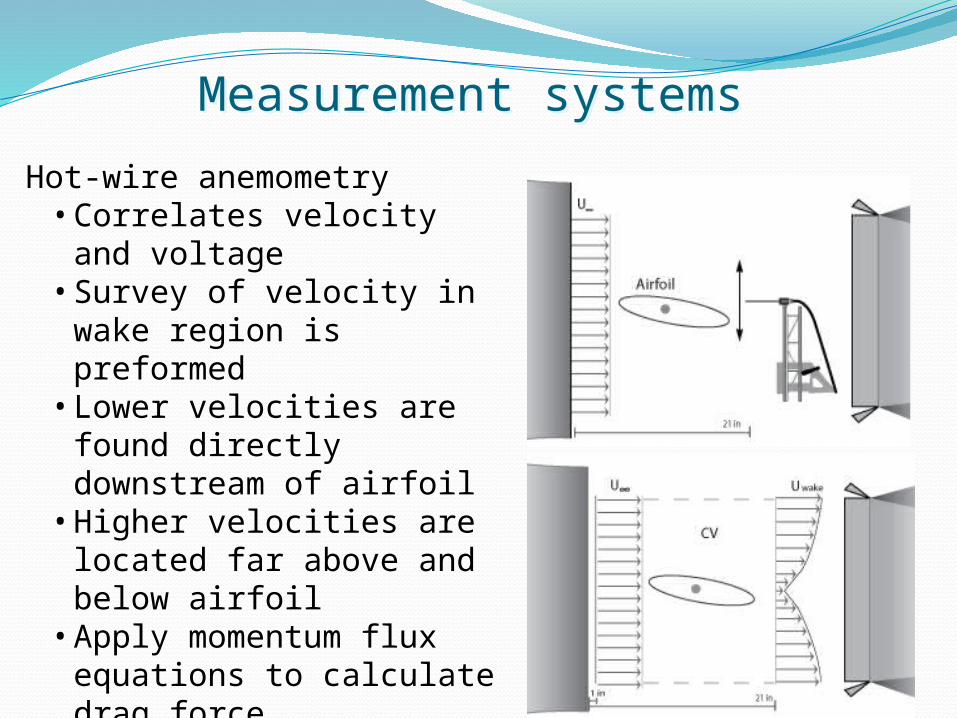
Hot-wire anemometry• Correlates velocity and voltage• Survey of velocity in wake
region is preformed• Lower velocities are found
directly downstream of airfoil• Higher velocities are located far
above and below airfoil• Apply momentum flux equations
to calculate drag force

AOA, and Pressure taps positions

Data reduction
In this experiment, the lift force, L on the Airfoil will be determined by integration of the measured pressure distribution over the Airfoil’s surface. The figure shows a typical pressure distribution on an Airfoil and its projection .

Data reduction
Calculation of lift and drag forces The lift force L is determined by integration of the
measured pressure distribution over the airfoil’s surface.
It is expressed in a dimensionless form by the pressure coefficient Cp where, pi = surface pressure measured, = P pressure in the free-stream
The lift force is also measured using the load cell and data acquisition system directly.
U = free-stream velocity, r = air density ( temperature),
pstagnation = stagnation pressure measured at the tip of the pitot tube, L = Lift force, b = airfoil span, c = airfoil chord
cU
dspp
C sL
2
21
sin
2
21
U
ppC ip
ppU stagnation2
bcU
LCL 2
2
dsppLs
sin
bcU
DcbUDCD 2
2,,,,
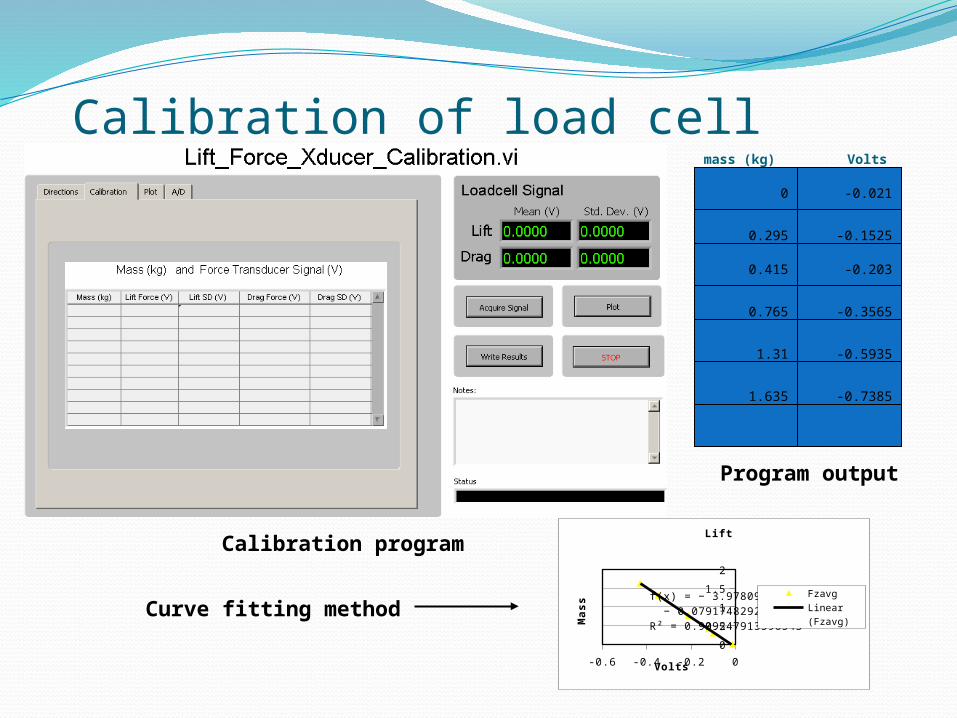
Calibration of load cell
-0.5 -0.4 -0.3 -0.2 -0.1 0
0
0.5
1
1.5
2
f(x) = − 3.97809750155233 x − 0.0791748292766911R² = 0.999247913596543
Lift
Fzavg
Linear (Fzavg)
Volts
Ma
ss
mass (kg) Volts
0 -0.021
0.295 -0.1525
0.415 -0.203
0.765 -0.3565
1.31 -0.5935
1.635 -0.7385
Calibration program
Program output
Curve fitting method

Data acquisition
Setting up the initial motor speed Visualization of wind tunnel conditions

Data acquisition (contd.)
Data needed: Observation point list Sampling Rate Settling Time Length of each Sample Angle of attack
Airfoil pressure visualization

Calculation of lift force
Program to measure lift force in volts
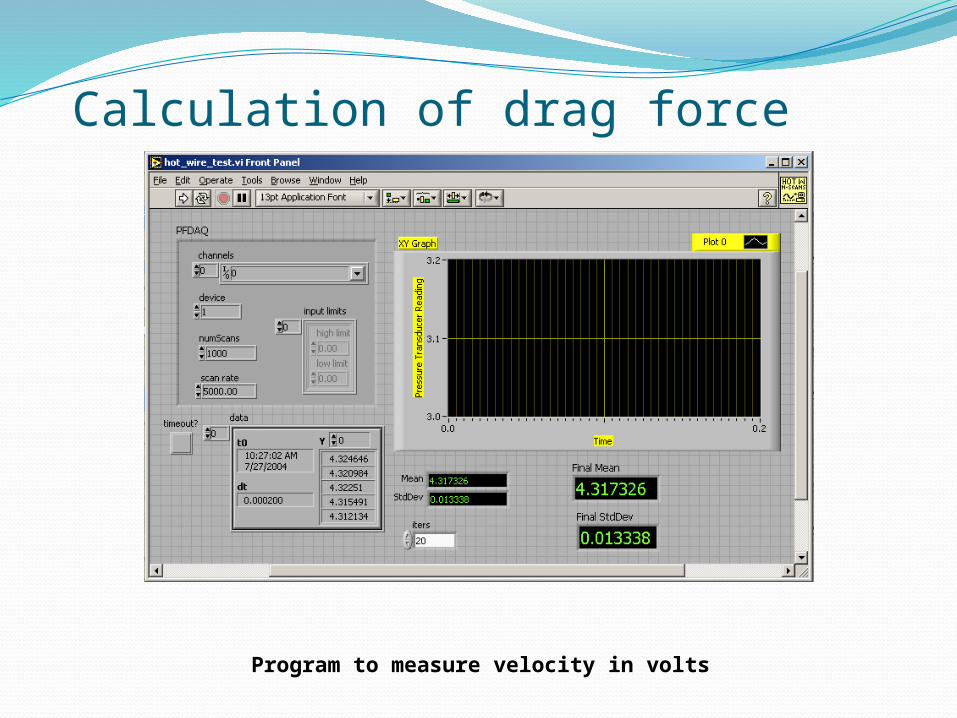
Calculation of drag force
Program to measure velocity in volts

Uncertainty analysis

Uncertainty analysisPressure coefficient Lift coefficient
),,( UppfC ip
222CpCpCp PBU
2)(
2)(
2
1
22
ppippii
j
iiCp BBB
2_
2
Upp
C
i
pppi
MSP CpCp 2
),,,,( cUppfC iil
222CLCLCL PBU
2)(
2)(
2
1
22
ppippii
j
iiCL BBB
MSP CLCL 2
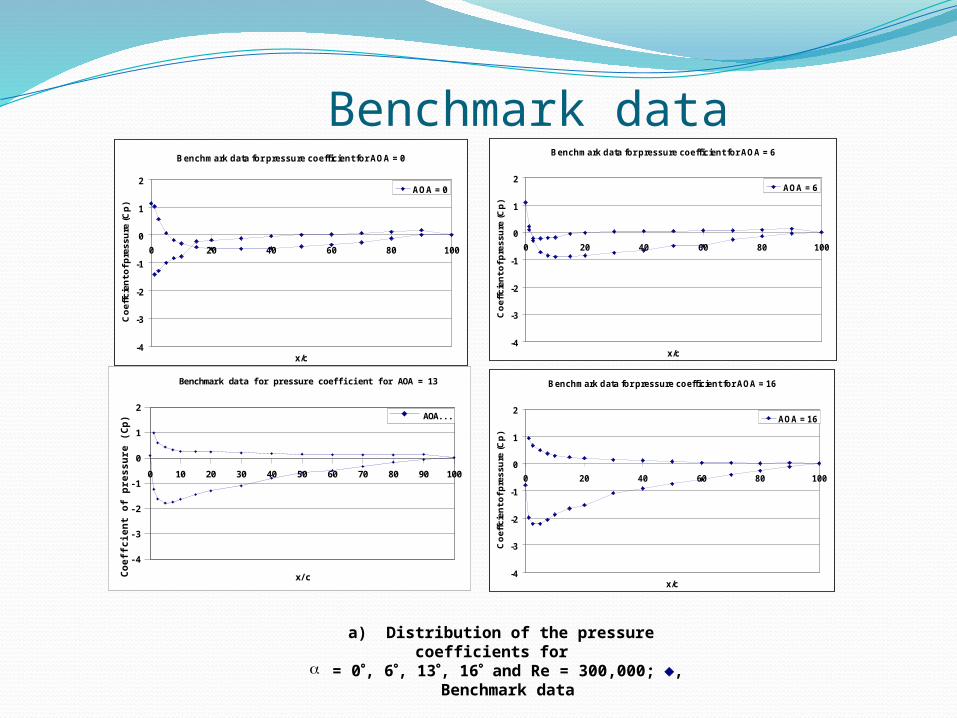
Benchmark data
0 10 20 30 40 50 60 70 80 90 100
-4
-3
-2
-1
0
1
2
Benchmark data for pressure coefficient for AOA = 13
AOA ...
x/c
Co
eff
cie
nt
of
pre
ss
ure
(C
p)
a) Distribution of the pressure coefficients for a = 0, 6, 13, 16 and Re = 300,000; , Benchmark data
Benchmark data for pressure coefficient for AOA = 0
-4
-3
-2
-1
0
1
2
0 20 40 60 80 100
x/c
Co
eff
cie
nt
of
pre
ss
ure
(C
p)
AOA = 0
Benchmark data for pressure coefficient for AOA = 6
-4
-3
-2
-1
0
1
2
0 20 40 60 80 100
x/c
Co
eff
cie
nt
of
pre
ss
ure
(C
p)
AOA = 6
Benchmark data for pressure coefficient for AOA = 16
-4
-3
-2
-1
0
1
2
0 20 40 60 80 100
x/c
Co
effc
ien
t of p
ress
ure
(Cp
)
AOA = 16
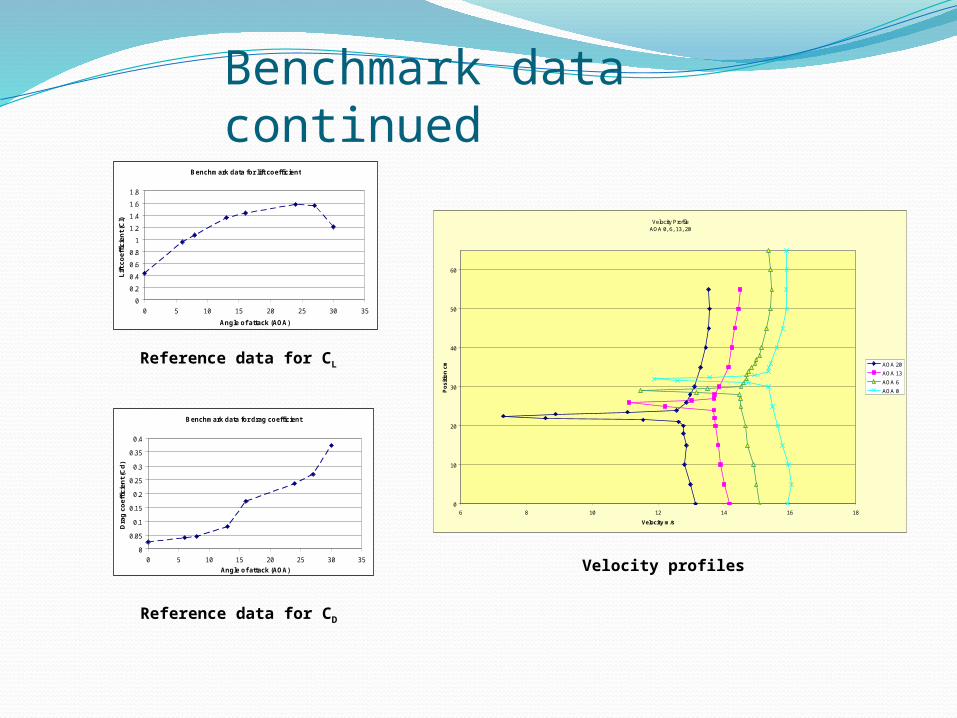
Benchmark data continued
Reference data for CL
Reference data for CD
Benchmark data for lift coefficient
0
0.2
0.4
0.6
0.8
1
1.2
1.4
1.6
1.8
0 5 10 15 20 25 30 35
Angle of attack (AOA)
Lif
t c
oe
ffic
ien
t (C
l)
Benchmark data for drag coefficient
0
0.05
0.1
0.15
0.2
0.25
0.3
0.35
0.4
0 5 10 15 20 25 30 35
Angle of attack (AOA)
Dra
g c
oef
ficie
nt (
Cd
)
Velocity ProfileAOA 0, 6, 13, 20
0
10
20
30
40
50
60
6 8 10 12 14 16 18
Velocity m/s
Po
siti
on
cm AOA 20
AOA 13
AOA 6
AOA 0
Velocity profiles
Related Documents