Setting the Stage Setting the Stage • Oil shortage • Greenhouse Effect

Welcome message from author
This document is posted to help you gain knowledge. Please leave a comment to let me know what you think about it! Share it to your friends and learn new things together.
Transcript
Setting the StageSetting the Stage
• Oil shortage• Greenhouse Effect
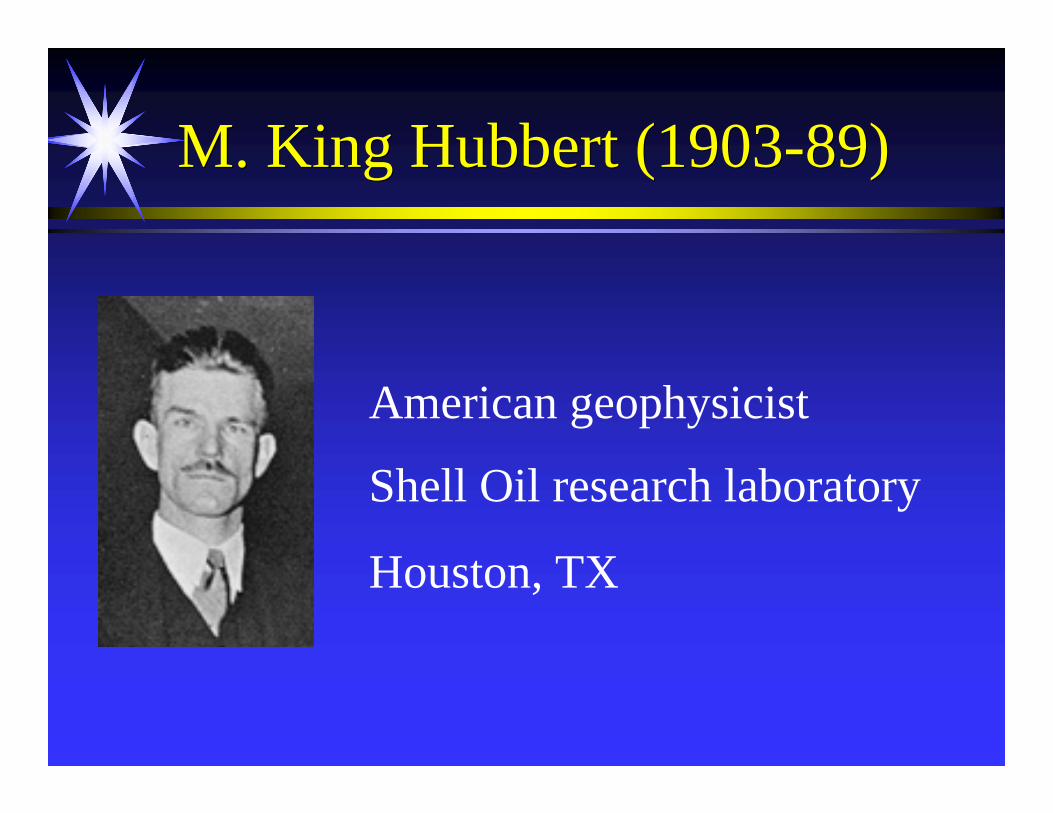
M. King Hubbert (1903-89)M. King Hubbert (1903-89)
American geophysicist
Shell Oil research laboratory
Houston, TX
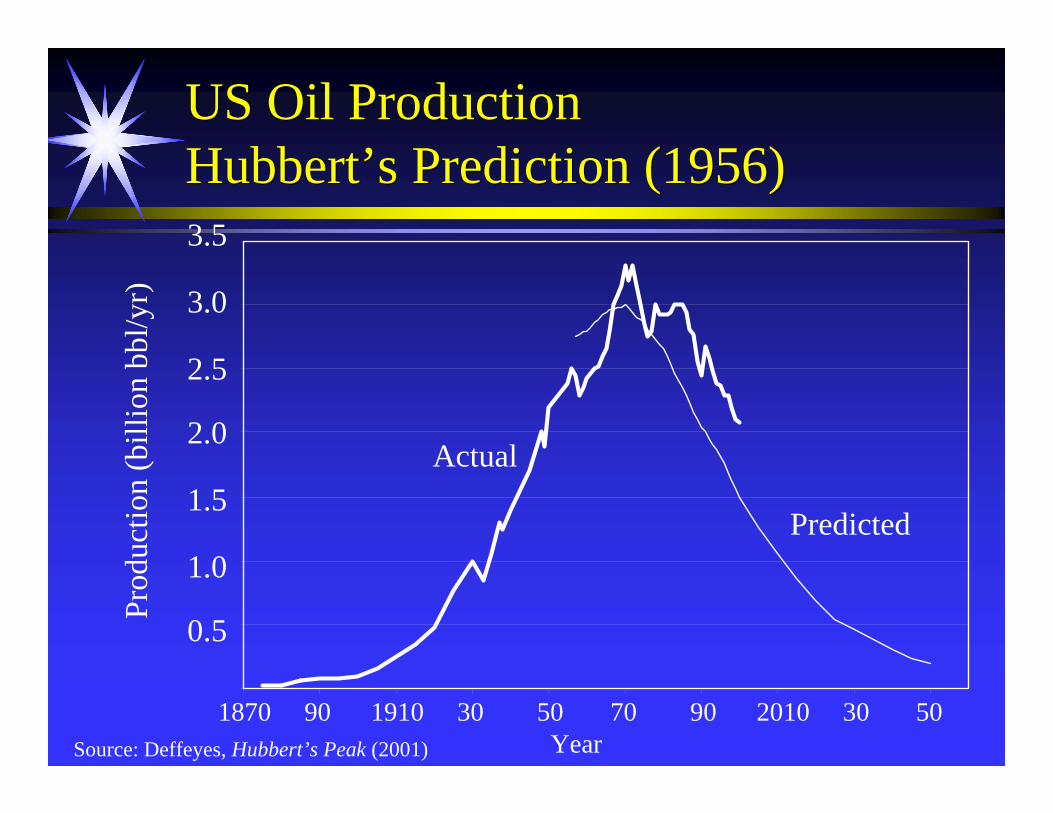
US Oil ProductionHubbert’s Prediction (1956)US Oil ProductionHubbert’s Prediction (1956)
1870 90 1910 30 50 70 90 2010 30 50Year
3.5
3.0
2.5
2.0
1.5
1.0
0.5
Prod
uctio
n (b
illio
n bb
l/yr)
Predicted
Actual
Source: Deffeyes, Hubbert’s Peak (2001)

World Oil ProductionDeffeyes Prediction (2001)World Oil ProductionDeffeyes Prediction (2001)
35
30
25
20
15
10
5Prod
uctio
n (b
illio
n bb
l/yr)
1860 80 1900 20 40 60 80 2000 20 40 60YearSource: Deffeyes, Hubbert’s Peak (2001)
Where will we get our energy?Where will we get our energy?
Study by Shell Group Planning
Georges Dupont-RocAlexon KhorChris Anastasi
The Evolution of the World’s Energy Systems
1996


• Oil shortage• Greenhouse Effect
Setting the StageSetting the Stage
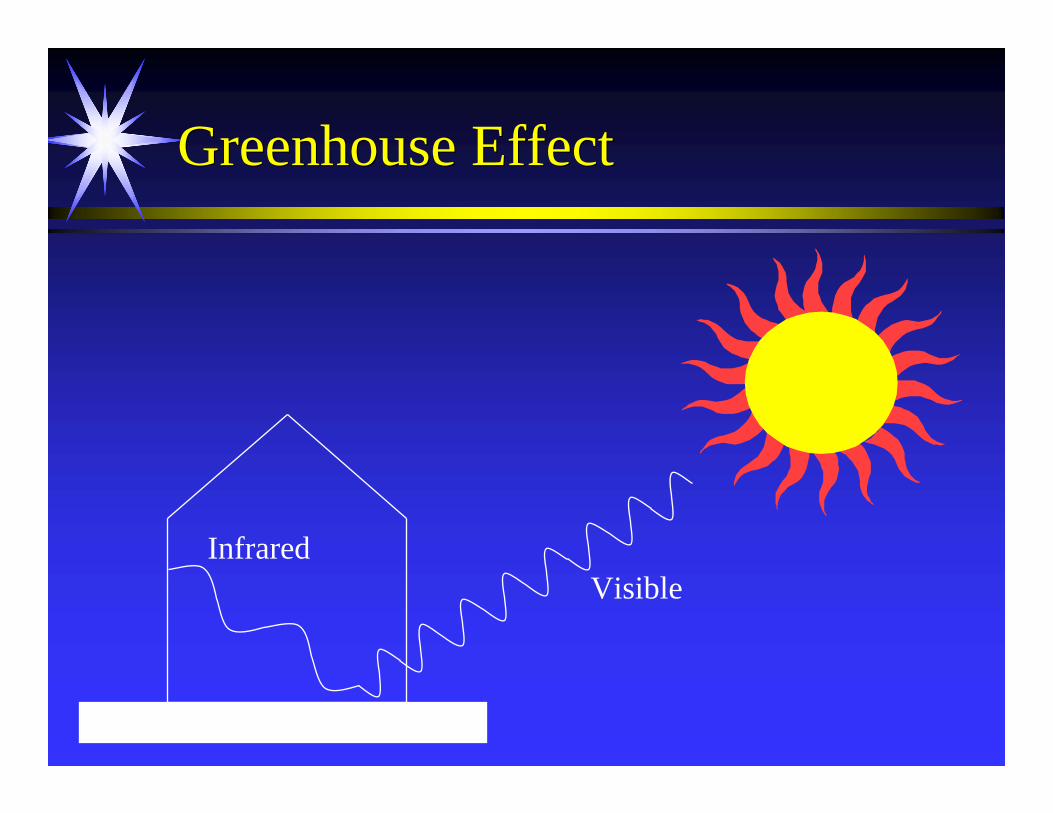
Greenhouse EffectGreenhouse Effect
VisibleInfrared

Greenhouse GasesGreenhouse Gases
Visible
Greenhouse Gases• CH4• CFC• NOx• CO2
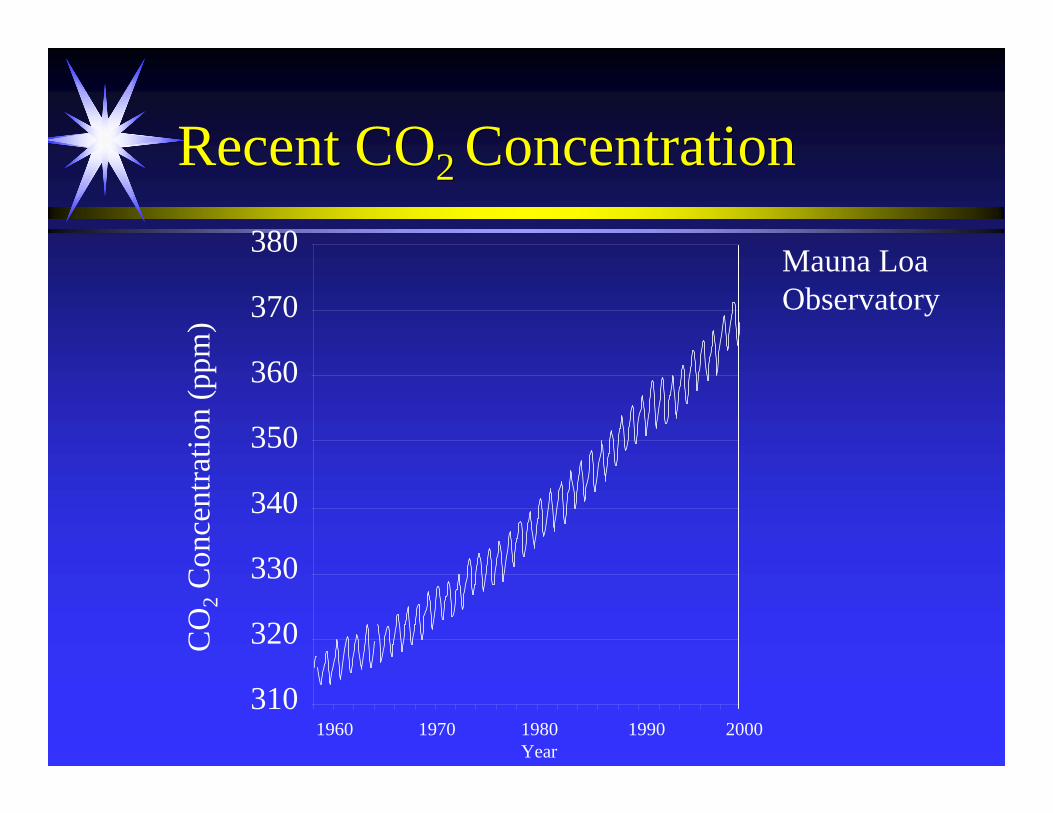
Recent CO2 ConcentrationRecent CO2 Concentration380
370
360
350
340
330
320
310
CO
2C
once
ntra
tion
(ppm
)
1960 1970 1980 1990 2000Year
Mauna Loa Observatory

Historical CO2 ConcentrationHistorical CO2 Concentration
380360340320300280260240220200180
160 140 120 100 80 60 40 20 0 Time Before Present (1000 years)C
arbo
n D
ioxi
de C
once
ntra
tion
(ppm
)

1086420-2-4-6-8-10
160 140 120 100 80 60 40 20 0 Time Before Present (1000 years) Te
mpe
ratu
re C
hang
e fr
om P
rese
nt (o C
)
Temperature ChangeTemperature Change
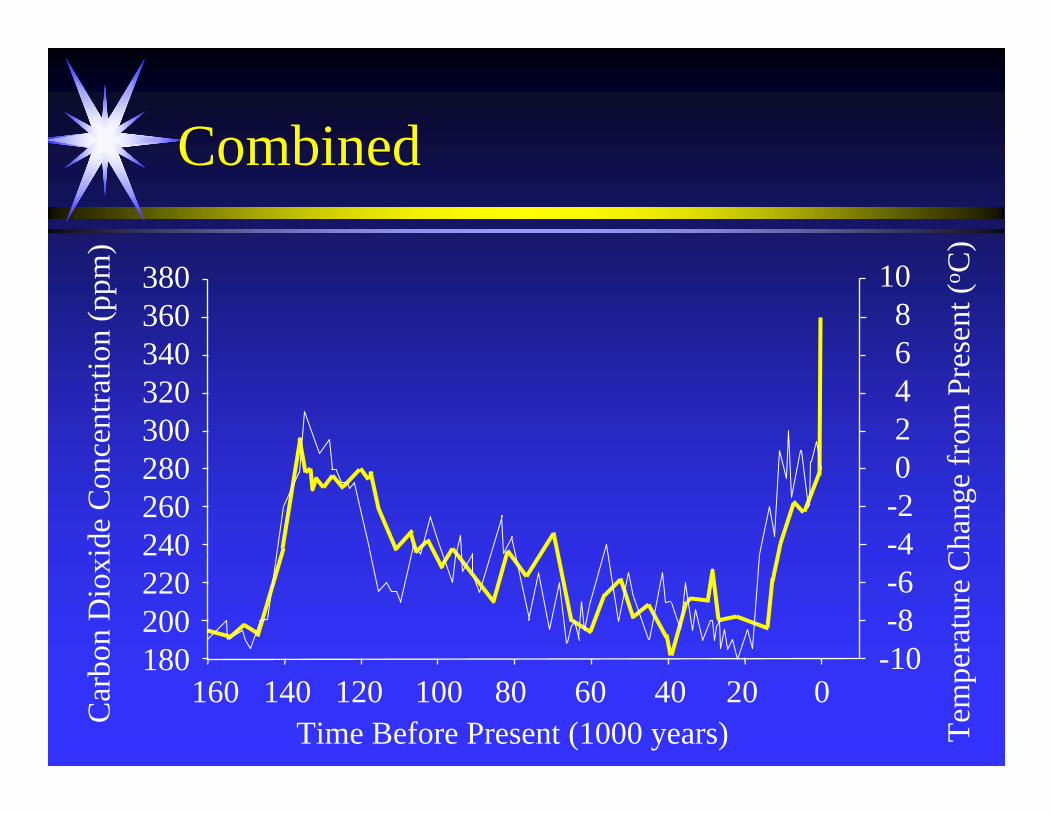
CombinedCombined
380360340320300280260240220200180
1086420-2-4-6-8-10
160 140 120 100 80 60 40 20 0 Time Before Present (1000 years)C
arbo
n D
ioxi
de C
once
ntra
tion
(ppm
)
Tem
pera
ture
Cha
nge
from
Pre
sent
(o C)

CorrelationCorrelation
Hypothesis Independent Dependent
1 Temp CO2
2 CO2 Temp
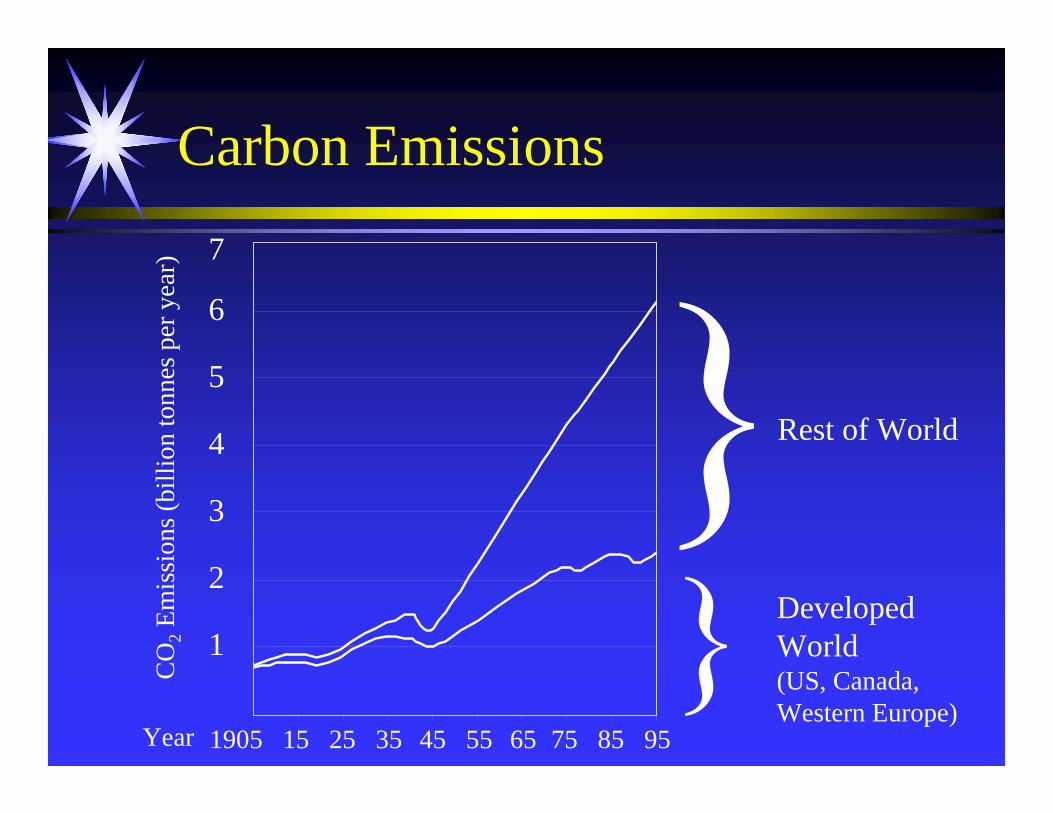
Carbon Emissions Carbon Emissions
1905 15 25 35 45 55 65 75 85 95
7
6
5
4
3
2
1
CO
2Em
issi
ons (
billi
on to
nnes
per y
ear)
DevelopedWorld(US, Canada, Western Europe)
Rest of World
Year

Recent CorrelationRecent Correlation
1860 80 1900 20 40 60 80 2000 Year
385
365
345
325
305
285
265 CO
2C
once
ntra
tion
(ppm
)
14.7
14.5
14.3
14.1
13.9
13.7
13.5
Ave
rage
Glo
bal T
empe
ratu
re (o C
)
Temp
CO2
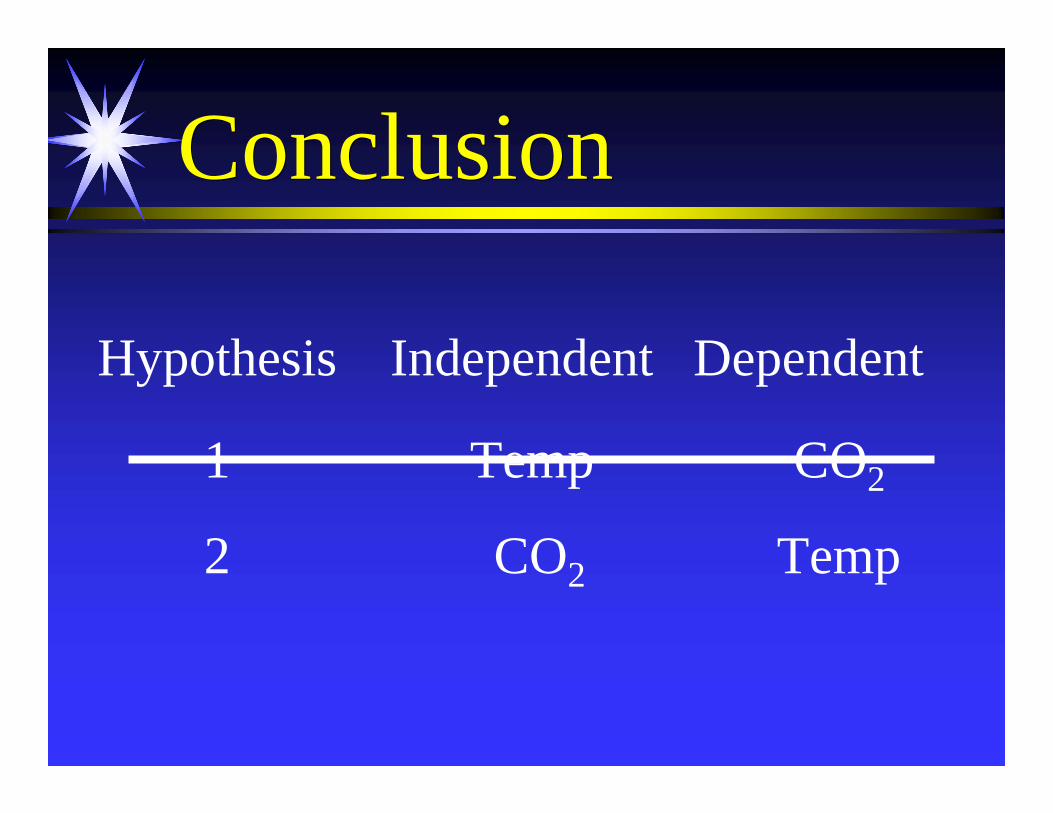
ConclusionConclusion
Hypothesis Independent Dependent
1 Temp CO2
2 CO2 Temp
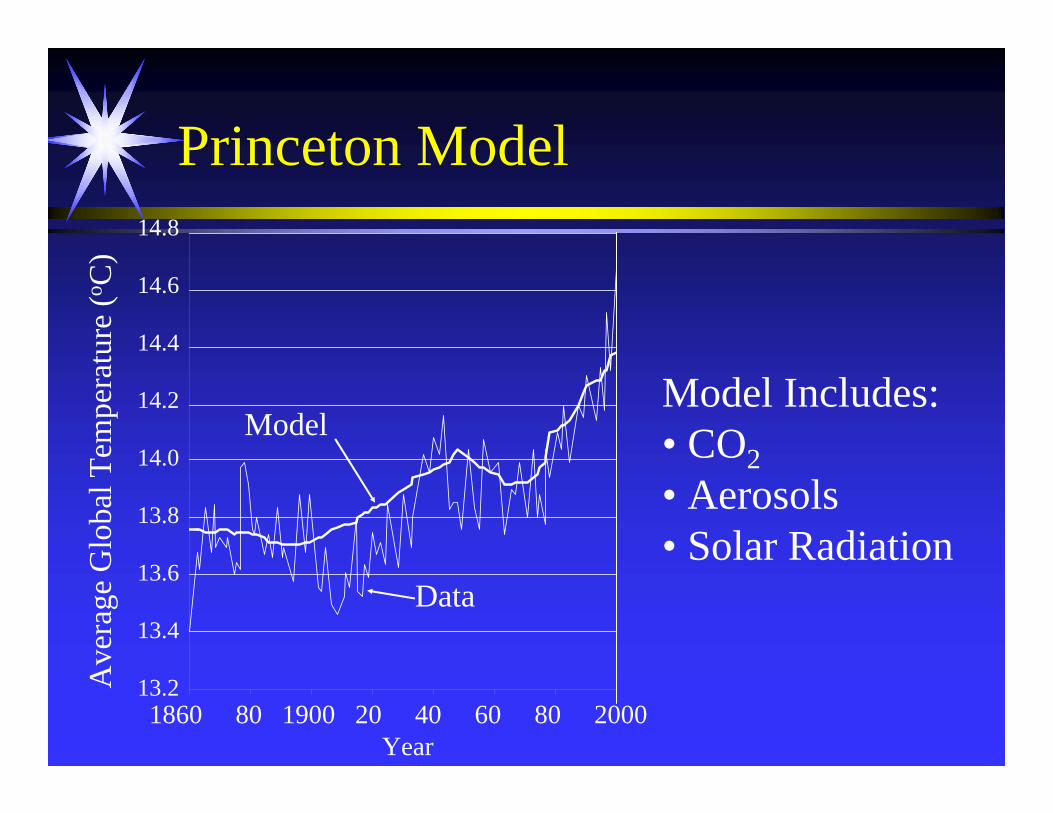
Princeton ModelPrinceton Model14.8
14.6
14.4
14.2
14.0
13.8
13.6
13.4
13.2Ave
rage
Glo
bal T
empe
ratu
re (o C
)
1860 80 1900 20 40 60 80 2000 Year
Model
Data
Model Includes:• CO2• Aerosols• Solar Radiation

Potential Negative EffectsPotential Negative Effects
• rapid extinctions• tropical diseases moving north• Grain Belt becomes Dust Belt• more insects• rising ocean levels• increased heat-related deaths• Gulf Stream shuts down, chilling Europe• increased storms/floods/hurricanes• droughts and floods more common• more forest fires due to drought• weakened coral reefs

Exacerbating EffectsExacerbating Effects
• extended thaw in tundra• polar ice caps melt• methane clathrates melt
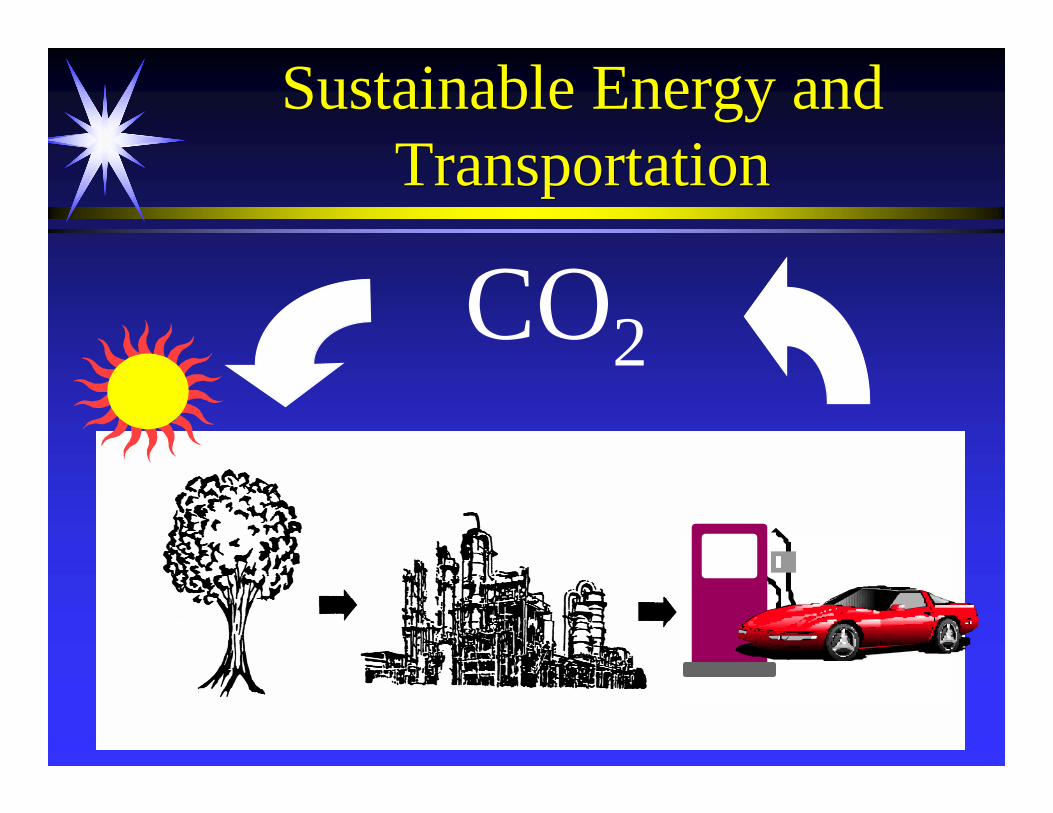
Sustainable Energy and Transportation
Sustainable Energy and Transportation
CO2
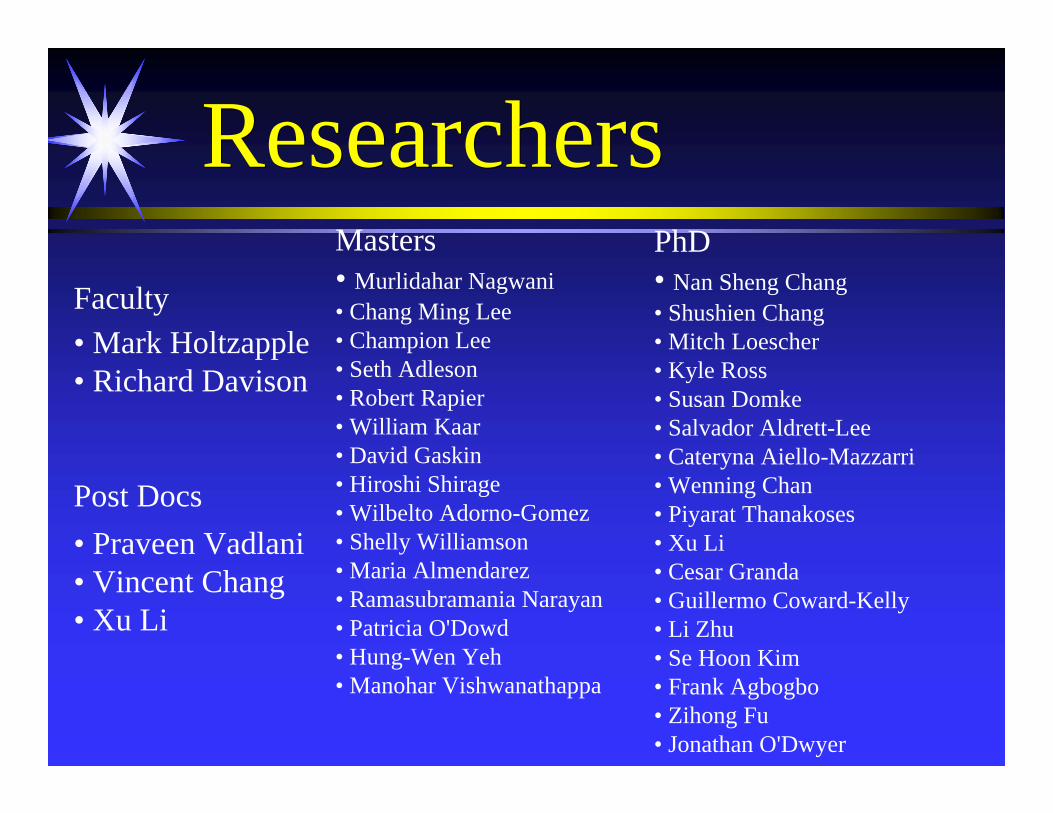
ResearchersResearchersFaculty• Mark Holtzapple• Richard Davison
Post Docs• Praveen Vadlani• Vincent Chang• Xu Li
Masters• Murlidahar Nagwani• Chang Ming Lee• Champion Lee • Seth Adleson• Robert Rapier• William Kaar• David Gaskin• Hiroshi Shirage• Wilbelto Adorno-Gomez• Shelly Williamson• Maria Almendarez• Ramasubramania Narayan• Patricia O'Dowd• Hung-Wen Yeh• Manohar Vishwanathappa
PhD• Nan Sheng Chang • Shushien Chang • Mitch Loescher• Kyle Ross• Susan Domke• Salvador Aldrett-Lee• Cateryna Aiello-Mazzarri• Wenning Chan• Piyarat Thanakoses• Xu Li• Cesar Granda• Guillermo Coward-Kelly• Li Zhu• Se Hoon Kim• Frank Agbogbo• Zihong Fu• Jonathan O'Dwyer

Research StatisticsResearch Statistics
• Year started = early 1991• Time spent = 12 years • Labor = ~107 person·years• Total funding = $2.1 mill
You can’t have it all!You can’t have it all!
CheapGoodFast
UniversityIndustry

Examples of BiomassExamples of Biomass
•• treestrees•• grassgrass•• agricultural residuesagricultural residues•• energy cropsenergy crops
Most of these are Most of these are ““lignocelluloselignocellulose..””
FuelsChemicals
•• municipal solid wastemunicipal solid waste•• sewage sludgesewage sludge•• animal manureanimal manure
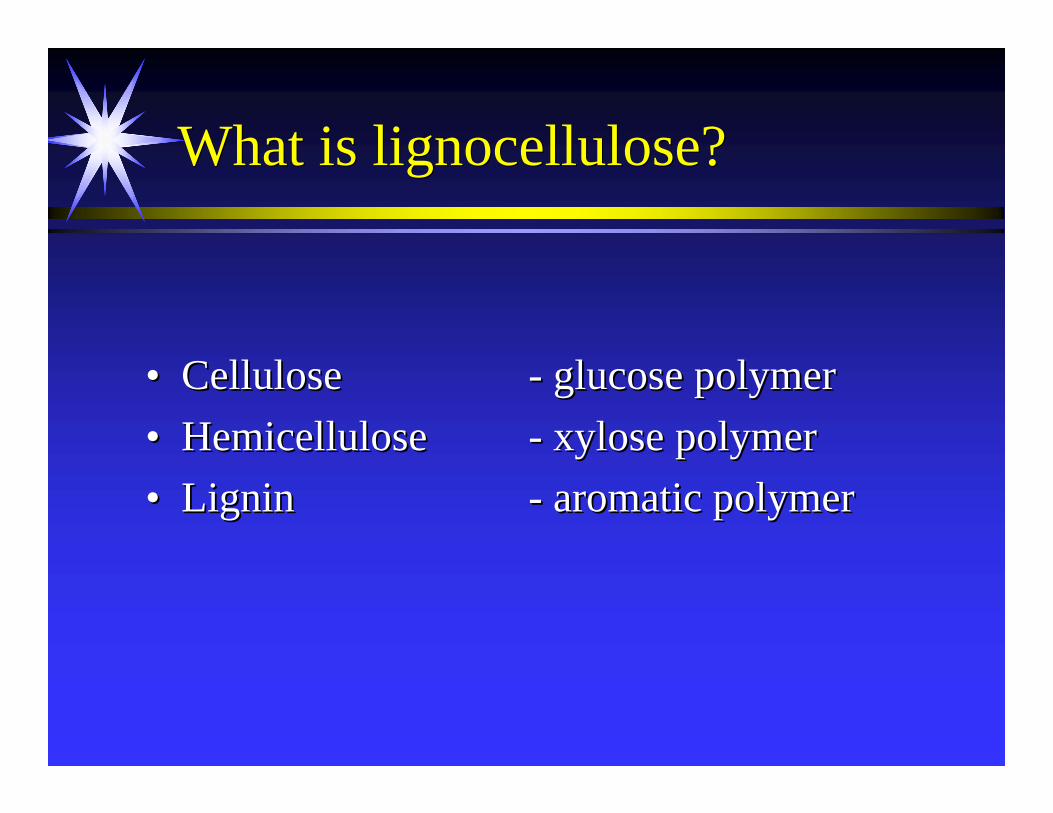
What is lignocellulose?What is lignocellulose?
•• CelluloseCellulose -- glucose polymerglucose polymer•• HemicelluloseHemicellulose -- xylosexylose polymerpolymer•• LigninLignin -- aromatic polymeraromatic polymer

787810.910.9
334.34.3
400400330330220220
U.S. Biodegradable Wastes
Municipal Solid WasteMunicipal Solid WasteSewage SludgeSewage SludgeIndustrial Industrial BiosludgeBiosludgeRecycled Paper FinesRecycled Paper FinesAgricultural ResiduesAgricultural ResiduesForestry ResiduesForestry ResiduesManureManure
AmountAmount(million (million tonnetonne/year)/year)
Alcohol PotentialAlcohol PotentialWasteWaste (billion gal/year)
10101.41.40.40.40.50.5
525243432828
TotalTotal 1,0461,046 135135U.S. Gasoline Consumption = 130 billion gal/yearU.S. Gasoline Consumption = 130 billion gal/yearU.S. Diesel Consumption = 40 billion gal/yearU.S. Diesel Consumption = 40 billion gal/year
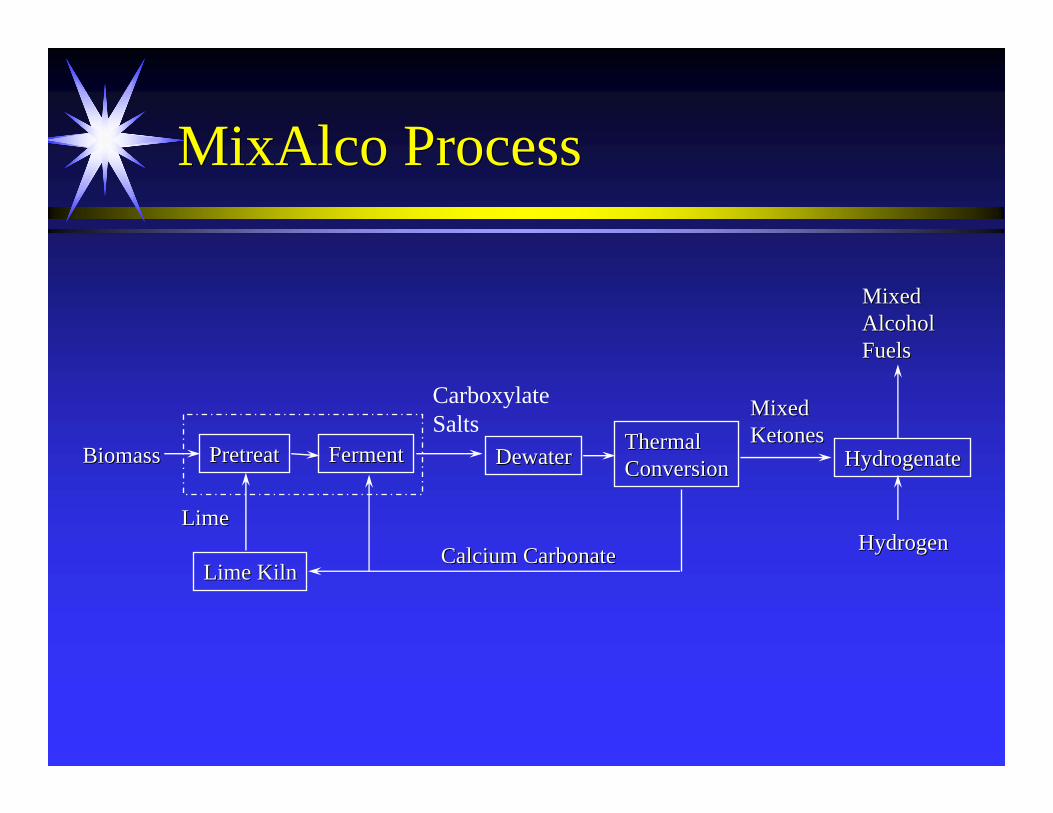
MixAlco ProcessMixAlco Process
HydrogenHydrogen
BiomassBiomass
Lime KilnLime Kiln
MixedMixedAlcoholAlcoholFuelsFuels
HydrogenateHydrogenate
MixedMixedKetonesKetonesThermalThermal
ConversionConversionDewaterDewaterFermentFermentPretreatPretreat
Calcium CarbonateCalcium CarbonateLimeLime
CarboxylateSalts

PatentsPatents
5,986,1335,969,1896,262,313
5,962,3075,874,263
5,865,8985,693,296
6,043,3926,395,926
HydrogenHydrogen
BiomassBiomass
Lime KilnLime Kiln
MixedMixedAlcoholAlcoholFuelsFuels
HydrogenateHydrogenate
MixedMixedKetonesKetonesThermalThermal
ConversionConversionDewaterDewaterFermentFermentPretreatPretreat
Calcium CarbonateCalcium CarbonateLimeLime

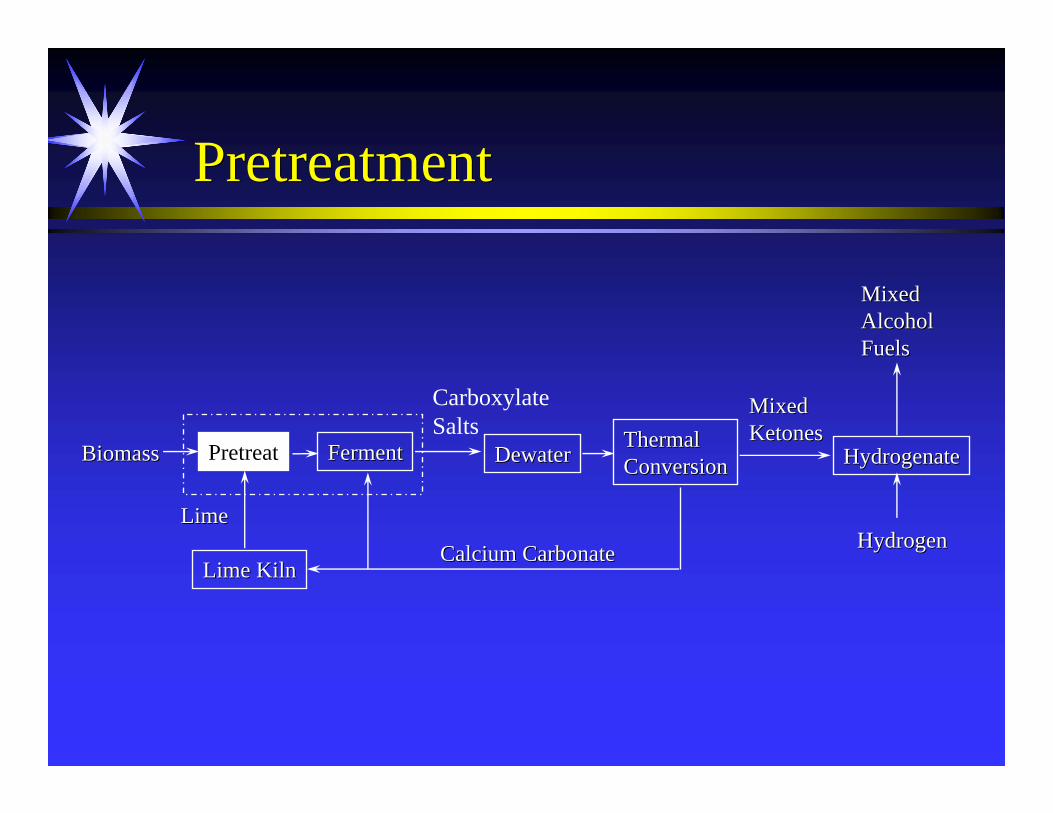
PretreatmentPretreatment
FermentFerment DewaterDewaterPretreat ThermalThermalConversionConversion HydrogenateHydrogenate
Lime KilnLime Kiln
MixedMixedAlcoholAlcoholFuelsFuels
MixedMixedKetonesKetones
BiomassBiomass
HydrogenHydrogenCalcium CarbonateCalcium CarbonateLimeLime
CarboxylateSalts
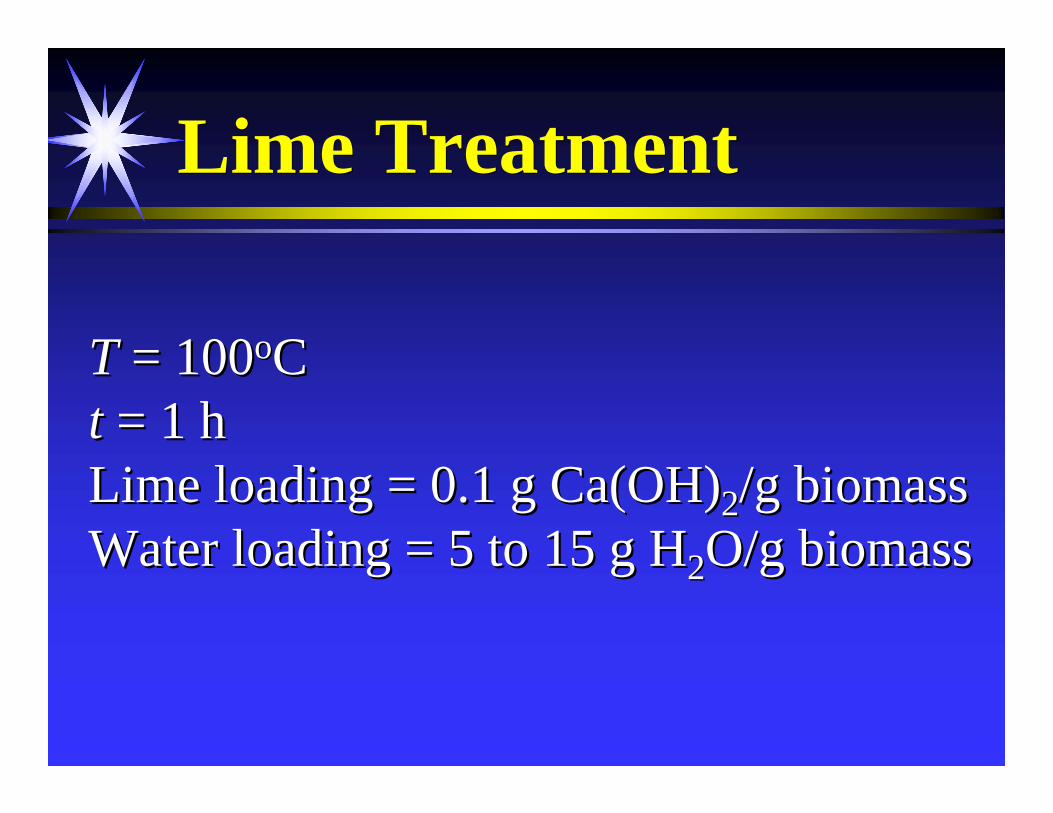
Lime TreatmentLime Treatment
TT = 100= 100ooCCtt = 1 h= 1 hLime loading = 0.1 g Ca(OH)Lime loading = 0.1 g Ca(OH)22/g biomass/g biomassWater loading = 5 to 15 g HWater loading = 5 to 15 g H22O/g biomassO/g biomass

In situ DigestionIn situ Digestion
•• Weigh ~ 2 g of biomassWeigh ~ 2 g of biomass•• Place biomass in Place biomass in ““tea bagtea bag””•• Place Place ““tea bagstea bags”” in porous sackin porous sack•• Place porous sacks in cattle rumenPlace porous sacks in cattle rumen•• IncubateIncubate•• Remove porous sackRemove porous sack•• Wash Wash ““tea bagstea bags””•• DryDry•• Weigh residueWeigh residue


In-Situ DigestionIn-Situ Digestion
SugarSugar--canecanebagassebagasse
AfricanAfricanmilletmilletstrawstraw
SorghumSorghumstrawstraw
TobaccoTobaccostalksstalks
4848-- h
Dig
estio
n h
Dig
estio
n (g
dig
este
d/g
fed)
(g d
iges
ted/
g fe
d) 1.01.00.80.80.60.60.40.40.20.20.00.0
UntreatedUntreatedLimeLime--treatedtreated

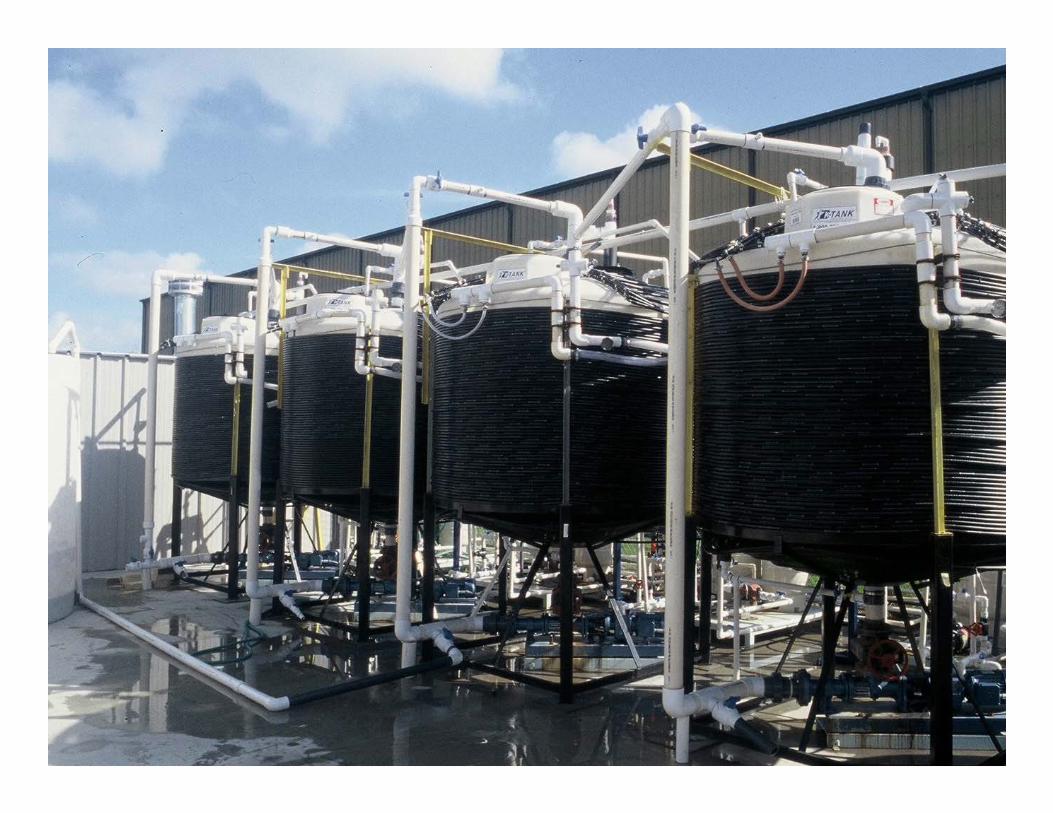
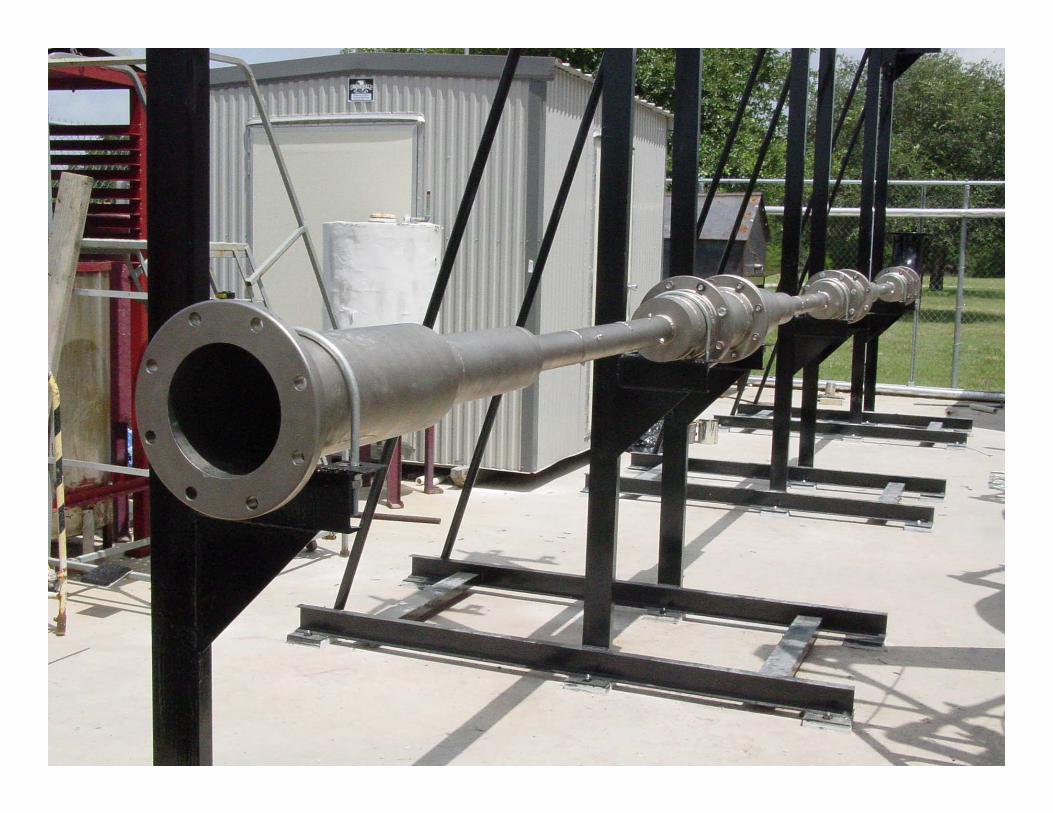
Pretreatment Vessels
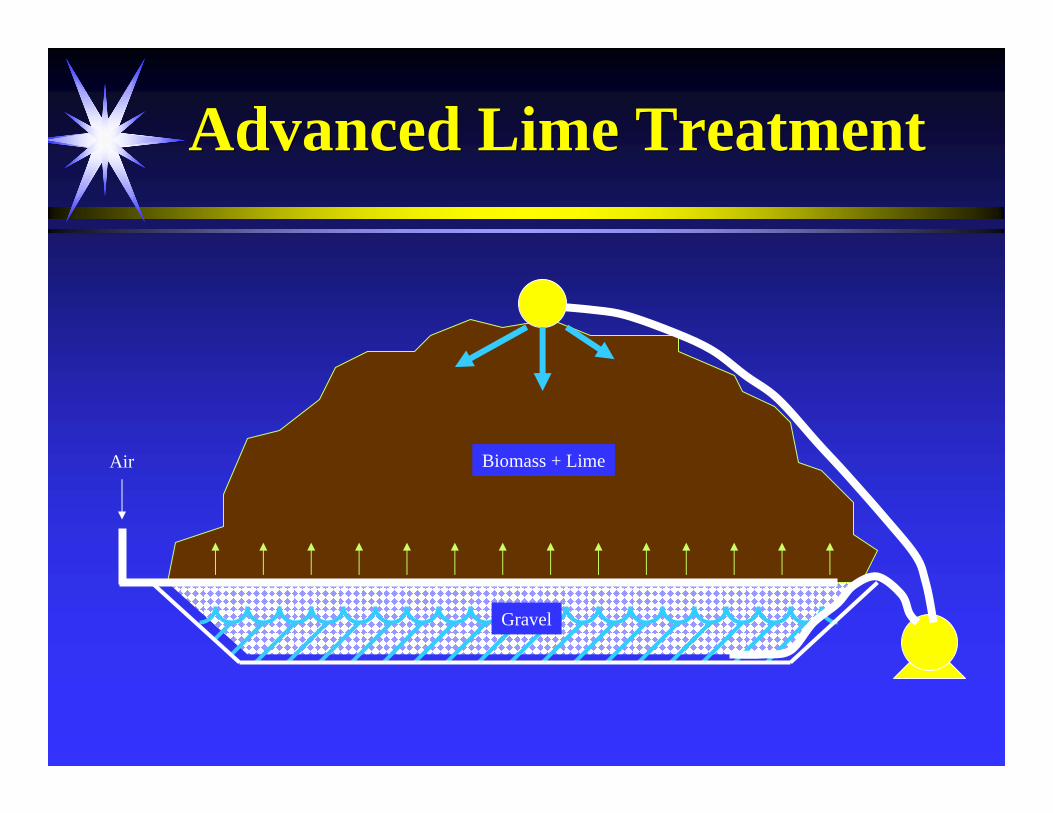
Advanced Lime Treatment Advanced Lime Treatment
Biomass + Lime
Gravel
Air
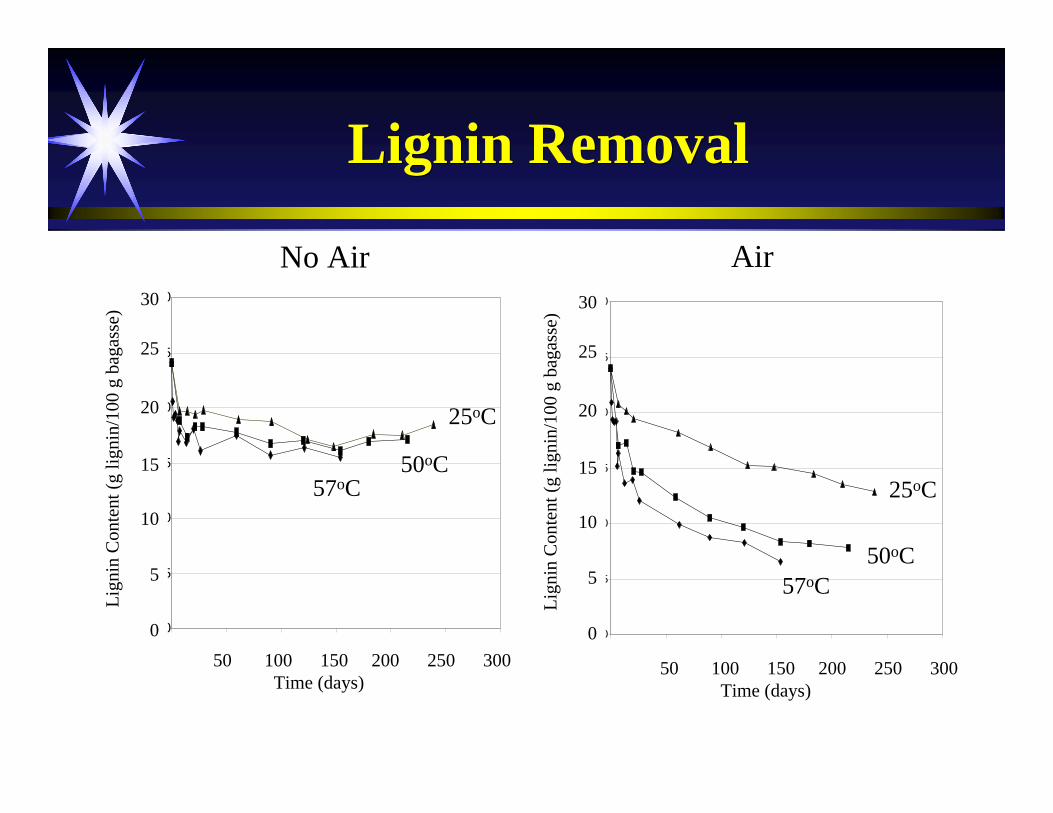
Lignin RemovalLignin Removal
0
5
10
15
20
25
30
0 50 100 150 200 250 300
Time (days)
Lign
in C
onte
nt in
Tre
ated
Bag
asse
(g
ligni
n/10
0g
ofba
gass
e)
0
5
10
15
20
25
30
0 50 100 150 200 250 300
Time (days)
Lign
in C
onte
nt in
Tre
ated
Bag
asse
(g
ligni
n/10
0g
treat
edba
gass
e)
50 100 150 200 250 300Time (days)
50 100 150 200 250 300Time (days)
30
25
20
15
10
5
0
Lign
in C
onte
nt (g
lign
in/1
00 g
bag
asse
) 30
25
20
15
10
5
0
Lign
in C
onte
nt (g
lign
in/1
00 g
bag
asse
) 30
25
20
15
10
5
0
Lign
in C
onte
nt (g
lign
in/1
00 g
bag
asse
) 30
25
20
15
10
5
0
Lign
in C
onte
nt (g
lign
in/1
00 g
bag
asse
)
25oC
50oC57oC 25oC
50oC57oC
No Air Air
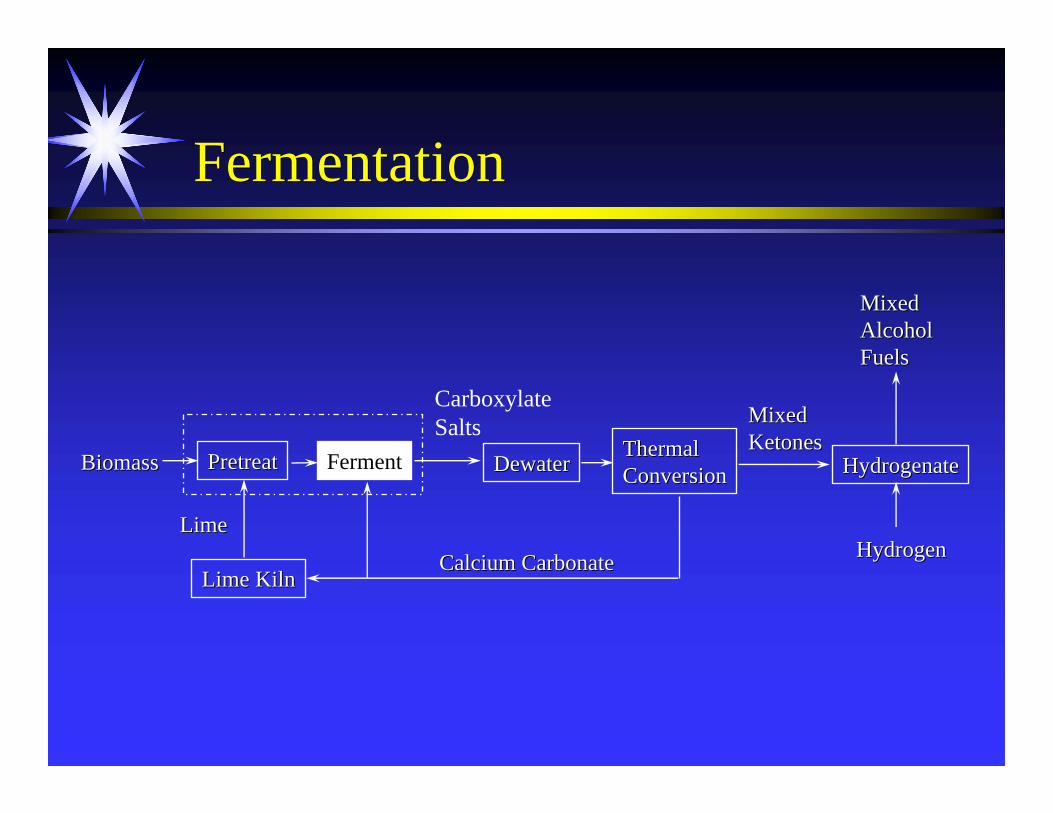
FermentationFermentation
Ferment DewaterDewaterPretreatPretreat ThermalThermalConversionConversion HydrogenateHydrogenate
Lime KilnLime Kiln
MixedMixedAlcoholAlcoholFuelsFuels
MixedMixedKetonesKetones
BiomassBiomass
HydrogenHydrogenCalcium CarbonateCalcium CarbonateLimeLime
CarboxylateSalts

Environments where organic acids naturally formEnvironments where organic acids naturally form
•• animal rumenanimal rumen-- cattlecattle-- sheepsheep-- deerdeer-- elephantselephants
•• anaerobic sewage anaerobic sewage digestorsdigestors•• swampsswamps•• termite gutstermite guts

Why are organic acids favored?Why are organic acids favored?
The actual The actual stoichiometrystoichiometry is more complexis more complex
CC66HH1212OO66 →→ 2 C2 C22HH55OH + 2 COOH + 2 CO22 ∆∆G = G = --48.56 kcal/mol48.56 kcal/mol
CC66HH1212OO66 →→ 3 C3 C22HH33OOH OOH ∆∆G = G = --61.8 kcal/mol61.8 kcal/mol
5 C5 C66HH1212OO66 →→ 6 acetate + 2 propionate + butyrate + 5 CO6 acetate + 2 propionate + butyrate + 5 CO22 + 3 CH+ 3 CH 4 4 + 6 H+ 6 H22OO(67 mol%) (22 mol%) (11 mol%)(67 mol%) (22 mol%) (11 mol%)
glucose ethanolglucose ethanol
glucose acetic acidglucose acetic acid

Typical Product Spectrumat Different Culture TemperaturesTypical Product Spectrumat Different Culture Temperatures
40oC 55oC C2 – Acetic 41 wt % 80 wt %C3 – Propionic 15 wt % 4 wt %C4 – Butyric 21 wt % 15 wt %C5 – Valeric 8 wt % <1 wt %C6 – Caproic 12 wt % <1 wt %C7 – Heptanoic 3 wt % <1 wt %
100 wt % 100 wt %


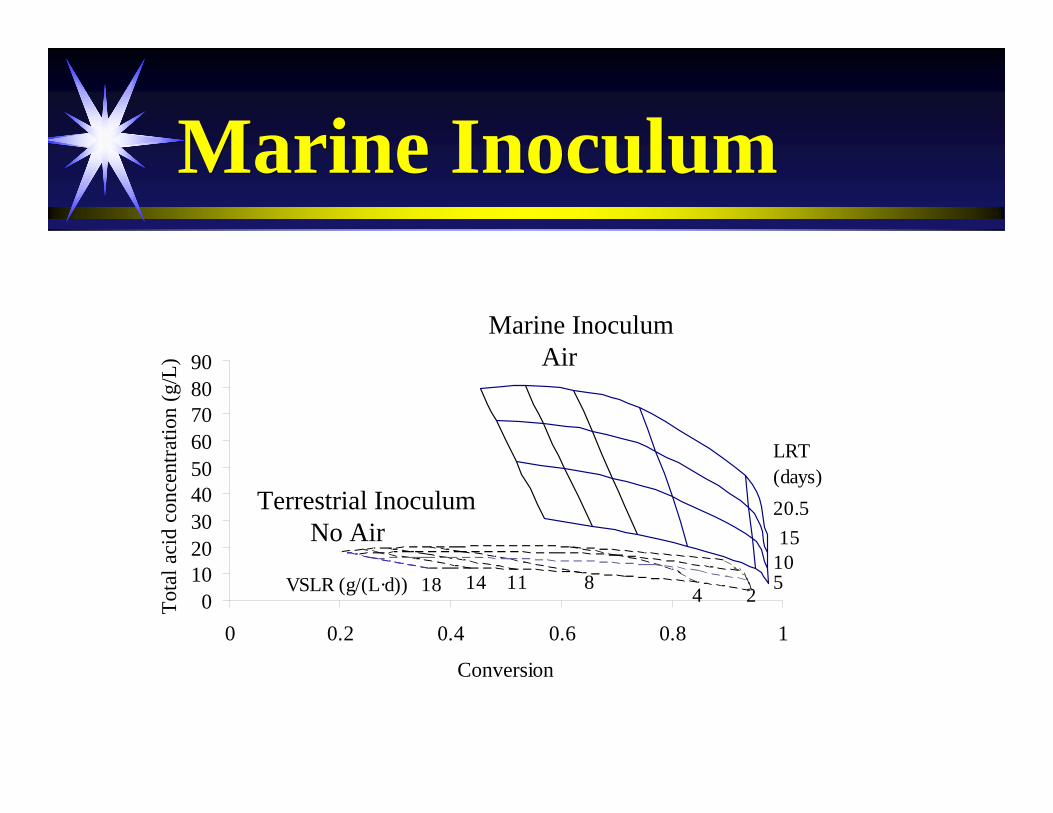
Marine InoculumMarine Inoculum
0102030405060708090
0 0.2 0.4 0.6 0.8 1
Conversion
Tota
l aci
d co
ncen
tratio
n (g
/L)
5
LRT(days)
1015
4111418
20.5
VSLR (g/(L·d)) 28
Marine InoculumAir
Terrestrial InoculumNo Air

Storage + Pretreatment + Fermentation
Storage + Pretreatment + Fermentation
Biomass + Lime + Calcium Carbonate
Gravel
Air
Tarp Cover
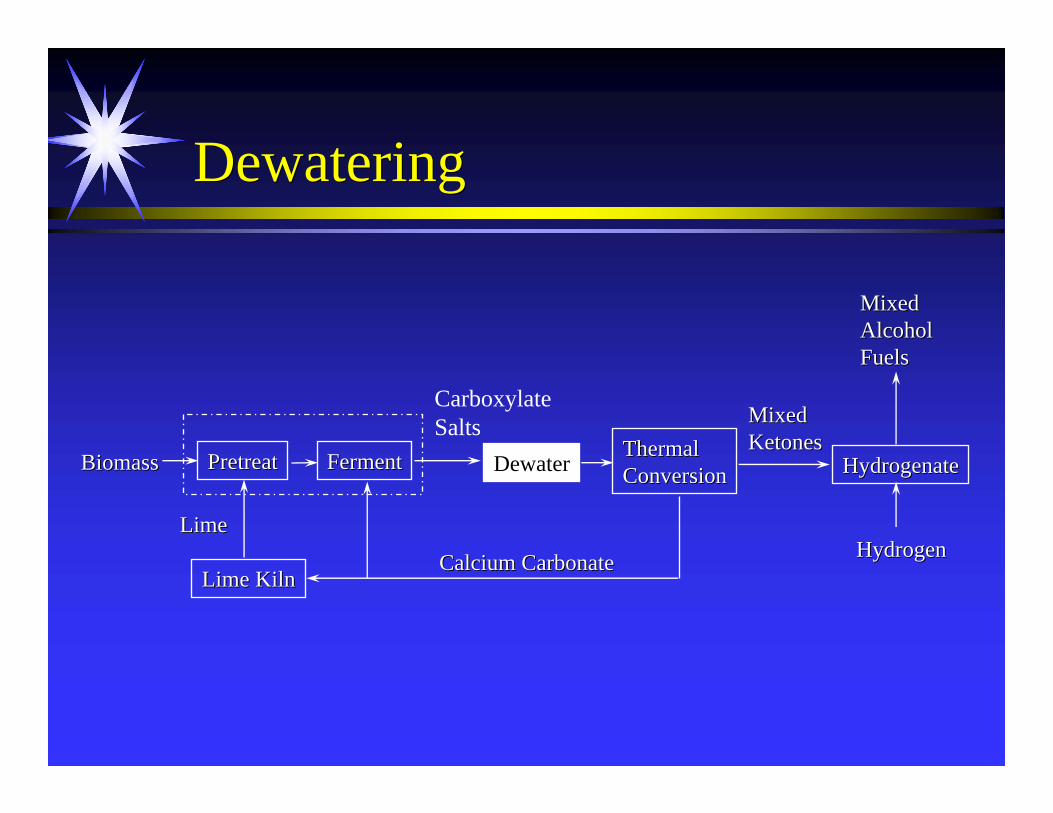
DewateringDewatering
FermentFerment DewaterPretreatPretreat ThermalThermalConversionConversion HydrogenateHydrogenate
Lime KilnLime Kiln
MixedMixedAlcoholAlcoholFuelsFuels
MixedMixedKetonesKetones
BiomassBiomass
HydrogenHydrogenCalcium CarbonateCalcium CarbonateLimeLime
CarboxylateSalts
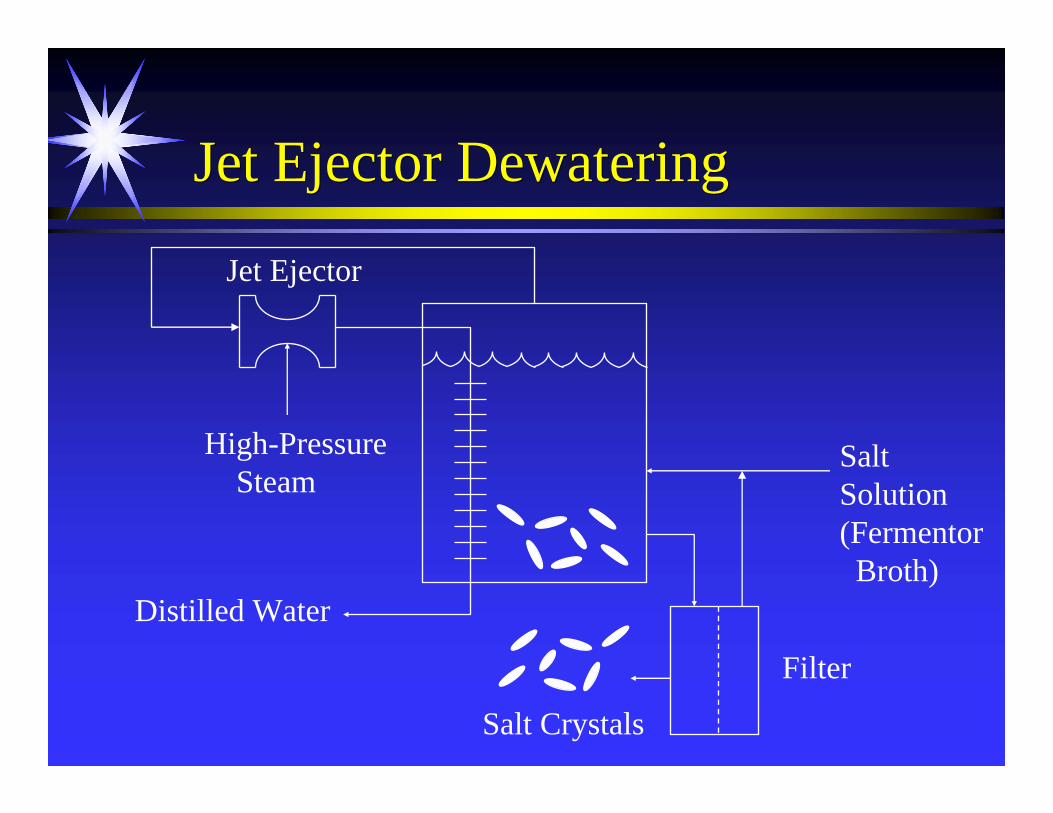
Jet Ejector DewateringJet Ejector Dewatering
SaltSolution(FermentorBroth)
High-PressureSteam
Distilled Water
Filter
Jet Ejector
Salt Crystals

Heat RequirementsHeat Requirements
SingleSingle--effect evaporator 1000effect evaporator 1000TripleTriple--effect evaporator effect evaporator 333333Jet ejector dewateringJet ejector dewatering
1010--effect effect 100 100 2020--effecteffect 50503030--effecteffect 3333
BtuBtulb water removedlb water removed
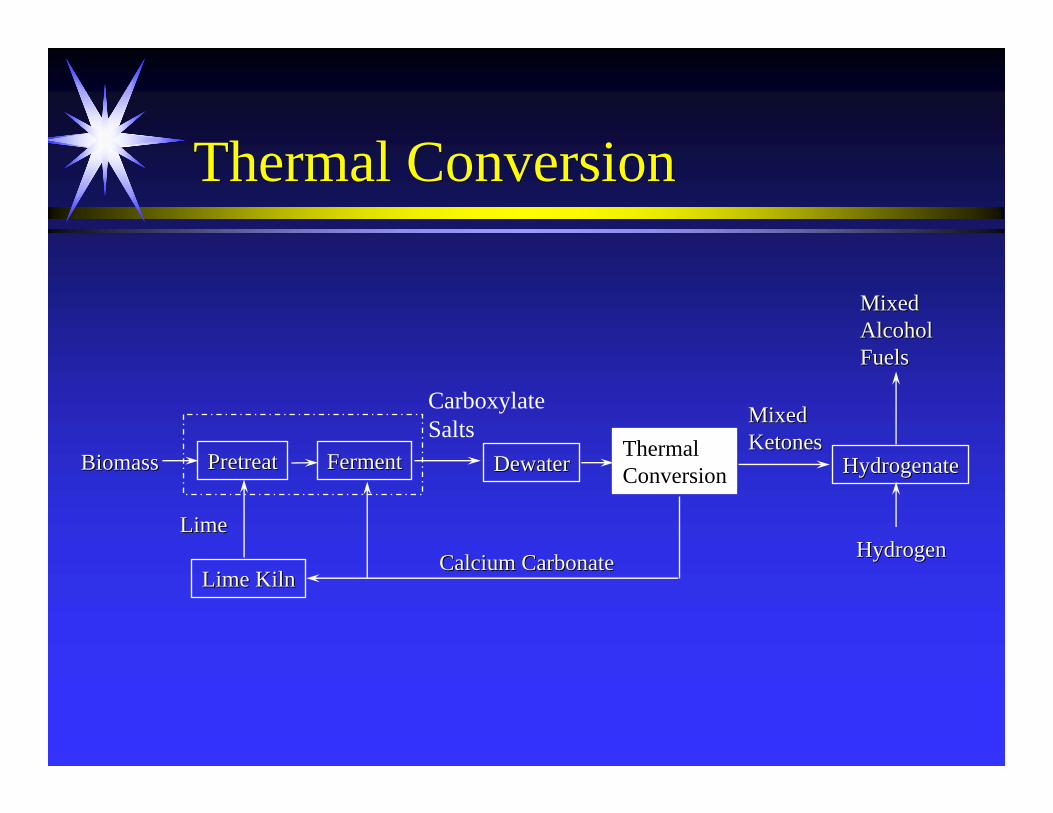
Thermal ConversionThermal Conversion
FermentFerment DewaterDewaterPretreatPretreat ThermalConversion HydrogenateHydrogenate
Lime KilnLime Kiln
MixedMixedAlcoholAlcoholFuelsFuels
MixedMixedKetonesKetones
BiomassBiomass
HydrogenHydrogenCalcium CarbonateCalcium CarbonateLimeLime
CarboxylateSalts

Thermal ConversionStoichiometryThermal ConversionStoichiometry
HH33CCOCaOCCHCCOCaOCCH33 →→ ΗΗ33CCCHCCCH33 + CaCO+ CaCO33
OO
Calcium Acetate AcetoneCalcium Acetate Acetone
OO OO
HH33CCHCCH22COCaOCCHCOCaOCCH22CHCH33 →→ ΗΗ33CCHCCH22CCHCCH22CHCH33 + CaCO+ CaCO33
Calcium Propionate DiethylCalcium Propionate Diethyl KetoneKetone
OO OO OO
HH33CCHCCH22CHCH22COCaOCCHCOCaOCCH22CHCH22CHCH33 →→ ΗΗ33CCHCCH22CHCH22CCHCCH22CHCH22CHCH33 + CaCO+ CaCO33
Calcium ButyrateCalcium Butyrate Dipropyl KetoneDipropyl Ketone
OO OO OO

Thermal Conversion KineticsThermal Conversion Kinetics
0
5
10
15
20
25
30
35
40
45
380 400 420 440 460 480 500
T (°C)
t (m
in)
999590
Conversion (%)


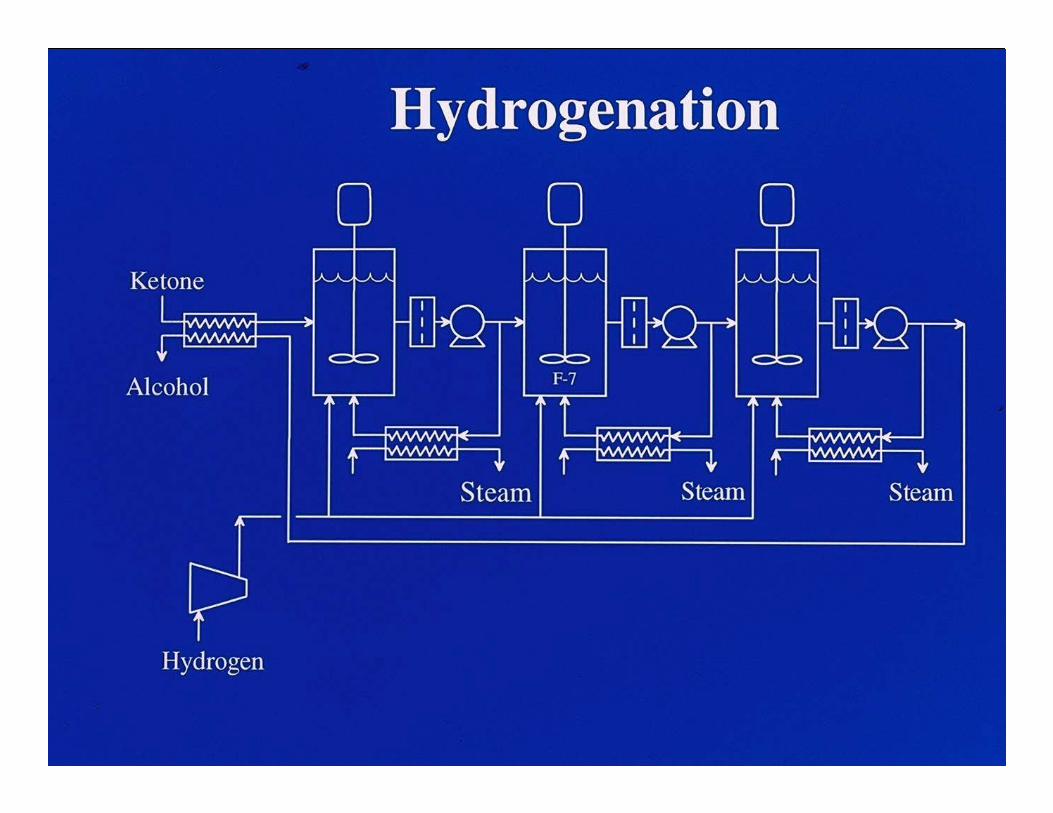
HydrogenationHydrogenation
FermentFerment DewaterDewaterPretreatPretreat ThermalThermalConversionConversion Hydrogenate
Lime KilnLime Kiln
MixedMixedAlcoholAlcoholFuelsFuels
MixedMixedKetonesKetones
BiomassBiomass
HydrogenHydrogenCalcium CarbonateCalcium CarbonateLimeLime
CarboxylateSalts

Ketone HydrogenationStoichiometryKetone HydrogenationStoichiometry
O OHH3CCCH3 + H2 → H3CCCH3
HAcetone Isopropanol
H3CCCH2CH3 + H2 → H3CCCH2CH3H
O OH
Methyl Ethyl Ketone 2-Butanol
H3CCH2CCH2CH3 + H2 → H3CCH2CCH2CH3
O
H
OH
Diethyl Ketone 3-Pentanol
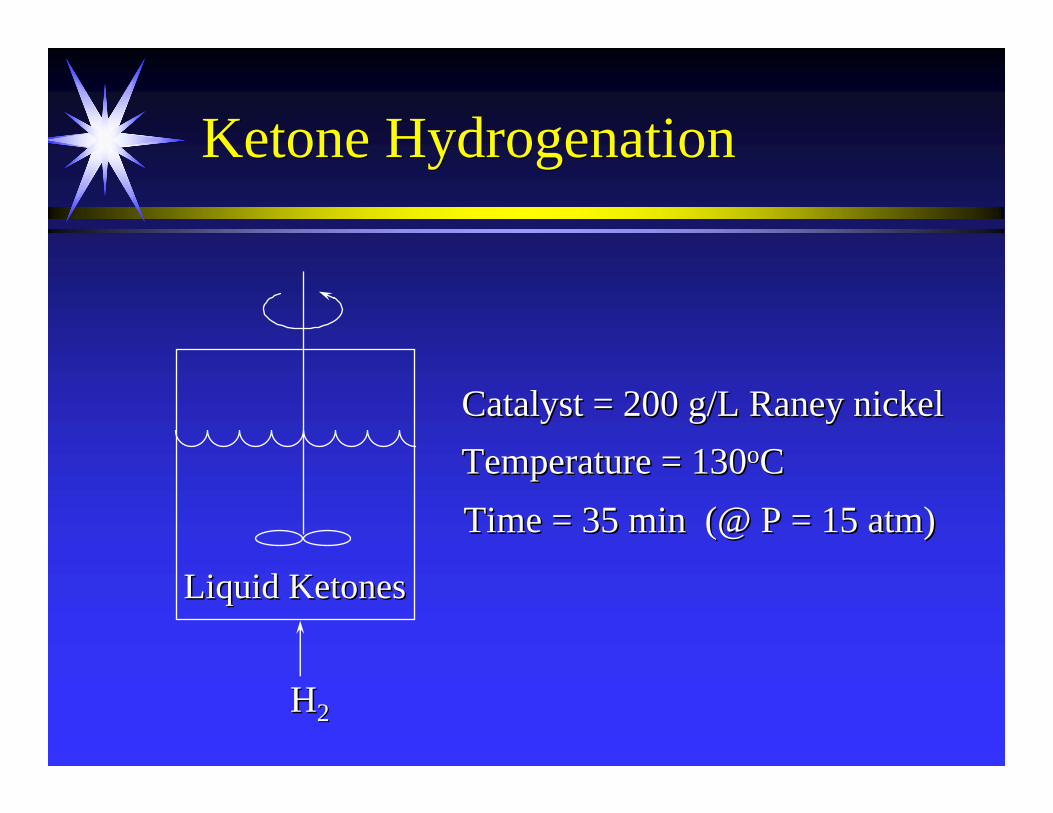
Ketone HydrogenationKetone Hydrogenation
HH22
Liquid Liquid KetonesKetones
Catalyst = 200 g/L Raney nickelCatalyst = 200 g/L Raney nickelTemperature = 130Temperature = 130ooCCTime = 35 min (@ P = 15Time = 35 min (@ P = 15 atmatm) )
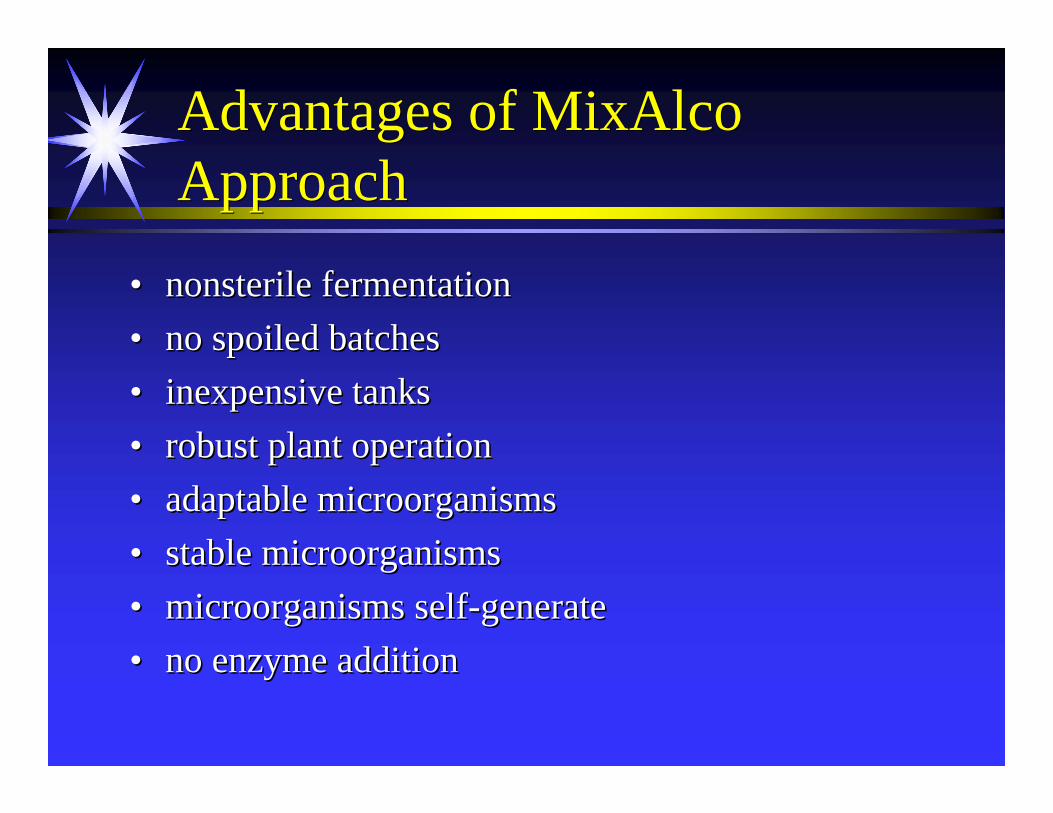
Advantages of MixAlcoApproachAdvantages of MixAlcoApproach
•• nonsterilenonsterile fermentationfermentation•• no spoiled batchesno spoiled batches•• inexpensive tanksinexpensive tanks•• robust plant operationrobust plant operation•• adaptable microorganismsadaptable microorganisms•• stable microorganismsstable microorganisms•• microorganisms selfmicroorganisms self--generategenerate•• no enzyme additionno enzyme addition

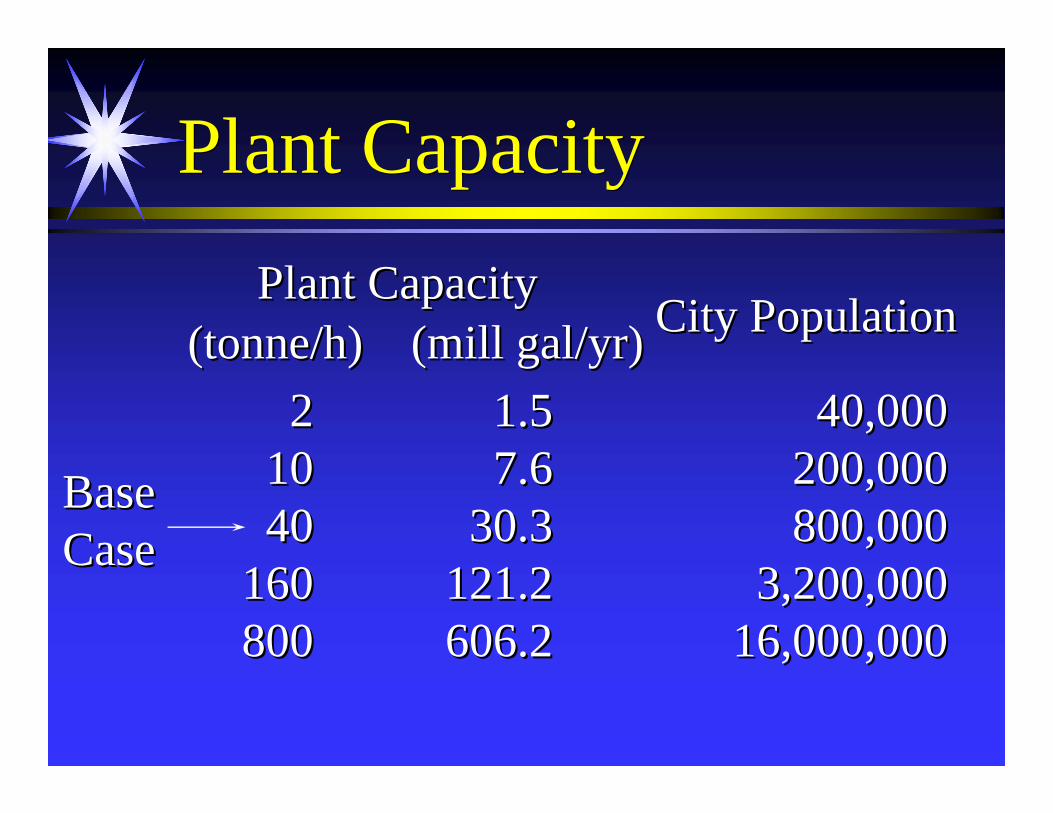
Plant CapacityPlant Capacity
((tonnetonne/h) (mill gal/yr)/h) (mill gal/yr)Plant CapacityPlant Capacity
City PopulationCity Population
2 1.5 40,0002 1.5 40,0001010 7.67.6 200,000200,00040 30.3 800,00040 30.3 800,000
160 121.2 3,200,000160 121.2 3,200,000800 606.2 16,000,000800 606.2 16,000,000
Base Base CaseCase

Capital Cost of Each Section (mill $)(40 tonne/h) Capital Cost of Each Section (mill $)(40 tonne/h)
PretreatPretreat/ / Dewater Dewater Thermal HydrogenThermal HydrogenFerment Ferment ConvConv
10.610.6
4.04.0 4.14.1
1.31.3
Total = $20 millTotal = $20 mill
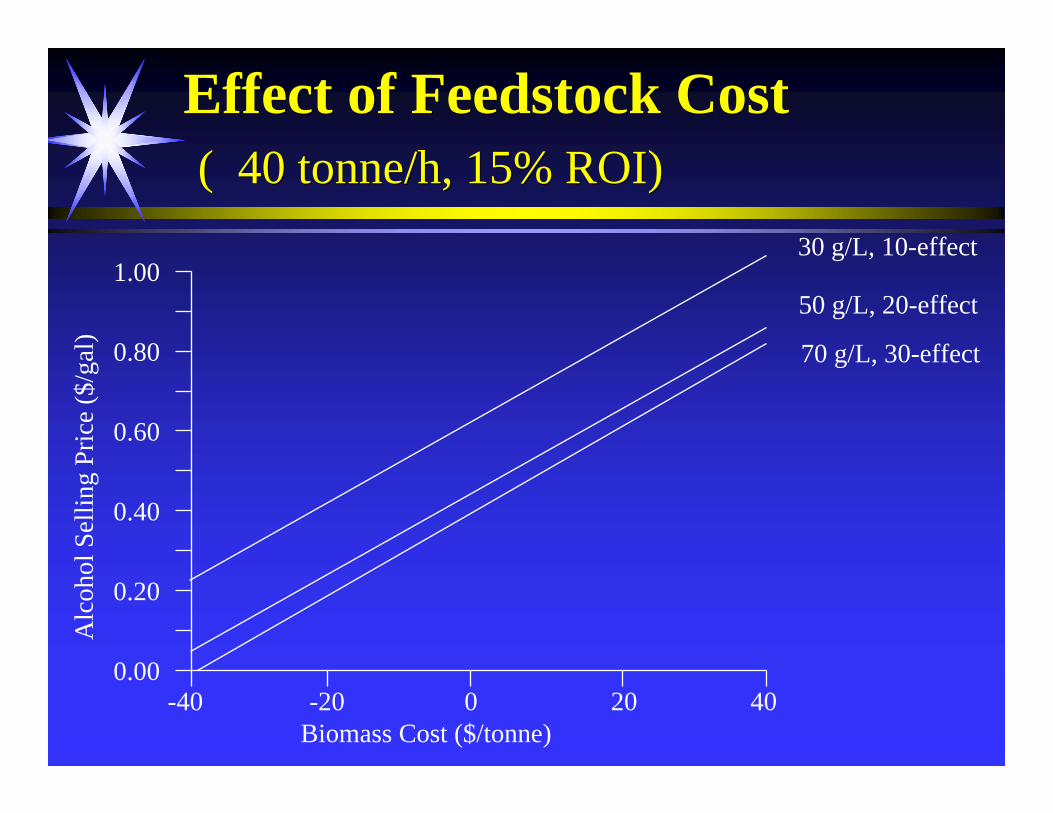
Effect of Feedstock Cost( 40 tonne/h, 15% ROI)
Effect of Feedstock Cost( 40 tonne/h, 15% ROI)
-40 -20 0 20 40Biomass Cost ($/tonne)
1.00
0.80
0.60
0.40
0.20
0.00
Alc
ohol
Sel
ling
Pric
e ($
/gal
)
30 g/L, 10-effect
50 g/L, 20-effect
70 g/L, 30-effect

Fuels and Sugar from Energy Cane
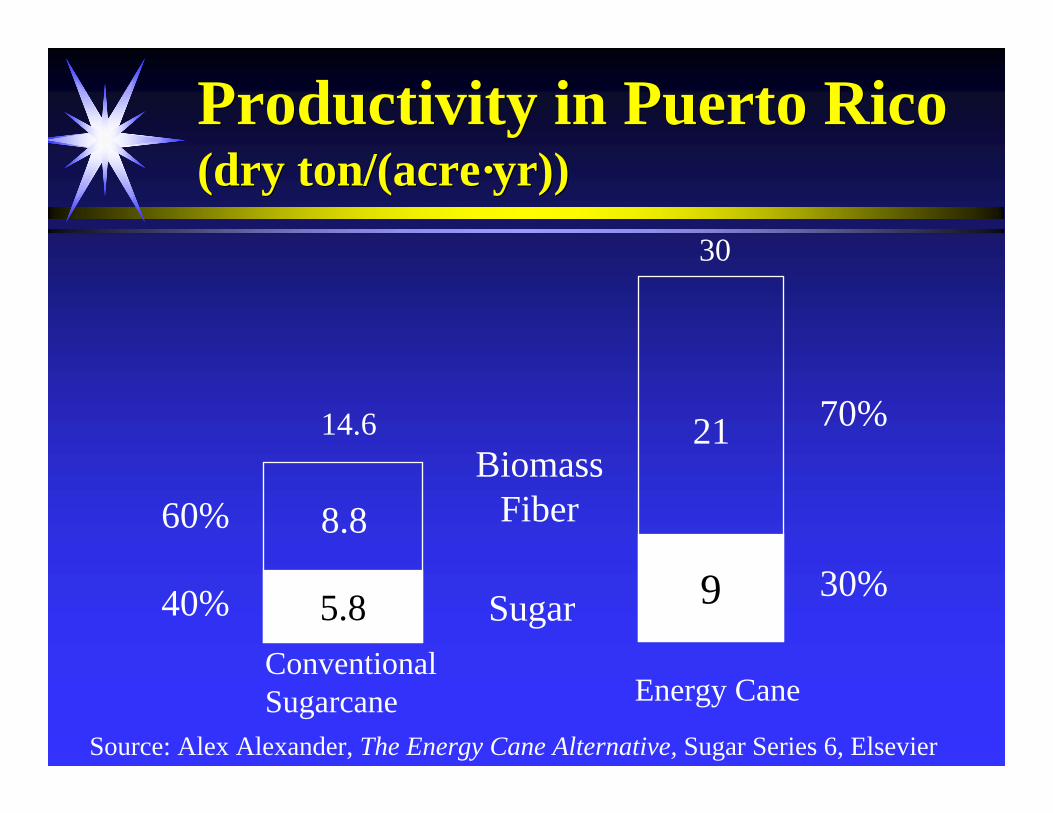
Productivity in Puerto Rico(dry ton/(acre·yr))Productivity in Puerto Rico(dry ton/(acre·yr))
Energy Cane
Source: Alex Alexander, The Energy Cane Alternative, Sugar Series 6, Elsevier
Sugar
BiomassFiber
ConventionalSugarcane
5.8
8.8
14.6
9
21
30
40%
60%
70%
30%

Energy Cane ProcessingEnergy Cane Processing
Energy Cane Extract
Sugar Mill
MixAlcoProcess
Sugar
AlcoholFuel
Sugar
BiomassFiber
Residue(Boiler Fuel)

Fuels from Energy Cane(no sugar credit)
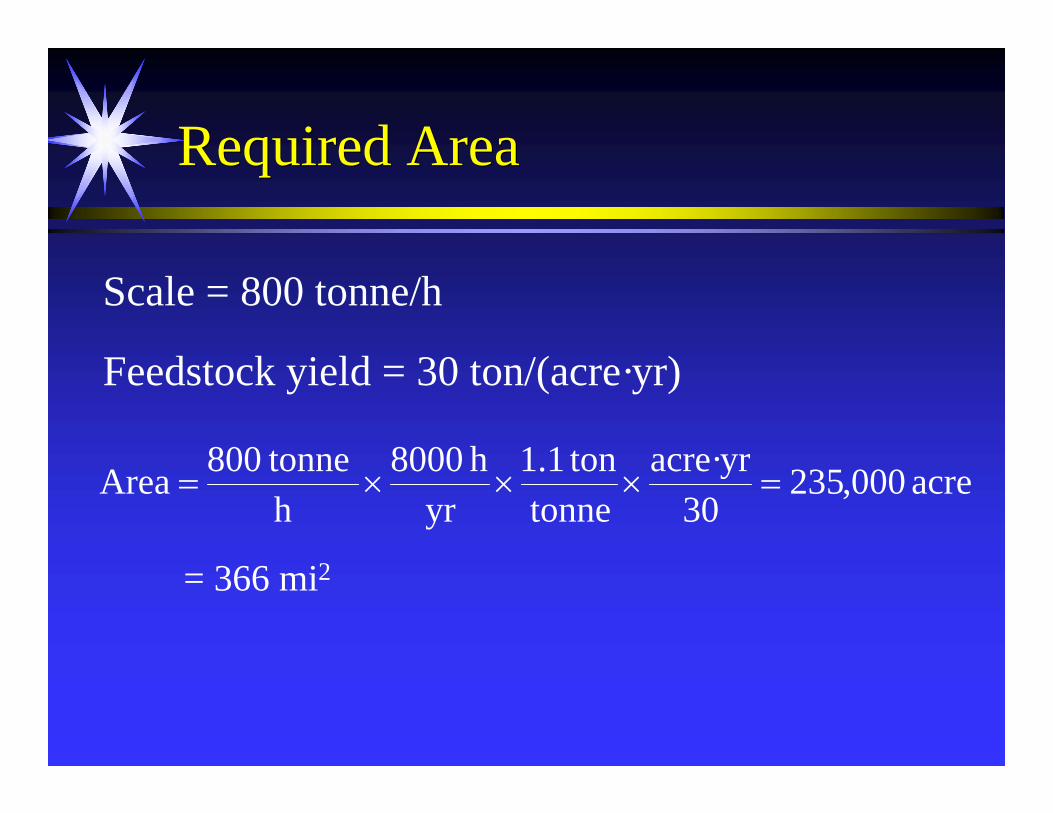
Required AreaRequired Area
Scale = 800 tonne/h
Feedstock yield = 30 ton/(acre·yr)
acre 000,23530
acre·yrtonne
ton1.1yr
h8000h
tonne800 Area =×××=
= 366 mi2

Centralized ProcessingCentralized Processing
15.3 mi50% of area planted
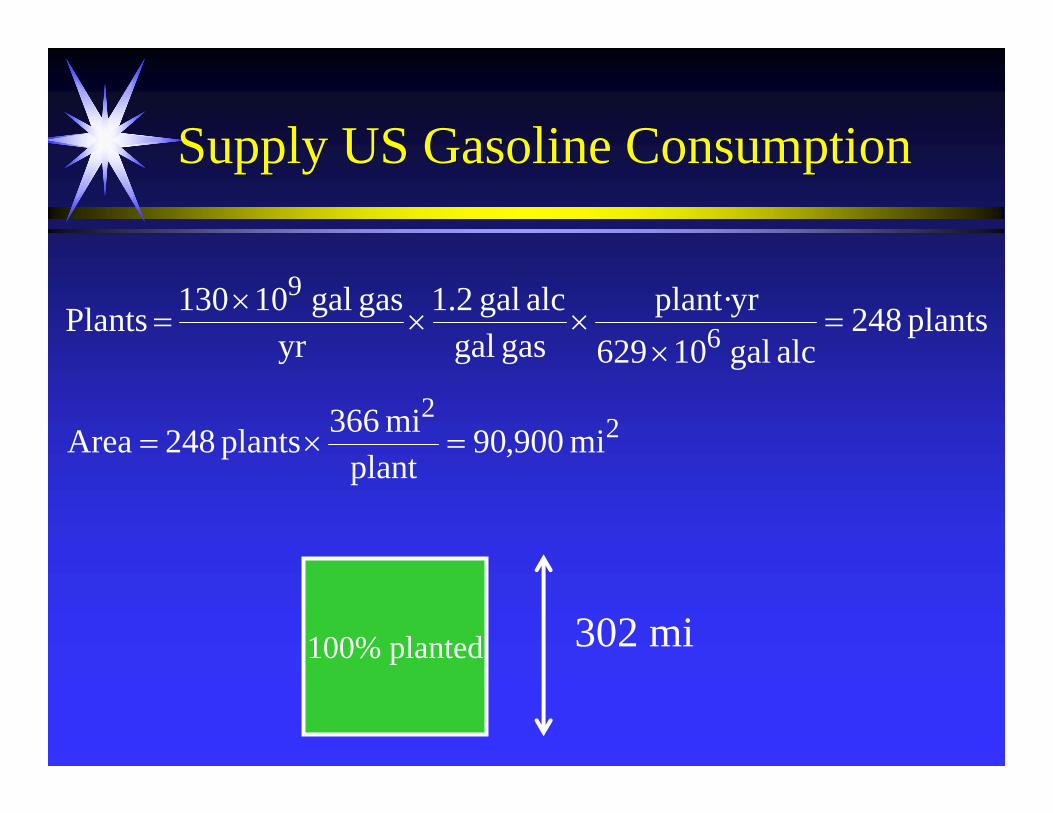
Supply US Gasoline Consumption Supply US Gasoline Consumption
plants 248alc gal 10 629
plant·yrgas gal
alc gal 2.1yr
gas gal 10 130 Plants 6
9=
×××
×=
22
mi 900,90plant
mi 366plants 248 Area =×=
100% planted 302 mi

Effect of Automotive EfficiencyEffect of Automotive Efficiency
302 mi1× better (Current)
2× better
3× better
213 mi
174 mi

Land required in BrazilLand required in Brazil
1 × 2 × 3 ×

Sweet SorghumSweet Sorghum
Grows in ~35 US states
William Rooney, Soil and Crop Sciences, Texas A&M University
Yield = 20–25 dry ton/(acre·yr)
100% planted 345 mi1×

Land Area in United StatesLand Area in United States
1× 2× 3×
Related Documents


![Water shortage[1]](https://static.cupdf.com/doc/110x72/556132e4d8b42a263b8b46da/water-shortage1.jpg)