Top Banner
29

% of married population % of population NSO Census 1995 2.801.35 NSO Lifestyle 2003 3.581.40 NSO Census 2005 6.833.30 NSO Lifestyle 2007 5.413.00 Health.

Dec 16, 2015

Download

Documents

Marisa Miggins
Welcome message from author
This document is posted to help you gain knowledge. Please leave a comment to let me know what you think about it! Share it to your friends and learn new things together.
Transcript
Page 1: % of married population % of population NSO Census 1995 2.801.35 NSO Lifestyle 2003 3.581.40 NSO Census 2005 6.833.30 NSO Lifestyle 2007 5.413.00 Health.
Page 2: % of married population % of population NSO Census 1995 2.801.35 NSO Lifestyle 2003 3.581.40 NSO Census 2005 6.833.30 NSO Lifestyle 2007 5.413.00 Health.
Page 3: % of married population % of population NSO Census 1995 2.801.35 NSO Lifestyle 2003 3.581.40 NSO Census 2005 6.833.30 NSO Lifestyle 2007 5.413.00 Health.

%% of married of married populationpopulation

%% of of populationpopulation

NSO Census 1995NSO Census 1995 2.80 1.35

NSO Lifestyle 2003NSO Lifestyle 2003 3.58 1.40

NSO Census 2005NSO Census 2005 6.83 3.30

NSO Lifestyle 2007NSO Lifestyle 2007 5.41 3.00

Health Interview Survey 2008Health Interview Survey 2008 6.47 3.80

Page 4: % of married population % of population NSO Census 1995 2.801.35 NSO Lifestyle 2003 3.581.40 NSO Census 2005 6.833.30 NSO Lifestyle 2007 5.413.00 Health.
Page 5: % of married population % of population NSO Census 1995 2.801.35 NSO Lifestyle 2003 3.581.40 NSO Census 2005 6.833.30 NSO Lifestyle 2007 5.413.00 Health.
Page 6: % of married population % of population NSO Census 1995 2.801.35 NSO Lifestyle 2003 3.581.40 NSO Census 2005 6.833.30 NSO Lifestyle 2007 5.413.00 Health.
Page 7: % of married population % of population NSO Census 1995 2.801.35 NSO Lifestyle 2003 3.581.40 NSO Census 2005 6.833.30 NSO Lifestyle 2007 5.413.00 Health.

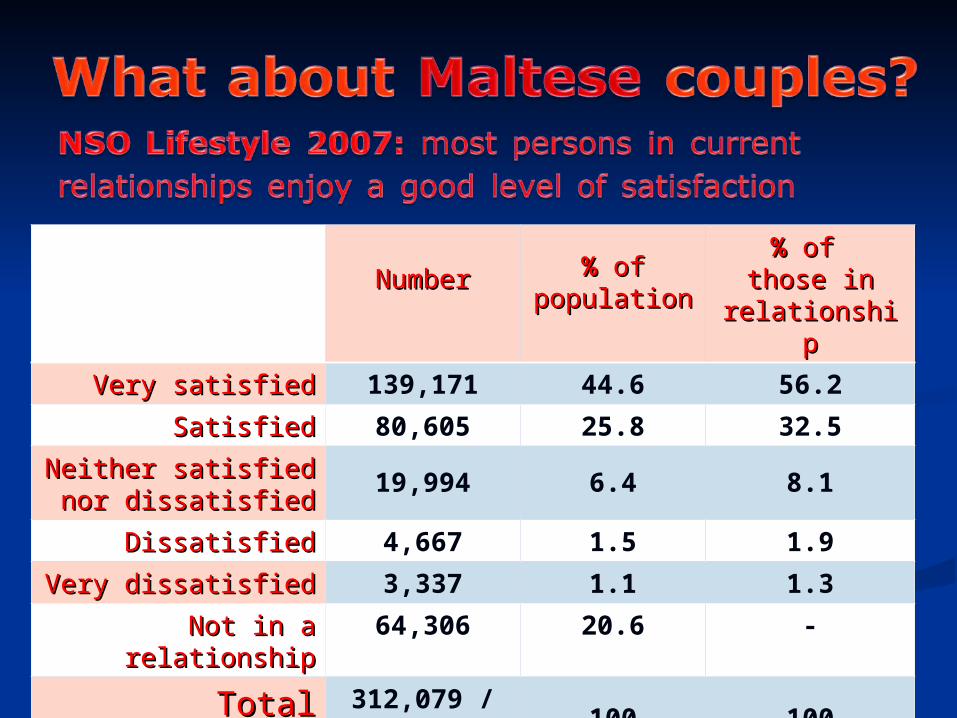
NumberNumber %% of of populationpopulation

%% of of those in those in

relationshiprelationship

Very satisfiedVery satisfied 139,171 44.6 56.2

SatisfiedSatisfied 80,605 25.8 32.5

Neither satisfied Neither satisfied nor dissatisfiednor dissatisfied

19,994 6.4 8.1

DissatisfiedDissatisfied 4,667 1.5 1.9

Very dissatisfiedVery dissatisfied 3,337 1.1 1.3

Not in a relationshipNot in a relationship 64,306 20.6 -

TotalTotal 312,079 / 247,773 100 100

Page 8: % of married population % of population NSO Census 1995 2.801.35 NSO Lifestyle 2003 3.581.40 NSO Census 2005 6.833.30 NSO Lifestyle 2007 5.413.00 Health.
Page 9: % of married population % of population NSO Census 1995 2.801.35 NSO Lifestyle 2003 3.581.40 NSO Census 2005 6.833.30 NSO Lifestyle 2007 5.413.00 Health.

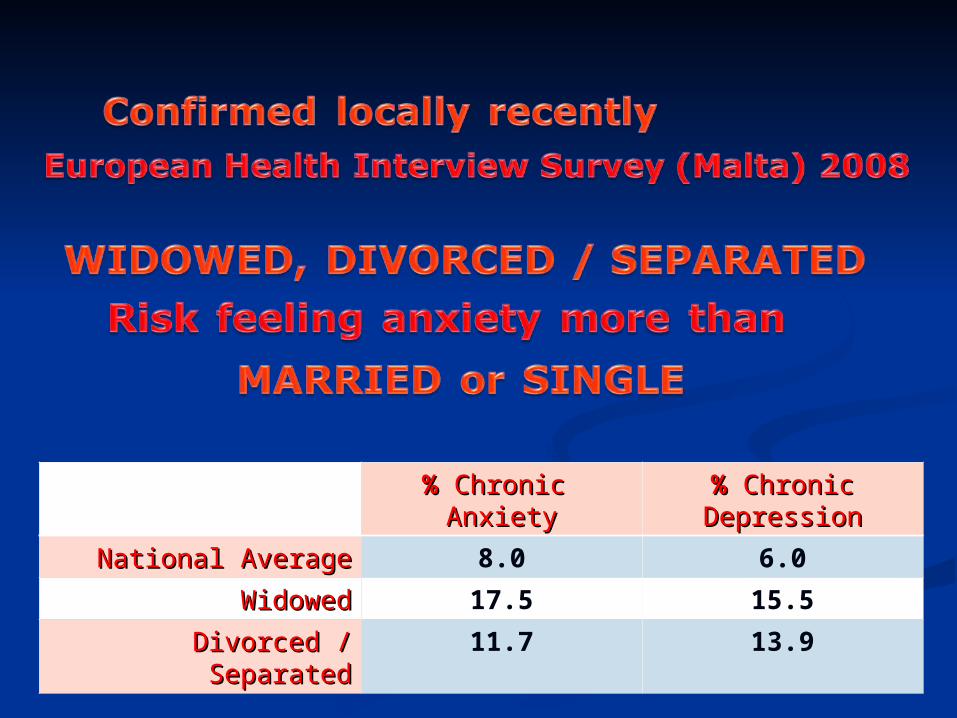
%% Chronic Chronic AnxietyAnxiety

%% Chronic Chronic DepressionDepression

National AverageNational Average 8.0 6.0

WidowedWidowed 17.5 15.5

Divorced / SeparatedDivorced / Separated 11.7 13.9

Page 10: % of married population % of population NSO Census 1995 2.801.35 NSO Lifestyle 2003 3.581.40 NSO Census 2005 6.833.30 NSO Lifestyle 2007 5.413.00 Health.
Page 11: % of married population % of population NSO Census 1995 2.801.35 NSO Lifestyle 2003 3.581.40 NSO Census 2005 6.833.30 NSO Lifestyle 2007 5.413.00 Health.
Page 12: % of married population % of population NSO Census 1995 2.801.35 NSO Lifestyle 2003 3.581.40 NSO Census 2005 6.833.30 NSO Lifestyle 2007 5.413.00 Health.
Page 13: % of married population % of population NSO Census 1995 2.801.35 NSO Lifestyle 2003 3.581.40 NSO Census 2005 6.833.30 NSO Lifestyle 2007 5.413.00 Health.

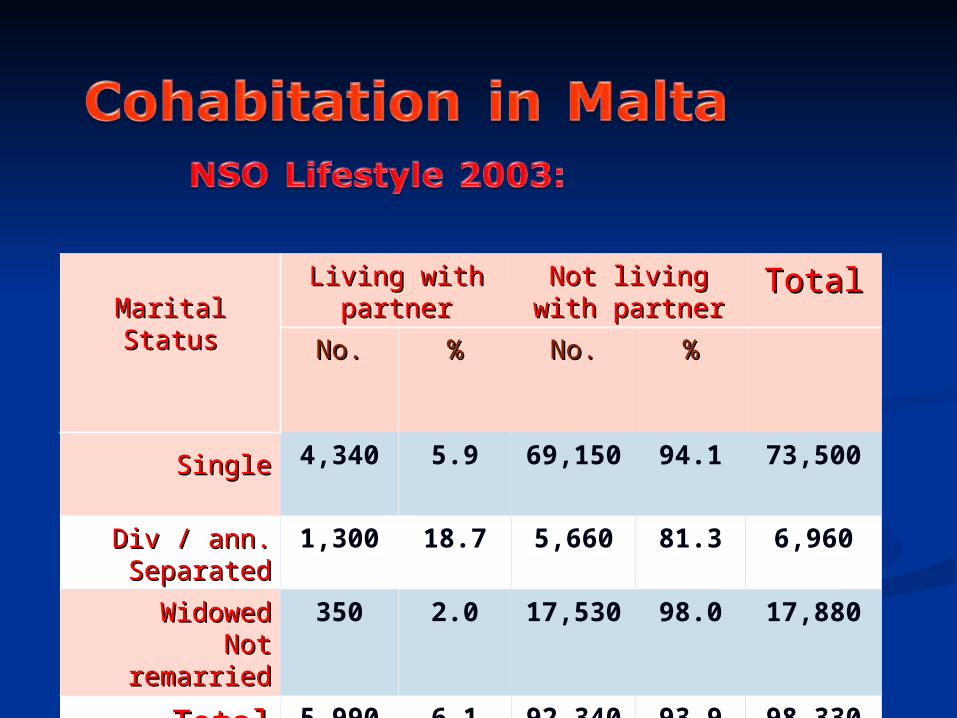
Marital StatusMarital StatusLiving with Living with

partnerpartnerNot living with Not living with

partnerpartnerTotalTotal

No.No. %% No.No. %%

SingleSingle 4,340 5.9 69,150 94.1 73,500

Div / ann.Div / ann.SeparatedSeparated

1,300 18.7 5,660 81.3 6,960

WidowedWidowedNot remarriedNot remarried

350 2.0 17,530 98.0 17,880

TotalTotal 5,990 6.1 92,340 93.9 98,330

Page 14: % of married population % of population NSO Census 1995 2.801.35 NSO Lifestyle 2003 3.581.40 NSO Census 2005 6.833.30 NSO Lifestyle 2007 5.413.00 Health.
Page 15: % of married population % of population NSO Census 1995 2.801.35 NSO Lifestyle 2003 3.581.40 NSO Census 2005 6.833.30 NSO Lifestyle 2007 5.413.00 Health.
Page 16: % of married population % of population NSO Census 1995 2.801.35 NSO Lifestyle 2003 3.581.40 NSO Census 2005 6.833.30 NSO Lifestyle 2007 5.413.00 Health.
Page 17: % of married population % of population NSO Census 1995 2.801.35 NSO Lifestyle 2003 3.581.40 NSO Census 2005 6.833.30 NSO Lifestyle 2007 5.413.00 Health.
Page 18: % of married population % of population NSO Census 1995 2.801.35 NSO Lifestyle 2003 3.581.40 NSO Census 2005 6.833.30 NSO Lifestyle 2007 5.413.00 Health.

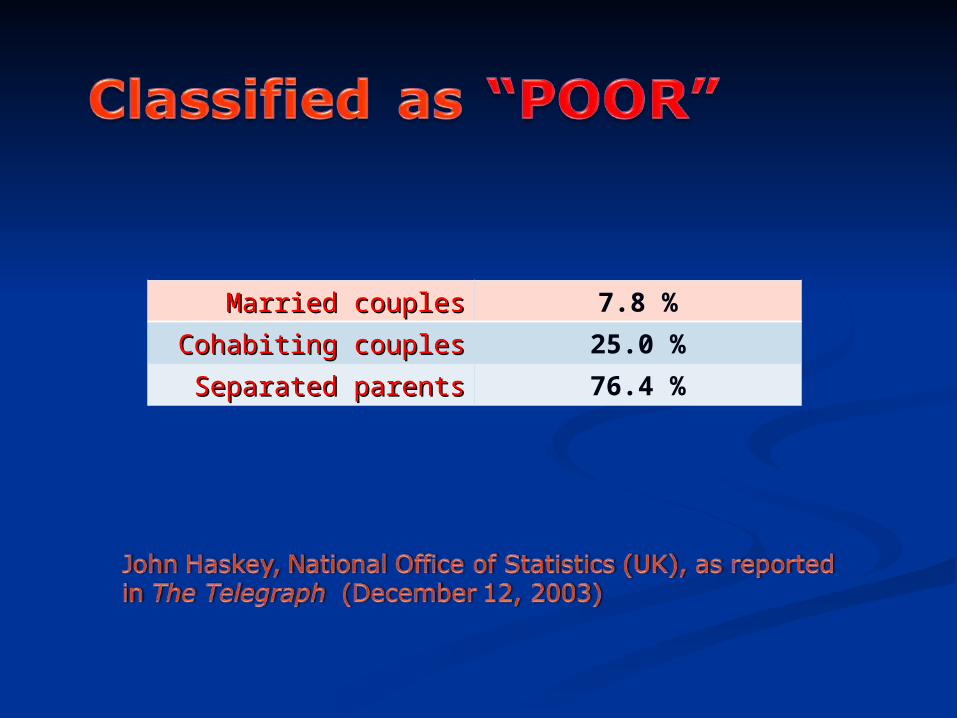
Married couplesMarried couples 7.8 %

Cohabiting couplesCohabiting couples 25.0 %

Separated parentsSeparated parents 76.4 %

Page 19: % of married population % of population NSO Census 1995 2.801.35 NSO Lifestyle 2003 3.581.40 NSO Census 2005 6.833.30 NSO Lifestyle 2007 5.413.00 Health.
Page 20: % of married population % of population NSO Census 1995 2.801.35 NSO Lifestyle 2003 3.581.40 NSO Census 2005 6.833.30 NSO Lifestyle 2007 5.413.00 Health.
Page 21: % of married population % of population NSO Census 1995 2.801.35 NSO Lifestyle 2003 3.581.40 NSO Census 2005 6.833.30 NSO Lifestyle 2007 5.413.00 Health.
Page 22: % of married population % of population NSO Census 1995 2.801.35 NSO Lifestyle 2003 3.581.40 NSO Census 2005 6.833.30 NSO Lifestyle 2007 5.413.00 Health.
Page 23: % of married population % of population NSO Census 1995 2.801.35 NSO Lifestyle 2003 3.581.40 NSO Census 2005 6.833.30 NSO Lifestyle 2007 5.413.00 Health.
Page 24: % of married population % of population NSO Census 1995 2.801.35 NSO Lifestyle 2003 3.581.40 NSO Census 2005 6.833.30 NSO Lifestyle 2007 5.413.00 Health.

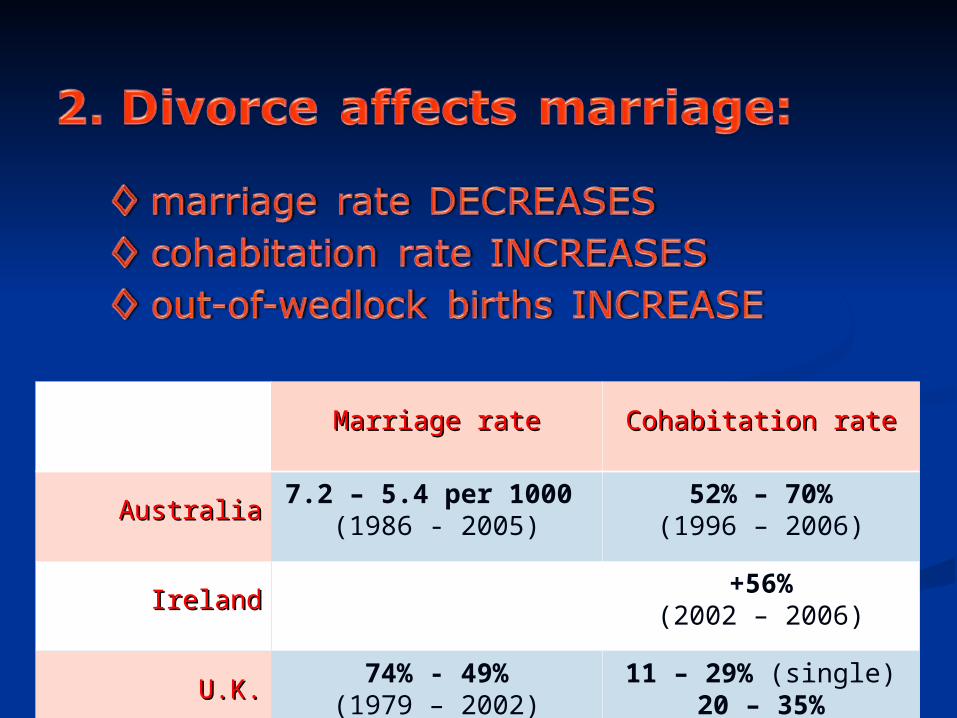
Marriage rateMarriage rate Cohabitation rateCohabitation rate

AustraliaAustralia7.2 – 5.4 per 1000

(1986 - 2005)52% – 70%

(1996 – 2006)

IrelandIreland+56%

(2002 – 2006)

U.K.U.K.74% - 49%

(1979 – 2002)11 – 29% (single)

20 – 35% (divorced)

Page 25: % of married population % of population NSO Census 1995 2.801.35 NSO Lifestyle 2003 3.581.40 NSO Census 2005 6.833.30 NSO Lifestyle 2007 5.413.00 Health.
Page 26: % of married population % of population NSO Census 1995 2.801.35 NSO Lifestyle 2003 3.581.40 NSO Census 2005 6.833.30 NSO Lifestyle 2007 5.413.00 Health.

YearYear TotalTotal CIVILCIVIL Both Both MalteseMaltese

Maltese Maltese groomgroom

Maltese Maltese bridebride

Maltese Maltese involvedinvolved

20042004 2,402 756 105 140 119 364

20052005 2,374 779 100 138 90 328

20062006 2,536 859 98 120 84 302

20072007 2,479 867 122 136 91 349

20082008 2,482 840 107 117 76 300

Page 27: % of married population % of population NSO Census 1995 2.801.35 NSO Lifestyle 2003 3.581.40 NSO Census 2005 6.833.30 NSO Lifestyle 2007 5.413.00 Health.

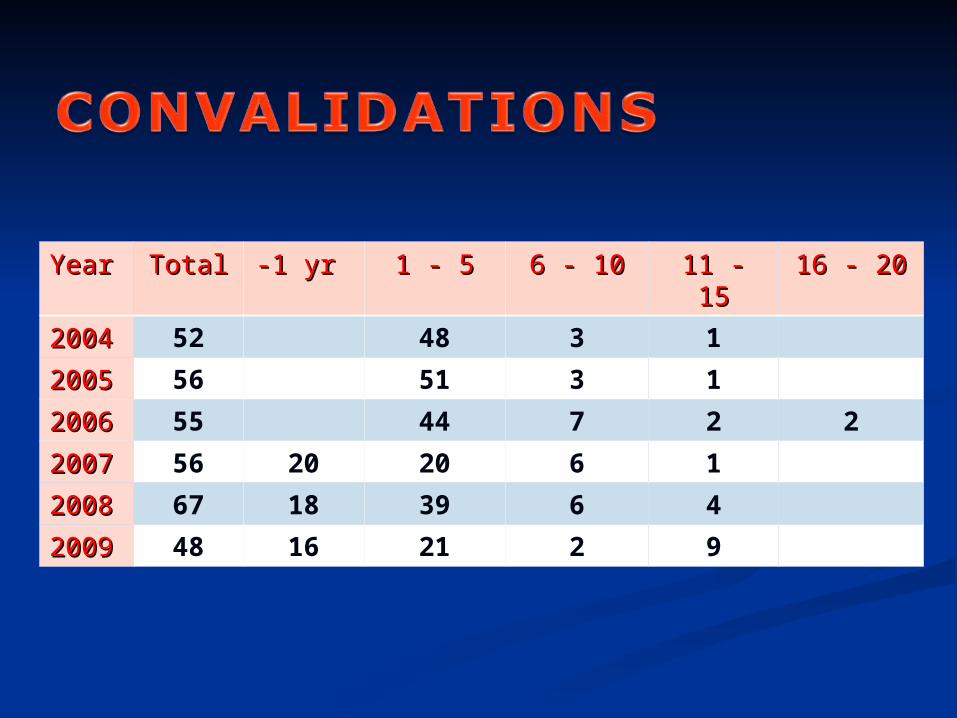
YearYear TotalTotal -1 yr -1 yr 1 - 51 - 5 6 - 106 - 10 11 - 1511 - 15 16 - 2016 - 20

20042004 52 48 3 1

20052005 56 51 3 1

20062006 55 44 7 2 2

20072007 56 20 20 6 1

20082008 67 18 39 6 4

20092009 48 16 21 2 9

Page 28: % of married population % of population NSO Census 1995 2.801.35 NSO Lifestyle 2003 3.581.40 NSO Census 2005 6.833.30 NSO Lifestyle 2007 5.413.00 Health.
Page 29: % of married population % of population NSO Census 1995 2.801.35 NSO Lifestyle 2003 3.581.40 NSO Census 2005 6.833.30 NSO Lifestyle 2007 5.413.00 Health.