© OECD/IEA – 2011 Key Insights from IEA Indicator Analysis ENERGY INDICATORS Efficient Power Generation 2011 Roundtable 4: Efficient use of energy in the end-use sector Moscow, 20 September 2011 Energy Savings Through Energy Efficiency Nathalie Trudeau International Energy Agency

© OECD/IEA – 2011 Key Insights from IEA Indicator Analysis ENERGY INDICATORS Efficient Power Generation 2011 Roundtable 4: Efficient use of energy in the.
Dec 27, 2015
Welcome message from author
This document is posted to help you gain knowledge. Please leave a comment to let me know what you think about it! Share it to your friends and learn new things together.
Transcript

© OECD/IEA – 2011
Key Insights fromIEA Indicator Analysis
ENERGY INDICATORS
Efficient Power Generation 2011Roundtable 4: Efficient use of energy in the end-use sector Moscow, 20 September 2011
Energy Savings Through Energy Efficiency
Nathalie TrudeauInternational Energy Agency
Worldwide Trendsin Energy Use and Efficiency
ENERGY
INDICATORS
© OECD/IEA - 2009© OECD/IEA – 2011
Key Insights fromIEA Indicator Analysis
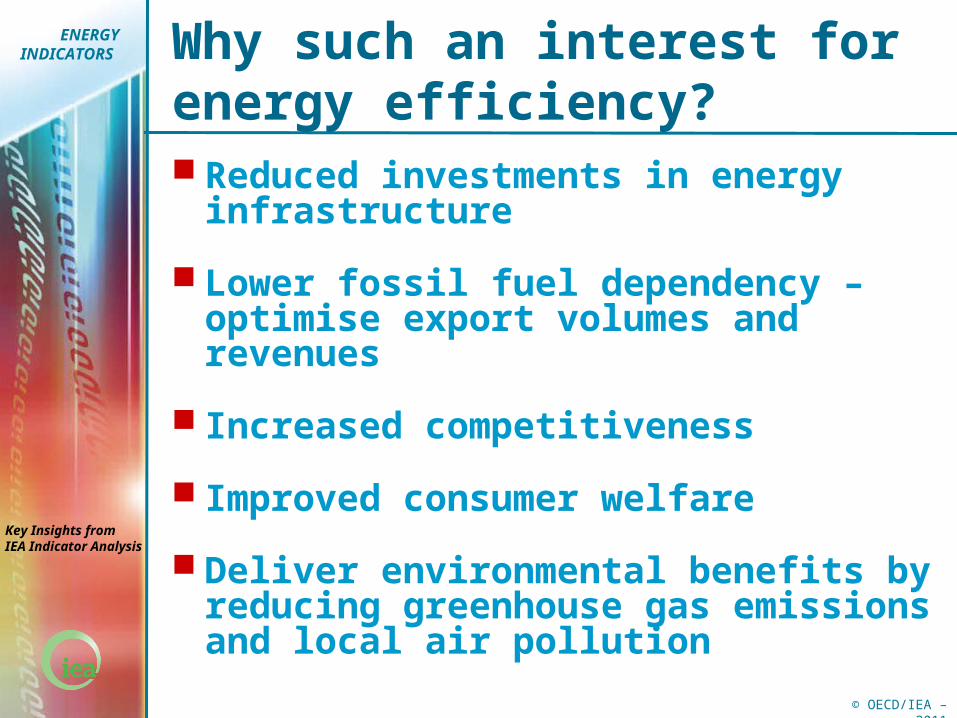
Why such an interest for energy efficiency? Reduced investments in energy
infrastructure
Lower fossil fuel dependency – optimise export volumes and revenues
Increased competitiveness
Improved consumer welfare
Deliver environmental benefits by reducing greenhouse gas emissions and local air pollution

2 0 1 0
ENERGYTECHNOLOG
YPERSPECTIV
ESScenarios &Strategiesto 2050
© OECD/IEA - 2010
Energy efficiency is a key abatement option to substantially reduce energy consumption and CO2 emissions
In the BLUE Map scenario, most of the reductions in energy-related CO2 emissions are from
improved efficiency.
Worldwide Trendsin Energy Use and Efficiency
ENERGY
INDICATORS
© OECD/IEA - 2009© OECD/IEA – 2011
Key Insights fromIEA Indicator Analysis
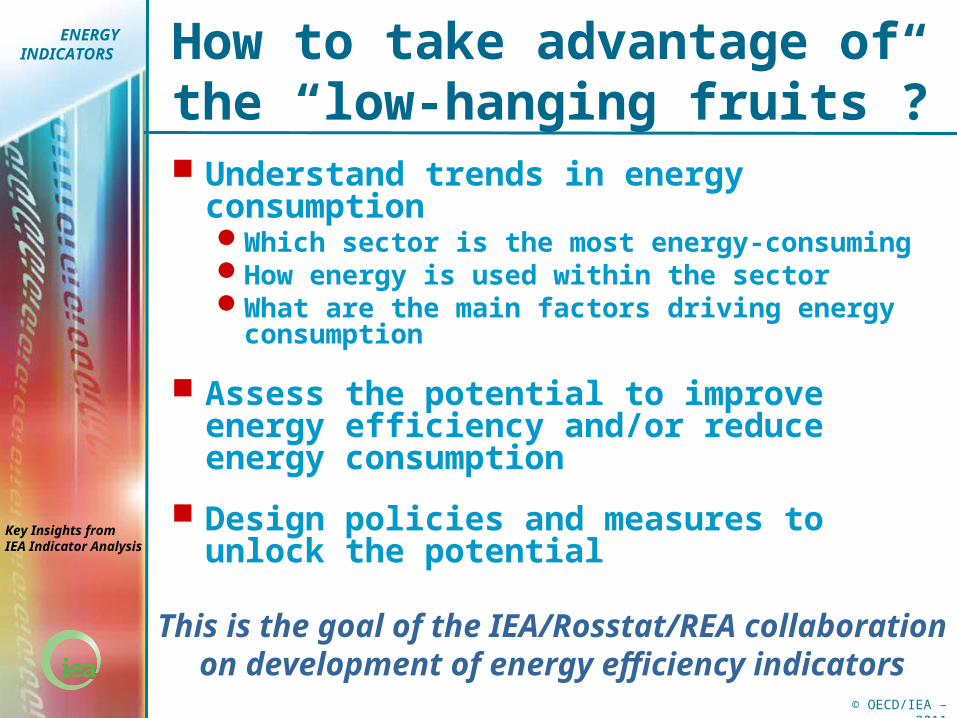
How to take advantage of the “low-hanging fruits”? Understand trends in energy
consumptionWhich sector is the most energy-consumingHow energy is used within the sectorWhat are the main factors driving energy
consumption
Assess the potential to improve energy efficiency and/or reduce energy consumption
Design policies and measures to unlock the potential
This is the goal of the IEA/Rosstat/REA collaboration on development of energy efficiency indicators
Worldwide Trendsin Energy Use and Efficiency
ENERGY
INDICATORS
© OECD/IEA - 2009© OECD/IEA – 2011
Key Insights fromIEA Indicator Analysis
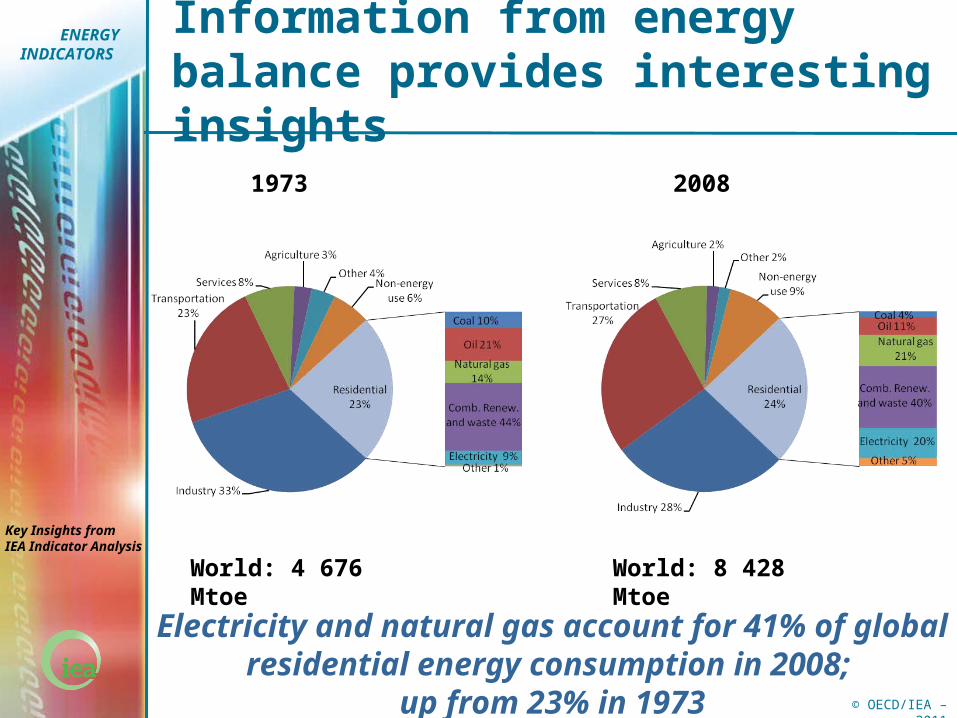
Information from energy balance provides interesting insights
1973 2008
Electricity and natural gas account for 41% of global residential energy consumption in 2008;
up from 23% in 1973
World: 4 676 Mtoe World: 8 428 Mtoe
Worldwide Trendsin Energy Use and Efficiency
ENERGY
INDICATORS
© OECD/IEA - 2009© OECD/IEA – 2011
Key Insights fromIEA Indicator Analysis
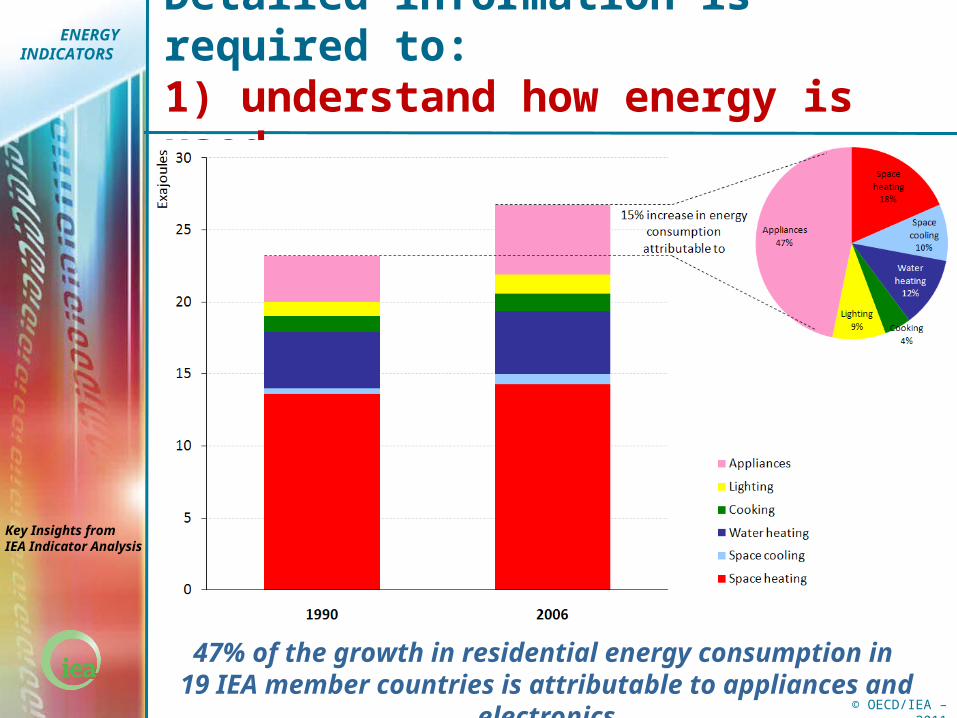
Detailed information is required to:1) understand how energy is used
47% of the growth in residential energy consumption in 19 IEA member countries is attributable to appliances and electronics
Worldwide Trendsin Energy Use and Efficiency
ENERGY
INDICATORS
© OECD/IEA - 2009© OECD/IEA – 2011
Key Insights fromIEA Indicator Analysis
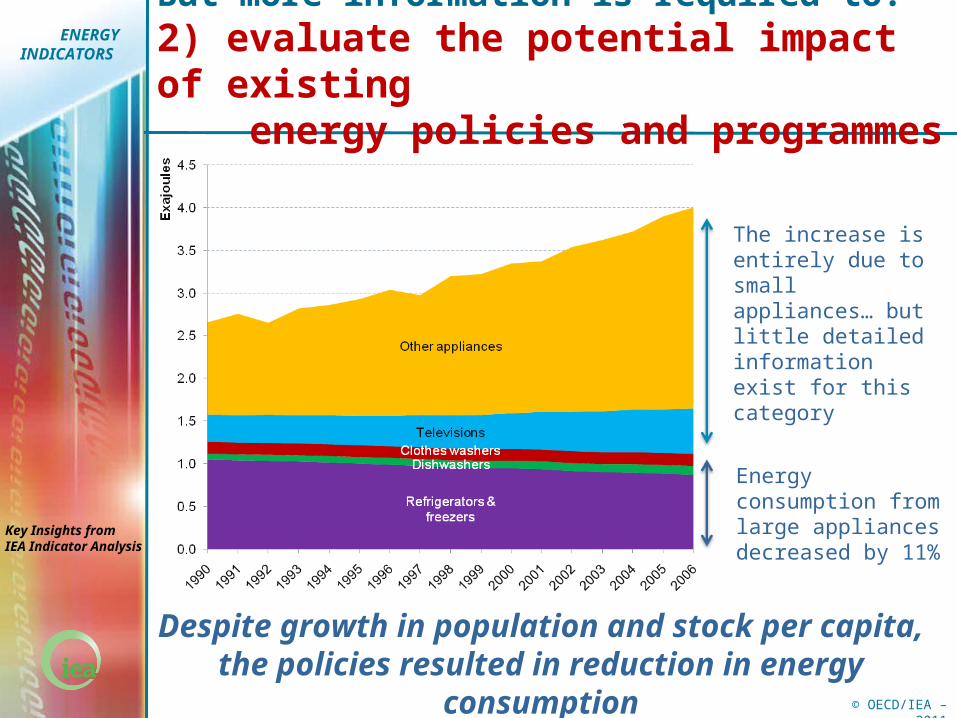
But more information is required to:2) evaluate the potential impact of existing energy policies and programmes
Energy consumption from large appliances decreased by 11%
The increase is entirely due to small appliances… but little detailed information exist for this category
Despite growth in population and stock per capita, the policies resulted in reduction in energy consumption

Worldwide Trendsin Energy Use and Efficiency
ENERGY
INDICATORS
© OECD/IEA - 2009© OECD/IEA – 2011
Key Insights fromIEA Indicator Analysis
But more information is required to:3) provide insights on the main factors influencing the trends in energy consumption
In general, higher per capita space heating energy demand – caused by fewer occupants and larger homes – was offset by an
improvement in energy efficiency

Worldwide Trendsin Energy Use and Efficiency
ENERGY
INDICATORS
© OECD/IEA - 2009© OECD/IEA – 2011
Key Insights fromIEA Indicator Analysis
But more information is required to:4) evaluate the role energy efficiency played in restraining the growth in energy consumption
Without savings from energy efficiency, energy consumption inIEA 19 would have been 13% higher in 2006

Worldwide Trendsin Energy Use and Efficiency
ENERGY
INDICATORS
© OECD/IEA - 2009© OECD/IEA – 2011
Key Insights fromIEA Indicator Analysis
Again, these indicators hide important information
High share of coal-DRI, low-quality coal and
iron ore
Low share of scrap useUse of OHF
Very high share of scrap use
Specificities of a country/an industry can explain large variations in energy intensity
Worldwide Trendsin Energy Use and Efficiency
ENERGY
INDICATORS
© OECD/IEA - 2009© OECD/IEA – 2011
Key Insights fromIEA Indicator Analysis
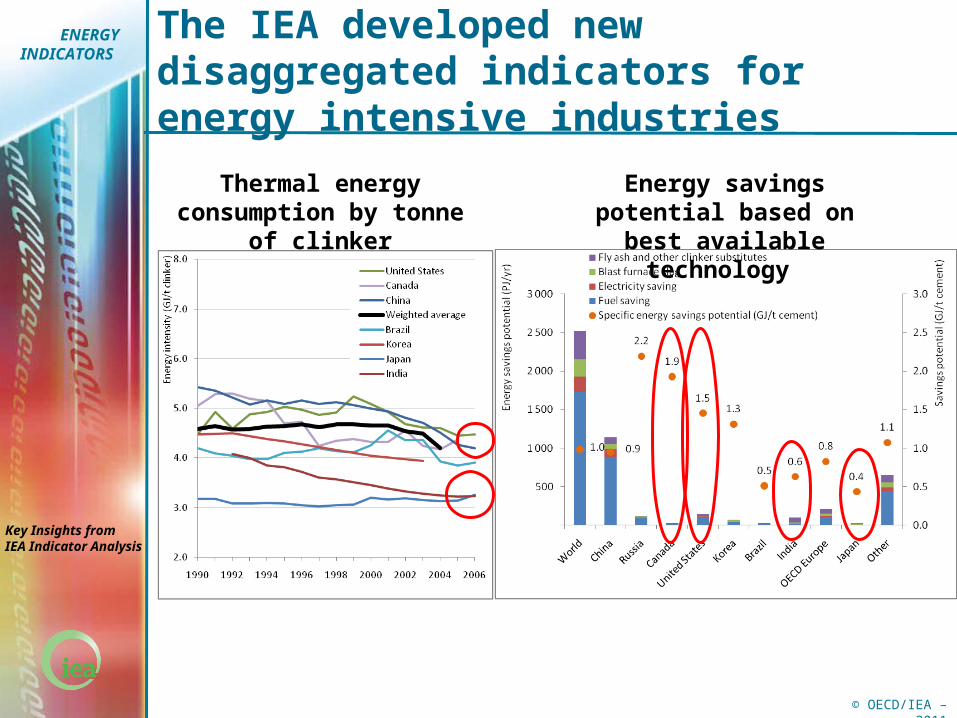
The IEA developed new disaggregated indicators for energy intensive industries
Thermal energy consumption by tonne of clinker
Energy savings potential based on best available technology

Worldwide Trendsin Energy Use and Efficiency
ENERGY
INDICATORS
© OECD/IEA - 2009© OECD/IEA – 2011
Key Insights fromIEA Indicator Analysis
They provide insights on both energy and emission savings potential
Over 400 Mt CO2 can be saved by applying best available technology in the iron and steel sector

© OECD/IEA - 2009
TOWARDSTOWARDSA MORE ENERGYA MORE ENERGY
EFFICIENT EFFICIENT FUTUREFUTURE
Applying indicators to Applying indicators to enhance energy enhance energy
policypolicy
Energy efficiency contributed to restrain the growth in energy use
0
20
40
60
80
100
120
140
160
180
1973 1980 1990 2000 2006
Actual energy use Energy savings due to efficiency improvements Energy efficiency improvements
Actual energy use
63 %
Hypothetical energy use without energy efficiency improvements
Savings
0.5%
0.7%
2.0%
1.0%
0%
1%
2%
1973-1990 1990-2006
Ave
rage
annual
per
cent c
han
ge
Without the savings from improved energy efficiency since 1973 in 11 IEA countries, energy
use would now be 63% higher.

Worldwide Trendsin Energy Use and Efficiency
ENERGY
INDICATORS
© OECD/IEA - 2009© OECD/IEA – 2011
Key Insights fromIEA Indicator Analysis
Key messages from IEA indicators work Energy efficiency can contribute to all the main
goals of energy policy Economic growth Energy security Environmental protection
Energy efficiency has shown sustained improvement over many years Results are often not visible, as offset by other
factors Rate of improvement needs to be substantially
increased
Energy efficiency is the single most important option to reduce CO2 emissions in the future Often low cost and relatively quick to implement Can buy time for less mature technologies to be
developed Barriers remain, but these can be overcome by
effective policies Requires Worldwide Implementation Now

Worldwide Trendsin Energy Use and Efficiency
ENERGY
INDICATORS
© OECD/IEA - 2009© OECD/IEA – 2011
Key Insights fromIEA Indicator Analysis
Key recommendations for Russia Improve end-use data availability to develop
indicators Build on past work on energy efficiency indicators Define priority areas Gather data available
Assessment of quality Assessment of comparability
Collect other required data Build on existing expertise (EU/Canada) and
successful projects (IEA/Mexico)
Develop indicators to understand past trends, assess potential and better support policy-making towards meeting Presidential targets and goals
Use indicators work to guide development of policy and measures
Develop tools to ensure compliance, enforcement and monitoring of energy efficiency policies

Worldwide Trendsin Energy Use and Efficiency
ENERGY
INDICATORS
© OECD/IEA - 2009© OECD/IEA – 2011
Key Insights fromIEA Indicator Analysis
Energy efficiency publications
Soon available in Russian at IEA Russian-
language web-site
Related Documents


