© OECD/IEA - 2010 Meeting Global Energy Challenges through Technology Leeds University, 21 March 2012 Ambassador Richard Jones Deputy Executive Director, IEA

© OECD/IEA - 2010 Meeting Global Energy Challenges through Technology Leeds University, 21 March 2012 Ambassador Richard Jones Deputy Executive Director,
Dec 14, 2015
Welcome message from author
This document is posted to help you gain knowledge. Please leave a comment to let me know what you think about it! Share it to your friends and learn new things together.
Transcript
© OECD/IEA - 2010
Meeting Global Energy Challenges through
Technology Leeds University, 21 March 2012
Ambassador Richard JonesDeputy Executive Director, IEA

2 0 1 0
ENERGYTECHNOLOG
YPERSPECTIV
ESScenarios &Strategiesto 2050
© OECD/IEA - 2010
The context
The world needs an energy technology revolution to satisfy its energy needs in ways that are secure, affordable and sustainable.
Unprecedented rates of change in new technology uptake will be needed
There are some early signs of progress, but much more needs to be done.
Which technologies can play a role?
What are the costs and benefits?
What policies are needed?

2 0 1 0
ENERGYTECHNOLOG
YPERSPECTIV
ESScenarios &Strategiesto 2050
© OECD/IEA - 2010
Global energy-related CO2 emissions in the Baseline and BLUE Map scenarios
0
10
20
30
40
50
60
2007 2030 2050 2030 2050
Baseline BLUE Map
Gt
CO 2
Other
Buildings
Transport
Industry
Other transformation
Power generation
Global CO2 emissions double in the Baseline, but in the BLUE Map scenario abatement across all sectors reduces emissions to half 2005 levels by 2050.

2 0 1 0
ENERGYTECHNOLOG
YPERSPECTIV
ESScenarios &Strategiesto 2050
© OECD/IEA - 2010
World energy-related CO2 emissions abatement by region
In the BLUE Map scenario, most of the reductions in energy-related CO2 emissions are in non-OECD countries.
51015202530354045505560
2010 2015 2020 2025 2030 2035 2040 2045 2050
Gt C
O2
Other Non-OECD 19%
Other OME 14%
India 12%
China 27%
Other OECD 10%
OECD Europe 7%
United States 11%BLUE Map emissions 14 Gt
Baseline emissions 57 Gt
ETP2010 analysis WEO 2009 450 ppm case

2 0 1 0
ENERGYTECHNOLOG
YPERSPECTIV
ESScenarios &Strategiesto 2050
© OECD/IEA - 2010
Key technologies for reducing global CO2 emissions
A wide range of technologies will be necessary to reduce energy-related CO2 emissions substantially.
0
5
10
15
20
25
30
35
40
45
50
55
60
2010 2015 2020 2025 2030 2035 2040 2045 2050
Gt C
O 2 CCS 19%
Renewables 17%
Nuclear 6%
Power generation efficiency and fuel switching 5%End-use fuel switching 15%
End-use fuel and electricity efficiency 38%
BLUE Map emissions 14 Gt
Baseline emissions 57 Gt
WEO 2009 450 ppmcase ETP2010 analysis
2 0 1 0
ENERGYTECHNOLOG
YPERSPECTIV
ESScenarios &Strategiesto 2050
© OECD/IEA - 2010
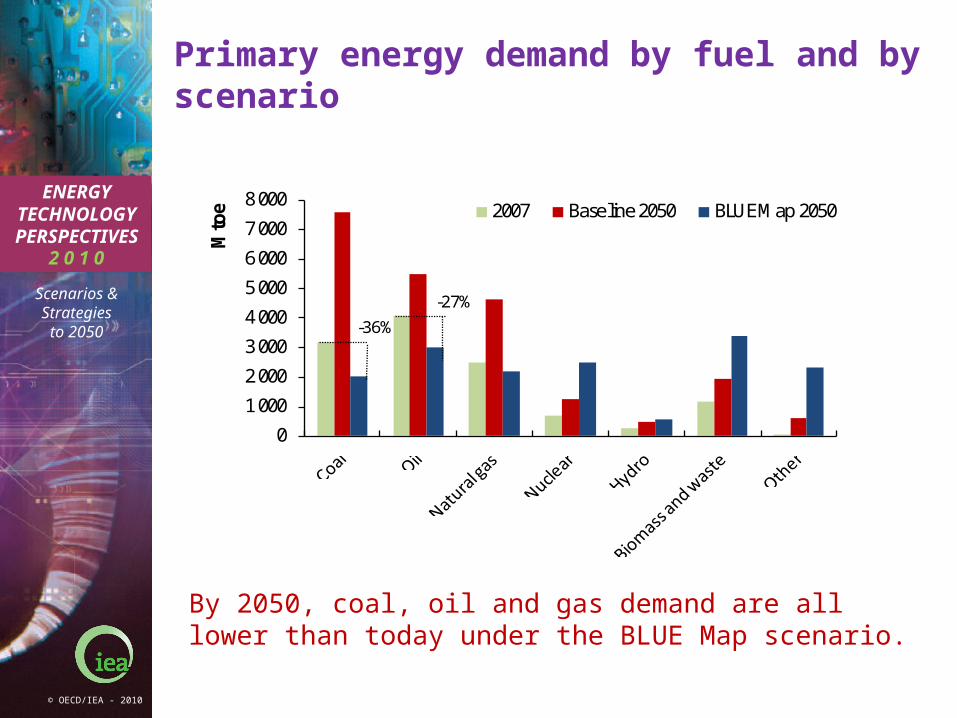
Primary energy demand by fuel and by scenario
By 2050, coal, oil and gas demand are all lower than today under the BLUE Map scenario.
0
1 000
2 000
3 000
4 000
5 000
6 000
7 000
8 000M
toe 2007 Baseline 2050 BLUE Map 2050
-27%
-36%

2 0 1 0
ENERGYTECHNOLOG
YPERSPECTIV
ESScenarios &Strategiesto 2050
© OECD/IEA - 2010
Decarbonising the power sector – a new age of electrification?
A mix of renewables, nuclear and fossil-fuels with CCS will be needed to decarbonise the electricity sector.
0
5
10
15
20
25
30
35
40
45
50
2007 Baseline 2050 BLUE Map 2050
BLUE High Nuclear 2050
BLUE High Ren 2050
PWh
Other
Solar
Wind
Biomass+CCS
Biomass and waste
Hydro
Nuclear
Natural gas+CCS
Natural gas
Oil
Coal+CCS
Coal

2 0 1 0
ENERGYTECHNOLOG
YPERSPECTIV
ESScenarios &Strategiesto 2050
© OECD/IEA - 2010
Average annual electricity capacity additions to 2050, BLUE Map scenario
Annual rates of investment in many low-carbon technologies must be massively increased from today’s levels.
0 10 20 30 40 50
Solar CSP
Solar PV
Geothermal
Wind-offshore
Wind-onshore
Biomass plants
Hydro
Nuclear
Gas-fired with CCS
Coal-fired with CCS
GW/ yr
Present rate Gap to reach BLUE Map
30 plants (1 000 MW)
200 plants (50 MW)
12 000 turbines (4 MW)3 600 turbines (4 MW)
45 units (100 MW)
55 CSP plants (250 MW)
325 million m2 solar panels
2/3 of Three Gorges Dam
35 plants (500 MW)
20 plants (500 MW)Historical high

2 0 1 0
ENERGYTECHNOLOG
YPERSPECTIV
ESScenarios &Strategiesto 2050
© OECD/IEA - 2010
Smart grid CO2 reductions in 2050
Smart grids allow better management of the grid and can facilitate the deployment of low-carbon technologies, such as renewables and electric vehicles.
0.00
0.25
0.50
0.75
1.00
1.25
1.50
1.75
2.00
2.25
2.50
Direct reductions Enabled reductions
Greater integration of renewables
Facilitation of electric vehicles and plug-in electric vehicles
Energy savings from peak load management
Continuous commissioning of service sector loads
Accelerated deployment of energy efficiency programs
Reduced line losses (voltage control)
Direct feedback on energy usage
0.34- 0.69
0.31- 0.62
0.09- 0.27
0.03- 0.25
0.01- 0.05
0.00- 0.01
0.07- 0.27
Gt
CO2
/ yr

2 0 1 0
ENERGYTECHNOLOG
YPERSPECTIV
ESScenarios &Strategiesto 2050
© OECD/IEA - 2010
Evolution of light-duty vehicle sales by technology
Baseline scenario BLUE Map scenario
In the BLUE Map scenario advanced technologies, such as plug-in hybrid, all-electric and fuel-cell vehicles, dominate sales after 2030.
0
20
40
60
80
100
120
140
160
180
200
2000 2010 2020 2030 2040 2050
mill
ion
sale
s/ y
r
20
40
60
80
100
120
140
160
180
200
2000 2010 2020 2030 2040 2050
Hydrogen fuel cell
Hydrogen hybrid
Electricity
CNG and LPG
Plug-in hybrid diesel
Plug-in hybrid gasoline
Hybrid diesel
Hybrid gasoline
Diesel
Gasoline

2 0 1 0
ENERGYTECHNOLOG
YPERSPECTIV
ESScenarios &Strategiesto 2050
© OECD/IEA - 2010
Additional investment and fuel savings, 2010-2050
Even using a 10% discount rate, fuel savings in the BLUE Map scenario more than offset the additional investment required.
-140
-120
-100
-80
-60
-40
-20
0
20
40
60
Inve
stm
ent
Fuel
savi
ngs
USD
trill
ion
(201
0-205
0)
Commercial
Residential
Transport
Industry
Power distribution
Power transmission
Power generation
Biomass and waste
Natural gas
Oil
Coal
Und
isco
unte
d
3% d
isco
unt
10%
dis
coun
t
Total

2 0 1 0
ENERGYTECHNOLOG
YPERSPECTIV
ESScenarios &Strategiesto 2050
© OECD/IEA - 2010
Key Technology Needs
We will move toward ever more electrification, and greater use of variable renewable power sources
Need much smarter grid management and end use signals
There are really only 3 potential zero carbon energy carriers: electricity, hydrogen, biofuels
Two of these face enormous challenges
Coal‘s use in power generation and industry will remain high for decades – we must make progress on deploying CCS

2 0 1 0
ENERGYTECHNOLOG
YPERSPECTIV
ESScenarios &Strategiesto 2050
© OECD/IEA - 2010
ETP 2012 Early release at CEM3
Clean Energy Progress Report 2011
Will be updated and improved in 2012Featured as ETP 2012 early release
February 25-26 2011
© OECD/IEA 2012
Energy technology roadmaps
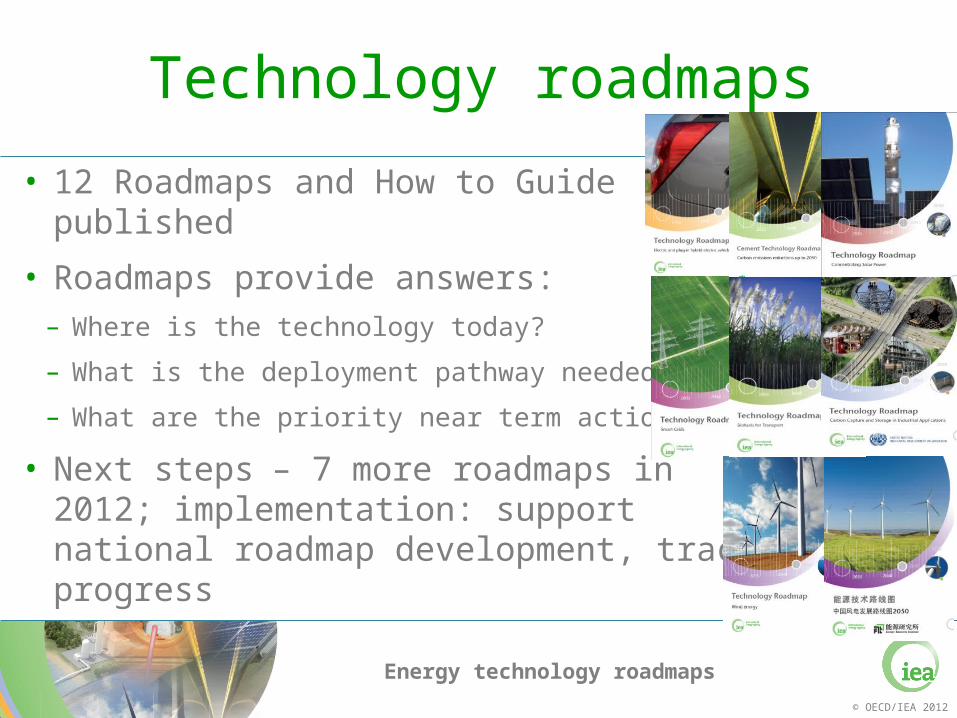
Technology roadmaps
• 12 Roadmaps and How to Guidepublished
• Roadmaps provide answers:– Where is the technology today?
– What is the deployment pathway needed?
– What are the priority near term actions?
• Next steps – 7 more roadmaps in 2012; implementation: support national roadmap development, track progress

2 0 1 0
ENERGYTECHNOLOG
YPERSPECTIV
ESScenarios &Strategiesto 2050
© OECD/IEA - 2010
1. How2Guide (H2G) • Stakeholder engagement• Capture knowledge• Develop the tools
2. Dialogue workshops • Disseminate H2G content• International best practice• Case studies
3. Training • Bi-lateral• Multi-lateral• Train The Trainer (T3)
4. Roadmap development • Indirect support• Direct support
Tech- Platform Activities
© OECD/IEA 2012
Energy Technology RoadmapsRegional & National level

2 0 1 0
ENERGYTECHNOLOG
YPERSPECTIV
ESScenarios &Strategiesto 2050
© OECD/IEA - 2010
GLOBAL ENERGY R&D NETWORK
©OECD/IEA 2011
5,000 scientists, experts, researchers, consultants
500 universities, labs, government offices, companies,
consultants
Link public and private
Link IEA members and non-members

2 0 1 0
ENERGYTECHNOLOG
YPERSPECTIV
ESScenarios &Strategiesto 2050
© OECD/IEA - 2010
Thank You
www.iea.org/techno/etp/index.asp
Related Documents