EMIGRATION.OF INDIAN WORKERS TO UNITED STATES OF AMERICA PART I: EMPIRICAL FACTS by * Somesh Das Gupta University of Minnesota and Indian Statistical Institute Technical Report No. 402 July 1982 --Privileged Circulation. --Not to be used or quoted without the author's permission until the report is published. --Your conunents are welcome.· *Partly supported by NSF Grant No. MSC8202209.

Welcome message from author
This document is posted to help you gain knowledge. Please leave a comment to let me know what you think about it! Share it to your friends and learn new things together.
Transcript
EMIGRATION.OF INDIAN WORKERS
TO UNITED STATES OF AMERICA
PART I: EMPIRICAL FACTS
by
* Somesh Das Gupta
University of Minnesota
and
Indian Statistical Institute
Technical Report No. 402
July 1982
--Privileged Circulation. --Not to be used or quoted
without the author's permission until the report is published.
--Your conunents are welcome.·
*Partly supported by NSF Grant No. MSC8202209.
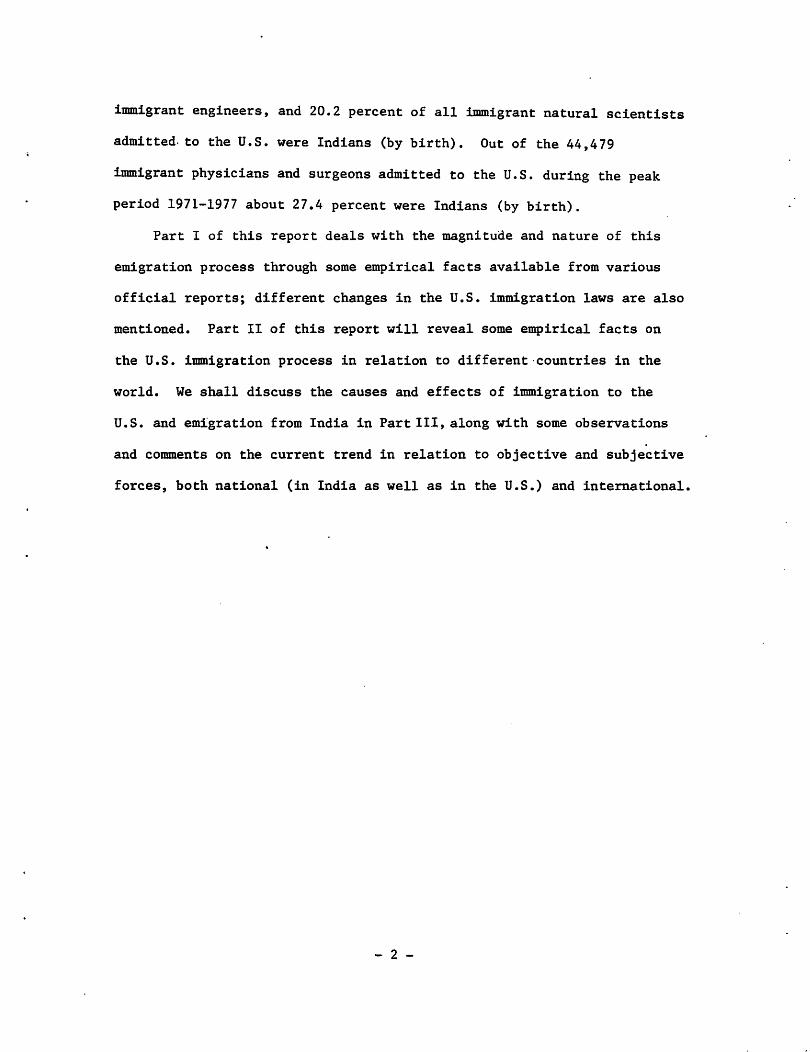
immigrant engineers, and 20.2 percent of all immigrant natural scientists
admitted. to the U.S. were Indians (by birth). Out of the 44,479
immigrant physicians and surgeons admitted to the U.S. during the peak
period 1971-1977 about 27.4 percent were Indians (by birth).
Part I of this report deals with the magnitude and nature of this
emigration process through some empirical facts available from various
official reports; different changes in the U.S. immigration laws are also
mentioned. Part II of this report will reveal some empirical facts on
the U.S. immigration process in relation to different-countries in the
world. We shall discuss the causes and effects of immigration to the
U.S. and emigration from India in Part II.I, along with some observations
and comments on the current trend in relation to objective and subjective
forces, both national (in India as well as in the U.S.) and international.
- 2 -

Introduction
The large-scale emigration of professional and technical workers from
the so-called under-developed countries to the industrially developed
capitalist countries, especially the U.S., has become a significant char
acteristic of the international division of labor after World War II.
This movement reflects the change in the organic composition of capital, and
the problems regarding valorization and accumulation of capital as well as
the reproduction of professional labor power in the capitalist metropolitan
centers on the one hand, and the social, economic and political development
in the countries peripheral and semi-peripheral in the capitalist world on
the other.
In this report we shall study this process, focusing our attention on
the emigration of professional and technical workers from India to the U.S.
The 1965 U.S. Immigration Act has led to the immigration of about 182,000
Indians to the U.S. during 1966-79. During 1966-79, about 68,000
Indian professional and technical workers immigrated to the U.S., a
total surpassed only by the Filipinos. India's contribution to the total
pool of professional and technical workers admitted to the U.S. as immigrants
during 1970-77 was 14.2 percent, while only 3.78 percent of all immigrants
admitted in that period were Indians by birth. Even in 1978-79 about 8,400
Indian professional and technical workers immigrated to the U.S., and the
total number of Indian immigrants to the U.S. exceeded 40,000 during this
two-year period. During 1966-79 more than 18,000 engineers, 6,000 scientists,
and 11,400 physicians and surgeons emigrated to the U.S. from India, and India
was the topmost source for immigrant scientists, engineers, and physicians
and surgeons in the U.S. Between 1969 and 1978 about 24.2 perceat cf all
- 1 -

During 1901-1950 about 11,000 Indians immigrated to the U.S. The
1952 U.S. Immigration Act gave preferences to professional workers of high
abilities. Moreover, as a result of implementing the Refugee Immigration
Act after the Second World War many European quotas were unfilled. These
two Acts led to an increase in the number of Indian imm~grants to the U.S.
About3,100Indians immigrated to the U.S. during 1951-60 and about 3,300
during 1961-65.
The large-scale emigration of Indians to the U.S. essentially started
since 1969, as a result of the 1965 U.S. Immigration Act (fully effective
after 1968). The 1965 Act replaced the nationality-quota system by the
preference system, mainly classified into "relative preferences'·' (74% of
over-all limitation), "occupational preferences" (20% of over-all limitation),
and the preference for refugees (6%); the upper limit of the number of
immigrants from any country in the Eastern.Hemisphere was set at 20,000, the
total number for. this Hemisphere being 170,000. The total ceiling for
the Western Hemisphere was set at 120,000, and the preference.system became
applicable to this Hemisphere since 1976. The preference system is now
applicable to the global quota of 290,000 following the 1978 amendment.*
During the early phase 1966-69 about 17,700 Indians immigrated to
the U.S., but the total number increased to about 83,000 in the next six
years. Although the problems of "brain drain" were extensively discussed
in the international circles, the number of Indian immigrants to the U.S.
gradually increased; about 81,200 Indians immigrated to the U.S. during
1976-79, and about 22,000 of these Indians were listed as professional and
*Currently the world-wide quota under different preference categories is .limited to 270,000 annually, of which 80% are allocated to relative preferences and 20% to occupational preferences. Special immigrants, "Immediate Relatives" of U.S. citizens, and refugee immigrants are exempt from numerical limitation.
- 4 -

Part I: Empirical Facts
1. Number of Immigrants. First we shall discuss the historical
process which eventually led to the present trend of emigration of Indian
workers to the U.S. Although over 19 million people, mostly blue-collar
workers, immigrated to the U.S. in the last century, the participation of
Indians in that process was negligible; only 696 Indians immigrated to the
U.S. during 1820-1900. Indian labor was then under the British colonial
power which was responsible for organizing the emigration of Indian (inden
tured) labor to the (former) British colonies, especially to the West Indies
and British Guinea.
The early part of this century was the peak period for the influx of
innnigrants to the U.S., and in several years during that period the annual
flow of immigrants exceeded one million. Out of a total of 8.8 million
immigrants admitted to the U.S. during 1901-10 only 4,700 were Indians.
Although about 347,000 Chinese immigrated to the U.S. during 185~-1920
and 242,000 Japanese in 1881-1920, their immigration was restricted
firstly by the "Chinese Exclusion Act" (1882), then by the "Gentlemen's
Agreement" (1907) with Japan, and lastly by the 1917 U.S. Iunnigration Act
which declared natives of a geographical area called the "barred zone" (which
included India besides most of the Asian countries) inadmissible.
Immigration of Indians to the U.S. was furthermore restricted by the
1921 Immigration Quota Law (modified later in 1924 and 1929) which determined
the limit on the numb.er of immigrants of any nationality as 2-3 percent of
the number of foreign-born in the U.S. of that nationality determined in a
previous census (1890/1910). This law was applicable only to Eastern
Hemisphere, for which. the total annual quota was set at 150,000. The
total quota for all the Asian countries was less than 3,000, and the
quota for India was only 100.
- 3 -

•
Table la. Number of Indians Admitted to the U.S. as Immigrants. 1951-79:
By Birth, by LPR and by the State of Chargeability(in thousands.
Immigrant 1951-65 1966-69 Indians
1970-75 1976-77* 1978-79 1966-791
By birth 6.5 17.7 83.0 . 40. 7 40.5 .. By last permanent residence 4.6 15.8 75.4 37.1 37.8
By state of chargeability 1.3 15.5 78.9 38.5 36.4
* Includes July 1, 1975 to Sept. 30, 1977 (2.25 years).
Note: During 1966-79 about 7.4% of Indian (by birth) immigrants were exempt from numerical limitation--12% in 1979.
Source: I.N.S. Annual Reports, U.S. Government.
181.9
166.l
I '
169.3 I I
I
It is not known how many Indian immigrants to the U.S. went back to
India or to other countries; the U.S. government does not keep emigration
statistics. According to the Alien Address Report (U.S.) the number of
Indian citizens in the U.S. increased from 5,089 in 1966 to 125,630 in 1979
including 113,879permanent residents; about 130,000 Indians were recorded
in the 1980 Alien Address Report. According to the 1980 U.S. Census, the
number of Asian Indians residing in the U.S. was 361,544 (1.6 percent of the
U.S. population); about one-fourth. of these Indians lived in N.Y. and N.J.
Immigrant Indians are becoming U.S. citizens at a rather slow rate;
the following table gives the trend. About 30,000 Indians became
U.S. citizens during 1971-79.
Table 2. Number of Indians Naturalized in the U.S., 1948-79.
Period 1948-65 1966-71 1972-76 1977 1978 1979 1948~79
Number 1,772 1,941 11,450 5,574 6,477 6,001 33,215
SourceJ I.N.S. Annual Reports, U.S. Government.
- 6 -
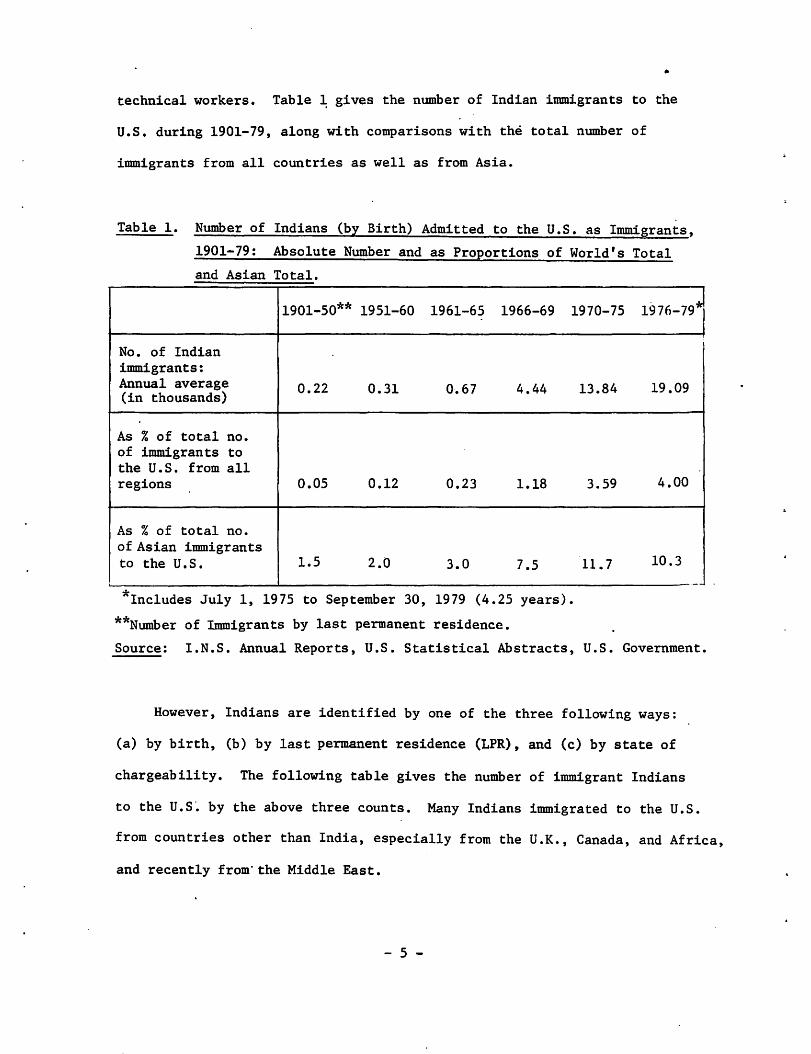
technical workers. Table~ gives the number of Indian inunigrants to the
U.S. during 1901-79, along with comparisons with the total number of
immigrants from all countries as well as from Asia.
Table 1. Number of Indians (by Birth) Admitted to the U.S. as Immigrants,
1901-79: Absolute Number and as Proportions of World's Total
and Asian Total.
1901-SO** 1951-60 1961-65 1966-69 1970-75 1976-79*
No. of Indian immigrants: Annual average 0.22 0.31 0.67 4.44 (in thousands)
As% of total no. of immigrants to the U.S. from all regions a.as 0.12 0.23 1.18
As % of total no. of Asian immigrants to the U.S. 1.5 2.0 3.0 7.5
*Includes July 1, 1975 to September 30, 1979 (4.25 years).
**Number of Immigrants by last permanent residence.
13.84 19.09
3.59 4.00
11. 7 10.3 ,_
Source: I.N.S. Annual Reports, U.S. Statistical Abstracts, U.S. Government.
However, Indians are identified by one of the three following ways:
(a) by birth, (b) by last permanent residence (LPR), and (c) by state of
chargeability. The following table gives the number of immigrant Indians
to the U.S~ by the above three counts. Many Indians immigrated to the U.S.
from countries other than India, especially from the U.K., Canada, and Africa,
and recently from·the Middle East.
- 5 -

PTK immigrants in 1970-77 came from Asian countries, mainly from the Philipines,
India, China (Taiwan), and Korea (South). Moreover, the annual flow (on
the average) of PTK immigrants to the U.S. increased from 26,128 in 1961-65
(9 percent of total) to 42,150 in 1966-77 (10.8 percent of total). During
1978-79, out of 88,374 PTK immigrants, 51.7% were Asians of whom 9.5% were
Indians; the percentage shares of Canada and Central America increased.
About 264 PTK Indians immigrated to the U.S. per year in 1961-65, but
that annual figure increased to 4,855 in 1966-77. While 10.8 percent of
all immigrants admitted to the U.S. in.the period 1966-77 were classified
as PTK workers, about 50.6 percent of all Indian immigrants admitted in
1966-69 and 40.8 percent of all Indian immigrants admitted in 1970-77 were
PTK workers. About 14.2 percent of all PTK immigrants admitted to the U.S.
in 1970-77 were Indians, whereas only 3.78 percent of all innnigrants admitted
in this period were Indians (by birth). Table 3 gives the trend
and distribution of the influx of the PTK immigrants to the U.S. during the
period 1961-79.
During 1966-79 about 77.1 percent of all immigrant Indian workers
(declaring some occupations) were PTK, whereas this percentage was 25.3 for
inmdgrants from all regions combined. There was a minor change in the
occupational distribution of Indian immigrants in the late seventies--the
percentage of immigrants with no occupations (wives, children) increased,
and so did the percentage of immigrants in the white-collar jobs other than
PTK. This was due to the fact that a large proportion of Indians were
admitted to the U.S. under relative preferences in the late seventies; many
Indian immigrants after being naturalized in the U.S., brought their parents
- 8 -

2. Occupations of Indian Innnigrants. Before 1952, the U.S. immigration
laws were not explicitly designed to import professional and technical workers.
However, the political and economic instability in Europe before and after
the First World War led to a major influx of European professionals to the
U.S.; besides this, the influence of the Russian Revolution was also signifi
cant. Later the outgrowth of the Nazi forces in Germany and Eastern Europe
was also responsible for the emigration of many European professionals
(especially Jews) to the U.S. On the average, about 621,000 people
immigrated to the U.S. per year during 1901-1930, and only 1.7 percent of
them were classified as "professional, technical and kindred" (PTK) workers.
Due to the economic depression in the U.S. only 52,700 people immigrated
to the U.S. annually in the next 11 years, but 7.7 percent of them were
PTK workers.
The influx of PTK workers to the U.S. considerably increased after
the Second World War; during 1946-55 about 13,600 PTK workers (7.0 percent
of the total) immigrated to the U.S. per year. The 1965 Act not only
led to a considerable increase in the number of immigrants from the Asian
countries (especially from the Philipines, India, Taiwan, and Korea), but
also the number of immigrant PTK workers (especially from the under-developed
countries) increased substantially.
Before 1945 almost all the immigrant PTK workers came from Europe or
Canada; this trend more or less continued until 1965, although after the
Second World War Latin American countries and ehe West Indies also
contributed significantly to the pool of PTK immigrants to the U.S. During
1961-65 about 61.3 percent of PTK immigrants came from Europe and Canada, but
this share reduced to only 21.5 percent in 1970-77. Over 59 percent of the
- 7 -

and brothers and sisters, who were not necessarily professional or tech
nical workers. Table 4 shows the occupation-distribution of the Indian
immigrants admitted in 1966-79.
Table 4. Occupational Distribution of Indians (by birth) Admitted to the
U.S. as Immigrants, 1966-79.
Indian Immigrants All Percentage Distribution 1966-79* innnigrants;
Occupation
1966- 1970- 1976-1969 1975 1977
Professional, techni-cal & kindred (PTK) 50.6 44.3 33.7
Managers and admini-strators excl.farm (MA) 1.3 2.0 4.2
Sales workers (SW) 0.4 0.5 0.9
Clerical & kindred(CK) 2.4 2.2 3.1
Craftsmen & kindred 1.1 1.2 1.6
Operatives 0.5 0.8 1.4
Laborers excl. farm 0.2 0.2 0.2
Farmers and farm managers 0.6 0.0 0.1
Farm laborers & foremen 0.3 0.2 0.9
Service workers excl. private household 0.6 0.8 0.8
Service workers -private household 0.4 0.2 0.2
No occupation 41.6 47.5 52.8
Total 100.0 100.0 100.0
*Includes the Transition Quarter, 1976.
**July 1, 1965 to Sept. 30, 1979.
1978-1979
20.8
5.1
1.0
3.3
1.5
1. 6
0.2
0.2
2.1
0.8
0.2
63.1
100.0
1966-79**
Total % 1Total(i~ % thou- ! ; _§>ands)
I I I
67,894 37.3 604.7 10.4
I 5,658, 3.11 150.1 2.6 i 1,235 0.7 54.6 0.9 I I 4,865 2.7 239.8 4.1
2,449 1.31 312.5 5.4
1,934 I 1. l 134,4 5.7
383 I
203.7 o. 2; 3.5 :
I i
290 0.2 22.9 0.4 I
1,482 0.8 9l.8 1.6
1,439 0.8 212.5 3.6
445 0.2 161.4 2.8
93,827 51.6 3,445.5 59.0
I I I ,-,181,901,100.0 5,834.0 100.0
----· _, - -·
Source: I.N.S. Annual Reports, U.S. Government.
- 10 -

Table 3. Number of PTK Immigrants Admitted to the U.S., 1961-79.
1961-65 1966-69 Country/Region
(by birth) As% of Annual total no. Annual average % of immig. average %
All countries 26, 128 100.0 9.0 40,218 100.0
Europe 11,992 45.9 9.7 13,117 32.6
Asia 2,523 9.7 11.7 12,741 31.7
India 264 1.0 39.3 2,244 5.6
Canada 4,025 15.4 11.5 3,340 8.3
N. America excl. Canada 4,445 17.0 5.3 7,130 17.7
S. America 2,536 9.7 10. 7 2,324 5.8
Africa 409 1.6 15. 7 1,153 2.9
Oceania 196 0.8 15.0 413 1.0
1973-77* 1978-79
Country/Region As % of (by birth) Annual total·no. Annual average % of immig. average %
All countries 40,304 100.0 9.9 44,187 100.0
Europe 7,528 18.7 9.7 7,576 17.1
Asia 23,740 58.9 17.0 22,858 51.7
India · 5,641 14.0 36.0 4,208 9.5
Canada 1,222 3.0 13.7 2,321 5.3
N. America excl. Canada 3,981 9.9 2.7 6,122 13.8
S. America 1,612 4.0 6.2 2,496 5.6
Africa 1,719 4.3 22.7 2,272 5.1
Oceania 502 1.2 14.4 542 1.2
*Includes the transition quarter July 1-Sept. 30, 1976. 1966-79: July 1, 1965 - Sept. 30, 1979. Source: Annual Reports of the I.N.S., U.S. Government.
- 9 -
1970-72
As % of total no. Annual of immig. average %
10.7 47,963 100.0
10.0 8,686 18.1
22.2 28,446 59.3
50.6 6,962 14.5
13.6 1,539 3.2
5.4 4,631 9.6
10.5 1,694 3.5
25.2 2,411 5.0
18.1 554 1.2
1966-79
As% of total no. Annual of immig. average %
8.3 42,437 100.0
11.3 9,347 22.0
10.4 21,520 50. 7
20.8 4,765 11.2
15.2 2,037 4.8
3.5 5,302 12.5
6.5 1,953 4.6
18.6 1,783 4.2
12.2 494 1.2
As% of total no. of immig.
12.8
8.6
26.9
50.5
12.2
3.7
8.2
33.6
17.7
I As% of
total no. of immig.
10.4
9.8
17.7
37.3
13.6
3.7
7.8
24.4
15.3

Table 5. Number of PTK Indians (by LPR) and Indian Students (by LPR) Admitted· to the U.S. as Immigrants, 1969-79: by Major Occupational Groups.
Occupation '69 '70 '71 '72 '73 '74 '75 '76
PTK-total 2,493 4,466 6,822 7,238 4,183 4,194 5,427 5.659 Accountants
& Auditors 61 161 296 346 106 116 102 100 Architects 37 . 103 117 132 52 42 57 27 _Engineers 1,119 2,347 3,254 2,502 636 663 973 892 Physicians & Surgeons 129 242 821 1,513 1,630 1,049 1,357 1,611
Registered Nurses 60 69 169 536 594 827 1,289 1,236
Scientists-Life, Physical, & Math 187 359 615 625 211 219 245 272
Social Scientists 29 62 58 48 . 13 49 46 35
Teachers-Colleges & Universi-ties:total 220 236 345 205 52 94 98 94 Natural Science 83 82 127 75 14 17 17 15
Social Science 24 37 21 22 6 5 10 7
Engineer-ing 22 21 15 13 5 6 7 8
Teachers- . Schools 240 373 421 401 205 167 179 178
Computer Special-ists - - - - - 48 86 82
Pharmacists 22 36 59 95 115 104 173 210 Technicians 84 102 139 183 147 387 327 340 Students 205 332 376 443 564 752 ]~002 1,220 Note: 1969-79: Total Immig. Indians (by LPR) = 155,527;
Total PTK Immig. Indians (by birth)= 61,807
TQ '77 '78 '79 '76
1.331 4.766 4.084 3.246
42 137 182 164 6 26 38 26
251 782 1,148 1,040
264 1,567 596 475
281 410 122 92
l
75 327 373 j 173
12 38 39 30
28 93 138 117
8 10 21 16
1 5 10 7
2 8 5 10
59 182 268 269
19 65 102 103 61 249 131 84 90 290 . 299 221
383 1,664 2,222 2,296 ..
Source: I.N.S. Special Reports, U.S. Government (through personal connnunication1
1969-79
53.909
1,813 663
15,607
11,254
5,685
3,681
459
1,720
485
155
122
2,942
505 1,339 2,609
11,459
immigrant scientists and engineers. Tables 6(a) and 6(b) give the number of
scientists, e~gineers, and physicians and surgeons admitted to the U.S. during
1962-79 as immigrants along with the corresponding figures for Asian and
Indian immigrants.
Table 6a. Number of Indian Scientists, Engineers, and Physicians and Surgeons Admitted to the U.S. as Immigrants, 1966-78.
E NS ss cs PS Indians by LPR 17,302 4,794 675 300 11,002 Indians by birth 18,357 5,740 795 346 13,766
-. 12 -

It may be added that 41 percent of the 5.8 million immigrants admitted
during 1966-79 reported some occupations; moreover, 40.9 percent of these
immigrant workers (having occupations) were recorded as white-collar, and
25.3 percent as PTK. It is important to note that the percentage of PTK
workers among all employed persons in the U.S. increased from 12.5 in 1965
to 16.0 in 1980, and the percentage of white-collar workers increased from
44.8 to 52.2 during the above period; the total number of PTK workers
increased by 76 percent whereas the total number of employed persons
increased by only 36.8 percent.
During 1966-79 about 605,000 PTK workers were admitted to the U.S.
as innnigrants, and in this group there were 42,519 accountants and auditors,
92,585 engineers, 42,042 technicians, 28,635 natural scientists (including
chemists), 7,164 social scientists, 66,874 physicians and surgeons, 79,671
nurses, and 21,556 teachers (colleges and universities).* Similar
data for Indian immigrants for 1969-79 are given in Table 5.
The most 'valuable' grqup among the immigrant PTK workers consists of
scientists, engineers, and physicians and surgeons. The peak year for the
immigration of sicentists and engineers was 1970, and for physicians and
surgeons it was 1972. During 1966-79 about 17.7 percent of all innnigrant
scientists and engineers, and 17.2 percent of all innnigrant physicians and
surgeons came from India; India contributed more than any other country
to the pool of immigrant physicians and surgeons as well as to the pool of
* In the early period chemists were listed separately. The group of college and university teachers include some scientists and engineers, not listed in other categories.
- 11 -

under the nonpreference category. The last category was mainly used in
order to expedite the immigration process. Details are given in the following
table. It is worth noting that during 1976-79 many more Indians were admitted
under the relative preferences than under the occupational preferences, and
this trend is becoming more prominent.
Table 7. Indian Immigrants Admitted to the U.S. under Different Preference
Categories, 1966-79: Percentages of the Total Number.
Preferences 1966-69 1970-7~ 1976-77** 1978-79 1966-79* .
% % % % Total %
Relative preferences: total 18.7 28.1 48.4 78.3 72,191 42.6
Second preference 12.8 20.8 24.1 29.4 38,367 22.6
Fifth-preference ·5. 0 7.1 24.0 48.4 . 33,208 19.6
Occupational preferences: total 71.2 27.3 26.6 18'. 7
I 49,667 29.3
Third preference* 33.9 11.4 11.2 5.2 20,531 12.1
Sixth preference* 9.2 4.4 6.8 4;4 9,149 5.4
Nonpreference 10.0 44.6 24.9 3.0 47,444 28.0 ·-
*Excludes spouses and children. **Includes the transition quarter July 1, 1976-Sept. 30, 1976.
Note: 1966-79: July 1, 1965-Sept. 30, 1979. Note: 2nd preference:
5th preference:
3rd preference: 6th preference: Nonpreference:
Source: 1.N.S. Annual
Spouses and unmarried sons and daughters of permanent residents. (Original quota was 20%--now 26%) Brothers and sisters of U.S. citizens, 21 years of age and over. (24% quota) Professional persons of exceptional abilities. (10% quota) Skilled and unskilled workers in short supply. (10% quota) Not used by the specified preference categories. Reports, U.S. Government.
4. Adjustments to the Immigrant Status. In 1966-79 only 31.6 percent
of Indian immigrants to the U.S. adjusted their non-immigrant status to·
immigran~ status--14.2 percent from student visas, 3.4 percent from "exchange
visitor" visas, and 5.5 percent from "temporary visitor" visas. It is worth
- 14 -
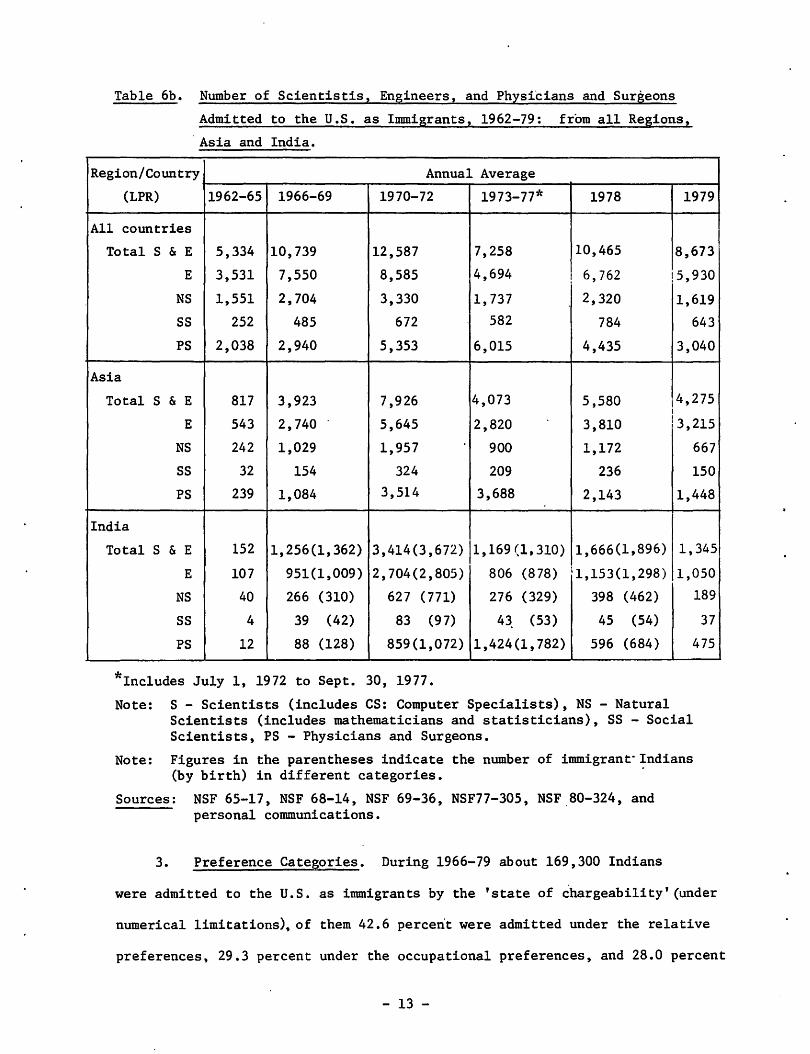
Table 6b. Number of Scientistis, Engineers, and Physicians and Surgeons
Admitted to the U.S. as Immigrants, 1962-79: from all Regions,
· Asia and India.
Region/Country Annual Average
(LPR) 1962-65 1966-69 1970-72 1973-77* 1978 1979
All countries
Total S & E 5,334 10,739 12,587 7,258 10,465 8,673
E 3,531 7,550 8,585 4,694 6,762 !5,930
NS 1,551 2,704 3,330 1,737 2,320 1,619
ss 252 485 672 582 784 643
PS 2,038 2,940 5,353 6,015 4,435 3,040
Asia
Total S & E 817 3,923 7,926 4,073 5,580 4,275 l
E 543 2,740 5,645 2,820 3,810 3,215
NS 242 1,029 1,957 900 1,172 667
ss 32 154 324 209 236 150
PS 239 1,084 3,514 3,688 2,143 1,448
India
Total S & E 152 1,256(1,362) 3,414(3,672) 1,169 (1,310) 1,666(1,896) 1,345
E 107 951(1,009) 2,704(2,805) 806 (878) 1,153(1,298) 1,050
NS 40 266 (310) 627 (771) 276 (329) 398 (462) 189
ss 4 39 (42) 83 (97) 43. (53) 45 (54) 37
PS 12 88 (128) 859(1,072) 1,424(1,782) 596 (684) 475
*Includes July 1, 1972 to Sept. 30, 1977.
Note: S - Scientists (includes CS: Computer Specialists), NS - Natural Scientists (includes mathematicians and statisticians), SS - Social Scientists, PS - Physicians and Surgeons.
Note: Figures in the parentheses indicate the number of immigrant·Indians (by birth) in different categories. ·
Sources: NSF 65-17, NSF 68-14, NSF 69-36, NSF77-305, NSF.80-324, and personal communications.
3. Preference Categories. During 1966-79 about 169,300 Indians
were admitted to the U.S. as immigrants by the 'state of chargeability' (under
numerical limitations), of them 42.6 percent were admitted under the relative
preferences, 29.3 percent under the occupational preferences, and 28.0 percent
- 13 -

1966-75 adjusted from student visas, and 2.6% from "exchange visitor" visas.
The adjustment rate for Indian Pis was 50% and most of these adjustments
were made from exchange-visitor visas. Except for social scientists the
adjustment rate for immigrant Indian SIE and PIS decreased in.the later half
of the 1970's.
Table 9. Indian (by birth) Scientists, Engineers, Physicians and Surgeons
Admitted to the U.S. as Immigrants, and Adjustments from Non
Immigrant Status, 1966-75 2 1977~78.
Occupation 1966-69
Natural Scientists-total 1,240
% Adjusted-to~al 74.0
Students 57.8
Exch. visitors 7.4
Social Scientists-total 170
% Adjusted-total 81.2
Students 62.9
Exch. visitors 4.7
Engineers-total 4,037
% Adjusted-total 78.4
Students 71.0
Exch. visitors 0.5
Physicians & Surgeons-total 513
% Adjusted-total 38.6
Students 7.8
Exch. visitors 21.6
*July 1, 1965 to Sept. 30, 1975.
**Includes the TQ, 1975.
1970-72 1973-75** 1966-75*
2,312 ~80 4,532
55.7 38.2 56.9
38.8 25.4 41.1
9.8 6.3 8.4
291 179 640
67.7 74.9 73.3
43.0 53.1 51.1
11.0 6.7 8.1
8,414 2,744 15,195
50.7 47.4 57.4
47.4 43.0 52.9
0.5 0.8 0.6
3,216 5,269 8,998
63.9 42.6 so.a 1.3 0.8 1.4
51.5 30.9 37.7
Source: N.S.F. Washington, D.C. (personal communication).
- 16 -
1977 1978
404 462
35.3 37.9
23.0 26.0
6.7 5.8
52 54
65.3 92.6
44.2 64.8
3.8 9.2
905 1,298
44.8 44.1
39.1 37.5
0.7 0.9
2,046 684
26.6 32.0
1.2 1.5
19.0 21.2

noting that during the above period more than 32~500 exchange visitors
and 400,000 temporary visitors (from all regions) were able to secure
immigrant status in the U.S. despite the general belief (and the U.S.
regulations) that such adjustments are generally not possible. In the
early period 1966-69 more than half of the Indian immigrants were first
admitted to the U.S. as non-immigrants, but in the later period 1976-78
more than three-fourths of the Indian immigrants were "direct" immigrants.
Table 8: Number of Adjustments of Indian (by birth) Nonimmigrants
in the U.S. to Immigrant Status 2 1966-79.
Nonimmigrant status Percentage of total number of Indian at entry immigrants admitted.
1966-69 1970-75 1976-78*
Total adjusted 54.6 37.2 23.1
Students 32 .• 3 15.7 9.8 Exchange visitors 1.8 5.5 2.0 Spouses and children of
students and exch. visitors 9.2 8.0 3.9
Temporary workers & trainees 0.8 0.5 0.3
Temporary visitors 5.9 5.5 5. 7 . Government officials 0.6 0.3 0.2
Note: Figures in parentheses indicate total number.
*Includes TQ, 1976. Figures for TQ, 1976 are estimated.
Source: I.N.S. Annual Reports, U.S. Government.
1979
13.9
5.3 0.5
1.8
0.3 4.6 0.3
1966-79*
31.6(57,556)
14.2(25,845) 3.4( 6,170)
6.0(11,023)
0.4( 799) 5.5(10,024) 0.3( 565)
During 1966-75 about 58% of immigrant Indian SIE adjusted from non
immigrant status to immigrant status; the adjustment rate for social scien
tists was about 73%. About 50% of immigrant Indian slE admitted during
- 15 -

the U.S. as immigrants during 1966-78 were of 20-39 years old--about 45%
between 20 and 29 years. In the later period, the percentages in both the
lowest and highest age groups as well as the percentage of females increased;
this is due to the fact that more Indians were admitted under relative pref
eren~es, and a larger number of Indian families immigrated in the later period.
Table 11. Percentage Distribution of Immigrant Indians by Age and Sex,
1965-79 (By Birth).
Age (in years) 1965 1966-69 1970-73 1974-77 1978-79
Under 10 11 12 16 14 15
10 - 19 10 6 6 7 11
20 - 29 43 45 44 46 38
30 - 39 27 29 27 22 22
40 - 49 5 5 6 5 7
50 and above 5 2 1 5 7
Males 56 60 55 52 52
Source: I.N.S. Annual Reports, U.S. Government.
6. Nonimmigrants. As' we have seen above, the majority of Indian immi-
grants were direct immigrants. However, the nonimmigrant status is the first
major step towards securing an immigrant visa when the channels for direct
immigration become restricted. Table 12 gives the number of Indians admitted
to the U.S. under different nonimmigrant categories during 1966-79.
It is interesting to note that the number of exchange visitors from
India gradually decreased, whereas the number of temporary visitors (especially
for pleasure) substantially increased.
Academic and cultural contacts between India and the U.S. began to
strengthen from the early fifties, and since then the numbers of Indian
students, exchange visitors and trainees in the U.S. gradually increased
- 18 -

It appears that the difference between the year of adjustment to immi
grant status and the year of entry to the U.S. as a non-immigrant is 3-4 years
on the average for the group of Indians who adjusted their status in 1966-77.
The distribution of these differences is given in Table 10.
Table 10. Number of Adjustments of Indian Non-immigrants to Immigrant Status,
1969-79: Years of Adjustment and Years of Entry to the u.s.(Indians by birth)
Difference between Number of adjustments under sec. 245 - percentage distribution time of adjustment Year of adjustment and .time of entry
(in years) 1969 1970 1971 1972 1973
0 - 0.5 1.1 0.5 1.1 1.2 0.8
0.5 - 1.5 11.6 10.0 11.5 14.2 26.0
1.5 - 2.5 22.7 25.0 27.0 26.7 32.1
2.5 - 3.5 20.0 24.8 24.5 24.8 18.9
3.5 - 4.5 17.4 15.9 17.1 15.4 11.1
4.5 - 5.5 10.9 9.7 8.2 9.8 5.9 5.5 -.6.5 6.3 6.3 4.1 3.6 2.5
6.5 and above 10.0 7.8 6.5 4.3 3.4
*The first column is 0-0.75, 0.75-1.75 etc.
Source: I.N.S. Annual Reports, U.S. Government.
1974 1975
0.8 1.4
19.7 15.0
25.8 29.3
19.9 19.3
16.2 13.6
9.8 10.7
4.4 6.7
3.4 4.0
1976 1977* 1978*
0.7 1.4 3.2
9.0 11.6 11.1
25.8 20.0 15.7
20.7 21.9 16.1
17.2 18.7 20.2
11.3 11.9 14.7
8.0 6.4 8.2
7.3 8.1 10.8
Although occupational preferences were designed to import professional
and technical workers, three-fourths of the PTK immigrants to the U.S. during
1966-77 were admitted under other preferences. Moreover, of those innnigrant
PTK workers admitted under occupational preferences, 45.8 percent adjusted
from non-immigrant status. Of course, these proportions varied for different
occupational categories, and these data for some specific occupations are
given in Part II. Similar information for Indian innnigrants, in particular,
is not available.
5. Age Distribution of Immig·rants. Over 70% of Indians admitted to
- 17 -
1979*
19.5
13.9
13.6
14. 6
12.2
8.8
4.5
12.9

Table 13. Number of Indian Students Admitted to the U.S. as Non-immigrants,
1967-78 (by LPR).*
Year of entry
1978 1977 1976 1975 1974 1973 1972 1971 1970 1969 1968 1967
Total number 2,948 2,112 2,350 3,194 4,293 3,780 3,725 5,314 5,137 4,330 3,888 3,019
Rank, coun-try-wise 13 16 11 8 6 4 7 3 3 3 3 3
As% of the no. of all nonimmigrant 1.6 1.4 1.9 3.0 3.9 5.8 3.8 5.6 5.2 4.8 5.3 4.8 students admitted
*Includes multiple entries.
Source: I.N.S. Annual Reports, U.S. Government.
Until 1973 the top three nationalities among the foreign students in the
U.S. were usually Canadian, Mexican and Indian. The number of Indian students
·1n U.S. colleges and universities increased from 3,772 in 1959-60 to 12,523 in
1970-71, and then slowly decreased to 9,250 in 1980-81. However, the number
of foreign students in U.S. colleges and universities increased from 48,486
in 1959-60 to 311,880 in 1980-81. About 35 percent of these foreign students
in 1979-80 came from the OPEC countries. It is worth mentioning that in
1979-80 more than 80 percent of foreign students in U.S. colleges and
universities were supported by personal family funds or the respective
national governments, and only 9 percent of them were supported by U.S.
colleges and universities. But in 1970-71 about 40 percent were supported
by personal family funds or the respective national governments, and 18
percent were fully or partly supported by U.S. colleges and universities.
The 1975 periodic survey of National Center of Education Statistics
revealed that out of 58,800 foreign graduate students in U.S. colleges
and universities, about J3,000 were enrolled full time in graduate science
- 20 -
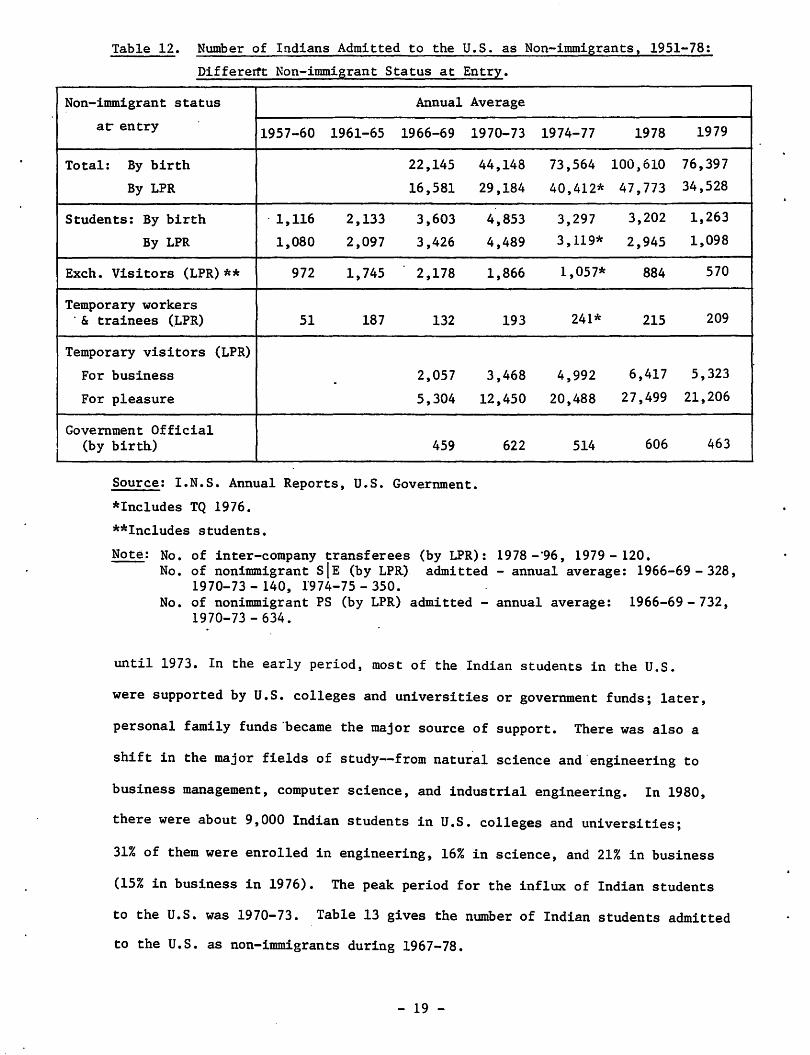
Table 12. Number of Indians Admitted to the U.S. as Non-immigrants, 1951-78:
Differed't Non-immigrant Status at Entry.
Non-immigrant status Annual Average
at" entry 1957-60 1961-65 1966-69 1970-73 1974-77 1978 1979
Total: By birth 22,145 44,148 73,564 100,610 76,397
By LPR 16,581 29,184 40,412* 47,773 34,528
Students: By birth · 1,116 2,133 3,603 4,853 3,297 3,202 1,263
By LPR 1,080 2,097 3,426 4,489 3, 119* 2,945 1,098
Exch. Visitors (LPR)** 972 1,745 2,178 1,866 1,057* 884 570
Temporary workers · & trainees (LPR) 51 187 132 193 241* 215 209
Temporary visitors (LPR)
For business 2,057 3,468 4,992 6,417 5,323 -For pleasure 5,304 12,450 20,488 27,499 21,206
Government Official (by birth) 459
Source: I.N.S. Annual Reports, U.S. Government.
*Includes TQ 1976.
**Includes students.
622 514 606 463
Note: No. of inter-company transferees (by LPR): 1978 -·96, 1979 - 120. No. of nonimmigrant SI E (by LPR) admitted - annual average: 1966-69 - 328,
1970-73 - 140, 1974-75 - 350. No. of nonimmigrant PS (by LPR) admitted - annual average: 1966-69 - 732,
1970-73 - 634.
until 1973. In the early period, most of the Indian students in the U.S.
were supported by U.S. colleges and universities or government funds; later,
personal family funds "became the major source of support. There was also a
shift in the major fields of study--from natural science and.engineering to
business management, computer science, and industrial engineering. In 1980,
there were about 9,000 Indian students in U.S. colleges and universities;
31% of them were enrolled in engineering, 16% in science, and 21% in business
(15% in business in 1976). The peak period for the influx of Indian students
to the U.S. was 1970-73. Table 13 gives the number of Indian students admitted
to the U.S. as non-immigrants during 1967-78.
- 19 -
complete record of individual movements. The number of Indian exchange
visitors admitted to the U.S. (as non-immigrants) during 1966-76 is 21,452;
but this figure includes repeated entries. Moreover, some exchange visitors
might have first visited the U.S. with student visas or trainee visas or
visitor's visas. Let us now assume that an exchange visitor would have
to stay in the U.S. for three years as a non-immigrant before changing to
immigrant status., The number of Indian exchange visitors who adjusted to
immigrant status during 1969-79 is 5,967. However, some exchange visitors
might have first left the U.S. temporarily and then re-entered the U.S. as
direct immigrants; some others might have first changed to temporary trainee's
visas and then adjusted to the immigrant status. Nevertheless, from the
two figures cited above we may get an estimate (probably an underestimate)
of the percentage of Indian exchange visitors admitted to the U.S. in
1966-76 who eventually became U.S. immigrants; that estimate turns out to
be 27.8 perc~nt.
It would be much less accurate to estimate the similar proportion for
Indian students admitted to the U.S. as non-immigrants using the above
method. Anyway, assuming that it would require 4 years (on the average)
for a non-immigrant Indian student to adjust to immigrant status, the
above method would indicate that about 51.percent of Indian non-immigrant
students admitted to the U.S. (excludes multiple entries) in 1962-75 became
U.S. immigrants.
Again, it is not possible to know what proportion of Indians admitted
to the U.S. as immigrants in a given period are still U.S. residents. Data
on multiple entries, deaths etc. are not available. According to the U.S.
Alien Address Report there were 113,872 Indian (Ay nationalitrl peopanent residenta
- 22 -

and engineering programs; the number of foreign students enrolled in Ph.D
granting .institutions in 1975 represented less than 16% of the full time
total in 1975, in contrast to the 20% share 5 years earlier.
In 1980, foreigners made up 21% of all full time SIE graduate stu
dents in doct~rate-granting institutions, up from 16% in 1975 (NSF 82-306).
Moreover, 46.3 percent of all recipients of new Ph.D. degrees in engineering
in 1980 were foreign citizens; similar percentages for physical sciences,
biological sciences and social sciences were 22.9, 11.5 and 20.0, respec
tively.
Table 14 gives the number of Indian students (not necessarily non
immigrants) in U.S. colleges and universities during selected periods in
1954-81.
Table 14. Number of Indian Students in U.S. Colleges and Universities,
1954-80~
1954-55 1959-60 1960-66 1966-69 1969-74 1974-80 1980-81
Annual average 1,673 3,772 6,094 8,399 11,203 9,323 9,250
Total as% of all foreign students 4.9 7.8 8.8 7.6 7.8 4.2 3.0 in U.S. colleges and universities
Source: Open Door, Institute of International Education, Washington, D.C.
7. Some Estimates. From the available official data it is not possible
to know what proportion of exchange visitors (or students) from India
eventually became U.S. il'IIlligrants (in a specific period); this would require
- 21 -

and exchange visitors in natural science, 9900 in engineering, and 4300
Indian exchange visitors in medicine adjusted to immigrant status during
1966-79. (See Table 9). Anyway, the C.S.I.R. data are presented below.
Table 15. Enrolled Number of Indian Scientists, Technicians, Engineers,
and Physicians and Surgeons that Went Abroad for Training, and
Number Returned Back. Selected Countries of Training.
Country of Training
Field U.S.A. U.K. W. Germany All Countries
Total No. Returned Total No. Returned Total No. Returned Total No. Returned
Science 3,674 1,753 (47.7) 1,293 661 454 239 7,422 3,678 (49.5)
Technology 390 189 (48.5) 474 260 219 98 1,305 658 (50.4)
Engineering 3,054 1,304 (42. 7) 2,793 1,321 1,158 560 8,457 3,891 (46 .0)
Medicine 971 494 (50. 9) 3,045 1,630 64 24 4,510 2,301 (51. 0)
Total 8,089 3,740 (46.2) 7,605 3,872 1,895 921 21,694 10,528 (48.5)
Note: Figures in parenthesis indicate percentages returned. Source: Technical manpower, C.S.I.R., Government of India, New Delhi,
January, 1980.
'Indians Abroad' started to include the list of social scientists in
1964. According to the C.S.I.R. report (1980),.496 Indians in social science
and 653 in business administration are enrolled in the 'Indians Abroad'; the
return-rates for these two groups are respectively 41.7 percent and 34.3
percent.
According to a report of the World Health Organization, 1334 Indian
physicians returned to India from abroad between 1965 and 1969--917 from
the U.K., and 313 from the U.S. (9)
8. Number of Indian (aliens) in the U.S. Every alien in the U.S. is
legally required to report his/her address to the U.S. Government each
January (until 1980). The following table gives the number of alien Indians
reported.
- 24 -

in the U.S. in 1979. Between 1961 and 1979 about 32,400 Indian citizens
naturalized in the U.S. On the other hand, about 170,000 Indians emigrated
to the U.S. from India during 1956-79. It appears from the above data
that roughly 86 percent of Indians admitted to the U.S. as immigrants
during 1956-79 were still residents of the U.S. in 1979 (ignoring multiple
entries, deaths, etc.)
It is more important to know what proportion of Indian scientists,
engineers, and physicians and surgeons admitted to the U.S. in a given
period eventually went back to India permanently (say, for at least two
years of residence). However, neither the U.S. government nor the Indian
government keeps track of these professional and technical workers. The
only estimates available are based on voluntary reports received by.the
C.S.I.R., Govt. of India, and these estimates are far from accurate.
Since 1957 the C.S.I.R., Govt. of India, has been keeping records of
the number of Indian scientists, engineers, and physicians and surgeons that
went abroad; but this is based on voluntary reports by these professionals.·
According to the N.S.F., U.S.A., about 5,000 Indian natural scientists, 18,000
engineers and 11,500 Indian physicians and surgeons immigrated to
the U.S. during 1966-79. The 'Indians Abroad' section of the
C.S.I.R. Register, January 1980, lists only 7100 Indian scientists and
engineers and 971 Indian physicians and surgeons that have received training
in the U.S. Apparently, the C.S.I.R. Register does not include the Indian
professionals who were directly admitted to the U.S. as immigrants. Even
then, the C.S.I.R. estimate of the number of Indian students (college/
university level), exchange visitors and temporary workers and trainees in sjE
admitted to the U.S. as non-immigrants is a gross under-estimate. (See
Tables 8 and 12). According to the N.S.F., U.S.A., 2600 Indian Students
- 23 -
Since 1970, the inflow of Indians to the Middle East has been
increasing rapidly. However, most of these migrants are temporary
workers, although many Indians have settled in certain regions in the
Middle East. According to the 1971 Census, there were 6,657 Indians in
Bahrain and 17,336 in Kuwait, but since then the number of Indians in
those regions has increased considerably.
(ii) India is the largest exporter of medical manpower. It is estimated
that there were about 15,000 Indian physicians outside India in 1971.
Indian physicians can be found all over the world.
During the late 1960s about 1,000 Indian physicians emigrated to the
U.K. each yea~ (on the average). Out of about 7,000 Indian-born physicians
in the U.K. in 1970, about 5,700 were attached to the National Health
Service, mostly in junior posts. Even in 1975 about 1,250 Indian physicians
entered the U.K. But the inflow of Indian physicians to the U.K. has
slowed down due to the fact that the British General .Medical Council with
drew recognition of qualification from 55 medical colleges in India. (9)
In 1970, there were about 4,000 Indian medical graduates in the U.S., and
65% of them were either interns or residents. During 1971-77 about 12,200
Indian physicians innnigrated to the U.S. (9,812 from India directly). The
influx of Indian physicians to the U.S. has slowed down due to the restrictive
measures by the U.S. Government in 1977.
Since 1970 the influx of Indian physicians to the OPEC countries of the
Middle East has increased considerably. Indian physicians can also be found
in different countries in Africa. In 1970, there were about 350 Indian
physicians in Kenya, 200 in T~nzania, 70 in Uganda, 65 in Ghana. There
was also a steady flow of Indian physicians, however small, to Canada. (9)
- 26 -
. i

Table 16. Number of Indians Reported under Alien Address Program, 1965-79;
Selected years.
Year 1965 1968 1971 1974 1977 1979
Total number 3,906 29,804 56,725 80,060 108,596 125,630
Total permanent residents 994 13,359 35,095 63,638 95,557 113,879
Source: I.N.S. Annual Reports, U.S. Government. Note: Total nllI:lbcr of people deported from the U.S. to India during
1966-79 = 468.
9. Comments.
(i) After the Second World War the emigration of Indians to Great Britain and
Northern Ireland considerably increased. During the second-half of the 1960s
about 20,000 Indians emigrated to these regions annually. The 1971 Census
in Great Britain revealed that there were 322,000 persons in Great Britain
who had been born in India; of these,252,000 had arrived after 1949. Net
migration of Indians to Great Britain slowed down in the 1970s. During 1970-74
net migration from India., _Pakistan, Bangladesh and Sri Lanka to the U.K. was
64,000. (10)
It was estimated that about 600,000 Indians were living abroad in 1974. (10)
Although emigrant Indians constituted the second largest nationality group
(next to Lebanese) among all foreign_ nationality groups in Australia in the
early 1970s, the major destination of emigrant Indians shifted from the U.K.
to the United States and Canada in the last decade.
About 29,500 people emigrated from India to Canada between 1946 and 1970,
and about 54,600 during 1970-77. More than 5,500 people immigrated to Canada
from India in 1977. During 1970-74 the number of Indian-born emigrants to
Canada was about 47,800, and by 1974 there were about 68,000 Indian-born
residents in Canada. (10)
According to the U.S. Census, the number of Indian~born residents in the
U.S. increased from 12,300 in 1960 to 51,000 in 1970, and then jumped to
361,544 (number of Asians of Indian origin) in 1980.
- 25 -

in the Indian ruling circles in order to promote the necessary fundamental
economic and social reforms, in spite of many socialist rhetoric by the ruling
power, are not only responsible for the massive wastage of natural and human
resources in India but also for the loss o_f national wealth incurred through
emigrant professionals. The "free" movement or the "free" development
of some privileged Indians manifested partly in the emigration process, and the
obstruction to the free development of the masses in India are the two sides
of the same coin.
It is true that India's position ~snot comparable to those of Taiwan,
the Phillipines, South Korea or Mexico so far as the extent and role of
U.S. capital is concerned. India's ruling circles have a certain degree
of autonomous political power, developed partly in the interests of the
national bourgeoisie and partly in response to the ongoing internal class
struggle. Nevertheless, the economic, educational and cultural contacts
with the dominant forces in the U.S. play a major role in the aspirations
and development of the ruling bourgeoisie in India amidst the dominant
..
capitalist mode of production. Perpetuation of the prevailing mode of production
in India and the contribution of the emigrant Indian professionals in the
U.S. to the reinforcement and strengthening of the rule of U.S. capital,
in particular, not only would reduce the degree of autonomous power of the
Indian ruling circles and undermine any efforts for self-reliance but also
heighten antagonism nationally in a wide scale.
On the other hand, the economic and political measures of the U.S.
ruling circles so far as India is concerned are primarily directed
towards keeping India within the periphery of the capitalist world. The
U.S. Immigration Acts ar~ designed to sustain and promote the interests
of U.S. capital, in particular, and the rule of capital in general.
- 28 -

(iii) The U.S. official data on the occupations of immigra~ts to the U.S.
reveal only the occupations declared by the immigrants at the time of entry.
These data do not portray the actual situation. Firstly, there may be an
"upward" bias in the declared categories of occupations. Secondl:¥, many
immigrant professionals were not able to engage into the respective professions
as declared at the time of entry, especially during the early period of their
residence in the U.S. As a matter of fact, it was not very uncommon to see
an Indian physician in the U.S. engaged as a laboratory technician, and an
Indian engineer as a dish-washer or an assembly-line worker,_an Indian
scientist even as a farm-worker, and an Indian chartered accountant as a
ban~-clerk. During the recession periods in the U.S. many immigrant Indian
engineers were unemployed for a considerable period of time. In effect, a large
number of Indian professionals in the U.S. were forced to accept low-paying
jobs which do not conform to their qualifications and experiences.
On the other hand, many Indian professionals changed their occupations
after emigrating to the U.S., and moved to more prospective professions (in
business management, computer technology etc.). Although, in most cases
•11no occupation" was recorded for wives of immigrant Indians at the time of
entry, later many such women took low-paying clerical or service jobs
besides few of them who have become professionals.
(iv) The purpose of this report is not to indulge into empiricism. The
first object is to reveal the data on the immigration process and to note that
these data by themselves cannot explain the process. The movement of
capital, governed by the rule of capital, essentially determines the
prevailing migration process. The colonial past of India along with the rise
of the-new bourgeoisie, capitalist development largely dependent on the
metropolitan capitalist centera, and the lack. of any effectiye political will
- 27 -
10. ·Graphs. Eight figures are presented to reveal various time-series
data on Indian immigrants to the U.S. It may be noted that the annual
figures prior to 1977 relate to July l -June 30, and from October 1 to
September 30 since 1977.
Acknowledgment. The author is thankful to Professor David Lane
for many helpful discussions and suggestions, to Ms. M. Hutson for careful
typing, and to Mr. J. Gannon of the N.S.F. for furnishing many unpublished
data.
- 30 -

These Acts are not at all concerned with the independent and rational
development of science and technology in India or the welfare of Indian
workers in general.
The emigration of Indian workers to the U.S. needs to be viewed
in the perspective of the cumulative effect of the above processes.
Lastly, it may be noted that the forthcoming changes in the U.S.
immigration laws, introducing restrictions on adjustments to immigrant
status from student visas and eliminating the Fifth Preference, would
have significant effects on the trend (especially the occupational
structure) of emigration of Indian workers to the U.S.; the new laws
would lead to more direct immigrants and more PTK immigrants from India,
indicating a shift from the recent trend.
- 29 -

18,000
17,000
16,000
15,000
14,000
13,000
12,000
11,000
10,000
9,000
8,000
7,000
6,000
5,000
4,000
3,000
2,000
1,000
1966
Figure 2. Cumulative Graphs--Indian Immigrants admitted to the U.S. under Different Preference Categories, 1966-79.
Total number under state
of chargeability
"
Non-preference Fifth relative preference
Second relative preference
_____ ....,
/ ....... / ....
., " / / Spouses and ', , ,,,, ·"' ' / children under ' ,
,"' ' // occup. ', / \ ' / , // preference , ,
/ \ / ' ----../" \ / V
Third preference
-32 -

Figure 1.
22,000
20,000
18,000.
16,000'
14,000
12,000
10,000
8,000
6,000
4,000
2,000
Number of Indian Immigrants to the U.S., 1965-79, under Different Classifications.
,,,. ' ,,,. ' ,,,. ,,,.
I
I I
I
I I
I
Total number (by birth)
I I
I I
I , I
I
I
I I
Total number (by LPR)
,,,. I
I I
,,. ,,. ,,. ,,.
I , 1famber of
1 direct , immigrants
I 1 (by birth)
Number of innnigrants with
Number of PTK immigrants
(by birth)
1965 66 67 68 69 70 71 72 73 74 75 76 77 78 79
- 31 -

Figure 4.
3,500
3,000
2,500
Number of Indian (LPR) Scientists, Engineers, and Physicians and Surgeons Admitted to the U.S. as Immigrants, 1962-79.
Engineers
2,000 I I I Physicians & Surgeons
1/\ /'
/ \ I
I ! \ i 1,500-, / \ \ /
I \ I I \ I I \ I I \1 I
1,000-t /V ; ' L '\I\ I Engineers \
\
\. Natural ',
/' \ Scientists A '\ soo... I -
1962 64 66 68 70 72 74 76 78 79
- 34 -

100
50
8,000
7,000
6,000
5, 00().
4,000
3,000
2,000
1,000
Figure 3. Number of Indian Immigrants who Adjusted to Immgirant Status from Different Nonimmigrant Categories. Cumulative Graphs: 1966-79.
1966 67 68 69 70 71 72
\ \
73 74 75
Total Number Adjusted to Immigrant Status
\ \ \ \
\ \
\ /
\ __ -/
76
................
Visas
77 78 79
From Other Visas
Spouses & Children of Students & Exchange Visitors
\ From
\ "Exchange Visitor"
\ v· 1.sas
1966 67 68 69 70 71 72 73 74 75 76 77 78 79
- 33 -

70,000
60,000
50,000
40,000
30,000
20,000
10,000
Figure 7. Number of Indians Reported Under U .·S. Alien Address Program,and Indian Permanent Residents in the U .s.
/-_.-1
I I
I
I I
I I
I Indian Permanent Residents
I I
I I
I I
I I
I / ------
1965 66 67 68 69 70 71 72 73 74 6,500
6,000
5,000
4,000
3,000
.2,000
=1,000
1965
Figure 8. Number of Indians Naturalized in the U.S.
- 36 -
/ /
/
75
I /
76
I I
I --- I
/
77 78
I I
I I
I
79 80

13,000
12,000
11,000
10,000
9,000
8,000
7,000
6,000
5,000
4,000
3,000
2,000
1,000
1950
3,000
2,500
2,000
1,500
1,000
500
1950
Figure 5_. Indian Students in U. S • Colleges & Universities, and Nonimmigrant Indian Students Admitted to the U. S .
52 54
Fi~ure 6.
52 54
Indian Students in U.S. Colleges & Universities
/ /
/ /
/
56
/ /
58
/ /
/
60
Indian Exchange Visitors Admitted to the U. S • , and Indian Temp. Trainees Admitted to the U.S.
62
Nonimmigrant Indian Students Admitted
/ I
By Birth / By LPR r
64 66 68 70
Indian Temporary Trainees
Indian Exchange Visitors Admitted
Admitted· By LPR ~
• 56 58 78
- 35 -
8~

1.
References
Annual Reports, Immigration and Naturalization Service, U.S. Govt., Washington, D.c •. (up to 1979). (Source of data for all tables except Tables 5, 6(a), 6(b), 9, 14, 15).
2. U.S. Statistical Abstract, Annual Issues. W~shington, D.C.
3.
4.
5.
6.
7.
8.
. 9.
10.
Reviews of Data on Science Resources, NSF 65-17, NSF 68-14, NSF 69-36, NSF 77-305, NSF 77-313, NSF 80-324, National Science Foundation, Washington, D.C. (Source for Table 6(a), 6(b)).
Admission of Foreign Medical Graduates to the U.S. by R.M. Miller. I.N.S. Reporter, Vol. 27, No. 4, 1979.
Open Door, Institute of International Education, Washington, D.C., Annual Issues. (Source of data for Table 14).
Technical Manpower, C.S.I.R., New Delhi, January, 1980. (Source of data for Table 15).
Congressional Digest, Washington, D.C., October 1977. (Source for information on U.S. Immigration Acts).
United States Immigration Laws: General Information - U.S. Department of Justice, U.S. Govt., October, 1980.
Physician and Nurse Migration by A. Mejia, H. Pizurki, E. Royston, W.H.O., Geneva, 1979.
Trends and Characteristics of International Migration Since 1950, United Nations, New York, 1979.
- 37 -
Related Documents