Idaho Standards Achievement Tests in English Language Arts and Mathematics 2018–2019 Technical Report Submitted to Idaho State Department of Education by the American Institutes for Research

Welcome message from author
This document is posted to help you gain knowledge. Please leave a comment to let me know what you think about it! Share it to your friends and learn new things together.
Transcript
Idaho Standards Achievement
Tests in English Language Arts
and Mathematics
2018–2019 Technical Report
Submitted to
Idaho State Department of Education
by the American Institutes for Research

Idaho Standards Achievement Tests in English Language Arts and Mathematics
2018–2019 Technical Report
i American Institutes for Research
TABLE OF CONTENTS
1. BACKGROUND................................................................................................................... 1
1.1 Updates; 2015–2018 ..................................................................................................................... 2
1.2 Changes in 2018–2019 Summative Assessments ........................................................................... 2
1.3 Impact of Changes in 2018–2019 ELA/L Test Blueprints.............................................................. 3
2. TEST ADMINISTRATION .................................................................................................. 7
2.1 Testing Windows.......................................................................................................................... 7
2.2 Test Options and Administrative Roles ......................................................................................... 7
2.2.1 Administrative Roles .......................................................................................................... 8
2.2.2 Online Administration ..................................................................................................... 10
2.2.3 Paper-Pencil Test Administration .................................................................................... 11
2.2.4 Braille Test Administration .............................................................................................. 11
2.3 Training and Information for Test Coordinators and Administrators ............................................ 12
2.3.1 Online Training ............................................................................................................... 12
2.3.2 District Training Workshops ............................................................................................ 17
2.4 Test Security .............................................................................................................................. 17
2.4.1 Student-Level Testing Confidentiality............................................................................... 17
2.4.2 System Security................................................................................................................ 18
2.4.3 Security of the Testing Environment ................................................................................. 19
2.4.4 Test Security Violations ................................................................................................... 20
2.5 Student Participation .................................................................................................................. 20
2.5.1 Homeschooled Students ................................................................................................... 21
2.5.2 Exempt Students .............................................................................................................. 21
2.6 Online Testing Features and Testing Accommodations ............................................................... 21
2.6.1 Online Universal Tools for All Students ........................................................................... 22
2.6.2 Designated Supports and Accommodations ...................................................................... 24
2.7 Data Forensics Program .............................................................................................................. 39

Idaho Standards Achievement Tests in English Language Arts and Mathematics
2018–2019 Technical Report
ii American Institutes for Research
2.7.1 Data Forensics Report ..................................................................................................... 39
2.7.2 Changes in Student Performance ..................................................................................... 39
2.7.3 Item Response Time ......................................................................................................... 40
2.7.4 Inconsistent Item Response Pattern .................................................................................. 40
2.8 Prevention and Recovery of Disruptions in Test Delivery System ............................................... 41
2.8.1 High-Level System Architecture ....................................................................................... 42
2.8.2 Automated Backup and Recovery ..................................................................................... 43
2.8.3 Other Disruption Prevention and Recovery ...................................................................... 43
3. CONSTRUCTION OF GRADES 9 AND 10 TESTS........................................................... 45
3.1 Test Blueprints ........................................................................................................................... 45
3.1.1 ELA/L Test Blueprint ....................................................................................................... 45
3.1.2 Mathematics Test Blueprint ............................................................................................. 46
3.2 Summary of Simulation Studies .................................................................................................. 46
3.2.1 Summary of Adaptive Algorithm ...................................................................................... 46
3.2.2 Testing Plan .................................................................................................................... 48
3.2.3 Statistical Summaries ...................................................................................................... 49
3.2.4 Summary Statistics on Test Blueprints ............................................................................. 50
3.2.5 Summary Statistics on Ability Estimation ......................................................................... 52
3.2.6 Global Item Exposure ...................................................................................................... 54
3.3 Establishing Cut Scores .............................................................................................................. 55
4. SUMMARY OF 2018–2019 OPERATIONAL TEST ADMINISTRATION ....................... 61
4.1 Student Population ..................................................................................................................... 61
4.2 Summary of Overall Student Performance .................................................................................. 62
4.3 Test-Taking Time ....................................................................................................................... 78
4.4 Distribution of Student Ability and Item Difficulty ..................................................................... 81
5. VALIDITY ......................................................................................................................... 90
5.1 Evidence on Test Content ........................................................................................................... 90
5.2 Evidence on Internal Structure .................................................................................................... 97
6. RELIABILITY .................................................................................................................. 101
6.1 Marginal Reliability.................................................................................................................. 101

Idaho Standards Achievement Tests in English Language Arts and Mathematics
2018–2019 Technical Report
iii American Institutes for Research
6.2 Standard Error Curves .............................................................................................................. 102
6.3 Reliability of Achievement Classification ................................................................................. 108
6.4 Reliability for Subgroups .......................................................................................................... 113
6.5 Reliability for Claim Scores ...................................................................................................... 116
7. SCORING ......................................................................................................................... 120
7.1 Estimating Student Ability Using Maximum Likelihood Estimation.......................................... 120
7.2 Rules for Transforming Theta to Vertical Scale Scores ............................................................. 121
7.3 Lowest/Highest Obtainable Scores (LOSS/HOSS) .................................................................... 122
7.4 Scoring All Correct and All Incorrect Cases .............................................................................. 123
7.5 Rules for Calculating Strengths and Weaknesses for Claim Scores ............................................ 123
7.6 Target Scores............................................................................................................................ 124
7.6.1 Target Scores Relative to Student’s Overall Estimated Ability ........................................ 124
7.6.2 Target Scores Relative to Proficiency Standard (Level 3 Cut) ........................................ 125
7.7 Handscoring ............................................................................................................................. 126
7.7.1 Rater Selection .............................................................................................................. 126
7.7.2 Rater Training ............................................................................................................... 127
7.7.3 Rater Statistics .............................................................................................................. 129
7.7.4 Rater Monitoring and Retraining ................................................................................... 130
7.7.5 Validity Checks.............................................................................................................. 130
7.7.6 Rater Dismissal ............................................................................................................. 131
7.7.7 Rater Agreement ............................................................................................................ 131
8. REPORTING AND INTERPRETING SCORES ............................................................... 134
8.1 Online Reporting System for Students and Educators ................................................................ 134
8.1.1 Types of Online Score Reports ....................................................................................... 134
8.1.2 Online Reporting System ............................................................................................... 136
8.2 Interpretation of Reported Scores .............................................................................................. 150
Idaho Standards Achievement Tests in English Language Arts and Mathematics
2018–2019 Technical Report
iv American Institutes for Research
8.2.1 Scale Score .................................................................................................................... 150
8.2.2 Standard Error of Measurement .................................................................................... 150
8.2.3 Achievement Level ......................................................................................................... 150
8.2.4 Performance Category for Claims ................................................................................. 151
8.2.5 Performance Category for Targets ................................................................................ 151
8.2.6 Aggregated Score .......................................................................................................... 152
8.3 Appropriate Uses for Scores and Reports .................................................................................. 152
9. QUALITY CONTROL PROCEDURE .............................................................................. 154
9.1 Adaptive Test Configuration ..................................................................................................... 154
9.1.1 Platform Review ............................................................................................................ 154
9.1.2 User Acceptance Testing and Final Review.................................................................... 155
9.2 Quality Assurance in Document Processing .............................................................................. 155
9.3 Quality Assurance in Data Preparation ...................................................................................... 155
9.4 Quality Assurance in Handscoring ............................................................................................ 155
9.4.1 Double Scoring Rates, Agreement Rates, Validity Sets, and Ongoing Read-Behinds ....... 155
9.4.2 Handscoring QA Monitoring Reports ............................................................................ 156
9.4.3 Monitoring by State Department of Education ............................................................... 156
9.4.4 Identifying, Evaluating, and Informing the State on Alert Responses .............................. 156
9.5 Quality Assurance in Test Scoring ............................................................................................ 157
9.5.1 Score-Report Quality Check .......................................................................................... 158
REFERENCES ....................................................................................................................... 161
APPENDICES ........................................................................................................................ 162

Idaho Standards Achievement Tests in English Language Arts and Mathematics
2018–2019 Technical Report
v American Institutes for Research
LIST OF TABLES
Table 1. Changes in ELA/L Test Blueprints......................................................................................... 3
Table 2. Changes in Testing Time (Grades 3–8 and 10) ....................................................................... 4
Table 3. Changes in Testing Time (Grades 9 and 11) ........................................................................... 4
Table 4. Changes in Test Score Reliabilities (Grades 3–8 and 10) ........................................................ 5
Table 5. Changes in Test Score Reliabilities (Grades 9 and 11) ............................................................ 5
Table 6. 2018–2019 Testing Windows ................................................................................................. 7
Table 7. Summary of Tests and Testing Options in 2018–2019 ............................................................ 7
Table 8. Number of Students Who Took Paper-Pencil Tests in 2018–2019 Summative Test
Administration ........................................................................................................................... 11
Table 9. SY 2018–2019 Universal Tools, Designated Supports, and Accommodations ...................... 28
Table 10. ELA/L Total Students with Allowed Embedded and Non-Embedded Accommodations
(Grades 3–8 and 10) ................................................................................................................... 29
Table 11. ELA/L Total Students with Allowed Embedded and Non-Embedded Accommodations
(Grades 9 and 11) ....................................................................................................................... 29
Table 12. ELA/L Total Students with Allowed Embedded Designated Supports (Grades 3–8 and 10) 30
Table 13. ELA/L Total Students with Allowed Embedded Designated Supports (Grades 9 and 11) .... 30
Table 14. ELA/L Total Students with Allowed Non-Embedded Designated Supports (Grades 3–8 and
10) ............................................................................................................................................. 31
Table 15. ELA/L Total Students with Allowed Non-Embedded Designated Supports (Grades 9 and 11)
................................................................................................................................................... 32
Table 16. Mathematics Total Students with Allowed Embedded and Non-Embedded Accommodations
(Grades 3–8 and 10) ................................................................................................................... 33
Table 17. Mathematics Total Students with Allowed Embedded and Non-Embedded Accommodations
(Grades 9 and 11) ....................................................................................................................... 33
Table 18. Mathematics Total Students with Allowed Embedded Designated Supports (Grades 3–8 and
10) ............................................................................................................................................. 34
Table 19. Mathematics Total Students with Allowed Embedded Designated Supports (Grades 9 and
11) ............................................................................................................................................. 35
Table 20. Mathematics Total Students with Allowed Non-Embedded Designated Supports (Grades 3–
8, 10) .......................................................................................................................................... 36
Table 21. Mathematics Total Students with Allowed Non-Embedded Designated Supports (Grades 9
and 11) ....................................................................................................................................... 38
Table 22. Parameters Used to Generate True Ability Distributions ..................................................... 48

Idaho Standards Achievement Tests in English Language Arts and Mathematics
2018–2019 Technical Report
vi American Institutes for Research
Table 23. Percentage of Tests Meeting Blueprint Requirements in ELA/L ......................................... 50
Table 24. Percentage of Tests Meeting Blueprint Requirements in Mathematics ................................ 51
Table 25. Average and Range of the Number of Unique Targets Covered in Each Test by Claim ....... 52
Table 26. Bias of the Estimated Abilities ........................................................................................... 52
Table 27. Average Item Difficulty and Student Ability ...................................................................... 53
Table 28. Standard Errors of the Estimated Abilities .......................................................................... 53
Table 29. Percentage of Items by Exposure Rate ............................................................................... 55
Table 30. Sample Sizes of Grades 9, 10, and 11 Students in Vertical Linking Sample ........................ 58
Table 31. Cut Scores for ELA/L ........................................................................................................ 58
Table 32. Cut Scores for Mathematics ............................................................................................... 59
Table 33. Predicted Cut Scores for ELA/L ......................................................................................... 59
Table 34. Predicted Cut Scores for Mathematics ................................................................................ 60
Table 35. Number of Students in Summative ELA/L Assessment (Grades 3–8 and 10) ...................... 61
Table 36. Number of Students in Summative ELA/L Assessment (Grades 9 and 11) .......................... 61
Table 37. Number of Students in Summative Mathematics Assessment (Grades 3–8 and 10) ............. 62
Table 38. Number of Students in Summative Mathematics Assessment (Grades 9 and 11) ................. 62
Table 39. ELA/L Percentage of Students in Achievement Levels for Overall and by Subgroup (Grades
3–5)............................................................................................................................................ 63
Table 40. ELA/L Percentage of Students in Achievement Levels for Overall and by Subgroup (Grades
6–8)............................................................................................................................................ 64
Table 41. ELA/L Percentage of Students in Achievement Levels for Overall and by Subgroup (Grade
10) ............................................................................................................................................. 65
Table 42. ELA/L Percentage of Students in Achievement Levels for Overall and by Subgroup (Grades
9 and 11) .................................................................................................................................... 66
Table 43. Mathematics Percentage of Students in Achievement Levels for Overall and by Subgroup
(Grades 3–5)............................................................................................................................... 67
Table 44. Mathematics Percentage of Students in Achievement Levels for Overall and by Subgroup
(Grades 6–8)............................................................................................................................... 68
Table 45. Mathematics Percentage of Students in Achievement Levels for Overall and by Subgroup
(Grade 10) .................................................................................................................................. 69
Table 46. Mathematics Percentage of Students in Achievement Levels for Overall and by Subgroup
(Grades 9 and 11) ....................................................................................................................... 70
Table 47. ELA/L Percentage of Students in Performance Categories by Claim (Grades 3–8 and 10) .. 77
Idaho Standards Achievement Tests in English Language Arts and Mathematics
2018–2019 Technical Report
vii American Institutes for Research
Table 48. ELA/L Percentage of Students in Performance Categories by Claim (Grades 9 and 11) ...... 77
Table 49. Mathematics Percentage of Students in Performance Categories by Claim (Grades 3–8 and
10) ............................................................................................................................................. 78
Table 50. Mathematics Percentage of Students in Performance Categories by Claim (Grades 9 and 11)
................................................................................................................................................... 78
Table 51. ELA/L Test-Taking Time (Grades 3–8 and 10) .................................................................. 79
Table 52. ELA/L Test-Taking Time (Grades 9 and 11) ...................................................................... 80
Table 53. Mathematics Test-Taking Time (Grades 3–8 and 10) ......................................................... 80
Table 54. Mathematics Test-Taking Time (Grades 9 and 11) ............................................................. 81
Table 55. Percentage of ELA/L Delivered Tests Meeting Blueprint Requirements for Each Claim and
the Number of Passages Administered (Grades 3–5) ................................................................... 91
Table 56. ELA/L Percentage of Delivered Tests Meeting Blueprint Requirements for Each Claim and
the Number of Passages Administered (Grades 6–8, 10) ............................................................. 92
Table 57. ELA/L Percentage of Delivered Tests Meeting Blueprint Requirements for Each Claim and
the Number of Passages Administered (Grades 9, 11) ................................................................. 93
Table 58. Mathematics Percentage of Delivered Tests Meeting Blueprint Requirements for Claims and
Targets (Grades 3–5) .................................................................................................................. 94
Table 59. Mathematics Percentage of Delivered Tests Meeting Blueprint Requirements for Claims and
Targets (Grades 6–8 and 10) ....................................................................................................... 95
Table 60. Mathematics Percentage of Delivered Tests Meeting Blueprint Requirements for Claims and
Targets (Grades 9 and 11) ........................................................................................................... 96
Table 61. Average and Range of the Number of Unique Targets Assessed Within Each Claim Across
All Delivered Tests (Grades 3–8 and 10) .................................................................................... 97
Table 62. Average and Range of the Number of Unique Targets Assessed Within Each Claim Across
All Delivered Tests (Grades 9 and 11) ........................................................................................ 97
Table 63. Correlations Among Claim Scores for ELA/L (Grades 3–8 and 10) .................................... 99
Table 64. Correlations Among Claim Scores for ELA/L (Grades 9 and 11) ........................................ 99
Table 65. Correlations Among Claim Scores for Mathematics (Grades 3–8 and 10) ......................... 100
Table 66. Correlations Among Claim Scores for Mathematics (Grades 9 and 11) ............................. 100
Table 67. Marginal Reliability for ELA/L and Mathematics (Grades 3–8 and 10) ............................ 102
Table 68. Marginal Reliability for ELA/L and Mathematics (Grades 9 and 11) ................................ 102
Table 69. Average Conditional Standard Error of Measurement by Achievement Level (Grades 3–8,
10) ........................................................................................................................................... 107
Idaho Standards Achievement Tests in English Language Arts and Mathematics
2018–2019 Technical Report
viii American Institutes for Research
Table 70. Average Conditional Standard Error of Measurement by Achievement Level (Grades 9 and
11) ........................................................................................................................................... 107
Table 71. Average Conditional Standard Error of Measurement at Each Achievement Level Cut Score
and Difference of the SEMs Between Two Cuts (Grades 3–8 and 10) ....................................... 108
Table 72. Average Conditional Standard Error of Measurement at Each Achievement Level Cut Score
and Difference of the SEMs Between Two Cuts (Grades 9 and 11) ........................................... 108
Table 73. Classification Accuracy and Consistency by Achievement Level (Grades 3–8 and 10) ..... 112
Table 74. Classification Accuracy and Consistency by Achievement Level (Grades 9 and 11) ......... 113
Table 75. Marginal Reliability and Average Conditional SEM by Subgroup for ELA/L (Grades 3–5)
................................................................................................................................................. 113
Table 76. Marginal Reliability and Average Conditional SEM by Subgroup for ELA/L (Grades 6–8
and 10) ..................................................................................................................................... 114
Table 77. Marginal Reliability and Average Conditional SEM by Subgroup for ELA/L (Grades 9 and
11) ........................................................................................................................................... 114
Table 78. Marginal Reliability and Average Conditional SEM by Subgroup for Mathematics (Grades
3–5).......................................................................................................................................... 115
Table 79. Marginal Reliability and Average Conditional SEM by Subgroup for Mathematics (Grades
6–8 and 10) .............................................................................................................................. 115
Table 80. Marginal Reliability and Average Conditional SEM by Subgroup for Mathematics (Grades 9
and 11) ..................................................................................................................................... 116
Table 81. Marginal Reliability Coefficients for Claim Scores in ELA/L (Grades 3–8 and 10) .......... 117
Table 82. Marginal Reliability Coefficients for Claim Scores in ELA/L (Grades 9 and 11) .............. 118
Table 83. Marginal Reliability Coefficients for Claim Scores in Mathematics (Grades 3–8 and 10).. 118
Table 84. Marginal Reliability Coefficients for Claim Scores in Mathematics (Grades 9 and 11) ..... 119
Table 85. Vertical Scaling Constants on the Reporting Metric ......................................................... 121
Table 86. Cut Scores in Scale Scores (Grades 3–11) ........................................................................ 122
Table 87. Extended Lowest- and Highest-Obtainable Scores (Grades 3−11) .................................... 123
Table 88. ELA/L Rater Agreements for Short-Answer Items (Grades 3–11) .................................... 131
Table 89. ELA/L Rater Agreements for Full-Write Items (Grades 3–11) .......................................... 132
Table 90. Mathematics Rater Agreements (Grades 3–11) ................................................................. 133
Table 91. Types of Online Score Reports by Level of Aggregation .................................................. 135
Table 92. Types of Subgroups ......................................................................................................... 135
Table 93. Overview of Quality Assurance Reports ........................................................................... 158

Idaho Standards Achievement Tests in English Language Arts and Mathematics
2018–2019 Technical Report
ix American Institutes for Research
LIST OF FIGURES
Figure 1. Standard Error of Measurements Across Estimated Theta Range ........................................ 54
Figure 2. ELA/L Smarter Balanced Cut Scores in Grades 7, 8, and 11 ............................................... 56
Figure 3. Mathematics Smarter Balanced Cut Scores in Grades 7, 8, and 11 ...................................... 57
Figure 4. ELA/L %Proficient Across Years (Grades 3–8 and 10) ....................................................... 71
Figure 5. Mathematics %Proficient Across Years (Grades 3–8 and 10) .............................................. 72
Figure 6. ELA/L and Mathematics %Proficient Across Years (Grades 9 and 11)................................ 73
Figure 7. ELA/L Average Scale Score Across Years (Grades 3–8 and 10) ......................................... 74
Figure 8. Mathematics Average Scale Score Across Years (Grades 3–8 and 10) ................................ 75
Figure 9. ELA/L and Mathematics Average Scale Score Across Years (Grades 9 and 11) .................. 76
Figure 10. Student Ability–Item Difficulty Distribution for ELA/L (Grades 3–8 and 10) ................... 82
Figure 11. Student Ability–Item Difficulty Distribution for ELA/L (Grades 9 and 11) ....................... 82
Figure 12. Student Ability–Item Difficulty Distribution by Claim: ELA/L (Grades 3–5) .................... 83
Figure 13. Student Ability–Item Difficulty Distribution by Claim: ELA/L (Grades 6–8, 10) .............. 84
Figure 14. Student Ability–Item Difficulty Distribution by Claim: ELA/L (Grades 9 and 11)............. 85
Figure 15. Student Ability–Item Difficulty Distribution for Mathematics (Grades 3–8 and 10)........... 86
Figure 16. Student Ability–Item Difficulty Distribution for Mathematics (Grades 9 and 11) .............. 86
Figure 17. Student Ability–Item Difficulty Distribution by Claim: Mathematics (Grades 3–5) ........... 87
Figure 18. Student Ability–Item Difficulty Distribution by Claim: Mathematics (Grades 6–8, 10) ..... 88
Figure 19. Student Ability–Item Difficulty Distribution by Claim: Mathematics (Grades 9 and 11) .... 89
Figure 20. Conditional Standard Error of Measurement for ELA/L (Grades 3–8 and 10) .................. 103
Figure 21. Conditional Standard Error of Measurement (Grades 9 and 11) ....................................... 104
Figure 22. Conditional Standard Error of Measurement for Mathematics (Grades 3–8 and 10) ......... 105
Figure 23. Conditional Standard Error of Measurement for Mathematics (Grades 9 and 11) ............. 106
LIST OF EXHIBITS
Exhibit 1. Home Page: State Level .................................................................................................. 136
Exhibit 2. Home Page: District Level .............................................................................................. 137

Idaho Standards Achievement Tests in English Language Arts and Mathematics
2018–2019 Technical Report
x American Institutes for Research
Exhibit 3. Subject Detail Page for ELA/L by Gender: District Level ................................................ 138
Exhibit 4. Claim Detail Page for Mathematics by LEP Status: District Level ................................... 139
Exhibit 5. Target Detail Page for ELA/L: School Level ................................................................... 140
Exhibit 6. Target Detail Page for ELA/L: Teacher Level ................................................................. 141
Exhibit 7. Target Detail Page for Mathematics: School Level .......................................................... 142
Exhibit 8. Target Detail Page for Mathematics: Teacher Level......................................................... 143
Exhibit 9. Trend Report for Mathematics: District Level.................................................................. 144
Exhibit 10. Student Detail Page for ELA/L ...................................................................................... 146
Exhibit 11. Student Detail Page for Mathematics ............................................................................. 147
Exhibit 12. Participation Rate Report at District Level ..................................................................... 148
Exhibit 13. State at a Glance ELA/L ................................................................................................ 149
LIST OF APPENDICES
Appendix A Summary of 2018–2019 Interim Assessments
Appendix B Student Performance Across Five Years for All Students and by Subgroup
Appendix C Classification Accuracy and Consistency Index by Subgroup
Idaho Standards Achievement Tests in English Language Arts and Mathematics
2018–2019 Technical Report
1 American Institutes for Research
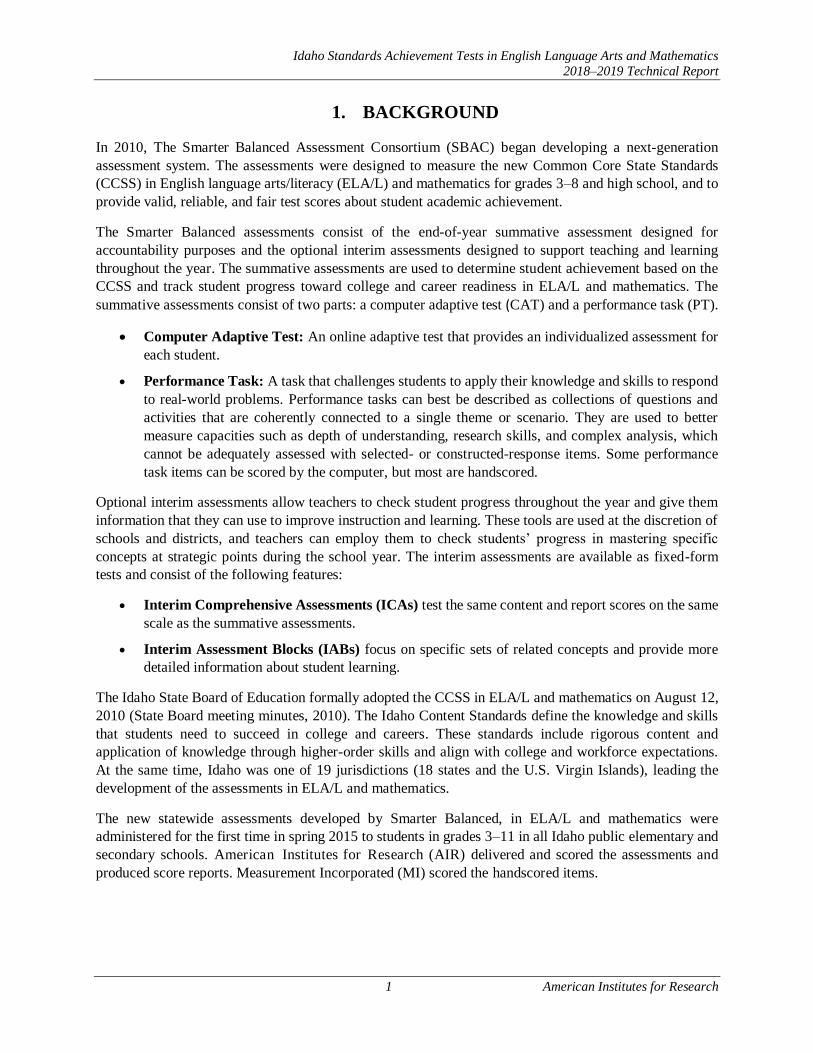
1. BACKGROUND
In 2010, The Smarter Balanced Assessment Consortium (SBAC) began developing a next-generation
assessment system. The assessments were designed to measure the new Common Core State Standards
(CCSS) in English language arts/literacy (ELA/L) and mathematics for grades 3–8 and high school, and to
provide valid, reliable, and fair test scores about student academic achievement.
The Smarter Balanced assessments consist of the end-of-year summative assessment designed for
accountability purposes and the optional interim assessments designed to support teaching and learning
throughout the year. The summative assessments are used to determine student achievement based on the
CCSS and track student progress toward college and career readiness in ELA/L and mathematics. The
summative assessments consist of two parts: a computer adaptive test (CAT) and a performance task (PT).
• Computer Adaptive Test: An online adaptive test that provides an individualized assessment for
each student.
• Performance Task: A task that challenges students to apply their knowledge and skills to respond
to real-world problems. Performance tasks can best be described as collections of questions and
activities that are coherently connected to a single theme or scenario. They are used to better
measure capacities such as depth of understanding, research skills, and complex analysis, which
cannot be adequately assessed with selected- or constructed-response items. Some performance
task items can be scored by the computer, but most are handscored.
Optional interim assessments allow teachers to check student progress throughout the year and give them
information that they can use to improve instruction and learning. These tools are used at the discretion of
schools and districts, and teachers can employ them to check students’ progress in mastering specific
concepts at strategic points during the school year. The interim assessments are available as fixed-form
tests and consist of the following features:
• Interim Comprehensive Assessments (ICAs) test the same content and report scores on the same
scale as the summative assessments.
• Interim Assessment Blocks (IABs) focus on specific sets of related concepts and provide more
detailed information about student learning.
The Idaho State Board of Education formally adopted the CCSS in ELA/L and mathematics on August 12,
2010 (State Board meeting minutes, 2010). The Idaho Content Standards define the knowledge and skills
that students need to succeed in college and careers. These standards include rigorous content and
application of knowledge through higher-order skills and align with college and workforce expectations.
At the same time, Idaho was one of 19 jurisdictions (18 states and the U.S. Virgin Islands), leading the
development of the assessments in ELA/L and mathematics.
The new statewide assessments developed by Smarter Balanced, in ELA/L and mathematics were
administered for the first time in spring 2015 to students in grades 3–11 in all Idaho public elementary and
secondary schools. American Institutes for Research (AIR) delivered and scored the assessments and
produced score reports. Measurement Incorporated (MI) scored the handscored items.

Idaho Standards Achievement Tests in English Language Arts and Mathematics
2018–2019 Technical Report
2 American Institutes for Research
1.1 UPDATES; 2015–2018
In 2015, as part of a scope of work in the Multi-Agency Assessment Cooperative (MAAC), AIR was tasked
to develop grades 9 and 10 ELA/L and mathematics tests on the basis of the grade 11 item pool in the
Smarter Balanced assessments shared by Idaho, West Virginia, and the U.S. Virgin Islands. The grades 9
and 10 tests would
• be calibrated on the Smarter Balanced grades 3–8 and 11 vertical scale;
• be administered as a computer-adaptive test; and
• have separate grade-specific cut scores.
AIR examined the CCSS for high school grades and concluded to use the grade 11 blueprint for grades 9
and 10 ELA/L. In mathematics, AIR created blueprints for grade 9 Integrated Mathematics I and grade 10
Integrated Mathematics II. AIR also set the cut scores for grades 9 and 10 in both ELA/L and mathematics
using a statistical method.
Idaho administered the high school assessment in grade 10, beginning in spring 2015. The state provides
assessments in grades 9 and 11, at the discretion of local education agencies to administer as an option.
House Bill 314, passed by the Idaho Legislature in the 2015 session mandated a review of the state’s ELA/L
and mathematics content standards, stating, “The state department of education shall begin to review the
Idaho's standards for learning of math and English language arts (ELA) in 2015. Idaho's content standards
of learning are intended to reinforce our commitment to maintaining a college and career ready standards.”
All stakeholders in Idaho were given the opportunity to voice their approval, or disapproval, of all standards
and provide actionable comments from August 12, 2015 to December 15, 2015 via an online platform.
Many avenues were utilized to elicit the maximum number of reviews statewide including radio and TV
ads reaching across Idaho. Once the challenge ended, all comments provided about specific standards were
evaluated by a team of Idaho educators and stakeholders. This team was composed of stakeholders
including K-12 teachers, administrators, higher education institutions, the PTA, parents, and business and
industry. The committee was selected from applications that were available statewide on the Idaho
Challenge home page by a team of stakeholders and the Idaho State Department of Education (SDE)
personnel. The criteria for selection of members was based on expertise, grade span experience, and
regional and stakeholder representation.
The team reviewed all actionable comments in face to face meetings on December 16 and 17, 2015.
Subsequently, the committee recommended 21 revisions or additions to the ELA/L standards and two
revisions to the mathematics standards. These revisions were taken to the Idaho State Board of Education
for approval before moving to the Idaho Legislature for final approval. The revisions were approved by the
2017 legislature.
1.2 CHANGES IN 2018–2019 SUMMATIVE ASSESSMENTS
In 2018, Smarter Balanced updated test blueprints of the ELA/L summative assessment, shortening the test
length by three to four items. The updated test blueprints were implemented in the 2018–2019 test
administration.
The purpose of the changes in the test blueprints was to reduce testing time burden by removing short
answer (SA) items while keeping the claim and target coverage specified in the test blueprint and the test
score reliability the same as the blueprint in previous years.

Idaho Standards Achievement Tests in English Language Arts and Mathematics
2018–2019 Technical Report
3 American Institutes for Research
In the CAT component, the requirement for short answer items in claim 1 reading and claim 2 writing were
removed in the grades 3–5 assessment while keeping the short answer item requirement in the grades 6–11
assessment. Four items were reduced in claim 2 writing and two items were added in claim 4 research. In
the PT component, one or two research items were removed and thus it consisted of one research item and
one full-write item. Overall test length (CAT and PT combined) was shortened by three to four items in the
ELA/L summative assessment. Table 1 shows a summary of the changes in the test blueprints in ELA/L.
Table 1. Changes in ELA/L Test Blueprints
Component Claim 2017–2018
BP
2018–2019
BP Changes in 2018–2019 BP
CAT
Claim 1 Reading* 14–19 14–19
Grades 3–5: Removed 0–1 short answer item
requirement.
Grades 6-11: No change
Claim 2 Writing 10 6
Grades 3–5: Removed one brief-write item
requirement and reduced the item requirement
by four items.
Grades 6–11: Reduced the item requirement
by four items.
Claim 3 Listening 8–9 8–9 No change
Claim 4 Research 6 8 Added two items
PT Claim 4 Research 2–3 1
Kept one DOK 3 item, with preference for
machine-scored item
Claim 2 Full-Write 1 1 No change
Note. * Required items for claim 1 reading are 14–16 in grades 3–5, 14–19 in grades 6–7, 16–19 in grade 8, and 15–16 in grades 9–11 in both the 2017–2018 and 2018–2019 test administrations.
1.3 IMPACT OF CHANGES IN 2018–2019 ELA/L TEST BLUEPRINTS
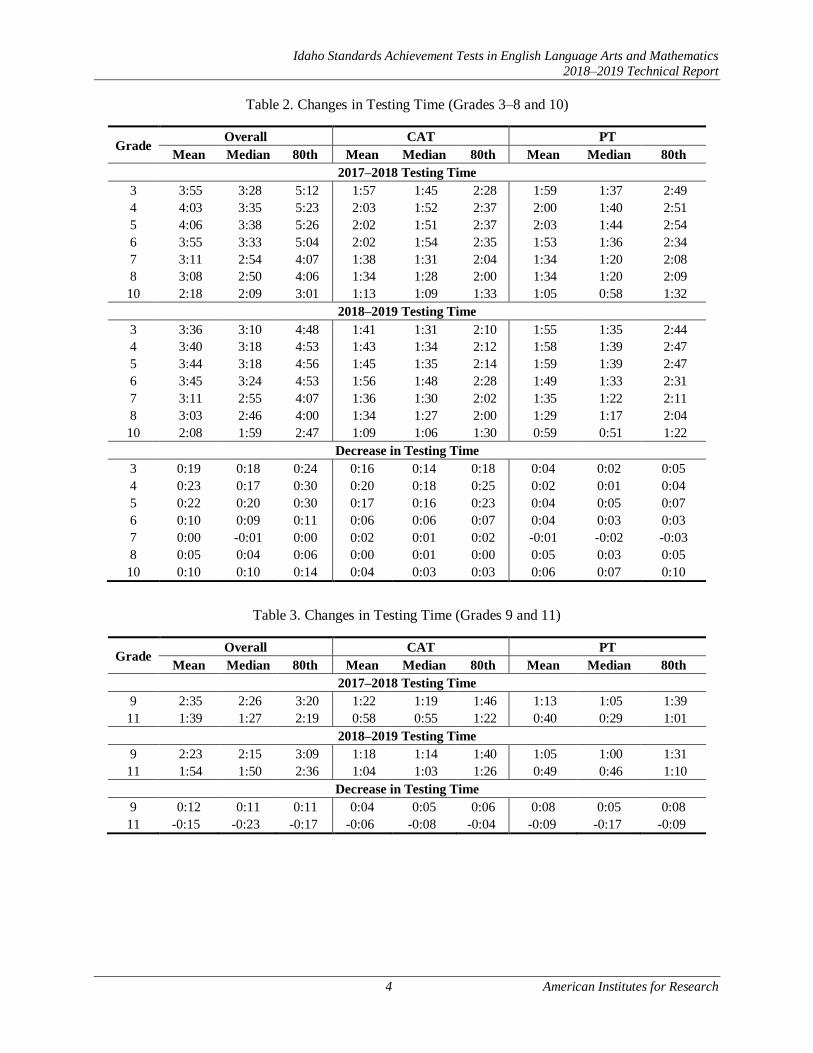
The impact of changes in the ELA/L test blueprints is presented in Tables 2–5. The total testing time was
reduced in all grades except for grades 7 and 11. As expected, the overall testing time was reduced more in
grades 3–5 than in upper grades because of the removal of short-answer (SA) items in claims 1 and 2 in
grades 3–5. The decrease in overall testing time for grades 3–5 was estimated to be 19 to 23 minutes on the
average and 24 to 30 minutes at the 80th percentile. The decrease in overall testing time for grades 6 and
8–10 was estimated to be 5 to 12 minutes on the average, and 6 to 14 minutes at the 80th percentile. The
overall testing time and the 80th percentile remains the same in grade 7 while the overall testing time and
the 80th percentile increased by 15 and 17 minutes in grade 11.
The test score reliabilities are similar for the overall scores and claims 1, 3, and 4 scores between the 2017–
2018 and 2018–2019 administrations. The reliability for claim 2 writing scores decreased slightly because
the total required items were reduced from 11 to 7 items in combined CAT and PT tests.
Idaho Standards Achievement Tests in English Language Arts and Mathematics
2018–2019 Technical Report
4 American Institutes for Research
Table 2. Changes in Testing Time (Grades 3–8 and 10)
Grade Overall CAT PT
Mean Median 80th Mean Median 80th Mean Median 80th
2017–2018 Testing Time
3 3:55 3:28 5:12 1:57 1:45 2:28 1:59 1:37 2:49
4 4:03 3:35 5:23 2:03 1:52 2:37 2:00 1:40 2:51
5 4:06 3:38 5:26 2:02 1:51 2:37 2:03 1:44 2:54
6 3:55 3:33 5:04 2:02 1:54 2:35 1:53 1:36 2:34
7 3:11 2:54 4:07 1:38 1:31 2:04 1:34 1:20 2:08
8 3:08 2:50 4:06 1:34 1:28 2:00 1:34 1:20 2:09
10 2:18 2:09 3:01 1:13 1:09 1:33 1:05 0:58 1:32
2018–2019 Testing Time
3 3:36 3:10 4:48 1:41 1:31 2:10 1:55 1:35 2:44
4 3:40 3:18 4:53 1:43 1:34 2:12 1:58 1:39 2:47
5 3:44 3:18 4:56 1:45 1:35 2:14 1:59 1:39 2:47
6 3:45 3:24 4:53 1:56 1:48 2:28 1:49 1:33 2:31
7 3:11 2:55 4:07 1:36 1:30 2:02 1:35 1:22 2:11
8 3:03 2:46 4:00 1:34 1:27 2:00 1:29 1:17 2:04
10 2:08 1:59 2:47 1:09 1:06 1:30 0:59 0:51 1:22
Decrease in Testing Time
3 0:19 0:18 0:24 0:16 0:14 0:18 0:04 0:02 0:05
4 0:23 0:17 0:30 0:20 0:18 0:25 0:02 0:01 0:04
5 0:22 0:20 0:30 0:17 0:16 0:23 0:04 0:05 0:07
6 0:10 0:09 0:11 0:06 0:06 0:07 0:04 0:03 0:03
7 0:00 -0:01 0:00 0:02 0:01 0:02 -0:01 -0:02 -0:03
8 0:05 0:04 0:06 0:00 0:01 0:00 0:05 0:03 0:05
10 0:10 0:10 0:14 0:04 0:03 0:03 0:06 0:07 0:10
Table 3. Changes in Testing Time (Grades 9 and 11)
Grade Overall CAT PT
Mean Median 80th Mean Median 80th Mean Median 80th
2017–2018 Testing Time
9 2:35 2:26 3:20 1:22 1:19 1:46 1:13 1:05 1:39
11 1:39 1:27 2:19 0:58 0:55 1:22 0:40 0:29 1:01
2018–2019 Testing Time
9 2:23 2:15 3:09 1:18 1:14 1:40 1:05 1:00 1:31
11 1:54 1:50 2:36 1:04 1:03 1:26 0:49 0:46 1:10
Decrease in Testing Time
9 0:12 0:11 0:11 0:04 0:05 0:06 0:08 0:05 0:08
11 -0:15 -0:23 -0:17 -0:06 -0:08 -0:04 -0:09 -0:17 -0:09

Idaho Standards Achievement Tests in English Language Arts and Mathematics
2018–2019 Technical Report
5 American Institutes for Research
Table 4. Changes in Test Score Reliabilities (Grades 3–8 and 10)
Grade Total Score Claim 1
Reading
Claim 2
Writing
Claim 3
Listening
Claim 4
Research
2017–2018 Administration
3 0.92 0.76 0.79 0.59 0.67
4 0.92 0.74 0.78 0.58 0.68
5 0.92 0.75 0.80 0.61 0.74
6 0.92 0.76 0.80 0.59 0.68
7 0.92 0.77 0.79 0.58 0.67
8 0.92 0.76 0.78 0.59 0.69
10 0.92 0.75 0.79 0.61 0.68
2018–2019 Administration
3 0.92 0.76 0.72 0.60 0.70
4 0.91 0.76 0.71 0.60 0.71
5 0.92 0.75 0.71 0.61 0.76
6 0.91 0.76 0.74 0.59 0.71
7 0.91 0.78 0.73 0.55 0.71
8 0.91 0.75 0.72 0.58 0.72
10 0.91 0.77 0.73 0.60 0.71
Table 5. Changes in Test Score Reliabilities (Grades 9 and 11)
Grade Total Score Claim 1
Reading
Claim 2
Writing
Claim 3
Listening
Claim 4
Research
2017–2018 Administration
9 0.91 0.73 0.76 0.58 0.66
11 0.91 0.69 0.80 0.60 0.57
2018–2019 Administration
9 0.91 0.76 0.71 0.58 0.70
11 0.92 0.79 0.74 0.64 0.71
This report provides a technical summary of the 2018–2019 summative assessments in ELA/L and
mathematics administered in grades 3–8 and 10, as the Idaho Standards Achievement Tests (ISAT) and
also provides information on the construction of grades 9 and 10 tests. The report includes nine chapters:
Overview, Test Administration, Construction of Grades 9 and 10 Tests, Summary of 2018–2019
Operational Test Administration, Validity, Reliability, Scoring, Reporting and Interpreting Scores, and
Quality Control Procedures. The data included in this report are based on Idaho data for the summative
assessment only. The data in the tables and appendices in this report include all students with valid test
scores in the test administration system. The data may not match final accountability reports or other data
files produced by the department of education. For the interim assessments, the number of students who
took ICAs and IABs and their performance are provided in Appendix A.
Although this report includes information on all aspects of the technical quality of the ISAT test
administration for Idaho, it is an addendum to the 2018–2019 Smarter Balanced technical report. The
information on item and test development, item content review, field-test administration, item data review,

Idaho Standards Achievement Tests in English Language Arts and Mathematics
2018–2019 Technical Report
6 American Institutes for Research
item calibrations, content alignment study, standard setting, and other validity information is included in
the Smarter Balanced technical report.
Smarter Balanced produces a report covering all technical aspects of the Smarter Balanced assessments
described in the Standards for Educational and Psychological Testing (American Educational Research
Association [AERA], American Psychological Association [APA], & National Council on Measurement in
Education [NCME], 2014) and the requirements of the U.S. Department of Education Peer Review of State
Assessment Systems Non-Regulatory Guidance for States (U.S. Department of Education, 2015). The
Smarter Balanced technical report includes information using the data at the consortium level, combining
data from the consortium states.

Idaho Standards Achievement Tests in English Language Arts and Mathematics
2018–2019 Technical Report
7 American Institutes for Research
2. TEST ADMINISTRATION
2.1 TESTING WINDOWS
The 2018–2019 Idaho Standards Achievement Tests (ISAT) English language arts/literacy (ELA/L) and
mathematics assessments testing window spanned approximately two months for the online summative
assessments and approximately eight months for the interim assessments. The paper-pencil fixed-form tests
for the summative assessments were administered over a six-week period during the online summative
assessment testing window. Table 6 shows the testing windows for both online and paper-pencil summative
and interim assessments.
Table 6. 2018–2019 Testing Windows
Tests Grade Start Date End Date Mode
Summative Assessments 3–11 3/18/2019 5/24/2019 Online Adaptive
3–11 4/1/2019 5/10/2019 Paper Fixed-Form
Interim Comprehensive Assessments 3–8, 11 8/9/2018
6/3/2019
3/13/2019
7/17/2019 Online Fixed-Form
Interim Assessment Blocks 3–8, 11 8/9/2018
6/3/2019
3/13/2019
7/17/2019 Online Fixed-Form
2.2 TEST OPTIONS AND ADMINISTRATIVE ROLES
The ISAT ELA/L and mathematics assessments are administered primarily online. To ensure that all
eligible students in the tested grades were given the opportunity to take the ISAT ELA/L and mathematics
assessments, several assessment options were available for the 2018–2019 administration to accommodate
students’ needs. Table 7 lists the testing options that were offered in 2018–2019. A testing option was
selected by content area. Once an option was selected, it applied to all tests in the content area.
Table 7. Summary of Tests and Testing Options in 2018–2019
Assessments Test Options Test Mode
Summative Assessments
English Online
Spanish (mathematics only) Online
Braille Online
Braille Paper
Regular Print Fixed-Form Paper
Large Print Fixed-Form Paper
Interim Assessments
English Online
Spanish (mathematics only) Online Braille Online
To ensure standardized administration conditions, teachers (TEs) and test administrators (TAs) follow
procedures outlined in the Idaho Assessment Systems Manual. TEs and TAs must review the manual before
testing to ensure that the testing room is prepared appropriately (e.g., removing certain classroom posters,
arranging desks) and read the boxed directions verbatim to students before and during testing to maintain
the standardized administration conditions. Make-up procedures should be established for any students who
are absent on testing day(s).

Idaho Standards Achievement Tests in English Language Arts and Mathematics
2018–2019 Technical Report
8 American Institutes for Research
2.2.1 Administrative Roles
The key personnel involved with the test administration are District Administrators (DAs), District Test
Coordinators (DCs), School Test Coordinators (SCs), TEs, and TAs. The main responsibilities of these key
personnel are described below. More detailed descriptions can be found in the manual, provided online at
https://idaho.portal.airast.org/core/fileparse.php/1519/urlt/Idaho-AlR-Systems-Manual.pdf.
District Administrator (DA)
The DA’s role is assigned by the Idaho State Department of Education (SDE). The DA is authorized to add
users to the Test Information Distribution Engine (TIDE) and to assign them any role except that of a DA.
DAs and DCs share many of the same test administration responsibilities. Their primary responsibility is
to coordinate the administration of the ISAT ELA/L and mathematics assessments in the district.
District Test Coordinator (DC)
The DC’s primary responsibility is to coordinate the administration of the ISAT ELA/L and mathematics
assessments in the district.
DCs are responsible for performing the following functions:
• Reviewing all state and Smarter Balanced policies and test administration documents
• Reviewing scheduling and test requirements with SCs, TEs, and TAs
• Working with SCs and Technology Coordinators to ensure that all systems, including the secure
browser, are properly installed and functioning
• Importing users (DCs, SCs, TEs, TAs) into TIDE
• Entering and verifying all student information, eligibility, and test settings in TIDE
• Scheduling and administering training sessions for all SCs, TEs, TAs, and Technology
Coordinators
• Ensuring that all personnel are trained on how to properly administer the ISAT ELA/L and
mathematics assessments
• Monitoring the secure administration of the test
• Investigating and recording all testing improprieties, irregularities, and breaches reported by the
TEs/TAs
• Attending to any secure materials in accordance with state and Smarter Balanced policies
School Test Coordinator (SC)
The SC’s primary responsibilities are to coordinate the administration of the ISAT ELA/L and mathematics
assessments and ensure that testing within his or her school is conducted in accordance with the test
procedures and security policies established by the Idaho SDE.
SCs are responsible for performing the following functions:
• Establishing a testing schedule with DCs, TEs, and TAs based on testing windows

Idaho Standards Achievement Tests in English Language Arts and Mathematics
2018–2019 Technical Report
9 American Institutes for Research
• Working with technology staff to ensure timely computer set-ups and installations
• Working with TEs and TAs to review student information in TIDE to ensure that student
information and test settings for designated supports and accommodations are correctly applied
• Entering student test settings in TIDE
• Identifying students who may require designated supports and test accommodations and ensuring
that procedures for testing these students follow state and Smarter Balanced policies
• Attending all district trainings and reviewing all state and Smarter Balanced policies and test
administration documents
• Ensuring that all TEs and TAs attend school or district trainings and review online training modules
posted on the portal
• Establishing secure and separate testing rooms if needed
• Monitoring secure administration of the test
• Monitoring testing progress during the testing window and ensuring that all students participate, as
appropriate
• Investigating and reporting all testing improprieties, irregularities, and breaches reported by the
TEs and TAs
• Attending to any secure material in accordance with state and Smarter Balanced policies
Teacher (TE)
A TE responsible for administering the ISAT ELA/L and mathematics assessments must have the same
qualifications as a TA. They also have the same test administration responsibilities as a TA. TEs can view
student results when they are made available. This role may also be assigned to teachers who do not
administer the test but will need access to student results.
Test Administrator (TA)
TAs are primarily responsible for administering the ISAT ELA/L and mathematics assessments. The TA
role does not allow access to student results and is designed for TAs, such as technology staff, who
administer tests but should not have access to student results.
TAs are responsible for performing the following functions:
• Completing ISAT ELA/L and mathematics assessments administration training
• Training and reviewing all state and Smarter Balanced policies and test administration documents
before administering any ISAT ELA/L and mathematics assessments
• Viewing student information before testing to ensure that a student receives the proper test with the
appropriate supports. TAs should report any potential data errors to SCs and DCs as appropriate.
• Administering the ISAT ELA/L and mathematics assessments
• Reporting all potential test security incidents to the SCs and DCs in a manner consistent with
Smarter Balanced, state, and district policies
Idaho Standards Achievement Tests in English Language Arts and Mathematics
2018–2019 Technical Report
10 American Institutes for Research
2.2.2 Online Administration
Within the state’s testing window, schools can set testing schedules, allowing students to test in intervals
(e.g., multiple sessions) rather than in one long period, minimizing the interruption of classroom instruction
and efficiently using its facility. With online testing, schools do not need to address the on-site storage and
security issues associated with large shipments of printed testing materials.
SCs oversee all aspects of testing at their schools and serve as the main point of contact; TEs and TAs
administer the assessments only. TEs and TAs are trained in the online testing requirements and the
mechanics of starting, pausing, and ending a test session. Training materials for the test administration are
available online and at regional face-to-face training sessions. All school personnel who serve as test
proctors are required to complete an online TA Certification Course before testing begins. Upon completion
of this course, staff members receive a certificate and authorization to log in to the online testing system.
To start a test session, the TE or TA must first access the TA Interface of the online testing system using
his or her own computer. A test session ID is generated when the test session is created. Students who are
taking the assessment with the TE or TA need to enter their Education Unique Identification (EDUID)
number, first name, and test session ID into the Student Interface using computers provided by the school.
The TE or TA then verifies that the students are taking the appropriate assessments with the appropriate
accessibility feature(s) (see Section 2.6 for a list of accommodations). Students can begin testing only when
the TE or TA confirms the settings. The TE or TA will then read aloud the Test Administration Directions
in the Idaho Assessment Systems Manual to the student(s) and guide them through the login process.
Once an assessment is begun, the student must answer all test questions presented on a page before
proceeding to the next page. Skipping questions is not permitted. For the online computer-adaptive
test (CAT), students are allowed to scroll back to review and edit previously answered items, as long as
these items are in the same test session and this session has not been paused for more than 20 minutes.
Students may review and edit previously completed responses until they submit the assessment. During an
active CAT session, if a student reviews and changes the response to a previously answered item, then the
responses to any following items to which the student already responded remain the same. No new items
are assigned to this student because he or she changed an answer. For example, a student paused for 10
minutes after completing item 10. After the pause, the student returned to item 5 and changed the answer.
If the response change in item 5 changed the item score from incorrect to correct, the student’s overall score
improves; however, there is no change in the scores for items 6–10.
For the performance tasks (PTs), there is no pause rule, but the same rules that apply to the CAT for reviews
and changes to responses also apply to PTs.
For the summative assessment, an assessment can be started in one test session and completed in a different
test session. For the CAT, the assessment must be completed within 45 calendar days of the start date or
the assessment opportunity will expire. For the PTs, the assessment must be completed within 20 calendar
days of the start date.
During a test session, TEs or TAs may pause the test for a student or group of students for a break. It is up
to the TEs or TAs to determine an appropriate stopping point; however, for ELA/L and mathematics CATs,
the assessments cannot be paused for more than 20 minutes to ensure the integrity of the test scores or
testing. If an assessment is paused for more than 20 minutes, the student must start a new test session and
resume testing at the next unanswered question where the test was paused. The student may not view or
edit any previous responses.

Idaho Standards Achievement Tests in English Language Arts and Mathematics
2018–2019 Technical Report
11 American Institutes for Research
The TE or TA must remain in the room at all times during a test session to monitor student testing. Once
the test session ends, the TE or TA must ensure that each student has successfully logged out of the system
and collect any handouts or scratch paper that students used during the assessment to securely shred them.
2.2.3 Paper-Pencil Test Administration
The paper-pencil versions of the ISAT ELA/L and mathematics assessments are provided as an
accommodation for students who do not have access to a computer or students with blindness or visual
impairments. For Idaho, paper-pencil tests were offered in regular print, braille, and large print formats.
In a district with student(s) who need to take the paper-pencil version of a test, the DA must submit a request
to SDE for appropriate materials on behalf of the student(s). If the request is approved, the testing contractor
will ship the appropriate test booklets, receipt instructions, and return instructions to the district.
Separate test booklets are used for ELA/L and mathematics assessments. The items from the CAT and the
PT components are combined into one test booklet, including two sessions for the CAT and one session for
the PT in both content areas. Thus, the TE or TA can break up the assessment into separate sessions.
After the student has completed the assessments, the TE must transcribe the student’s responses into the
Data Entry Interface (DEI) and return the test booklets to the testing vendor. The testing vendor will score
the handscored items. Once the handscored items are scored, scores will be combined with the non-
handscored items, and the final score will appear in the Online Reporting System (ORS).
The total number of students who took paper-pencil tests is presented in Table 8.
Table 8. Number of Students Who Took Paper-Pencil Tests
in 2018–2019 Summative Test Administration
Subject G3 G4 G5 G6 G7 G8 G9 G10 G11 Total
ELA/L 4 4 6 2 3 19
Mathematics 4 4 7 1 2 3 21
2.2.4 Braille Test Administration
The adaptive braille test was available with the same test blueprint in English in both ELA/L and
mathematics. In the 2018–2019 test administration, Smarter Balanced added the Braille Hybrid Adaptive
Test (Braille HAT) for mathematics. The Braille HAT consists of a fixed-form segment, a computer-
adaptive segment, and a fixed-form PT. The fixed-form segment includes items with tactile graphics which
can be embossed at the testing location or received as a package of pre-embossed materials through the
SDE. All items on the Braille HAT can be presented to the students using a Refreshable Braille Display
(RBD).
The braille interface is described below:
• The braille interface includes a text-to-speech component for mathematics consistent with the read-
aloud assessment accommodation. The Job Access with Speech (JAWS) screen reading software
provided by Freedom Scientific is an essential component that students use with the braille
interface.

Idaho Standards Achievement Tests in English Language Arts and Mathematics
2018–2019 Technical Report
12 American Institutes for Research
• Mathematics items are presented to students in Nemeth Braille code via a braille embosser through
the adaptive online summative test and a fixed-form PT.
• Students taking the summative ELA/L assessment can emboss both reading passages and items as
they progress through the assessment. If a student has an RBD, a 40-cell RBD is recommended.
The summative ELA/L is presented to the student with items in either contracted or uncontracted
Literary Braille (for items containing only text) and via a braille embosser (for items with tactile or
spatial components that cannot be read by an RBD).
Before administering the online summative assessments using the braille interface, TEs or TAs must ensure
that the technical requirements are met. These requirements apply to the student’s computer, the TE/TA’s
computer, and any assistive braille technologies used in conjunction with the braille interface.
2.3 TRAINING AND INFORMATION FOR TEST COORDINATORS AND ADMINISTRATORS
All DAs, DCs, and SCs oversee all aspects of testing at their schools and serve as the main point of contact,
while TEs and TAs administer the online assessments. The online TA Certification Course, webinars,
manuals, and regional training sites are used to train TEs and TAs on the online testing requirements and
the mechanics of starting, pausing, and ending a test session. Training materials for the administration are
available online (http://idaho.portal.airast.org/resources).
2.3.1 Online Training
Multiple training opportunities were offered to key staff through the Internet.
TA Certification Course
All school personnel who serve as test proctors are required to complete an online TA Certification Course
to administer assessments. This web-based course is about 20 minutes long and covers information on
testing policies and the steps for administering a test session in the online system. The course is interactive,
requiring participants to practice starting test sessions under different scenarios. Throughout the training
and at the end of the course, participants are required to answer multiple-choice questions about the
information provided. Completion of the TA Certification Course is tracked online in the Test Information
Distribution Engine (TIDE).
Webinars
The following training modules were offered to the field:
Idaho Alternate Assessment (IDAA) Tutorial: March 1, 2018. This video provides a 20-minute walk-
through of the various steps needed for a student to participate and complete the Alternate Assessment in
ELA and Mathematics.
New Test Coordinator Video Tutorial: October 12, 2018. This video provides guidance to Idaho educators
on all the important information regarding the Idaho Assessment Systems. It provides detailed directions
on how to access the resources available on the ISAT portal.
Interim Assessment Implementation Video Tutorial: December 12, 2018. This video tutorial outlines the
tasks for administering and scoring Interim Assessments (ICAs and IABs). The optional Interim
Assessments are given to students throughout the year to help teachers monitor student progress. This video
also provides information on all available materials and resources specific to Interim Assessments.
Idaho Standards Achievement Tests in English Language Arts and Mathematics
2018–2019 Technical Report
13 American Institutes for Research
TIDE Video Tutorial Part 1 and 2: December 14, 2018. These videos provide guidance on the Test
Information Distribution Engine (TIDE). Part 1 includes details on activating your TIDE password, logging
in, and resetting your password, as well as the tasks required to add, view, and edit users, students, and
student test settings. Part 2 includes details on creating and printing rosters, printing test tickets and student
test settings, and the several reports available for monitoring test progress throughout your district or school.
Test Administration Interface and Student Interface Video Tutorial: January 11, 2019. This video provides
a walk-through of the test session setup and student sign-in process. This video tutorial also demonstrates
how students can navigate the practice tests, Interim assessments, and Summative assessments offered
through AIR.
Practice and Training Test Site
In August 2018, separate training sites were opened for TEs, TAs, and students. TEs and TAs can practice
administering assessments and starting and ending test sessions on the TA Training Site, and students can
practice taking an online assessment on the Student Practice and Training Site. The ISAT ELA/L and
mathematics assessments practice tests mirror the corresponding Summative assessments for ELA/L and
mathematics. Each test provides students with a grade-specific testing experience, including a variety of
question types and difficulty levels (approximately 30 items each in ELA/L and mathematics), as well as a
performance task.
The training tests are designed to provide students and teachers with opportunities to quickly familiarize
themselves with the software and navigational tools they will use for the ISAT ELA/L and mathematics
assessments. Training tests are available for both ELA/L and mathematics and are organized by grade bands
(grades 3–5, 6–8, and 9–11), with each test containing 5–10 questions.
A student can log in directly to the practice and training test site as a “Guest” without a TA-generated test
session ID, or the student can log in through a training test session created by the TE or TA in the TA
Training Site. Items in the student training test include all item types that are included in the operational
item pool, including multiple-choice, grid, and natural-language items. Teachers can also use these training
tests to help students become familiar with the online platform and question types.
Manuals and User Guides
The following manuals and user guides are available on the ISAT portal (http://idaho.portal.airast.org):
The Idaho Assessment Systems Manual – AIR Systems User Guide combines the following documents into
one comprehensive manual as unique chapters:
• The Test Information Distribution Engine (TIDE) User Guide is designed to help users navigate
TIDE. Users can find information on managing user account information, student account
information, student test settings, student accommodations, appeals, and rosters.
• The Test Administrator User Guide is designed to help users navigate the test delivery system
(TDS), including the Student Interface and the TA Interface, and to help support TAs in managing
and administering online testing for students.
• The Interim Test Administration Manual describes the Interim assessments and provides
administration details and policy information for District Coordinators and School Test
Coordinators regarding policies and procedures for the Interim assessments.
Idaho Standards Achievement Tests in English Language Arts and Mathematics
2018–2019 Technical Report
14 American Institutes for Research
• The Assessment Viewing Application (AVA) User Guide provides an overview of how to access
and use AVA, which allows teachers to view items on the Interim assessments.
• The AIRWays Reporting User Guide provides instructions and support for users viewing
performance reports for Interim assessments. This user guide is intended for district-level, school-
level, and classroom teacher users.
• The Online Reporting System (ORS) User Guide provides information about the ORS, including
instructions for viewing score reports, accessing test management resources, creating and editing
rosters, and searching for students.
• The Test Improprieties in TIDE chapter provides guidance on how to correctly identify and escalate
test improprieties to the SDE by giving specific examples of test improprieties and suggested
actions in TIDE.
• The Online Summative Test Administration Manual provides information for District Coordinators
and School Test Coordinators regarding policies and procedures for the 2018–2019 ISAT ELA/L
and mathematics assessments. This manual also provides information for TEs and TAs
administering the ISAT ELA/L and mathematics assessments. It includes screen captures and step-
by-step instructions on how to administer the online tests.
• The Data Entry Interface (DEI) is a component of the TDS that allows authorized users to enter
student assessment data, such as item responses and scores.
• The Braille Requirements and Testing provides information about supported hardware and
software requirements for Braille testing and instructions for configuring JAWS. Information about
navigating an online Braille test using JAWS is also included.
• The Paper-Pencil Test Administration Quick Reference provides administration information for
accommodated tests administered on paper.
The Comprehensive Technology Manual for Technology Coordinators combines the following documents
into one comprehensive manual as unique chapters:
• The System Requirements for Online Testing outlines the basic technology requirements for
administering an online assessment, including operating system requirements and supported web
browsers.
• The Secure Browser Installation Manual provides instructions for downloading and installing the
secure browser on supported operating systems used for online assessments.
• The Technical Specifications Manual for Online Testing provides technology staff with the
technical specifications for online testing, including information on Internet and network
requirements, general hardware and software requirements, and the text-to-speech function.
• The Operating System Support Plan describes AIR’s plan for supporting operating systems during
the upcoming test administration and following years. This plan helps districts and schools manage
operating system deployments based on the support timelines.
• The Voice Pack Installation Guide provides information on how to install the NeoSpeech™ Voice
Pack on Windows operating systems for students that use this operating system and require the
text-to-speech accommodation. The voice pack is available in TIDE.
Idaho Standards Achievement Tests in English Language Arts and Mathematics
2018–2019 Technical Report
15 American Institutes for Research
The User Roles Chart provides a brief overview of tasks within each of AIR’s systems, which users can
access each system, and features and tasks within each system.
All manuals and user guides pertaining to 2018–2019 online testing are available on the portal. DAs, DCs,
and SCs can use these manuals and user guides to train TEs and TAs regarding test administration policies
and procedures.
Quick Guides
The following quick guides were created to highlight the most important information for all the systems
used in the ISAT ELA/L and mathematics assessments.
The AIRWays Reporting Quick Guide provides instructions and support for users viewing the 2018–2019
Interim Assessment performance reports and handscoring information in AIRWays Reporting.
The ISAT Portal Quick Guide outlines the ISAT portal and the AIR systems available for the 2018–2019
school year.
The Dual Enrollments in TIDE Quick Guide describes a new feature in TIDE for users to have the ability
to enroll students in multiple districts or schools.
The Test Administration Quick Guide provides information to help users access and navigate the TA
Interface.
The Test Information Distribution Engine (TIDE) Quick Guide assist users in the field with creating
accounts for users and students in TIDE.
The Quick Guide to Printing Individual Student Reports (ISRs) in ORS provides information to users in the
field on how to quickly print ISRs for the assessments appearing in the ORS.
The Sample Tests Quick Guide provides directions to administer sample tests for the ISAT ELA/L and
Mathematics, Science and End-of-Course Assessments, and Alternate Assessment ELA/L and Mathematics
Assessments.
Training Modules
The following training modules were created to help users in the field understand the overall ISAT ELA/L
and mathematics assessments as well as how each system works. The modules were provided as PowerPoint
presentations.
Accessibility and Accommodations Training Module: This module provides a general overview of the
accessibility and accommodations tools available for students taking the ELA/L and mathematics
assessments in the TDS.
AIRWays Reporting Training Module: This module is designed to help district-level, school-level, and
classroom teachers navigate and view the Interim assessment student performance reports.
AIRWays Reporting Tutorials: These tutorials explain how to navigate AIRWays Reporting. The following
tutorials were presented to users:
1. How to Access AIRWays Reporting for Districts
2. How to Access AIRWays Reporting for Schools

Idaho Standards Achievement Tests in English Language Arts and Mathematics
2018–2019 Technical Report
16 American Institutes for Research
3. How to Access AIRWays Reporting for Teachers
4. How to Modify Scores
5. How to Handscore Unscored Items
6. How to Access Longitudinal Reports
7. How to Export and Print Student Data
8. How to Create, Manage, and Edit Rosters
9. How to Set Up Your Reports So They Make Sense
Assessment Viewing Application (AVA) Module: This module explains how to navigate the Assessment
Viewing Application. AVA allows authorized users to view the Interim Comprehensive Assessments
(ICAs) and Interim Assessment Blocks (IABs) for administrative and instructional purposes.
Embedded Universal Tools and Online Features Module: This module acquaints students and teachers with
the online, universal tools (e.g., types of calculators, expandable text) available in the ISAT ELA/L and
mathematics assessments.
Online Reporting System (ORS) Tutorials: These tutorials explain how to navigate the ORS, including
summary statistics, student results, and score reports. The following tutorials were presented to users:
1. Defining Student Population
2. Creating Rosters
3. Viewing and Editing Rosters
4. Printing Reports
5. Using the Exploration Menu
6. Viewing Claim Detail Reports
7. Viewing Target Reports
8. Viewing Item Detail Reports
9. Viewing Reports by Demographic Sub-Groups
10. Downloading Individual Student Reports with Manifest Tutorial
11. Downloading Student Data Files
12. Printing Spanish Individual Student Reports (ISRs) – Open Captions
13. Printing Spanish Individual Student Reports (ISRs) – Closed Captions
Online Reporting System (ORS) Training Module: This training module provides information about all
ORS’s features, including instructions for viewing score reports, generating and exporting summary
statistics and student results, and adding and updating rosters.
Online Testing Braille Training Module: This module provides detailed information on how to administer
tests to students using online braille tests for the ELA/L and mathematics ISAT assessments.
Performance Task Overview Module: This module provides an overview of the performance tasks.

Idaho Standards Achievement Tests in English Language Arts and Mathematics
2018–2019 Technical Report
17 American Institutes for Research
Technology Requirements for Online Testing Module: This module provides current information about
technology requirements, site readiness, supported devices, and secure browser installation, and is designed
to help Technology Coordinators prepare for the administration of online tests.
Test Administrator Interface and Student Interface Tutorial: This tutorial provides a 16-minute overview
of the test session setup and student sign-in process. This video tutorial also demonstrates how students can
navigate the practice tests, Interim assessments, and Summative assessments offered through AIR.
What Is a CAT? Module: This module describes the computer-adaptive test (CAT) and its role in taking
ELA/L and mathematics online assessments.
2.3.2 District Training Workshops
District Training Workshops (known locally as Assessment Roadshows) were held on January 31, February
5, and February 8, 2019, at three locations across the state of Idaho. Training was provided for the
administration of the ISAT ELA/L and mathematics assessments. During the training, district staff were
provided with information to support training their district and school staff. The following topics were
discussed during these workshops:
The Test Information Distribution Engine (TIDE) Roadshow Presentation addresses numerous topics in
TIDE, including tasks that typically take place before testing, during test administration, and after testing
has concluded.
The Technology Requirements for Online Testing and the Test Delivery System (TDS) Roadshow
Presentation assists users in the field to understand technology requirements, the TA Interface that TAs use
to administer online tests, and the Student Interface that students use to take online tests.
The Online Reporting System (ORS) Roadshow Presentation assists users in the field by providing
assessment data and tools in order to better understand student performance.
The Writing 3D-Science Assessment Entities Roadshow Presentation explains the 3-dimensional science
standards that students will be tested on in future school years.
The Troubleshooting Common Issues Roadshow Presentation provides guidance on how to reduce test
improprieties and testing delays.
2.4 TEST SECURITY
All test items, test materials, and student-level testing information are secured materials for all assessments.
The importance of maintaining test security and the integrity of test items is stressed throughout the webinar
trainings and in the user guides, modules, and manuals. Features in the testing system also protect test
security. This section describes system security, student confidentiality, and policies on testing
improprieties.
2.4.1 Student-Level Testing Confidentiality
All secured websites and software systems enforce role-based security models that protect individual
privacy and confidentiality in a manner consistent with the Family Educational Rights and Privacy Act
(FERPA) and other federal laws. Secure transmission and password-protected access are basic features of
the current system and ensure authorized data access. All aspects of the system, including item development

Idaho Standards Achievement Tests in English Language Arts and Mathematics
2018–2019 Technical Report
18 American Institutes for Research
and review, test delivery, and reporting, are secured by password-protected logins. Our systems use role-
based security models that ensure that users may access only the data to which they are entitled and may
edit data only in accordance with their user rights.
There are three elements related to ensuring that the correct students are accessing appropriate test content:
1. Test eligibility, which refers to the assignment of a test for a particular student
2. Test accommodation, which refers to the assignment of a test setting to specific students based on
needs
3. Test session, which refers to the authentication process of a TE or TA creating and managing a test
session, the TE or TA reviewing and approving a test (and its settings) for every student, and the
student logging in to take the test
FERPA prohibits the public disclosure of student information or test results. Examples of prohibited
practices include
• providing login information (username and password) to other authorized TIDE users or to
unauthorized individuals;
• sending a student’s name and EDUID number together in an email message; and
• having students log in and test under another student’s EDUID number.
Test materials and score reports should not be exposed to identify student names with test scores except by
authorized individuals with an appropriate need-to-know status. If information about an individual test must
be sent via email or fax, include only the EDUID number, not the student’s name.
All students, including home-schooled students, must be enrolled or registered at their testing schools in
order to take the online or paper-pencil assessments. Student enrollment information, including
demographic data, is uploaded by the districts to TIDE during the school year. For any updates to student
information needed throughout the year, the DAs, DCs, and SCs must update the student information in
TIDE.
Students log in to the online assessment using their legal first name, EDUID number, and a test session ID.
Only students can log in to an online test session. TEs, TAs, proctors, or other personnel are not permitted
to log in to the system on behalf of students, although they are permitted to assist students who need help
logging in. For the paper-pencil versions of the assessments, DAs, DCs, SCs, TEs, or TAs are required to
enter student responses into the Data Entry Interface (DEI) site in order to receive scores for students testing
on paper.
After a test session, only staff with the administrative roles of DAs, DCs, SCs, or TEs can view their
students’ scores in the OORS. TAs do not have access to student scores.
2.4.2 System Security
The objective of system security is to ensure that all data are protected and accessed appropriately by the
right user groups. It is about protecting data and maintaining data and system integrity as intended,
including ensuring that all personal information is secured, that transferred data (whether sent or received)
is not altered in any way, that the data source is known, and that any service or activity can be performed
by a specific, designated user only.

Idaho Standards Achievement Tests in English Language Arts and Mathematics
2018–2019 Technical Report
19 American Institutes for Research
A hierarchy of control: As described in Section 2.2, DAs, DCs, SCs, TAs, and TEs have well-defined
roles and access to the testing system. Districts are responsible for adding users’ access to the AIR systems
through TIDE. DAs must contact SDE to be added to TIDE. DAs are then responsible for selecting and
entering DC and SC information into TIDE, and DCs and SCs are responsible for entering TA and TE
information into TIDE. Throughout the year, the DAs, DCs, and SCs are also expected to delete user
information in TIDE for staff members who have transferred to other schools, resigned, or no longer serve
as TAs or teachers.
Password protection: All access points by different roles—at the state, district, and school levels—require
a password to log in to the system. Newly added users receive passwords through their personal email
addresses or school-assigned email addresses.
Secure Browser: A key role of the Technology Coordinator is to ensure that the secure browser is properly
installed on the computers used for the administration of the online assessments. Developed by the testing
contractor, the secure browser prevents students from accessing other computers or Internet applications
and from copying test information. The secure browser suppresses access to commonly used browsers such
as Internet Explorer and Firefox and prevents students from searching for answers on the Internet or
communicating with other students. The assessments can be accessed only through the secure browser and
not by other Internet browsers.
2.4.3 Security of the Testing Environment
The DCs, SCs, TEs, and TAs work together to determine appropriate testing schedules based on the number
of computers available, the number of students in each tested grade, and the average length of time needed
to complete each assessment.
Testing personnel are reminded in the online training, face-to-face training, and user manuals that
assessments should be administered in testing rooms that do not crowd students. Good lighting, ventilation,
and freedom from noise and interruption are important factors to consider when selecting testing rooms.
TEs and TAs must establish procedures to maintain a quiet environment during each test session,
recognizing that some students may finish more quickly than others. If students are allowed to leave the
testing room when they finish, TEs or TAs are required to explain the procedures for leaving without
disrupting others and to clarify where they are expected to report once they leave. If students are expected
to remain in the testing room until the end of the session, TEs or TAs are encouraged to prepare some quiet
work for students to do after they finish the assessment.
If a student needs to leave the room for a brief time, the TEs or TAs are required to pause the student’s
assessment. For the CAT, if the pause lasts longer than 20 minutes, the student can continue with the rest
of the assessment in a new test session, but the system will not allow the student to return to the items
presented before the pause. This measure is implemented to prevent students from using the time to look
up or verify answers.
Room Preparation
The room should be prepared before the start of the test session. Any information displayed on bulletin
boards, chalkboards, or charts that students might use to help answer test questions should be removed or
covered. This rule applies to rubrics, vocabulary charts, student work, posters, graphs, content-area strategy
charts, etc. The cell phones of both testing personnel and students must be turned off and stored out of sight
in the testing room. TEs and TAs are encouraged to minimize access to the testing rooms by posting signs

Idaho Standards Achievement Tests in English Language Arts and Mathematics
2018–2019 Technical Report
20 American Institutes for Research
in halls and entrances in order to promote optimum testing conditions; they should also post “TESTING—
DO NOT DISTURB” signs on the doors of testing rooms.
Seating Arrangements
TEs and TAs should provide adequate spacing between students’ seats. Students should be seated so that
they will not be tempted to look at the answers of others. Because the online CAT is adaptive, it is unlikely
that students will see the same test questions as other students; however, through appropriate seating
arrangements, students should be discouraged from communicating. For the performance tasks, different
forms are spiraled within a classroom so that students receive different forms of the performance tasks.
After the Test
TEs or TAs must walk through the classroom to pick up any scratch paper that students used and any papers
that display students’ EDUID numbers and names together at the end of a test session. These materials
should be securely shredded or stored in a locked area immediately. The printed reading passages and
questions for any content area assessment provided for a student who is allowed to use this accommodation
in an individual setting must also be shredded immediately after a test session ends.
For the paper-pencil versions, specific instructions are provided in the Paper-Pencil Test Administration
Manual on how to package and secure the test booklets to be returned to the testing contractor’s office after
student responses have been entered into the DEI site.
2.4.4 Test Security Violations
Everyone who administers or proctors the assessments is responsible for understanding the security
procedures for administering them. Prohibited practices as detailed in the Idaho Assessment Systems
Manual fall into one of three categories:
Impropriety: This is a test security incident that has a low impact on the individual or group of students
who are testing and has a low risk of potentially affecting student performance on the test, test security, or
test validity (e.g., student[s] leaving the testing room without authorization).
Irregularity: A test security incident that impacts an individual or group of students who are testing and
may potentially affect student performance on the test, test security, or test validity. These circumstances
can be contained at the local level (e.g., disruption during the test session, such as a fire drill).
Breach: A test security incident that poses a threat to the validity of the test. Breaches require immediate
attention and escalation to the state agency. Examples may include such situations as exposure of secure
materials or a repeatable security/system risk. These circumstances have external implications
(e.g., administrators modifying student answers or students sharing test items through social media).
District and school personnel must document all test security incidents in the test security incident log on
the SDE website (https://apps.sde.idaho.gov/testincidentlog). This log is the document of record for all test
security incidents and should be maintained at the district level and submitted to the SDE as incidents occur
throughout testing.
2.5 STUDENT PARTICIPATION
All students (including retained students) currently enrolled in grades 3–8 and 10 at public schools in Idaho
are required to participate in the ISAT ELA/L and mathematics assessments. Testing at grades 9 and 11 is
Idaho Standards Achievement Tests in English Language Arts and Mathematics
2018–2019 Technical Report
21 American Institutes for Research
optional. Students must be tested in the enrolled grade assessment; out-of-grade-level testing is not allowed
for the administration of the ISAT ELA/L and mathematics assessments.
2.5.1 Homeschooled Students
Students who are homeschooled may participate in the ISAT ELA/L and mathematics assessments at the
request of their parent or guardian. Schools must provide these students with one testing opportunity for
each relevant content area if requested.
2.5.2 Exempt Students
The following students are exempt from participating in the ISAT ELA/L and mathematics assessments:
• Foreign exchange students who are enrolled in a U.S. school
• English learners (ELs) who enrolled in a U.S. school within the last 12 months before the beginning
of testing have a one-time exemption; these students may instead participate in the English
language proficiency assessment consistent with state and federal policies. ELs are not exempt from
completing the mathematics assessment.
• A student with significant cognitive disabilities who meets the criteria for a state-selected or state-
developed ELA/L and mathematics alternative assessment based on alternative achievement
standards (approximately 1% or fewer of the student population). Students meeting these criteria
are not exempt from testing; they are exempt only from completing the ISAT ELA/L and
mathematics assessments.
School personnel should follow federal and state policies regarding student participation.
2.6 ONLINE TESTING FEATURES AND TESTING ACCOMMODATIONS
The Smarter Balanced Assessment Consortium’s Usability, Accessibility, and Accommodations Guidelines
(UAAG) are intended for school-level personnel and decision-making teams, including Individualized
Education Program (IEP) and Section 504 Plan teams, as they prepare for and implement the Smarter
Balanced assessments. The UAAG provide information for classroom teachers, English language
development educators, special education teachers, and instructional assistants to use in selecting and
administering universal tools, designated supports, and accommodations for those students who need them.
The UAAG are also intended for assessment staff and administrators who oversee the decisions that are
made in instruction and assessment.
The UAAG apply to all students. They emphasize an individualized approach to the implementation of
assessment practices for those students who have diverse needs and participate in large-scale content
assessments. The UAAG focus on universal tools, designated supports, and accommodations for the ISAT
ELA/L and mathematics assessments. At the same time, the UAAG support important instructional
decisions about accessibility and accommodations for students who participate in the ISAT ELA/L and
mathematics assessments.
The Summative assessments contain universal tools, designated supports, and accommodations in both
embedded and non-embedded versions. Embedded resources are part of the computer-adaptive test
administration system, whereas non-embedded resources are provided outside of that system.

Idaho Standards Achievement Tests in English Language Arts and Mathematics
2018–2019 Technical Report
22 American Institutes for Research
State-level users, DAs, DCs, and SCs can set embedded and non-embedded designated supports and
accommodations based on their specific user roles. Designated supports and accommodations must be set
in TIDE before starting a test session.
All embedded and non-embedded universal tools are available to all students during a test session. A TE or
TA can deactivate any of the preselected universal tools in the TA Interface of the testing system for a
student who may be distracted by the ability to access a specific tool during a test session.
For additional information about the availability of designated supports and accommodations, refer to the
Usability, Accessibility, and Accommodations Guidelines at http://idaho.portal.airast.org.
2.6.1 Online Universal Tools for All Students
Universal tools are access features of an assessment or exam that are embedded or non-embedded
components of the test administration system. Universal tools are available to all students based on their
preference and selection and have been preset in TIDE. In the 2018–2019 test administration, the following
features of universal tools were available for all students to access. For specific information on how to
access and use these features, refer to the Idaho Assessment Systems Manual at http://idaho.portal.airast.org.
Embedded Universal Tools
Calculator: Students can access an embedded on-screen digital calculator for calculator-allowed items by
clicking the calculator button. This tool is available with the specific items that the Smarter Balanced Item
Specifications indicate are appropriate only.
Digital Notepad: This tool is used for making notes about an item. The digital notepad is item-specific and
is available through the end of the test segment. Notes are not saved when the student moves on to the next
segment or after a break of more than 20 minutes.
English Dictionary: An on-screen English dictionary is available for the full-write portion of an ELA/L
performance task.
English Glossary: Grade- and context-appropriate definitions of specific construct-irrelevant terms are
shown in English on the screen via a pop-up window. The student can access the embedded glossary by
clicking any of the pre-selected terms.
Expandable Items: Each item can be expanded so that it takes up a larger portion of the screen, requiring
less scrolling by the student.
Expandable Passages: Each passage or stimulus can be expanded so that it takes up a larger portion of the
screen, requiring less scrolling by the student.
Global Notes: This digital notepad is available for the full-write portion of ELA/L performance tasks. The
student clicks the notepad icon for the notepad to appear. During the ELA/L performance tasks, notes are
retained from segment to segment so that the student can return to them even though he or she cannot go
back to specific items in any previous segment.
Highlighter: This tool is used to highlight passages or sections of passages and test questions.
Keyboard Navigation: Navigation throughout a text can be accomplished by using a keyboard.
Line Reader: This tool is used to highlight an individual line of text in a passage or test question.
Idaho Standards Achievement Tests in English Language Arts and Mathematics
2018–2019 Technical Report
23 American Institutes for Research
Mark for Review: The student can mark a question for review in order to return to it later. However, for the
CAT, if the assessment is paused for more than 20 minutes, students will not be allowed to return to marked
test questions.
Mathematics Tools: These digital tools (e.g., embedded ruler or protractor) are used for measurements and
are available only with the mathematics items for which the Smarter Balanced Item Specifications deem
them to be appropriate.
Pause: The student can pause the assessment and return to the test question they were working on. However,
if an assessment is paused for more than 20 minutes, students will not be allowed to return to previous test
questions.
Spellcheck: This tool is used to check the spelling of words in student-generated responses. Spellcheck
indicates only that a word is misspelled; it does not provide the correct spelling. This tool is available only
with the specific items for which the Smarter Balanced Item Specifications indicated that it would be
appropriate. Spellcheck is bundled with other embedded writing tools for all full-write portions of a
performance task (planning, drafting, revising, and editing). A full-write is the second part of a performance
task.
Strikethrough: This tool allows students to cross out response options using the strikethrough function.
Take as much time as needed to complete the ISAT ELA/L and mathematics assessments: Testing may be
split across multiple sessions so that the testing does not interfere with class schedules. The CAT assessment
must be completed within 45 calendar days of its start date. Performance tasks must be completed within
20 calendar days of the date on which each task is started.
Thesaurus: A thesaurus can be provided for the full-write portion of an ELA/L performance task. A full-
write is the second part of a performance task. The use of this universal tool may result in the student
needing additional overall time to complete the assessment.
Writing Tools: Selected writing tools (e.g., bold, italics, bullets, and undo/redo) are available for all student-
generated responses.
Zoom In: Students are able to zoom in on test questions, text, or graphics.
Non-Embedded Universal Tools
Breaks: Breaks may be given at predetermined intervals or after completion of sections of the assessment
for students taking a paper-pencil test. Sometimes, students are allowed to take breaks when individually
needed to reduce cognitive fatigue when they experience heavy assessment demands. The use of this
universal tool may result in the student needing additional overall time to complete the assessment.
English dictionary: An English dictionary can be provided for the full-write portion of an ELA/L
performance task. A full-write is the second part of a performance task. The use of this universal tool may
result in the student needing additional overall time to complete the assessment.
Scratch paper: Scratch paper may be used to make notes, write computations, or record responses. Only
plain paper or lined paper is appropriate for ELA/L. Graph paper is required beginning in grade 6 and can
be used on all mathematics assessments. A student can use an assistive technology device for scratch paper
as long as the device is consistent with the child’s IEP or Section 504 Plan and is acceptable to the state.

Idaho Standards Achievement Tests in English Language Arts and Mathematics
2018–2019 Technical Report
24 American Institutes for Research
Thesaurus: A thesaurus can be provided for the full-write portion of an ELA/L performance task. A full-
write is the second part of a performance task. The use of this universal tool may result in the student
needing additional overall time to complete the assessment.
2.6.2 Designated Supports and Accommodations
Designated supports for the ISAT ELA/L and mathematics assessments are those features that are available
for use by any student for whom the need has been indicated by an educator (or team of educators with
parent/guardian and student). Scores achieved by students using designated supports will be included for
federal accountability purposes. It is recommended that a consistent process be used to determine these
supports for individual students. All educators making these decisions should be trained on the process and
understand the range of designated supports available. Smarter Balanced members have identified digitally
embedded and non-embedded designated supports for students for whom an adult or team has indicated a
need for the support.
Accommodations are changes in procedures or materials that increase equitable access during the ISAT
ELA/L and mathematics assessments. Assessment accommodations generate valid assessment results for
students who need them; they allow these students to show what they know and can do. Accommodations
are available for students with documented IEPs or Section 504 Plans. Consortium-approved
accommodations do not compromise the learning expectations, construct, grade-level standard, or intended
outcome of the assessments.
Embedded Designated Supports
Color contrast: Students are able to adjust screen background or font color, based on student needs or
preferences. This may include reversing the colors for the entire interface or choosing the color of font and
background. Black on white, reverse contrast, black on rose, medium gray on light gray, and yellow on blue
are offered for the online assessments.
Masking: Masking involves blocking off content that is not of immediate need or that may be distracting to
the student. Students can focus their attention on a specific part of a test item by using the masking feature.
Mouse pointer: This embedded support allows the mouse pointer to be set to a larger size and for the color
to be changed for students to more readily find the mouse pointer.
Text-to-speech (for mathematics stimuli items and ELA/L items; not for reading passages): Text is read
aloud to the student via embedded text-to-speech technology. The student can control the speed and raise
or lower the volume of the voice via a volume control.
Translated test directions (for mathematics): Translation of test directions is a language support available
before beginning the actual test items. Students can see test directions in another language. As an embedded
designated support, translated test directions are automatically a part of the stacked translation designated
support.
Translations (glossaries) (for mathematics): Translated glossaries are a language support. The translated
glossaries are provided for selected construct-irrelevant terms for mathematics. Translations for these terms
appear on the computer screen when students click on them. The following language glossaries were
offered: Arabic, Cantonese, Filipino, Korean, Mandarin, Punjabi, Russian, Spanish, Ukrainian, and
Vietnamese.

Idaho Standards Achievement Tests in English Language Arts and Mathematics
2018–2019 Technical Report
25 American Institutes for Research
Translations (Spanish stacked) (for mathematics): Stacked translations are a language support available for
some students. They provide a full translation of each test item above the original item in English.
Turn off any universal tools: Teachers can disable any universal tools that might be distracting, that students
do not need to use, or that students are unable to use.
Non-Embedded Designated Supports
Amplification: The student adjusts the volume control beyond the computer’s built-in settings using
headphones or other non-embedded devices.
Bilingual dictionary: A bilingual/dual language word-to-word dictionary is a language support and can be
provided for the full-write portion of an ELA/L performance task.
Color contrast: Test content of online items may be displayed with different colors.
Color overlays: Color transparencies may be placed over a paper-pencil assessment.
Magnification: The size of specific areas of the screen (e.g., text, formulas, tables, graphics, navigation
buttons) may be adjusted by the student with an assistive technology device. Magnification enables
increasing the size to a level not allowed by the zoom universal tool.
Medical device: Students may have access to an electronic device for medical purposes (e.g., glucose
monitor). The device may include a cell phone and should support the student only during testing for
medical reasons.
Noise buffer: These include ear mufflers, white noise, and/or other equipment to reduce environmental
noises.
Read aloud (for mathematics items and ELA/L items; not for reading passages): Text is read aloud to the
student by a trained and qualified human reader who follows the administration guidelines provided in the
Idaho Assessment Systems Manual and the Guidelines for Read Aloud, Test Reader. All or portions of the
content may be read aloud.
Read aloud in Spanish (for mathematics only): Spanish text is read aloud to the student by a trained and
qualified human reader who follows the administration guidelines provided in the Idaho Assessment
Systems Manual and the read-aloud guidelines. All or portions of the content may be read aloud.
Scribe (for ELA/L non-writing items): Students dictate their responses to a human who records verbatim
what they dictate. The scribe must be trained and qualified and must follow the administration guidelines
provided in the Idaho Assessment Systems Manual.
Separate setting: Test location is altered so that the student is tested in a setting different from that made
available for most students.
Simplified test directions: The TA simplifies or paraphrases the test directions found in the Test
Administration Manual according to the Simplified Test Directions guidelines.
Translated test directions: This is a PDF file of directions translated in each of the languages currently
supported. A bilingual adult can read this information to the student.

Idaho Standards Achievement Tests in English Language Arts and Mathematics
2018–2019 Technical Report
26 American Institutes for Research
Translations (glossaries) (for mathematics paper-pencil tests): Translated glossaries are a language support
provided for selected construct-irrelevant terms for mathematics. Glossary terms are listed by item and
include the English term and its translated equivalent.
Embedded Accommodations
American Sign Language (ASL) (for ELA/L listening items and mathematics items): Test content is
translated into ASL video. An ASL human signer and the signed test content are viewed on the same screen.
Students may view portions of the ASL video as often as needed.
Braille: This is a raised-dot code that individuals read with their fingertips. Graphic material (e.g., maps,
charts, graphs, diagrams, illustrations) is presented in a raised format (paper or thermoform). Contracted
and non-contracted braille is available; Nemeth code is available for mathematics.
Braille Transcript: This is a braille transcript of the closed captioning created for the listening passages.
Closed captioning (for ELA/L listening stimulus items): This is printed text that appears on the computer
screen as audio materials are presented.
Streamlined Interface Mode: This accommodation provides a streamlined interface of the test in an
alternate, simplified format in which the items are displayed below the stimuli.
Text-to-speech (for ELA/L reading passages): Text is read aloud to the student via embedded text-to-speech
technology. The student can control the speed and raise or lower the volume of the voice via a volume
control.
Non-Embedded Accommodations
100s Number Table: This is a paper-based table listing numbers from 1–100 available from Smarter
Balanced for reference.
Abacus: For students who typically use an abacus, this tool may be used in place of scratch paper.
Alternate response options: Alternate response options include but are not limited to adapted keyboards,
large keyboards, StickyKeys, MouseKeys, FilterKeys, adapted mouse, touch screen, head wand, and
switches.
Calculator (for grades 6–11 mathematics tests): A non-embedded calculator may be provided to students
needing a special calculator, such as a braille calculator or a talking calculator, currently unavailable in the
assessment platform.
Multiplication table (grade 4 and above mathematics tests): A paper-based single digit (1–9) multiplication
table is available from Smarter Balanced for reference.
Print-on-Demand: Paper copies of either passages/stimuli and/or items may be printed for students. For
those students needing a paper copy of a passage or stimulus, permission to request printing must first be
set in TIDE.
Read aloud (for ELA/L passages): Text is read aloud to the student via an external screen reader or by a
trained and qualified human reader who follows the administration guidelines provided in the Idaho
Assessment Systems Manual and Read Aloud Guidelines. All or portions of the content may be read aloud.
Idaho Standards Achievement Tests in English Language Arts and Mathematics
2018–2019 Technical Report
27 American Institutes for Research
Members can refer to the Guidelines for Choosing the Read Aloud Accommodation when deciding if this
accommodation is appropriate for a student.
Scribe (for ELA/L writing items): Students dictate their responses to a human who records verbatim what
they dictate. The scribe must be trained and qualified, and must follow the administration guidelines
provided in the Idaho Assessment Systems Manual.
Speech-to-text: Voice recognition allows students to use their voices as devices to input information into
the computer in order to dictate responses or give commands (e.g., opening application programs, pulling
down menus, saving work). Voice recognition software generally can recognize speech up to 160 words
per minute. Students may use their own assistive technology devices.
Word prediction: This allows students to begin writing a word and choose from a list of words that have
been predicted from word frequency and syntax rules.
Table 9 presents a list of universal tools, designated supports, and accommodations that were offered in the
2018–2019 administration. Tables 10–21 provide the number of students who were offered the
accommodations and designated supports.

Idaho Standards Achievement Tests in English Language Arts and Mathematics
2018–2019 Technical Report
28 American Institutes for Research
Table 9. SY 2018–2019 Universal Tools, Designated Supports, and Accommodations
Universal Tools Designated Supports Accommodations
Embedded
Calculator1
Digital Notepad English Dictionary2
English Glossary
Expandable Items
Expandable Passages
Global Notes
Highlighter
Keyboard Navigation
Line Reader
Mark for Review
Mathematics Tools3
Pause Spellcheck
Strikethrough
Thesaurus2
Writing Tools4
Zoom
Color Contrast
Masking Mouse Pointer
Text-to-Speech5
Translated Test Directions
Translations (Glossary)6
Translations (Stacked)6
Turn off Any Universal Tools
American Sign Language7
Braille Braille Transcript15
Closed Captioning8
Streamlined Interface Mode
Text-to-Speech9
Non-Embedded
Breaks
English Dictionary2
Scratch Paper
Thesaurus2
Amplification
Bilingual Dictionary2
Color Contrast
Color Overlay
Magnification
Medical Device
Noise Buffers
Read Aloud10
Read Aloud in Spanish
Scribe11
Separate Setting
Simplified Test Directions
Translated Test Directions
Translations (Glossary)12
100s Number Table14
Abacus
Alternate Response
Options13
Calculator1
Multiplication Table14
Print-on-Demand
Read Aloud15
Scribe
Speech-to-Text
Word Prediction
Items shown are available for ELA/L and mathematics unless otherwise noted. 1 For calculator-allowed items only in grades 6–11 2 For full-write portion of ELA/L performance task 3 Includes embedded ruler, embedded protractor 4 Includes bold, italic, underline, indent, cut, paste, spellcheck, bullets, undo/redo 5 For ELA/L PT stimuli, ELA/L PT and CAT items (not ELA/L CAT reading passages), and mathematics stimuli and
items: Must be set in TIDE by district- or school-level user and must be set before test begins. 6 For mathematics items 7 For ELA/L listening items and mathematics items 8 For ELA/L listening items 9 For ELA/L reading passages. Must be set in TIDE by district- or school-level user and must be set before test begins. 10 For ELA/L items (not ELA/L reading passages) and mathematics items 11 For ELA/L non-writing items and mathematics items 12 For mathematics items on the paper-pencil test 13 Includes adapted keyboards, large keyboard, StickyKeys, MouseKeys, FilterKeys, adapted mouse, touch screen,
head wand, and switches 14 For mathematics items beginning in grade 4 15 For ELA/L reading passages, all grades

Idaho Standards Achievement Tests in English Language Arts and Mathematics
2018–2019 Technical Report
29 American Institutes for Research
Table 10. ELA/L Total Students with Allowed Embedded and Non-Embedded Accommodations (Grades
3–8 and 10)
Accommodations Grade
3 4 5 6 7 8 10
Embedded Accommodations
American Sign Language 4 11 12 9 14 6 8
Braille 3 1 1
Closed Captioning 17 24 26 35 36 21 29
Streamlined Interface Mode 91 67 106 164 84 122 40
Text-to-Speech: Passages 47 35 56 70 61 71 11
Text-to-Speech: Passages and Items 2,126 2,024 2,146 1,899 1,778 1,759 763
Non-Embedded Accommodations
Alternate Response Options 13 24 9 7 6 6 6
Print-on-Demand: Items 5 2 4 1 1 2 1
Print-on-Demand: Passages 2 10 10 1 1
Print-on-Demand: Passages and Items 50 63 55 43 78 73 32
Print-on-Demand: Stimuli and Items 1 3
Read Aloud Stimuli 98 91 84 113 103 70 86
Scribe Items (Writing) 119 131 109 79 49 34
Speech-to-Text 151 129 139 156 160 117 98
Word Prediction 31 30 42 42 52 25 7
Table 11. ELA/L Total Students with Allowed Embedded and Non-Embedded Accommodations (Grades
9 and 11)
Accommodations Grade
9 11
Embedded Accommodations
American Sign Language 4
Closed Captioning 5
Streamlined Interface Mode 14
Text-to-Speech: Passages 14 1
Text-to-Speech: Passages and Items 460 35
Non-Embedded Accommodations
Alternate Response Options 2
Print-on-Demand: Passages and Items 26 2
Read Aloud Stimuli 49 2
Speech-to-Text 21 5
Word Prediction 12 3
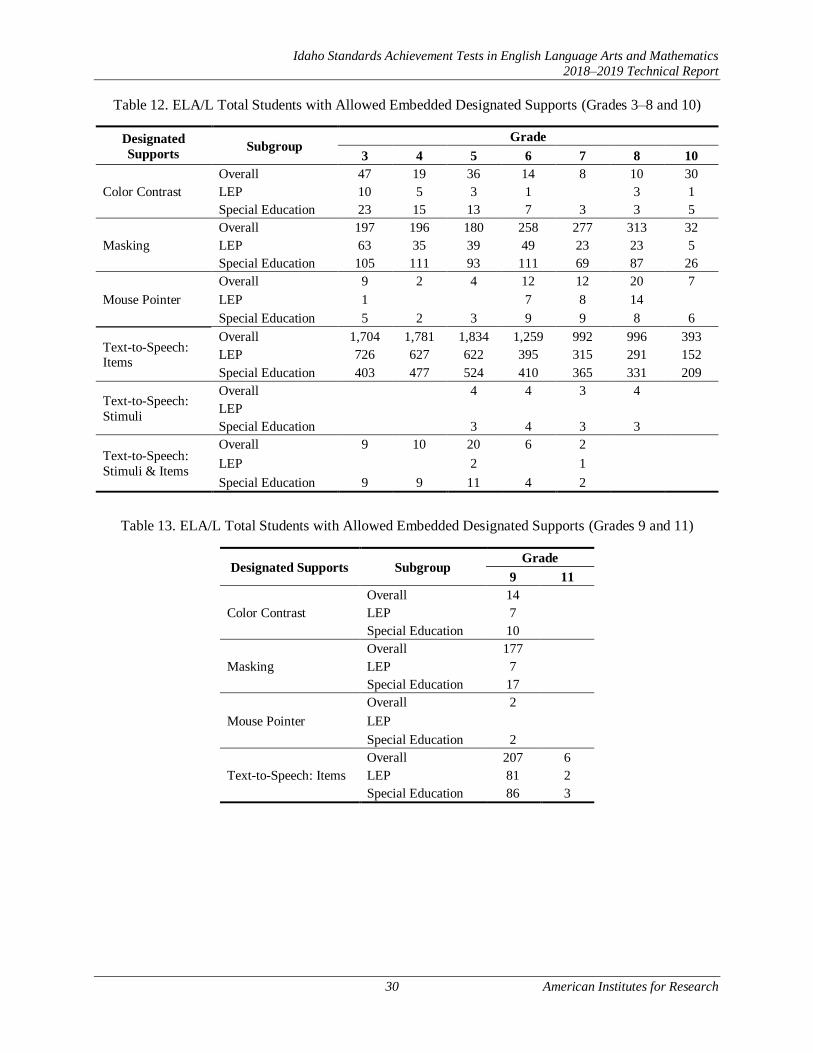
Idaho Standards Achievement Tests in English Language Arts and Mathematics
2018–2019 Technical Report
30 American Institutes for Research
Table 12. ELA/L Total Students with Allowed Embedded Designated Supports (Grades 3–8 and 10)
Designated
Supports Subgroup
Grade
3 4 5 6 7 8 10
Color Contrast
Overall 47 19 36 14 8 10 30
LEP 10 5 3 1 3 1
Special Education 23 15 13 7 3 3 5
Masking
Overall 197 196 180 258 277 313 32
LEP 63 35 39 49 23 23 5
Special Education 105 111 93 111 69 87 26
Mouse Pointer
Overall 9 2 4 12 12 20 7
LEP 1 7 8 14
Special Education 5 2 3 9 9 8 6
Text-to-Speech: Items
Overall 1,704 1,781 1,834 1,259 992 996 393
LEP 726 627 622 395 315 291 152
Special Education 403 477 524 410 365 331 209
Text-to-Speech:
Stimuli
Overall 4 4 3 4
LEP
Special Education 3 4 3 3
Text-to-Speech:
Stimuli & Items
Overall 9 10 20 6 2
LEP 2 1
Special Education 9 9 11 4 2
Table 13. ELA/L Total Students with Allowed Embedded Designated Supports (Grades 9 and 11)
Designated Supports Subgroup Grade
9 11
Color Contrast
Overall 14
LEP 7
Special Education 10
Masking
Overall 177
LEP 7
Special Education 17
Mouse Pointer
Overall 2
LEP
Special Education 2
Text-to-Speech: Items
Overall 207 6
LEP 81 2
Special Education 86 3
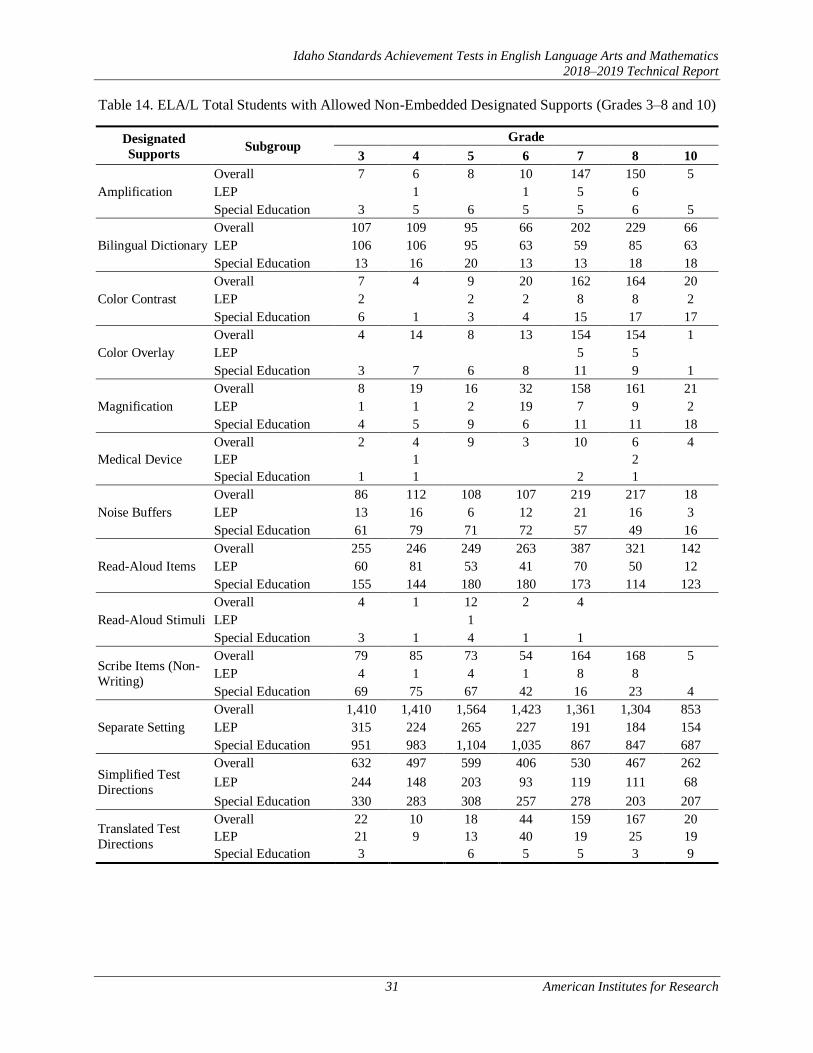
Idaho Standards Achievement Tests in English Language Arts and Mathematics
2018–2019 Technical Report
31 American Institutes for Research
Table 14. ELA/L Total Students with Allowed Non-Embedded Designated Supports (Grades 3–8 and 10)
Designated
Supports Subgroup
Grade
3 4 5 6 7 8 10
Amplification
Overall 7 6 8 10 147 150 5
LEP 1 1 5 6
Special Education 3 5 6 5 5 6 5
Bilingual Dictionary
Overall 107 109 95 66 202 229 66
LEP 106 106 95 63 59 85 63
Special Education 13 16 20 13 13 18 18
Color Contrast
Overall 7 4 9 20 162 164 20
LEP 2 2 2 8 8 2
Special Education 6 1 3 4 15 17 17
Color Overlay
Overall 4 14 8 13 154 154 1
LEP 5 5
Special Education 3 7 6 8 11 9 1
Magnification
Overall 8 19 16 32 158 161 21
LEP 1 1 2 19 7 9 2
Special Education 4 5 9 6 11 11 18
Overall 2 4 9 3 10 6 4
Medical Device LEP 1 2
Special Education 1 1 2 1
Noise Buffers
Overall 86 112 108 107 219 217 18
LEP 13 16 6 12 21 16 3
Special Education 61 79 71 72 57 49 16
Read-Aloud Items
Overall 255 246 249 263 387 321 142
LEP 60 81 53 41 70 50 12
Special Education 155 144 180 180 173 114 123
Read-Aloud Stimuli
Overall 4 1 12 2 4
LEP 1
Special Education 3 1 4 1 1
Scribe Items (Non-
Writing)
Overall 79 85 73 54 164 168 5
LEP 4 1 4 1 8 8
Special Education 69 75 67 42 16 23 4
Separate Setting
Overall 1,410 1,410 1,564 1,423 1,361 1,304 853
LEP 315 224 265 227 191 184 154
Special Education 951 983 1,104 1,035 867 847 687
Simplified Test
Directions
Overall 632 497 599 406 530 467 262
LEP 244 148 203 93 119 111 68
Special Education 330 283 308 257 278 203 207
Translated Test
Directions
Overall 22 10 18 44 159 167 20
LEP 21 9 13 40 19 25 19
Special Education 3 6 5 5 3 9
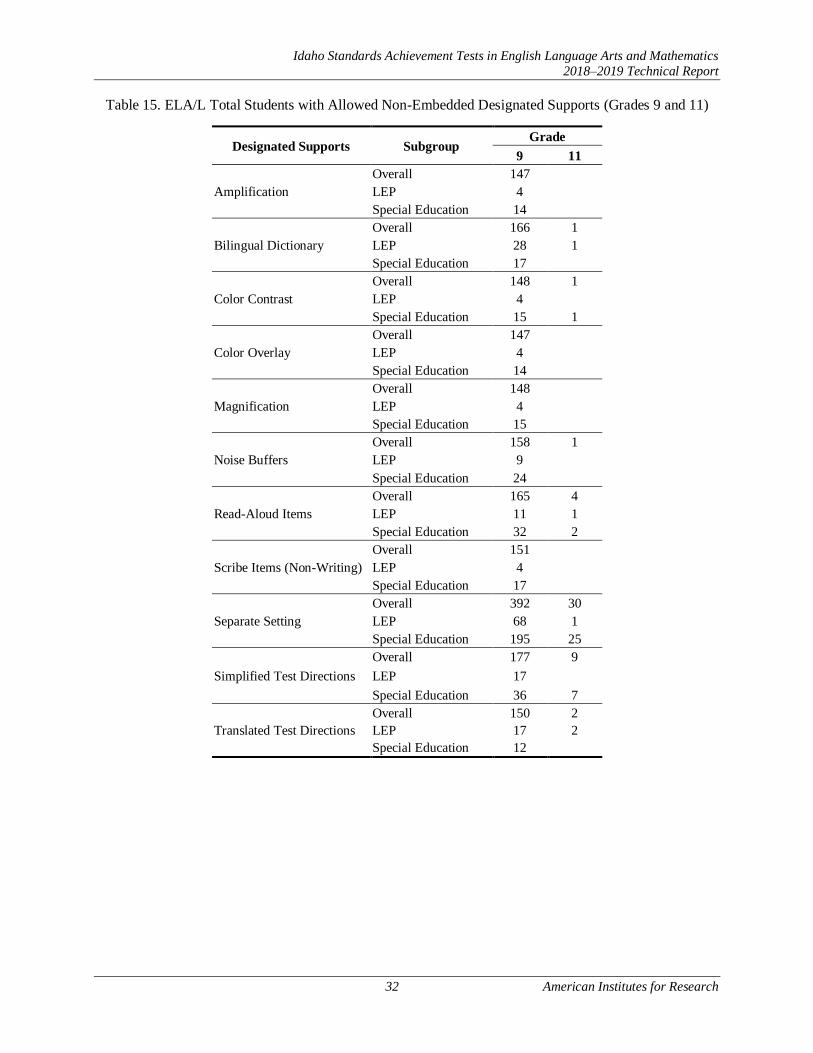
Idaho Standards Achievement Tests in English Language Arts and Mathematics
2018–2019 Technical Report
32 American Institutes for Research
Table 15. ELA/L Total Students with Allowed Non-Embedded Designated Supports (Grades 9 and 11)
Designated Supports Subgroup Grade
9 11
Amplification
Overall 147
LEP 4
Special Education 14
Bilingual Dictionary
Overall 166 1
LEP 28 1
Special Education 17
Color Contrast
Overall 148 1
LEP 4
Special Education 15 1
Color Overlay
Overall 147
LEP 4
Special Education 14
Magnification
Overall 148
LEP 4
Special Education 15
Noise Buffers
Overall 158 1
LEP 9
Special Education 24
Read-Aloud Items
Overall 165 4
LEP 11 1
Special Education 32 2
Scribe Items (Non-Writing)
Overall 151
LEP 4
Special Education 17
Separate Setting
Overall 392 30
LEP 68 1
Special Education 195 25
Simplified Test Directions
Overall 177 9
LEP 17
Special Education 36 7
Translated Test Directions
Overall 150 2
LEP 17 2
Special Education 12

Idaho Standards Achievement Tests in English Language Arts and Mathematics
2018–2019 Technical Report
33 American Institutes for Research
Table 16. Mathematics Total Students with Allowed Embedded and Non-Embedded Accommodations
(Grades 3–8 and 10)
Accommodations Grade
3 4 5 6 7 8 10
Embedded Accommodations
American Sign Language 4 10 8 9 12 6 7
Braille 3 1
Streamlined Interface Mode 90 72 108 163 84 126 39
Non-Embedded Accommodations
100s Number Table 216 218 212 172 94 99 15
Abacus 10 6 4 2 4 1
Alternate Response Options 8 13 6 5 4 4 5
Calculator 98 180 213 362 395 486 321
Multiplication Table 55 193 267 242 157 103 24
Print-on-Demand: Items 1 2
Print-on-Demand: Stimuli 2 1
Print-on-Demand: Stimuli and Items 57 54 58 31 39 41 20
Read Aloud Stimuli 2 4
Speech-to-Text 137 109 111 124 129 103 70
Word Prediction 17 6 17 17 18 9 1
Table 17. Mathematics Total Students with Allowed Embedded and Non-Embedded Accommodations
(Grades 9 and 11)
Accommodations Grade
9 11
Embedded Accommodations
American Sign Language 4
Streamlined Interface Mode 12
Non-Embedded Accommodations
100s Number Table 1 3
Alternate Response Options 2
Calculator 73 9
Multiplication Table 3 3
Print-on-Demand: Stimuli and Items 7 2
Speech-to-Text 16 6
Word Prediction 3 1

Idaho Standards Achievement Tests in English Language Arts and Mathematics
2018–2019 Technical Report
34 American Institutes for Research
Table 18. Mathematics Total Students with Allowed Embedded Designated Supports (Grades 3–8 and 10)
Designated Supports Subgroup Grade
3 4 5 6 7 8 10
Color Contrast
Overall 44 17 34 14 10 10 31
LEP 10 5 3 1 3 1
Special Education 21 14 13 6 4 3 5
Masking
Overall 191 180 178 218 270 303 30
LEP 63 36 42 26 18 15 3
Special Education 97 95 88 96 69 87 25
Mouse Pointer
Overall 8 2 4 12 12 21 7
LEP 1 7 8 14
Special Education 4 2 3 9 9 8 6
Text-to-Speech: Items
Overall 192 202 267 142 173 113 54
LEP 41 37 41 30 23 20 7
Special Education 99 109 149 106 127 94 44
Text-to-Speech: Stimuli
Overall 10 15 13 8 12 12 1
LEP 3 1 5 1 2 2
Special Education 6 10 5 6 5 8
Text-to-Speech: Stimuli and Items
Overall 2,891 2,838 2,987 2,503 2,088 2,151 945
LEP 991 867 875 651 515 515 223
Special Education 1,298 1,317 1,453 1,363 1,113 1,104 705
Translation (Glossary):
Spanish
Overall 164 142 162 101 100 104 87
LEP 164 139 151 97 92 97 86
Special Education 20 15 34 21 16 15 22
Translation (Glossary):
Other Languages
Overall 15 8 3 2 2 7 2
LEP 15 7 3 2 2 7 2
Special Education
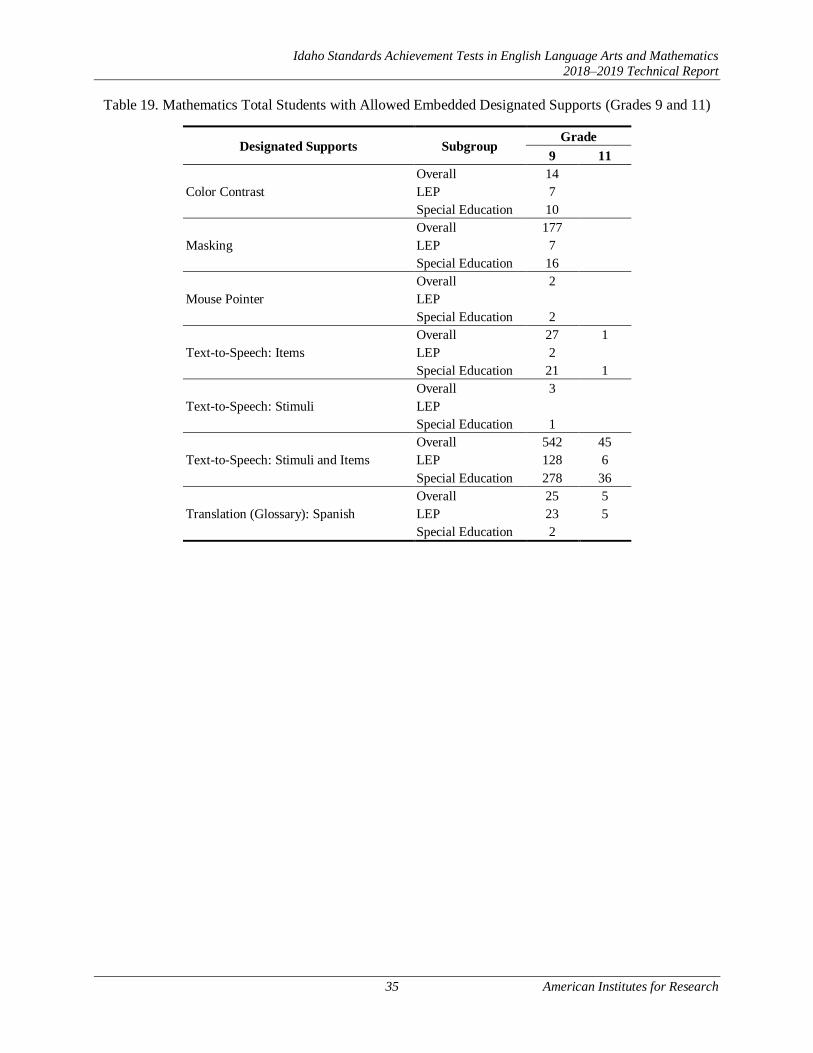
Idaho Standards Achievement Tests in English Language Arts and Mathematics
2018–2019 Technical Report
35 American Institutes for Research
Table 19. Mathematics Total Students with Allowed Embedded Designated Supports (Grades 9 and 11)
Designated Supports Subgroup Grade
9 11
Color Contrast
Overall 14
LEP 7
Special Education 10
Masking
Overall 177
LEP 7
Special Education 16
Mouse Pointer
Overall 2
LEP
Special Education 2
Text-to-Speech: Items
Overall 27 1
LEP 2
Special Education 21 1
Text-to-Speech: Stimuli
Overall 3
LEP
Special Education 1
Text-to-Speech: Stimuli and Items
Overall 542 45
LEP 128 6
Special Education 278 36
Translation (Glossary): Spanish
Overall 25 5
LEP 23 5
Special Education 2

Idaho Standards Achievement Tests in English Language Arts and Mathematics
2018–2019 Technical Report
36 American Institutes for Research
Table 20. Mathematics Total Students with Allowed Non-Embedded Designated Supports (Grades 3–8,
10)
Designated Supports Subgroup Grade
3 4 5 6 7 8 10
Amplification
Overall 11 9 10 10 150 149 5
LEP 1 1 1 6 6
Special Education 7 7 9 6 8 6 5
Color Contrast
Overall 11 5 11 21 162 161 21
LEP 2 1 2 8 8 2
Special Education 9 4 5 6 15 16 18
Color Overlay
Overall 2 13 8 12 153 152 1
LEP 5 5
Special Education 1 6 6 8 10 7 1
Magnification
Overall 9 16 16 32 156 162 24
LEP 1 2 19 7 9 2
Special Education 5 4 9 6 9 12 20
Medical Device
Overall 2 4 11 3 10 6
LEP 1 2
Special Education 1 1 1 2 1
Noise Buffers
Overall 89 113 132 123 211 215 18
LEP 12 16 10 14 19 16 3
Special Education 64 77 89 82 49 48 16
Read-Aloud Items
Overall 296 339 347 328 410 394 160
LEP 69 129 86 67 93 85 34
Special Education 190 188 246 218 172 155 124
Read-Aloud Items
(Spanish)
Overall 4 3 2 9 8 8 3
LEP 4 3 2 8 8 7 3
Special Education 2 1 1 1
Read-Aloud Stimuli
Overall 230 195 208 208 170 146 39
LEP 57 50 40 20 67 48 7
Special Education 149 130 155 144 96 79 37
Read-Aloud Stimuli
(Spanish)
Overall 6 3 2 10 10 8 1
LEP 4 3 2 8 9 8 1
Special Education 3 3 2
Scribe Items
Overall 97 95 87 57 165 173 15
LEP 7 4 6 1 7 7 1
Special Education 84 78 80 41 18 26 13
Separate Setting
Overall 1,438 1,454 1,600 1,425 1,366 1,315 857
LEP 324 274 286 241 208 187 159
Special Education 968 984 1,121 1,037 861 848 682
Simplified Test
Directions
Overall 636 541 605 405 525 444 268
LEP 252 193 213 102 127 110 70
Special Education 341 287 303 258 280 204 210
Translated Test Directions
Overall 35 26 37 49 188 178 36
LEP 35 25 30 45 44 36 35
Special Education 3 3 7 2 9 5 9
Translation (Glossary):
Spanish
Overall 110 123 108 66 64 81 51
LEP 110 119 108 65 64 76 51
Special Education 11 7 20 12 8 15 16

Idaho Standards Achievement Tests in English Language Arts and Mathematics
2018–2019 Technical Report
37 American Institutes for Research
Designated Supports Subgroup Grade
3 4 5 6 7 8 10
Translation (Glossary):
Other Languages
Overall 3 4 3 1 3 3 1
LEP 3 4 3 1 3 3 1
Special Education

Idaho Standards Achievement Tests in English Language Arts and Mathematics
2018–2019 Technical Report
38 American Institutes for Research
Table 21. Mathematics Total Students with Allowed Non-Embedded Designated Supports (Grades 9 and
11)
Designated Supports Subgroup Grade
9 11
Amplification
Overall 147
LEP 4
Special Education 14
Color Contrast
Overall 147 1
LEP 4
Special Education 14 1
Color Overlay
Overall 147
LEP 4
Special Education 14
Magnification
Overall 149
LEP 4
Special Education 16
Noise Buffers
Overall 156 1
LEP 10
Special Education 21
Read-Aloud Items
Overall 183 5
LEP 25 1
Special Education 32 4
Read-Aloud Items (Spanish)
Overall 1
LEP 1
Special Education
Read-Aloud Stimuli
Overall 13 2
LEP 1
Special Education 11 1
Read-Aloud Stimuli (Spanish)
Overall 1
LEP 1
Special Education
Scribe Items
Overall 156
LEP 4
Special Education 21
Separate Setting
Overall 407 39
LEP 86 5
Special Education 190 31
Simplified Test Directions
Overall 207 9
LEP 45
Special Education 36 7
Translated Test Directions
Overall 156 4
LEP 19 4
Special Education 18
Translation (Glossary): Spanish
Overall 15 1
LEP 15 1
Special Education 2

Idaho Standards Achievement Tests in English Language Arts and Mathematics
2018–2019 Technical Report
39 American Institutes for Research
2.7 DATA FORENSICS PROGRAM
2.7.1 Data Forensics Report
The validity of test scores depends critically on the integrity of the test administrations. Any irregularities
in test administration could cast doubt on the validity of the inferences based on those test scores. Multiple
facets ensure that tests are administered properly; these include clear test administration policies, effective
TA training, and tools to identify possible irregularities in test administrations.
Online test administration allows for collection of information that was impossible in paper-pencil tests,
such as item response changes, item response time, number of visits for an item or an item group, and test
starting and ending times. AIR’s test delivery system (TDS) captures all of this information.
For online administrations, a set of quality assurance (QA) reports are generated during and after the testing
window. One of the QA reports focuses on flagging possible testing anomalies. Testing anomalies are
analyzed for changes in test scores between administrations, testing time, and item response patterns using
a person-fit index. Flagging criteria used for these analyses are configurable and can be changed by an
authorized user. Analyses are performed at the student level and summarized for each aggregate unit,
including testing session, TA, and school. The QA reports are provided to state clients to monitor testing
anomalies throughout the testing window.
2.7.2 Changes in Student Performance
Changes in student scores between administration years are examined using a regression model to check
for outliers. For these between-year comparisons, students’ current-year scores are regressed on their test
scores from the previous year and on the number of days between the two years’ test-end dates (to control
for the instruction time between the two test scores). Between-year comparisons are performed between the
current school year (e.g., 2018–2019) and the year before the current school year (e.g., 2017–2018).
A large score gain or loss in student scores between administration years is detected by examining the
residuals for outliers. The residuals are computed as the observed value minus the regression model’s
predicted value. To detect unusual residuals, the studentized residuals are computed. An unusual increase
or decrease in student scores between administration years is flagged when the absolute value of the
studentized residual is greater than |3|.
The residuals of students are also aggregated for a testing session, TA, and school. The system flags any
unusual changes in an aggregate performance between administrations and/or years based on the average
of the residuals in the aggregate unit (e.g., testing session, TA, school). For each aggregate unit, a t value
is computed and flagged when |𝑡| is greater than 3,
𝑡 =∑ �̂�𝑖𝑛𝑖=1 /𝑛
√𝑠2
𝑛+∑ 𝜎2(1 − ℎ𝑖𝑖)𝑛𝑖=1
𝑛2
,
where s is the standard deviation of residuals in an aggregate unit; n is the number of students in an
aggregate unit (e.g., testing session, TA, school), 𝜎2 is the MSE from the regression, and �̂�𝑖 is the residual
for the ith student.

Idaho Standards Achievement Tests in English Language Arts and Mathematics
2018–2019 Technical Report
40 American Institutes for Research
The variance of average residuals in the denominator is estimated in two components, conditioning on true
residual 𝑒𝑖 , 𝑣𝑎𝑟(𝐸(�̂�𝑖|𝑒𝑖)) = 𝑠2 and 𝐸(𝑣𝑎𝑟(�̂�𝑖|𝑒𝑖)) = 𝜎
2(1 − ℎ𝑖𝑖). Following the law of total variance
(Billingsley, 1995, p. 456),
𝑣𝑎𝑟(�̂�𝑖) = 𝑣𝑎𝑟(𝐸(�̂�𝑖|𝑒𝑖)) + 𝐸(𝑣𝑎𝑟(�̂�𝑖|𝑒𝑖)) = 𝑠2 + 𝜎2(1 − ℎ𝑖𝑖), hence,
𝑣𝑎𝑟 (∑ �̂�𝑖𝑛𝑖=1
𝑛) =
∑ (𝑠2+𝜎2(1−ℎ𝑖𝑖))𝑛𝑖=1
𝑛2=
𝑠2
𝑛+
∑ (𝜎2(1−ℎ𝑖𝑖))𝑛𝑖=1
𝑛2.
The QA report includes a list of the flagged aggregate units and the number of flagged students. If the
aggregate unit size is between one to five students, the aggregate unit is flagged if the percentage of flagged
students is greater than 50%. The aggregate unit size for the score change is based on the number of students
included in the between-year regression analysis in the aggregate unit.
2.7.3 Item Response Time
The online environment also allows item response time to be captured as the item page time (the time each
item page is presented) in milliseconds. For discrete items, each item appears on the screen one item at a
time, whereas stimulus-based items appear on the screen together. The page time is the time spent on one
item for discrete items and the time spent on all items associated with a stimulus for stimulus-based items.
For each student, the total time taken to complete the test is computed by adding up the page time for all
items and item groups (stimulus-based items).
The expectation is that the item response time will be shorter than the average time if students have a prior
knowledge of items. An example of unusual item response time is a test record for an individual who scores
very well on the test even though the average time spent for each item is far less than that required of
students statewide. If students already know the answers to the questions, the response time will be much
shorter than the response time for those items where the student has no prior knowledge of the item content.
Conversely, if a TA helps students by “coaching” them to change their responses during the test, the testing
time could be longer than expected.
The average and the standard deviation of test-taking time are computed across all students for each
opportunity. Students and aggregate units were flagged if the test-taking time was greater than |3| standard
deviations of the state average. The state average and standard deviation were computed based on all
students when the analysis was performed. The QA report includes a list of the flagged aggregate units.
2.7.4 Inconsistent Item Response Pattern
In item response theory (IRT) models, person-fit measurement is used to identify test takers whose response
patterns are improbable given an IRT model. If a test has psychometric integrity, little irregularity will be
seen in the item responses of the individual who responds to the items fairly and honestly.
If a test taker has prior knowledge of some test items (or is provided answers during the exam), he or she
will respond correctly to those items at a higher probability than indicated by his or her ability as estimated
across all items. In this case, the person-fit index will be large for the student. We note, however, that if a
student has prior knowledge of the entire test content, this will not be detected based on the person-fit index,
even if the item response time index might flag such a student.
The person-fit index is based on all item responses of a test. An unlikely response to a single test question
may not result in a flagged person-fit index. Of course, not all unlikely patterns indicate cheating, as in the
Idaho Standards Achievement Tests in English Language Arts and Mathematics
2018–2019 Technical Report
41 American Institutes for Research
case of a student who is able to guess a significant number of correct answers. Therefore, the evidence of
person-fit index should be evaluated along with other testing irregularities to determine possible testing
irregularities. The number of flagged students is summarized for every testing session, TA, and school.
The person-fit index is computed using a standardized log-likelihood statistic. Following Drasgow, Levine,
and Williams (1985) and Sotaridona, Pornell, and Vallejo (2003), aberrant response pattern is defined as a
deviation from the expected item score model. Snijders (2001) showed that the distribution of 𝑙𝑧 is
asymptotically normal (i.e., with an increasing number of administered items). Even at shorter test lengths
of 8 or 15 items, the “asymptotic error probabilities are quite reasonable for nominal Type I error
probabilities of 0.10 and 0.05” (Snijders, 2001).
Sotaridona et al. (2003) report promising results of using 𝑙𝑧 for systematic flagging of aberrant response
patterns. Students with 𝑙𝑧values greater than |3| are flagged. Aggregate units are flagged with t greater
than |3|,
𝑡 =𝐴𝑣𝑒𝑟𝑎𝑔𝑒 z
l values
√𝑠2 𝑛⁄,
where s = standard deviation of 𝑙𝑧values in an aggregate unit and n = number of students in an aggregate
unit. The QA report includes a list of the flagged aggregate units.
2.8 PREVENTION AND RECOVERY OF DISRUPTIONS IN TEST DELIVERY SYSTEM
AIR is continuously improving our ability to protect our systems from interruptions. AIR’s TDS is designed
to ensure that student responses are captured accurately and stored on more than one server in case of a
failure. Our architecture, described below, is designed to recover from failure of any component with little
interruption. Each system is redundant, and critical student response data is transferred to a different data
center each night.
AIR has developed a unique monitoring system that is very sensitive to changes in server performance.
Most monitoring systems provide warnings when something is going wrong. Ours does, too, but it also
provides warnings when any given server is performing differently from its performance over the prior few
hours, or differently than the other servers performing the same jobs. Subtle changes in performance often
precede actual failure by hours or days, allowing us to detect potential problems, investigate them, and
mitigate them before a failure. On multiple occasions, this has enabled us to make adjustments and replace
equipment before any problems occur.
AIR has also implemented an escalation procedure that enables us to alert clients within minutes of any
disruption. Our emergency alert system notifies by text message our executive and technical staff, who
immediately join a call to understand the problem.
The section below describes AIR system architecture and how it recovers from device failures, Internet
interruptions, and other problems.
Idaho Standards Achievement Tests in English Language Arts and Mathematics
2018–2019 Technical Report
42 American Institutes for Research
2.8.1 High-Level System Architecture
Our architecture provides redundancy, robustness, and reliability required by a large-scale, high-stakes
testing program. Our general approach, which has been adopted by Smarter Balanced as standard policy, is
pragmatic and well supported by our architecture.
Any system built around an expectation of flawless performance of computers or networks within schools
and districts is bound to fail. Our system is designed to ensure that the testing results and experience are
able to respond robustly to such inevitable failures. Thus, AIR’s TDS is designed to protect data integrity
and prevent student data loss at every point in the process.
The key elements of the testing system, including the data integrity processes at work at each point in the
system, are described below. Fault tolerance and automated recovery are built into every component of the
system, as described in this section.
Student Machine
Student responses are conveyed to our servers in real time as students respond. Long responses, such as
essays, are saved automatically at configurable intervals (usually set to one minute) so that student work is
not at risk during testing.
Responses are saved asynchronously, with a background process on the student machine waiting for
confirmation of successfully stored data on the server. If confirmation is not received within the designated
time (usually set to 30–90 seconds), the system will prevent the student from doing any more work until
connectivity is restored. The student is offered the choice of asking the system to try again or pausing the
test and returning at a later time. For example:
• If connectivity is lost and restored within the designated time period, the student may be unaware
of the momentary interruption.
• If connectivity cannot be silently restored, the student is prevented from testing and given the option
of logging out or retrying the save.
• If the system fails completely, upon logging back in the system, the student returns to the item at
which the failure occurred.
In short, data integrity is preserved by confirmed saves to our servers and prevention of further testing if
confirmation is not received.
Test Delivery Satellites
The test delivery satellites communicate with the student machines to deliver items and receive responses.
Each satellite is a collection of web and database servers. Each satellite is equipped with redundant array
of independent disks (RAID) systems to mitigate the risk of disk failure. Each response is stored on multiple
independent disks.
One server for every four satellites serves as a backup hub. This server continually monitors and stores all
changed student response data from the satellites, creating an additional copy of the real-time data. In the
unlikely event of failure, data are completely protected. Satellites are automatically monitored, and upon
failure, they are removed from service. Real-time student data are immediately recoverable from the
satellite, backup hub, or hub (described below), with backup copies remaining on the drive arrays of the
disabled satellite.

Idaho Standards Achievement Tests in English Language Arts and Mathematics
2018–2019 Technical Report
43 American Institutes for Research
If a satellite fails, students will exit the system. The automatic recovery system enables them to log in again
within seconds or minutes of the failure, without data loss. This process is managed by the hub. Data will
remain on the satellites until the satellite receives notice from the demographic and history servers that the
data are safely stored on those disks.
Hub
Hub servers are redundant clusters of database servers with RAID drive systems. Hub servers continuously
gather data from the test delivery satellites and their mini-hubs and store that data as described above. This
real-time backup copy remains on the hub until the hub receives notification from the demographic and
history servers that the data have reached the designated storage location.
Demographic and History Servers
The demographic and history servers store student data for the duration of the testing window. They are
clustered database servers, with RAID subsystems, that provide redundant capability to prevent data loss
in the event of server or disk failure. At the normal conclusion of a test, these servers receive completed
tests from the test delivery satellites. Upon successful completion of the storage of the information, these
servers notify the hub and satellites that it is safe to delete student data.
Quality Assurance System
The quality assurance (QA) system gathers data used to detect cheating, monitors real-time item function,
and evaluates test integrity. Every completed test runs through the QA system, and any anomalies (such as
unscored or missing items, unexpected test lengths, or other unlikely issues) are flagged, and immediate
notification goes out to our psychometricians and project team.
Database of Record
The Database of Record (DoR) is the final storage location for the student data. These clustered database
servers with RAID systems hold the completed student data.
2.8.2 Automated Backup and Recovery
Every system is backed up nightly. Industry-standard backup and recovery procedures are in place to ensure
safety, security, and integrity of all data. This set of systems and processes is designed to provide complete
data integrity and prevent loss of student data. Redundant systems at every point, real-time data integrity
protection and checks, and well-considered real-time backup processes prevent loss of student data, even
in the unlikely event of system failure.
2.8.3 Other Disruption Prevention and Recovery
These testing systems are designed to be extremely fault-tolerant. The systems can withstand failure of any
component with little or no service interruption. This robustness is archived through redundancy. Key
redundant systems are as follows:
• The system’s hosting provider has redundant power generators that can continue to operate for up
to 60 hours without refueling. With the multiple refueling contracts that are in place, these
generators can operate indefinitely.
• The hosting provider has multiple redundancies in the flow of information to and from the system’s

Idaho Standards Achievement Tests in English Language Arts and Mathematics
2018–2019 Technical Report
44 American Institutes for Research
data centers by partnering with nine different network providers. Each fiber carrier must enter the
data center at separate physical points, protecting the data center from a complete service failure
caused by an unlikely network cable cut.
• On the network level are redundant firewalls and load balancers throughout the environment.
• The system uses redundant power and switching within all server cabinets.
• Data are protected by nightly backups. A full weekly backup and incremental nightly backups
protect data. Should a catastrophic event occur, AIR is able to reconstruct real-time data using the
data retained on the TDS satellites and hubs.
• The server backup agents send alerts to notify system administration staff in the event of a backup
error, at which time they will inspect the error to determine whether the backup was successful or
if they need to rerun it.
The system’s TDS is hosted in an industry-leading facility with redundant power, cooling, state-of-the-art
security, and other features that protect the system from failure. The system is redundant at every
component, and in the event of failure, the unique design ensures that data are always stored in at least two
locations. The engineering that led to this system protects student responses from loss.
Idaho Standards Achievement Tests in English Language Arts and Mathematics
2018–2019 Technical Report
45 American Institutes for Research
3. CONSTRUCTION OF GRADES 9 AND 10 TESTS
Part of the scope of work in the Multi-Agency Assessment Cooperative (MAAC) was to develop grades 9
and 10 ELA/L and mathematics tests from the grade 11 item pool in the 2014 Smarter Balanced assessment.
The grades 9 and 10 tests would:
• be shared by Idaho, West Virginia, and the U.S. Virgin Islands;
• be calibrated on the Smarter Balanced grades 3–11 vertical scale;
• be administered as a computer-adaptive test; and
• have separate grade-specific cut scores.
3.1 TEST BLUEPRINTS
The grade 11 Smarter Balanced assessment was developed and intended to meet the standards for all high
school grades, not specifically for grade 11, although the item pool was administered to grade 11 students.
AIR examined the Common Core State Standards (CCSS) for high school grades, and determined that the
extent of the overlap in content standards in high school grades is too great to develop separate grades 9
and 10 blueprints in ELA/L. In mathematics, however, the grade 11 blueprint includes an accumulation of
standards from concepts taught in grades 9, 10, and 11; therefore, the blueprints for grades 9 and 10 can be
developed as a subset of the grade 11 blueprint.
3.1.1 ELA/L Test Blueprint
The CCSS for ELA/L in high school grades are nearly identical; therefore, the blueprint we propose for the
grades 9 and 10 ELA/L benchmark assessments is the same blueprint used in grade 11. Note that although
the same pool is administered in multiple grades, if a student takes a test in multiple grades, the algorithm
selects different items.
The Smarter Balanced blueprint is organized in claims and targets, within which are the CCSS for grades
11 and 12. These groupings can be found in the Smarter Balance Assessment content specifications located
on the Smarter Balanced website (http://www.smarterbalanced.org). The blueprint does not go down to the
standard level; therefore, the specific differences between the two grade bands are indistinguishable on the
blueprint itself.
Based on the content specifications, targets 4 and 5 show some differences between the standards at grades
9 and 10 and grades 11 and 12. For example, standard 9, which is included in both targets 4 and 5, calls for
a comparison across literary texts. In grades 11 and 12, the standard calls for a comparison that is limited
to foundational works of American literature from the same time period. In grades 9 and 10, the standard
calls for an examination of texts across time periods and cultures. While there are some variations in the
passages that support these standards, the items themselves—and the essential skills of integrating
knowledge across multiple texts—are, we believe, ostensibly the same constructs.
The Smarter Balanced assessment blueprint also calls for brief writing tasks as well as an extended writing
task associated with the performance task (PT). The rubric used to score the PT is the same rubric used at
grade 8. It is intended to measure overall writing performance rather than grade-specific subskills. Even the
conventions dimension of the rubric does not specify grade-level grammar/usage skills. A full-credit score
on conventions is given if the response “demonstrates an adequate command of conventions: adequate use
Idaho Standards Achievement Tests in English Language Arts and Mathematics
2018–2019 Technical Report
46 American Institutes for Research
of correct sentence formation, punctuation, capitalization, usage grammar, and spelling; no systematic
pattern of errors is displayed.”
3.1.2 Mathematics Test Blueprint
In mathematics, while all of the targets and domains on the grade 11 mathematics test are considered to be
college and career ready content, the blueprints for grades 9 and 10 included a subset of the grade 11
blueprint based on what is taught in Integrated Mathematics I for grade 9 and Integrated Mathematics II for
grade 10.
The steps taken to create the blueprints for grades 9 and 10 are:
• The targets in claim 1 that contain standards that are not part of the Integrated Mathematics I or
Integrated Mathematics II recommended standards from the CCSS Appendix A were removed.
Domains in claims 2, 3, and 4 that contain standards that are not part of the Integrated Mathematics
I/Integrated Mathematics II recommended standards from the CCSS Appendix A were removed.
• The targets were allocated appropriately to calculator and non-calculator segments based on how
the items were field tested on the grade 11 assessment.
• The total number of items allocated to each claim and content category were updated to be
proportional to the number of items on the grade 11 assessment.
3.2 SUMMARY OF SIMULATION STUDIES
Before the operational testing window, AIR conducts simulations to evaluate and ensure the
implementation and quality of the adaptive item-selection algorithm and the scoring algorithm. The
simulation tool enables us to manipulate key blueprint and configuration settings to match the blueprint and
minimize measurement error; this also enables us to maximize the number of different assessments seen by
students; no items are recycled across opportunities for a student.
3.2.1 Summary of Adaptive Algorithm
For the Smarter Balanced assessments, item selection rules ensure that each student receives an assessment
representing an adequate sample of the domain with appropriate difficulty. The algorithm maximizes the
information for each student and allows for certain constraints to be set, ensuring that items selected
represent the required content distribution. The TDS ensures that students are not exposed to the same items
or passages in subsequent assessments if they attempt multiple opportunities for the same content area.
Items selected for each student depend on the student’s performance on previously selected items. The
accuracy of the student responses to items determines the next item or passage that the student will see.
Thus, each student is presented with a set of items that most accurately aligns with his or her proficiency
level based on grade-level content. Higher performance is followed by more difficult items, and lower
performance is followed by less difficult items until test length constraints are met.
The adaptive algorithm selects items to administer on each student’s assessment to meet three objectives:
• Match the test specifications (test blueprints).
• Accurately classify test takers’ proficiency in each claim.
Idaho Standards Achievement Tests in English Language Arts and Mathematics
2018–2019 Technical Report
47 American Institutes for Research
• Minimize the measurement error by administering an assessment with items targeted to a student’s
ability.
For the first item, the initial ability is used to select the first item or the first item group. The algorithm starts
each assessment with the score in the previous grade. For example, the initial ability for grade 9 students is
the grade 8 score in the previous year. When no prior score is available, the algorithm can either start an
assessment with an item of average difficulty near the average ability of students in the previous scores (
e.g., 2017–2018 summative test scores) assuming the same initial ability for all students, or select the first
item randomly from the pool.
The algorithm, as described in the Smarter Balanced Adaptive Algorithm (Cohen, C., & Albright, L., 2014),
selects the first item based on a prior estimate of student achievement, selecting from the k items providing
the most information given prior student achievement. The parameter k is a configurable parameter that can
be used to mitigate item exposure or more closely match a student’s performance depending on its value.
Because selection of the initial item can affect item exposure, the parameter k was chosen, in consultation
with Smarter Balanced, to minimize the unused item rate while providing the most information given prior
student achievement. Larger values of k provide more exposure control at the expense of optional selection.
After the initial item is administered, the algorithm identifies the best item to administer using the criteria
described in this section.
Match to the Blueprint
The algorithm first selects items to maximize fit to the test blueprint. Blueprints specify a range of items to
be administered in each claim for each assessment, with a collection of constraint sets. A constraint set is
a set of exhaustive, mutually exclusive classifications of items. For example, if a claim consists of four
targets and each item measures one—and only one—of the claims, the claim classifications constitute a
constraint set.
During item selection, the algorithm “rewards” claims that have not yet reached the minimum number of
items. For example, if the measurement claim requires that an assessment contain between eight and nine
items, measurement is the constrained feature. At any point in time, the minimum constraint on some
features may have already been satisfied, while others may not have been satisfied. Other features may be
approaching the maximum defined by the constraint. The value measure must reward items that have not
yet met minimum constraints and penalize items that would exceed the maximum constraints. The
algorithm stops administering items when the specified assessment length is met.
Increased Precision
The adaptive algorithm is able to quickly and efficiently derive very precise estimates of student
achievement. To increase the diagnostic value of score reports, the algorithm also seeks to increase the
likelihood that a student’s claim score will be clearly above or below the proficient level performance
standard. Thus, when selecting items from within each claim, the algorithm also values items that increase
the likelihood function that a student’s claim score is above or below the proficiency cut score. After
identifying eligible items that meet the blueprint, the algorithm selects items that maximize the precision
with which proficiency is assessed for each claim by selecting the best fitting item from the available items
within the targeted claim.

Idaho Standards Achievement Tests in English Language Arts and Mathematics
2018–2019 Technical Report
48 American Institutes for Research
Match to Student Ability
In addition to rewarding items that match the blueprint, the adaptive algorithm also places greater value on
items that maximize assessment information near the student’s estimated ability, ensuring the most precise
estimate of student ability possible, given the constraints of the item pool and satisfaction of the blueprint
match requirement. After each response is submitted, the algorithm recalculates a score. As more answers
are provided, the estimate becomes more precise, and the difficulty of the items selected for administration
more closely aligns to the student’s ability level. Higher performance (answering items correctly) is
followed by more difficult items, and lower performance (answering items incorrectly) is followed by less
difficult items. When the assessment is completed, the algorithm scores the overall assessment and each
claim.
The algorithm allows previously answered items to be changed; however, it does not allow items to be
skipped. Item selection requires iteratively updating the estimate of the overall and claim ability estimates
after each item is answered. When a previously answered item is changed, the proficiency estimate is
adjusted to account for the changed responses when the next new item is selected. While the update of the
ability estimates is performed at each iteration, the overall and claim scores are recalculated using all data
at the end of the assessment for the final score.
The Smarter Balanced TDS administers assessments with items representing the breadth and depth
identified in the test specifications and content standards. Because the assessment adapts to each student’s
performance while maintaining accurate representation of the required grade-level knowledge and skills in
content breadth and depth, the test results provide precise estimates of each student’s achievement level
across the range of proficiency.
3.2.2 Testing Plan
The testing of the adaptive item-selection algorithm begins by generating a sample of test takers’ with true
thetas from a normal distribution with (,) for each grade and subject where and represent mean and
standard deviation of the normal distribution. The parameters for the normal distribution are based on
students’ scores in the spring 2017–2018 summative tests in Idaho, Vermont, and Washington. Each
simulated examinee is administered one test opportunity in both ELA/L and mathematics.
The initial ability is drawn from a uniform distribution within the range of true theta plus or minus 1. The
initial ability is used to initiate the test by choosing the first few items. Table 22 provides the means and
standard deviations used to generate a sample of student abilities in the simulation for grades 9 and 10 in
ELA/L and mathematics. Simulations generated 5,000 simulated test administrations in both ELA/L and
mathematics.
Table 22. Parameters Used to Generate True Ability Distributions
Grade ELA/L Mathematics
Mean SD Mean SD
9 0.849 1.262 0.351 1.501
10 1.179 1.292 0.750 1.513
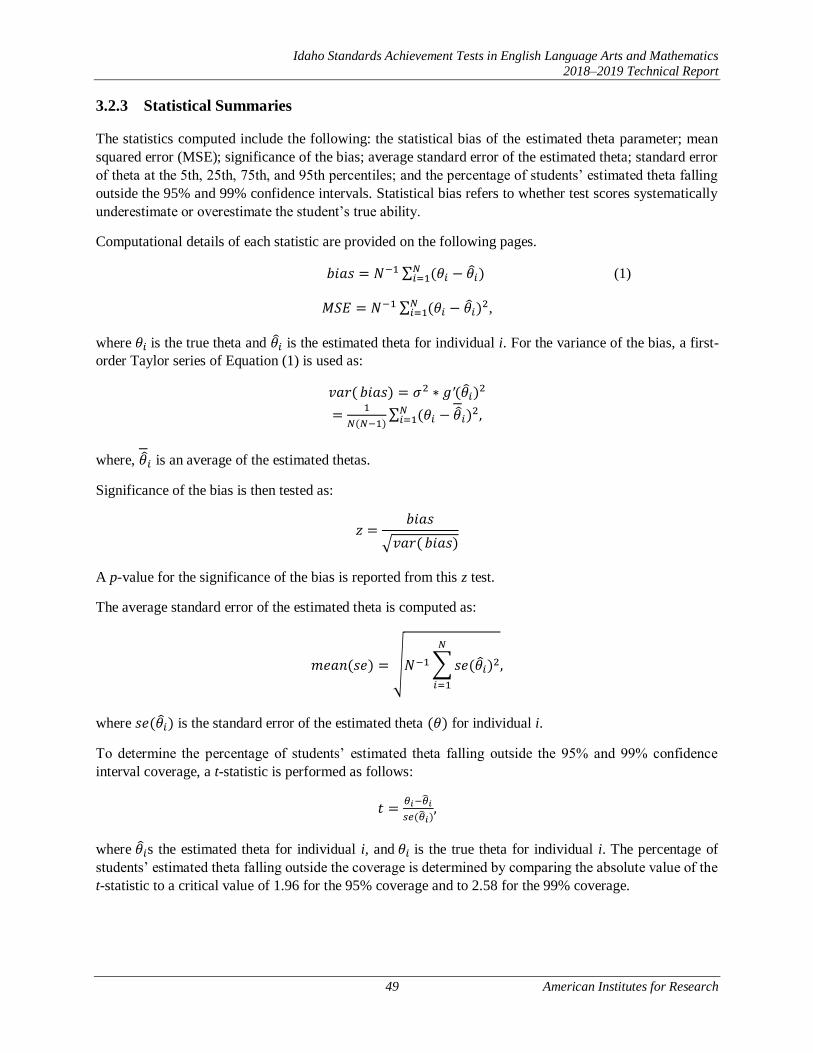
Idaho Standards Achievement Tests in English Language Arts and Mathematics
2018–2019 Technical Report
49 American Institutes for Research
3.2.3 Statistical Summaries
The statistics computed include the following: the statistical bias of the estimated theta parameter; mean
squared error (MSE); significance of the bias; average standard error of the estimated theta; standard error
of theta at the 5th, 25th, 75th, and 95th percentiles; and the percentage of students’ estimated theta falling
outside the 95% and 99% confidence intervals. Statistical bias refers to whether test scores systematically
underestimate or overestimate the student’s true ability.
Computational details of each statistic are provided on the following pages.
𝑏𝑖𝑎𝑠 = 𝑁−1 ∑ (𝜃𝑖 − 𝜃𝑖)𝑁𝑖=1 (1)
𝑀𝑆𝐸 = 𝑁−1 ∑ (𝜃𝑖 − 𝜃𝑖)2𝑁
𝑖=1 ,
where 𝜃𝑖 is the true theta and 𝜃𝑖 is the estimated theta for individual i. For the variance of the bias, a first-
order Taylor series of Equation (1) is used as:
𝑣𝑎𝑟( 𝑏𝑖𝑎𝑠) = 𝜎2 ∗ 𝑔′(𝜃𝑖)2
=1
𝑁(𝑁−1)∑ (𝜃𝑖 − 𝜃𝑖)
2𝑁𝑖=1 ,
where, 𝜃𝑖 is an average of the estimated thetas.
Significance of the bias is then tested as:
𝑧 =𝑏𝑖𝑎𝑠
√𝑣𝑎𝑟(𝑏𝑖𝑎𝑠)
A p-value for the significance of the bias is reported from this z test.
The average standard error of the estimated theta is computed as:
𝑚𝑒𝑎𝑛(𝑠𝑒) = √𝑁−1∑𝑠𝑒(𝜃𝑖)2𝑁
𝑖=1
,
where 𝑠𝑒(𝜃𝑖) is the standard error of the estimated theta (𝜃) for individual i.
To determine the percentage of students’ estimated theta falling outside the 95% and 99% confidence
interval coverage, a t-statistic is performed as follows:
𝑡 =𝜃𝑖−�̂�𝑖
𝑠𝑒(�̂�𝑖),
where 𝜃𝑖s the estimated theta for individual i, and 𝜃𝑖 is the true theta for individual i. The percentage of
students’ estimated theta falling outside the coverage is determined by comparing the absolute value of the
t-statistic to a critical value of 1.96 for the 95% coverage and to 2.58 for the 99% coverage.

Idaho Standards Achievement Tests in English Language Arts and Mathematics
2018–2019 Technical Report
50 American Institutes for Research
3.2.4 Summary Statistics on Test Blueprints
In the adaptive item-selection algorithm, item selection takes place in two discrete stages: blueprint
satisfaction and match-to-ability. The Smarter Balanced assessment blueprints specify a range of items to
be administered in each claim, content domain/standards, and targets. Moreover, blueprints constrain Depth
of Knowledge (DOK) and item and passage types. For DOK, most of the Smarter Balanced blueprint
specifies the minimum number of items, not the maximum. In blueprints, all content blueprint elements are
configured to obtain a strictly enforced range of items administered. The algorithm also seeks to satisfy
target-level constraints, but these ranges are not strictly enforced. In ELA/L, the blueprints also specify the
number of passages in reading (claim 1) and listening (claim 3) claims.
Tables 23–24 present the percentages of tests aligned with the test blueprints for ELA/L and mathematics
by claim, target, DOK, and item type constraints. In ELA/L, all tests met the blueprint constraints for items
and passages except for target constraints in claim 1 due to the uneven distribution of items across targets
and DOKs within and across passages. In mathematics, all tests met the blueprint requirements.
Table 23. Percentage of Tests Meeting Blueprint Requirements in ELA/L
Claim Content Category/Target
Required
Items in
G9–10
%BP Match for Item
Requirements
%BP Match for
Passage Requirement
G9 G10 G9–10
1 Literary Text 4 100 100 100
Target 2: Central Ideas 1 99 99
Target 4: Reasoning and Evaluation 1 99 99
Targets 1, 3, 5, 6, & 7 2 99 99
Target 2 or 4 short text 0–1 100 100
Informational Text 11–12 100 100 100
Target 9 & 11 2–4 94 93
Targets 8, 10, 12, 13, & 14 7–10 98 97
Target 9 or 11 short text 0–1 100 100
DOK 1 ≤ 4 100 100
DOK 3 or 4 ≥ 3 100 100
2 Writing 6 100 100
Target 1, 3, & 6: Organization/Purpose 1 100 100
Target 1, 3, & 6: Evidence/Elaboration 1 100 100
Target 8: Language and Vocabulary Use 1 100 100
Target 9: Edit/Clarify 3 100 100
DOK 2 ≥ 2 100 100
DOK 3 or 4 1 100 100
Brief Write 1 100 100
3 Listening 8–9 100 100 100
Target 4: Listen/Interpret 8–9 100 100
DOK 2 or higher ≥ 4 100 100
4 Research 8 100 100
Target 2: Interpret and Integrate Information 2–3 100 100
Target 3: Analyze Information/Sources 2–3 100 100
Target 4: Use Evidence 2–3 100 100

Idaho Standards Achievement Tests in English Language Arts and Mathematics
2018–2019 Technical Report
51 American Institutes for Research
Table 24. Percentage of Tests Meeting Blueprint Requirements in Mathematics
Claim Content/Target
G9 G10
Required
Items
%BP
Match
Required
Items %BP Match
1 Overall 20 100 20 100
DOK 2 or higher ≥ 7 100 ≥ 7 100 Priority Cluster 15 100 13 100
Targets D, E 0–5 100
Target F 0–1 100
Targets G, H, I 0–8 100 0–5 100
Target J 0–8 100
Target K 0–8 100
Targets L, M, N 0–8 100 0–9 100 Supporting Cluster 5 100 7 100
Target O 3–5 100
Target P 0–3 100
Targets A, B 0–4 100
Target C 0–3 100
2&4 Overall 6 100 6 100 DOK 3 or higher ≥ 2 100 ≥ 2 100
2. Target A 2 100 2 100
2. Targets B, C, D 1 100 1 100
4. Targets A, D 1 100 1 100
4. Targets B, E 1 100 1 100 4. Targets C, F 1 100 1 100
3-Calc Overall 8 100 5 100
DOK 3 or higher ≥ 2 100 ≥ 2 100 Targets A, D 2–3 100 1–3 100 Targets B, E 3 100 2–3 100
Targets C, F, G 1–2 100 0–2 100
3-No Calc Overall 1 100
Table 25 presents a summary for the number of targets specified in the blueprints and the average and range
of the number of unique targets administered in each simulated test by claim. The blueprints require
covering a few targets in a claim; therefore, the number of targets covered in each test are expected to vary
across tests. The blueprint match results demonstrate the fact that all test forms conform to the same content
target, thus providing evidence of content comparability. In other words, while each form is unique with
respect to its items, all forms align with the same curricular expectations set forth in the test blueprints.

Idaho Standards Achievement Tests in English Language Arts and Mathematics
2018–2019 Technical Report
52 American Institutes for Research
Table 25. Average and Range of the Number of Unique Targets Covered in Each Test by Claim
Grade Total Targets in BP Mean Range (Minimum–
Maximum) C1 C
22
2
C3 C4 C1 C2 C3 C4 C1 C2 C3 C4
ELA/L
9 14 5 1 3 10.0 4 1 3 7–11 4–4 1–1 3–3
10 14 5 1 3 10.0 4 1 3 7–11 4–4 1–1 3–3
Mathematics
9 9 4 7 6 9.0 2 5.5 3 8–9 2–2 3–6 3–3
10 11 4 7 6 7.9 2 4 3 7–9 2–2 2–6 3–3
3.2.5 Summary Statistics on Ability Estimation
Each simulated test includes an initial ability, a true score, and an ability estimate based on the adaptive test
administration. Table 26 presents statistical summaries of the ability estimation, including mean of the
biases, which is the average of the biases of estimated abilities across all students, the standard error of the
mean bias, and the p-value for the significance of the estimated bias reported from the z test. Table 26 also
provides the mean square error and the percentage of students’ estimated theta falling outside the 95%
coverage and 99% coverage.
The mean bias of the estimated abilities is not statistically significant in ELA/L, while significant bias is
observed in mathematics for grades 9 and 10. Significant bias in mathematics is from the lower end of the
ability range due to the mismatch between the item difficulties and students’ abilities. The item pools
currently have a shortage of items that are better targeted toward low performing students, resulting in a
mismatch between the difficulty of item pool and the ability of the student population. Table 27 provides
the average item difficulty for the pool and the average estimated ability for the simulated students. As
shown in Table 27, the average item difficulties in the mathematics pool are much higher than the average
student abilities, indicating a difficulty to select items that maximize assessment information near the
student’s estimated ability while meeting the blueprint requirements. The percentages of students’ estimated
theta falling outside the 95% and 99% confidence interval coverage are close to 5% and 1%, respectively.
Table 26. Bias of the Estimated Abilities
Grade Mean of the
Biases
SE of the
Biases
P-value for
the Z-test MSE
95%
Coverage
99%
Coverage
ELA/L
9 0.01 0.01 0.37 0.18 4.7% 0.9%
10 0.00 0.01 0.43 0.18 5.4% 1.0%
Mathematics
9 0.05 0.01 0.00 0.30 4.9% 0.9%
10 0.05 0.01 0.00 0.30 4.6% 1.1%

Idaho Standards Achievement Tests in English Language Arts and Mathematics
2018–2019 Technical Report
53 American Institutes for Research
Table 27. Average Item Difficulty and Student Ability
Grade
ELA/L Mathematics
Items Ability Items Ability
Mean SD Mean SD Mean SD Mean SD
9 1.722 1.476 0.840 1.363 2.394 1.680 0.279 1.634
10 1.722 1.476 1.175 1.370 2.700 1.364 0.709 1.638
Table 28 presents the mean standard error of the ability estimate across 5,000 simulated test administrations,
as well as the standard error across the ability distribution. The standard errors are large in the low ability
range in both ELA/L and mathematics—an indication that the item pool is too difficult for students and
there is a shortage of easy items. In ELA/L, the standard error is greatest at the very low end of the ability
range. In mathematics, the standard error is greatest at the very low end of the ability range and decreases
as it approaches the very high end of the ability range. The standard error curves are shown in Figure 1.
Table 28. Standard Errors of the Estimated Abilities
Grade Average
SE
SE at
5th Percentile
SE at Bottom
Quartile (25th)
SE at Top
Quartile (75th)
SE at 95th
Percentile
ELA/L
9 0.42 0.46 0.38 0.36 0.40
10 0.41 0.48 0.38 0.39 0.42
Mathematics
9 0.54 0.87 0.58 0.40 0.32
10 0.54 0.76 0.57 0.31 0.30

Idaho Standards Achievement Tests in English Language Arts and Mathematics
2018–2019 Technical Report
54 American Institutes for Research
Figure 1. Standard Error of Measurements Across Estimated Theta Range
3.2.6 Global Item Exposure
The item exposure rate for each item was calculated by dividing the total number of test administrations in
which an item appears by the total number of tests administered. Then, we reported the distribution of the
item exposure rate (r) in six bins. The bins are r = 0% (unused), 0% < r < 20%, 20% < r < 40%, 40% < r <
60%, 60% < r < 80%, and 80% < r < 100%. If global item exposure is minimal, we would expect the largest
portion of items to appear in the 0% < r < 20% bin, an indication that most of the items appear on a very
small percentage of the test forms. The exposure rates are computed for 5,000 simulated tests in both ELA/L
and mathematics.
Table 29 presents the percentage of items that falls into each exposure bin by subject and grade. The
distribution of exposure rates is as expected, given the number of items in the blueprint constraints. Most
test items are administered in 20% or fewer test administrations. There were no items with high exposure
rates (e.g., 60%–80%, 81%–100%) in both ELA/L and mathematics. All items were used in grades 9 and
10 mathematics, while there were some unused items in ELA/L. Most unused items in ELA/L are due to
unbalanced DOK distribution in passage (e.g., too many DOK 3 or 4 items in each passage) and off-grade
items.

Idaho Standards Achievement Tests in English Language Arts and Mathematics
2018–2019 Technical Report
55 American Institutes for Research
Table 29. Percentage of Items by Exposure Rate
Grade Total
Items
Exposure Rate
Unused 0%–20% 21%–40% 41%–60% 61%–80% 81%–100%
ELA/L
9 2,684 8.76 91.06 0.19 0 0 0
10 2,684 8.64 91.17 0.19 0 0 0
Mathematics
9 971 0 97.12 2.16 0.72 0 0
10 1,081 0 96.48 2.68 0.83 0 0
3.3 ESTABLISHING CUT SCORES
There are several ways that cut scores could be established for the common grades 9 and 10 tests. The most
time-consuming and expensive option would be to bring in a panel of standard setters and do a regular
standard setting similar to the one done by the Consortium. This could have been done after the close of the
testing window in 2015. The big disadvantage of this option was that scores in grades 9 and 10 could not
have been reported until after the standard-setting process was completed. A second more simple and
immediate way that the cut scores could be established was to use a regression interpolation procedure and
determine the cut scores statistically. This is the approach taken in the results below.
AIR examined the cut scores established by Smarter Balanced in a variety of ways. Several patterns were
immediately obvious when examining the cut scores in the vicinity of grade 9 and 10. These are shown in
Figures 2 and 3.
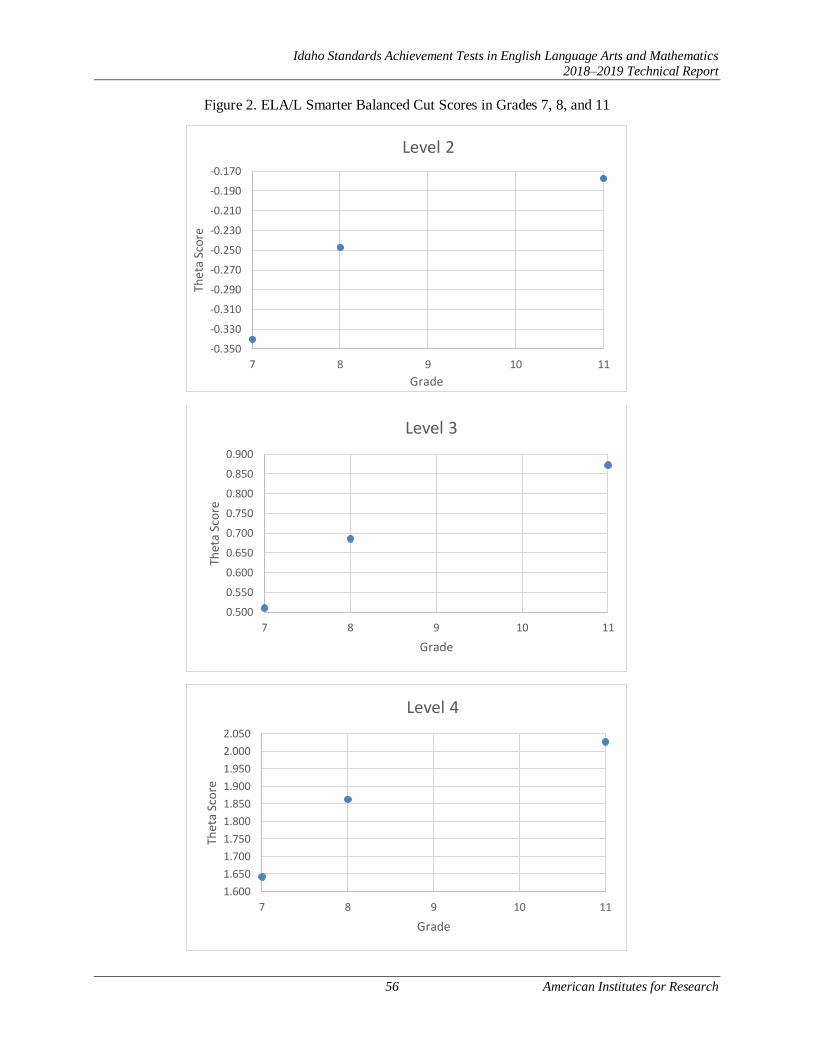
Idaho Standards Achievement Tests in English Language Arts and Mathematics
2018–2019 Technical Report
56 American Institutes for Research
Figure 2. ELA/L Smarter Balanced Cut Scores in Grades 7, 8, and 11
-0.350
-0.330
-0.310
-0.290
-0.270
-0.250
-0.230
-0.210
-0.190
-0.170
7 8 9 10 11
Thet
a Sc
ore
Grade
Level 2
0.500
0.550
0.600
0.650
0.700
0.750
0.800
0.850
0.900
7 8 9 10 11
Thet
a Sc
ore
Grade
Level 3
1.600
1.650
1.700
1.750
1.800
1.850
1.900
1.950
2.000
2.050
7 8 9 10 11
Thet
a Sc
ore
Grade
Level 4
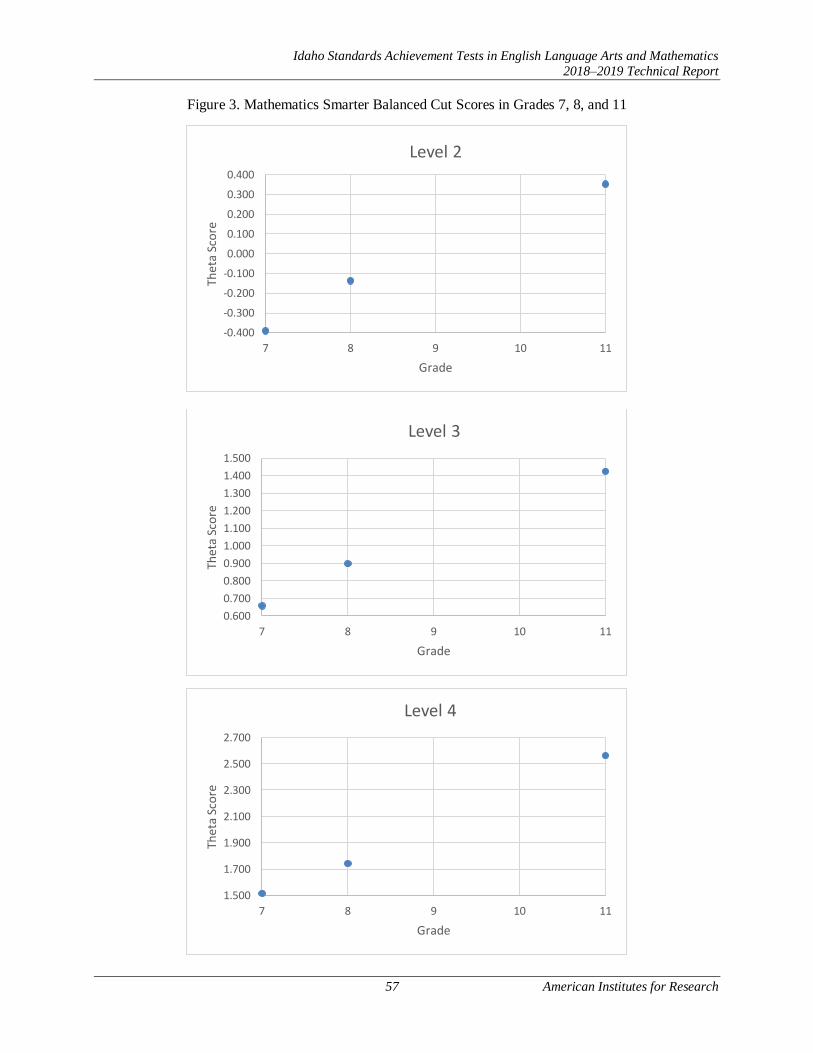
Idaho Standards Achievement Tests in English Language Arts and Mathematics
2018–2019 Technical Report
57 American Institutes for Research
Figure 3. Mathematics Smarter Balanced Cut Scores in Grades 7, 8, and 11
-0.400
-0.300
-0.200
-0.100
0.000
0.100
0.200
0.300
0.400
7 8 9 10 11
Thet
a Sc
ore
Grade
Level 2
0.600
0.700
0.800
0.900
1.000
1.100
1.200
1.300
1.400
1.500
7 8 9 10 11
Thet
a Sc
ore
Grade
Level 3
1.500
1.700
1.900
2.100
2.300
2.500
2.700
7 8 9 10 11
Thet
a Sc
ore
Grade
Level 4

Idaho Standards Achievement Tests in English Language Arts and Mathematics
2018–2019 Technical Report
58 American Institutes for Research
The obvious patterns in the graphs are that the cut scores for ELA/L are curvilinear between grades 7 and
11, but the cut scores for mathematics are linear. Therefore, in order to predict the cut scores for grades 9
and 10, AIR used a curvilinear regression approach for ELA/L and a linear regression approach for
mathematics. For ELA/L, theta was converted to exp(theta). The predicted exp(theta) was converted back
to the original theta metric by taking the log of predicted exp(theta). For mathematics, a simple linear
regression using theta was used. The sample sizes used in the regression analyses are listed in Table 30.
Tables 31 and 32 present the values of cut scores used in the regression, along with the slopes and intercepts
of the regressions. The percentage at and above for grades 9 and 10 was obtained from Educational Testing
Service (ETS). These percentages are based on the 2014 Smarter Balanced field-test vertical linking sample.
The predicted cut scores for grades 9 and 10 are provided in Tables 33 and 34. The scaled score cut scores
for grades 9 and 10 are bolded in both tables. The cut scores look reasonable and are probably very close
to what would be established if an actual workshop were used to recommend standards. The statistical
approach relies on the assumption that the results of the 2014 grade 9 and 10 vertical linking samples are
comparable to the results that would have occurred if the 2014 grade 9 and 10 tests had been administered
according to the above blueprints.
Table 30. Sample Sizes of Grades 9, 10, and 11 Students in Vertical Linking Sample
Grade ELA/L Mathematics
9 7,714 12,016
10 11,924 14,342
11 31,019 21,250
Table 31. Cut Scores for ELA/L
Anchoring
Grade Exp(theta) Theta Cut
Percentage (%)
at and Above
Level 2
7 0.712 -0.340 66
8 0.781 -0.247 71
11 0.838 -0.177 72
Slope 0.028589
Intercept 0.529122
Level 3
7 1.665 0.510 38
8 1.984 0.685 41
11 2.392 0.872 41
Slope 0.17107
Intercept 0.530975
Level 4
7 5.160 1.641 8
8 6.437 1.862 9
11 7.584 2.026 11
Slope 0.554269
Intercept 1.58987

Idaho Standards Achievement Tests in English Language Arts and Mathematics
2018–2019 Technical Report
59 American Institutes for Research
Table 32. Cut Scores for Mathematics
Anchoring Grade Theta Cut Percentage (%) at
and Above
Level 2
7 −0.390 64
8 −0.137 62
11 0.354 59
Slope 0.180846
Intercept −1.625
Level 3
7 0.657 33
8 0.897 32
11 1.426 33
Slope 0.188577
Intercept −0.641
Level 4
7 1.515 13
8 1.741 13
11 2.561 11
Slope 0.264231
Intercept −0.351
Table 33. Predicted Cut Scores for ELA/L
Performance
Standards Grade
Predicted
Theta Cut
Inverse
Proportions Theta Cuts
Scaled Score
Cuts
Level 2
7 −0.316 65 −0.340 2479
8 −0.277 72 −0.247 2487
9 −0.240 68 −0.240 2488
10 −0.205 76 −0.205 2491
11 −0.170 72 −0.177 2493
Level 3
7 0.547 37 0.510 2552
8 0.642 43 0.685 2567
9 0.728 38 0.728 2571
10 0.807 46 0.807 2577
11 0.881 40 0.872 2583
Level 4
7 1.699 8 1.641 2649
8 1.796 10 1.862 2668
9 1.884 9 1.884 2670
10 1.965 13 1.965 2677
11 2.040 11 2.026 2682

Idaho Standards Achievement Tests in English Language Arts and Mathematics
2018–2019 Technical Report
60 American Institutes for Research
Table 34. Predicted Cut Scores for Mathematics
Performance
Standards Grade
Predicted
Theta Cut Inverse
Proportions Theta Cuts
Scaled Score
Cuts
Level 2
7 −0.359 63 −0.390 2484
8 −0.178 63 −0.137 2504
9 0.003 56 0.003 2515
10 0.183 62 0.183 2529
11 0.364 59 0.354 2543
Level 3
7 0.679 32 0.657 2567
8 0.868 33 0.897 2586
9 1.056 28 1.056 2599
10 1.245 33 1.245 2614
11 1.433 33 1.426 2628
Level 4
7 1.499 13 1.515 2635
8 1.763 12 1.741 2653
9 2.027 9 2.027 2676
10 2.291 12 2.291 2697
11 2.556 11 2.561 2718

Idaho Standards Achievement Tests in English Language Arts and Mathematics
2018–2019 Technical Report
61 American Institutes for Research
4. SUMMARY OF 2018–2019 OPERATIONAL TEST ADMINISTRATION
4.1 STUDENT POPULATION
All students enrolled in grades 3–8 and 10 in all public elementary and secondary schools are required to
participate in the Smarter Balanced ELA/L and mathematics assessments. Testing at grades 9 and 11 is
optional. Tables 35–38 present the demographic composition of Idaho students who meet attemptedness
requirements for scoring and reporting of the Smarter Balanced assessments.
Table 35. Number of Students in Summative ELA/L Assessment (Grades 3–8 and 10)
Group G3 G4 G5 G6 G7 G8 G10
All Students 22,722 23,337 24,315 24,367 23,835 23,897 22,305
Female 11,159 11,311 12,005 11,855 11,647 11,558 10,892
Male 11,563 12,026 12,310 12,512 12,188 12,339 11,413
African American 249 261 315 306 250 330 280
AmerIndian/Alaskan 292 276 319 286 309 326 275
Asian 260 254 268 302 267 348 310
Hispanic 3,855 3,948 4,186 4,171 4,035 4,052 3,460
Pacific Islander 198 191 197 177 195 250 381
White 17,868 18,407 19,030 19,125 18,779 18,591 17,599
LEP 2,405 2,067 2,140 1,880 1,718 1,757 1,259
Special Education 2,309 2,244 2,360 2,250 2,107 2,024 1,673
Section 504 492 690 847 979 1,059 1,115 1,027
Note. African American=Black or African American; AmerIndian/Alaskan=American Indian or Alaska Native; Pacific Islander=Native Hawaiian or Other Pacific Islander
Table 36. Number of Students in Summative ELA/L Assessment (Grades 9 and 11)
Group G9 G11
All Students 6,495 388
Female 3,164 197
Male 3,331 191
African American 64 4
AmerIndian/Alaskan 107 8
Asian 52 3
Hispanic 1,074 60
Pacific Islander 38 5
White 5,160 308
LEP 371 14
Special Education 536 66
Section 504 195 14

Idaho Standards Achievement Tests in English Language Arts and Mathematics
2018–2019 Technical Report
62 American Institutes for Research
Table 37. Number of Students in Summative Mathematics Assessment (Grades 3–8 and 10)
Group G3 G4 G5 G6 G7 G8 G10
All Students 22,747 23,356 24,322 24,368 23,826 23,892 22,274
Female 11,165 11,320 12,010 11,854 11,643 11,544 10,866
Male 11,582 12,036 12,312 12,514 12,183 12,348 11,408
African American 261 273 329 312 262 338 283
AmerIndian/Alaskan 293 276 318 285 305 325 273
Asian 264 261 274 305 267 351 309
Hispanic 3,874 3,963 4,201 4,189 4,055 4,067 3,469
Pacific Islander 199 188 197 180 195 251 254
White 17,856 18,395 19,003 19,097 18,742 18,560 17,686
LEP 2,443 2,118 2,190 1,928 1,763 1,785 1,287
Special Education 2,311 2,243 2,356 2,251 2,093 2,022 1,672
Section 504 501 695 851 980 1,061 1,117 1,033
Table 38. Number of Students in Summative Mathematics Assessment (Grades 9 and 11)
Group G9 G11
All Students 6,515 421
Female 3,162 217
Male 3,353 204
African American 76 4
AmerIndian/Alaskan 108 8
Asian 51 4
Hispanic 1,107 66
Pacific Islander 41 5
White 5,132 334
LEP 404 17
Special Education 528 69
Section 504 196 15
4.2 SUMMARY OF OVERALL STUDENT PERFORMANCE
Tables 39–46 present a summary of the 2018–2019 summative test results for all students and by subgroup,
including the average and the standard deviation of scale scores, the percentage of students in each
achievement level, and the percentage of proficient students. Figures 4–6 present the percentage of
proficient students in five years for all students (cohort comparisons). Figures 7–9 present the average scale
scores in five years for all students. The average and the standard deviation of scale scores, as well as the
percentage of proficient students for each test administration across five years by subgroup are provided in
Appendix B.

Idaho Standards Achievement Tests in English Language Arts and Mathematics
2018–2019 Technical Report
63 American Institutes for Research
Table 39. ELA/L Percentage of Students in Achievement Levels
for Overall and by Subgroup (Grades 3–5)
Group Number
Tested
Scale
Score
Mean
Scale
Score
SD
%
Level 1
%
Level 2
%
Level 3
%
Level 4
%
Proficient
Grade 3
All Students 22,722 2427.79 87.96 25 25 25 26 50
Female 11,159 2435.42 86.29 22 24 26 28 54
Male 11,563 2420.43 88.93 28 25 24 23 47
African American 249 2390.77 90.56 41 24 19 16 35
AmerIndian/Alaskan 292 2379.94 87.03 47 24 18 11 29
Asian 260 2445.16 89.22 23 18 26 34 60
Hispanic 3,855 2389.17 81.36 40 28 20 12 32
Pacific Islander 198 2429.55 88.12 24 23 27 26 53
White 17,868 2437.15 86.62 21 24 26 29 55
LEP 2,405 2379.09 79.40 46 27 18 9 27 Special Education 2,309 2349.80 84.15 63 21 10 7 17
Section 504 492 2412.77 81.17 30 27 26 17 43
Grade 4
All Students 23,337 2471.34 93.64 28 20 25 27 52
Female 11,311 2479.78 91.74 24 20 26 29 55
Male 12,026 2463.40 94.71 31 20 24 25 49
African American 261 2423.35 95.91 48 21 17 13 30
AmerIndian/Alaskan 276 2414.75 89.91 52 21 17 10 27
Asian 254 2477.36 100.43 26 17 23 34 57
Hispanic 3,948 2429.98 86.21 44 24 20 12 32
Pacific Islander 191 2467.77 89.04 27 28 17 27 45
White 18,407 2481.69 92.18 24 19 26 31 57
LEP 2,067 2411.93 85.33 52 23 16 9 24
Special Education 2,244 2378.66 89.43 69 15 10 6 16
Section 504 690 2455.52 88.93 33 24 23 20 43 Grade 5
All Students 24,315 2512.57 93.91 23 20 32 24 57
Female 12,005 2523.11 91.24 19 20 34 27 61
Male 12,310 2502.29 95.34 27 21 31 21 53
African American 315 2468.67 95.21 38 21 30 11 41
AmerIndian/Alaskan 319 2457.63 92.93 45 22 23 10 33
Asian 268 2541.03 102.08 19 15 26 40 66
Hispanic 4,186 2469.39 86.75 38 26 26 10 36
Pacific Islander 197 2523.56 81.82 19 23 32 26 58
White 19,030 2523.20 92.12 19 19 34 28 62
LEP 2,140 2452.26 86.40 45 28 20 7 27
Special Education 2,360 2408.32 88.84 68 17 11 4 15
Section 504 847 2501.51 85.91 26 24 32 18 50
Note: The percentage of each achievement level may not add up to 100% due to rounding.

Idaho Standards Achievement Tests in English Language Arts and Mathematics
2018–2019 Technical Report
64 American Institutes for Research
Table 40. ELA/L Percentage of Students in Achievement Levels
for Overall and by Subgroup (Grades 6–8)
Group Number
Tested
Scale
Score
Mean
Scale
Score
SD
%
Level 1
%
Level 2
%
Level 3
%
Level 4
%
Proficient
Grade 6
All Students 24,367 2535.88 93.56 20 25 35 20 55
Female 11,855 2549.42 89.46 16 24 38 23 61
Male 12,512 2523.05 95.54 24 26 33 16 50
African American 306 2489.53 99.72 37 24 30 9 39
AmerIndian/Alaskan 286 2478.77 94.23 38 30 26 5 31
Asian 302 2573.29 94.43 13 16 35 36 71
Hispanic 4,171 2493.11 89.08 34 32 26 8 34
Pacific Islander 177 2536.85 97.30 20 24 38 18 56
White 19,125 2546.20 91.07 16 24 38 22 60
LEP 1,880 2469.38 90.33 45 31 19 5 25 Special Education 2,250 2424.69 87.68 67 22 9 3 11
Section 504 979 2516.33 88.29 25 30 34 12 46
Grade 7
All Students 23,835 2561.12 97.95 20 22 39 19 58
Female 11,647 2577.18 92.83 15 21 42 22 64
Male 12,188 2545.77 100.22 25 24 37 15 52
African American 250 2501.04 109.40 39 28 24 8 33
AmerIndian/Alaskan 309 2512.57 99.11 38 24 32 7 39
Asian 267 2583.58 102.07 16 18 37 28 66
Hispanic 4,035 2513.87 93.94 35 29 30 7 37
Pacific Islander 195 2553.24 89.70 17 26 43 14 57
White 18,779 2572.63 94.99 16 21 42 21 63
LEP 1,718 2489.85 97.32 46 26 23 5 28
IDEA 2,107 2440.02 89.65 68 20 10 2 12
Section 504 1,059 2543.23 89.83 24 26 38 11 49 Grade 8
All Students 23,897 2570.21 96.96 20 26 38 16 54
Female 11,558 2588.55 92.85 15 24 41 20 61
Male 12,339 2553.03 97.60 26 28 34 12 46
African American 330 2514.25 98.38 40 29 25 5 31
AmerIndian/Alaskan 326 2519.90 88.24 37 33 24 5 29
Asian 348 2607.10 97.70 12 20 36 31 67
Hispanic 4,052 2526.05 91.44 34 33 27 6 33
Pacific Islander 250 2571.50 91.44 16 32 36 15 52
White 18,591 2581.00 94.86 17 25 40 18 59
LEP 1,757 2501.89 91.64 44 32 19 4 24
Special Education 2,024 2450.97 81.69 71 20 8 1 9
Section 504 1,115 2556.67 88.07 22 32 37 9 46
Note: The percentage of each achievement level may not add up to 100% due to rounding.

Idaho Standards Achievement Tests in English Language Arts and Mathematics
2018–2019 Technical Report
65 American Institutes for Research
Table 41. ELA/L Percentage of Students in Achievement Levels
for Overall and by Subgroup (Grade 10)
Group Number
Tested
Scale
Score
Mean
Scale
Score
SD
%
Level 1
%
Level 2
%
Level 3
%
Level 4
%
Proficient
Grade 10
All Students 22,305 2592.89 109.75 19 22 35 24 59
Female 10,892 2608.87 103.21 14 21 38 27 65
Male 11,413 2577.64 113.59 24 23 32 21 53
African American 280 2510.63 115.63 43 27 21 9 30
AmerIndian/Alaskan 275 2538.82 104.61 34 30 26 10 36
Asian 310 2627.31 101.02 11 19 36 35 71
Hispanic 3,460 2544.20 104.61 31 30 28 11 39
Pacific Islander 381 2611.08 107.28 14 18 39 28 68
White 17,599 2603.62 107.44 16 20 36 27 64
LEP 1,259 2509.29 107.27 45 28 20 7 27 Special Education 1,673 2459.26 92.96 68 20 9 2 11
Section 504 1,027 2582.78 105.01 21 25 34 20 54
Note: The percentage of each achievement level may not add up to 100% due to rounding.
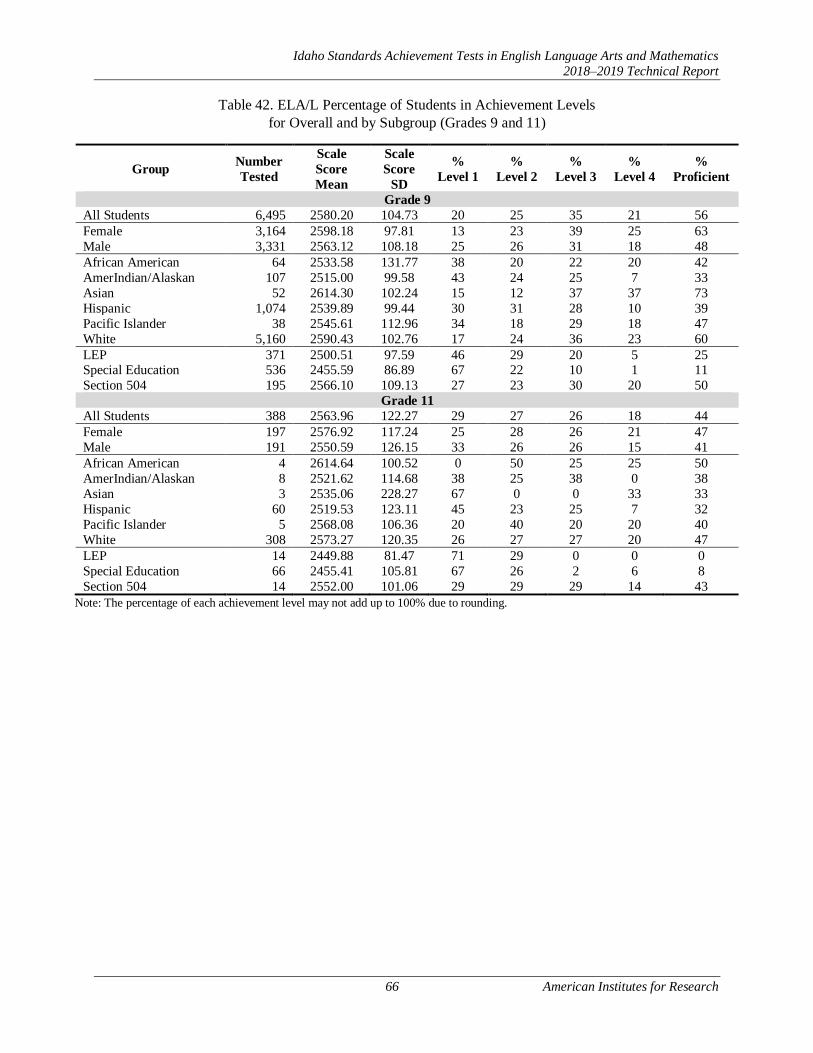
Idaho Standards Achievement Tests in English Language Arts and Mathematics
2018–2019 Technical Report
66 American Institutes for Research
Table 42. ELA/L Percentage of Students in Achievement Levels
for Overall and by Subgroup (Grades 9 and 11)
Group Number
Tested
Scale
Score
Mean
Scale
Score
SD
%
Level 1
%
Level 2
%
Level 3
%
Level 4
%
Proficient
Grade 9
All Students 6,495 2580.20 104.73 20 25 35 21 56
Female 3,164 2598.18 97.81 13 23 39 25 63
Male 3,331 2563.12 108.18 25 26 31 18 48
African American 64 2533.58 131.77 38 20 22 20 42
AmerIndian/Alaskan 107 2515.00 99.58 43 24 25 7 33
Asian 52 2614.30 102.24 15 12 37 37 73
Hispanic 1,074 2539.89 99.44 30 31 28 10 39
Pacific Islander 38 2545.61 112.96 34 18 29 18 47
White 5,160 2590.43 102.76 17 24 36 23 60
LEP 371 2500.51 97.59 46 29 20 5 25 Special Education 536 2455.59 86.89 67 22 10 1 11
Section 504 195 2566.10 109.13 27 23 30 20 50
Grade 11
All Students 388 2563.96 122.27 29 27 26 18 44
Female 197 2576.92 117.24 25 28 26 21 47
Male 191 2550.59 126.15 33 26 26 15 41
African American 4 2614.64 100.52 0 50 25 25 50
AmerIndian/Alaskan 8 2521.62 114.68 38 25 38 0 38
Asian 3 2535.06 228.27 67 0 0 33 33
Hispanic 60 2519.53 123.11 45 23 25 7 32
Pacific Islander 5 2568.08 106.36 20 40 20 20 40
White 308 2573.27 120.35 26 27 27 20 47
LEP 14 2449.88 81.47 71 29 0 0 0
Special Education 66 2455.41 105.81 67 26 2 6 8
Section 504 14 2552.00 101.06 29 29 29 14 43
Note: The percentage of each achievement level may not add up to 100% due to rounding.
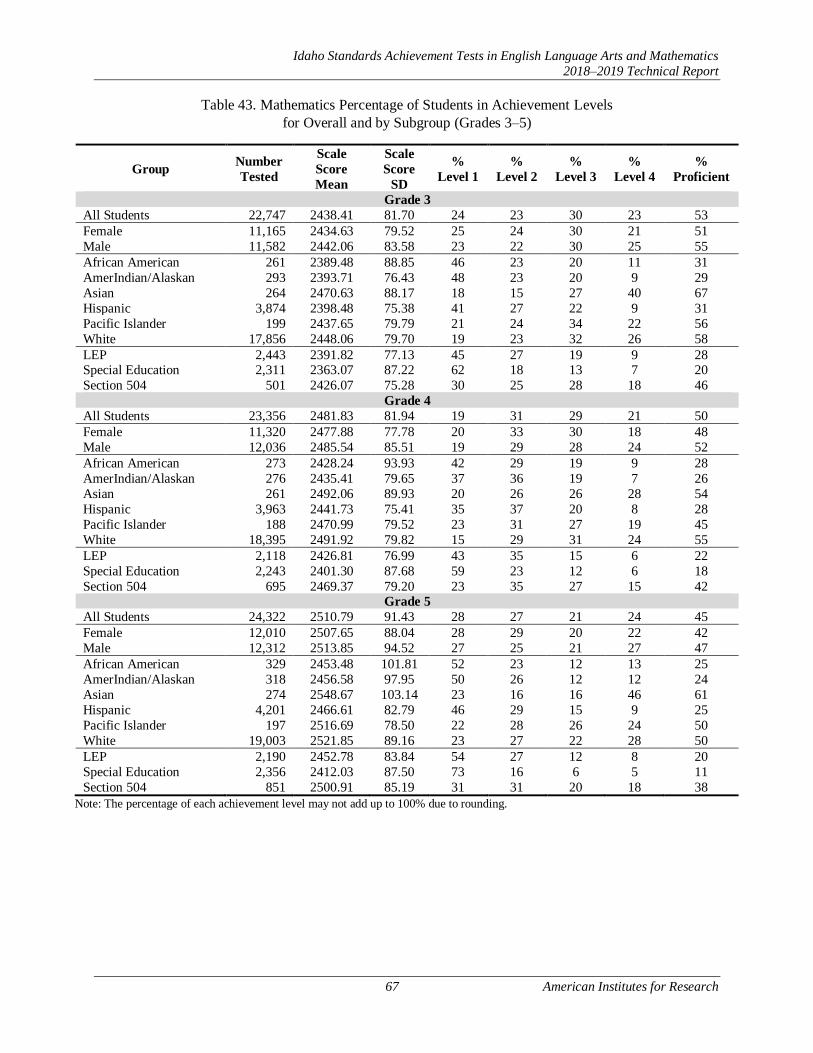
Idaho Standards Achievement Tests in English Language Arts and Mathematics
2018–2019 Technical Report
67 American Institutes for Research
Table 43. Mathematics Percentage of Students in Achievement Levels
for Overall and by Subgroup (Grades 3–5)
Group Number
Tested
Scale
Score
Mean
Scale
Score
SD
%
Level 1
%
Level 2
%
Level 3
%
Level 4
%
Proficient
Grade 3
All Students 22,747 2438.41 81.70 24 23 30 23 53
Female 11,165 2434.63 79.52 25 24 30 21 51
Male 11,582 2442.06 83.58 23 22 30 25 55
African American 261 2389.48 88.85 46 23 20 11 31
AmerIndian/Alaskan 293 2393.71 76.43 48 23 20 9 29
Asian 264 2470.63 88.17 18 15 27 40 67
Hispanic 3,874 2398.48 75.38 41 27 22 9 31
Pacific Islander 199 2437.65 79.79 21 24 34 22 56
White 17,856 2448.06 79.70 19 23 32 26 58
LEP 2,443 2391.82 77.13 45 27 19 9 28 Special Education 2,311 2363.07 87.22 62 18 13 7 20
Section 504 501 2426.07 75.28 30 25 28 18 46
Grade 4
All Students 23,356 2481.83 81.94 19 31 29 21 50
Female 11,320 2477.88 77.78 20 33 30 18 48
Male 12,036 2485.54 85.51 19 29 28 24 52
African American 273 2428.24 93.93 42 29 19 9 28
AmerIndian/Alaskan 276 2435.41 79.65 37 36 19 7 26
Asian 261 2492.06 89.93 20 26 26 28 54
Hispanic 3,963 2441.73 75.41 35 37 20 8 28
Pacific Islander 188 2470.99 79.52 23 31 27 19 45
White 18,395 2491.92 79.82 15 29 31 24 55
LEP 2,118 2426.81 76.99 43 35 15 6 22
Special Education 2,243 2401.30 87.68 59 23 12 6 18
Section 504 695 2469.37 79.20 23 35 27 15 42 Grade 5
All Students 24,322 2510.79 91.43 28 27 21 24 45
Female 12,010 2507.65 88.04 28 29 20 22 42
Male 12,312 2513.85 94.52 27 25 21 27 47
African American 329 2453.48 101.81 52 23 12 13 25
AmerIndian/Alaskan 318 2456.58 97.95 50 26 12 12 24
Asian 274 2548.67 103.14 23 16 16 46 61
Hispanic 4,201 2466.61 82.79 46 29 15 9 25
Pacific Islander 197 2516.69 78.50 22 28 26 24 50
White 19,003 2521.85 89.16 23 27 22 28 50
LEP 2,190 2452.78 83.84 54 27 12 8 20
Special Education 2,356 2412.03 87.50 73 16 6 5 11
Section 504 851 2500.91 85.19 31 31 20 18 38
Note: The percentage of each achievement level may not add up to 100% due to rounding.
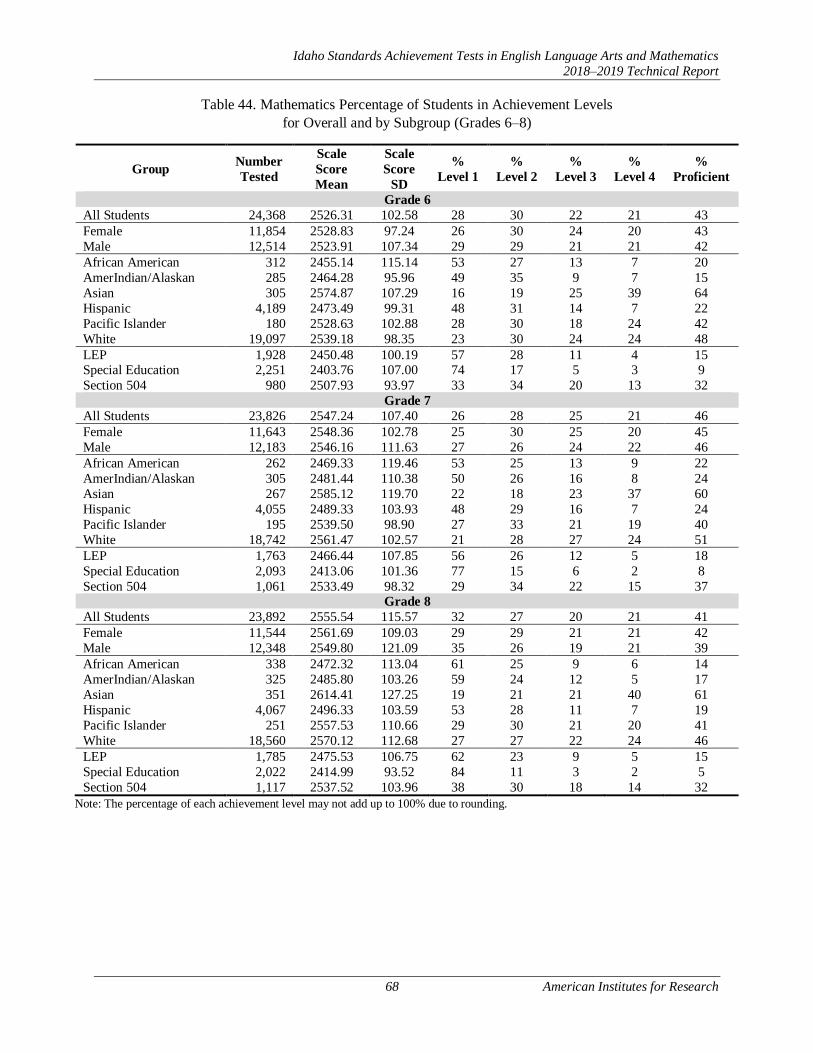
Idaho Standards Achievement Tests in English Language Arts and Mathematics
2018–2019 Technical Report
68 American Institutes for Research
Table 44. Mathematics Percentage of Students in Achievement Levels
for Overall and by Subgroup (Grades 6–8)
Group Number
Tested
Scale
Score
Mean
Scale
Score
SD
%
Level 1
%
Level 2
%
Level 3
%
Level 4
%
Proficient
Grade 6
All Students 24,368 2526.31 102.58 28 30 22 21 43
Female 11,854 2528.83 97.24 26 30 24 20 43
Male 12,514 2523.91 107.34 29 29 21 21 42
African American 312 2455.14 115.14 53 27 13 7 20
AmerIndian/Alaskan 285 2464.28 95.96 49 35 9 7 15
Asian 305 2574.87 107.29 16 19 25 39 64
Hispanic 4,189 2473.49 99.31 48 31 14 7 22
Pacific Islander 180 2528.63 102.88 28 30 18 24 42
White 19,097 2539.18 98.35 23 30 24 24 48
LEP 1,928 2450.48 100.19 57 28 11 4 15 Special Education 2,251 2403.76 107.00 74 17 5 3 9
Section 504 980 2507.93 93.97 33 34 20 13 32
Grade 7
All Students 23,826 2547.24 107.40 26 28 25 21 46
Female 11,643 2548.36 102.78 25 30 25 20 45
Male 12,183 2546.16 111.63 27 26 24 22 46
African American 262 2469.33 119.46 53 25 13 9 22
AmerIndian/Alaskan 305 2481.44 110.38 50 26 16 8 24
Asian 267 2585.12 119.70 22 18 23 37 60
Hispanic 4,055 2489.33 103.93 48 29 16 7 24
Pacific Islander 195 2539.50 98.90 27 33 21 19 40
White 18,742 2561.47 102.57 21 28 27 24 51
LEP 1,763 2466.44 107.85 56 26 12 5 18
Special Education 2,093 2413.06 101.36 77 15 6 2 8
Section 504 1,061 2533.49 98.32 29 34 22 15 37 Grade 8
All Students 23,892 2555.54 115.57 32 27 20 21 41
Female 11,544 2561.69 109.03 29 29 21 21 42
Male 12,348 2549.80 121.09 35 26 19 21 39
African American 338 2472.32 113.04 61 25 9 6 14
AmerIndian/Alaskan 325 2485.80 103.26 59 24 12 5 17
Asian 351 2614.41 127.25 19 21 21 40 61
Hispanic 4,067 2496.33 103.59 53 28 11 7 19
Pacific Islander 251 2557.53 110.66 29 30 21 20 41
White 18,560 2570.12 112.68 27 27 22 24 46
LEP 1,785 2475.53 106.75 62 23 9 5 15
Special Education 2,022 2414.99 93.52 84 11 3 2 5
Section 504 1,117 2537.52 103.96 38 30 18 14 32
Note: The percentage of each achievement level may not add up to 100% due to rounding.

Idaho Standards Achievement Tests in English Language Arts and Mathematics
2018–2019 Technical Report
69 American Institutes for Research
Table 45. Mathematics Percentage of Students in Achievement Levels
for Overall and by Subgroup (Grade 10)
Group Number
Tested
Scale
Score
Mean
Scale
Score
SD
%
Level 1
%
Level 2
%
Level 3
%
Level 4
%
Proficient
Grade 10
All Students 22,274 2561.64 121.61 40 27 19 14 33
Female 10,866 2562.11 114.74 38 29 20 12 32
Male 11,408 2561.20 127.82 42 24 18 16 34
African American 283 2464.09 124.87 69 20 6 4 10
AmerIndian/Alaskan 273 2500.97 115.04 63 22 10 5 16
Asian 309 2619.60 129.62 23 25 24 28 51
Hispanic 3,469 2500.24 106.52 63 23 11 4 14
Pacific Islander 254 2559.62 122.15 39 30 17 14 31
White 17,686 2575.20 119.38 35 28 21 16 37
LEP 1,287 2473.30 111.83 71 19 6 3 10 Special Education 1,672 2425.83 101.75 88 8 2 2 4
Section 504 1,033 2546.89 115.28 46 27 17 9 27
Note: The percentage of each achievement level may not add up to 100% due to rounding.
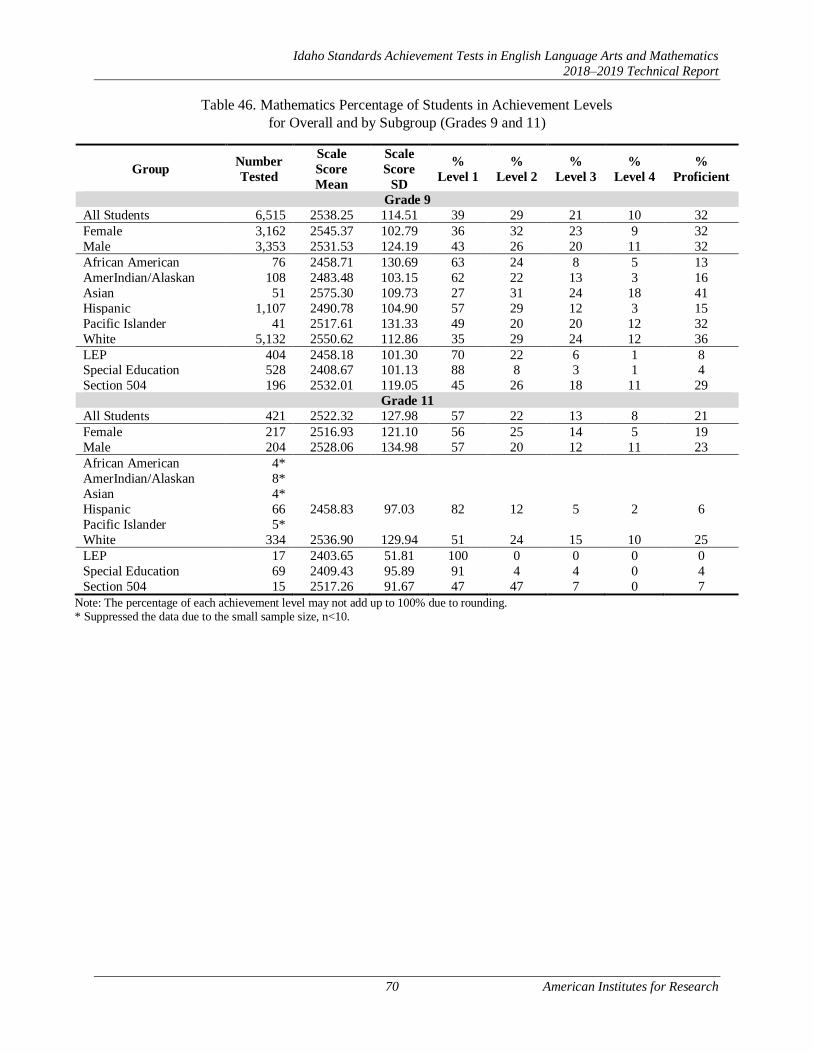
Idaho Standards Achievement Tests in English Language Arts and Mathematics
2018–2019 Technical Report
70 American Institutes for Research
Table 46. Mathematics Percentage of Students in Achievement Levels
for Overall and by Subgroup (Grades 9 and 11)
Group Number
Tested
Scale
Score
Mean
Scale
Score
SD
%
Level 1
%
Level 2
%
Level 3
%
Level 4
%
Proficient
Grade 9
All Students 6,515 2538.25 114.51 39 29 21 10 32
Female 3,162 2545.37 102.79 36 32 23 9 32
Male 3,353 2531.53 124.19 43 26 20 11 32
African American 76 2458.71 130.69 63 24 8 5 13
AmerIndian/Alaskan 108 2483.48 103.15 62 22 13 3 16
Asian 51 2575.30 109.73 27 31 24 18 41
Hispanic 1,107 2490.78 104.90 57 29 12 3 15
Pacific Islander 41 2517.61 131.33 49 20 20 12 32
White 5,132 2550.62 112.86 35 29 24 12 36
LEP 404 2458.18 101.30 70 22 6 1 8 Special Education 528 2408.67 101.13 88 8 3 1 4
Section 504 196 2532.01 119.05 45 26 18 11 29
Grade 11
All Students 421 2522.32 127.98 57 22 13 8 21
Female 217 2516.93 121.10 56 25 14 5 19
Male 204 2528.06 134.98 57 20 12 11 23
African American 4*
AmerIndian/Alaskan 8*
Asian 4*
Hispanic 66 2458.83 97.03 82 12 5 2 6
Pacific Islander 5*
White 334 2536.90 129.94 51 24 15 10 25
LEP 17 2403.65 51.81 100 0 0 0 0
Special Education 69 2409.43 95.89 91 4 4 0 4
Section 504 15 2517.26 91.67 47 47 7 0 7
Note: The percentage of each achievement level may not add up to 100% due to rounding. * Suppressed the data due to the small sample size, n<10.

Idaho Standards Achievement Tests in English Language Arts and Mathematics
2018–2019 Technical Report
71 American Institutes for Research
Figure 4. ELA/L %Proficient Across Years (Grades 3–8 and 10)
48
46
52
48
5152
60
4950
54
50
5354
61
4748
54
51
54
52
59
50 50
5554 54 54
59
50
52
57
55
58
54
59
Grade 3 Grade 4 Grade 5 Grade 6 Grade 7 Grade 8 Grade 10
2015 2016 2017 2018 2019

Idaho Standards Achievement Tests in English Language Arts and Mathematics
2018–2019 Technical Report
72 American Institutes for Research
Figure 5. Mathematics %Proficient Across Years (Grades 3–8 and 10)
50
43
38
36
3837
30
52
47
4039
42
38
31
50
47
42
40
42
39
32
52
48
4344 44
42
33
53
50
45
43
46
41
33
Grade 3 Grade 4 Grade 5 Grade 6 Grade 7 Grade 8 Grade 10
2015 2016 2017 2018 2019

Idaho Standards Achievement Tests in English Language Arts and Mathematics
2018–2019 Technical Report
73 American Institutes for Research
Figure 6. ELA/L and Mathematics %Proficient Across Years (Grades 9 and 11)
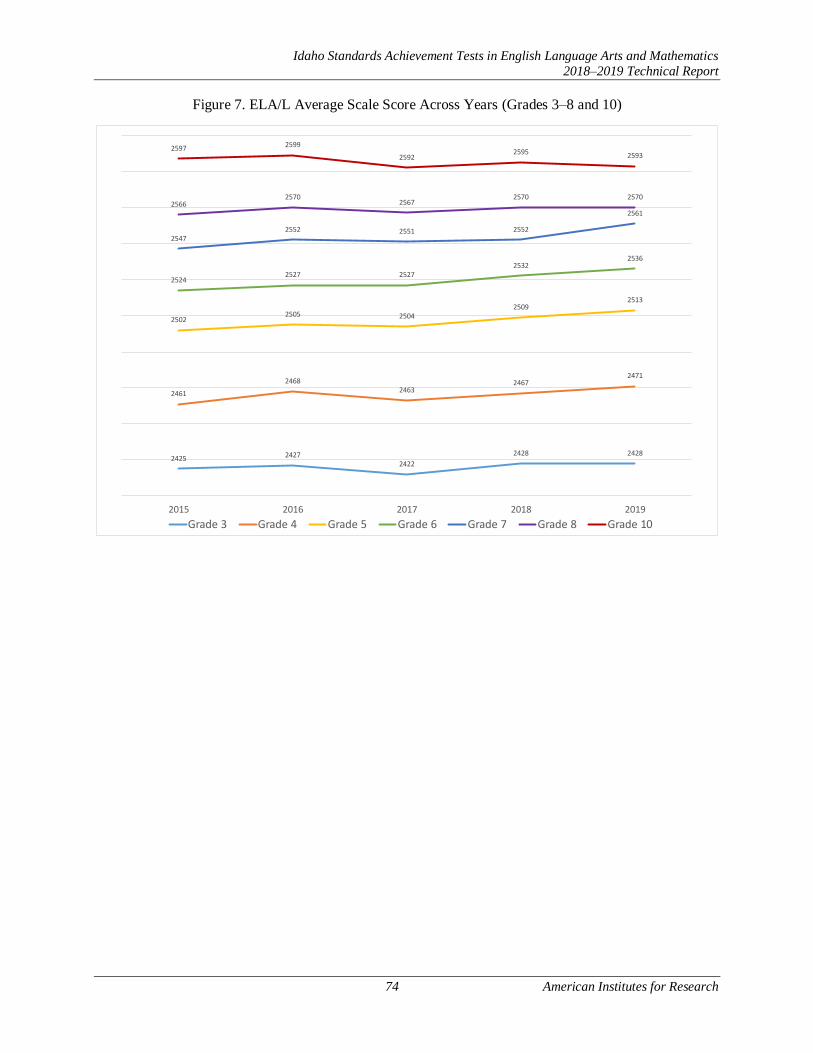
Idaho Standards Achievement Tests in English Language Arts and Mathematics
2018–2019 Technical Report
74 American Institutes for Research
Figure 7. ELA/L Average Scale Score Across Years (Grades 3–8 and 10)
2425 24272422
2428 2428
2461
24682463
24672471
25022505 2504
25092513
25242527 2527
25322536
25472552 2551 2552
25612566
25702567
2570 2570
2597 2599
25922595 2593
2015 2016 2017 2018 2019
Grade 3 Grade 4 Grade 5 Grade 6 Grade 7 Grade 8 Grade 10

Idaho Standards Achievement Tests in English Language Arts and Mathematics
2018–2019 Technical Report
75 American Institutes for Research
Figure 8. Mathematics Average Scale Score Across Years (Grades 3–8 and 10)
24312435 2434
2437 2438
2470
24772475
24782482
24992502
25052507
2511
2516
2521 2522
25292526
2532
2541 2541 2542
254725462551 2551
2557
255625552557
25592562 2562
2015 2016 2017 2018 2019
Grade 3 Grade 4 Grade 5 Grade 6 Grade 7 Grade 8 Grade 10

Idaho Standards Achievement Tests in English Language Arts and Mathematics
2018–2019 Technical Report
76 American Institutes for Research
Figure 9. ELA/L and Mathematics Average Scale Score Across Years (Grades 9 and 11)

Idaho Standards Achievement Tests in English Language Arts and Mathematics
2018–2019 Technical Report
77 American Institutes for Research
Because the precision of scores in each claim is not sufficient to report scores, given a small number of
items, the scores on each claim are reported using one of the three performance categories, taking into
account the Standard Error of Measurement (SEM) of the claim score: (1) Below Standard, (2) At/Near
Standard, or (3) Above Standard (see Section 7.5, Rules for Calculating Strengths and Weaknesses for
Claim Scores, for the rules). Tables 47–50 present the distribution of performance categories for each claim.
The number of claims is four in ELA/L, and three in mathematics, combining claims 2 and 4.
Table 47. ELA/L Percentage of Students in Performance Categories by Claim (Grades 3–8 and 10)
Grade Performance
Category
Claim 1:
Reading
Claim 2:
Writing
Claim 3:
Listening
Claim 4:
Research
3
Below 24 27 14 28
At/Near 48 53 62 52
Above 27 20 24 20
4
Below 24 24 14 28
At/Near 47 55 64 53
Above 28 21 22 20
5
Below 21 20 17 25
At/Near 47 55 63 48
Above 32 25 20 27
6
Below 25 22 15 20
At/Near 47 55 66 53
Above 27 23 19 26
7
Below 25 19 15 21
At/Near 48 52 68 52
Above 28 29 16 27
8
Below 24 20 15 24
At/Near 48 56 66 51
Above 28 24 18 25
10
Below 23 16 14 22
At/Near 45 50 63 51
Above 32 34 23 27
Table 48. ELA/L Percentage of Students in Performance Categories by Claim (Grades 9 and 11)
Grade Performance
Category
Claim 1:
Reading
Claim 2:
Writing
Claim 3:
Listening
Claim 4:
Research
9
Below 23 16 14 23
At/Near 48 54 66 52
Above 29 30 20 25
11
Below 35 24 23 34
At/Near 39 51 57 46
Above 25 25 20 19
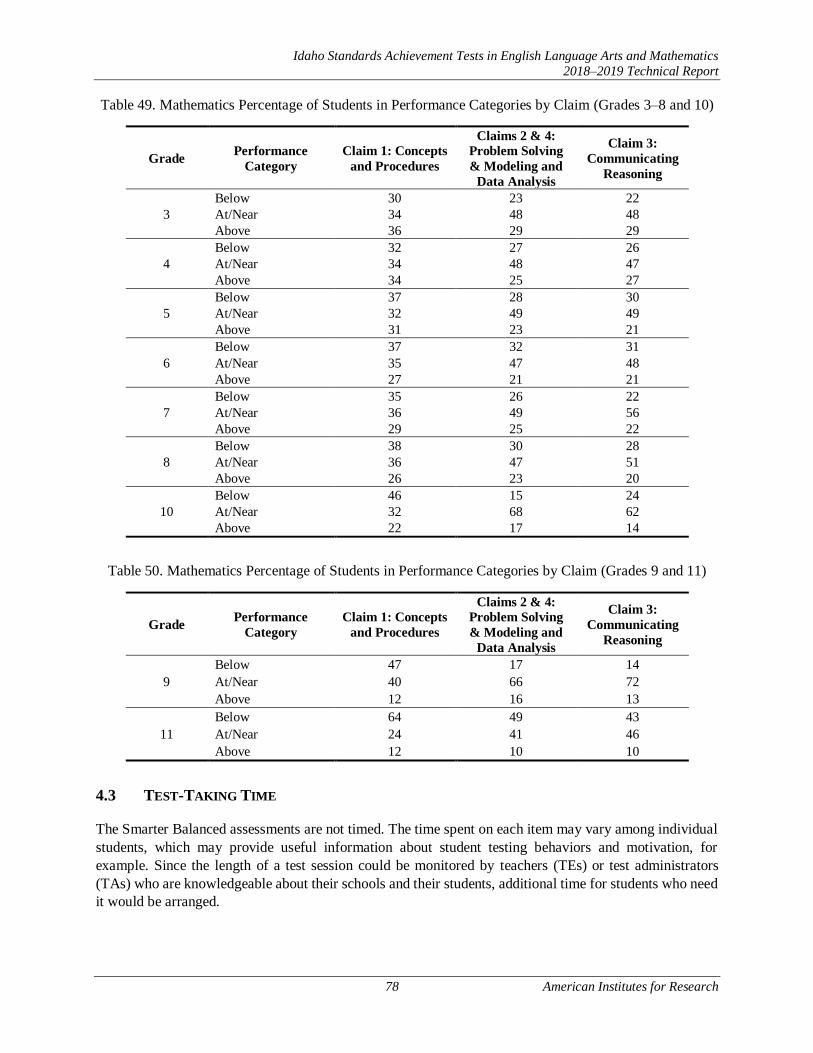
Idaho Standards Achievement Tests in English Language Arts and Mathematics
2018–2019 Technical Report
78 American Institutes for Research
Table 49. Mathematics Percentage of Students in Performance Categories by Claim (Grades 3–8 and 10)
Grade Performance
Category
Claim 1: Concepts
and Procedures
Claims 2 & 4:
Problem Solving
& Modeling and
Data Analysis
Claim 3:
Communicating
Reasoning
3
Below 30 23 22
At/Near 34 48 48
Above 36 29 29
4
Below 32 27 26
At/Near 34 48 47
Above 34 25 27
5
Below 37 28 30
At/Near 32 49 49
Above 31 23 21
6
Below 37 32 31
At/Near 35 47 48
Above 27 21 21
7
Below 35 26 22
At/Near 36 49 56
Above 29 25 22
8
Below 38 30 28
At/Near 36 47 51
Above 26 23 20
10
Below 46 15 24
At/Near 32 68 62
Above 22 17 14
Table 50. Mathematics Percentage of Students in Performance Categories by Claim (Grades 9 and 11)
Grade Performance
Category
Claim 1: Concepts
and Procedures
Claims 2 & 4:
Problem Solving
& Modeling and
Data Analysis
Claim 3:
Communicating
Reasoning
9
Below 47 17 14
At/Near 40 66 72
Above 12 16 13
11
Below 64 49 43
At/Near 24 41 46
Above 12 10 10
4.3 TEST-TAKING TIME
The Smarter Balanced assessments are not timed. The time spent on each item may vary among individual
students, which may provide useful information about student testing behaviors and motivation, for
example. Since the length of a test session could be monitored by teachers (TEs) or test administrators
(TAs) who are knowledgeable about their schools and their students, additional time for students who need
it would be arranged.

Idaho Standards Achievement Tests in English Language Arts and Mathematics
2018–2019 Technical Report
79 American Institutes for Research
In the test delivery system (TDS), item response latency is captured as the item page time (the length of
time that each item page is presented) in milliseconds. Discrete items appear on the screen one item at a
time, and items associated with a stimulus appear on the screen together with the page time measured as
the total time spent on all associated items. In this case, the page time for each item is the average time for
all the items associated with the stimulus. For each student, the total testing time for the test was the sum
of the page time for all items.
Tables 51–54 present an average testing time and the testing time at percentiles for the overall test, the CAT
component, and the PT component.
Table 51. ELA/L Test-Taking Time (Grades 3–8 and 10)
Grade
Average
Testing
Time
(hh:mm)
SD of
Testing
Time
(hh:mm)
Testing Time in Percentiles (hh:mm)
75th 80th 85th 90th 95th
Overall Test
3 3:36 1:57 4:25 4:48 5:20 6:05 7:19
4 3:40 1:51 4:31 4:53 5:23 6:04 7:10
5 3:44 1:53 4:33 4:56 5:28 6:12 7:24
6 3:45 1:46 4:33 4:53 5:20 5:59 7:05
7 3:11 1:30 3:50 4:07 4:29 4:59 5:55
8 3:03 1:29 3:43 4:00 4:22 4:55 5:47
10 2:08 1:05 2:36 2:47 3:02 3:23 4:03
CAT Component
3 1:41 0:52 2:01 2:10 2:21 2:38 3:11
4 1:43 0:47 2:03 2:12 2:22 2:38 3:09
5 1:45 0:48 2:05 2:14 2:26 2:43 3:17
6 1:56 0:49 2:19 2:28 2:39 2:56 3:26
7 1:36 0:40 1:55 2:02 2:11 2:24 2:47
8 1:34 0:42 1:52 2:00 2:10 2:24 2:51
10 1:09 0:31 1:25 1:30 1:37 1:48 2:04
PT Component
3 1:55 1:22 2:27 2:44 3:07 3:39 4:35
4 1:58 1:19 2:30 2:47 3:09 3:40 4:31
5 1:59 1:18 2:31 2:47 3:09 3:38 4:30
6 1:49 1:10 2:17 2:31 2:50 3:16 3:59
7 1:35 1:01 1:58 2:11 2:25 2:48 3:29
8 1:29 0:58 1:52 2:04 2:18 2:40 3:17
10 0:59 0:41 1:15 1:22 1:32 1:45 2:11
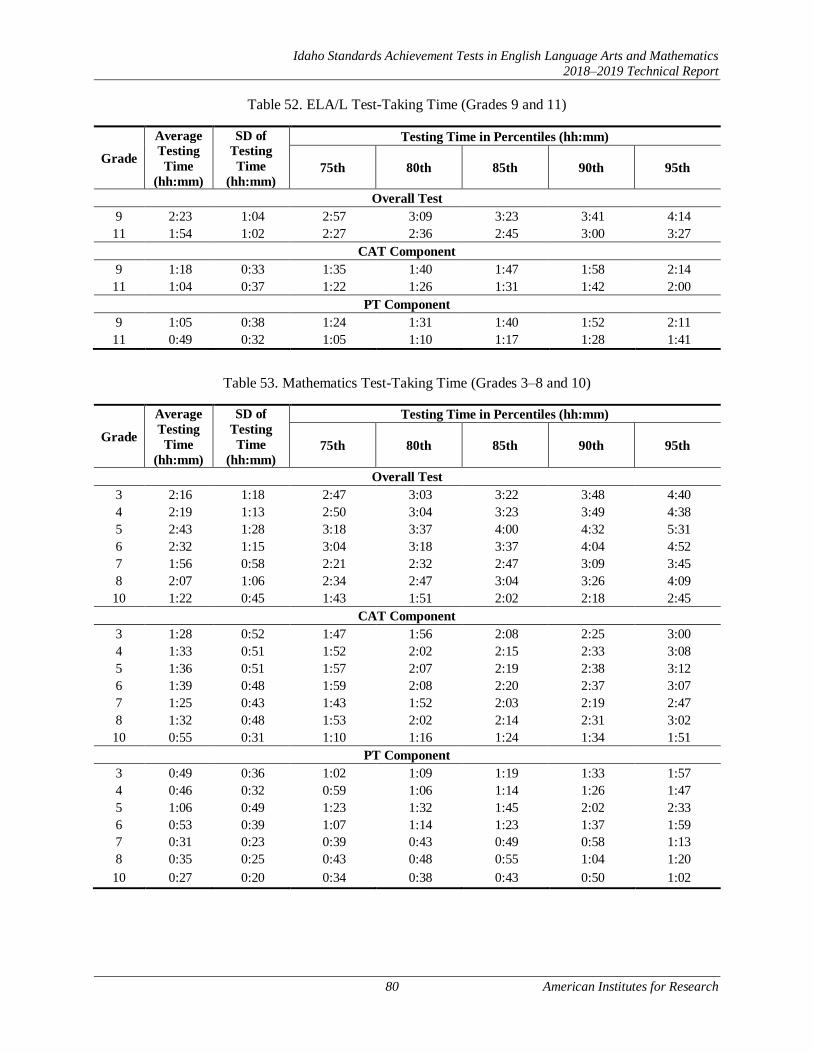
Idaho Standards Achievement Tests in English Language Arts and Mathematics
2018–2019 Technical Report
80 American Institutes for Research
Table 52. ELA/L Test-Taking Time (Grades 9 and 11)
Grade
Average
Testing
Time
(hh:mm)
SD of
Testing
Time
(hh:mm)
Testing Time in Percentiles (hh:mm)
75th 80th 85th 90th 95th
Overall Test
9 2:23 1:04 2:57 3:09 3:23 3:41 4:14
11 1:54 1:02 2:27 2:36 2:45 3:00 3:27
CAT Component
9 1:18 0:33 1:35 1:40 1:47 1:58 2:14
11 1:04 0:37 1:22 1:26 1:31 1:42 2:00
PT Component
9 1:05 0:38 1:24 1:31 1:40 1:52 2:11
11 0:49 0:32 1:05 1:10 1:17 1:28 1:41
Table 53. Mathematics Test-Taking Time (Grades 3–8 and 10)
Grade
Average
Testing
Time
(hh:mm)
SD of
Testing
Time
(hh:mm)
Testing Time in Percentiles (hh:mm)
75th 80th 85th 90th 95th
Overall Test
3 2:16 1:18 2:47 3:03 3:22 3:48 4:40
4 2:19 1:13 2:50 3:04 3:23 3:49 4:38
5 2:43 1:28 3:18 3:37 4:00 4:32 5:31
6 2:32 1:15 3:04 3:18 3:37 4:04 4:52
7 1:56 0:58 2:21 2:32 2:47 3:09 3:45
8 2:07 1:06 2:34 2:47 3:04 3:26 4:09
10 1:22 0:45 1:43 1:51 2:02 2:18 2:45
CAT Component
3 1:28 0:52 1:47 1:56 2:08 2:25 3:00
4 1:33 0:51 1:52 2:02 2:15 2:33 3:08
5 1:36 0:51 1:57 2:07 2:19 2:38 3:12
6 1:39 0:48 1:59 2:08 2:20 2:37 3:07
7 1:25 0:43 1:43 1:52 2:03 2:19 2:47
8 1:32 0:48 1:53 2:02 2:14 2:31 3:02
10 0:55 0:31 1:10 1:16 1:24 1:34 1:51
PT Component
3 0:49 0:36 1:02 1:09 1:19 1:33 1:57
4 0:46 0:32 0:59 1:06 1:14 1:26 1:47
5 1:06 0:49 1:23 1:32 1:45 2:02 2:33
6 0:53 0:39 1:07 1:14 1:23 1:37 1:59
7 0:31 0:23 0:39 0:43 0:49 0:58 1:13
8 0:35 0:25 0:43 0:48 0:55 1:04 1:20
10 0:27 0:20 0:34 0:38 0:43 0:50 1:02
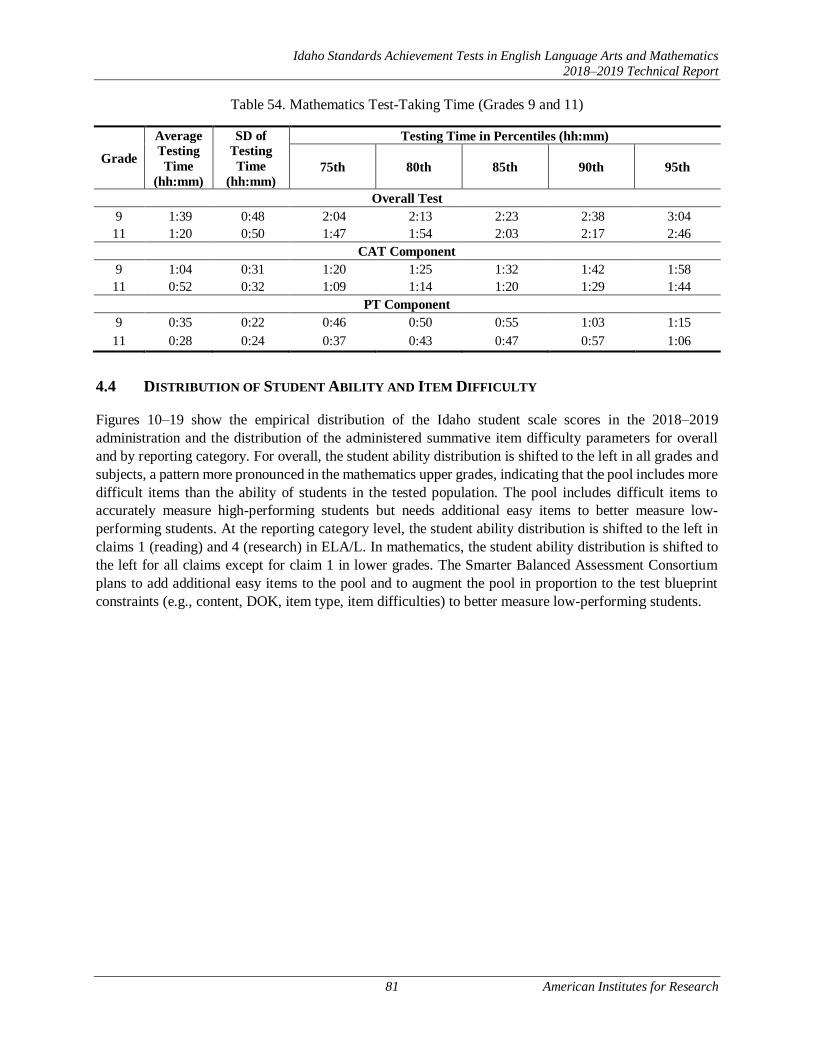
Idaho Standards Achievement Tests in English Language Arts and Mathematics
2018–2019 Technical Report
81 American Institutes for Research
Table 54. Mathematics Test-Taking Time (Grades 9 and 11)
Grade
Average
Testing
Time
(hh:mm)
SD of
Testing
Time
(hh:mm)
Testing Time in Percentiles (hh:mm)
75th 80th 85th 90th 95th
Overall Test
9 1:39 0:48 2:04 2:13 2:23 2:38 3:04
11 1:20 0:50 1:47 1:54 2:03 2:17 2:46
CAT Component
9 1:04 0:31 1:20 1:25 1:32 1:42 1:58
11 0:52 0:32 1:09 1:14 1:20 1:29 1:44
PT Component
9 0:35 0:22 0:46 0:50 0:55 1:03 1:15
11 0:28 0:24 0:37 0:43 0:47 0:57 1:06
4.4 DISTRIBUTION OF STUDENT ABILITY AND ITEM DIFFICULTY
Figures 10–19 show the empirical distribution of the Idaho student scale scores in the 2018–2019
administration and the distribution of the administered summative item difficulty parameters for overall
and by reporting category. For overall, the student ability distribution is shifted to the left in all grades and
subjects, a pattern more pronounced in the mathematics upper grades, indicating that the pool includes more
difficult items than the ability of students in the tested population. The pool includes difficult items to
accurately measure high-performing students but needs additional easy items to better measure low-
performing students. At the reporting category level, the student ability distribution is shifted to the left in
claims 1 (reading) and 4 (research) in ELA/L. In mathematics, the student ability distribution is shifted to
the left for all claims except for claim 1 in lower grades. The Smarter Balanced Assessment Consortium
plans to add additional easy items to the pool and to augment the pool in proportion to the test blueprint
constraints (e.g., content, DOK, item type, item difficulties) to better measure low-performing students.
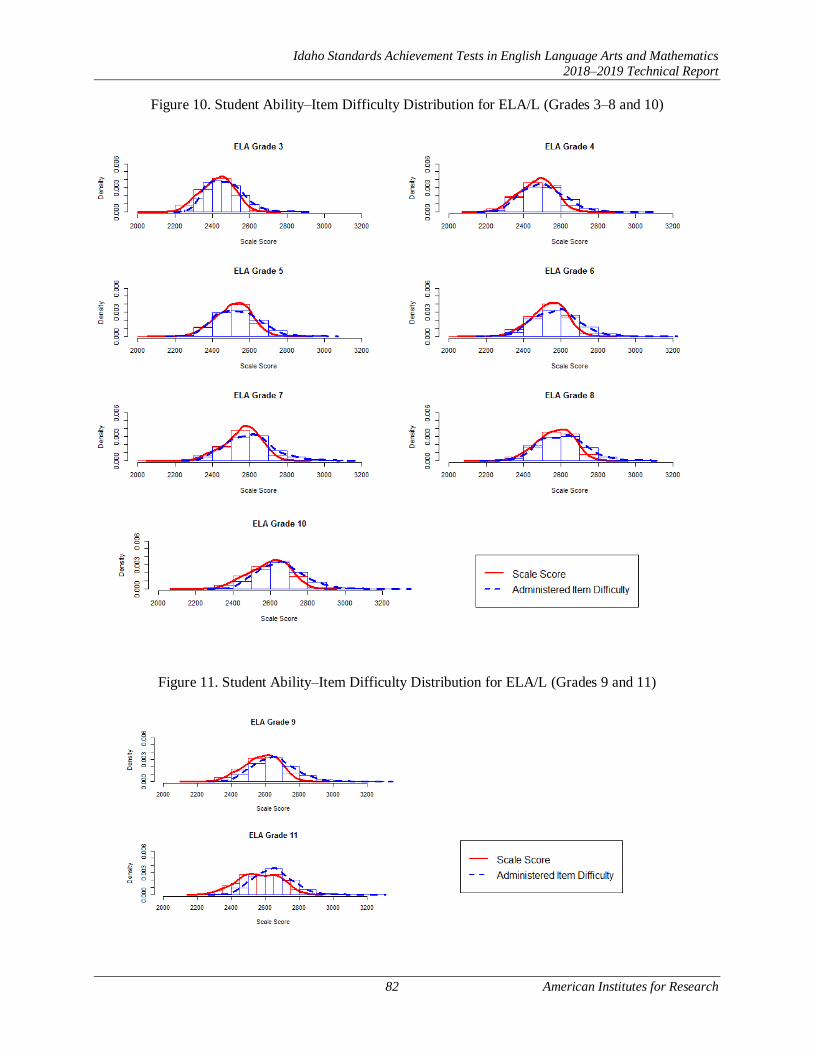
Idaho Standards Achievement Tests in English Language Arts and Mathematics
2018–2019 Technical Report
82 American Institutes for Research
Figure 10. Student Ability–Item Difficulty Distribution for ELA/L (Grades 3–8 and 10)
Figure 11. Student Ability–Item Difficulty Distribution for ELA/L (Grades 9 and 11)

Idaho Standards Achievement Tests in English Language Arts and Mathematics
2018–2019 Technical Report
83 American Institutes for Research
Figure 12. Student Ability–Item Difficulty Distribution by Claim: ELA/L (Grades 3–5)
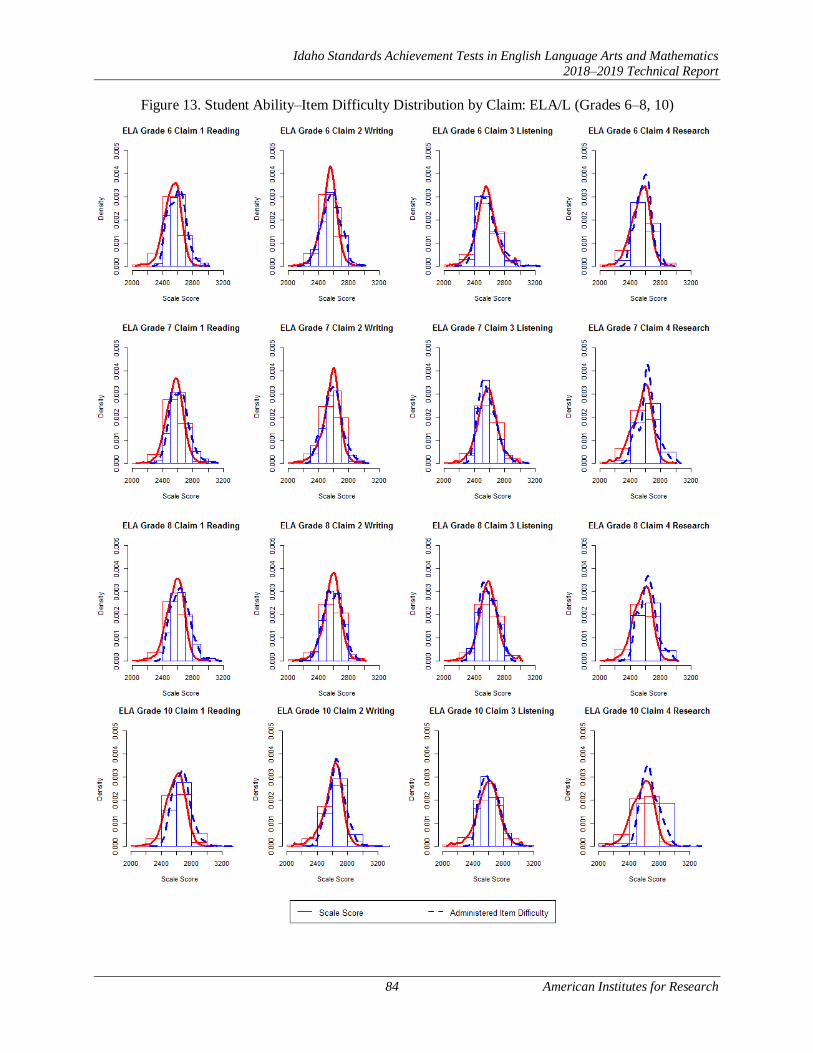
Idaho Standards Achievement Tests in English Language Arts and Mathematics
2018–2019 Technical Report
84 American Institutes for Research
Figure 13. Student Ability–Item Difficulty Distribution by Claim: ELA/L (Grades 6–8, 10)

Idaho Standards Achievement Tests in English Language Arts and Mathematics
2018–2019 Technical Report
85 American Institutes for Research
Figure 14. Student Ability–Item Difficulty Distribution by Claim: ELA/L (Grades 9 and 11)

Idaho Standards Achievement Tests in English Language Arts and Mathematics
2018–2019 Technical Report
86 American Institutes for Research
Figure 15. Student Ability–Item Difficulty Distribution for Mathematics (Grades 3–8 and 10)
Figure 16. Student Ability–Item Difficulty Distribution for Mathematics (Grades 9 and 11)
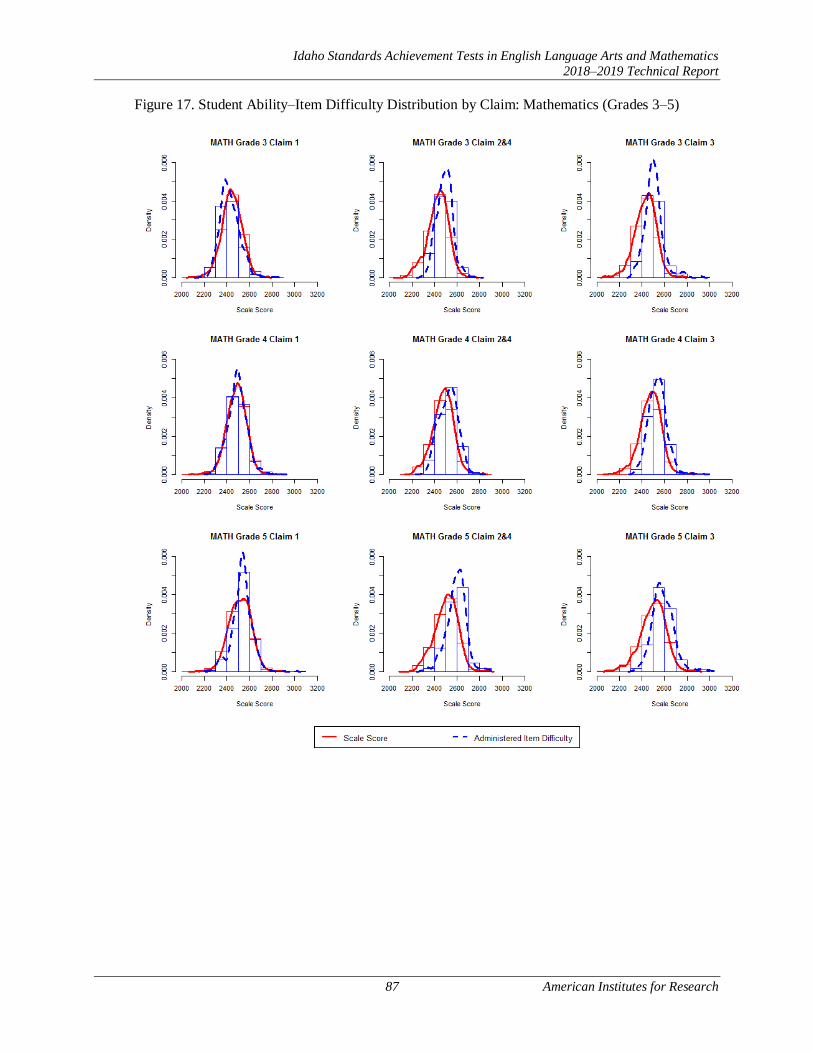
Idaho Standards Achievement Tests in English Language Arts and Mathematics
2018–2019 Technical Report
87 American Institutes for Research
Figure 17. Student Ability–Item Difficulty Distribution by Claim: Mathematics (Grades 3–5)

Idaho Standards Achievement Tests in English Language Arts and Mathematics
2018–2019 Technical Report
88 American Institutes for Research
Figure 18. Student Ability–Item Difficulty Distribution by Claim: Mathematics (Grades 6–8, 10)
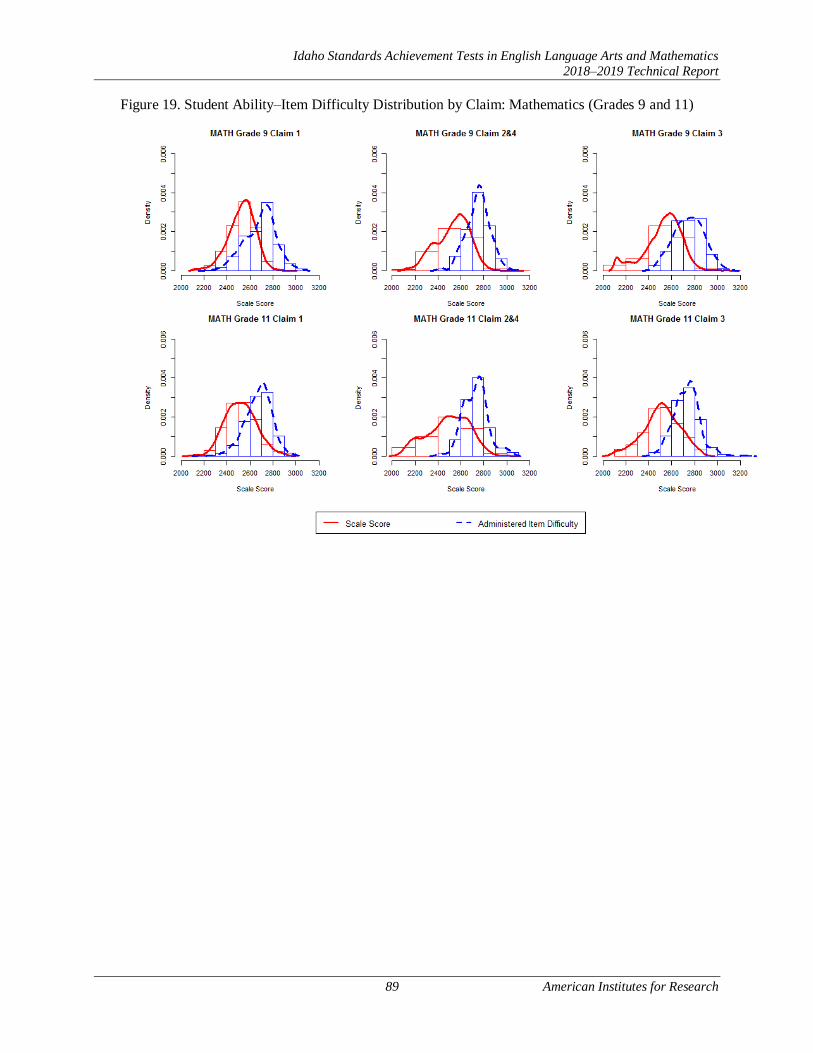
Idaho Standards Achievement Tests in English Language Arts and Mathematics
2018–2019 Technical Report
89 American Institutes for Research
Figure 19. Student Ability–Item Difficulty Distribution by Claim: Mathematics (Grades 9 and 11)
Idaho Standards Achievement Tests in English Language Arts and Mathematics
2018–2019 Technical Report
90 American Institutes for Research
5. VALIDITY
According to the Standards for Educational and Psychological Testing (AERA, APA, & NCME, 2014),
validity refers to the degree to which evidence and theory support the interpretations of test scores as
described by the intended uses of assessments. The validity of an intended interpretation of test scores relies
on all the evidence accrued about the technical quality of a testing system, including test development and
construction procedures, test score reliability, accurate scaling and equating, procedures for setting
meaningful achievement standards, standardized test administration and scoring procedures, and attention
to fairness for all test takers. The appropriateness and usefulness of the Smarter Balanced summative
assessments depends on the assessments meeting the relevant standards of validity.
Validity evidence provided in this chapter is as follows:
• Test Content
• Internal Structure
Evidence on test content validity is provided with the blueprint match rates for the delivered tests. Evidence
on internal structure is examined in the results of intercorrelations among claim scores.
Some of the evidence on standardized test administration, scoring procedures, and attention to fairness for
all test takers is provided in other chapters.
5.1 EVIDENCE ON TEST CONTENT
The Smarter Balanced summative assessment includes two components: the computer-adaptive test (CAT)
and the performance task (PT). For the CAT, each student receives a different set of items adapted to his or
her ability. For PT, each student is administered a fixed-form test. The content coverage in all PT forms is
the same.
In the adaptive item-selection algorithm, item selection takes place in two discrete stages: blueprint
satisfaction and match-to-ability. The Smarter Balanced blueprints specify a range of items to be
administered in each claim, content domain/standards, and targets. Moreover, blueprints constrain the DOK
and item and passage types. For DOK constraints, the Smarter Balanced blueprint specifies the minimum
number of items, not the maximum. In blueprints, all content blueprint elements are configured to obtain a
strictly enforced range of items administered. The algorithm also seeks to satisfy target-level constraints,
but these ranges are not strictly enforced. In ELA/L, the blueprints also specify the number of passages in
reading (claim 1) and listening (claim 3) claims.
Tables 55–57 present the percentages of tests aligned with the ELA/L test blueprint constraints for items in
claims, targets and DOK, and passages in claims 1 and 3. For the passage constraints, four passages in claim
1 reading and three to four passages in claim 3 listening are required. The composition of four reading
passages in claim 1 is two literary-text passages (one long and one short passage) and two informational-
text passages (one long and one short passage) in grades 3–5 and one literary-text passage (long passage)
and three information-text passages (one long and two short passages) in grades 6–11.
All tests met the blueprint requirements, except for claims 1 and 2 targets, which administered a few items
more or less than the item requirement. The violations in claim 1 reading targets appeared in all grades due
to the uneven distribution of items across targets and DOKs within and across passages. The violations in

Idaho Standards Achievement Tests in English Language Arts and Mathematics
2018–2019 Technical Report
91 American Institutes for Research
claim 2 writing targets appeared in grade 6 only due to the uneven distribution of items across targets and
DOKs.
Tables 58–60 provide the percentages of tests aligned with the test blueprint constraints for the mathematics
CAT for claims, DOK, and target constraints. In mathematics, the tests met all blueprint requirements.
Table 55. Percentage of ELA/L Delivered Tests Meeting Blueprint Requirements
for Each Claim and the Number of Passages Administered (Grades 3–5)
Claim Content Category/Target
Required
Items
in G3–5
%BP Match for
Item Requirements
%BP Match
for Passage
Requirement
G3 G4 G5 G3–5
1 Literary Text 7–8 100 100 100 100
Target 2: Central Ideas 1–2 100 100 100
Target 4: Reasoning and Evaluation 1–2 100 100 100
Targets 1, 3, 5, 6, & 7 3–6 100 100 100
Informational Text 7–8 100 100 100 100
Target 9: Central Ideas 1–2 83 98 99
Target 11: Reasoning and Evaluation 1–2 100 100 100
Targets 8, 10, 12, 13, & 14 3–6 100 100 100
DOK 2 ≥ 7 100 100 100
DOK 3 or 4 ≥ 2 100 100 100
2 Writing 6 100 100 100
Target 1, 3, or 6: Organization/Purpose 1 100 100 100
Target 1, 3, or 6: Evidence/Elaboration 1 100 100 100
Target 8: Language and Vocabulary Use 1 100 100 100
Target 9: Edit/Clarify 3 100 100 100
DOK 2 or higher ≥ 2 100 100 100
3 Listening 8–9 100 100 100 100
Target 4: Listen/Interpret 8–9 100 100 100
DOK 2 or higher ≥ 3 100 100 100
4 Research 8 100 100 100
Target 2: Interpret and Integrate
Information 2–3 100 100 100
Target 3: Analyze Information/Sources 2–3 100 100 100
Target 4: Use Evidence 2–3 100 100 100
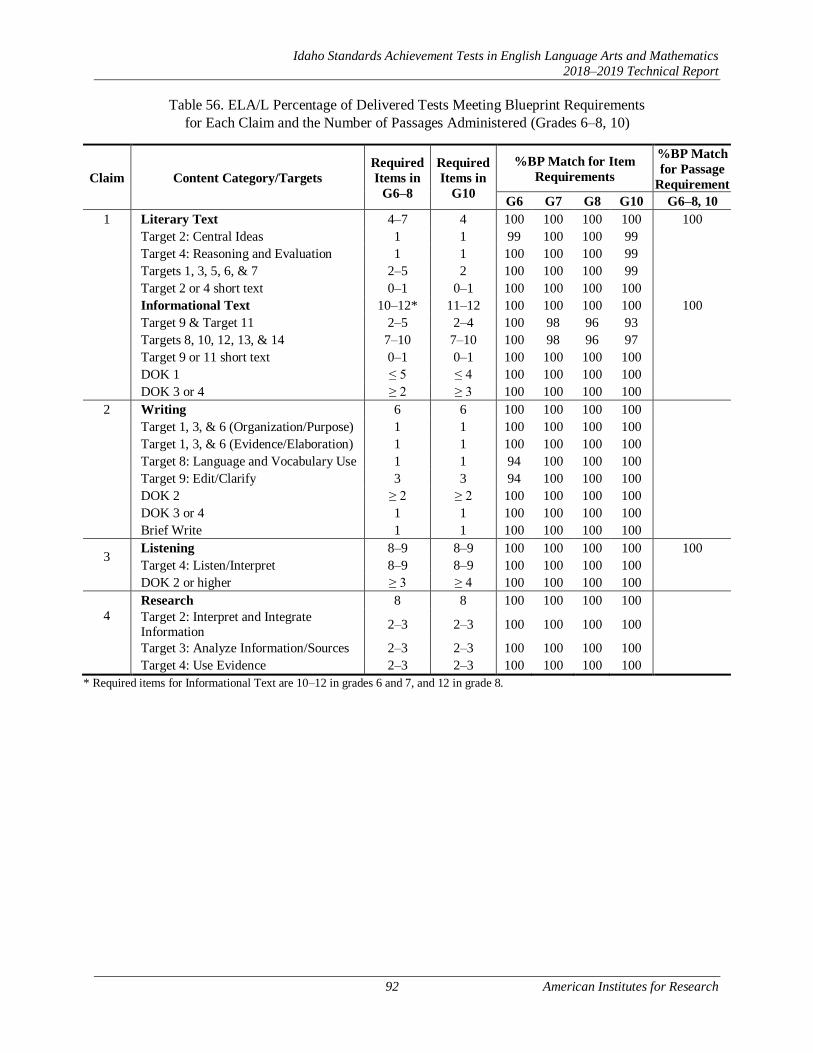
Idaho Standards Achievement Tests in English Language Arts and Mathematics
2018–2019 Technical Report
92 American Institutes for Research
Table 56. ELA/L Percentage of Delivered Tests Meeting Blueprint Requirements
for Each Claim and the Number of Passages Administered (Grades 6–8, 10)
Claim Content Category/Targets
Required
Items in
G6–8
Required
Items in
G10
%BP Match for Item
Requirements
%BP Match
for Passage
Requirement
G6 G7 G8 G10 G6–8, 10
1 Literary Text 4–7 4 100 100 100 100 100
Target 2: Central Ideas 1 1 99 100 100 99
Target 4: Reasoning and Evaluation 1 1 100 100 100 99
Targets 1, 3, 5, 6, & 7 2–5 2 100 100 100 99
Target 2 or 4 short text 0–1 0–1 100 100 100 100
Informational Text 10–12* 11–12 100 100 100 100 100
Target 9 & Target 11 2–5 2–4 100 98 96 93
Targets 8, 10, 12, 13, & 14 7–10 7–10 100 98 96 97
Target 9 or 11 short text 0–1 0–1 100 100 100 100
DOK 1 ≤ 5 ≤ 4 100 100 100 100
DOK 3 or 4 ≥ 2 ≥ 3 100 100 100 100
2 Writing 6 6 100 100 100 100
Target 1, 3, & 6 (Organization/Purpose) 1 1 100 100 100 100
Target 1, 3, & 6 (Evidence/Elaboration) 1 1 100 100 100 100
Target 8: Language and Vocabulary Use 1 1 94 100 100 100
Target 9: Edit/Clarify 3 3 94 100 100 100
DOK 2 ≥ 2 ≥ 2 100 100 100 100
DOK 3 or 4 1 1 100 100 100 100
Brief Write 1 1 100 100 100 100
3 Listening 8–9 8–9 100 100 100 100 100
Target 4: Listen/Interpret 8–9 8–9 100 100 100 100
DOK 2 or higher ≥ 3 ≥ 4 100 100 100 100
4
Research 8 8 100 100 100 100
Target 2: Interpret and Integrate Information
2–3 2–3 100 100 100 100
Target 3: Analyze Information/Sources 2–3 2–3 100 100 100 100
Target 4: Use Evidence 2–3 2–3 100 100 100 100
* Required items for Informational Text are 10–12 in grades 6 and 7, and 12 in grade 8.
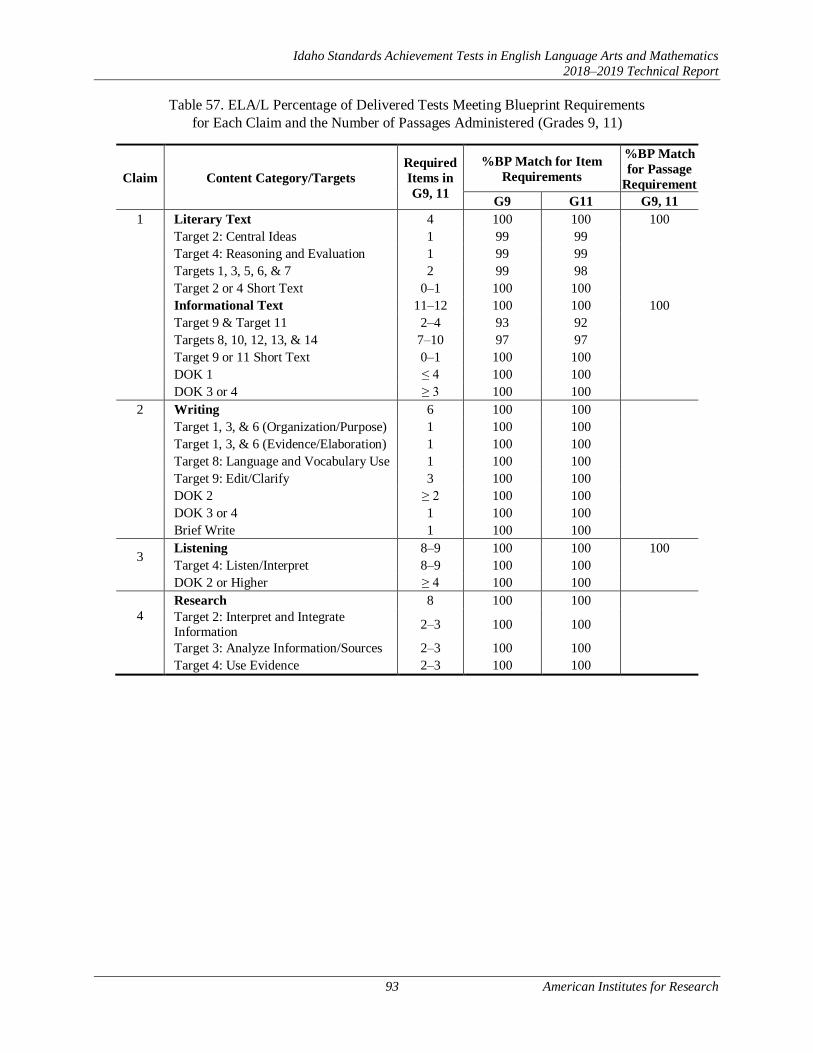
Idaho Standards Achievement Tests in English Language Arts and Mathematics
2018–2019 Technical Report
93 American Institutes for Research
Table 57. ELA/L Percentage of Delivered Tests Meeting Blueprint Requirements
for Each Claim and the Number of Passages Administered (Grades 9, 11)
Claim Content Category/Targets
Required
Items in
G9, 11
%BP Match for Item
Requirements
%BP Match
for Passage
Requirement
G9 G11 G9, 11
1 Literary Text 4 100 100 100
Target 2: Central Ideas 1 99 99
Target 4: Reasoning and Evaluation 1 99 99
Targets 1, 3, 5, 6, & 7 2 99 98
Target 2 or 4 Short Text 0–1 100 100
Informational Text 11–12 100 100 100
Target 9 & Target 11 2–4 93 92
Targets 8, 10, 12, 13, & 14 7–10 97 97
Target 9 or 11 Short Text 0–1 100 100
DOK 1 ≤ 4 100 100
DOK 3 or 4 ≥ 3 100 100
2 Writing 6 100 100
Target 1, 3, & 6 (Organization/Purpose) 1 100 100
Target 1, 3, & 6 (Evidence/Elaboration) 1 100 100
Target 8: Language and Vocabulary Use 1 100 100
Target 9: Edit/Clarify 3 100 100
DOK 2 ≥ 2 100 100
DOK 3 or 4 1 100 100
Brief Write 1 100 100
3 Listening 8–9 100 100 100
Target 4: Listen/Interpret 8–9 100 100
DOK 2 or Higher ≥ 4 100 100
4
Research 8 100 100
Target 2: Interpret and Integrate Information
2–3 100 100
Target 3: Analyze Information/Sources 2–3 100 100
Target 4: Use Evidence 2–3 100 100

Idaho Standards Achievement Tests in English Language Arts and Mathematics
2018–2019 Technical Report
94 American Institutes for Research
Table 58. Mathematics Percentage of Delivered Tests Meeting Blueprint Requirements
for Claims and Targets (Grades 3–5)
Claim Content Domain
G3 G4 G5
Required
Items
%BP
Match
Required
Items
%BP
Match
Required
Items
%BP
Match
1 Overall 17–20 100 17–20 100 17–20 100
DOK 2 or higher ≥ 7 100 ≥ 7 100 ≥ 7 100 Priority Cluster 13–15 100
Targets B, C, G, I 5–6 100
Targets D, F 5–6 100
Target A 2–3 100
Supporting Cluster 4–5 100
Targets E. J, K 3–4 100
Target H 1 100
Priority Cluster 13–15 100
Targets A, E, F 8–9 100
Target G 2–3 100
Target D 1–2 100
Target H 1 100
Supporting Cluster 4–5 100
Targets I, K 2–3 100
Targets B, C, J 1 100
Target L 1 100
Priority Cluster 13–15 100
Targets E, I 5–6 100
Target F 4–5 100
Targets C, D 3–4 100
Supporting Cluster 4–5 100
Targets J, K 2–3 100
Targets A, B, G, H 2 100
2&4 Overall 6 100 6 100 6 100 DOK 3 or Higher ≥ 2 100 ≥ 2 100 ≥ 2 100
2. Target A 2 100 2 100 2 100
2. Targets B, C, D 1 100 1 100 1 100
4. Targets A, D 1 100 1 100 1 100 4. Targets B, E 1 100 1 100 1 100 4. Targets C, F 1 100 1 100 1 100
3 Overall 8 100 8 100 8 100
DOK 3 or Higher ≥ 2 100 ≥ 2 100 ≥ 2 100
Targets A, D 3 100 3 100 3 100
Targets B, E 3 100 3 100 3 100
Targets C, F 2 100 2 100 2 100
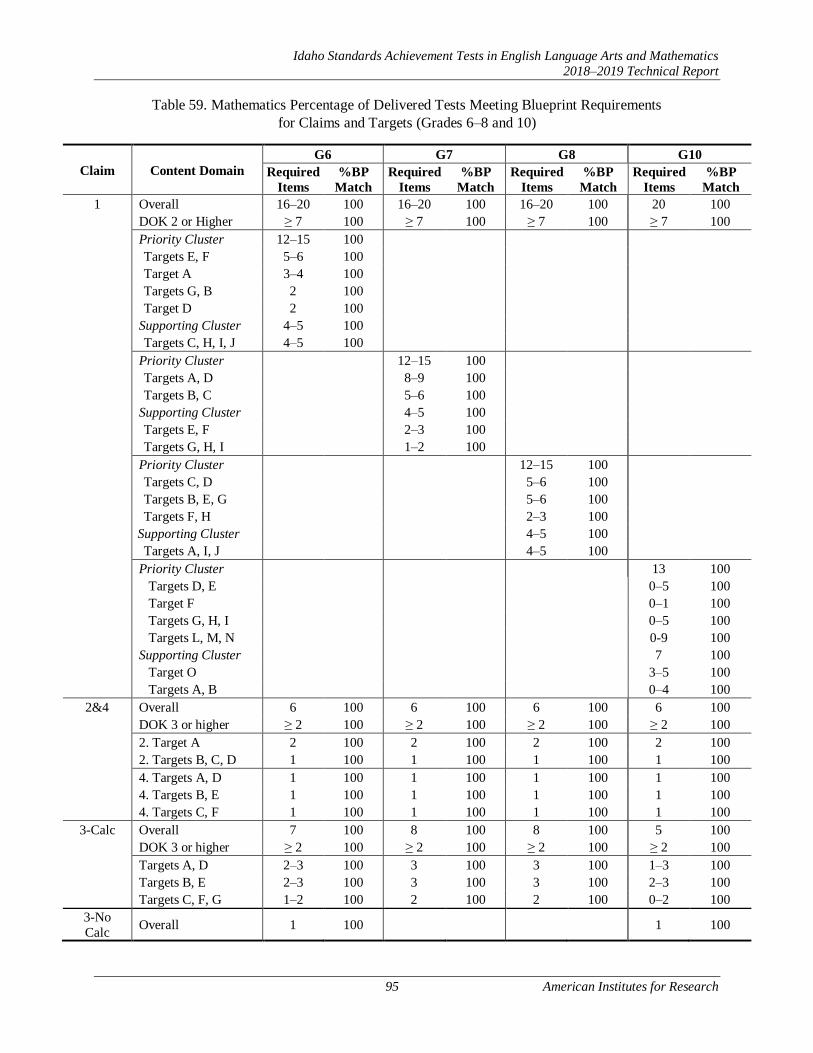
Idaho Standards Achievement Tests in English Language Arts and Mathematics
2018–2019 Technical Report
95 American Institutes for Research
Table 59. Mathematics Percentage of Delivered Tests Meeting Blueprint Requirements
for Claims and Targets (Grades 6–8 and 10)
Claim Content Domain
G6 G7 G8 G10
Required
Items
%BP
Match
Required
Items
%BP
Match
Required
Items
%BP
Match
Required
Items
%BP
Match
1 Overall 16–20 100 16–20 100 16–20 100 20 100
DOK 2 or Higher ≥ 7 100 ≥ 7 100 ≥ 7 100 ≥ 7 100 Priority Cluster 12–15 100
Targets E, F 5–6 100
Target A 3–4 100
Targets G, B 2 100
Target D 2 100
Supporting Cluster 4–5 100
Targets C, H, I, J 4–5 100
Priority Cluster 12–15 100
Targets A, D 8–9 100
Targets B, C 5–6 100
Supporting Cluster 4–5 100
Targets E, F 2–3 100
Targets G, H, I 1–2 100
Priority Cluster 12–15 100
Targets C, D 5–6 100
Targets B, E, G 5–6 100
Targets F, H 2–3 100
Supporting Cluster 4–5 100
Targets A, I, J 4–5 100
Priority Cluster 13 100
Targets D, E 0–5 100
Target F 0–1 100
Targets G, H, I 0–5 100
Targets L, M, N 0-9 100
Supporting Cluster 7 100
Target O 3–5 100
Targets A, B 0–4 100
2&4 Overall 6 100 6 100 6 100 6 100 DOK 3 or higher ≥ 2 100 ≥ 2 100 ≥ 2 100 ≥ 2 100
2. Target A 2 100 2 100 2 100 2 100
2. Targets B, C, D 1 100 1 100 1 100 1 100
4. Targets A, D 1 100 1 100 1 100 1 100
4. Targets B, E 1 100 1 100 1 100 1 100
4. Targets C, F 1 100 1 100 1 100 1 100
3-Calc Overall 7 100 8 100 8 100 5 100
DOK 3 or higher ≥ 2 100 ≥ 2 100 ≥ 2 100 ≥ 2 100
Targets A, D 2–3 100 3 100 3 100 1–3 100
Targets B, E 2–3 100 3 100 3 100 2–3 100
Targets C, F, G 1–2 100 2 100 2 100 0–2 100
3-No
Calc Overall 1 100 1 100

Idaho Standards Achievement Tests in English Language Arts and Mathematics
2018–2019 Technical Report
96 American Institutes for Research
Table 60. Mathematics Percentage of Delivered Tests Meeting Blueprint Requirements
for Claims and Targets (Grades 9 and 11)
Claim Content Domain
Grade 9 Grade 11
Required
Items
%BP
Match
Required
Items
%BP
Match
1 Overall 20 100 19–22 100
DOK 2 or higher ≥ 7 100 ≥ 7 100 Priority Cluster 15 100 14–16 100
Targets D, E 2 100
Target F 1 100
Targets G, H, I 0–8 100 4–5 100
Target J 0–8 100 2 100
Target K 0–8 100 2 100
Targets L, M, N 0–8 100 3–4 100 Supporting Cluster 5 100 5–6 100
Target O 2 100
Target P 0–3 100 1–2 100
Targets A, B 1 99
Target C 0–3 100 1 100
2&4 Overall 6 100 6 100 DOK 3 or higher ≥ 2 100 ≥ 2 100
2. Target A 2 100 2 100
2. Targets B, C, D 1 100 1 100
4. Targets A, D 1 100 1 100
4. Targets B, E 1 100 1 100 4. Targets C, F 1 100 1 100
3-Calc Overall 8 100 7 100
DOK 3 or higher ≥ 2 100 ≥ 2 100 Targets A, D 2–3 100 2–3 100 Targets B, E 3 100 2–3 100
Targets C, F, G 1–2 100 1–2 100
3-No Calc Overall 1 100
Tables 61 and 62 summarizes the target coverage by claim that includes the average and range of the number
of unique targets administered in each delivered test. Since the test blueprint is not required to cover all
targets in each test, it is expected that the number of targets covered varies across tests. Although the target
coverage varies somewhat across individual tests, all targets are covered at an aggregate level across all
tests combined.

Idaho Standards Achievement Tests in English Language Arts and Mathematics
2018–2019 Technical Report
97 American Institutes for Research
Table 61. Average and Range of the Number of Unique Targets Assessed
Within Each Claim Across All Delivered Tests (Grades 3–8 and 10)
Grade Total Targets in BP Mean Range (Minimum – Maximum)
C1 C2 C3 C4 C1 C2 C3 C4 C1 C2 C3 C4
ELA/L
3 14 5 1 3 10.1 4 1 3 8-13 4-4 1-1 3-3
4 14 5 1 3 10.7 4 1 3 8-14 4-4 1-1 3-3
5 14 5 1 3 11.4 4 1 3 9-14 4-4 1-1 3-3
6 14 5 1 3 10.3 4 1 3 8-11 4-5 1-1 3-3
7 14 5 1 3 10.7 4 1 3 8-11 4-4 1-1 3-3
8 14 5 1 3 10.9 4 1 3 8-11 4-4 1-1 3-3
10 14 5 1 3 10.0 4 1 3 6-11 4-4 1-1 3-3
Mathematics
3 11 4 6 6 10.9 2 5.7 3 9-11 2-2 4-6 3-3
4 12 4 6 6 10.0 2 5.4 3 9-10 2-2 3-6 3-3
5 11 4 6 6 9.0 2 5.2 3.0 9-9 2-2 3-6 3-4
6 10 4 7 6 10.0 2 4.6 3 8-10 2-2 3-7 3-3
7 9 4 7 6 8.0 2 4.6 3 8-8 2-2 3-6 3-3
8 10 4 7 6 10.0 2 4.8 3.0 10-10 1-2 3-6 2-4
10 11 4 7 6 7.9 2 3.9 3.0 6-9 2-2 2-6 2-3
Table 62. Average and Range of the Number of Unique Targets Assessed
Within Each Claim Across All Delivered Tests (Grades 9 and 11)
Grade Total Targets in BP Mean Range (Minimum – Maximum)
C1 C2 C3 C4 C1 C2 C3 C4 C1 C2 C3 C4
ELA/L
9 14 5 1 3 10.0 4 1 3 6-11 4-4 1-1 3-3
11 14 5 1 3 10.0 4 1 3 8-11 4-4 1-1 3-3
Mathematics
9 9 4 7 6 9.0 2 5.5 3 7-9 2-2 3-6 3-3
11 16 4 7 6 14.9 2 5.1 3 14-16 2-2 3-7 3-3
An adaptive testing algorithm constructs a test form unique to each student, targeting the student’s level of
ability and meeting the test blueprints. Consequently, the test forms will not be statistically parallel (e.g.,
equal test difficulty). However, scores from the test should be comparable, and each test form should
measure the same content, albeit with a different set of test items, ensuring the comparability of assessments
in content and scores. The blueprint match and target coverage results demonstrate that test forms conform
to the same content as specified, thus providing evidence of content comparability. In other words, while
each form is unique with respect to its items, all forms align with the same curricular expectations set forth
in the test blueprints.
5.2 EVIDENCE ON INTERNAL STRUCTURE
The measurement and reporting model used in the Smarter Balanced assessments assumes a single
underlying latent trait (ability), with achievement reported as a total score as well as scores for each claim
measured. The evidence on the internal structure is examined based on the correlations among claim scores.
Idaho Standards Achievement Tests in English Language Arts and Mathematics
2018–2019 Technical Report
98 American Institutes for Research
The correlations among claim scores, both observed (below diagonal) and corrected for attenuation (above
diagonal), are presented in Tables 63–66. The correction for attenuation indicates what the correlation
would be if claim scores could be measured with perfect reliability, corrected (adjusted) for measurement
error estimates.
The observed correlation between two claim scores with measurement errors can be corrected for
attenuation 𝑟𝑥′𝑦′ =𝑟𝑥𝑦
√𝑟𝑥𝑥×𝑟𝑦𝑦, where 𝑟𝑥′𝑦′ is the correlation between x and y corrected for attenuation, 𝑟𝑥𝑦 is
the observed correlation between x and y, 𝑟𝑥𝑥 is the reliability coefficient for x, and 𝑟𝑦𝑦 is the reliability
coefficient for y.
When corrected for attenuation (above diagonal), the correlations among claim scores are higher than
observed correlations. The disattenuated correlations are quite high, especially in mathematics. The
correction for attenuation is large in mathematics, because the marginal reliabilities of claim 2 and 4 and
claim 3 scores are low. The low reliabilities are due to large standard errors among lower scores due to a
shortage of easy items in the item pool.
Because the reliability for claim scores are low, the performance of all the claim scores is reported in three
performance categories. The distribution of performance categories for each claim is provided in Tables
47–50, Section 4.2. Scale scores are not reported for claims.
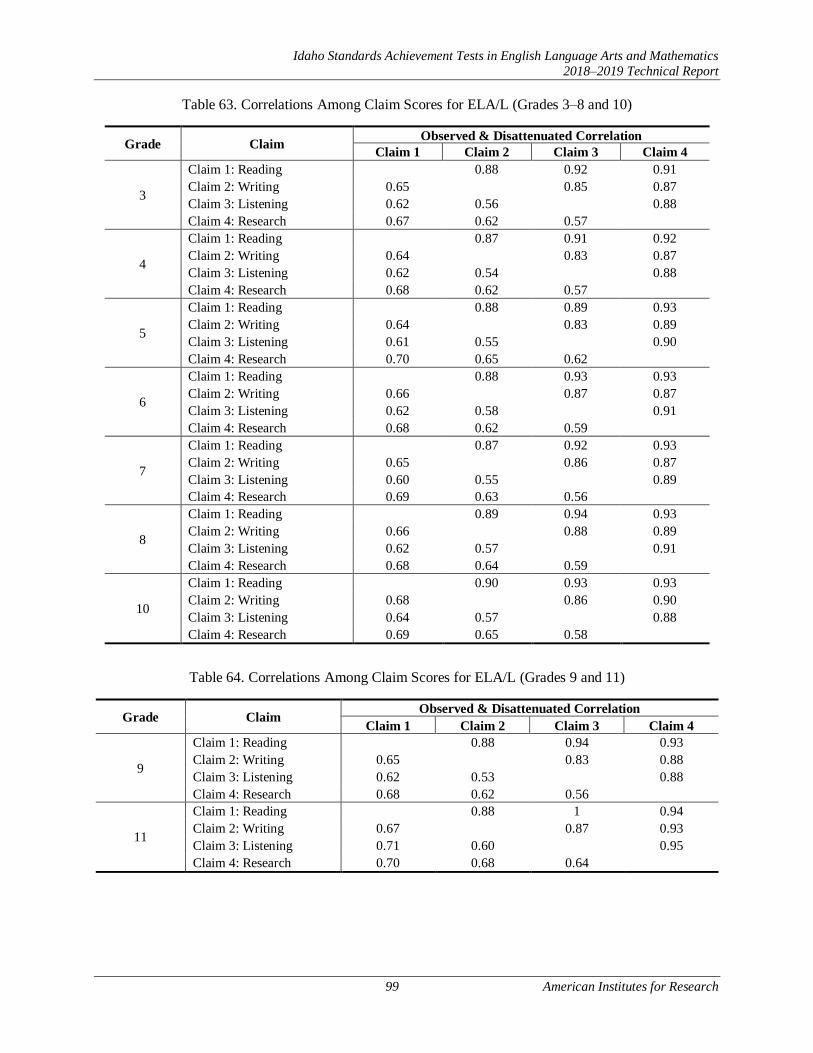
Idaho Standards Achievement Tests in English Language Arts and Mathematics
2018–2019 Technical Report
99 American Institutes for Research
Table 63. Correlations Among Claim Scores for ELA/L (Grades 3–8 and 10)
Grade Claim Observed & Disattenuated Correlation
Claim 1 Claim 2 Claim 3 Claim 4
3
Claim 1: Reading 0.88 0.92 0.91
Claim 2: Writing 0.65 0.85 0.87
Claim 3: Listening 0.62 0.56 0.88
Claim 4: Research 0.67 0.62 0.57
4
Claim 1: Reading 0.87 0.91 0.92
Claim 2: Writing 0.64 0.83 0.87
Claim 3: Listening 0.62 0.54 0.88
Claim 4: Research 0.68 0.62 0.57
5
Claim 1: Reading 0.88 0.89 0.93
Claim 2: Writing 0.64 0.83 0.89
Claim 3: Listening 0.61 0.55 0.90
Claim 4: Research 0.70 0.65 0.62
6
Claim 1: Reading 0.88 0.93 0.93
Claim 2: Writing 0.66 0.87 0.87
Claim 3: Listening 0.62 0.58 0.91
Claim 4: Research 0.68 0.62 0.59
7
Claim 1: Reading 0.87 0.92 0.93
Claim 2: Writing 0.65 0.86 0.87
Claim 3: Listening 0.60 0.55 0.89
Claim 4: Research 0.69 0.63 0.56
8
Claim 1: Reading 0.89 0.94 0.93
Claim 2: Writing 0.66 0.88 0.89
Claim 3: Listening 0.62 0.57 0.91
Claim 4: Research 0.68 0.64 0.59
10
Claim 1: Reading 0.90 0.93 0.93
Claim 2: Writing 0.68 0.86 0.90
Claim 3: Listening 0.64 0.57 0.88
Claim 4: Research 0.69 0.65 0.58
Table 64. Correlations Among Claim Scores for ELA/L (Grades 9 and 11)
Grade Claim Observed & Disattenuated Correlation
Claim 1 Claim 2 Claim 3 Claim 4
9
Claim 1: Reading 0.88 0.94 0.93
Claim 2: Writing 0.65 0.83 0.88
Claim 3: Listening 0.62 0.53 0.88
Claim 4: Research 0.68 0.62 0.56
11
Claim 1: Reading 0.88 1 0.94
Claim 2: Writing 0.67 0.87 0.93
Claim 3: Listening 0.71 0.60 0.95
Claim 4: Research 0.70 0.68 0.64

Idaho Standards Achievement Tests in English Language Arts and Mathematics
2018–2019 Technical Report
100 American Institutes for Research
Table 65. Correlations Among Claim Scores for Mathematics (Grades 3–8 and 10)
Grade Claim Observed & Disattenuated Correlation
Claim 1 Claim 2&4 Claim 3
3
Claim 1 0.96 0.92
Claim 2 & 4 0.77 0.98
Claim 3 0.76 0.72
4
Claim 1 0.96 0.97
Claim 2 & 4 0.80 0.98
Claim 3 0.79 0.74
5
Claim 1 1 0.96
Claim 2 & 4 0.79 1
Claim 3 0.77 0.73
6
Claim 1 1 0.97
Claim 2 & 4 0.81 1
Claim 3 0.78 0.75
7
Claim 1 1 0.97
Claim 2 & 4 0.79 1
Claim 3 0.75 0.70
8
Claim 1 1 0.96
Claim 2 & 4 0.80 1
Claim 3 0.75 0.70
10
Claim 1 1 0.93
Claim 2 & 4 0.65 1
Claim 3 0.62 0.53
Legend: Claim 1: Concepts and Procedures; Claims 2 & 4: Problem Solving & Modeling and Data Analysis; Claim 3: Communicating Reasoning
Table 66. Correlations Among Claim Scores for Mathematics (Grades 9 and 11)
Grade Claim Observed & Disattenuated Correlation
Claim 1 Claim 2&4 Claim 3
9
Claim 1 1 0.90
Claim 2 & 4 0.70 1
Claim 3 0.59 0.56
11
Claim 1 1 1
Claim 2 & 4 0.76 1
Claim 3 0.71 0.64
Legend: Claim 1: Concepts and Procedures; Claims 2 & 4: Problem Solving & Modeling and Data Analysis; Claim 3: Communicating Reasoning
Idaho Standards Achievement Tests in English Language Arts and Mathematics
2018–2019 Technical Report
101 American Institutes for Research
6. RELIABILITY
Reliability refers to the consistency in test scores. Reliability is evaluated in terms of the Standard Error of
Measurement (SEM). In classical test theory, reliability is defined as the ratio of the true score variance to
the observed score variance, assuming the error variance is the same for all scores. Within the item response
theory (IRT) framework, measurement error varies conditioning on ability. The amount of precision in
estimating achievement can be determined by the test information, which describes the amount of
information provided by the test at each score point along the ability continuum. Test information is a value
that is the inverse of the measurement error of the test; the larger the measurement error, the less test
information is being provided. In computer-adaptive testing (CAT), because selected items vary among
students, the measurement error can vary for the same ability depending on the selected items for each
student.
The reliability evidence of the Smarter Balanced summative tests is provided with marginal reliability,
SEM, and classification accuracy and consistency in each achievement level.
6.1 MARGINAL RELIABILITY
For reliability, the marginal reliability was computed for the scale scores, taking into account the varying
measurement errors across the ability range. Marginal reliability is a measure of the overall reliability of an
assessment based on the average conditional SEM, estimated at different points on the ability scale, for all
students.
The marginal reliability (�̅�) is defined as
�̅� = [𝜎2 − (∑ 𝐶𝑆𝐸𝑀𝑖
2𝑁𝑖=1
𝑁)]/𝜎2,
where N is the number of students; 𝐶𝑆𝐸𝑀𝑖is the conditional standard error of measurement of the scale
score for student i; and 𝜎2is the variance of the scale score. The higher the reliability coefficient, the greater
the precision of the test.
Another way to examine test reliability is with the SEM. In IRT, SEM is estimated as a function of test
information provided by a given set of items that makes up the test. In CAT, items administered vary among
all students, so the SEM also can vary among students, which yields conditional SEM. The average
conditional SEM can be computed as
𝐴𝑣𝑒𝑟𝑎𝑔𝑒𝐶𝑆𝐸𝑀 = 𝜎√1 − �̄� = √∑ 𝐶𝑆𝐸𝑀𝑖2𝑁
𝑖=1 /𝑁.
The smaller the value of average conditional SEM, the greater the accuracy of test scores.
Tables 67 and 68 presents the marginal reliability coefficients and the average conditional SEM for the total
scale scores.

Idaho Standards Achievement Tests in English Language Arts and Mathematics
2018–2019 Technical Report
102 American Institutes for Research
Table 67. Marginal Reliability for ELA/L and Mathematics (Grades 3–8 and 10)
Grade N
Number of
Items Specified
in Test
Blueprint
Marginal
Reliability
Scale Score
Mean
Scale Score
SD
Average
CSEM
Min Max
ELA/L
3 22,722 38 41 0.92 2427.79 87.96 25.64
4 23,337 38 41 0.91 2471.34 93.64 27.56
5 24,315 38 41 0.92 2512.57 93.91 27.04
6 24,367 38 41 0.91 2535.88 93.56 27.50
7 23,835 38 41 0.91 2561.12 97.95 28.80
8 23,897 40 41 0.91 2570.21 96.96 28.88
10 22,305 39 41 0.91 2592.89 109.75 32.15
Mathematics
3 22,747 39 40 0.95 2438.41 81.70 19.12
4 23,356 37 40 0.94 2481.83 81.94 19.40
5 24,322 38 40 0.94 2510.79 91.43 22.50
6 24,368 38 39 0.94 2526.31 102.58 25.53
7 23,826 38 40 0.94 2547.24 107.40 27.13
8 23,892 38 40 0.93 2555.54 115.57 29.53
10 22,274 36 38 0.89 2561.64 121.61 40.25
Table 68. Marginal Reliability for ELA/L and Mathematics (Grades 9 and 11)
Grade N
Number of
Items Specified
in Test
Blueprint
Marginal
Reliability
Scale Score
Mean
Scale Score
SD
Average
CSEM
Min Max
ELA/L
9 6,495 39 41 0.91 2580.20 104.73 32.07
11 388 39 41 0.92 2563.96 122.27 34.98
Mathematics
9 6,515 38 39 0.88 2538.25 114.51 40.17
11 421 40 42 0.91 2522.32 127.98 38.45
6.2 STANDARD ERROR CURVES
Figures 20–23 present plots of the conditional SEM of scale scores across the range of ability. The vertical
lines indicate the cut scores for Level 2, Level 3, and Level 4. The item selection algorithm matched items
to each student’s ability and to the test blueprints with the same precision across the range of abilities.
Overall, the standard error curves suggest that students are measured with a high degree of precision, given
that the standard errors are consistently low. However, larger standard errors are observed at the lower ends
of the score distribution relative to the higher ends. This occurs because the item pools currently have a
shortage of easy items that are better targeted toward these lower-achieving students. Content experts use
this information to consider how to further target and populate item pools.
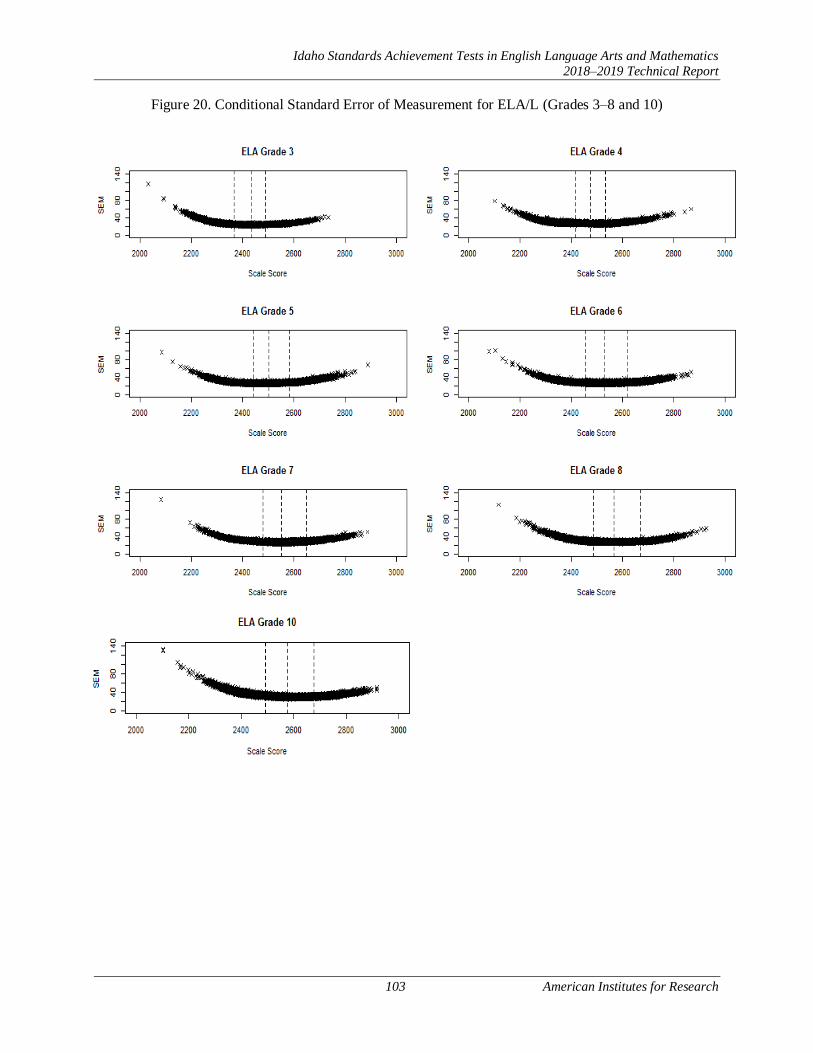
Idaho Standards Achievement Tests in English Language Arts and Mathematics
2018–2019 Technical Report
103 American Institutes for Research
Figure 20. Conditional Standard Error of Measurement for ELA/L (Grades 3–8 and 10)

Idaho Standards Achievement Tests in English Language Arts and Mathematics
2018–2019 Technical Report
104 American Institutes for Research
Figure 21. Conditional Standard Error of Measurement (Grades 9 and 11)
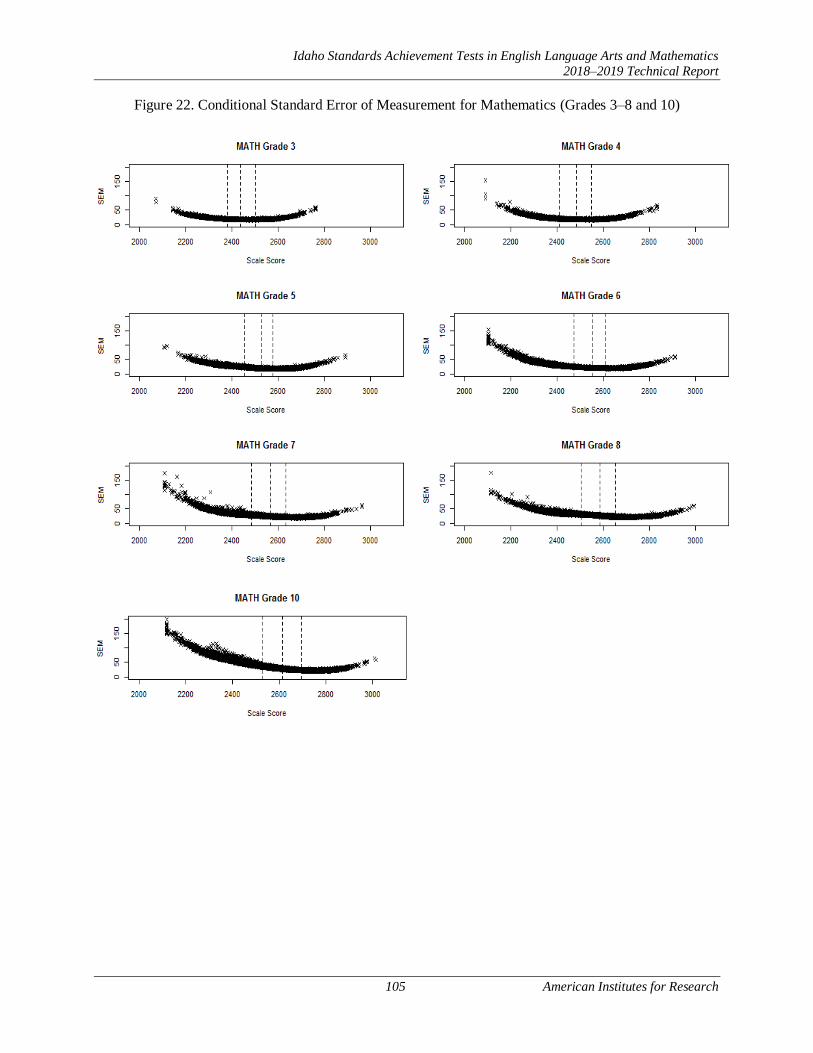
Idaho Standards Achievement Tests in English Language Arts and Mathematics
2018–2019 Technical Report
105 American Institutes for Research
Figure 22. Conditional Standard Error of Measurement for Mathematics (Grades 3–8 and 10)

Idaho Standards Achievement Tests in English Language Arts and Mathematics
2018–2019 Technical Report
106 American Institutes for Research
Figure 23. Conditional Standard Error of Measurement for Mathematics (Grades 9 and 11)

Idaho Standards Achievement Tests in English Language Arts and Mathematics
2018–2019 Technical Report
107 American Institutes for Research
The SEMs presented in Figures 20–23 are summarized in Tables 69–72. Tables 69 and 70 provides the
average conditional SEM for all scores and for scores in each achievement level. Tables 71 and 72 present
the average conditional SEMs at each cut score and the difference in average conditional SEMs between
two cut scores. As shown in Figures 20–23, the greatest average conditional SEM is in Level 1 in both
ELA/L and mathematics. Average conditional SEMs at all cut scores are similar in ELA/L, but larger in
Level 2 cut scores in mathematics.
Table 69. Average Conditional Standard Error of Measurement by Achievement Level (Grades 3–8, 10)
Grade Level 1 Level 2 Level 3 Level 4 Average
CSEM
ELA/L
3 29.11 24.10 23.67 25.28 25.64
4 29.01 26.57 26.07 28.09 27.56
5 27.58 24.89 25.71 29.82 27.04
6 29.92 25.81 26.34 29.06 27.50
7 31.29 26.97 27.36 31.04 28.80
8 32.35 27.38 27.22 30.36 28.88
10 38.17 30.32 29.56 32.17 32.15
Mathematics
3 22.62 18.23 17.22 18.41 19.12
4 24.02 18.43 17.24 18.81 19.40
5 28.41 21.15 18.52 19.12 22.50
6 33.87 22.55 20.46 21.11 25.53
7 36.02 25.47 22.01 21.18 27.13
8 36.38 28.94 24.15 22.16 29.53
10 53.37 32.57 25.55 22.89 40.25
Table 70. Average Conditional Standard Error of Measurement by Achievement Level (Grades 9 and 11)
Grade Level 1 Level 2 Level 3 Level 4 Average
CSEM
ELA/L
9 38.01 30.46 29.59 31.76 32.07
11 43.92 30.20 29.49 32.77 34.98
Mathematics
9 51.71 33.21 28.45 25.81 40.17
11 45.61 28.60 24.33 21.93 38.45
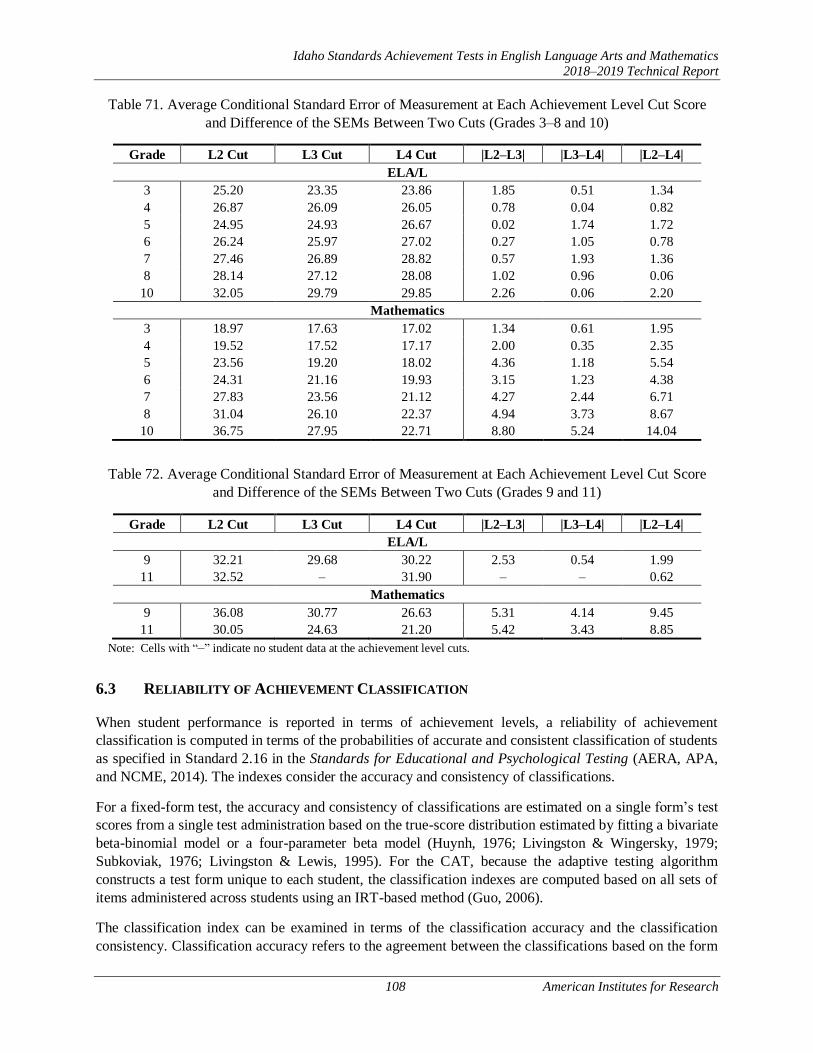
Idaho Standards Achievement Tests in English Language Arts and Mathematics
2018–2019 Technical Report
108 American Institutes for Research
Table 71. Average Conditional Standard Error of Measurement at Each Achievement Level Cut Score
and Difference of the SEMs Between Two Cuts (Grades 3–8 and 10)
Grade L2 Cut L3 Cut L4 Cut |L2–L3| |L3–L4| |L2–L4|
ELA/L
3 25.20 23.35 23.86 1.85 0.51 1.34
4 26.87 26.09 26.05 0.78 0.04 0.82
5 24.95 24.93 26.67 0.02 1.74 1.72
6 26.24 25.97 27.02 0.27 1.05 0.78
7 27.46 26.89 28.82 0.57 1.93 1.36
8 28.14 27.12 28.08 1.02 0.96 0.06
10 32.05 29.79 29.85 2.26 0.06 2.20
Mathematics
3 18.97 17.63 17.02 1.34 0.61 1.95
4 19.52 17.52 17.17 2.00 0.35 2.35
5 23.56 19.20 18.02 4.36 1.18 5.54
6 24.31 21.16 19.93 3.15 1.23 4.38
7 27.83 23.56 21.12 4.27 2.44 6.71
8 31.04 26.10 22.37 4.94 3.73 8.67
10 36.75 27.95 22.71 8.80 5.24 14.04
Table 72. Average Conditional Standard Error of Measurement at Each Achievement Level Cut Score
and Difference of the SEMs Between Two Cuts (Grades 9 and 11)
Grade L2 Cut L3 Cut L4 Cut |L2–L3| |L3–L4| |L2–L4|
ELA/L
9 32.21 29.68 30.22 2.53 0.54 1.99
11 32.52 – 31.90 – – 0.62
Mathematics
9 36.08 30.77 26.63 5.31 4.14 9.45
11 30.05 24.63 21.20 5.42 3.43 8.85
Note: Cells with “–” indicate no student data at the achievement level cuts.
6.3 RELIABILITY OF ACHIEVEMENT CLASSIFICATION
When student performance is reported in terms of achievement levels, a reliability of achievement
classification is computed in terms of the probabilities of accurate and consistent classification of students
as specified in Standard 2.16 in the Standards for Educational and Psychological Testing (AERA, APA,
and NCME, 2014). The indexes consider the accuracy and consistency of classifications.
For a fixed-form test, the accuracy and consistency of classifications are estimated on a single form’s test
scores from a single test administration based on the true-score distribution estimated by fitting a bivariate
beta-binomial model or a four-parameter beta model (Huynh, 1976; Livingston & Wingersky, 1979;
Subkoviak, 1976; Livingston & Lewis, 1995). For the CAT, because the adaptive testing algorithm
constructs a test form unique to each student, the classification indexes are computed based on all sets of
items administered across students using an IRT-based method (Guo, 2006).
The classification index can be examined in terms of the classification accuracy and the classification
consistency. Classification accuracy refers to the agreement between the classifications based on the form
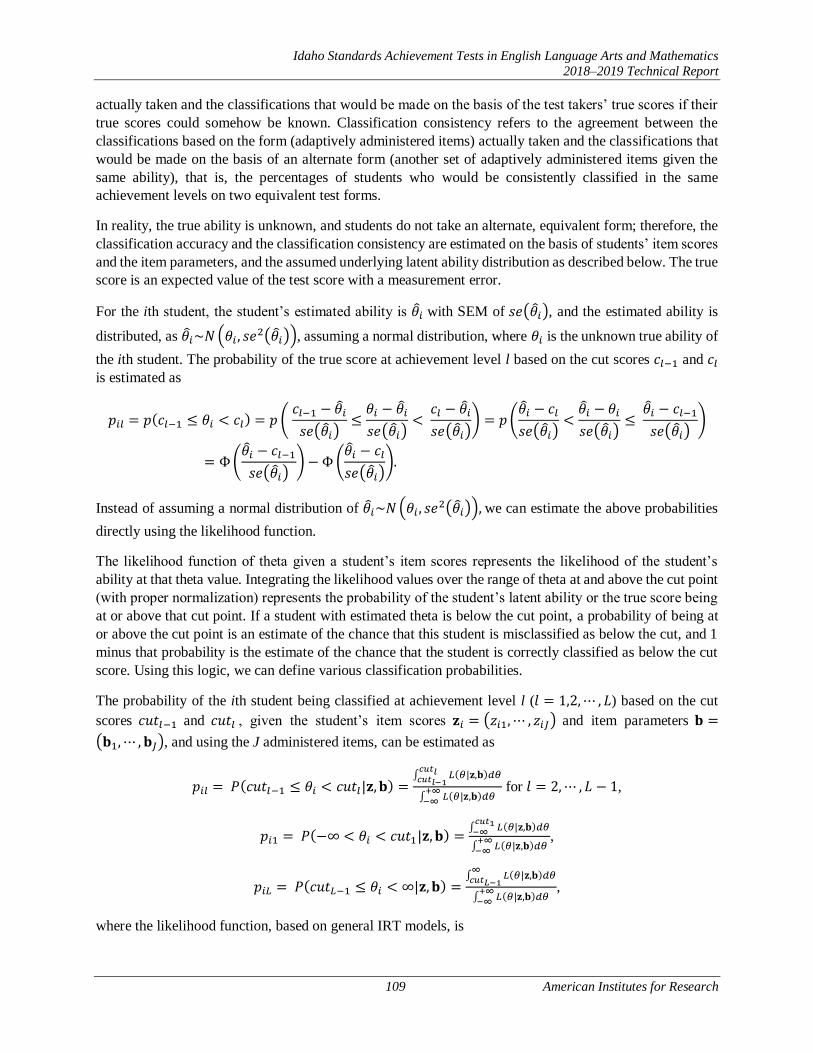
Idaho Standards Achievement Tests in English Language Arts and Mathematics
2018–2019 Technical Report
109 American Institutes for Research
actually taken and the classifications that would be made on the basis of the test takers’ true scores if their
true scores could somehow be known. Classification consistency refers to the agreement between the
classifications based on the form (adaptively administered items) actually taken and the classifications that
would be made on the basis of an alternate form (another set of adaptively administered items given the
same ability), that is, the percentages of students who would be consistently classified in the same
achievement levels on two equivalent test forms.
In reality, the true ability is unknown, and students do not take an alternate, equivalent form; therefore, the
classification accuracy and the classification consistency are estimated on the basis of students’ item scores
and the item parameters, and the assumed underlying latent ability distribution as described below. The true
score is an expected value of the test score with a measurement error.
For the ith student, the student’s estimated ability is 𝜃𝑖 with SEM of 𝑠𝑒(𝜃𝑖), and the estimated ability is
distributed, as 𝜃𝑖~𝑁(𝜃𝑖 , 𝑠𝑒2(𝜃𝑖)), assuming a normal distribution, where 𝜃𝑖 is the unknown true ability of
the ith student. The probability of the true score at achievement level l based on the cut scores 𝑐𝑙−1 and 𝑐𝑙 is estimated as
𝑝𝑖𝑙 = 𝑝(𝑐𝑙−1 ≤ 𝜃𝑖 < 𝑐𝑙) = 𝑝 ( 𝑐𝑙−1 − 𝜃𝑖
𝑠𝑒(𝜃𝑖)≤𝜃𝑖 − 𝜃𝑖
𝑠𝑒(𝜃𝑖)< 𝑐𝑙 − 𝜃𝑖
𝑠𝑒(𝜃𝑖)) = 𝑝(
𝜃𝑖 − 𝑐𝑙
𝑠𝑒(𝜃𝑖)<𝜃𝑖 − 𝜃𝑖
𝑠𝑒(𝜃𝑖)≤ 𝜃𝑖 − 𝑐𝑙−1
𝑠𝑒(𝜃𝑖))
= Φ(𝜃𝑖 − 𝑐𝑙−1
𝑠𝑒(𝜃𝑖)) −Φ(
𝜃𝑖 − 𝑐𝑙
𝑠𝑒(𝜃𝑖)).
Instead of assuming a normal distribution of 𝜃𝑖~𝑁(𝜃𝑖 , 𝑠𝑒2(𝜃𝑖)), we can estimate the above probabilities
directly using the likelihood function.
The likelihood function of theta given a student’s item scores represents the likelihood of the student’s
ability at that theta value. Integrating the likelihood values over the range of theta at and above the cut point
(with proper normalization) represents the probability of the student’s latent ability or the true score being
at or above that cut point. If a student with estimated theta is below the cut point, a probability of being at
or above the cut point is an estimate of the chance that this student is misclassified as below the cut, and 1
minus that probability is the estimate of the chance that the student is correctly classified as below the cut
score. Using this logic, we can define various classification probabilities.
The probability of the ith student being classified at achievement level l (𝑙 = 1,2,⋯ , 𝐿) based on the cut
scores 𝑐𝑢𝑡𝑙−1 and 𝑐𝑢𝑡𝑙 , given the student’s item scores 𝐳𝑖 = (𝑧𝑖1, ⋯ , 𝑧𝑖𝐽) and item parameters 𝐛 =
(𝐛1, ⋯ , 𝐛𝐽), and using the J administered items, can be estimated as
𝑝𝑖𝑙 = 𝑃(𝑐𝑢𝑡𝑙−1 ≤ 𝜃𝑖 < 𝑐𝑢𝑡𝑙|𝐳, 𝐛) =∫ 𝐿(𝜃|𝐳,𝐛)𝑑𝜃𝑐𝑢𝑡𝑙𝑐𝑢𝑡𝑙−1
∫ 𝐿(𝜃|𝐳,𝐛)𝑑𝜃+∞−∞
for 𝑙 = 2,⋯ , 𝐿 − 1,
𝑝𝑖1 = 𝑃(−∞ < 𝜃𝑖 < 𝑐𝑢𝑡1|𝐳, 𝐛) =∫ 𝐿(𝜃|𝐳,𝐛)𝑑𝜃𝑐𝑢𝑡1−∞
∫ 𝐿(𝜃|𝐳,𝐛)𝑑𝜃+∞−∞
,
𝑝𝑖𝐿 = 𝑃(𝑐𝑢𝑡𝐿−1 ≤ 𝜃𝑖 < ∞|𝐳,𝐛) =∫ 𝐿(𝜃|𝐳,𝐛)𝑑𝜃∞𝑐𝑢𝑡𝐿−1
∫ 𝐿(𝜃|𝐳,𝐛)𝑑𝜃+∞−∞
,
where the likelihood function, based on general IRT models, is

Idaho Standards Achievement Tests in English Language Arts and Mathematics
2018–2019 Technical Report
110 American Institutes for Research
𝐿(𝜃|𝐳𝑖 , 𝐛) = ∏ (𝑧𝑖𝑗𝑐𝑗 +(1−𝑐𝑗)𝐸𝑥𝑝(𝑧𝑖𝑗𝐷𝑎𝑗(𝜃−𝑏𝑗))
1+𝐸𝑥𝑝(𝐷𝑎𝑗(𝜃−𝑏𝑗)))𝑗∈d ∏ (
𝐸𝑥𝑝(𝐷𝑎𝑗(𝑧𝑖𝑗𝜃−∑ 𝑏𝑖𝑘𝑧𝑖𝑗𝑘=1
))
1+∑ 𝐸𝑥𝑝(𝐷𝑎𝑗(∑ (𝜃−𝑏𝑗𝑘)𝑚𝑘=1 ))
𝐾𝑗𝑚=1
)𝑗∈p ,
where d stands for dichotomous and p stands for polytomous items; 𝐛𝑗 = (𝑎𝑗, 𝑏𝑗, 𝑐𝑗) if the jth item is a
dichotomous item, and 𝐛𝑗 = (𝑎𝑗 , 𝑏𝑗1, … , 𝑏𝑗𝐾𝑖) if the jth item is a polytomous item; 𝑎𝑗 is the item’s
discrimination parameter (for Rasch model, 𝑎𝑗 = 1), 𝑐𝑗 is the guessing parameter (for Rasch and 2PL
models, 𝑐𝑗 = 0), and 𝐷 is 1.7 for non-Rasch models and 1 for Rasch model.
Classification Accuracy
Using 𝑝𝑖𝑙, we can construct a 𝐿 × 𝐿 table as
(
𝑛𝑎11 ⋯ 𝑛𝑎1𝐿⋮ ⋮ ⋮
𝑛𝑎𝐿1 ⋯ 𝑛𝑎𝐿𝐿),
where 𝑛𝑎𝑙𝑚 = ∑ 𝑝𝑖𝑚𝑝𝑙𝑖=𝑙 . 𝑛𝑎𝑙𝑚 is the expected number of students at achievement level lm, 𝑝𝑙𝑖 is the ith
student’s achievement level, and 𝑝𝑖𝑚 are the probabilities of the ith student being classified at achievement
level m. In the above table, the row represents the observed level and the column represents the expected
level.
The classification accuracy (CA) at level 𝑙 (𝑙 = 1,⋯ , 𝐿) is estimated by
𝐶𝐴𝑙 =𝑛𝑎𝑙𝑙
∑ 𝑛𝑎𝑙𝑚𝐿𝑚=1
,
and the overall classification accuracy is estimated by
𝐶𝐴 =∑ 𝑛𝑎𝑙𝑙𝐿𝑙=1
𝑁,
where 𝑁 is the total number of students.
Classification Consistency
Using 𝑝𝑖𝑙 , which is similar to accuracy, we can construct another 𝐿 × 𝐿 table by assuming the test is
administered twice independently to the same student group, hence we have
(
𝑛𝑐11 ⋯ 𝑛𝑐1𝐿⋮ ⋮ ⋮
𝑛𝑐𝐿1 ⋯ 𝑛𝑐𝐿𝐿),
where 𝑛𝑐𝑙𝑚 = ∑ 𝑝𝑖𝑙𝑝𝑖𝑚𝑁𝑖=1 . 𝑝𝑖𝑙 and 𝑝𝑖𝑚 are the probabilities of the ith student being classified at
achievement level l and m, respectively based on observed scores and hypothetical scores from equivalent
test form.
The classification consistency (CC) at level 𝑙 (𝑙 = 1,⋯ , 𝐿) is estimated by
𝐶𝐶𝑙 =𝑛𝑐𝑙𝑙
∑ 𝑛𝑐𝑙𝑚𝐿𝑚=1
,
and the overall classification consistency is
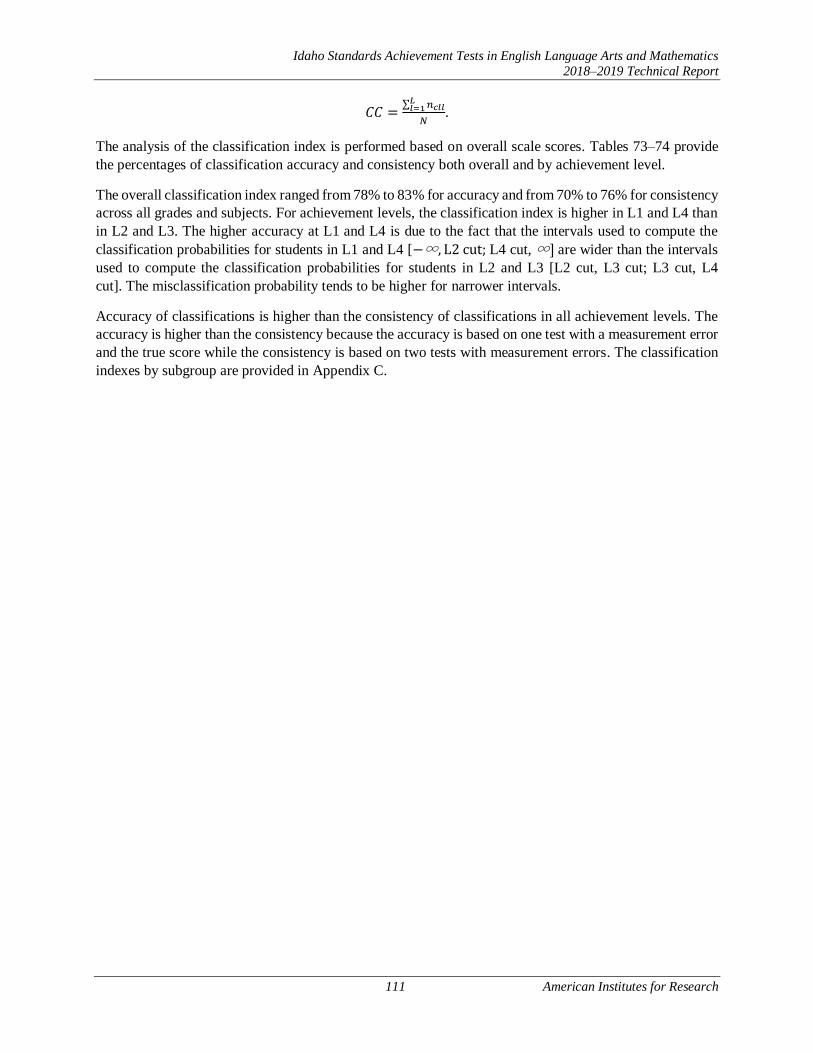
Idaho Standards Achievement Tests in English Language Arts and Mathematics
2018–2019 Technical Report
111 American Institutes for Research
𝐶𝐶 =∑ 𝑛𝑐𝑙𝑙𝐿𝑙=1
𝑁.
The analysis of the classification index is performed based on overall scale scores. Tables 73–74 provide
the percentages of classification accuracy and consistency both overall and by achievement level.
The overall classification index ranged from 78% to 83% for accuracy and from 70% to 76% for consistency
across all grades and subjects. For achievement levels, the classification index is higher in L1 and L4 than
in L2 and L3. The higher accuracy at L1 and L4 is due to the fact that the intervals used to compute the
classification probabilities for students in L1 and L4 [−∞, L2 cut; L4 cut, ∞] are wider than the intervals
used to compute the classification probabilities for students in L2 and L3 [L2 cut, L3 cut; L3 cut, L4
cut]. The misclassification probability tends to be higher for narrower intervals.
Accuracy of classifications is higher than the consistency of classifications in all achievement levels. The
accuracy is higher than the consistency because the accuracy is based on one test with a measurement error
and the true score while the consistency is based on two tests with measurement errors. The classification
indexes by subgroup are provided in Appendix C.
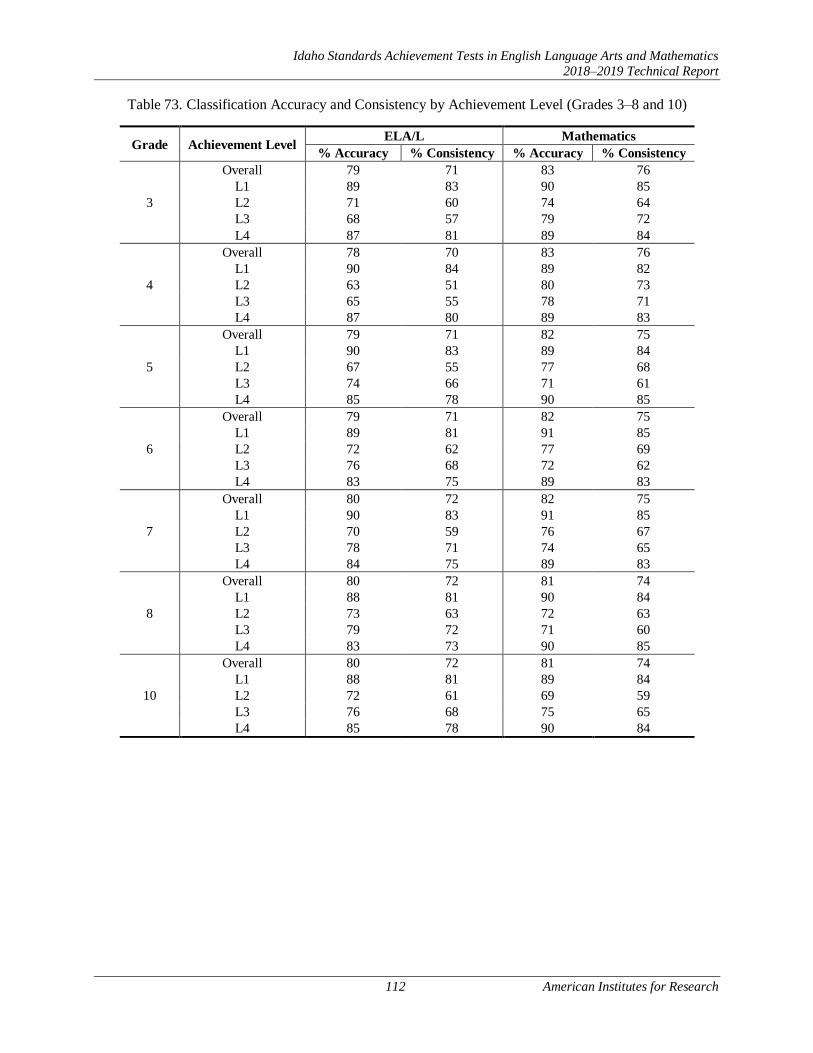
Idaho Standards Achievement Tests in English Language Arts and Mathematics
2018–2019 Technical Report
112 American Institutes for Research
Table 73. Classification Accuracy and Consistency by Achievement Level (Grades 3–8 and 10)
Grade Achievement Level ELA/L Mathematics
% Accuracy % Consistency % Accuracy % Consistency
3
Overall 79 71 83 76
L1 89 83 90 85
L2 71 60 74 64
L3 68 57 79 72
L4 87 81 89 84
4
Overall 78 70 83 76
L1 90 84 89 82
L2 63 51 80 73
L3 65 55 78 71
L4 87 80 89 83
5
Overall 79 71 82 75
L1 90 83 89 84
L2 67 55 77 68
L3 74 66 71 61
L4 85 78 90 85
6
Overall 79 71 82 75
L1 89 81 91 85
L2 72 62 77 69
L3 76 68 72 62
L4 83 75 89 83
7
Overall 80 72 82 75
L1 90 83 91 85
L2 70 59 76 67
L3 78 71 74 65
L4 84 75 89 83
8
Overall 80 72 81 74
L1 88 81 90 84
L2 73 63 72 63
L3 79 72 71 60
L4 83 73 90 85
10
Overall 80 72 81 74
L1 88 81 89 84
L2 72 61 69 59
L3 76 68 75 65
L4 85 78 90 84

Idaho Standards Achievement Tests in English Language Arts and Mathematics
2018–2019 Technical Report
113 American Institutes for Research
Table 74. Classification Accuracy and Consistency by Achievement Level (Grades 9 and 11)
Grade Achievement Level ELA/L Mathematics
% Accuracy % Consistency % Accuracy % Consistency
9
Overall 79 70 79 71
L1 87 80 89 84
L2 71 61 68 58
L3 76 68 70 60
L4 84 76 85 74
11
Overall 81 73 87 82
L1 89 83 95 92
L2 72 64 73 64
L3 77 67 77 66
L4 87 77 88 83
6.4 RELIABILITY FOR SUBGROUPS
The reliability of test scores is also computed by subgroup. Tables 75–80 present the marginal reliability
coefficients and average conditional SEMs. The reliability coefficients are similar across subgroups in
ELA/L, but somewhat lower in mathematics for subgroups with low performance, e.g., LEP and special
education. In mathematics, due to the shortage of easy items in the item pool, especially in grade 10, lower
reliability coefficients are due to the large percentage of students in Level 1 with large SEMs in these
subgroups.
Table 75. Marginal Reliability and Average Conditional SEM by Subgroup for ELA/L (Grades 3–5)
Group G3 G4 G5
MR CSEM MR CSEM MR CSEM
All Students 0.92 25.64 0.91 27.56 0.92 27.04
Female 0.91 25.46 0.91 27.46 0.91 27.08
Male 0.92 25.82 0.91 27.65 0.92 27.00
African American 0.91 26.74 0.91 28.24 0.92 27.09
AmerIndian/Alaskan 0.90 26.95 0.90 28.21 0.92 27.05
Asian 0.92 25.42 0.92 27.82 0.93 27.95
Hispanic 0.90 26.29 0.90 27.70 0.91 26.53
Pacific Islander 0.92 25.59 0.90 27.54 0.89 26.54
White 0.91 25.47 0.91 27.51 0.91 27.14
LEP 0.89 26.56 0.89 28.04 0.90 26.82
Special Education 0.89 28.51 0.89 29.57 0.90 28.33
Economic Disadvantage 0.90 25.61 0.90 27.53 0.91 26.46

Idaho Standards Achievement Tests in English Language Arts and Mathematics
2018–2019 Technical Report
114 American Institutes for Research
Table 76. Marginal Reliability and Average Conditional SEM by Subgroup for ELA/L
(Grades 6–8 and 10)
Group G6 G7 G8 G10
MR CSEM MR CSEM MR CSEM MR CSEM
All Students 0.91 27.50 0.91 28.80 0.91 28.88 0.91 32.15
Female 0.91 27.38 0.90 28.68 0.90 28.71 0.91 31.59
Male 0.92 27.62 0.92 28.90 0.91 29.05 0.92 32.67
African American 0.92 28.27 0.92 30.02 0.91 29.96 0.90 35.72
AmerIndian/Alaskan 0.91 28.68 0.91 29.09 0.89 29.15 0.90 33.11
Asian 0.91 27.79 0.92 29.15 0.91 28.90 0.90 31.37
Hispanic 0.90 27.62 0.91 28.89 0.90 29.48 0.90 33.09
Pacific Islander 0.92 27.59 0.90 28.39 0.90 28.75 0.91 31.78
White 0.91 27.44 0.91 28.75 0.91 28.73 0.91 31.90
LEP 0.90 28.25 0.91 29.60 0.89 30.50 0.89 35.21
Special Education 0.88 30.08 0.88 31.38 0.84 32.27 0.84 37.18
Economic Disadvantage 0.90 27.26 0.90 28.38 0.90 28.38 0.91 31.89
Table 77. Marginal Reliability and Average Conditional SEM by Subgroup for ELA/L
(Grades 9 and 11)
Group G9 G11
MR CSEM MR CSEM
All Students 0.91 32.07 0.92 34.98
Female 0.90 31.50 0.91 35.63
Male 0.91 32.60 0.93 34.30
African American 0.93 35.25 0.91 29.77
AmerIndian/Alaskan 0.89 33.44 0.91 33.84
Asian 0.91 31.29 0.97 39.66
Hispanic 0.89 32.80 0.92 34.99
Pacific Islander 0.92 32.69 0.91 32.28
White 0.90 31.84 0.92 35.06
LEP 0.87 34.62 0.79 37.47
Special Education 0.82 36.86 0.87 38.12
Economic Disadvantage 0.91 32.47 0.90 32.61
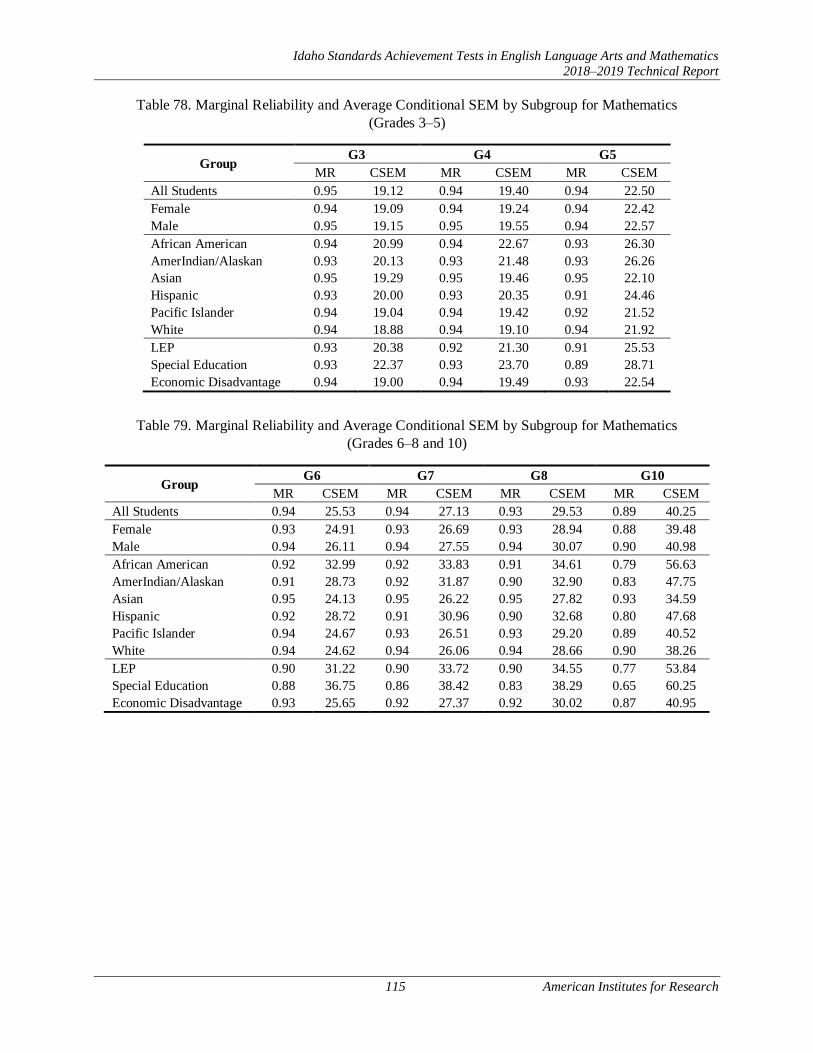
Idaho Standards Achievement Tests in English Language Arts and Mathematics
2018–2019 Technical Report
115 American Institutes for Research
Table 78. Marginal Reliability and Average Conditional SEM by Subgroup for Mathematics
(Grades 3–5)
Group G3 G4 G5
MR CSEM MR CSEM MR CSEM
All Students 0.95 19.12 0.94 19.40 0.94 22.50
Female 0.94 19.09 0.94 19.24 0.94 22.42
Male 0.95 19.15 0.95 19.55 0.94 22.57
African American 0.94 20.99 0.94 22.67 0.93 26.30
AmerIndian/Alaskan 0.93 20.13 0.93 21.48 0.93 26.26
Asian 0.95 19.29 0.95 19.46 0.95 22.10
Hispanic 0.93 20.00 0.93 20.35 0.91 24.46
Pacific Islander 0.94 19.04 0.94 19.42 0.92 21.52
White 0.94 18.88 0.94 19.10 0.94 21.92
LEP 0.93 20.38 0.92 21.30 0.91 25.53
Special Education 0.93 22.37 0.93 23.70 0.89 28.71
Economic Disadvantage 0.94 19.00 0.94 19.49 0.93 22.54
Table 79. Marginal Reliability and Average Conditional SEM by Subgroup for Mathematics
(Grades 6–8 and 10)
Group G6 G7 G8 G10
MR CSEM MR CSEM MR CSEM MR CSEM
All Students 0.94 25.53 0.94 27.13 0.93 29.53 0.89 40.25
Female 0.93 24.91 0.93 26.69 0.93 28.94 0.88 39.48
Male 0.94 26.11 0.94 27.55 0.94 30.07 0.90 40.98
African American 0.92 32.99 0.92 33.83 0.91 34.61 0.79 56.63
AmerIndian/Alaskan 0.91 28.73 0.92 31.87 0.90 32.90 0.83 47.75
Asian 0.95 24.13 0.95 26.22 0.95 27.82 0.93 34.59
Hispanic 0.92 28.72 0.91 30.96 0.90 32.68 0.80 47.68
Pacific Islander 0.94 24.67 0.93 26.51 0.93 29.20 0.89 40.52
White 0.94 24.62 0.94 26.06 0.94 28.66 0.90 38.26
LEP 0.90 31.22 0.90 33.72 0.90 34.55 0.77 53.84
Special Education 0.88 36.75 0.86 38.42 0.83 38.29 0.65 60.25
Economic Disadvantage 0.93 25.65 0.92 27.37 0.92 30.02 0.87 40.95

Idaho Standards Achievement Tests in English Language Arts and Mathematics
2018–2019 Technical Report
116 American Institutes for Research
Table 80. Marginal Reliability and Average Conditional SEM by Subgroup for Mathematics (Grades 9
and 11)
Group G9 G11
MR CSEM MR CSEM
All Students 0.88 40.17 0.91 38.45
Female 0.86 38.37 0.90 38.71
Male 0.89 41.80 0.92 38.17
African American 0.84 51.79 0.91 35.18
AmerIndian/Alaskan 0.81 44.47 0.78 46.14
Asian 0.89 35.73 0.95 41.36
Hispanic 0.81 45.14 0.79 44.51
Pacific Islander 0.90 42.21 0.88 34.31
White 0.88 38.74 0.92 36.99
LEP 0.76 49.39 – 51.92
Special Education 0.69 56.50 0.72 50.35
Economic Disadvantage 0.88 40.86 0.83 37.51
Note: Cells with “–” indicate that marginal reliability coefficients were not computed due to a large SEM.
6.5 RELIABILITY FOR CLAIM SCORES
The marginal reliability coefficients and the measurement errors are also computed for claim scores. In
mathematics, claims 2 and 4 are combined to have enough items to generate a score. Because the precision
of scores in claims is insufficient to report scores given a small number of items, the scores on each claim
are reported using one of the three performance categories, taking into account the SEM of the claim score: (1) Below Standard, (2) At/Near Standard, or (3) Above Standard. Tables 81–84 present the marginal
reliability coefficients for each claim score in ELA/L and mathematics, respectively.

Idaho Standards Achievement Tests in English Language Arts and Mathematics
2018–2019 Technical Report
117 American Institutes for Research
Table 81. Marginal Reliability Coefficients for Claim Scores in ELA/L (Grades 3–8 and 10)
Grade Claim
Number of Items
Specified in Test
Blueprint Marginal
Reliability
Scale Score
Mean
Scale Score
SD
Average
CSEM
Min Max
3
Claim 1: Reading 14 16 0.76 2434.21 101.23 49.83
Claim 2: Writing 7 7 0.72 2417.80 109.88 57.84
Claim 3: Listening 8 9 0.60 2442.93 121.86 76.74
Claim 4: Research 9 9 0.70 2406.09 117.48 64.44
4
Claim 1: Reading 14 16 0.76 2474.01 105.46 51.58
Claim 2: Writing 7 7 0.71 2467.56 120.24 64.26
Claim 3: Listening 8 9 0.60 2487.85 132.40 83.37
Claim 4: Research 9 9 0.71 2449.89 123.99 67.32
5
Claim 1: Reading 14 16 0.75 2522.27 110.86 55.58
Claim 2: Writing 7 7 0.71 2513.90 116.60 62.50
Claim 3: Listening 8 9 0.61 2510.58 132.55 82.41
Claim 4: Research 9 9 0.76 2501.64 118.54 58.30
6
Claim 1: Reading 14 19 0.76 2528.38 112.70 55.12
Claim 2: Writing 7 7 0.74 2534.96 111.26 57.22
Claim 3: Listening 8 9 0.59 2554.57 137.44 88.19
Claim 4: Research 9 9 0.71 2531.98 122.26 66.26
7
Claim 1: Reading 14 19 0.78 2559.04 114.76 54.38
Claim 2: Writing 7 7 0.73 2565.61 121.17 62.59
Claim 3: Listening 8 9 0.55 2568.59 134.15 89.50
Claim 4: Research 9 9 0.71 2550.39 132.90 70.98
8
Claim 1: Reading 16 19 0.75 2565.15 116.67 58.13
Claim 2: Writing 7 7 0.72 2575.05 119.17 63.18
Claim 3: Listening 8 9 0.58 2582.01 131.81 84.92
Claim 4: Research 9 9 0.72 2558.16 126.30 67.17
10
Claim 1: Reading 15 16 0.77 2588.07 127.88 60.76
Claim 2: Writing 7 7 0.73 2602.37 135.12 69.82
Claim 3: Listening 8 9 0.60 2596.05 153.66 96.68
Claim 4: Research 9 9 0.71 2575.88 144.41 77.98

Idaho Standards Achievement Tests in English Language Arts and Mathematics
2018–2019 Technical Report
118 American Institutes for Research
Table 82. Marginal Reliability Coefficients for Claim Scores in ELA/L (Grades 9 and 11)
Grade Claim
Number of Items
Specified in Test
Blueprint Marginal
Reliability
Scale Score
Mean
Scale Score
SD
Average
CSEM
Min Max
9
Claim 1: Reading 15 16 0.76 2573.84 123.87 61.07
Claim 2: Writing 7 7 0.71 2589.51 129.44 69.72
Claim 3: Listening 8 9 0.58 2580.93 149.14 96.34
Claim 4: Research 9 9 0.70 2564.23 141.51 77.95
11
Claim 1: Reading 15 16 0.79 2563.90 142.25 64.54
Claim 2: Writing 7 7 0.74 2569.91 147.81 74.79
Claim 3: Listening 8 9 0.64 2564.64 170.11 101.37
Claim 4: Research 9 9 0.71 2544.02 146.56 79.30
Table 83. Marginal Reliability Coefficients for Claim Scores in Mathematics (Grades 3–8 and 10)
Grade Claim
Number of Items
Specified in Test
Blueprint Marginal
Reliability
Scale Score
Mean
Scale Score
SD
Average
CSEM
Min Max
3
Claim 1 20 20 0.91 2442.15 91.02 28.04
Claims 2 & 4 8 11 0.72 2432.21 93.72 49.98
Claim 3 9 11 0.76 2431.99 95.53 47.07
4
Claim 1 20 20 0.90 2484.41 87.59 27.54
Claims 2 & 4 8 10 0.76 2476.93 94.59 46.31
Claim 3 9 10 0.74 2474.86 97.10 49.09
5
Claim 1 20 20 0.90 2514.38 98.33 31.65
Claims 2 & 4 8 10 0.69 2503.38 101.36 56.42
Claim 3 9 10 0.72 2499.93 113.25 60.35
6
Claim 1 19 19 0.89 2528.79 110.58 37.18
Claims 2 & 4 9 10 0.73 2517.03 116.52 60.85
Claim 3 9 11 0.73 2519.40 120.12 62.70
7
Claim 1 20 20 0.89 2546.80 114.65 37.86
Claims 2 & 4 9 10 0.68 2538.28 125.13 70.77
Claim 3 9 10 0.67 2538.05 131.07 75.15
8
Claim 1 20 20 0.89 2557.48 124.42 42.16
Claims 2 & 4 8 10 0.71 2545.45 131.66 71.21
Claim 3 9 10 0.69 2542.88 139.16 76.88
10
Claim 1 20 20 0.84 2558.80 136.65 55.48
Claims 2 & 4 8 10 0.49 2535.88 164.12 117.25
Claim 3 7 8 0.54 2539.14 152.58 103.94
Legend: Claim 1: Concepts and Procedures; Claims 2 & 4: Problem Solving & Modeling and Data Analysis; and Claim 3: Communicating Reasoning

Idaho Standards Achievement Tests in English Language Arts and Mathematics
2018–2019 Technical Report
119 American Institutes for Research
Table 84. Marginal Reliability Coefficients for Claim Scores in Mathematics (Grades 9 and 11)
Grade Claim
Number of Items
Specified in Test
Blueprint Marginal
Reliability
Scale Score
Mean
Scale Score
SD
Average
CSEM
Min Max
9
Claim 1 20 20 0.80 2528.82 117.70 52.03
Claims 2 & 4 8 10 0.49 2531.78 146.37 104.39
Claim 3 9 10 0.53 2529.12 162.90 112.20
11
Claim 1 22 22 0.86 2520.15 132.84 48.93
Claims 2 & 4 8 10 0.56 2492.14 178.73 118.77
Claim 3 9 10 0.54 2512.92 156.14 105.50
Legend: Claim 1: Concepts and Procedures; Claims 2 & 4: Problem Solving & Modeling and Data Analysis; and Claim 3: Communicating Reasoning
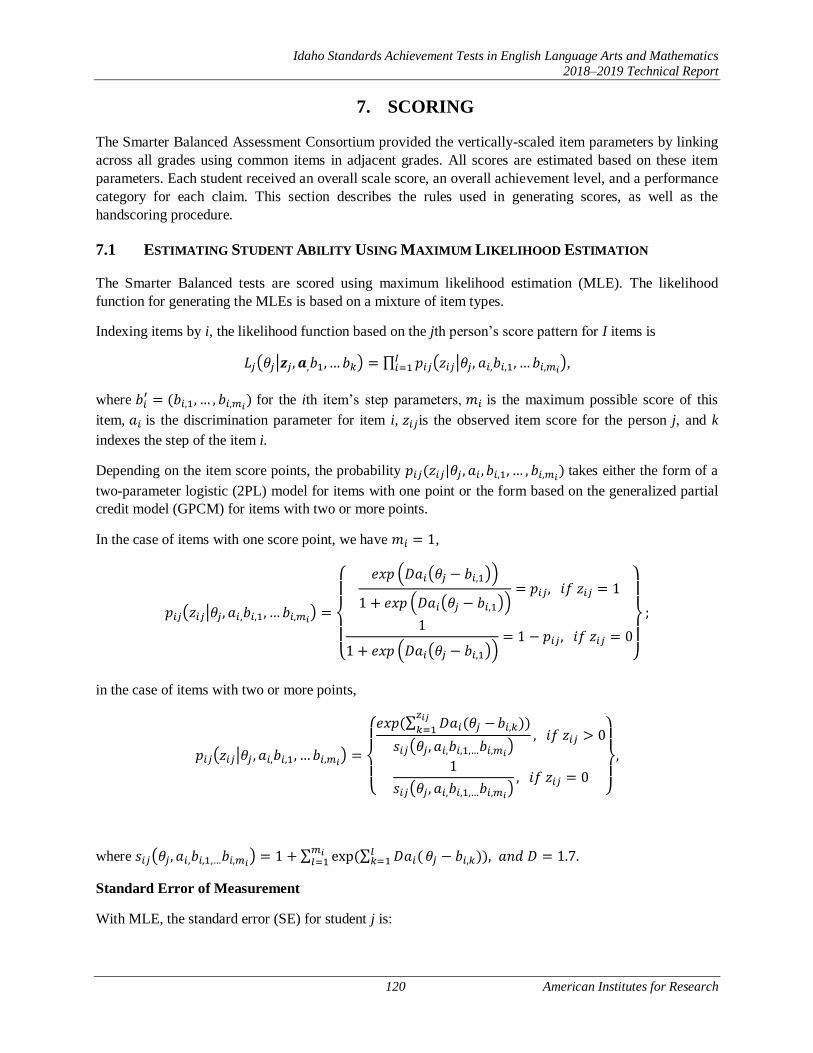
Idaho Standards Achievement Tests in English Language Arts and Mathematics
2018–2019 Technical Report
120 American Institutes for Research
7. SCORING
The Smarter Balanced Assessment Consortium provided the vertically-scaled item parameters by linking
across all grades using common items in adjacent grades. All scores are estimated based on these item
parameters. Each student received an overall scale score, an overall achievement level, and a performance
category for each claim. This section describes the rules used in generating scores, as well as the
handscoring procedure.
7.1 ESTIMATING STUDENT ABILITY USING MAXIMUM LIKELIHOOD ESTIMATION
The Smarter Balanced tests are scored using maximum likelihood estimation (MLE). The likelihood
function for generating the MLEs is based on a mixture of item types.
Indexing items by i, the likelihood function based on the jth person’s score pattern for I items is
𝐿𝑗(𝜃𝑗|𝒛𝑗, 𝒂,𝑏1,… 𝑏𝑘) = ∏ 𝑝𝑖𝑗(𝑧𝑖𝑗|𝜃𝑗, 𝑎𝑖,𝑏𝑖,1, … 𝑏𝑖,𝑚𝑖)𝐼
𝑖=1 ,
where 𝑏𝑖′ = (𝑏𝑖,1, … , 𝑏𝑖,𝑚𝑖
) for the ith item’s step parameters, 𝑚𝑖 is the maximum possible score of this
item, 𝑎𝑖 is the discrimination parameter for item i, 𝑧𝑖𝑗is the observed item score for the person j, and k
indexes the step of the item i.
Depending on the item score points, the probability 𝑝𝑖𝑗(𝑧𝑖𝑗|𝜃𝑗 , 𝑎𝑖 , 𝑏𝑖,1, … , 𝑏𝑖,𝑚𝑖) takes either the form of a
two-parameter logistic (2PL) model for items with one point or the form based on the generalized partial
credit model (GPCM) for items with two or more points.
In the case of items with one score point, we have 𝑚𝑖 = 1,
𝑝𝑖𝑗(𝑧𝑖𝑗|𝜃𝑗, 𝑎𝑖,𝑏𝑖,1, … 𝑏𝑖,𝑚𝑖) =
{
𝑒𝑥𝑝 (𝐷𝑎𝑖(𝜃𝑗 − 𝑏𝑖,1))
1 + 𝑒𝑥𝑝 (𝐷𝑎𝑖(𝜃𝑗 − 𝑏𝑖,1))= 𝑝𝑖𝑗, 𝑖𝑓 𝑧𝑖𝑗 = 1
1
1 + 𝑒𝑥𝑝 (𝐷𝑎𝑖(𝜃𝑗 − 𝑏𝑖,1))= 1 − 𝑝𝑖𝑗, 𝑖𝑓 𝑧𝑖𝑗 = 0
}
;
in the case of items with two or more points,
𝑝𝑖𝑗(𝑧𝑖𝑗|𝜃𝑗 , 𝑎𝑖,𝑏𝑖,1, … 𝑏𝑖,𝑚𝑖) =
{
𝑒𝑥𝑝(
∑ 𝐷𝑎𝑖(𝜃𝑗 −𝑧𝑖𝑗𝑘=1
𝑏𝑖,𝑘))
𝑠𝑖𝑗(𝜃𝑗, 𝑎𝑖,𝑏𝑖,1,…𝑏𝑖,𝑚𝑖)
, 𝑖𝑓 𝑧𝑖𝑗 > 0
1
𝑠𝑖𝑗(𝜃𝑗, 𝑎𝑖,𝑏𝑖,1,…𝑏𝑖,𝑚𝑖), 𝑖𝑓 𝑧𝑖𝑗 = 0
}
,
where 𝑠𝑖𝑗(𝜃𝑗, 𝑎𝑖,𝑏𝑖,1,…𝑏𝑖,𝑚𝑖) = 1 + ∑ exp (∑ 𝐷𝑎𝑖(
𝑙𝑘=1
𝑚𝑖𝑙=1 𝜃𝑗 − 𝑏𝑖,𝑘)), 𝑎𝑛𝑑 𝐷 = 1.7.
Standard Error of Measurement
With MLE, the standard error (SE) for student j is:
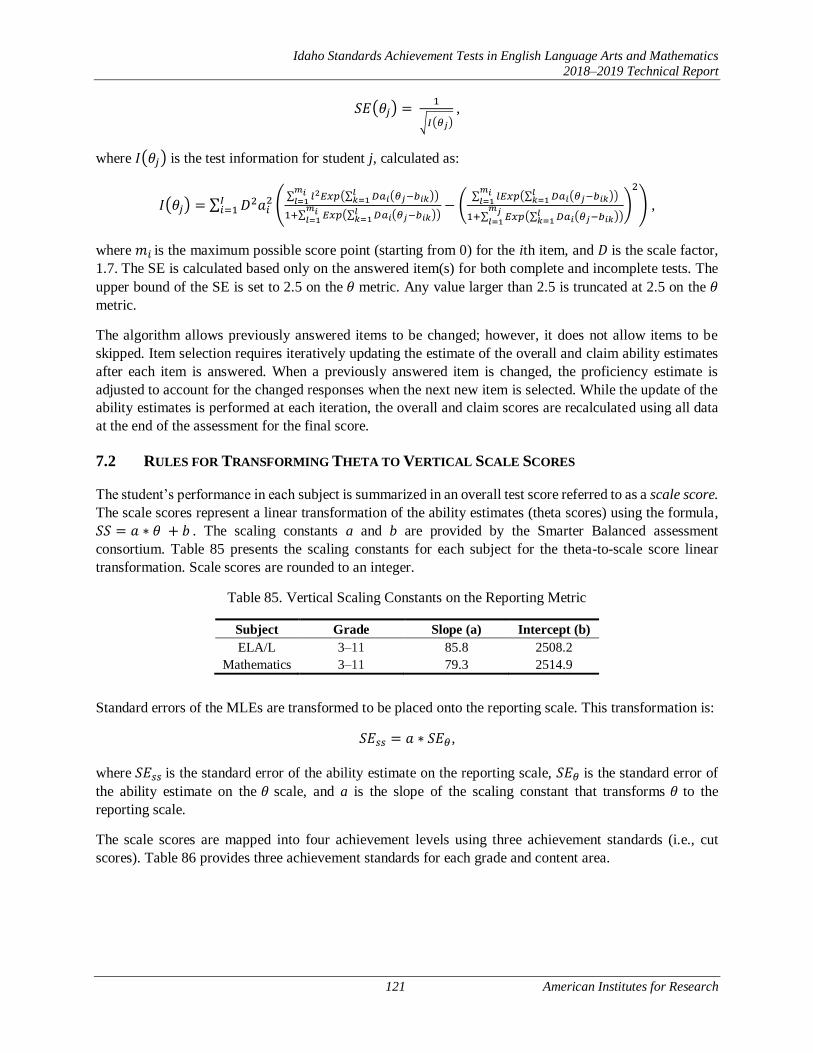
Idaho Standards Achievement Tests in English Language Arts and Mathematics
2018–2019 Technical Report
121 American Institutes for Research
𝑆𝐸(𝜃𝑗) = 1
√𝐼(𝜃𝑗) ,
where 𝐼(𝜃𝑗) is the test information for student j, calculated as:
𝐼(𝜃𝑗) = ∑ 𝐷2𝑎𝑖2 (
∑ 𝑙2𝐸𝑥𝑝(∑ 𝐷𝑎𝑖(𝜃𝑗−𝑏𝑖𝑘)𝑙𝑘=1 )
𝑚𝑖𝑙=1
1+∑ 𝐸𝑥𝑝(∑ 𝐷𝑎𝑖(𝜃𝑗−𝑏𝑖𝑘)𝑙𝑘=1 )
𝑚𝑖𝑙=1
− (∑ 𝑙𝐸𝑥𝑝(∑ 𝐷𝑎𝑖(𝜃𝑗−𝑏𝑖𝑘)
𝑙𝑘=1 )
𝑚𝑖𝑙=1
1+∑ 𝐸𝑥𝑝(∑ 𝐷𝑎𝑖(𝜃𝑗−𝑏𝑖𝑘)𝑙𝑘=1 )
𝑚𝑗𝑙=1
)
2
)𝐼𝑖=1 ,
where 𝑚𝑖 is the maximum possible score point (starting from 0) for the ith item, and 𝐷 is the scale factor,
1.7. The SE is calculated based only on the answered item(s) for both complete and incomplete tests. The
upper bound of the SE is set to 2.5 on the 𝜃 metric. Any value larger than 2.5 is truncated at 2.5 on the 𝜃
metric.
The algorithm allows previously answered items to be changed; however, it does not allow items to be
skipped. Item selection requires iteratively updating the estimate of the overall and claim ability estimates
after each item is answered. When a previously answered item is changed, the proficiency estimate is
adjusted to account for the changed responses when the next new item is selected. While the update of the
ability estimates is performed at each iteration, the overall and claim scores are recalculated using all data
at the end of the assessment for the final score.
7.2 RULES FOR TRANSFORMING THETA TO VERTICAL SCALE SCORES
The student’s performance in each subject is summarized in an overall test score referred to as a scale score.
The scale scores represent a linear transformation of the ability estimates (theta scores) using the formula,
𝑆𝑆 = 𝑎 ∗ 𝜃 + 𝑏 . The scaling constants a and b are provided by the Smarter Balanced assessment
consortium. Table 85 presents the scaling constants for each subject for the theta-to-scale score linear
transformation. Scale scores are rounded to an integer.
Table 85. Vertical Scaling Constants on the Reporting Metric
Subject Grade Slope (a) Intercept (b)
ELA/L 3–11 85.8 2508.2
Mathematics 3–11 79.3 2514.9
Standard errors of the MLEs are transformed to be placed onto the reporting scale. This transformation is:
𝑆𝐸𝑠𝑠 = 𝑎 ∗ 𝑆𝐸𝜃,
where 𝑆𝐸𝑠𝑠 is the standard error of the ability estimate on the reporting scale, 𝑆𝐸𝜃 is the standard error of
the ability estimate on the 𝜃 scale, and a is the slope of the scaling constant that transforms 𝜃 to the
reporting scale.
The scale scores are mapped into four achievement levels using three achievement standards (i.e., cut
scores). Table 86 provides three achievement standards for each grade and content area.

Idaho Standards Achievement Tests in English Language Arts and Mathematics
2018–2019 Technical Report
122 American Institutes for Research
Table 86. Cut Scores in Scale Scores (Grades 3–11)
Grade ELA/L Mathematics
Level 2 Level 3 Level 4 Level 2 Level 3 Level 4
3 2367 2432 2490 2381 2436 2501
4 2416 2473 2533 2411 2485 2549
5 2442 2502 2582 2455 2528 2579
6 2457 2531 2618 2473 2552 2610
7 2479 2552 2649 2484 2567 2635
8 2487 2567 2668 2504 2586 2653
9 2488 2571 2670 2491 2577 2677
10 2491 2577 2677 2529 2614 2697
11 2493 2583 2682 2543 2628 2718
7.3 LOWEST/HIGHEST OBTAINABLE SCORES (LOSS/HOSS)
Although the observed score is measured more precisely in an adaptive test than in a fixed-form test,
especially for high- and low-performing students, if the item pool does not include enough easy or difficult
items to measure low- and high-performing students, the standard error can be large in low and high ends
of the ability range. The Smarter Balanced Assessment Consortium decided to truncate extreme unreliable
student ability estimates. Table 87 presents the lowest obtainable score (LOT or LOSS) and the highest
obtainable score (HOT or HOSS) in both theta and scale score metrics. Estimated thetas lower than LOT
or higher than HOT are truncated to the LOT and HOT values, and are assigned LOSS and HOSS associated
with the LOT and HOT. LOT and HOT were applied to all tests and all scores (total and claim scores). The
standard error for LOT and HOT is computed using the LOT and HOT ability estimates given the
administered items.
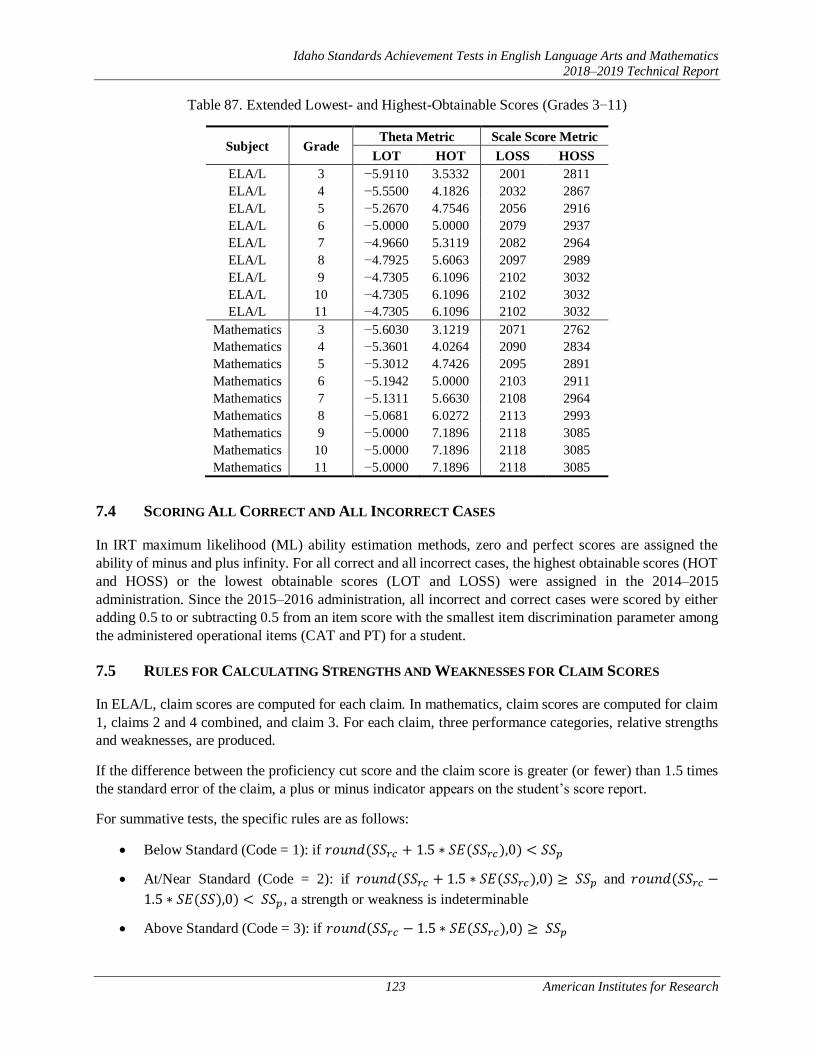
Idaho Standards Achievement Tests in English Language Arts and Mathematics
2018–2019 Technical Report
123 American Institutes for Research
Table 87. Extended Lowest- and Highest-Obtainable Scores (Grades 3−11)
Subject Grade Theta Metric Scale Score Metric
LOT HOT LOSS HOSS
ELA/L 3 −5.9110 3.5332 2001 2811
ELA/L 4 −5.5500 4.1826 2032 2867
ELA/L 5 −5.2670 4.7546 2056 2916
ELA/L 6 −5.0000 5.0000 2079 2937
ELA/L 7 −4.9660 5.3119 2082 2964
ELA/L 8 −4.7925 5.6063 2097 2989
ELA/L 9 −4.7305 6.1096 2102 3032
ELA/L 10 −4.7305 6.1096 2102 3032
ELA/L 11 −4.7305 6.1096 2102 3032
Mathematics 3 −5.6030 3.1219 2071 2762
Mathematics 4 −5.3601 4.0264 2090 2834
Mathematics 5 −5.3012 4.7426 2095 2891
Mathematics 6 −5.1942 5.0000 2103 2911
Mathematics 7 −5.1311 5.6630 2108 2964
Mathematics 8 −5.0681 6.0272 2113 2993
Mathematics 9 −5.0000 7.1896 2118 3085
Mathematics 10 −5.0000 7.1896 2118 3085
Mathematics 11 −5.0000 7.1896 2118 3085
7.4 SCORING ALL CORRECT AND ALL INCORRECT CASES
In IRT maximum likelihood (ML) ability estimation methods, zero and perfect scores are assigned the
ability of minus and plus infinity. For all correct and all incorrect cases, the highest obtainable scores (HOT
and HOSS) or the lowest obtainable scores (LOT and LOSS) were assigned in the 2014–2015
administration. Since the 2015–2016 administration, all incorrect and correct cases were scored by either
adding 0.5 to or subtracting 0.5 from an item score with the smallest item discrimination parameter among
the administered operational items (CAT and PT) for a student.
7.5 RULES FOR CALCULATING STRENGTHS AND WEAKNESSES FOR CLAIM SCORES
In ELA/L, claim scores are computed for each claim. In mathematics, claim scores are computed for claim
1, claims 2 and 4 combined, and claim 3. For each claim, three performance categories, relative strengths
and weaknesses, are produced.
If the difference between the proficiency cut score and the claim score is greater (or fewer) than 1.5 times
the standard error of the claim, a plus or minus indicator appears on the student’s score report.
For summative tests, the specific rules are as follows:
• Below Standard (Code = 1): if 𝑟𝑜𝑢𝑛𝑑(𝑆𝑆𝑟𝑐 + 1.5 ∗ 𝑆𝐸(𝑆𝑆𝑟𝑐),0) < 𝑆𝑆𝑝
• At/Near Standard (Code = 2): if 𝑟𝑜𝑢𝑛𝑑(𝑆𝑆𝑟𝑐 + 1.5 ∗ 𝑆𝐸(𝑆𝑆𝑟𝑐),0) ≥ 𝑆𝑆𝑝 and 𝑟𝑜𝑢𝑛𝑑(𝑆𝑆𝑟𝑐 −
1.5 ∗ 𝑆𝐸(𝑆𝑆),0) < 𝑆𝑆𝑝, a strength or weakness is indeterminable
• Above Standard (Code = 3): if 𝑟𝑜𝑢𝑛𝑑(𝑆𝑆𝑟𝑐 − 1.5 ∗ 𝑆𝐸(𝑆𝑆𝑟𝑐),0) ≥ 𝑆𝑆𝑝

Idaho Standards Achievement Tests in English Language Arts and Mathematics
2018–2019 Technical Report
124 American Institutes for Research
where 𝑆𝑆𝑟𝑐 is the student’s scale score on a claim; 𝑆𝑆𝑝 is the proficiency scale score cut (Level 3 cut); and
𝑆𝐸(𝑆𝑆𝑟𝑐) is the standard error of the student’s scale score on the claim.
7.6 TARGET SCORES
The target-level reports cannot be produced for a fixed-form test because the number of items included per
target (i.e., benchmark) is too low to produce a reliable score at the target level. A typical fixed-form test
includes only one or two items per target. Even when aggregated, these data narrowly reflect the benchmark
because they reflect only one or two ways of measuring the target. An adaptive test, however, offers a
tremendous opportunity for target-level data at the class, school, and district area level. With an adequate
item pool, a class of 20 students might respond to 10 or 15 different items measuring any given target.
Target scores are computed for attempted tests based on the responded items. Target scores are computed
in each claim (four claims) for ELA/L and only in claim 1 for mathematics.
Target scores are computed in two ways: (1) target scores relative to a student’s overall estimated ability
(θ), and (2) target scores relative to the proficiency standard (Level 3 cut).
7.6.1 Target Scores Relative to Student’s Overall Estimated Ability
By defining 𝑝𝑖𝑗 = 𝑝(𝑧𝑖𝑗 = 1), indicating the probability that student j responds correctly to item i, 𝑧𝑖𝑗
represents the jth student’s score on the ith item. For items with one score point, we use the 2PL IRT model
to calculate the expected score on item i for student j with estimated ability 𝜃𝑗 as:
𝐸(𝑧𝑖𝑗) =exp (𝐷𝑎𝑖(�̂�𝑗 − 𝑏𝑖))
1 + exp (𝐷𝑎𝑖(�̂�𝑗 − 𝑏𝑖))
For items with two or more score points, using the GPCM model, the expected score for student j with
estimated ability 𝜃𝑗 on an item i with a maximum possible score of mi is calculated as:
𝐸(𝑧𝑖𝑗) =∑𝑙exp(∑ 𝐷𝑎𝑖(�̂�𝑗 − 𝑏𝑖,𝑘)
𝑙𝑘=1 )
1 + ∑ exp(∑ 𝐷𝑎𝑖(�̂�𝑗 − 𝑏𝑖,𝑘)𝑙𝑘=1 )𝑚𝑖
𝑙=1
𝑚𝑖
𝑙=1
For each item i, the residual between observed and expected score for each student is defined as:
𝛿𝑖𝑗 = 𝑧𝑖𝑗 − 𝐸(𝑧𝑖𝑗)
Residuals are summed for items within a target. The sum of residuals is divided by the total number of
points possible for items within the target, T.
𝛿𝑗𝑇 =∑ 𝛿𝑗𝑖𝑖∈𝑇
∑ 𝐾𝑚𝑖𝑖∈𝑇.
For an aggregate unit, a target score is computed by averaging the individual student target scores for the
target, across students of different abilities receiving different items and measuring the same target at
different levels of difficulty,
𝛿̅𝑇𝑔 =1
𝑛𝑔∑ 𝛿𝑗𝑇𝑗∈𝑔 , and 𝑠𝑒(𝛿̅𝑇𝑔) = √
1
𝑛𝑔(𝑛𝑔−1)∑ (𝛿𝑗𝑇 − 𝛿̅𝑇𝑔)
2,𝑗∈𝑔
Idaho Standards Achievement Tests in English Language Arts and Mathematics
2018–2019 Technical Report
125 American Institutes for Research
where 𝑛𝑔 is the number of students who responded to any of the items that belong to the target T for an
aggregate unit g. If a student did not happen to see any items on a particular target, the student is NOT
included in the 𝑛𝑔 count for the aggregate.
A statistically significant difference from zero in these aggregates may indicate that a roster, teacher, school,
or district is more effective (if 𝛿�̅�𝑔is positive) or less effective (negative 𝛿̅𝑇𝑔) in teaching a given target.
In the aggregate, a target performance is reported as a group of students performing better, worse, or as
expected on this target. In some cases, insufficient information will be available and that will be indicated
as well.
For target-level strengths/weakness, report the following:
• If 𝛿̅𝑇𝑔 ≥ +1 ∗ 𝑠𝑒(𝛿�̅�𝑔), then performance is better than on the rest of the test.
• If 𝛿̅𝑇𝑔 ≤ −1 ∗ 𝑠𝑒(𝛿�̅�𝑔), then performance is worse than on the rest of the test.
• Otherwise, performance is similar to performance on the test as a whole.
• If 𝑠𝑒(𝛿�̅�𝑔) > 0.2, data are insufficient.
7.6.2 Target Scores Relative to Proficiency Standard (Level 3 Cut)
By defining 𝑝𝑖𝑗 = 𝑝(𝑧𝑖𝑗 = 1), indicating the probability that student j responds correctly to item i. 𝑧𝑖𝑗
represents the jth student’s score on the ith item. For items with one score point we use the 2PL IRT model
to calculate the expected score on item i for student j with 𝜃𝐿𝑒𝑣𝑒𝑙 3 𝑐𝑢𝑡 as:
𝐸(𝑧𝑖𝑗) =exp(𝐷𝑎𝑖(𝜃𝐿𝑒𝑣𝑒𝑙 3 𝑐𝑢𝑡 − 𝑏𝑖))
1 + exp(𝐷𝑎𝑖(𝜃𝐿𝑒𝑣𝑒𝑙 3 𝑐𝑢𝑡 − 𝑏𝑖))
For items with two or more score points, using the generalized partial credit model, the expected score for
student j with Level 3 cut on an item i with a maximum possible score of mi is calculated as:
𝐸(𝑧𝑖𝑗) =∑𝑙exp(∑ 𝐷𝑎𝑖(𝜃𝐿𝑒𝑣𝑒𝑙 3 𝑐𝑢𝑡 − 𝑏𝑖,𝑘)
𝑙𝑘=1 )
1 + ∑ exp(∑ 𝐷𝑎𝑖(𝜃𝐿𝑒𝑣𝑒𝑙 3 𝑐𝑢𝑡 − 𝑏𝑖,𝑘)𝑙𝑘=1 )𝑚𝑖
𝑙=1
𝑚𝑖
𝑙=1
For each item i, the residual between observed and expected score for each student is defined as:
𝛿𝑖𝑗 = 𝑧𝑖𝑗 − 𝐸(𝑧𝑖𝑗)
Residuals are summed for items within a target. The sum of residuals is divided by the total number of
points possible for items within the target, T.
𝛿𝑗𝑇 =∑ 𝛿𝑗𝑖𝑖∈𝑇
∑ 𝑚𝑖𝑖∈𝑇.
For an aggregate unit, a target score is computed by averaging individual student target scores for the target,
across students of different abilities receiving different items measuring the same target at different levels
of difficulty,

Idaho Standards Achievement Tests in English Language Arts and Mathematics
2018–2019 Technical Report
126 American Institutes for Research
𝛿̅𝑇𝑔 =1
𝑛𝑔∑ 𝛿𝑗𝑇𝑗∈𝑔 , and 𝑠𝑒(𝛿̅𝑇𝑔) = √
1
𝑛𝑔(𝑛𝑔−1)∑ (𝛿𝑗𝑇 − 𝛿̅𝑇𝑔)
2,𝑗∈𝑔
where 𝑛𝑔 is the number of students who responded to any of the items that belong to the target T for an
aggregate unit g. If a student did not happen to see any items on a particular target, the student is NOT
included in the 𝑛𝑔 count for the aggregate.
A statistically significant difference from zero in these aggregates may indicate that a class, teacher, school,
or district is more effective (if 𝛿�̅�𝑔is positive) or less effective (negative 𝛿̅𝑇𝑔) in teaching a given target.
We do not suggest direct reporting of the statistic 𝛿̅𝑇𝑔; instead, we recommend reporting whether, in the
aggregate, a group of students performs better, worse, or as expected on this target. In some cases,
insufficient information will be available and that will be indicated, as well.
For target-level strengths/weakness, we will report the following:
• If 𝛿̅𝑇𝑔 ≥ +1 ∗ 𝑠𝑒(𝛿�̅�𝑔), then performance is above the Proficiency Standard.
• If 𝛿̅𝑇𝑔 ≤ −1 ∗ 𝑠𝑒(𝛿�̅�𝑔), then performance is below the Proficiency Standard.
• Otherwise, performance is near the Proficiency Standard.
• If 𝑠𝑒(𝛿�̅�𝑔) > 0.2, data are insufficient.
7.7 HANDSCORING
AIR provides the automated electronic scoring, and Measurement Incorporated (MI) provides all
handscoring for the Smarter Balanced summative assessments. Short-answer (SA) items and full-write
items in ELA/L and SA items in mathematics are scored by human raters; this is also referred to as
handscoring. The procedures for scoring these items are specified by Smarter Balanced.
Outlined below is the scoring process MI follows. This procedure is used to score responses to all
constructed-response short answer and essay items.
7.7.1 Rater Selection
MI maintains a large pool of raters at each scoring center, as well as distributive raters who work remotely.
MI’s recruiting team first recruits qualified raters who have experience scoring the Smarter Balanced
assessment. Rater accuracy parameters are used to focus recruitment efforts for experienced Smarter
Balanced raters in order to recruit the most objectively accurate raters. Once recruited, experienced raters
are assigned to the content area and grade band(s) in which they are most experienced. These experienced,
demonstrably accurate raters comprise the majority of the total rater pool.
To supplement this core pool, MI contacts other raters in their database who have experience successfully
scoring other large-scale assessments. These raters are assigned to the grade level, subject area, and item
type for which they are most qualified based on their performance on similar projects. Returning staff are
selected based on experience and performance, as well as attendance, punctuality, and cooperation with
work procedures and MI policies. MI maintains evaluations and performance data for all staff who work
on each scoring project in order to determine employment eligibility for future projects. Finally, MI targets
recruitment of new raters for site-based and remote scoring as needed, in order to continue to identify talent
Idaho Standards Achievement Tests in English Language Arts and Mathematics
2018–2019 Technical Report
127 American Institutes for Research
across the country that will best fulfill the handscoring requirements. For new raters, MI’s recruiting team
reviews applications, including prospective raters’ resumes, references, proof of degree, and recognition of
rater requirements, before offering employment.
In selecting team leaders, MI scoring leadership review the files of all returning staff. They look for people
who are experienced team leaders with a record of good performance on previous projects and also consider
raters who have been recommended for promotion to the team leader position.
MI is an equal opportunity employer that actively recruits minority staff. Historically, MI’s temporary staff
on major projects averages about 51% female, 49% male, 76% Caucasian, and 24% minority.
MI requires all handscoring project staff (scoring directors, team leaders, raters, and clerical staff) to sign
a confidentiality/nondisclosure agreement before receiving any training or secure project materials. The
employment agreement indicates that no participant in training and/or scoring may reveal information about
the test, the scoring criteria, or the scoring methods to any person.
7.7.2 Rater Training
All raters hired for Smarter Balanced assessment handscoring task are trained using the rubric(s), anchor
sets, and training/qualifying sets provided by Smarter Balanced. These sets were created during the original
field-test scoring in 2014 and approved by Smarter Balanced. The same anchor sets are used each year.
Additionally, MI conducts an annual review of the rater agreement and scoring materials in order to inform
the development of item-specific, supplemental training materials. Supplemental materials are developed
each summer and implemented in the following operational administration.
Once hired, raters are placed into a scoring group that corresponds to the subject/grade that they are deemed
best suited to score (based on work history, results of the placement assessments, and performance on past
scoring projects). Raters are trained on a specific item type (i.e., brief writes, reading, research, full-writes,
and/or mathematics). Within each group, raters are divided into teams consisting of one team leader and
10–15 raters. Each team leader and rater is assigned a unique number for easy identification of their scoring
work throughout the scoring session. The number of items an individual rater scores is minimized so that
the rater becomes highly experienced in scoring responses to a given set of items.
MI’s Virtual Scoring Center (VSC) includes an online training interface which presents rubrics, scoring
guides, and training/qualifying sets. Raters are trained by a scoring director (in person) or using scripted
videos (online). The same training protocol is followed for both site-based and distributive raters.
After the contracts and nondisclosure forms are signed and the scoring director completes his or her
introductory remarks, training begins. Rater training and team leader training follow the same format. The
scoring director presents the writing or constructed-response task and introduces the scoring guide (anchor
set), then discusses each score point with the entire room. This presentation is followed by practice scoring
on the training/qualifying sets. The scoring director reminds the raters to compare each training/qualifying
set response to anchor responses in the scoring guide to ensure consistency in scoring the training/qualifying
responses.
All scoring personnel log in to MI’s secure Scoring Resource Center (SRC). The SRC includes all online
training modules, functions as the portal to the VSC interface, and serves as the data repository for all
scoring reports that are used for rater monitoring.

Idaho Standards Achievement Tests in English Language Arts and Mathematics
2018–2019 Technical Report
128 American Institutes for Research
After completing the first training set, raters are provided a rationale for the score of each response presented
in the set. Training continues until all training/qualifying sets have been scored and discussed.
Like team leaders, raters must demonstrate their ability to score accurately by attaining the qualifying
agreement percentage established by Smarter Balanced before they may score actual student responses.
Any raters unable to meet the qualifying standards are not permitted to score that item. Raters who reach
the qualifying standard on some items but not others will only score the items on which they have
successfully qualified. All raters understand this stipulation when they are hired.
Training is carefully orchestrated so that raters understand how to apply the rubric in scoring the responses,
how to reference the scoring guide, how to develop the flexibility needed to handle a variety of responses,
and how to retain the consistency needed to accurately score all responses. In addition to completing all of
the initial training and qualifications, significant time is allotted for demonstrations of the VSC handscoring
system, explanations of how to “flag” unusual responses for review by the scoring director, and instructions
about other procedures necessary for the conduct of a smooth project.
Training design varies slightly depending on Smarter Balanced item type:
• Full-writes: Raters train and qualify on baseline sets for each grade and writing purpose (e.g., Grade
3 Narrative, Grade 6 Argumentative, etc.), then take qualifying sets for each item in that grade and
purpose.
• Brief writes, reading, and research: Raters train and qualify on a baseline set within a specific grade
band and target.
• Mathematics: Raters train on baseline items, which qualify the raters for that item as well as any
items associated with it; for items with no associated items, training is for the specific item.
Rater training time varies by grade and content area. Training for brief writes, reading, research, and many
mathematics items can be accomplished in one day, while training for full-writes may take up to five days
to complete. Raters generally work 6.5 hours per day, excluding breaks. Evening shift raters work 3.75
hours, excluding breaks.
Multiple strategies are used to minimize rater bias. First, raters do not have access to any student identifiers.
Unless the students sign their names, write about their home towns, or in some way provide other
identifying information as part of their response, the raters have no knowledge of student characteristics.
Second, all raters are trained using Smarter Balanced-provided materials, which were approved as unbiased
examples of responses at the various score points. Training involves constant comparisons with the rubric
and anchor papers so that raters’ judgments are based solely on the scoring criteria. Finally, following
training, a cycle of diagnosis and feedback is used to identify any issues. Specifically, during scoring, raters
are monitored and any instances of raters making scoring decisions based on anything except the criteria
are discussed. Raters are further monitored, and if any continue to exhibit bias after receiving a reasonable
amount of feedback, they are dismissed.
MI also implements a series of automated score verifications to ensure the accuracy of scores. For example,
MI conducts a blank check which resets scores when a condition code of “blank” is assigned to a response
that has one or more characters in the response string (e.g., a response comprised of spaces or tabs). In this
case, only after three independent raters have assigned a condition code of “blank” to a response that appears
blank but includes characters in the response string is the score recorded. A similar check is run when a
score or condition code other than “blank” is assigned to a response that includes no characters in the
Idaho Standards Achievement Tests in English Language Arts and Mathematics
2018–2019 Technical Report
129 American Institutes for Research
response string. Automatic resetting of double-scored responses when two raters assign non-adjacent
scores, mismatched condition codes, or a combination of a condition code and a numeric score provides an
additional score verification. In addition to automatically resetting and rescoring these responses, the rater
information is captured in a report and reviewed by scoring directors, as one of many tools used to determine
retraining needs.
7.7.3 Rater Statistics
One concern regarding the scoring of any open-response assessment is the reliability and accuracy of the
scoring. MI appreciates and shares this concern and continually develops new and technically sound
methods of monitoring reliability. Reliable scoring starts with detailed scoring rubrics and training materials
and thorough training sessions by experienced trainers. Quality results are achieved through the daily
monitoring of each rater.
In addition to extensive experience in the preparation of training materials and employing management and
staff with unparalleled expertise in the field of handscored educational assessments, MI constantly monitors
the quality of each rater’s work throughout every project. Rater status reports are used to monitor raters’
scoring habits during the Smarter Balanced handscoring project.
MI has developed and operates a comprehensive system for collecting and analyzing scoring data. After
the raters’ scores are submitted into the VSC handscoring system, the data are uploaded into the scoring
data report servers located at MI’s corporate headquarters in Durham, NC.
More than 20 reports are available and can be customized to meet the information needs of the client and
MI’s scoring department. These reports provide the following data:
• Rater ID and team
• Number of responses scored
• Number of responses assigned each score point (1–4 or other)
• Percentage of responses scored that day in exact agreement with a second rater
• Percentage of responses scored that day within one point of agreement with a second rater
• Number and percentage of responses receiving adjacent scores at each line (0/1, 1/2, 2/3, etc.)
• Number and percentage of responses receiving nonadjacent scores at each line
• Number of correctly assigned scores on the validity responses
Updated real-time reports are available that show both daily and cumulative (project-to-date) data. These
reports are available for access by the handscoring project monitors at each MI scoring center via a secure
website, and the handscoring project monitors provide updated reports to the scoring directors several times
per day. MI further utilized dynamic “threshold” reports, which, based on inputted criteria, immediately
identify potential scoring performance issues. These reports allow scoring leadership to pinpoint areas of
concern and to take corrective action with great efficiency. MI scoring directors are experienced in
examining these reports and using the information to determine a need for retraining of individual raters or
the group as a whole. It can easily be determined if a rater is consistently scoring high or low and the
specific score points with which they may be having difficulty. The scoring directors share such information
with the team leaders and direct all retraining efforts.

Idaho Standards Achievement Tests in English Language Arts and Mathematics
2018–2019 Technical Report
130 American Institutes for Research
7.7.4 Rater Monitoring and Retraining
Team leaders spot-check (i.e., read behind) each rater’s scoring to ensure that he or she is on target and
conduct one-on-one retraining sessions addressing any problems found. At the beginning of the project,
team leaders read behind every rater every day; they become more selective about the frequency and number
of read-behinds as raters become more proficient at scoring. The daily rater reliability reports and
validity/calibration results are used to identify raters who need more frequent monitoring.
Retraining is an ongoing process once scoring is underway. Daily analysis of the rater status reports enables
management personnel to identify individual or group retraining needs. If it becomes apparent that a whole
team or group is having difficulty with a particular type of response, large group training sessions are
conducted. Standard retraining procedures include room-wide discussions led by the scoring director, team
discussions conducted by team leaders, and one-on-one discussions with individual raters. It is standard
practice to conduct morning room-wide retraining at MI each day, with a more extensive retraining on
Monday mornings in order to re-anchor the raters after a weekend away from scoring.
Each student response is scored holistically by a trained and qualified rater using the scoring criteria
developed and approved by Smarter Balanced, with a second read conducted on 15% of responses for each
item for reliability purposes. Responses are randomly selected for second reads and scored by raters who
are not aware of the score assigned by the first rater or even that the response has been read before. MI’s
QA/reliability procedures allow the handscoring staff to identify struggling raters very early and begin
retraining at once. While retraining these raters, MI also monitors their scoring intensively to ensure that
all responses are scored accurately. In fact, MI’s monitoring is also used as a retraining method. MI shows
raters responses that the raters have scored incorrectly, explains the correct scores, and has the raters change
the scores.
During scoring, raters occasionally send responses to their leadership for review and/or scoring. These types
of responses most commonly include non-scorable responses such as off-topic or foreign-language
responses that are difficult to score using the available rubrics and reference responses, as well as at-risk
responses that are alerted to the client state for action.
7.7.5 Validity Checks
MI’s VSC scoring system randomly seeds validity responses among operational responses during scoring.
A small set of validity responses is provided by Smarter Balanced for all vendors to use, and these are
supplemented with responses selected and approved by MI scoring management. The “true” scores for these
responses are entered into a validity database. Validity responses are indistinguishable from operational
responses.
MI staff and all clients have access to real-time validity reports that include the response identification
number, the score(s) assigned by the raters, and the “true” scores. A daily and project-to-date summary of
the percentages of correct scores and low/high considerations at each score point is also provided.
Retraining may be conducted with the raters using the validity data as a guide for how to focus the
retraining. Validity results are not used in isolation but as one piece of evidence along with the second read
and read-behind agreement to make decisions about retraining and dismissing raters.
MI has amassed a large, longitudinal dataset of rater performance data from years of Smarter Balanced
handscoring. In spring 2019, we launched an enhanced accuracy monitoring system drawing on these data.
This system used validity responses, calibrated to fit a unidimensional item response theory (IRT) model

Idaho Standards Achievement Tests in English Language Arts and Mathematics
2018–2019 Technical Report
131 American Institutes for Research
for each content area/item type. Calibrating validity responses allows us to prioritize them (using
correlations and fit statistics) such that those responses that provide the greatest information about rater
accuracy are distributed to raters first. MI runs nightly analyses to evaluate performance during scoring.
Empirically-determined cut points are used to classify raters into performance tiers based on recent validity
and inter-rater reliability (IRR). A rater with unacceptable performance initially receives feedback and
additional monitoring in the form of increased read-behinds. If performance does not improve quickly, the
rater is assigned an assessment composed of validity responses, the results of which determine whether the
rater may continue to score.
7.7.6 Rater Dismissal
When read-behinds or daily statistics identify a rater who cannot maintain acceptable agreement rates, the
rater is retrained and monitored by scoring leadership personnel. A rater may be released from the project
if retraining is unsuccessful. In these situations, all items scored by a rater during the timeframe in question
can be identified, reset, and released back into the scoring pool. The aberrant rater’s scores are deleted, and
the responses are redistributed to other qualified raters for rescoring.
7.7.7 Rater Agreement
The inter-rater reliability (IRR) is computed based on scorable responses (numeric scores) scored by two
independent raters only, excluding non-scorable responses (e.g., off-topic, off-purpose, or foreign-language
responses) that are scored by scoring leadership, not by two independent raters. The IRR is computed based
on the raters who scored student responses in Idaho.
In ELA/L, writing essay item responses (full-writes) are scored in three dimensions: convention (0–2
rubric), evidence/elaboration (1–4 rubric), and organization/purpose (1–4 rubric). The short-answer (SA)
items are scored in 0–2. Mathematics SA items are scored using 0–1, 0–2, or 0–3 rubrics.
Tables 88–90 provide a summary of the IRR based on items with a sample size greater than 50. The inter-
rater reliability is presented with average of %exact agreement, minimum and maximum %exact
agreements, combined %exact and %adjacent agreement, and quadratic weighted Kappa (QWK).
Table 88. ELA/L Rater Agreements for Short-Answer Items (Grades 3–11)
Grade # of Items %Exact %(Exact+
Adjacent) QWK
Average Min Max
3 12 77.84 68.67 87.43 100 0.75
4 15 75.86 67.76 83.01 100 0.76
5 16 72.06 62.24 81.94 100 0.75
6 35 73.63 59.04 88.73 100 0.69
7 37 73.44 62.14 87.32 100 0.70
8 38 74.48 60.58 89.44 100 0.72
9–11 77 74.49 57.79 98.18 100 0.74

Idaho Standards Achievement Tests in English Language Arts and Mathematics
2018–2019 Technical Report
132 American Institutes for Research
Table 89. ELA/L Rater Agreements for Full-Write Items (Grades 3–11)
Grade Dimensions # of
Items
%Exact %(Exact+
Adjacent) QWK
Average Min Max Conventions 19 68.80 57.14 75.19 99.44 0.62
3 Evid/Elab 19 72.31 57.39 80.17 99.14 0.68 Org/Purp 19 72.01 58.77 78.63 99.10 0.68 Conventions 22 66.80 56.88 75.73 98.72 0.60
4 Evid/Elab 22 65.90 55.29 73.48 98.46 0.64 Org/Purp 22 66.39 56.47 75.81 98.76 0.67 Conventions 25 66.75 60.18 74.63 99.81 0.54
5 Evid/Elab 25 62.22 57.02 68.38 98.58 0.66 Org/Purp 25 64.50 58.41 70.99 98.77 0.68 Conventions 19 73.75 65.68 81.10 98.75 0.60
6 Evid/Elab 19 66.02 56.44 74.56 98.66 0.66 Org/Purp 19 65.70 56.44 72.99 98.72 0.66 Conventions 24 73.37 60.43 84.96 99.58 0.60
7 Evid/Elab 24 66.94 55.74 76.56 98.99 0.68 Org/Purp 24 67.07 54.10 76.69 98.86 0.68
8
Conventions 25 75.86 67.69 85.71 98.93 0.57
Evid/Elab 25 68.28 57.46 76.30 98.96 0.72
Org/Purp 25 68.18 58.96 75.61 99.12 0.72
Conventions 28 75.48 66.43 82.01 99.13 0.65
9–11 Evid/Elab 28 72.43 63.77 79.14 99.39 0.76
Org/Purp 28 72.38 64.29 80.58 99.52 0.75
Legend: Evid/Elab: Evidence/Elaboration; Org/Purp: Organization/Purpose

Idaho Standards Achievement Tests in English Language Arts and Mathematics
2018–2019 Technical Report
133 American Institutes for Research
Table 90. Mathematics Rater Agreements (Grades 3–11)
Grade Score
Points
# of
Items
%Exact %(Exact+
Adjacent) QWK
Average Min Max
3 1 10 91.23 82.72 97.96 100 0.80
4 1 11 87.52 80.54 96.62 100 0.69
5 1 5 90.90 87.70 97.31 100 0.64
6 1 12 98.22 96.49 100 100 0.90
7 1 8 96.98 93.12 99.28 100 0.78
8 1 15 92.06 84.62 100 100 0.81
9–11 1 16 92.16 84.88 100 100 0.71
3 2 29 89.93 68.62 98.91 100 0.91
4 2 41 88.59 71.81 99.33 100 0.88
5 2 51 88.50 77.01 97.83 100 0.87
6 2 41 89.67 77.92 97.78 100 0.88
7 2 25 89.90 80.63 95.14 100 0.86
8 2 26 90.13 82.11 100 100 0.88
9–11 2 22 91.57 75.88 100 100 0.88
3 3 6 92.61 89.45 95.54 100 0.97
4 3 4 88.74 87.76 89.33 100 0.95
5 3 8 87.26 82.20 97.80 100 0.90
7 3 1 78.61 78.61 78.61 100 0.82
9–11 3 7 87.79 75.81 91.20 100 0.91

Idaho Standards Achievement Tests in English Language Arts and Mathematics
2018–2019 Technical Report
134 American Institutes for Research
8. REPORTING AND INTERPRETING SCORES
The Online Reporting System (ORS) generates a set of online score reports that includes the information
describing student performance for students, parents, educators, and other stakeholders. The online score
reports are produced immediately after students complete tests and the tests are handscored. Because the
score reports on students’ performance are updated each time that students complete tests and they are
handscored, authorized users (e.g., school principals, teachers) can have quickly available information on
students’ performance on the tests and use it to improve student learning. In addition to individual students
‘score reports, the ORS also produces aggregate score reports by class, school, district, and state. The timely
accessibility of aggregate score reports could help users monitor students’ performance in each subject by
grade area, evaluate the effectiveness of instructional strategies, and inform the adoption of strategies to
improve student learning and teaching during the school year. Additionally, the ORS provides participation
data that help monitor student participation rates.
This section contains a description of the types of scores reported in the ORS and a description of the ways
to interpret and use these scores in detail.
8.1 ONLINE REPORTING SYSTEM FOR STUDENTS AND EDUCATORS
8.1.1 Types of Online Score Reports
The ORS is designed to help educators and students answer questions about how well students have
performed on ELA/L and mathematics assessments. The ORS is the online tool that provides educators and
other stakeholders with timely, relevant score reports. The ORS for the Smarter Balanced assessments has
been designed with stakeholders, who are not technical measurement experts, in mind in order to make
score reports easy to read. This is achieved by using simple language so that users can quickly understand
assessment results and make inferences about student achievement. The ORS is also designed to present
student performance in a uniform format. For example, similar colors are used for groups of similar
elements, such as achievement levels, throughout the design. This design strategy allows readers to compare
similar elements and to avoid comparing dissimilar elements.
Once authorized users log in to the ORS and select “Score Reports,” the online score reports are presented
hierarchically. The ORS starts by presenting summaries on student performance by subject and grade at a
selected aggregate level. To view student performance for a specific aggregate unit, users can select the
specific aggregate unit from a drop-down list of aggregate units (e.g., schools within a district, or teachers
within a school). For more detailed student assessment results for a school, a teacher, or a roster, users can
select the subject and grade on the online score reports. Additionally, when authorized state-level users log
in to the ORS and select “State at a Glance,” the ORS generates a summary of student performance data
for a test across the entire state.
Generally, the ORS provides two categories of online score reports: (1) aggregate score reports, and (2)
student score reports. Table 91 summarizes the types of online score reports available at the aggregate level
and the individual student level. Detailed information about the online score reports and instructions on
how to navigate the online score reporting system can be found in the Online Reporting System User Guide,
located via a help button on the ORS.

Idaho Standards Achievement Tests in English Language Arts and Mathematics
2018–2019 Technical Report
135 American Institutes for Research
Table 91. Types of Online Score Reports by Level of Aggregation
Level of
Aggregation Types of Online Score Reports
State
District
School
Teacher
Roster
• Number of students tested and percentage of students with Level 3 or 4 (for overall
students and by subgroup)
• Average scale score and standard error of average scale score (for overall students and
by subgroup)
• Percentage of students at each achievement level on the overall test and by claims (for
overall students and by subgroup)
• Achievement performance level in each target (for overall students)1
• Participation rate (for overall students)2
• On-demand student roster report
Student
• Total scale score and standard error of measurement
• Achievement level on overall and claim scores with achievement-level descriptors
• Average scale scores and standard errors of average scale scores for student’s school,
district, and state
• Student growth in scale score and achievement level over time
• Writing performance descriptors and scores by dimensions
Note: 1: Performance category in each target is provided for all aggregate levels except for state. 2: Participation rate reports are provided at the state, district, and school levels.
Aggregate score reports at a selected aggregate level are provided for overall students and by subgroup.
Users can see student assessment results by any of the subgroups. Table 92 presents the types of subgroup
and subgroup categories provided in ORS.
Table 92. Types of Subgroups
Subgroup Subgroup Category
Gender Female
Male
Special Education Status Yes
No
Limited English Proficiency
(LEP) Status
Yes
No
LEP Category* L1, LE, EW, X1, X2, X3, X4, FL, SO
Section 504 Status Yes
No
Race/Ethnicity
American Indian or Alaska Native
Asian
Black or African American
Hispanic or Latino Ethnicity
Native Hawaiian or Other Pacific Islander
White
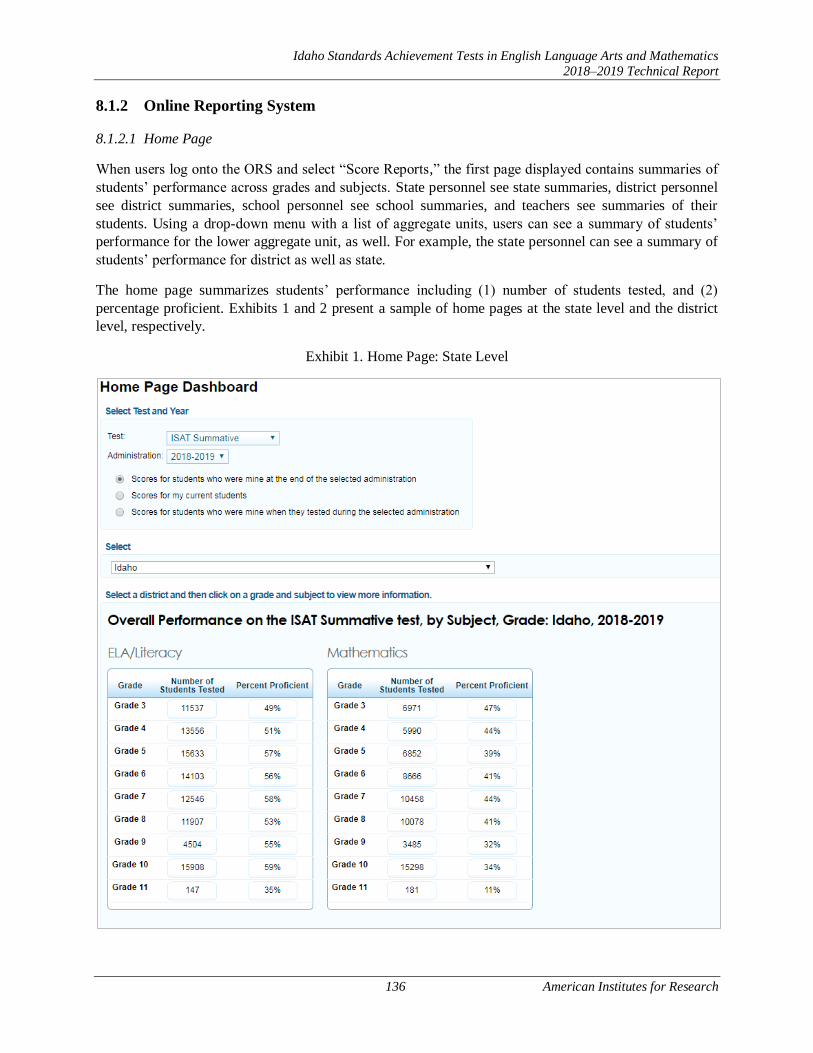
Idaho Standards Achievement Tests in English Language Arts and Mathematics
2018–2019 Technical Report
136 American Institutes for Research
8.1.2 Online Reporting System
8.1.2.1 Home Page
When users log onto the ORS and select “Score Reports,” the first page displayed contains summaries of
students’ performance across grades and subjects. State personnel see state summaries, district personnel
see district summaries, school personnel see school summaries, and teachers see summaries of their
students. Using a drop-down menu with a list of aggregate units, users can see a summary of students’
performance for the lower aggregate unit, as well. For example, the state personnel can see a summary of
students’ performance for district as well as state.
The home page summarizes students’ performance including (1) number of students tested, and (2)
percentage proficient. Exhibits 1 and 2 present a sample of home pages at the state level and the district
level, respectively.
Exhibit 1. Home Page: State Level

Idaho Standards Achievement Tests in English Language Arts and Mathematics
2018–2019 Technical Report
137 American Institutes for Research
Exhibit 2. Home Page: District Level
8.1.2.2 Subject Detail Page
More detailed summaries of student performance in each grade on a subject area for a selected aggregate
level are presented when users select a grade within a subject on the home page. On each aggregate report,
the summary report presents the summary results for the selected aggregate unit as well as the summary
results for the state and the aggregate unit above the selected aggregate. For example, if a school is selected
on the subject detail page, the summary results of the state and the district of the school are provided above
the school summary results, as well, so that the school performance can be compared with the above-
aggregate levels.
The subject detail page provides the aggregate summaries on a specific subject area including: (1) number
of students tested, (2) average scale score and standard error associated with the average scale score, (3)
percentage of students at Level 3 or above, and (4) percentage of students in each achievement level. The
summaries are also presented for overall students and by subgroup. Exhibit 3 presents an example of subject
detail pages for ELA/L at the district level when a user selects a subgroup of gender.

Idaho Standards Achievement Tests in English Language Arts and Mathematics
2018–2019 Technical Report
138 American Institutes for Research
Exhibit 3. Subject Detail Page for ELA/L by Gender: District Level
8.1.2.3 Claim Detail Page
The claim detail page provides the aggregate summaries on student performance in each claim for a
particular grade and subject. The aggregate summaries on the claim detail page include: (1) number of
students tested, (2) average scale score and standard error associated with the average scale score, (3)
percentage proficient, and (4) percentage of students in each claim performance category.
As with the subject detail page, the summary report presents the summary results for the selected aggregate
unit as well as the summary results for the state and the aggregate unit above the selected aggregate. Also,
the summaries on claim-level performance can be presented for overall students and by subgroup. Exhibit
4 presents an example of claim detail page for mathematics at the district level when a user selects a
subgroup of LEP status.
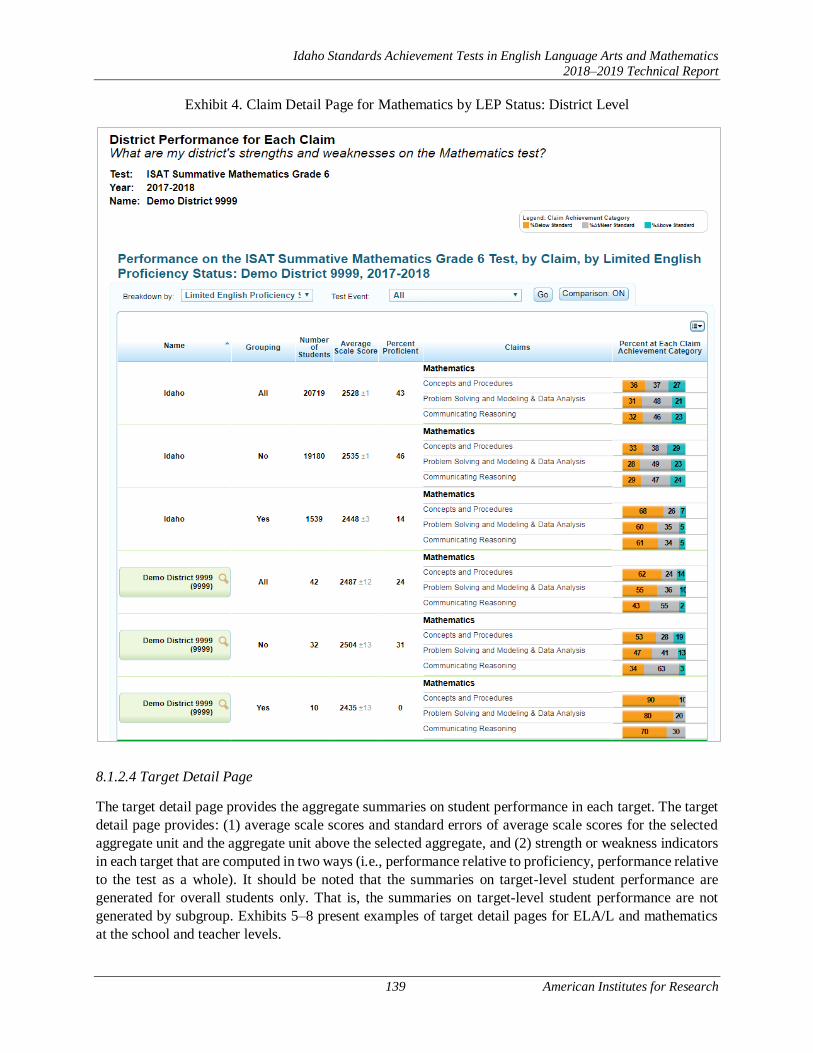
Idaho Standards Achievement Tests in English Language Arts and Mathematics
2018–2019 Technical Report
139 American Institutes for Research
Exhibit 4. Claim Detail Page for Mathematics by LEP Status: District Level
8.1.2.4 Target Detail Page
The target detail page provides the aggregate summaries on student performance in each target. The target
detail page provides: (1) average scale scores and standard errors of average scale scores for the selected
aggregate unit and the aggregate unit above the selected aggregate, and (2) strength or weakness indicators
in each target that are computed in two ways (i.e., performance relative to proficiency, performance relative
to the test as a whole). It should be noted that the summaries on target-level student performance are
generated for overall students only. That is, the summaries on target-level student performance are not
generated by subgroup. Exhibits 5–8 present examples of target detail pages for ELA/L and mathematics
at the school and teacher levels.
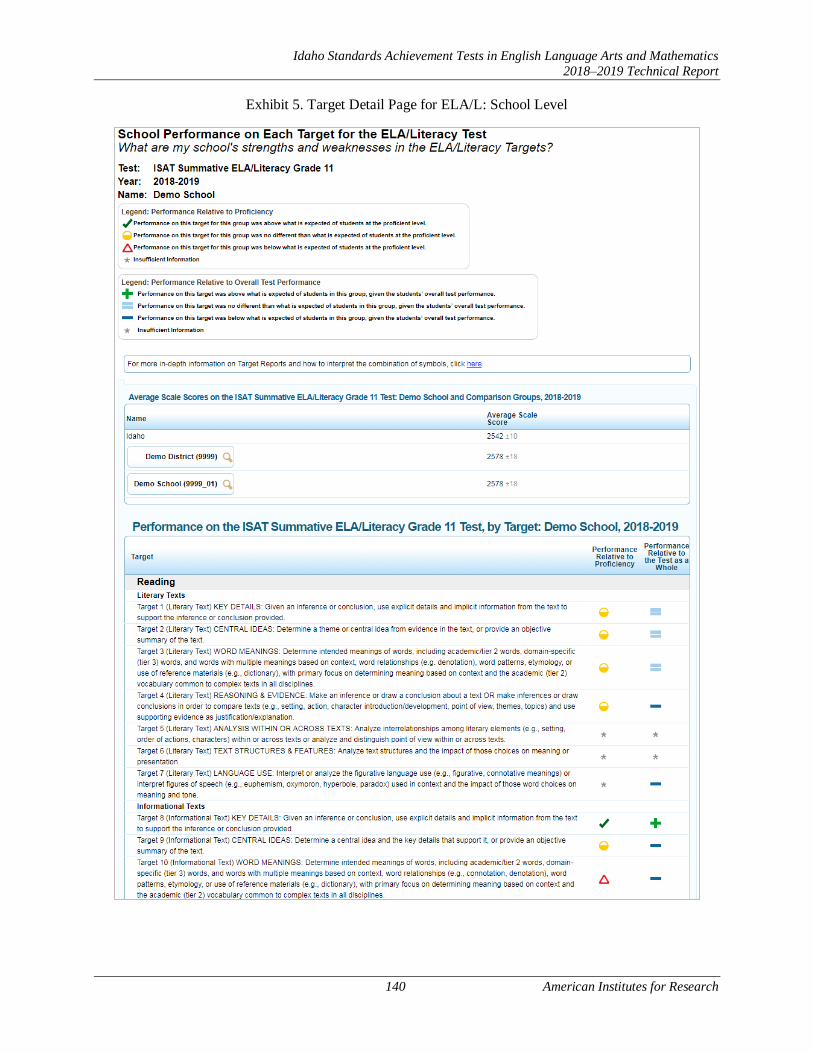
Idaho Standards Achievement Tests in English Language Arts and Mathematics
2018–2019 Technical Report
140 American Institutes for Research
Exhibit 5. Target Detail Page for ELA/L: School Level
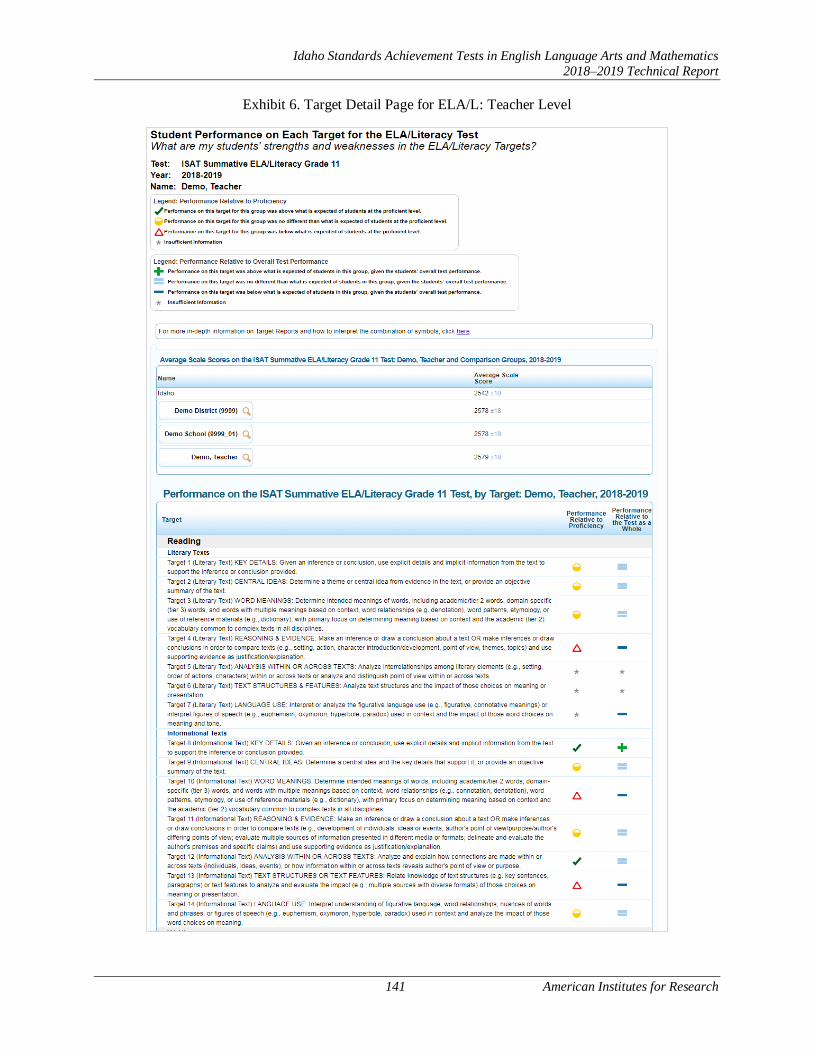
Idaho Standards Achievement Tests in English Language Arts and Mathematics
2018–2019 Technical Report
141 American Institutes for Research
Exhibit 6. Target Detail Page for ELA/L: Teacher Level
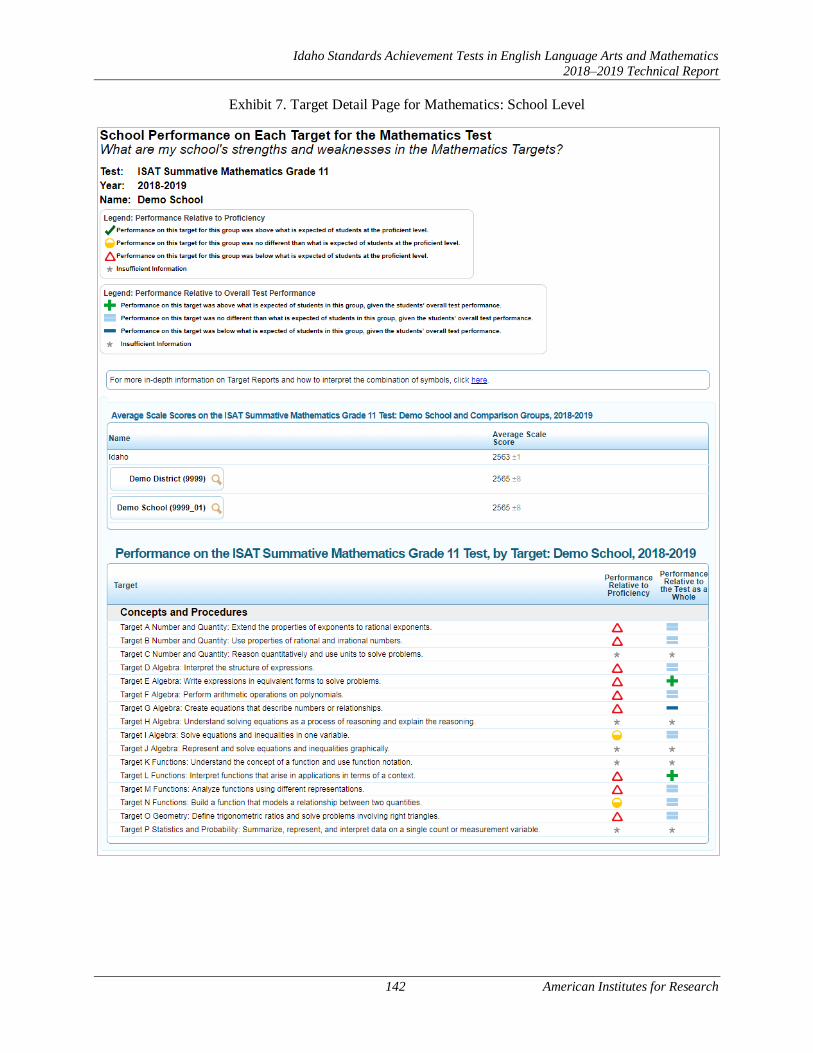
Idaho Standards Achievement Tests in English Language Arts and Mathematics
2018–2019 Technical Report
142 American Institutes for Research
Exhibit 7. Target Detail Page for Mathematics: School Level

Idaho Standards Achievement Tests in English Language Arts and Mathematics
2018–2019 Technical Report
143 American Institutes for Research
Exhibit 8. Target Detail Page for Mathematics: Teacher Level

Idaho Standards Achievement Tests in English Language Arts and Mathematics
2018–2019 Technical Report
144 American Institutes for Research
8.1.2.5 Trend Report Page
The trend (i.e., longitudinal) page provides the trend of student performance for an aggregate (e.g., state,
district, and school) over time. The trend report can be set to plot either average scale scores or percentages
of proficient students on the graph for the selected aggregate unit. In addition, the trend report can be plotted
by demographic subgroup. Exhibit 9 presents an example of trend report pages for mathematics at the
district level.
Exhibit 9. Trend Report for Mathematics: District Level
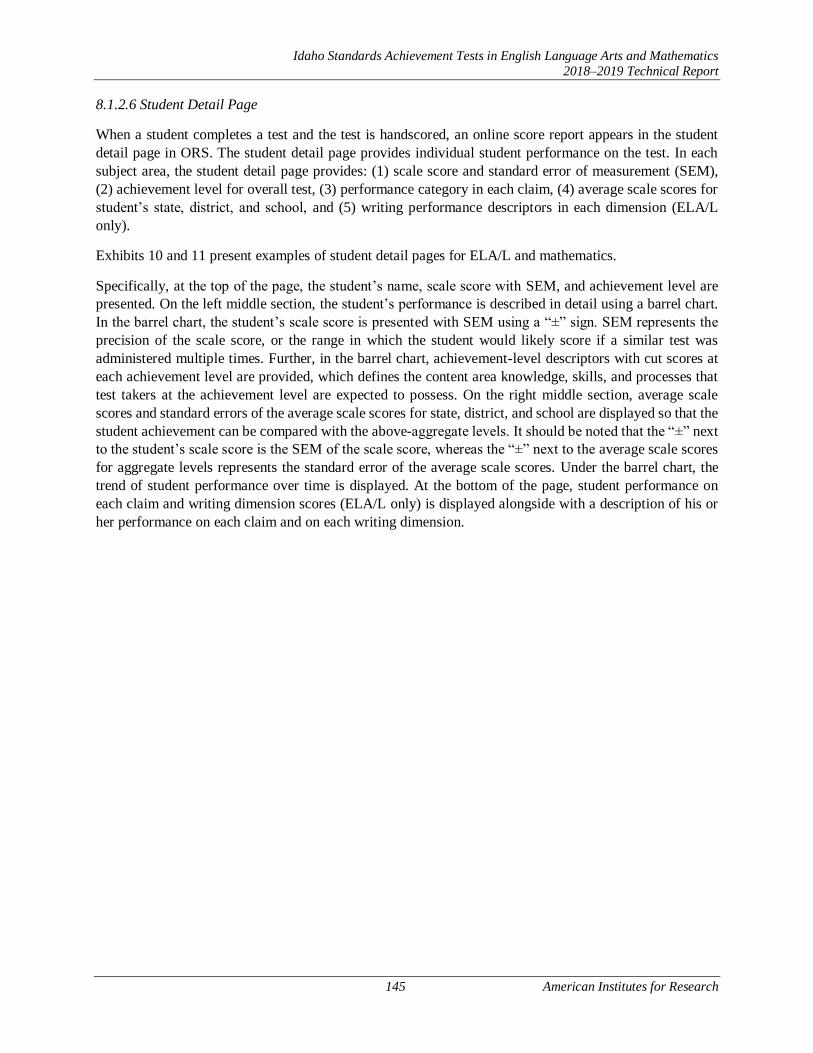
Idaho Standards Achievement Tests in English Language Arts and Mathematics
2018–2019 Technical Report
145 American Institutes for Research
8.1.2.6 Student Detail Page
When a student completes a test and the test is handscored, an online score report appears in the student
detail page in ORS. The student detail page provides individual student performance on the test. In each
subject area, the student detail page provides: (1) scale score and standard error of measurement (SEM),
(2) achievement level for overall test, (3) performance category in each claim, (4) average scale scores for
student’s state, district, and school, and (5) writing performance descriptors in each dimension (ELA/L
only).
Exhibits 10 and 11 present examples of student detail pages for ELA/L and mathematics.
Specifically, at the top of the page, the student’s name, scale score with SEM, and achievement level are
presented. On the left middle section, the student’s performance is described in detail using a barrel chart.
In the barrel chart, the student’s scale score is presented with SEM using a “±” sign. SEM represents the
precision of the scale score, or the range in which the student would likely score if a similar test was
administered multiple times. Further, in the barrel chart, achievement-level descriptors with cut scores at
each achievement level are provided, which defines the content area knowledge, skills, and processes that
test takers at the achievement level are expected to possess. On the right middle section, average scale
scores and standard errors of the average scale scores for state, district, and school are displayed so that the
student achievement can be compared with the above-aggregate levels. It should be noted that the “±” next
to the student’s scale score is the SEM of the scale score, whereas the “±” next to the average scale scores
for aggregate levels represents the standard error of the average scale scores. Under the barrel chart, the
trend of student performance over time is displayed. At the bottom of the page, student performance on
each claim and writing dimension scores (ELA/L only) is displayed alongside with a description of his or
her performance on each claim and on each writing dimension.

Idaho Standards Achievement Tests in English Language Arts and Mathematics
2018–2019 Technical Report
146 American Institutes for Research
Exhibit 10. Student Detail Page for ELA/L
Idaho Standards Achievement Tests in English Language Arts and Mathematics
2018–2019 Technical Report
147 American Institutes for Research
Exhibit 11. Student Detail Page for Mathematics

Idaho Standards Achievement Tests in English Language Arts and Mathematics
2018–2019 Technical Report
148 American Institutes for Research
8.1.2.6 Participation Rate
In addition to online score reports, the ORS provides participation rate reports for the districts and schools
to help monitor student participation rate. Participation data are updated each time a student completes tests
and the test is handscored. Included in the participation table are: (1) the number and percentage of students
who are tested and not tested, and (2) the percentage proficient. Exhibit 12 presents a sample of the
participation rate report at the district level.
Exhibit 12. Participation Rate Report at District Level

Idaho Standards Achievement Tests in English Language Arts and Mathematics
2018–2019 Technical Report
149 American Institutes for Research
8.1.2.7 State-Level Summary
The ORS provides a State at a Glance page for authorized state-level users to track student performance for
a test across the entire state. Users can specify the test and administration year to display in the report.
Exhibit 13 presents a sample of state-level summary for ELA/L.
Exhibit 13. State at a Glance ELA/L

Idaho Standards Achievement Tests in English Language Arts and Mathematics
2018–2019 Technical Report
150 American Institutes for Research
8.2 INTERPRETATION OF REPORTED SCORES
A student’s performance on a test is reported on a scale score, an achievement level for the overall test, and
an achievement level for each claim. Students’ scores and achievement levels are also summarized at the
aggregate levels. The next section provides a description about how to interpret these scores.
8.2.1 Scale Score
A scale score is used to describe how well a student performed on a test and can be interpreted as an estimate
of the students’ knowledge and skills measured. The scale score is the transformed score from a theta score,
which is estimated based on mathematical models. Low scale scores can be interpreted to mean that the
student does not possess sufficient knowledge and skills measured by the test. Conversely, high scale scores
can be interpreted to mean that the student has proficient knowledge and skills measured by the test. Scale
scores can be used to measure student growth across school years. Interpretation of scale scores is more
meaningful when the scale scores are used along with achievement levels and achievement-level
descriptors.
8.2.2 Standard Error of Measurement
A scale score (observed score on any test) is an estimate of the true score. If a student takes a similar test
multiple times, the resulting scale score will vary across administrations, sometimes being a little higher, a
little lower, or the same. The standard error of measurement (SEM) represents the precision of the scale
score, or the range in which the student would likely score if a similar test was administered multiple times.
When interpreting scale scores, it is recommended to consider the range of scale scores incorporating the
SEM of the scale score.
The “±” next to the student’s scale score provides information about the certainty, or confidence, of the
score’s interpretation. The boundaries of the score band are one SEM above and below the student’s
observed scale score, representing a range of score values that is likely to contain the true score. For
example, 2680 ± 10 indicates that if a student was tested again, it is likely that the student would receive a
score between 2670 and 2690. The SEM can be different for the same scale score, depending on how closely
the administered items match the student’s ability.
8.2.3 Achievement Level
Achievement levels are proficiency categories on a test that students fall into based on their scale scores.
For the Smarter Balanced assessments, scale scores are mapped into four achievement levels (i.e., Level 1,
Level 2, Level 3, and Level 4) using three achievement standards (i.e., cut scores). Achievement-level
descriptors are a description of content area knowledge and skills that test takers at each achievement level
are expected to possess. Thus, achievement levels can be interpreted based on achievement-level
descriptors. For the achievement level in ELA/L, for instance, achievement-level descriptors are described
for grade 6 Level 3 as: “The student has met the achievement standard and demonstrates progress toward
mastery of the knowledge and skills in English language arts/literacy needed for likely success in entry-
level credit-bearing college coursework after high school.” Generally, students performing at Levels 3 and
4 on Smarter Balanced tests are considered to be on track to demonstrate progress toward mastery of the
knowledge and skills necessary for college and career readiness.

Idaho Standards Achievement Tests in English Language Arts and Mathematics
2018–2019 Technical Report
151 American Institutes for Research
8.2.4 Performance Category for Claims
Students’ performance on each claim is reported in three categories: (1) Below Standard, (2) At/Near
Standard, and (3) Above Standard. Unlike the achievement level for overall test, student performance on
each of claims is evaluated with respect to the “Meets Standard” achievement standard. For students
performing at either “Below Standard” or “Above Standard,” this can be interpreted to mean that their
performance is clearly below or above the “Meets Standard” cut score for a specific claim. For students
performing at “At/Near Standard,” this can be interpreted to mean that the students’ performance does not
provide enough information to tell whether students reached the “Meets Standard” mark for the specific
claim.
8.2.5 Performance Category for Targets
In addition to the claim level reports, teachers and educators ask for additional reports on student
performance for instructional needs. Target-level reports are produced for the aggregate units only, not for
individual students, because each student is administered with too few items in a target to produce a reliable
score for each target.
Target reports are produced for each target within a claim. AIR reports two types of relative strength and
weakness scores for each target within a claim. The strengths and weaknesses reports are generated for
aggregate units of classroom, school, and district and provide information about how a group of students in
a class, school, or district performed on each target, either relative to their performance on the test as a
whole or relative to the proficiency cut set by Smarter Balanced. Specifically, for target performance
relative to the test as a whole, students’ observed performance on items within the reporting element is
compared with expected performance based on the overall ability estimate. At the aggregate level, when
observed performance within a target is greater than expected performance, then the reporting unit (e.g.,
roster, teacher, school, or district) shows a relative strength in that target. Conversely, when observed
performance within a target is below the level expected based on overall achievement, then the reporting
unit shows a relative weakness in that target.
For target performance relative to proficiency, students’ observed performance on items within the
reporting element is compared with proficiency cut (e.g., Achievement Level 3 cut). At the aggregate level,
when observed performance within a target is greater than the proficiency cut, the reporting unit shows a
relative strength in that target. Conversely, when observed performance within a target is below the
proficiency cut, the reporting unit shows a relative weakness in that target.
The performance on target shows how a group of students performed on each target either relative to their
overall subject performance on a test or relative to proficiency standard. The performance on target is
mapped into three performance categories: (1) better than performance on the test as a whole (higher than
expected) or relative to proficiency standard, (2) similar to performance on the test as a whole or relative to
proficiency standard, and (3) worse than performance on the test as a whole (lower than expected) or relative
to proficiency standard. “Worse than performance on the test as a whole” does not imply a lack of
achievement. Instead, it can be interpreted to mean that student performance on that target was below their
performance across all other targets put together. Although performance categories for targets provide some
evidence to help address students’ strengths and weaknesses, they should not be over-interpreted because
student performance on each target is based on relatively few items, especially for a small group.

Idaho Standards Achievement Tests in English Language Arts and Mathematics
2018–2019 Technical Report
152 American Institutes for Research
8.2.6 Aggregated Score
Students’ scale scores are aggregated at roster, teacher, school, district, and state levels to represent how a
group of students performs on a test. When students’ scale scores are aggregated, the aggregated scale
scores can be interpreted as an estimate of knowledge and skills that a group of students possesses. Given
that student scale scores are estimates, the aggregated scale scores are also estimates and are subject to
measures of uncertainty. In addition to the aggregated scale scores, the percentage of students in each
achievement level for overall and by claim are reported at the aggregate level to represent how well a group
of students performs for overall and by claim.
8.3 APPROPRIATE USES FOR SCORES AND REPORTS
Assessment results can be used to provide information on individual students’ achievement on the test.
Overall, assessment results show what students know and are able to do in certain subject areas. Further,
they give information on whether students are on track to demonstrate the knowledge and skills necessary
for college and their careers. Additionally, assessment results can be used to identify students’ relative
strengths and weaknesses in certain content areas. For example, performance categories for claims can be
used to identify an individual student’s relative strengths and weaknesses among claims within a content
area.
Assessment results on student achievement on the test can be used to help teachers or schools make
decisions on how to support students’ learning. Aggregate score reports for teacher and school level provide
information regarding the strengths and weaknesses of their students and can be utilized to improve teaching
and student learning. For example, a group of students performed very well in overall, but it could be
possible that they would not perform as well in several targets compared to their overall performance. In
this case, teachers or schools can identify strengths and weaknesses of their students through the group
performance by claim and target and promote instruction on specific claim or target areas that the group
performance is below their overall performance. Further, by narrowing down the student performance result
by subgroup, teachers and schools can determine what strategies may need to be implemented to improve
teaching and student learning particularly for students from disadvantaged subgroups. For example,
teachers can see student assessment results by LEP status and observe that LEP students are struggling with
literary response and analysis in reading. Teachers can then provide additional instructions for these
students to enhance their achievement in a specific target in a claim.
In addition, assessment results can be used to compare students’ performance among different students and
among different groups. Teachers can evaluate how their students perform compared with other students in
schools and districts for overall and by claim. Although all students are administered different sets of items
in each computer-adaptive test, scale scores are comparable across students. Furthermore, scale scores can
be used to measure the growth of individual students over time if data are available. In the Smarter Balanced
assessments, the scale scores across grades are on the same scale because the scores are vertically linked
across grades. Therefore, scale scores from one grade can be compared with the next grade (i.e., measuring
the growth).
While assessment results provide valuable information to understand students’ performance, these scores
and reports should be used with caution. It is important to note that scale scores reported are estimates of
true scores and hence do not represent the precise measure for student performance. A student’s scale score
is associated with measurement error and thus users need to consider measurement error when using student
scores to make decisions about student achievement. Moreover, although student scores may be used to
Idaho Standards Achievement Tests in English Language Arts and Mathematics
2018–2019 Technical Report
153 American Institutes for Research
help make important decisions about students’ placement and retention, or teachers’ instructional planning
and implementation, the assessment results should not be used as the only source of information. Given
that assessment results measured by a test provide limited information, other sources on student
achievement such as classroom assessment and teacher evaluation should be considered when making
decisions on student learning. Finally, when student performance is compared across groups, users need to
take into account the group size. The smaller the group size, the larger the measurement error related to
these aggregate data, thus requiring interpretation with more caution.

Idaho Standards Achievement Tests in English Language Arts and Mathematics
2018–2019 Technical Report
154 American Institutes for Research
9. QUALITY CONTROL PROCEDURE
Quality assurance (QA) procedures are enforced through all stages of the Smarter Balanced test
development, administration, and scoring and reporting of results. AIR implements a series of quality
control steps to ensure error-free production of score reports in both online and paper formats. The quality
of the information produced in the test delivery system (TDS) is tested thoroughly before, during, and after
the testing window opens.
9.1 ADAPTIVE TEST CONFIGURATION
For the CAT, a test configuration file is the key file that contains all specifications for the item selection
algorithm and the scoring algorithm, such as the test blueprint specification, slopes and intercepts for theta-
to-scale score transformation, cut scores, and the item information (e.g., answer keys, item attributes, item
parameters, and passage information). The accuracy of the information in the configuration file is checked
and confirmed numerous times independently by multiple staff members before the testing window opens.
To verify the accuracy of the scoring engine, we use simulated test administrations. The simulator generates
a sample of students with an ability distribution that matches that of the population (Smarter Balanced
Assessment Consortium states). The ability of each simulated student is used to generate a sequence of item
response scores consistent with the underlying ability distribution. These simulations provide a rigorous
test of the adaptive algorithm for adaptively administered tests and also provide a check of form
distributions (if administering multiple test forms) and test scores in fixed-form tests.
Simulations are generated using the production item selection and scoring engine to ensure that verification
of the scoring engine is based on a wide range of student response patterns. The results of simulated test
administrations are used to configure and evaluate the adequacy of the item selection algorithm used to
administer the Smarter Balanced summative assessments. The purpose of the simulations is to configure
the adaptive algorithm to optimize item selection to meet blueprint specifications while targeting test
information to student ability as well as check the score accuracy.
After the adaptive test simulations, another set of simulations for the combined tests (CAT component plus
a fixed-form PT component) are performed to check scores. The simulated data are used to check whether
the scoring specifications were applied accurately. The scores in the simulated data file are checked
independently, following the scoring rules specified in the scoring specifications.
9.1.1 Platform Review
AIR’s TDS supports a variety of item layouts. Each item goes through an extensive platform review on
different operating systems like Windows, Linux, and iOS to ensure that the item looks consistent in all of
them. Some of the layouts have the stimulus and item response options/response area displayed side by
side. In each of these layouts, both stimulus and response options have independent scroll bars.
Platform review is a process in which each item is checked to ensure that it is displayed appropriately on
each tested platform. A platform is a combination of a hardware device and an operating system. In recent
years, the number of platforms has proliferated, and platform review now takes place on various platforms
that are significantly different from one another.

Idaho Standards Achievement Tests in English Language Arts and Mathematics
2018–2019 Technical Report
155 American Institutes for Research
Platform review is conducted by a team. The team leader projects the item as it was web approved in the
Item Tracking System (ITS), and team members, each using a different platform, look at the same item to
see that it is rendered as expected.
9.1.2 User Acceptance Testing and Final Review
Before deployment, the testing system and content are deployed to a staging server where they are subject
to user acceptance testing (UAT). UAT of the TDS serves as both a software evaluation and content
approval role. The UAT period provides Idaho with an opportunity to interact with the exact test that the
students will use.
9.2 QUALITY ASSURANCE IN DOCUMENT PROCESSING
The Smarter Balanced assessments are administered primarily online; however, a few students took paper-
pencil assessments. When test documents are scanned, a quality control sample of documents consisting of
10 test cases per document type (normally between 500 and 600 documents) was created so that all possible
responses and all demographic grids are verified, including various typical errors that required editing via
MI’s Data Inspection, Correction, and Entry (DICE) application program. This structured method of testing
provided exact test parameters and a methodical way of determining that the output received from the
scanner(s) was correct. MI staff carefully compared the documents and the data file created from them to
further ensure that results from the scanner, editing process (validation and data correction), and transfer to
the AIR database are correct.
9.3 QUALITY ASSURANCE IN DATA PREPARATION
AIR’s test delivery system (TDS) has a real-time, built-in quality-monitoring component. After a test is
administered to a student, the TDS passes the resulting data to our Quality Assurance (QA) system. QA
conducts a series of data integrity checks, ensuring, for example, that the record for each test contains
information for each item, keys for multiple-choice items, score points in each item, and total number of
field-test items and operational items. QA ensures that the test record contains no data from items that have
been invalidated.
Data pass directly from the Quality Monitoring System (QMS) to the Database of Record (DoR), which
serves as the repository for all test information and from which all test information for reporting is pulled.
The Data Extract Generator (DEG) is the tool that is used to pull data from the DoR for delivery to the
SDE. AIR staff ensure that data in the extract files match the DoR before delivering to the SDE.
9.4 QUALITY ASSURANCE IN HANDSCORING
9.4.1 Double Scoring Rates, Agreement Rates, Validity Sets, and Ongoing Read-Behinds
MI’s scoring process is designed to employ a high level of quality control. All scoring activities are
conducted anonymously; at no time do scorers have access to the students’ demographic information.
MI’s Virtual Scoring Center (VSC) provides the infrastructure for extensive quality control procedures.
Through the VSC platform, project leadership can perform spot-checks (read-behinds) of each scorer to
evaluate scoring performance; provide feedback and respond to questions; deliver retraining and/or
recalibration items on demand and at regularly scheduled intervals; and prevent scorers from scoring live
responses in the event that they require additional monitoring.
Idaho Standards Achievement Tests in English Language Arts and Mathematics
2018–2019 Technical Report
156 American Institutes for Research
Once scoring is underway, quality results are achieved by consistent monitoring of each scorer. The scoring
director and team leaders read behind each scorer’s performance every day to ensure that he or she is on
target, and they conduct one-on-one retraining sessions when necessary. MI’s QA procedures allow scoring
staff to identify struggling scorers very early and begin retraining immediately.
If through read-behinds (or data monitoring) it becomes apparent that a scorer is experiencing difficulties,
he or she is given interactive feedback and mentoring on the responses that have been scored incorrectly,
and that scorer is expected to change the scores. Retraining is an ongoing process throughout the scoring
effort to ensure more accurate scoring. Daily analyses of the scorer status reports alert management
personnel to individual or group retraining needs.
In addition to using validity responses as a qualification threshold, other validity responses are presented
throughout scoring as ongoing quality checks. Validity responses can be pulled from approved existing
anchor or validity responses, but they also may be generated from live scoring and included in the pool
following review and approval by the Smarter Balanced Assessment Consortium. MI periodically
administers validity sets to each of MI’s scorers to monitor the scorer status. VSC is capable of dynamically
embedding calibration responses in scoring sets as individual items or in sets of whatever number of items
is preferred by the state.
With the VSC program, the way in which the student responses are presented prevents scorers from having
any knowledge about which responses are being single or double read, or which responses are validity set
responses.
9.4.2 Handscoring QA Monitoring Reports
MI generates detailed scorer status reports for each scoring project using a comprehensive system for
collecting and analyzing score data. The scores are validated and processed according to the specifications
set out by Smarter Balanced. This allows MI to manage the quality of the scorers and take any corrective
actions immediately. Updated real-time reports are available that show both daily and cumulative (project-
to-date) data. These reports are available to states 24 hours a day via a secure website. Project leadership
reviews these reports regularly. This mechanism allows project leadership to spot-check scores at any time
and offer feedback to ensure that each scorer is on target.
9.4.3 Monitoring by State Department of Education
The SDE also directly observes MI activities, virtually. MI provides virtual access to the training activities
through the online training interface. The SDE monitors the scoring process through the Client Command
Center (CCC), with access to view and run specific reports during the scoring process.
9.4.4 Identifying, Evaluating, and Informing the State on Alert Responses
MI implements a formal process for informing clients when student responses reflect a possibly dangerous
situation for the test taker. We also flag potential security breaches identified during scoring. For possible
dangerous situations, scoring project management and staff employ a set of alert procedures to notify the
client of responses indicating endangerment, abuse, or psychological and/or emotional difficulties.
This process is also used to notify each Consortium state of possible instances of teacher or proctor
interference or student collusion with others. The alert procedure is habitually explained during scorer
training sessions. Within the VSC system, if a scorer identifies a response which may require an alert, he

Idaho Standards Achievement Tests in English Language Arts and Mathematics
2018–2019 Technical Report
157 American Institutes for Research
or she flags or notes that response as a possible alert and transfers the image to the scoring manager. Scoring
management then decides if the response should be forwarded to the client for any necessary action or
follow-up.
9.5 QUALITY ASSURANCE IN TEST SCORING
To monitor the performance of the TDS during the test administration window, AIR statisticians examine
the delivery demands, including the number of tests to be delivered, the length of the window, and the
historic state-specific behaviors to model the likely peak loads. Using data from the load tests, these
calculations indicate the number of each type of server necessary to provide continuous, responsive service,
and AIR contracts for service in excess of this amount. Once deployed, our servers are monitored at the
hardware, operating system, and software platform levels with monitoring software that alerts our engineers
at the first signs that trouble may be ahead. The applications log not only errors and exceptions but also
item response time information for critical database calls. This information enables us to know instantly
whether the system is performing as designed or if it is starting to slow down or experience a problem. In
addition, item response time data are captured for each assessed student, such as data about how long it
takes to load, view, or respond to an item. All of this information is logged, enabling us to automatically
identify schools or districts experiencing unusual slowdowns, often before they even notice.
A series of quality assurance reports can also be generated at any time during the online assessment window,
such as blueprint match rate, item exposure rate, and item statistics, for early detection of any unexpected
issues. Any deviations from the expected outcome are flagged, investigated, and resolved. In addition to
these statistics, a cheating analysis report is produced to flag any unlikely patterns of behavior in a testing
session, as discussed in Section 2.7.
For example, an item statistics analysis report allows psychometricians to ensure that items are performing
as intended and serves as an empirical key check through the operational testing window. The item statistics
analysis report is used to monitor the performance of test items throughout the testing window and serves
as a key check for the early detection of potential problems with item scoring, including incorrect
designation of a keyed response or other scoring errors, as well as potential breaches of test security that
may be indicated by changes in the difficulty of test items. This report generates classical item analysis
indicators of difficulty and discrimination, including proportion correct and biserial/polyserial correlation.
The report is configurable and can be produced so that only items with statistics falling outside a specified
range are flagged for reporting or to generate reports based on all items in the pool.
For the CAT component, other reports such as blueprint match and item exposure reports allow
psychometricians to verify that test administrations conform to the simulation results. The QA reports can
be generated on any desired schedule. Item analysis and blueprint match reports are evaluated frequently at
the opening of the testing window to ensure that test administrations conform to blueprint, and items are
performing as anticipated.
Table 93 presents an overview of the QA reports.

Idaho Standards Achievement Tests in English Language Arts and Mathematics
2018–2019 Technical Report
158 American Institutes for Research
Table 93. Overview of Quality Assurance Reports
QA Reports Purpose Rationale
Item Statistics To confirm whether items work as
expected
Early detection of errors (key errors for selected-response items and
scoring errors for constructed-
response, performance-, or
technology-enhanced items)
Blueprint Match Rates To monitor unexpectedly low
blueprint match rates
Early detection of unexpected
blueprint match issue
Item Exposure Rates
To monitor unlikely high exposure
rates of items or passages or
unusually low item pool usage (high
unused items/passages)
Early detection of any oversight in the
blueprint specification
Cheating Analysis To monitor testing irregularities Early detection of testing irregularities
9.5.1 Score-Report Quality Check
In the 2018–2019 Smarter Balanced summative assessments, only online score reports were produced in
Idaho.
9.5.1.1 Online Report Quality Assurance
Scores for online assessments are assigned by automated systems in real time. For machine-scored portions
of assessments, the machine rubrics are created and reviewed along with the items, then validated and
finalized during rubric validation following field testing. The review process “locks down” the item and
rubric when the item is approved for web display (Web Approval). During operational testing, actual item
responses are compared with expected item responses (given the item response theory [IRT] parameters),
which can detect mis-keyed items, item score distribution, or other scoring problems. Potential issues are
automatically flagged in reports available to our psychometricians.
The handscoring processes include rigorous training, validity and reliability monitoring, and back-reading
to ensure accurate scoring. Handscored items are paired to the machine-scored items by our Test Integration
System (TIS). The integration is based on identifiers that are never separated from their data and are checked
by our quality assurance (QA) system. The integrated scores are sent to our test-scoring system, a mature,
well-tested real-time system that applies client-specific scoring rules and assigns scores from the calibrated
items, including calculating achievement-level indicators, subscale scores, and other features, which then
pass automatically to the reporting system and Database of Record (DoR). The scoring system is tested
extensively before deployment, including hand checks of scored tests and large-scale simulations to ensure
that point estimates and standard errors are correct.
Every test undergoes a series of validation checks. Once the QA system signs off, data are passed to the
DoR, which serves as the centralized location for all student scores and responses, ensuring that there is
only one place where the “official” record is stored. Only after scores have passed the QA checks and are
uploaded to the DoR are they passed to the Online Reporting System (ORS), which is responsible for
presenting individual-level results and calculating and presenting aggregate results. Absolutely no score is
reported in the ORS until it passes all of the QA system’s validation checks. All of the above processes take
milliseconds to complete; within less than a second of handscores being received by AIR and passing QA
validation checks, the composite score is available in the ORS.
Idaho Standards Achievement Tests in English Language Arts and Mathematics
2018–2019 Technical Report
159 American Institutes for Research
9.5.1.2 Paper Report Quality Assurance
Statistical Programming
The family reports contain custom programming and require rigorous quality assurance processes to ensure
their accuracy. All custom programming is guided by detailed and precise specifications in our reporting
specifications document. Upon approval of the specifications, analytic rules are programmed, and each
program is extensively tested on test decks and real data from other programs. The final programs are
reviewed by two senior statisticians and one senior programmer to ensure that they implement agreed-upon
procedures. Custom programming is implemented independently by two statistical programming teams
working from the specifications. Only when the output from both teams matches exactly are the scripts
released for production.
Much of the statistical processing is repeated, and AIR has implemented a structured software development
process to ensure that the repeated tasks are implemented correctly and identically each time. We write
small programs (called macros) that take specified data as input and produce data sets containing derived
variables as output. Approximately 30 such macros reside in our library for the score reports. Each macro
is extensively tested and stored in a central development server. Once a macro is tested and stored, changes
to the macro must be approved by the director of score reporting and the director of psychometrics, as well
as by the project directors for affected projects.
Each change is followed by a complete retesting with the entire collection of scenarios on which the macro
was originally tested. The main statistical program is mostly made up of calls to various macros, including
macros that verify the data and conversion tables and the macros that do the many complicated calculations.
This program is developed and tested using artificial data generated to test both typical and extreme cases.
In addition, the program goes through a rigorous code review by a senior statistician.
Display Programming
The paper report development process uses graphical programming, which takes place in a Xerox-
developed programming language called VIPP and allows virtually infinite control of the visual appearance
of the reports. After designers at AIR create backgrounds, our VIPP programmers write code that indicates
where to place all variable information (data, graphics, and text) on the reports. The VIPP code is tested
using both artificial and real data. AIR’s data generation utilities can read the output layout specifications
and generate artificial data for direct input into the VIPP programs. This allows the testing of these programs
to begin before the statistical programming is complete. In later stages, artificial data are generated
according to the input layout and run through the psychometric process and the score reporting statistical
programs, and the output is formatted as VIPP input. This enables us to test the entire system. Programmed
output goes through multiple stages of review and revision by graphics editors and the score reporting team
to ensure that design elements are accurately reproduced and data are correctly displayed. Once we receive
final data and VIPP programs, the AIR score reporting team reviews proofs that contain actual data based
on our standard quality assurance documentation.
In addition, we compare data independently calculated by AIR psychometricians with data on the reports.
A large sample of reports is reviewed by several AIR staff members to make sure that all data are correctly
placed on reports. This rigorous review typically is conducted over several days and takes place in a secure
location in the AIR building. All reports containing actual data are stored in a locked storage area. Before
printing the reports, AIR provides a live data file and individual student reports with sample districts for

Idaho Standards Achievement Tests in English Language Arts and Mathematics
2018–2019 Technical Report
160 American Institutes for Research
Idaho staff review. AIR will work closely with SDE to resolve questions and correct any problems. The
reports will not be delivered unless SDE approves the sample reports and data file.

Idaho Standards Achievement Tests in English Language Arts and Mathematics
2018–2019 Technical Report
161 American Institutes for Research
REFERENCES
American Educational Research Association, American Psychological Association, & National Council on
Measurement in Education. (2014). Standards for educational and psychological testing.
Washington, DC: American Educational Research Association.
Cohen, J. & Albright, L. (2014). Smarter Balanced adaptive item selection algorithm design report.
Washington, DC: American Institutes for Research.
Drasgow, F., Levine, M.V., & Williams, E.A. (1985). Appropriateness measurement with polychotomous
item response models and standardized indices. British Journal of Mathematical and Statistical
Psychology, 38(1), 67–86.
Guo, F. (2006). Expected Classification Accuracy Using the Latent Distribution. Practical Assessment,
Research & Evaluation, 11(6).
Huynh, H. (1976). On the reliability of decisions in domain-referenced testing, Journal of Educational
Measurement, 13(4), 253–264.
Livingston, S. A., & Lewis, C. (1995). Estimating the consistency and accuracy of classifications based on
test scores. Journal of Educational Measurement, 32(2), 179–197.
Livingston, S. A., & Wingersky, M. S. (1979). Assessing the reliability of tests used to make pass/fail
decisions. Journal of Educational Measurement, 16(4), 247–260.
Snijders, T. A. B. (2001). Asymptotic null distribution of person fit statistics with estimated person
parameter. Psychometrika 66(3), 331–342.
Sotaridona, L. S., Pornel, J. B., & Vallejo, A. (2003). Some applications of item response theory to testing.
The Philippine Statistician 52(1–4), 81–92.
Subkoviak, M. J. (1976). Estimating reliability from a single administration of a criterion-referenced test.
Journal of Educational Measurement, 13(4), 265–276.
U.S. Department of Education (2015). Peer Review of State Assessment Systems: Non-Regulatory Guidance
for States. Washington, D.C.: https://www2.ed.gov/policy/elsec/guid/assessguid15.pdf

Idaho Standards Achievement Tests in English Language Arts and Mathematics
2018–2019 Technical Report
162 American Institutes for Research
APPENDICES

Idaho Standards Achievement Tests in English Language Arts and Mathematics
2018–2019 Technical Report
163 American Institutes for Research
Appendix A: Summary of the 2018–2019 Interim Assessments
The Interim Comprehensive Assessments (ICA) were fixed-form tests for each grade and subject. Most
students took the ICA once, but some students took it multiple times. Table A-1 presents the number of
students who took the ICA by the number of attempts. Total number of tests indicate the total ICA tests
taken by the total number of students, counting multiple attempts as multiple tests. For example, if a student
took ICA twice, the number of tests for this student is counted twice. Table A-2 summarizes student
performance on ICA for all tests taken, including the average and the standard deviation of scale scores,
the percentage of students in each achievement level, and the percentage of proficient students.
Table A-1. Number of Students Who Took ICAs (Grades 3–8 and 11)
Grade
Number of Students by Number of Attempts Total
Number of
Tests Taken Once Twice Three
Times Four
Times Five
Times
Total
Number of
Students
ELA/L
3 1,190 222 4 0 0 1,416 1,646
4 784 117 1 0 0 902 1,021
5 1,116 79 0 0 0 1,195 1,274
6 719 34 0 0 0 753 787
7 728 40 0 0 0 768 808
8 735 28 0 0 0 763 791
11 348 28 0 0 0 376 404
Mathematics
3 1,034 96 0 0 0 1,130 1,226
4 818 62 0 0 0 880 942
5 919 87 0 0 0 1,006 1,093
6 1,091 50 1 0 0 1,142 1,194
7 1,248 67 0 0 0 1,315 1,382
8 999 85 0 0 0 1,084 1,169
11 525 2 0 0 0 527 529
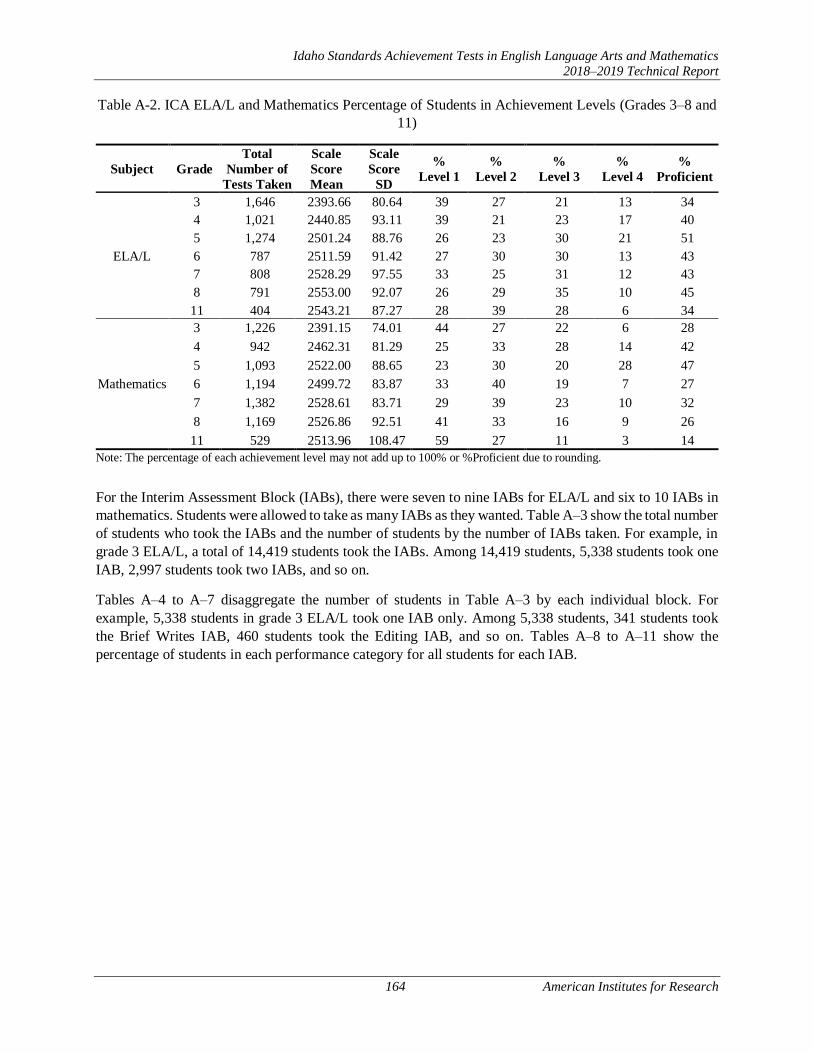
Idaho Standards Achievement Tests in English Language Arts and Mathematics
2018–2019 Technical Report
164 American Institutes for Research
Table A-2. ICA ELA/L and Mathematics Percentage of Students in Achievement Levels (Grades 3–8 and
11)
Subject Grade
Total
Number of
Tests Taken
Scale
Score
Mean
Scale
Score
SD
%
Level 1
%
Level 2
%
Level 3
%
Level 4
%
Proficient
ELA/L
3 1,646 2393.66 80.64 39 27 21 13 34
4 1,021 2440.85 93.11 39 21 23 17 40
5 1,274 2501.24 88.76 26 23 30 21 51
6 787 2511.59 91.42 27 30 30 13 43
7 808 2528.29 97.55 33 25 31 12 43
8 791 2553.00 92.07 26 29 35 10 45
11 404 2543.21 87.27 28 39 28 6 34
Mathematics
3 1,226 2391.15 74.01 44 27 22 6 28
4 942 2462.31 81.29 25 33 28 14 42
5 1,093 2522.00 88.65 23 30 20 28 47
6 1,194 2499.72 83.87 33 40 19 7 27
7 1,382 2528.61 83.71 29 39 23 10 32
8 1,169 2526.86 92.51 41 33 16 9 26
11 529 2513.96 108.47 59 27 11 3 14
Note: The percentage of each achievement level may not add up to 100% or %Proficient due to rounding.
For the Interim Assessment Block (IABs), there were seven to nine IABs for ELA/L and six to 10 IABs in
mathematics. Students were allowed to take as many IABs as they wanted. Table A–3 show the total number
of students who took the IABs and the number of students by the number of IABs taken. For example, in
grade 3 ELA/L, a total of 14,419 students took the IABs. Among 14,419 students, 5,338 students took one
IAB, 2,997 students took two IABs, and so on.
Tables A–4 to A–7 disaggregate the number of students in Table A–3 by each individual block. For
example, 5,338 students in grade 3 ELA/L took one IAB only. Among 5,338 students, 341 students took
the Brief Writes IAB, 460 students took the Editing IAB, and so on. Tables A–8 to A–11 show the
percentage of students in each performance category for all students for each IAB.
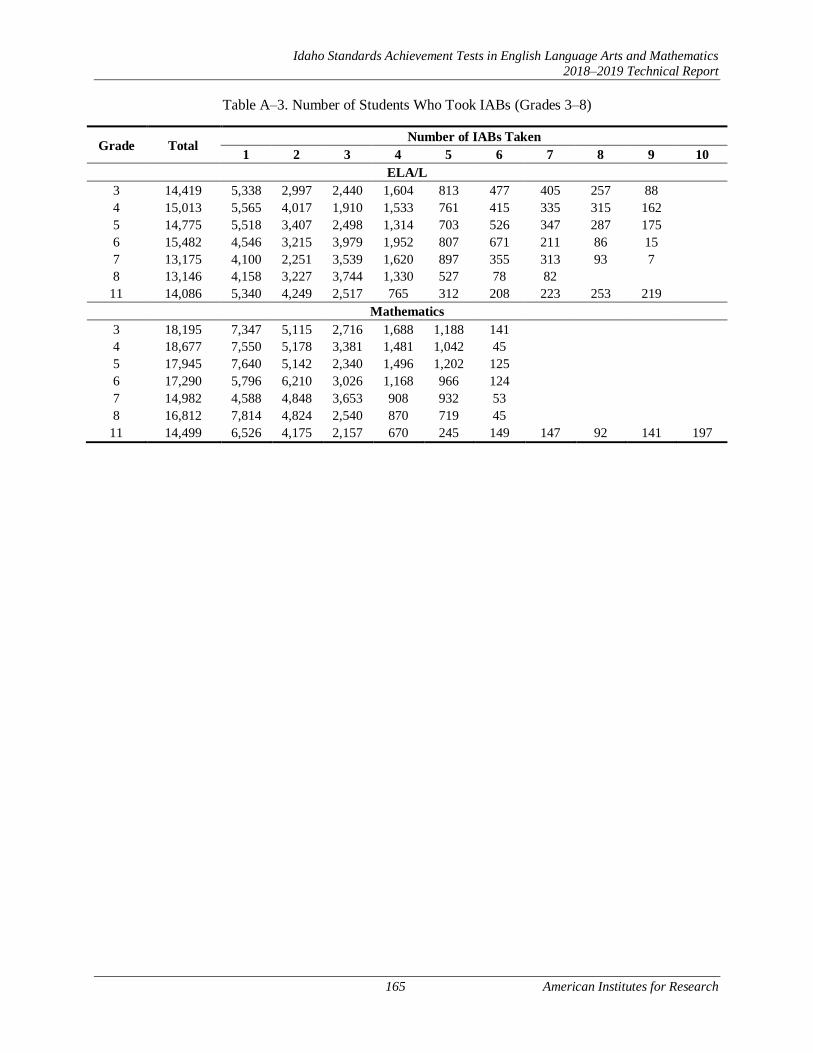
Idaho Standards Achievement Tests in English Language Arts and Mathematics
2018–2019 Technical Report
165 American Institutes for Research
Table A–3. Number of Students Who Took IABs (Grades 3–8)
Grade Total Number of IABs Taken
1 2 3 4 5 6 7 8 9 10
ELA/L
3 14,419 5,338 2,997 2,440 1,604 813 477 405 257 88
4 15,013 5,565 4,017 1,910 1,533 761 415 335 315 162
5 14,775 5,518 3,407 2,498 1,314 703 526 347 287 175
6 15,482 4,546 3,215 3,979 1,952 807 671 211 86 15
7 13,175 4,100 2,251 3,539 1,620 897 355 313 93 7
8 13,146 4,158 3,227 3,744 1,330 527 78 82
11 14,086 5,340 4,249 2,517 765 312 208 223 253 219
Mathematics
3 18,195 7,347 5,115 2,716 1,688 1,188 141
4 18,677 7,550 5,178 3,381 1,481 1,042 45
5 17,945 7,640 5,142 2,340 1,496 1,202 125
6 17,290 5,796 6,210 3,026 1,168 966 124
7 14,982 4,588 4,848 3,653 908 932 53
8 16,812 7,814 4,824 2,540 870 719 45
11 14,499 6,526 4,175 2,157 670 245 149 147 92 141 197
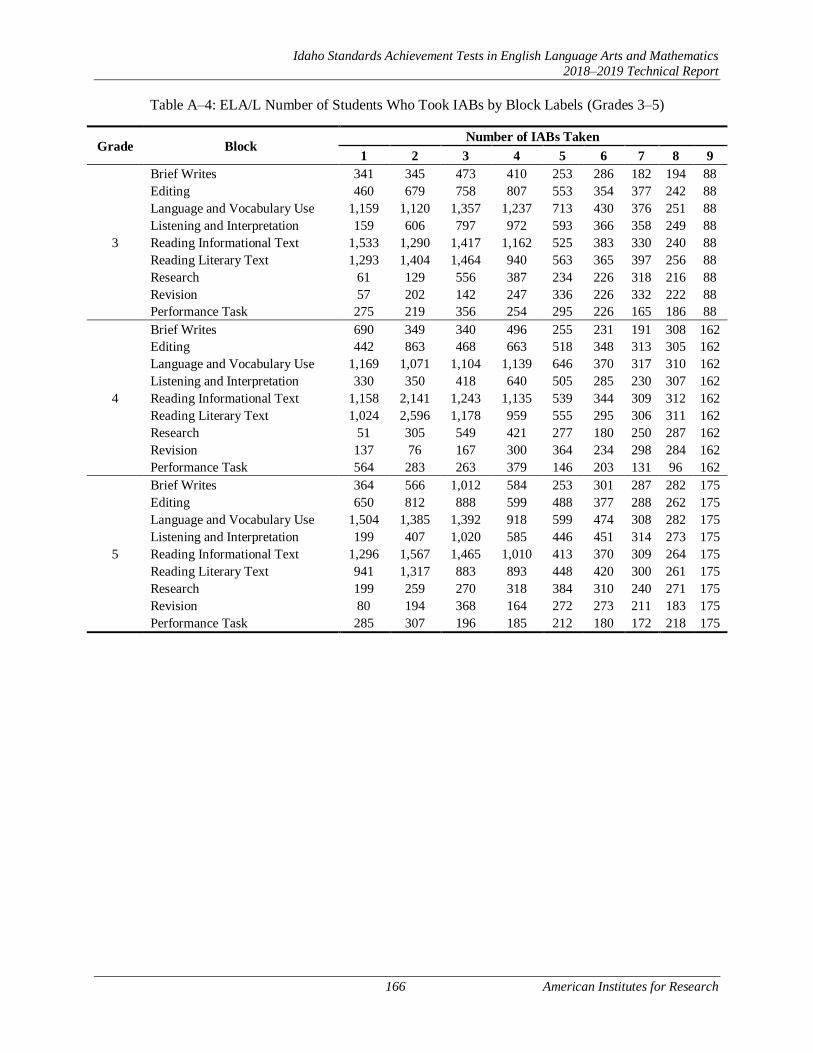
Idaho Standards Achievement Tests in English Language Arts and Mathematics
2018–2019 Technical Report
166 American Institutes for Research
Table A–4: ELA/L Number of Students Who Took IABs by Block Labels (Grades 3–5)
Grade Block Number of IABs Taken
1 2 3 4 5 6 7 8 9
3
Brief Writes 341 345 473 410 253 286 182 194 88
Editing 460 679 758 807 553 354 377 242 88
Language and Vocabulary Use 1,159 1,120 1,357 1,237 713 430 376 251 88
Listening and Interpretation 159 606 797 972 593 366 358 249 88
Reading Informational Text 1,533 1,290 1,417 1,162 525 383 330 240 88
Reading Literary Text 1,293 1,404 1,464 940 563 365 397 256 88
Research 61 129 556 387 234 226 318 216 88
Revision 57 202 142 247 336 226 332 222 88
Performance Task 275 219 356 254 295 226 165 186 88
4
Brief Writes 690 349 340 496 255 231 191 308 162
Editing 442 863 468 663 518 348 313 305 162
Language and Vocabulary Use 1,169 1,071 1,104 1,139 646 370 317 310 162
Listening and Interpretation 330 350 418 640 505 285 230 307 162
Reading Informational Text 1,158 2,141 1,243 1,135 539 344 309 312 162
Reading Literary Text 1,024 2,596 1,178 959 555 295 306 311 162
Research 51 305 549 421 277 180 250 287 162
Revision 137 76 167 300 364 234 298 284 162
Performance Task 564 283 263 379 146 203 131 96 162
5
Brief Writes 364 566 1,012 584 253 301 287 282 175
Editing 650 812 888 599 488 377 288 262 175
Language and Vocabulary Use 1,504 1,385 1,392 918 599 474 308 282 175
Listening and Interpretation 199 407 1,020 585 446 451 314 273 175
Reading Informational Text 1,296 1,567 1,465 1,010 413 370 309 264 175
Reading Literary Text 941 1,317 883 893 448 420 300 261 175
Research 199 259 270 318 384 310 240 271 175
Revision 80 194 368 164 272 273 211 183 175
Performance Task 285 307 196 185 212 180 172 218 175
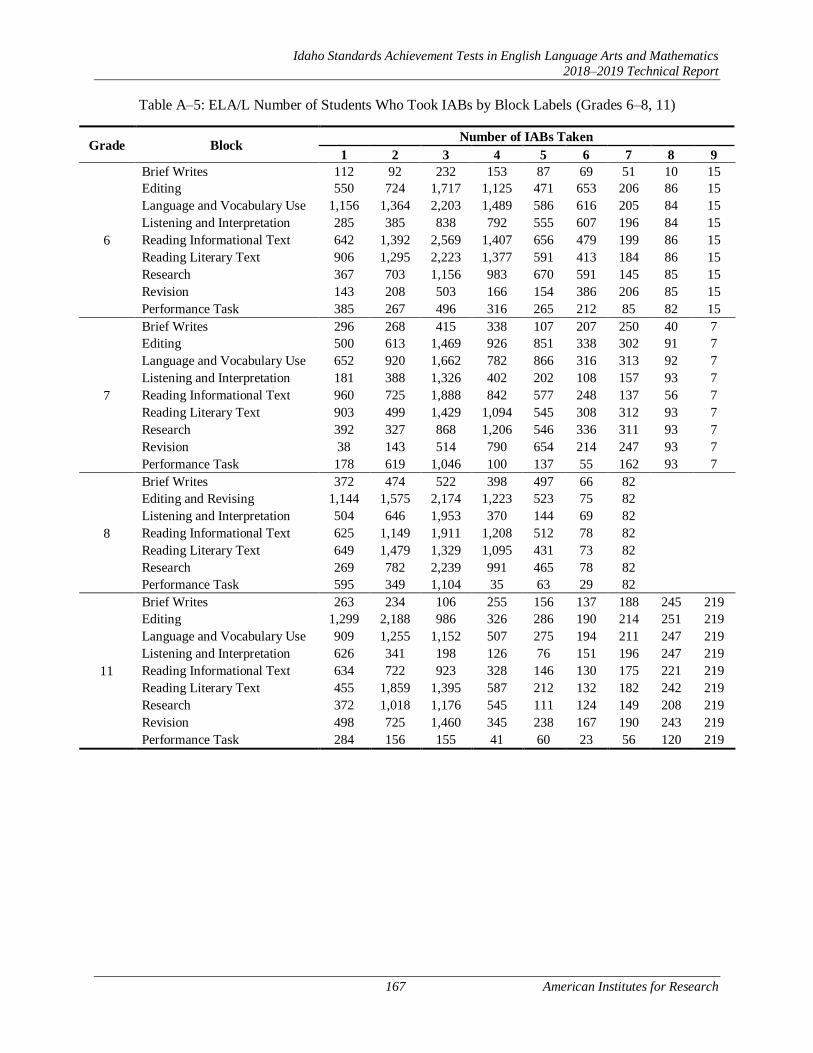
Idaho Standards Achievement Tests in English Language Arts and Mathematics
2018–2019 Technical Report
167 American Institutes for Research
Table A–5: ELA/L Number of Students Who Took IABs by Block Labels (Grades 6–8, 11)
Grade Block Number of IABs Taken
1 2 3 4 5 6 7 8 9
6
Brief Writes 112 92 232 153 87 69 51 10 15
Editing 550 724 1,717 1,125 471 653 206 86 15
Language and Vocabulary Use 1,156 1,364 2,203 1,489 586 616 205 84 15
Listening and Interpretation 285 385 838 792 555 607 196 84 15
Reading Informational Text 642 1,392 2,569 1,407 656 479 199 86 15
Reading Literary Text 906 1,295 2,223 1,377 591 413 184 86 15
Research 367 703 1,156 983 670 591 145 85 15
Revision 143 208 503 166 154 386 206 85 15
Performance Task 385 267 496 316 265 212 85 82 15
7
Brief Writes 296 268 415 338 107 207 250 40 7
Editing 500 613 1,469 926 851 338 302 91 7
Language and Vocabulary Use 652 920 1,662 782 866 316 313 92 7
Listening and Interpretation 181 388 1,326 402 202 108 157 93 7
Reading Informational Text 960 725 1,888 842 577 248 137 56 7
Reading Literary Text 903 499 1,429 1,094 545 308 312 93 7
Research 392 327 868 1,206 546 336 311 93 7
Revision 38 143 514 790 654 214 247 93 7
Performance Task 178 619 1,046 100 137 55 162 93 7
8
Brief Writes 372 474 522 398 497 66 82
Editing and Revising 1,144 1,575 2,174 1,223 523 75 82
Listening and Interpretation 504 646 1,953 370 144 69 82
Reading Informational Text 625 1,149 1,911 1,208 512 78 82
Reading Literary Text 649 1,479 1,329 1,095 431 73 82
Research 269 782 2,239 991 465 78 82
Performance Task 595 349 1,104 35 63 29 82
11
Brief Writes 263 234 106 255 156 137 188 245 219
Editing 1,299 2,188 986 326 286 190 214 251 219
Language and Vocabulary Use 909 1,255 1,152 507 275 194 211 247 219
Listening and Interpretation 626 341 198 126 76 151 196 247 219
Reading Informational Text 634 722 923 328 146 130 175 221 219
Reading Literary Text 455 1,859 1,395 587 212 132 182 242 219
Research 372 1,018 1,176 545 111 124 149 208 219
Revision 498 725 1,460 345 238 167 190 243 219
Performance Task 284 156 155 41 60 23 56 120 219

Idaho Standards Achievement Tests in English Language Arts and Mathematics
2018–2019 Technical Report
168 American Institutes for Research
Table A–6: Mathematics Number of Students Who Took IABs by Block Labels (Grades 3–8)
Grade Block Number of IABs Taken
1 2 3 4 5 6
3
Geometry 125 527 828 960 1,150 141
Measurement and Data 557 861 1,107 1,285 1,186 141
Number and Operations in Base Ten 2,258 2,784 1,954 1,475 1,184 141
Number and Operations – Fractions 405 2,086 1,826 1,409 1,180 141
Operational and Algebraic Thinking 3,998 3,967 2,389 1,548 1,187 141
Performance Task 4 5 44 75 53 141
4
Geometry 436 839 986 1,085 1,038 45
Measurement and Data 165 682 721 734 1,035 45
Number and Operations in Base Ten 3,613 3,536 3,112 1,408 1,042 45
Number and Operations – Fractions 1,888 2,906 2,599 1,366 1,041 45
Operational and Algebraic Thinking 1,386 2,365 2,661 1,221 1,040 45
Performance Task 62 28 64 110 14 45
5
Geometry 441 706 782 933 1,195 125
Measurement and Data 232 628 978 1,071 1,173 125
Number and Operations in Base Ten 3,725 3,455 2,001 1,449 1,199 125
Number and Operations – Fractions 2,847 4,069 1,901 1,419 1,202 125
Operations and Algebraic Thinking 373 1,367 1,276 1,062 1,184 125
Performance Task 22 59 82 50 57 125
6
Expressions and Equations 961 2,024 2,147 983 966 124
Geometry 246 852 1,167 656 956 124
Number System 2,888 5,045 2,936 1,120 965 124
Ratios and Proportional
Relationships 1,551 3,638 1,983 1,070 965 124
Statistics and Probability 120 756 321 795 953 124
Performance Task 30 105 524 48 25 124
7
Expressions and Equations 799 2,265 2,439 880 932 53
Geometry 177 517 1,020 473 930 53
Number System 2,142 3,830 3,514 779 932 53
Ratios and Proportional
Relationships 1,336 2,600 2,366 823 931 53
Statistics and Probability 83 355 828 578 921 53
Performance Task 51 129 792 99 14 53
8
Expressions and Equations I 2,364 2,805 2,241 835 719 45
Expressions and Equations II 1,354 1,879 1,327 605 717 45
Functions 2,928 2,629 1,659 733 719 45
Geometry 648 722 1,033 556 707 45
Number System 497 986 1,334 732 708 45
Performance Task 23 627 26 19 25 45

Idaho Standards Achievement Tests in English Language Arts and Mathematics
2018–2019 Technical Report
169 American Institutes for Research
Table A–7: Mathematics Number of Students Who Took IABs by Block Labels (Grade 11)
Grade Block Number of IABs Taken
1 2 3 4 5 6 7 8 9 10
11
Algebra – Linear Functions 3,600 3,249 1,498 516 207 137 136 79 125 197
Algebra – Quadratic Functions 561 1,267 1,328 352 175 123 130 83 129 197
Geometry – Congruence 697 686 471 251 118 63 63 86 140 197
GMD 15 159 160 148 129 81 105 87 137 197
GRTR 341 248 637 332 82 95 114 80 141 197
Interpreting Functions 143 1,215 268 249 181 127 139 68 140 197
Number and Quantity 366 689 886 310 129 102 124 76 133 197
SSE 687 418 684 340 119 98 130 87 136 197
Statistics and Probability 49 333 458 154 56 59 67 67 125 197
Performance Task 67 86 81 28 29 9 21 23 63 197
Note: The percentage of each performance category may not add up to 100% due to rounding. GRTR; Geometry – Measurement and Modeling, GMD; Geometry – Measurement and Modeling, SSE; Seeing Structure in Expressions and Polynomial Expressions
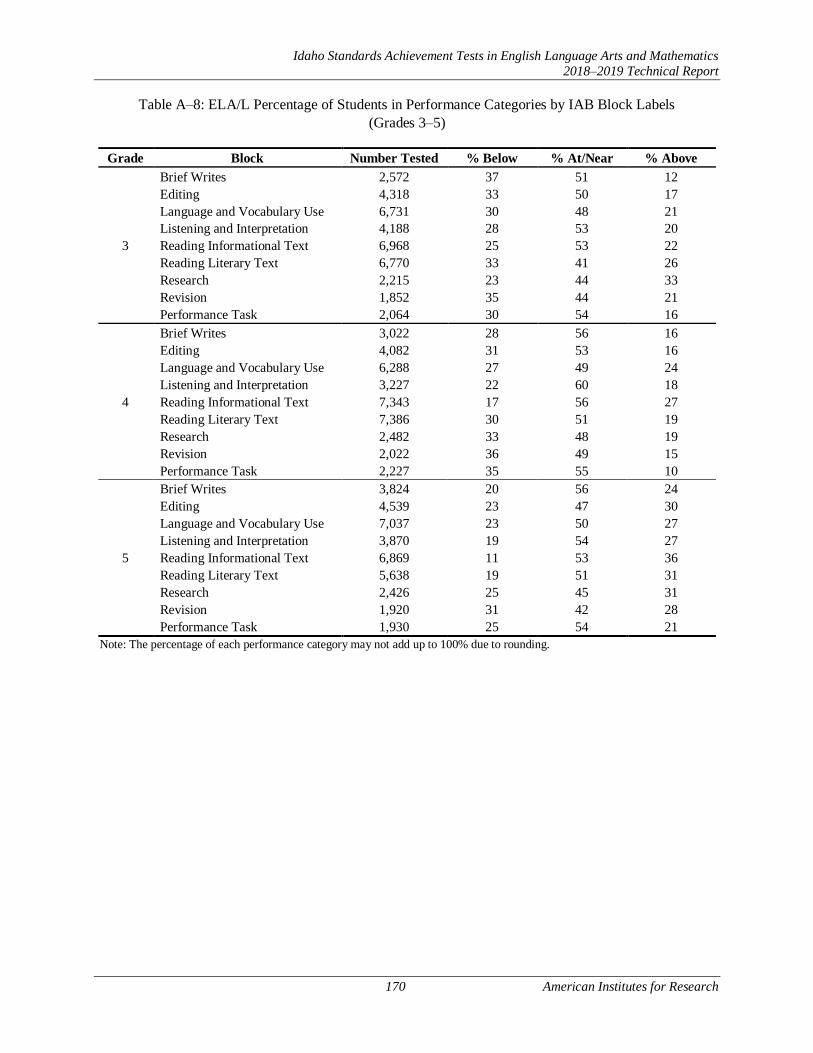
Idaho Standards Achievement Tests in English Language Arts and Mathematics
2018–2019 Technical Report
170 American Institutes for Research
Table A–8: ELA/L Percentage of Students in Performance Categories by IAB Block Labels
(Grades 3–5)
Grade Block Number Tested % Below % At/Near % Above
3
Brief Writes 2,572 37 51 12
Editing 4,318 33 50 17
Language and Vocabulary Use 6,731 30 48 21
Listening and Interpretation 4,188 28 53 20
Reading Informational Text 6,968 25 53 22
Reading Literary Text 6,770 33 41 26
Research 2,215 23 44 33
Revision 1,852 35 44 21
Performance Task 2,064 30 54 16
4
Brief Writes 3,022 28 56 16
Editing 4,082 31 53 16
Language and Vocabulary Use 6,288 27 49 24
Listening and Interpretation 3,227 22 60 18
Reading Informational Text 7,343 17 56 27
Reading Literary Text 7,386 30 51 19
Research 2,482 33 48 19
Revision 2,022 36 49 15
Performance Task 2,227 35 55 10
5
Brief Writes 3,824 20 56 24
Editing 4,539 23 47 30
Language and Vocabulary Use 7,037 23 50 27
Listening and Interpretation 3,870 19 54 27
Reading Informational Text 6,869 11 53 36
Reading Literary Text 5,638 19 51 31
Research 2,426 25 45 31
Revision 1,920 31 42 28
Performance Task 1,930 25 54 21
Note: The percentage of each performance category may not add up to 100% due to rounding.
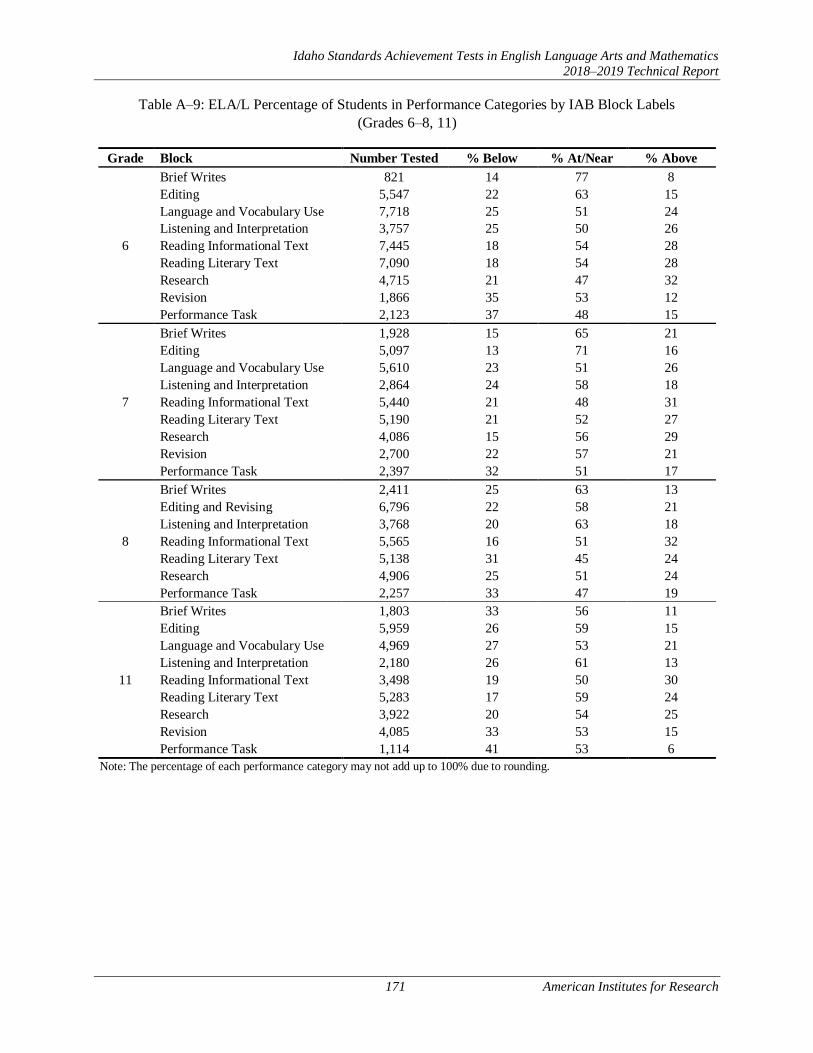
Idaho Standards Achievement Tests in English Language Arts and Mathematics
2018–2019 Technical Report
171 American Institutes for Research
Table A–9: ELA/L Percentage of Students in Performance Categories by IAB Block Labels
(Grades 6–8, 11)
Grade Block Number Tested % Below % At/Near % Above
6
Brief Writes 821 14 77 8
Editing 5,547 22 63 15
Language and Vocabulary Use 7,718 25 51 24
Listening and Interpretation 3,757 25 50 26
Reading Informational Text 7,445 18 54 28
Reading Literary Text 7,090 18 54 28
Research 4,715 21 47 32
Revision 1,866 35 53 12
Performance Task 2,123 37 48 15
7
Brief Writes 1,928 15 65 21
Editing 5,097 13 71 16
Language and Vocabulary Use 5,610 23 51 26
Listening and Interpretation 2,864 24 58 18
Reading Informational Text 5,440 21 48 31
Reading Literary Text 5,190 21 52 27
Research 4,086 15 56 29
Revision 2,700 22 57 21
Performance Task 2,397 32 51 17
8
Brief Writes 2,411 25 63 13
Editing and Revising 6,796 22 58 21
Listening and Interpretation 3,768 20 63 18
Reading Informational Text 5,565 16 51 32
Reading Literary Text 5,138 31 45 24
Research 4,906 25 51 24
Performance Task 2,257 33 47 19
11
Brief Writes 1,803 33 56 11
Editing 5,959 26 59 15
Language and Vocabulary Use 4,969 27 53 21
Listening and Interpretation 2,180 26 61 13
Reading Informational Text 3,498 19 50 30
Reading Literary Text 5,283 17 59 24
Research 3,922 20 54 25
Revision 4,085 33 53 15
Performance Task 1,114 41 53 6
Note: The percentage of each performance category may not add up to 100% due to rounding.

Idaho Standards Achievement Tests in English Language Arts and Mathematics
2018–2019 Technical Report
172 American Institutes for Research
Table A–10: Mathematics Percentage of Students in Performance Categories by IAB Block Labels
(Grades 3–5)
Grade Block Number Tested % Below % At/Near % Above
3
Geometry 3,731 30 51 20
Measurement and Data 5,137 31 43 26
Number and Operations in Base Ten 9,796 33 39 28
Number and Operations – Fractions 7,047 22 49 30
Operational and Algebraic Thinking 13,230 40 43 17
Performance Task 322 22 49 29
4
Geometry 4,429 11 69 21
Measurement and Data 3,382 21 52 26
Number and Operations in Base Ten 12,756 30 47 23
Number and Operations – Fractions 9,845 40 40 21
Operational and Algebraic Thinking 8,718 40 45 15
Performance Task 323 15 63 22
5
Geometry 4,182 35 49 17
Measurement and Data 4,207 33 43 24
Number and Operations in Base Ten 11,954 32 46 23
Number and Operations – Fractions 11,563 37 43 20
Operations and Algebraic Thinking 5,387 29 47 24
Performance Task 395 16 39 46
Note: The percentage of each performance category may not add up to 100% due to rounding.

Idaho Standards Achievement Tests in English Language Arts and Mathematics
2018–2019 Technical Report
173 American Institutes for Research
Table A–11: Mathematics Percentage of Students in Performance Categories by IAB Block Labels
(Grades 6–8, 11)
Grade Block Number
Tested
% Below % At/Near % Above
6
Expressions and Equations 7,205 30 44 25
Geometry 4,001 28 42 29
Number System 13,078 35 45 20
Ratios and Proportional Relationships 9,331 45 34 21
Statistics and Probability 3,069 18 69 12
Performance Task 856 49 49 2
7
Expressions and Equations 7,368 26 47 27
Geometry 3,170 21 62 17
Number System 11,250 26 53 21
Ratios and Proportional Relationships 8,109 22 56 22
Statistics and Probability 2,818 26 56 17
Performance Task 1,138 33 55 12
8
Expressions and Equations I 9,009 33 52 14
Expressions and Equations II 5,927 35 50 14
Functions 8,713 43 40 17
Geometry 3,711 36 48 16
Number System 4,302 38 39 23
Performance Task 765 52 44 3
11
Algebra – Linear Functions 9,744 59 34 7
Algebra – Quadratic Functions 4,345 34 57 9
Geometry – Congruence 2,772 14 70 16
Geometry – Measurement and Modeling 1,218 24 72 4
Geometry – Right Triangles and Trigonometric Ratios 2,267 41 37 22
Interpreting Functions 2,727 40 49 11
Number and Quantity 3,012 42 48 10
Seeing Structure in Expressions and Polynomial Expressions 2,896 60 31 8
Statistics and Probability 1,565 33 58 9
Performance Task 604 48 50 2
Note: The percentage of each performance category may not add up to 100% due to rounding.
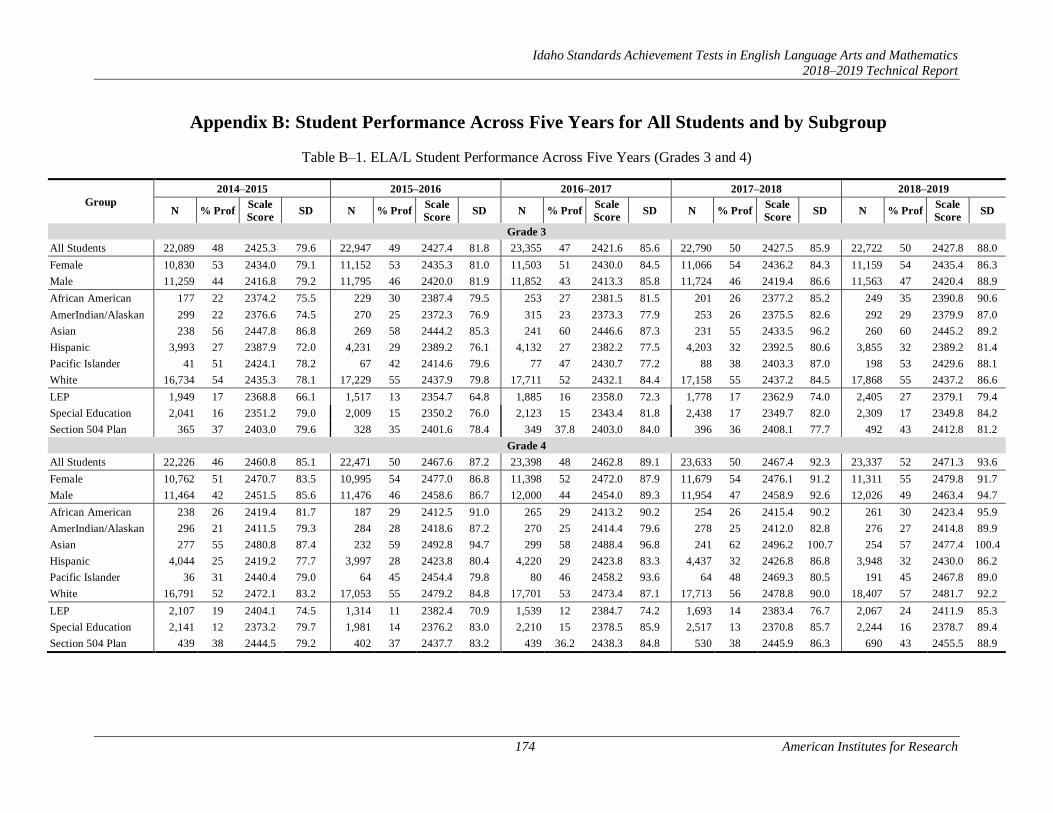
Idaho Standards Achievement Tests in English Language Arts and Mathematics
2018–2019 Technical Report
174 American Institutes for Research
Appendix B: Student Performance Across Five Years for All Students and by Subgroup
Table B–1. ELA/L Student Performance Across Five Years (Grades 3 and 4)
Group
2014–2015 2015–2016 2016–2017 2017–2018 2018–2019
N % Prof Scale
Score SD N % Prof
Scale
Score SD N % Prof
Scale
Score SD N % Prof
Scale
Score SD N % Prof
Scale
Score SD
Grade 3
All Students 22,089 48 2425.3 79.6 22,947 49 2427.4 81.8 23,355 47 2421.6 85.6 22,790 50 2427.5 85.9 22,722 50 2427.8 88.0
Female 10,830 53 2434.0 79.1 11,152 53 2435.3 81.0 11,503 51 2430.0 84.5 11,066 54 2436.2 84.3 11,159 54 2435.4 86.3
Male 11,259 44 2416.8 79.2 11,795 46 2420.0 81.9 11,852 43 2413.3 85.8 11,724 46 2419.4 86.6 11,563 47 2420.4 88.9
African American 177 22 2374.2 75.5 229 30 2387.4 79.5 253 27 2381.5 81.5 201 26 2377.2 85.2 249 35 2390.8 90.6
AmerIndian/Alaskan 299 22 2376.6 74.5 270 25 2372.3 76.9 315 23 2373.3 77.9 253 26 2375.5 82.6 292 29 2379.9 87.0
Asian 238 56 2447.8 86.8 269 58 2444.2 85.3 241 60 2446.6 87.3 231 55 2433.5 96.2 260 60 2445.2 89.2
Hispanic 3,993 27 2387.9 72.0 4,231 29 2389.2 76.1 4,132 27 2382.2 77.5 4,203 32 2392.5 80.6 3,855 32 2389.2 81.4
Pacific Islander 41 51 2424.1 78.2 67 42 2414.6 79.6 77 47 2430.7 77.2 88 38 2403.3 87.0 198 53 2429.6 88.1
White 16,734 54 2435.3 78.1 17,229 55 2437.9 79.8 17,711 52 2432.1 84.4 17,158 55 2437.2 84.5 17,868 55 2437.2 86.6
LEP 1,949 17 2368.8 66.1 1,517 13 2354.7 64.8 1,885 16 2358.0 72.3 1,778 17 2362.9 74.0 2,405 27 2379.1 79.4
Special Education 2,041 16 2351.2 79.0 2,009 15 2350.2 76.0 2,123 15 2343.4 81.8 2,438 17 2349.7 82.0 2,309 17 2349.8 84.2
Section 504 Plan 365 37 2403.0 79.6 328 35 2401.6 78.4 349 37.8 2403.0 84.0 396 36 2408.1 77.7 492 43 2412.8 81.2
Grade 4
All Students 22,226 46 2460.8 85.1 22,471 50 2467.6 87.2 23,398 48 2462.8 89.1 23,633 50 2467.4 92.3 23,337 52 2471.3 93.6
Female 10,762 51 2470.7 83.5 10,995 54 2477.0 86.8 11,398 52 2472.0 87.9 11,679 54 2476.1 91.2 11,311 55 2479.8 91.7
Male 11,464 42 2451.5 85.6 11,476 46 2458.6 86.7 12,000 44 2454.0 89.3 11,954 47 2458.9 92.6 12,026 49 2463.4 94.7
African American 238 26 2419.4 81.7 187 29 2412.5 91.0 265 29 2413.2 90.2 254 26 2415.4 90.2 261 30 2423.4 95.9
AmerIndian/Alaskan 296 21 2411.5 79.3 284 28 2418.6 87.2 270 25 2414.4 79.6 278 25 2412.0 82.8 276 27 2414.8 89.9
Asian 277 55 2480.8 87.4 232 59 2492.8 94.7 299 58 2488.4 96.8 241 62 2496.2 100.7 254 57 2477.4 100.4
Hispanic 4,044 25 2419.2 77.7 3,997 28 2423.8 80.4 4,220 29 2423.8 83.3 4,437 32 2426.8 86.8 3,948 32 2430.0 86.2
Pacific Islander 36 31 2440.4 79.0 64 45 2454.4 79.8 80 46 2458.2 93.6 64 48 2469.3 80.5 191 45 2467.8 89.0
White 16,791 52 2472.1 83.2 17,053 55 2479.2 84.8 17,701 53 2473.4 87.1 17,713 56 2478.8 90.0 18,407 57 2481.7 92.2
LEP 2,107 19 2404.1 74.5 1,314 11 2382.4 70.9 1,539 12 2384.7 74.2 1,693 14 2383.4 76.7 2,067 24 2411.9 85.3
Special Education 2,141 12 2373.2 79.7 1,981 14 2376.2 83.0 2,210 15 2378.5 85.9 2,517 13 2370.8 85.7 2,244 16 2378.7 89.4
Section 504 Plan 439 38 2444.5 79.2 402 37 2437.7 83.2 439 36.2 2438.3 84.8 530 38 2445.9 86.3 690 43 2455.5 88.9
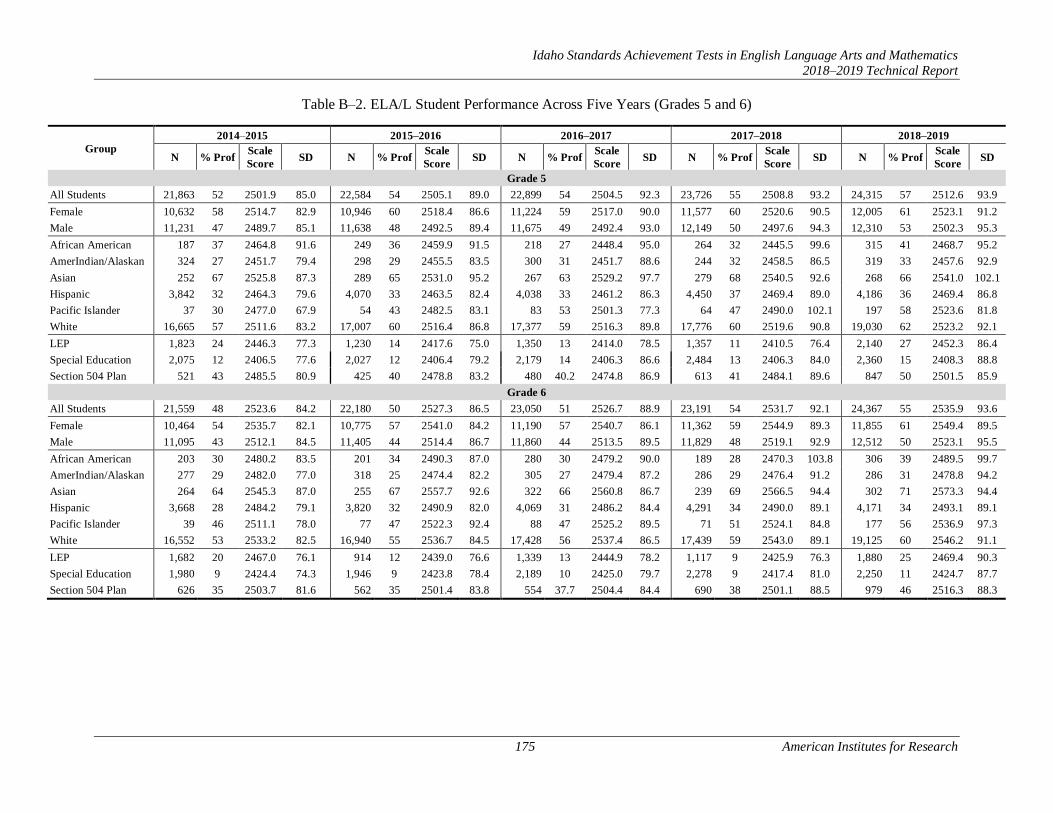
Idaho Standards Achievement Tests in English Language Arts and Mathematics
2018–2019 Technical Report
175 American Institutes for Research
Table B–2. ELA/L Student Performance Across Five Years (Grades 5 and 6)
Group
2014–2015 2015–2016 2016–2017 2017–2018 2018–2019
N % Prof Scale
Score SD N % Prof
Scale
Score SD N % Prof
Scale
Score SD N % Prof
Scale
Score SD N % Prof
Scale
Score SD
Grade 5
All Students 21,863 52 2501.9 85.0 22,584 54 2505.1 89.0 22,899 54 2504.5 92.3 23,726 55 2508.8 93.2 24,315 57 2512.6 93.9
Female 10,632 58 2514.7 82.9 10,946 60 2518.4 86.6 11,224 59 2517.0 90.0 11,577 60 2520.6 90.5 12,005 61 2523.1 91.2
Male 11,231 47 2489.7 85.1 11,638 48 2492.5 89.4 11,675 49 2492.4 93.0 12,149 50 2497.6 94.3 12,310 53 2502.3 95.3
African American 187 37 2464.8 91.6 249 36 2459.9 91.5 218 27 2448.4 95.0 264 32 2445.5 99.6 315 41 2468.7 95.2
AmerIndian/Alaskan 324 27 2451.7 79.4 298 29 2455.5 83.5 300 31 2451.7 88.6 244 32 2458.5 86.5 319 33 2457.6 92.9
Asian 252 67 2525.8 87.3 289 65 2531.0 95.2 267 63 2529.2 97.7 279 68 2540.5 92.6 268 66 2541.0 102.1
Hispanic 3,842 32 2464.3 79.6 4,070 33 2463.5 82.4 4,038 33 2461.2 86.3 4,450 37 2469.4 89.0 4,186 36 2469.4 86.8
Pacific Islander 37 30 2477.0 67.9 54 43 2482.5 83.1 83 53 2501.3 77.3 64 47 2490.0 102.1 197 58 2523.6 81.8
White 16,665 57 2511.6 83.2 17,007 60 2516.4 86.8 17,377 59 2516.3 89.8 17,776 60 2519.6 90.8 19,030 62 2523.2 92.1
LEP 1,823 24 2446.3 77.3 1,230 14 2417.6 75.0 1,350 13 2414.0 78.5 1,357 11 2410.5 76.4 2,140 27 2452.3 86.4
Special Education 2,075 12 2406.5 77.6 2,027 12 2406.4 79.2 2,179 14 2406.3 86.6 2,484 13 2406.3 84.0 2,360 15 2408.3 88.8
Section 504 Plan 521 43 2485.5 80.9 425 40 2478.8 83.2 480 40.2 2474.8 86.9 613 41 2484.1 89.6 847 50 2501.5 85.9
Grade 6
All Students 21,559 48 2523.6 84.2 22,180 50 2527.3 86.5 23,050 51 2526.7 88.9 23,191 54 2531.7 92.1 24,367 55 2535.9 93.6
Female 10,464 54 2535.7 82.1 10,775 57 2541.0 84.2 11,190 57 2540.7 86.1 11,362 59 2544.9 89.3 11,855 61 2549.4 89.5
Male 11,095 43 2512.1 84.5 11,405 44 2514.4 86.7 11,860 44 2513.5 89.5 11,829 48 2519.1 92.9 12,512 50 2523.1 95.5
African American 203 30 2480.2 83.5 201 34 2490.3 87.0 280 30 2479.2 90.0 189 28 2470.3 103.8 306 39 2489.5 99.7
AmerIndian/Alaskan 277 29 2482.0 77.0 318 25 2474.4 82.2 305 27 2479.4 87.2 286 29 2476.4 91.2 286 31 2478.8 94.2
Asian 264 64 2545.3 87.0 255 67 2557.7 92.6 322 66 2560.8 86.7 239 69 2566.5 94.4 302 71 2573.3 94.4
Hispanic 3,668 28 2484.2 79.1 3,820 32 2490.9 82.0 4,069 31 2486.2 84.4 4,291 34 2490.0 89.1 4,171 34 2493.1 89.1
Pacific Islander 39 46 2511.1 78.0 77 47 2522.3 92.4 88 47 2525.2 89.5 71 51 2524.1 84.8 177 56 2536.9 97.3
White 16,552 53 2533.2 82.5 16,940 55 2536.7 84.5 17,428 56 2537.4 86.5 17,439 59 2543.0 89.1 19,125 60 2546.2 91.1
LEP 1,682 20 2467.0 76.1 914 12 2439.0 76.6 1,339 13 2444.9 78.2 1,117 9 2425.9 76.3 1,880 25 2469.4 90.3
Special Education 1,980 9 2424.4 74.3 1,946 9 2423.8 78.4 2,189 10 2425.0 79.7 2,278 9 2417.4 81.0 2,250 11 2424.7 87.7
Section 504 Plan 626 35 2503.7 81.6 562 35 2501.4 83.8 554 37.7 2504.4 84.4 690 38 2501.1 88.5 979 46 2516.3 88.3
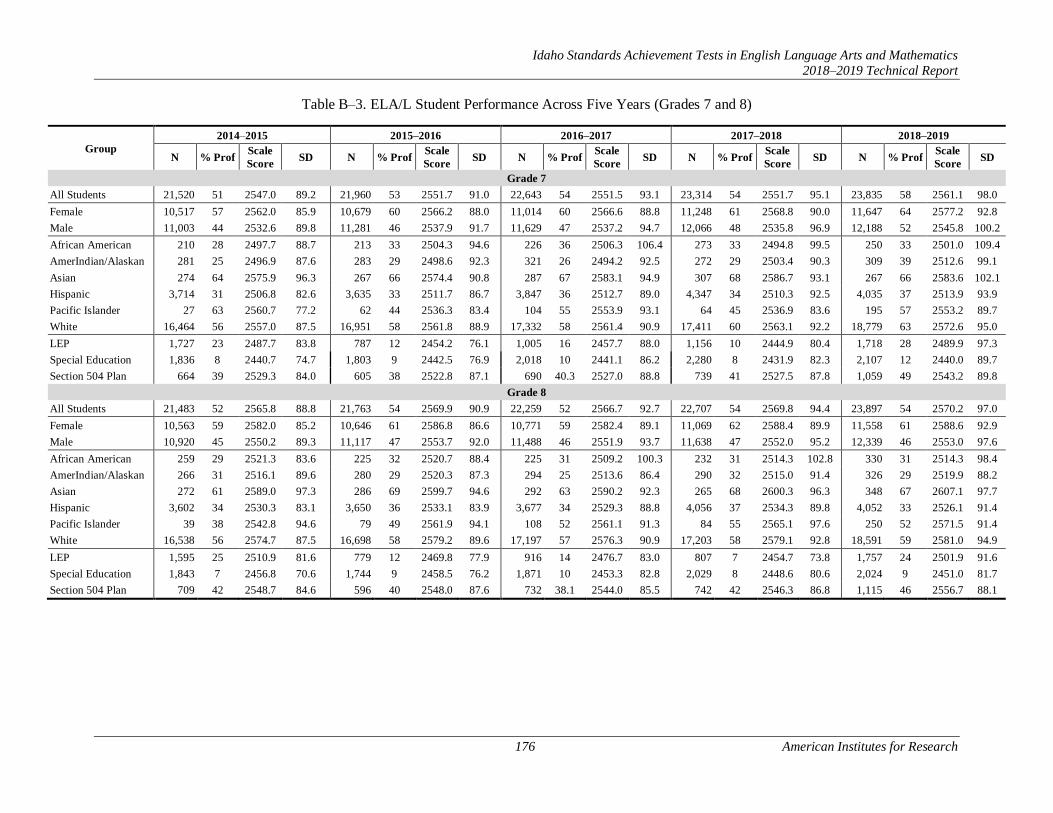
Idaho Standards Achievement Tests in English Language Arts and Mathematics
2018–2019 Technical Report
176 American Institutes for Research
Table B–3. ELA/L Student Performance Across Five Years (Grades 7 and 8)
Group
2014–2015 2015–2016 2016–2017 2017–2018 2018–2019
N % Prof Scale
Score SD N % Prof
Scale
Score SD N % Prof
Scale
Score SD N % Prof
Scale
Score SD N % Prof
Scale
Score SD
Grade 7
All Students 21,520 51 2547.0 89.2 21,960 53 2551.7 91.0 22,643 54 2551.5 93.1 23,314 54 2551.7 95.1 23,835 58 2561.1 98.0
Female 10,517 57 2562.0 85.9 10,679 60 2566.2 88.0 11,014 60 2566.6 88.8 11,248 61 2568.8 90.0 11,647 64 2577.2 92.8
Male 11,003 44 2532.6 89.8 11,281 46 2537.9 91.7 11,629 47 2537.2 94.7 12,066 48 2535.8 96.9 12,188 52 2545.8 100.2
African American 210 28 2497.7 88.7 213 33 2504.3 94.6 226 36 2506.3 106.4 273 33 2494.8 99.5 250 33 2501.0 109.4
AmerIndian/Alaskan 281 25 2496.9 87.6 283 29 2498.6 92.3 321 26 2494.2 92.5 272 29 2503.4 90.3 309 39 2512.6 99.1
Asian 274 64 2575.9 96.3 267 66 2574.4 90.8 287 67 2583.1 94.9 307 68 2586.7 93.1 267 66 2583.6 102.1
Hispanic 3,714 31 2506.8 82.6 3,635 33 2511.7 86.7 3,847 36 2512.7 89.0 4,347 34 2510.3 92.5 4,035 37 2513.9 93.9
Pacific Islander 27 63 2560.7 77.2 62 44 2536.3 83.4 104 55 2553.9 93.1 64 45 2536.9 83.6 195 57 2553.2 89.7
White 16,464 56 2557.0 87.5 16,951 58 2561.8 88.9 17,332 58 2561.4 90.9 17,411 60 2563.1 92.2 18,779 63 2572.6 95.0
LEP 1,727 23 2487.7 83.8 787 12 2454.2 76.1 1,005 16 2457.7 88.0 1,156 10 2444.9 80.4 1,718 28 2489.9 97.3
Special Education 1,836 8 2440.7 74.7 1,803 9 2442.5 76.9 2,018 10 2441.1 86.2 2,280 8 2431.9 82.3 2,107 12 2440.0 89.7
Section 504 Plan 664 39 2529.3 84.0 605 38 2522.8 87.1 690 40.3 2527.0 88.8 739 41 2527.5 87.8 1,059 49 2543.2 89.8
Grade 8
All Students 21,483 52 2565.8 88.8 21,763 54 2569.9 90.9 22,259 52 2566.7 92.7 22,707 54 2569.8 94.4 23,897 54 2570.2 97.0
Female 10,563 59 2582.0 85.2 10,646 61 2586.8 86.6 10,771 59 2582.4 89.1 11,069 62 2588.4 89.9 11,558 61 2588.6 92.9
Male 10,920 45 2550.2 89.3 11,117 47 2553.7 92.0 11,488 46 2551.9 93.7 11,638 47 2552.0 95.2 12,339 46 2553.0 97.6
African American 259 29 2521.3 83.6 225 32 2520.7 88.4 225 31 2509.2 100.3 232 31 2514.3 102.8 330 31 2514.3 98.4
AmerIndian/Alaskan 266 31 2516.1 89.6 280 29 2520.3 87.3 294 25 2513.6 86.4 290 32 2515.0 91.4 326 29 2519.9 88.2
Asian 272 61 2589.0 97.3 286 69 2599.7 94.6 292 63 2590.2 92.3 265 68 2600.3 96.3 348 67 2607.1 97.7
Hispanic 3,602 34 2530.3 83.1 3,650 36 2533.1 83.9 3,677 34 2529.3 88.8 4,056 37 2534.3 89.8 4,052 33 2526.1 91.4
Pacific Islander 39 38 2542.8 94.6 79 49 2561.9 94.1 108 52 2561.1 91.3 84 55 2565.1 97.6 250 52 2571.5 91.4
White 16,538 56 2574.7 87.5 16,698 58 2579.2 89.6 17,197 57 2576.3 90.9 17,203 58 2579.1 92.8 18,591 59 2581.0 94.9
LEP 1,595 25 2510.9 81.6 779 12 2469.8 77.9 916 14 2476.7 83.0 807 7 2454.7 73.8 1,757 24 2501.9 91.6
Special Education 1,843 7 2456.8 70.6 1,744 9 2458.5 76.2 1,871 10 2453.3 82.8 2,029 8 2448.6 80.6 2,024 9 2451.0 81.7
Section 504 Plan 709 42 2548.7 84.6 596 40 2548.0 87.6 732 38.1 2544.0 85.5 742 42 2546.3 86.8 1,115 46 2556.7 88.1

Idaho Standards Achievement Tests in English Language Arts and Mathematics
2018–2019 Technical Report
177 American Institutes for Research
Table B–4. ELA/L Student Performance Across Five Years (Grade 10)
Group
2014–2015 2015–2016 2016–2017 2017–2018 2018–2019
N % Prof Scale
Score SD N % Prof
Scale
Score SD N % Prof
Scale
Score SD N % Prof
Scale
Score SD N % Prof
Scale
Score SD
Grade 10
All Students 20,217 60 2597.2 100.7 20,770 61 2598.5 103.6 21,412 59 2591.7 105.2 21,512 59 2594.7 106.4 22,305 59 2592.9 109.8
Female 9,930 68 2615.4 94.6 10,057 68 2615.7 97.8 10,581 65 2608.1 100.5 10,578 66 2611.5 100.7 10,892 65 2608.9 103.2
Male 10,287 53 2579.7 103.2 10,713 55 2582.4 106.2 10,831 53 2575.6 107.2 10,934 53 2578.4 109.2 11,413 53 2577.6 113.6
African American 210 33 2522.3 99.2 221 38 2534.8 110.9 335 31 2513.7 111.7 258 30 2505.6 118.3 280 30 2510.6 115.6
AmerIndian/Alaskan 223 38 2548.0 102.0 234 42 2545.8 107.5 251 39 2544.7 109.5 236 40 2548.2 102.0 275 36 2538.8 104.6
Asian 293 73 2627.4 116.8 313 71 2618.9 126.2 307 69 2613.8 120.4 290 72 2630.3 118.2 310 71 2627.3 101.0
Hispanic 3,276 42 2553.5 93.9 3,403 43 2554.4 96.2 3,488 40 2545.2 101.0 3,732 40 2547.2 100.6 3,460 39 2544.2 104.6
Pacific Islander 49 59 2582.2 99.0 101 52 2570.8 109.6 125 50 2571.7 96.9 62 50 2573.1 97.4 381 68 2611.1 107.3
White 15,697 65 2607.5 98.6 16,031 66 2609.4 101.3 16,470 64 2603.7 102.0 16,396 64 2607.0 103.4 17,599 64 2603.6 107.4
LEP 1,313 31 2524.3 95.7 643 12 2471.1 88.2 795 11 2459.5 88.4 702 6 2444.0 85.3 1,259 27 2509.3 107.3
Special Education 1,401 10 2468.5 79.8 1,396 10 2465.6 82.0 1,674 10 2460.6 87.3 1,695 11 2462.6 87.7 1,673 11 2459.3 93.0
Section 504 Plan 634 54 2579.2 98.3 533 49 2574.8 99.6 599 47.7 2569.9 102.1 737 53 2581.0 104.6 1,027 54 2582.8 105.0
* Suppressed data due to the small sample size, n < 10.

Idaho Standards Achievement Tests in English Language Arts and Mathematics
2018–2019 Technical Report
178 American Institutes for Research
Table B–5. ELA/L Student Performance Across Five Years (Grades 9 and 11)
Group
2014–2015 2015–2016 2016–2017 2017–2018 2018–2019
N % Prof Scale
Score SD N % Prof
Scale
Score SD N % Prof
Scale
Score SD N % Prof
Scale
Score SD N % Prof
Scale
Score SD
Grade 9
All Students 9,568 52 2569.7 96.9 6,040 54 2573.1 101.8 4,970 55 2575.9 101.1 5,507 57 2583.5 99.5 6,495 56 2580.2 104.7
Female 4,596 59 2585.7 93.4 2,942 62 2593.2 96.6 2,485 62 2592.7 96.0 2,704 64 2601.2 92.7 3,164 63 2598.2 97.8
Male 4,972 45 2555.0 97.7 3,098 46 2554.1 103.0 2,485 48 2559.1 103.4 2,803 51 2566.5 102.9 3,331 48 2563.1 108.2
African American 50 44 2533.4 102.0 49 35 2507.6 127.1 40 43 2533.0 111.8 56 36 2523.7 116.6 64 42 2533.6 131.8
AmerIndian/Alaskan 106 29 2519.2 96.8 106 26 2517.9 96.6 80 30 2521.9 95.8 88 34 2533.5 79.0 107 33 2515.0 99.6
Asian 87 69 2612.0 103.5 54 57 2579.1 132.0 55 55 2579.6 113.0 54 69 2599.5 96.7 52 73 2614.3 102.2
Hispanic 1,660 34 2530.3 90.5 1,027 39 2541.4 94.2 915 33 2530.7 96.9 862 42 2543.4 94.1 1,074 39 2539.9 99.4
Pacific Islander 2* 48 52 2562.0 96.8 64 44 2563.1 94.1 40 50 2579.0 83.9 38 47 2545.6 113.0
White 7,424 56 2578.9 95.3 4,620 58 2582.6 100.3 3,721 61 2589.5 98.3 4,407 61 2593.0 98.4 5,160 60 2590.4 102.8
LEP 664 30 2515.3 89.6 204 13 2463.8 92.1 253 11 2463.0 84.6 259 26 2500.7 98.3 371 25 2500.5 97.6
Special Education 707 7 2447.4 71.4 505 10 2456.3 85.6 386 8 2451.1 81.5 469 10 2461.5 87.0 536 11 2455.6 86.9
Section 504 Plan 282 39 2550.2 96.3 166 43 2552.9 91.5 120 45.8 2567.9 103.0 209 51 2571.5 93.7 195 50 2566.1 109.1
Grade 11
All Students 580 60 2602.3 103.5 1,048 39 2548.7 109.8 401 45 2558.5 115.9 404 30 2523.7 111.7 388 44 2564.0 122.3
Female 287 71 2628.6 92.9 505 44 2564.9 107.7 196 53 2578.1 112.3 170 36 2543.0 113.6 197 47 2576.9 117.2
Male 293 49 2576.6 107.0 543 34 2533.6 109.7 205 37 2539.7 116.5 234 25 2509.7 108.4 191 41 2550.6 126.2
African American 4* 14 14 2463.7 122.7 9* 10 0 2388.3 58.8 4*
AmerIndian/Alaskan 4* 18 33 2497.2 123.9 7* 5* 8*
Asian 5* 15 33 2509.4 170.2 2* 6* 3*
Hispanic 99 35 2546.1 103.1 203 31 2527.3 93.3 75 19 2500.5 87.4 72 15 2491.2 92.4 60 32 2519.5 123.1
Pacific Islander 0* 4* 2* 3* 5*
White 465 66 2614.7 99.8 767 41 2557.5 110.6 297 53 2575.5 118.4 308 35 2536.0 112.8 308 47 2573.3 120.4
LEP 39 26 2529.6 95.2 49 14 2470.9 95.4 19 5 2453.9 73.2 22 9 2442.1 90.6 14 0 2449.9 81.5
Special Education 37 11 2467.3 80.9 100 8 2457.7 82.7 72 28 2524.3 112.3 56 7 2439.5 90.1 66 8 2455.4 105.8
Section 504 Plan 18 56 2585.3 101.9 43 40 2539.2 108.6 15 46.7 2566.5 124.6 17 29 2539.1 95.3 14 43 2552.0 101.1
* Suppressed data due to the small sample size, n < 10.

Idaho Standards Achievement Tests in English Language Arts and Mathematics
2018–2019 Technical Report
179 American Institutes for Research
Table B–6. Mathematics Student Performance Across Five Years (Grades 3 and 4)
Group
2014–2015 2015–2016 2016–2017 2017–2018 2018–2019
N % Prof Scale
Score SD N % Prof
Scale
Score SD N % Prof
Scale
Score SD N % Prof
Scale
Score SD N % Prof
Scale
Score SD
Grade 3
All Students 22,131 50 2431.1 74.1 22,954 52 2435.4 76.0 23,383 50 2433.6 78.4 22,840 52 2436.8 80.5 22,747 53 2438.4 81.7
Female 10,849 48 2429.0 72.0 11,156 51 2433.2 73.7 11,511 48 2430.8 76.0 11,092 51 2433.7 77.5 11,165 51 2434.6 79.5
Male 11,282 51 2433.2 76.1 11,798 53 2437.5 78.0 11,872 52 2436.2 80.7 11,748 53 2439.8 83.1 11,582 55 2442.1 83.6
African American 188 23 2373.5 75.0 242 28 2379.4 86.2 272 25 2377.4 90.0 211 28 2377.8 93.1 261 31 2389.5 88.9
AmerIndian/Alaskan 296 24 2385.7 76.8 270 25 2384.1 75.9 314 27 2388.3 80.0 253 25 2385.4 81.0 293 29 2393.7 76.4
Asian 243 59 2453.9 84.5 269 64 2461.0 82.2 251 61 2460.6 91.3 241 55 2441.2 89.6 264 67 2470.6 88.2
Hispanic 4,015 27 2394.5 68.7 4,248 31 2400.0 71.6 4,176 31 2399.2 72.7 4,234 33 2400.9 74.7 3,874 31 2398.5 75.4
Pacific Islander 41 44 2428.5 75.5 67 43 2424.0 68.4 79 54 2436.3 69.3 89 40 2412.3 75.4 199 56 2437.7 79.8
White 16,740 56 2441.2 71.7 17,208 58 2445.4 73.4 17,675 56 2443.6 76.3 17,156 58 2447.1 78.5 17,856 58 2448.1 79.7
LEP 1,998 20 2379.7 67.4 1,561 18 2372.3 70.4 1,945 19 2375.6 71.7 1,850 20 2373.7 72.8 2,443 28 2391.8 77.1
Special Education 2,050 18 2360.9 82.2 2,004 19 2363.0 84.9 2,140 18 2358.0 84.9 2,440 21 2362.9 88.1 2,311 20 2363.1 87.2
Section 504 Plan 366 42 2414.7 80.1 326 36 2412.2 75.7 350 38.9 2412.3 76.0 399 38 2415.2 77.8 501 46 2426.1 75.3
Grade 4
All Students 22,260 43 2470.5 74.9 22,479 47 2477.4 77.8 23,429 47 2475.5 79.7 23,668 48 2478.1 81.7 23,356 50 2481.8 81.9
Female 10,767 42 2468.1 72.1 11,001 45 2474.2 75.2 11,409 45 2472.6 76.7 11,699 45 2473.9 77.7 11,320 48 2477.9 77.8
Male 11,493 45 2472.7 77.3 11,478 49 2480.4 80.1 12,020 48 2478.2 82.4 11,969 51 2482.2 85.2 12,036 52 2485.5 85.5
African American 248 22 2424.3 75.6 196 21 2416.5 83.0 285 21 2412.0 86.7 262 24 2417.3 95.4 273 28 2428.2 93.9
AmerIndian/Alaskan 298 18 2423.0 71.2 285 24 2434.2 74.5 269 19 2422.5 72.6 280 22 2430.2 79.7 276 26 2435.4 79.7
Asian 286 56 2492.1 81.9 238 58 2506.1 97.3 302 58 2502.3 90.0 252 60 2507.9 90.8 261 54 2492.1 89.9
Hispanic 4,061 21 2432.5 66.3 4,005 25 2436.0 71.2 4,255 26 2437.1 73.1 4,467 29 2439.1 75.1 3,963 28 2441.7 75.4
Pacific Islander 36 33 2442.3 70.6 64 30 2455.7 79.9 82 39 2470.6 80.7 65 49 2479.4 67.4 188 45 2471.0 79.5
White 16,787 49 2481.1 73.1 17,037 53 2488.6 75.0 17,680 52 2486.4 77.0 17,697 54 2489.4 79.1 18,395 55 2491.9 79.8
LEP 2,155 15 2418.9 65.3 1,351 10 2401.7 66.7 1,599 13 2404.3 71.8 1,750 13 2403.6 69.8 2,118 22 2426.8 77.0
Special Education 2,142 13 2395.8 78.0 1,981 15 2398.6 80.6 2,222 16 2400.3 83.5 2,532 14 2393.2 83.0 2,243 18 2401.3 87.7
Section 504 Plan 438 35 2460.8 69.6 403 33 2456.3 71.2 440 33.4 2456.5 77.7 532 37 2461.2 76.7 695 42 2469.4 79.2

Idaho Standards Achievement Tests in English Language Arts and Mathematics
2018–2019 Technical Report
180 American Institutes for Research
Table B–7. Mathematics Student Performance Across Five Years (Grades 5 and 6)
Group
2014–2015 2015–2016 2016–2017 2017–2018 2018–2019
N % Prof Scale
Score SD N % Prof
Scale
Score SD N % Prof
Scale
Score SD N % Prof
Scale
Score SD N % Prof
Scale
Score SD
Grade 5
All Students 21,898 38 2499.2 81.8 22,580 40 2502.3 83.9 22,922 42 2504.5 88.1 23,758 43 2506.9 89.7 24,322 45 2510.8 91.4
Female 10,652 36 2497.3 78.5 10,945 38 2500.1 80.2 11,237 40 2501.6 84.8 11,594 41 2504.3 86.3 12,010 42 2507.7 88.0
Male 11,246 39 2501.1 84.8 11,635 42 2504.4 87.2 11,685 43 2507.3 91.1 12,164 45 2509.4 92.8 12,312 47 2513.9 94.5
African American 195 24 2454.8 88.1 260 20 2447.0 88.0 237 19 2438.5 99.6 272 18 2436.3 92.1 329 25 2453.5 101.8
AmerIndian/Alaskan 325 16 2447.5 78.3 296 19 2457.8 75.5 303 20 2457.9 82.8 244 18 2451.6 80.3 318 24 2456.6 98.0
Asian 263 57 2525.8 90.4 294 53 2532.2 90.7 274 50 2529.1 99.0 285 57 2545.3 95.7 274 61 2548.7 103.1
Hispanic 3,863 19 2459.1 75.8 4,082 19 2459.4 77.5 4,071 21 2459.9 81.4 4,490 23 2464.3 83.6 4,201 25 2466.6 82.8
Pacific Islander 37 32 2471.4 79.3 55 27 2472.6 93.2 83 37 2495.6 83.7 64 36 2486.7 97.0 197 50 2516.7 78.5
White 16,658 43 2509.7 79.4 16,979 45 2514.3 81.0 17,343 47 2517.1 85.0 17,754 49 2518.8 86.9 19,003 50 2521.9 89.2
LEP 1,870 14 2443.8 75.2 1,269 7 2420.5 71.2 1,403 8 2420.9 73.8 1,427 7 2418.4 73.1 2,190 20 2452.8 83.8
Special Education 2,079 9 2415.3 80.1 2,025 9 2413.6 80.1 2,187 11 2414.8 85.2 2,474 10 2411.5 82.8 2,356 11 2412.0 87.5
Section 504 Plan 524 33 2489.1 78.8 424 28 2483.1 78.1 481 31.2 2481.6 82.8 617 31 2484.8 87.0 851 38 2500.9 85.2
Grade 6
All Students 21,577 36 2515.5 93.3 22,180 39 2521.2 97.4 23,066 40 2522.0 99.7 23,217 44 2528.8 102.1 24,368 43 2526.3 102.6
Female 10,472 36 2517.4 89.0 10,785 40 2523.4 92.6 11,189 41 2525.5 93.4 11,368 44 2530.7 97.2 11,854 43 2528.8 97.2
Male 11,105 36 2513.7 97.2 11,395 39 2519.1 101.6 11,877 39 2518.8 105.1 11,849 43 2526.9 106.6 12,514 42 2523.9 107.3
African American 210 14 2457.4 91.5 215 22 2463.5 110.2 294 16 2451.5 105.6 195 16 2442.1 118.9 312 20 2455.1 115.1
AmerIndian/Alaskan 275 14 2461.7 87.7 318 15 2457.4 97.8 309 15 2460.6 95.2 286 22 2467.3 101.4 285 15 2464.3 96.0
Asian 270 51 2542.0 98.4 257 57 2557.5 108.5 331 58 2563.3 104.1 245 59 2566.1 110.9 305 64 2574.9 107.3
Hispanic 3,683 17 2467.6 89.8 3,837 19 2473.2 93.0 4,130 19 2473.1 93.7 4,321 23 2477.5 99.4 4,189 22 2473.5 99.3
Pacific Islander 38 34 2505.0 84.9 78 35 2510.0 89.0 89 31 2512.2 95.1 73 34 2502.4 114.9 180 42 2528.6 102.9
White 16,543 41 2527.6 90.0 16,908 45 2533.7 93.5 17,374 45 2535.5 96.0 17,423 49 2543.1 97.4 19,097 48 2539.2 98.4
LEP 1,711 12 2452.0 87.6 955 7 2418.7 92.9 1,392 9 2433.5 94.2 1,172 6 2412.8 93.5 1,928 15 2450.5 100.2
Special Education 1,980 7 2401.4 93.2 1,942 7 2403.2 99.3 2,170 7 2404.9 101.6 2,271 7 2395.8 103.9 2,251 9 2403.8 107.0
Section 504 Plan 625 27 2498.6 90.7 557 29 2500.6 98.3 558 28.1 2497.8 96.8 687 30 2499.9 97.2 980 32 2507.9 94.0

Idaho Standards Achievement Tests in English Language Arts and Mathematics
2018–2019 Technical Report
181 American Institutes for Research
Table B–8. Mathematics Student Performance Across Five Years (Grades 7 and 8)
Group
2014–2015 2015–2016 2016–2017 2017–2018 2018–2019
N % Prof Scale
Score SD N % Prof
Scale
Score SD N % Prof
Scale
Score SD N % Prof
Scale
Score SD N % Prof
Scale
Score SD
Grade 7
All Students 21,552 38 2532.5 96.6 21,952 42 2541.0 98.0 22,632 42 2541.2 102.5 23,321 44 2541.8 105.3 23,826 46 2547.2 107.4
Female 10,543 38 2534.5 92.2 10,673 41 2541.9 93.7 11,006 42 2542.6 97.6 11,253 44 2543.9 100.0 11,643 45 2548.4 102.8
Male 11,009 38 2530.5 100.7 11,279 42 2540.1 101.8 11,626 43 2539.8 106.9 12,068 44 2539.7 110.0 12,183 46 2546.2 111.6
African American 221 19 2476.1 98.8 230 20 2465.8 115.7 234 22 2470.9 121.1 283 18 2461.2 111.2 262 22 2469.3 119.5
AmerIndian/Alaskan 281 16 2471.4 98.2 282 18 2480.9 95.7 316 16 2478.3 93.3 272 22 2481.7 99.9 305 24 2481.4 110.4
Asian 281 53 2570.7 105.2 274 57 2573.4 103.4 294 63 2585.9 112.6 310 62 2597.0 108.8 267 60 2585.1 119.7
Hispanic 3,729 18 2483.9 90.2 3,655 21 2490.7 95.6 3,903 22 2492.2 96.7 4,383 22 2487.9 102.3 4,055 24 2489.3 103.9
Pacific Islander 27 44 2532.1 84.3 62 39 2525.5 110.3 107 46 2544.9 96.1 63 30 2514.7 107.4 195 40 2539.5 98.9
White 16,466 43 2544.8 93.7 16,900 47 2553.8 93.5 17,254 47 2553.8 99.1 17,371 50 2556.6 100.3 18,742 51 2561.5 102.6
LEP 1,771 13 2463.8 93.1 846 8 2431.4 94.7 1,040 9 2437.8 98.0 1,220 6 2425.7 93.0 1,763 18 2466.4 107.9
Special Education 1,836 6 2415.6 91.2 1,795 7 2418.6 95.4 2,002 9 2420.5 99.8 2,268 6 2408.4 95.7 2,093 8 2413.1 101.4
Section 504 Plan 662 28 2515.2 92.9 602 27 2516.5 95.6 691 30.4 2519.0 97.5 737 34 2520.9 95.6 1,061 37 2533.5 98.3
Grade 8
All Students 21,521 37 2546.1 104.7 21,753 38 2551.1 107.8 22,221 39 2551.1 111.3 22,700 42 2557.2 114.1 23,892 41 2555.5 115.6
Female 10,566 37 2550.8 99.4 10,642 39 2555.4 102.1 10,746 39 2555.1 105.0 11,081 43 2562.6 107.9 11,544 42 2561.7 109.0
Male 10,955 36 2541.7 109.4 11,111 37 2546.9 112.8 11,475 38 2547.4 116.7 11,619 40 2552.0 119.5 12,348 39 2549.8 121.1
African American 273 18 2484.6 98.1 231 18 2491.0 102.7 247 16 2464.6 118.6 240 20 2479.8 122.5 338 14 2472.3 113.0
AmerIndian/Alaskan 267 19 2493.8 104.3 281 17 2491.6 107.7 295 17 2487.0 99.1 291 14 2483.0 98.9 325 17 2485.8 103.3
Asian 281 54 2583.9 121.6 291 54 2598.7 124.6 290 55 2599.4 117.8 272 62 2609.8 128.7 351 61 2614.4 127.3
Hispanic 3,625 17 2495.4 95.7 3,658 18 2501.0 96.3 3,697 20 2500.1 102.5 4,084 23 2506.2 104.4 4,067 19 2496.3 103.6
Pacific Islander 40 25 2510.9 102.7 80 34 2540.7 108.3 108 28 2539.5 102.5 83 45 2545.1 128.9 251 41 2557.5 110.7
White 16,534 41 2558.6 102.5 16,668 43 2563.6 105.8 17,130 43 2564.2 108.8 17,155 47 2570.6 111.6 18,560 46 2570.1 112.7
LEP 1,641 13 2479.8 97.2 812 6 2440.0 91.5 964 9 2449.9 97.1 859 4 2427.6 89.8 1,785 15 2475.5 106.8
Special Education 1,846 4 2417.0 85.9 1,732 5 2425.4 94.8 1,838 6 2420.0 99.0 2,014 4 2414.4 93.8 2,022 5 2415.0 93.5
Section 504 Plan 707 29 2529.6 103.7 596 26 2524.1 106.9 730 25.8 2524.6 103.7 742 30 2528.1 105.3 1,117 32 2537.5 104.0
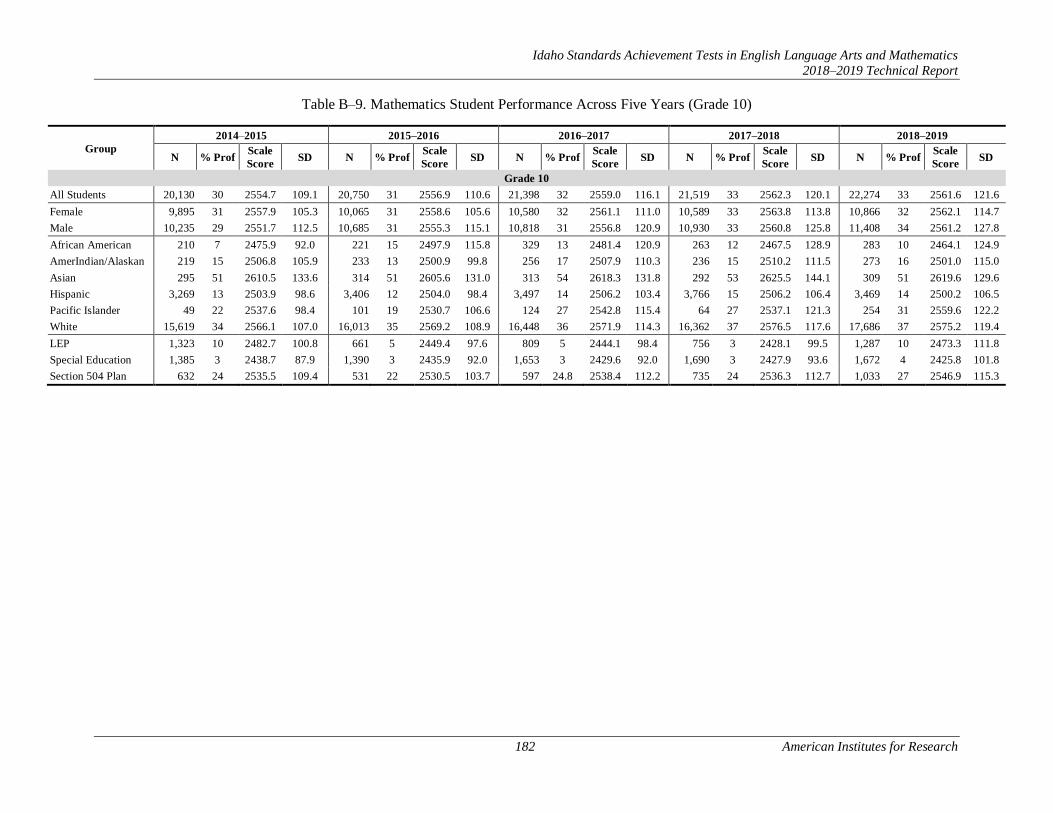
Idaho Standards Achievement Tests in English Language Arts and Mathematics
2018–2019 Technical Report
182 American Institutes for Research
Table B–9. Mathematics Student Performance Across Five Years (Grade 10)
Group
2014–2015 2015–2016 2016–2017 2017–2018 2018–2019
N % Prof Scale
Score SD N % Prof
Scale
Score SD N % Prof
Scale
Score SD N % Prof
Scale
Score SD N % Prof
Scale
Score SD
Grade 10
All Students 20,130 30 2554.7 109.1 20,750 31 2556.9 110.6 21,398 32 2559.0 116.1 21,519 33 2562.3 120.1 22,274 33 2561.6 121.6
Female 9,895 31 2557.9 105.3 10,065 31 2558.6 105.6 10,580 32 2561.1 111.0 10,589 33 2563.8 113.8 10,866 32 2562.1 114.7
Male 10,235 29 2551.7 112.5 10,685 31 2555.3 115.1 10,818 31 2556.8 120.9 10,930 33 2560.8 125.8 11,408 34 2561.2 127.8
African American 210 7 2475.9 92.0 221 15 2497.9 115.8 329 13 2481.4 120.9 263 12 2467.5 128.9 283 10 2464.1 124.9
AmerIndian/Alaskan 219 15 2506.8 105.9 233 13 2500.9 99.8 256 17 2507.9 110.3 236 15 2510.2 111.5 273 16 2501.0 115.0
Asian 295 51 2610.5 133.6 314 51 2605.6 131.0 313 54 2618.3 131.8 292 53 2625.5 144.1 309 51 2619.6 129.6
Hispanic 3,269 13 2503.9 98.6 3,406 12 2504.0 98.4 3,497 14 2506.2 103.4 3,766 15 2506.2 106.4 3,469 14 2500.2 106.5
Pacific Islander 49 22 2537.6 98.4 101 19 2530.7 106.6 124 27 2542.8 115.4 64 27 2537.1 121.3 254 31 2559.6 122.2
White 15,619 34 2566.1 107.0 16,013 35 2569.2 108.9 16,448 36 2571.9 114.3 16,362 37 2576.5 117.6 17,686 37 2575.2 119.4
LEP 1,323 10 2482.7 100.8 661 5 2449.4 97.6 809 5 2444.1 98.4 756 3 2428.1 99.5 1,287 10 2473.3 111.8
Special Education 1,385 3 2438.7 87.9 1,390 3 2435.9 92.0 1,653 3 2429.6 92.0 1,690 3 2427.9 93.6 1,672 4 2425.8 101.8
Section 504 Plan 632 24 2535.5 109.4 531 22 2530.5 103.7 597 24.8 2538.4 112.2 735 24 2536.3 112.7 1,033 27 2546.9 115.3

Idaho Standards Achievement Tests in English Language Arts and Mathematics
2018–2019 Technical Report
183 American Institutes for Research
Table B–10. Mathematics Student Performance Across Five Years (Grades 9 and 11)
Group
2014–2015 2015–2016 2016–2017 2017–2018 2018–2019
N % Prof Scale
Score SD N % Prof
Scale
Score SD N % Prof
Scale
Score SD N % Prof
Scale
Score SD N % Prof
Scale
Score SD
Grade 9
All Students 9,631 28 2533.9 103.0 5,673 29 2536.1 106.8 4,943 30 2537.5 108.7 5,492 31 2542.4 110.8 6,515 32 2538.3 114.5
Female 4,635 27 2537.0 96.7 2,769 30 2541.9 99.5 2,477 29 2542.2 103.2 2,693 31 2548.0 101.8 3,162 32 2545.4 102.8
Male 4,996 28 2531.2 108.5 2,904 28 2530.6 113.1 2,466 30 2532.9 113.8 2,799 32 2537.0 118.7 3,353 32 2531.5 124.2
African American 60 23 2486.3 124.4 55 7 2442.4 107.9 57 9 2444.5 119.0 61 8 2457.3 107.0 76 13 2458.7 130.7
AmerIndian/Alaskan 110 12 2483.2 94.1 99 11 2484.8 101.7 80 15 2490.2 100.7 88 9 2477.5 108.6 108 16 2483.5 103.2
Asian 94 40 2556.3 118.9 51 29 2545.4 118.8 56 36 2551.2 101.5 54 39 2552.9 111.4 51 41 2575.3 109.7
Hispanic 1,670 12 2492.5 92.1 1,013 14 2494.0 98.6 905 12 2491.2 98.3 867 15 2495.8 104.6 1,107 15 2490.8 104.9
Pacific Islander 2* 50 16 2509.6 93.6 64 30 2523.6 117.1 40 25 2517.5 102.6 41 32 2517.6 131.3
White 7,456 31 2544.2 102.1 4,300 34 2548.9 105.2 3,685 35 2552.1 106.8 4,382 35 2554.2 108.8 5,132 36 2550.6 112.9
LEP 684 8 2473.3 88.9 222 5 2437.6 97.8 266 2 2432.3 90.2 273 9 2457.0 105.4 404 8 2458.2 101.3
Special Education 705 3 2418.3 86.1 487 4 2419.6 99.6 385 4 2413.3 93.3 464 5 2413.8 99.8 528 4 2408.7 101.1
Section 504 Plan 282 22 2518.1 104.5 168 22 2516.6 105.0 120 30.0 2541.3 103.7 206 24 2532.0 103.3 196 29 2532.0 119.1
Grade 11
All Students 589 35 2571.8 117.5 1,088 16 2516.3 111.2 459 19 2525.0 115.0 464 15 2510.0 113.8 421 21 2522.3 128.0
Female 295 39 2580.8 112.7 523 15 2523.5 102.1 229 19 2526.3 105.4 204 18 2522.9 113.0 217 19 2516.9 121.1
Male 294 31 2562.7 121.6 565 17 2509.7 118.6 230 18 2523.7 124.0 260 13 2499.9 113.6 204 23 2528.1 135.0
African American 5* 15 7 2448.4 131.3 10 0 2469.0 59.2 6* 4*
AmerIndian/Alaskan 3* 18 11 2466.6 96.9 7* 5* 8*
Asian 6* 16 31 2525.6 155.3 3* 6* 4*
Hispanic 104 9 2495.6 104.9 206 7 2491.0 99.6 81 7 2480.5 95.2 90 4 2469.4 88.5 66 6 2458.8 97.0
Pacific Islander 0* 5* 2* 3* 5*
White 467 41 2589.2 112.8 801 18 2525.6 110.9 348 22 2540.1 116.5 354 17 2521.8 113.7 334 25 2536.9 129.9
LEP 40 0 2470.6 68.3 53 4 2458.2 103.2 17 0 2437.2 64.5 24 4 2479.4 103.2 17 0 2403.7 51.8
Special Education 41 0 2414.1 87.7 98 0 2411.2 81.2 85 8 2459.5 114.2 57 0 2407.4 78.3 69 4 2409.4 95.9
Section 504 Plan 16 25 2544.4 104.8 42 14 2505.8 125.2 23 17.4 2522.9 112.4 20 5 2501.7 77.1 15 7 2517.3 91.7
* Suppressed data due to the small sample size, n < 10.
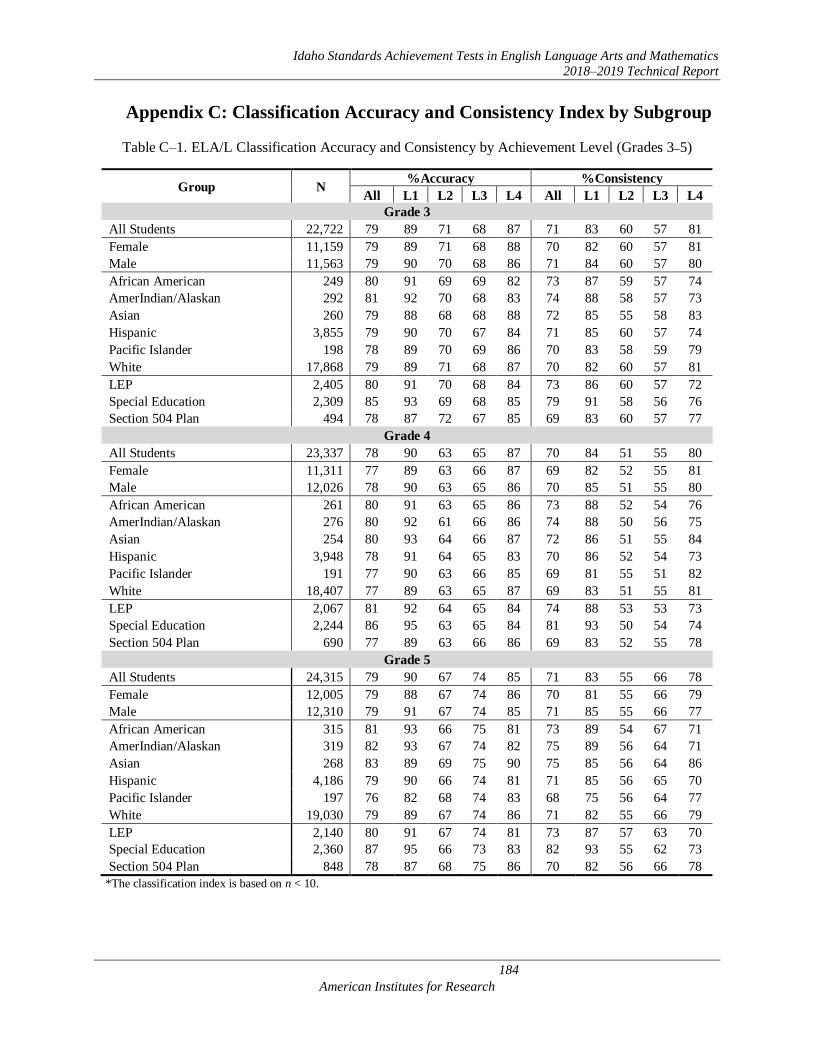
Idaho Standards Achievement Tests in English Language Arts and Mathematics
2018–2019 Technical Report
184
American Institutes for Research
Appendix C: Classification Accuracy and Consistency Index by Subgroup
Table C–1. ELA/L Classification Accuracy and Consistency by Achievement Level (Grades 3–5)
Group N %Accuracy %Consistency
All L1 L2 L3 L4 All L1 L2 L3 L4
Grade 3
All Students 22,722 79 89 71 68 87 71 83 60 57 81
Female 11,159 79 89 71 68 88 70 82 60 57 81
Male 11,563 79 90 70 68 86 71 84 60 57 80
African American 249 80 91 69 69 82 73 87 59 57 74
AmerIndian/Alaskan 292 81 92 70 68 83 74 88 58 57 73
Asian 260 79 88 68 68 88 72 85 55 58 83
Hispanic 3,855 79 90 70 67 84 71 85 60 57 74
Pacific Islander 198 78 89 70 69 86 70 83 58 59 79
White 17,868 79 89 71 68 87 70 82 60 57 81
LEP 2,405 80 91 70 68 84 73 86 60 57 72
Special Education 2,309 85 93 69 68 85 79 91 58 56 76
Section 504 Plan 494 78 87 72 67 85 69 83 60 57 77
Grade 4
All Students 23,337 78 90 63 65 87 70 84 51 55 80
Female 11,311 77 89 63 66 87 69 82 52 55 81
Male 12,026 78 90 63 65 86 70 85 51 55 80
African American 261 80 91 63 65 86 73 88 52 54 76
AmerIndian/Alaskan 276 80 92 61 66 86 74 88 50 56 75
Asian 254 80 93 64 66 87 72 86 51 55 84
Hispanic 3,948 78 91 64 65 83 70 86 52 54 73
Pacific Islander 191 77 90 63 66 85 69 81 55 51 82
White 18,407 77 89 63 65 87 69 83 51 55 81
LEP 2,067 81 92 64 65 84 74 88 53 53 73
Special Education 2,244 86 95 63 65 84 81 93 50 54 74
Section 504 Plan 690 77 89 63 66 86 69 83 52 55 78
Grade 5
All Students 24,315 79 90 67 74 85 71 83 55 66 78
Female 12,005 79 88 67 74 86 70 81 55 66 79
Male 12,310 79 91 67 74 85 71 85 55 66 77
African American 315 81 93 66 75 81 73 89 54 67 71
AmerIndian/Alaskan 319 82 93 67 74 82 75 89 56 64 71
Asian 268 83 89 69 75 90 75 85 56 64 86
Hispanic 4,186 79 90 66 74 81 71 85 56 65 70
Pacific Islander 197 76 82 68 74 83 68 75 56 64 77
White 19,030 79 89 67 74 86 71 82 55 66 79
LEP 2,140 80 91 67 74 81 73 87 57 63 70
Special Education 2,360 87 95 66 73 83 82 93 55 62 73
Section 504 Plan 848 78 87 68 75 86 70 82 56 66 78
*The classification index is based on n < 10.
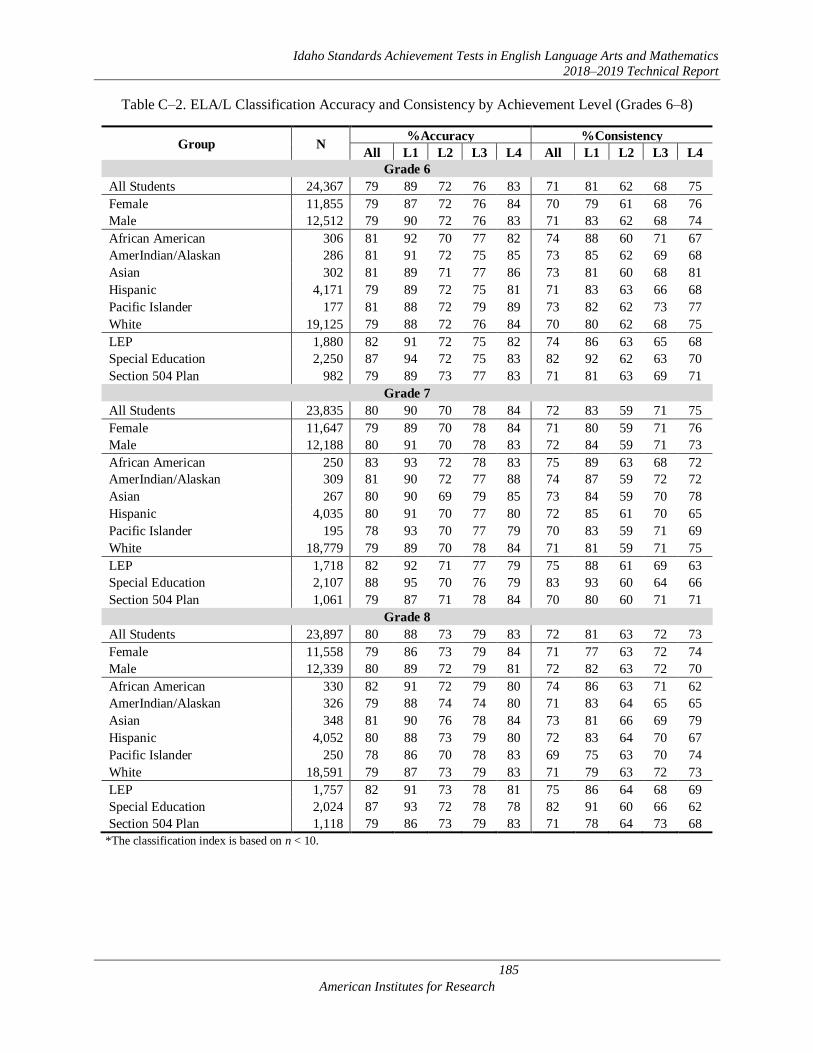
Idaho Standards Achievement Tests in English Language Arts and Mathematics
2018–2019 Technical Report
185
American Institutes for Research
Table C–2. ELA/L Classification Accuracy and Consistency by Achievement Level (Grades 6–8)
Group N %Accuracy %Consistency
All L1 L2 L3 L4 All L1 L2 L3 L4
Grade 6
All Students 24,367 79 89 72 76 83 71 81 62 68 75
Female 11,855 79 87 72 76 84 70 79 61 68 76
Male 12,512 79 90 72 76 83 71 83 62 68 74
African American 306 81 92 70 77 82 74 88 60 71 67
AmerIndian/Alaskan 286 81 91 72 75 85 73 85 62 69 68
Asian 302 81 89 71 77 86 73 81 60 68 81
Hispanic 4,171 79 89 72 75 81 71 83 63 66 68
Pacific Islander 177 81 88 72 79 89 73 82 62 73 77
White 19,125 79 88 72 76 84 70 80 62 68 75
LEP 1,880 82 91 72 75 82 74 86 63 65 68
Special Education 2,250 87 94 72 75 83 82 92 62 63 70
Section 504 Plan 982 79 89 73 77 83 71 81 63 69 71
Grade 7
All Students 23,835 80 90 70 78 84 72 83 59 71 75
Female 11,647 79 89 70 78 84 71 80 59 71 76
Male 12,188 80 91 70 78 83 72 84 59 71 73
African American 250 83 93 72 78 83 75 89 63 68 72
AmerIndian/Alaskan 309 81 90 72 77 88 74 87 59 72 72
Asian 267 80 90 69 79 85 73 84 59 70 78
Hispanic 4,035 80 91 70 77 80 72 85 61 70 65
Pacific Islander 195 78 93 70 77 79 70 83 59 71 69
White 18,779 79 89 70 78 84 71 81 59 71 75
LEP 1,718 82 92 71 77 79 75 88 61 69 63
Special Education 2,107 88 95 70 76 79 83 93 60 64 66
Section 504 Plan 1,061 79 87 71 78 84 70 80 60 71 71
Grade 8
All Students 23,897 80 88 73 79 83 72 81 63 72 73
Female 11,558 79 86 73 79 84 71 77 63 72 74
Male 12,339 80 89 72 79 81 72 82 63 72 70
African American 330 82 91 72 79 80 74 86 63 71 62
AmerIndian/Alaskan 326 79 88 74 74 80 71 83 64 65 65
Asian 348 81 90 76 78 84 73 81 66 69 79
Hispanic 4,052 80 88 73 79 80 72 83 64 70 67
Pacific Islander 250 78 86 70 78 83 69 75 63 70 74
White 18,591 79 87 73 79 83 71 79 63 72 73
LEP 1,757 82 91 73 78 81 75 86 64 68 69
Special Education 2,024 87 93 72 78 78 82 91 60 66 62
Section 504 Plan 1,118 79 86 73 79 83 71 78 64 73 68
*The classification index is based on n < 10.
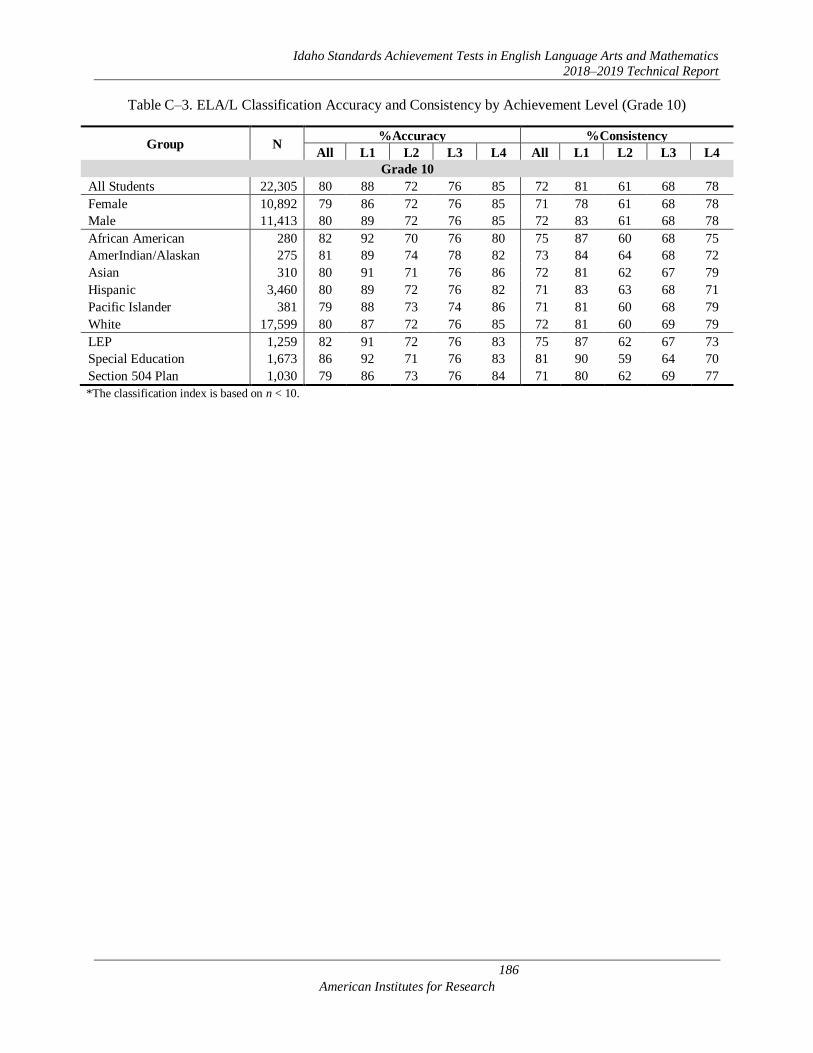
Idaho Standards Achievement Tests in English Language Arts and Mathematics
2018–2019 Technical Report
186
American Institutes for Research
Table C–3. ELA/L Classification Accuracy and Consistency by Achievement Level (Grade 10)
Group N %Accuracy %Consistency
All L1 L2 L3 L4 All L1 L2 L3 L4
Grade 10
All Students 22,305 80 88 72 76 85 72 81 61 68 78
Female 10,892 79 86 72 76 85 71 78 61 68 78
Male 11,413 80 89 72 76 85 72 83 61 68 78
African American 280 82 92 70 76 80 75 87 60 68 75
AmerIndian/Alaskan 275 81 89 74 78 82 73 84 64 68 72
Asian 310 80 91 71 76 86 72 81 62 67 79
Hispanic 3,460 80 89 72 76 82 71 83 63 68 71
Pacific Islander 381 79 88 73 74 86 71 81 60 68 79
White 17,599 80 87 72 76 85 72 81 60 69 79
LEP 1,259 82 91 72 76 83 75 87 62 67 73
Special Education 1,673 86 92 71 76 83 81 90 59 64 70
Section 504 Plan 1,030 79 86 73 76 84 71 80 62 69 77
*The classification index is based on n < 10.

Idaho Standards Achievement Tests in English Language Arts and Mathematics
2018–2019 Technical Report
187
American Institutes for Research
Table C–4. ELA/L Classification Accuracy and Consistency by Achievement Level (Grades 9 and 11)
Group N %Accuracy %Consistency
All L1 L2 L3 L4 All L1 L2 L3 L4
Grade 9
All Students 6,495 79 87 71 76 84 70 80 61 68 76
Female 3,164 78 85 71 76 85 70 76 60 69 77
Male 3,331 79 88 70 76 84 71 82 61 67 75
African American 64 83 95 69 79 81 77 91 59 66 79
AmerIndian/Alaskan 107 82 91 71 81 71* 74 86 59 73 59*
Asian 52 82 89* 75* 78 86 74 83* 56* 70 81
Hispanic 1,074 78 88 70 75 81 70 82 61 66 70
Pacific Islander 38 82 95 64* 80 80* 76 91 53* 71 77*
White 5,160 79 87 71 76 85 70 79 61 68 77
LEP 371 81 90 71 74 79 73 86 60 65 67
Special Education 536 85 92 70 75 76* 80 90 59 64 49*
Section 504 Plan 196 79 87 67 78 82 71 81 56 69 76
Grade 11
All Students 388 81 89 72 77 87 73 83 64 67 77
Female 197 80 86 72 77 86 72 80 63 67 78
Male 191 82 91 72 77 87 75 86 64 68 76
African American 4**
AmerIndian/Alaskan 8**
Asian 3**
Hispanic 60 83 90 72 79 95* 77 88 61 72 75*
Pacific Islander 5**
White 308 80 89 72 76 86 73 82 64 66 77
LEP 14 80 83 72* – – 75 84 62* – –
Special Education 66 84 93 63 59* 88* 80 88 59 37* 80*
Section 504 Plan 15 81 83* 84* 76* 83* 72 79* 66* 68* 82*
*The classification index is based on n < 10.
**Suppressed data due to the small sample size, n < 10.
Cells with “– “ indicate that no student was observed in the performance level.
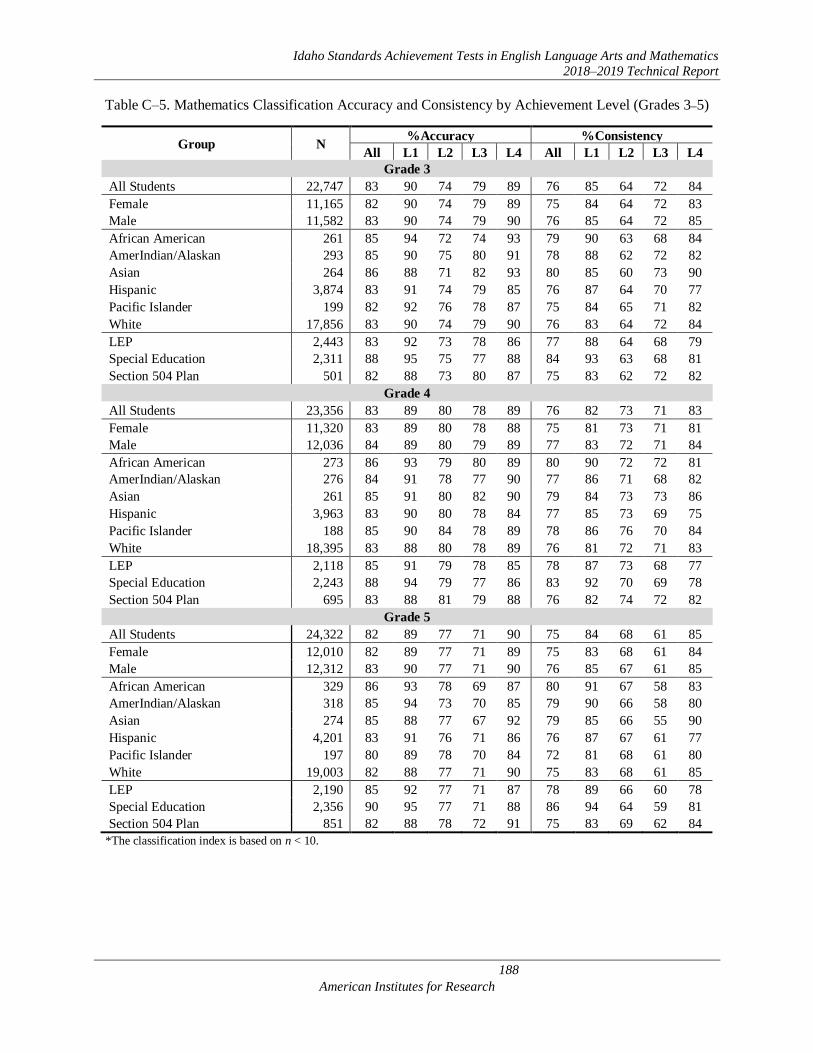
Idaho Standards Achievement Tests in English Language Arts and Mathematics
2018–2019 Technical Report
188
American Institutes for Research
Table C–5. Mathematics Classification Accuracy and Consistency by Achievement Level (Grades 3–5)
Group N %Accuracy %Consistency
All L1 L2 L3 L4 All L1 L2 L3 L4
Grade 3
All Students 22,747 83 90 74 79 89 76 85 64 72 84
Female 11,165 82 90 74 79 89 75 84 64 72 83
Male 11,582 83 90 74 79 90 76 85 64 72 85
African American 261 85 94 72 74 93 79 90 63 68 84
AmerIndian/Alaskan 293 85 90 75 80 91 78 88 62 72 82
Asian 264 86 88 71 82 93 80 85 60 73 90
Hispanic 3,874 83 91 74 79 85 76 87 64 70 77
Pacific Islander 199 82 92 76 78 87 75 84 65 71 82
White 17,856 83 90 74 79 90 76 83 64 72 84
LEP 2,443 83 92 73 78 86 77 88 64 68 79
Special Education 2,311 88 95 75 77 88 84 93 63 68 81
Section 504 Plan 501 82 88 73 80 87 75 83 62 72 82
Grade 4
All Students 23,356 83 89 80 78 89 76 82 73 71 83
Female 11,320 83 89 80 78 88 75 81 73 71 81
Male 12,036 84 89 80 79 89 77 83 72 71 84
African American 273 86 93 79 80 89 80 90 72 72 81
AmerIndian/Alaskan 276 84 91 78 77 90 77 86 71 68 82
Asian 261 85 91 80 82 90 79 84 73 73 86
Hispanic 3,963 83 90 80 78 84 77 85 73 69 75
Pacific Islander 188 85 90 84 78 89 78 86 76 70 84
White 18,395 83 88 80 78 89 76 81 72 71 83
LEP 2,118 85 91 79 78 85 78 87 73 68 77
Special Education 2,243 88 94 79 77 86 83 92 70 69 78
Section 504 Plan 695 83 88 81 79 88 76 82 74 72 82
Grade 5
All Students 24,322 82 89 77 71 90 75 84 68 61 85
Female 12,010 82 89 77 71 89 75 83 68 61 84
Male 12,312 83 90 77 71 90 76 85 67 61 85
African American 329 86 93 78 69 87 80 91 67 58 83
AmerIndian/Alaskan 318 85 94 73 70 85 79 90 66 58 80
Asian 274 85 88 77 67 92 79 85 66 55 90
Hispanic 4,201 83 91 76 71 86 76 87 67 61 77
Pacific Islander 197 80 89 78 70 84 72 81 68 61 80
White 19,003 82 88 77 71 90 75 83 68 61 85
LEP 2,190 85 92 77 71 87 78 89 66 60 78
Special Education 2,356 90 95 77 71 88 86 94 64 59 81
Section 504 Plan 851 82 88 78 72 91 75 83 69 62 84
*The classification index is based on n < 10.
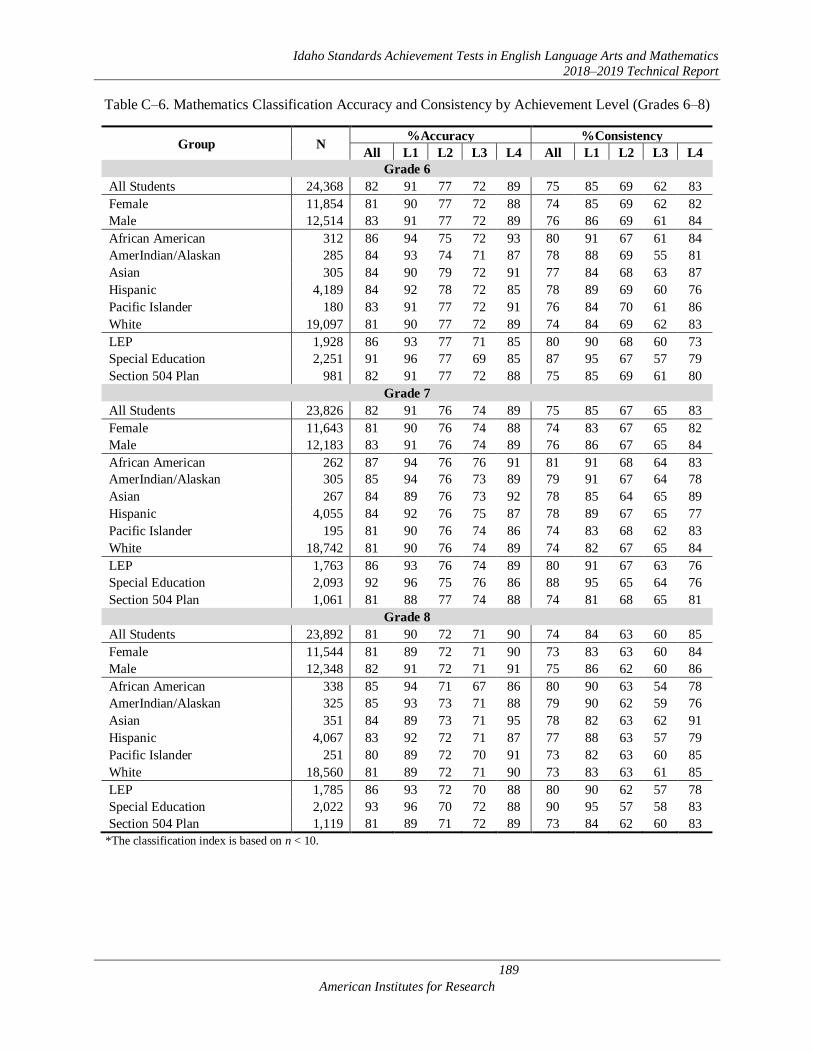
Idaho Standards Achievement Tests in English Language Arts and Mathematics
2018–2019 Technical Report
189
American Institutes for Research
Table C–6. Mathematics Classification Accuracy and Consistency by Achievement Level (Grades 6–8)
Group N %Accuracy %Consistency
All L1 L2 L3 L4 All L1 L2 L3 L4
Grade 6
All Students 24,368 82 91 77 72 89 75 85 69 62 83
Female 11,854 81 90 77 72 88 74 85 69 62 82
Male 12,514 83 91 77 72 89 76 86 69 61 84
African American 312 86 94 75 72 93 80 91 67 61 84
AmerIndian/Alaskan 285 84 93 74 71 87 78 88 69 55 81
Asian 305 84 90 79 72 91 77 84 68 63 87
Hispanic 4,189 84 92 78 72 85 78 89 69 60 76
Pacific Islander 180 83 91 77 72 91 76 84 70 61 86
White 19,097 81 90 77 72 89 74 84 69 62 83
LEP 1,928 86 93 77 71 85 80 90 68 60 73
Special Education 2,251 91 96 77 69 85 87 95 67 57 79
Section 504 Plan 981 82 91 77 72 88 75 85 69 61 80
Grade 7
All Students 23,826 82 91 76 74 89 75 85 67 65 83
Female 11,643 81 90 76 74 88 74 83 67 65 82
Male 12,183 83 91 76 74 89 76 86 67 65 84
African American 262 87 94 76 76 91 81 91 68 64 83
AmerIndian/Alaskan 305 85 94 76 73 89 79 91 67 64 78
Asian 267 84 89 76 73 92 78 85 64 65 89
Hispanic 4,055 84 92 76 75 87 78 89 67 65 77
Pacific Islander 195 81 90 76 74 86 74 83 68 62 83
White 18,742 81 90 76 74 89 74 82 67 65 84
LEP 1,763 86 93 76 74 89 80 91 67 63 76
Special Education 2,093 92 96 75 76 86 88 95 65 64 76
Section 504 Plan 1,061 81 88 77 74 88 74 81 68 65 81
Grade 8
All Students 23,892 81 90 72 71 90 74 84 63 60 85
Female 11,544 81 89 72 71 90 73 83 63 60 84
Male 12,348 82 91 72 71 91 75 86 62 60 86
African American 338 85 94 71 67 86 80 90 63 54 78
AmerIndian/Alaskan 325 85 93 73 71 88 79 90 62 59 76
Asian 351 84 89 73 71 95 78 82 63 62 91
Hispanic 4,067 83 92 72 71 87 77 88 63 57 79
Pacific Islander 251 80 89 72 70 91 73 82 63 60 85
White 18,560 81 89 72 71 90 73 83 63 61 85
LEP 1,785 86 93 72 70 88 80 90 62 57 78
Special Education 2,022 93 96 70 72 88 90 95 57 58 83
Section 504 Plan 1,119 81 89 71 72 89 73 84 62 60 83
*The classification index is based on n < 10.
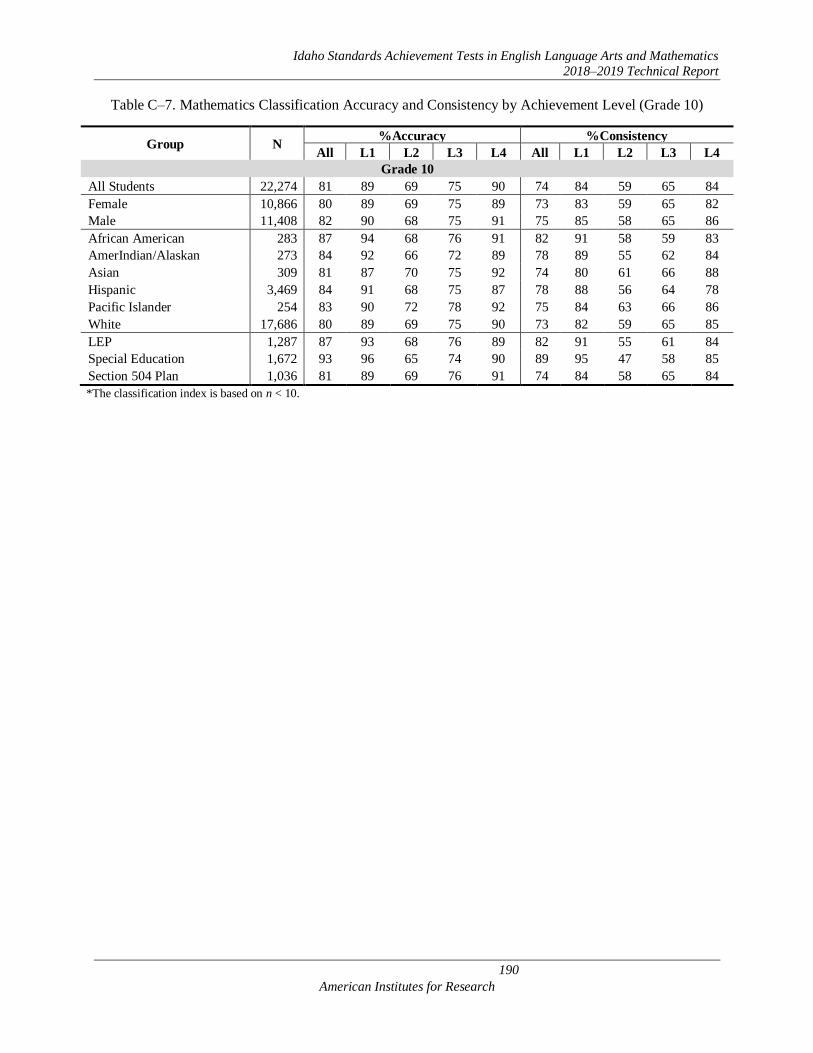
Idaho Standards Achievement Tests in English Language Arts and Mathematics
2018–2019 Technical Report
190
American Institutes for Research
Table C–7. Mathematics Classification Accuracy and Consistency by Achievement Level (Grade 10)
Group N %Accuracy %Consistency
All L1 L2 L3 L4 All L1 L2 L3 L4
Grade 10
All Students 22,274 81 89 69 75 90 74 84 59 65 84
Female 10,866 80 89 69 75 89 73 83 59 65 82
Male 11,408 82 90 68 75 91 75 85 58 65 86
African American 283 87 94 68 76 91 82 91 58 59 83
AmerIndian/Alaskan 273 84 92 66 72 89 78 89 55 62 84
Asian 309 81 87 70 75 92 74 80 61 66 88
Hispanic 3,469 84 91 68 75 87 78 88 56 64 78
Pacific Islander 254 83 90 72 78 92 75 84 63 66 86
White 17,686 80 89 69 75 90 73 82 59 65 85
LEP 1,287 87 93 68 76 89 82 91 55 61 84
Special Education 1,672 93 96 65 74 90 89 95 47 58 85
Section 504 Plan 1,036 81 89 69 76 91 74 84 58 65 84
*The classification index is based on n < 10.

Idaho Standards Achievement Tests in English Language Arts and Mathematics
2018–2019 Technical Report
191
American Institutes for Research
Table C–8. Mathematics Classification Accuracy and Consistency by Achievement Level (Grades 9 and
11)
Group N %Accuracy %Consistency
All L1 L2 L3 L4 All L1 L2 L3 L4
Grade 9
All Students 6,515 79 89 68 70 85 71 84 58 60 74
Female 3,162 77 88 69 71 83 69 82 59 60 70
Male 3,353 80 91 68 70 87 73 86 57 60 77
African American 76 86 94 71 66* 81* 80 90 62 53* 74*
AmerIndian/Alaskan 108 82 91 68 65 83* 75 88 54 55 67*
Asian 51 78 92 65 68 94* 71 85 59 57 82*
Hispanic 1,107 81 91 67 70 83 74 87 57 56 68
Pacific Islander 41 83 93 63* 75* 89* 77 89 54* 67* 78*
White 5,132 78 89 68 70 85 70 83 58 60 75
LEP 404 85 93 66 70 83* 80 90 55 53 61*
Special Education 528 92 95 67 70 88* 88 95 49 58 66*
Section 504 Plan 197 79 88 67 69 83 71 85 56 58 74
Grade 11
All Students 421 87 95 73 77 88 82 92 64 66 83
Female 217 87 95 73 80 84 82 92 65 68 77
Male 204 87 94 73 73 90 82 92 63 62 86
African American 4**
AmerIndian/Alaskan 8**
Asian 4**
Hispanic 66 91 96 72* 67* 93* 88 95 59* 57* 88*
Pacific Islander 5**
White 334 86 94 73 77 88 80 91 65 67 82
LEP 17 99 99 – – – 98 99 – – –
Special Education 69 95 98 72* 75* – 94 98 54* 71* –
Section 504 Plan 15 84 93* 77* 80* – 76 83* 71* 57* –
*The classification index is based on n < 10.
**Suppressed data due to the small sample size, n < 10.
Cells with “– “ indicate that no student was observed in the performance level.
Related Documents