© Huron Consulting Services LLC. All rights reserved. Yale School of Medicine Yale Center for Clinical Investigation Regional Clinical Research Management Workshop February 22, 2011

© Huron Consulting Services LLC. All rights reserved. Yale School of Medicine Yale Center for Clinical Investigation Regional Clinical Research Management.
Dec 19, 2015
Welcome message from author
This document is posted to help you gain knowledge. Please leave a comment to let me know what you think about it! Share it to your friends and learn new things together.
Transcript

© Huron Consulting Services LLC. All rights reserved.
Yale School of MedicineYale Center for Clinical Investigation
Regional Clinical Research Management Workshop
February 22, 2011

Agenda
I. CRC Organization Improvement
II. Cost Recovery Initiative
2

Introductions

Rick Rohrbach, Managing Director Experience: 18+ years
Focus Area: Strategic planning, and performance improvement for the research mission of academic medical centers and health systems. Lead Huron’s Clinical Research Services team.
Recent Clients: Dartmouth University, University of California at San Francisco, Weill Cornell Medical College, Premier Health Partners, Kansas City Area Life Sciences Institute
Kathleen Shaw, Director Experience: 15+ years
Focus Area: Academic Medical Center strategic planning, operations improvement, financial planning, budgeting, feasibility studies, physician compensation and revenue cycle improvement
Recent Clients: Northwestern University, Duke University, University of California at San Francisco, George Washington University
Introductions
4

Topic 1
CRC Organization Improvement

CRC Organization ImprovementEngagement Overview
6
UCSF CTSI Clinical Research Services - Identify cost reduction and revenue enhancement opportunities
Approach & Outputs
Cost value mapping Process analyses and
process mapping Database of opportunities Business case
development Risk assessment Cost savings and
resources defined
In-Scope Locations
UCSF Medical Center – 12 Moffitt
UCSF Medical Center – 6 Moffitt
SFGH Mt. Zion Tenderloin CRC
Project Phases
Phase IInitiate /
Discover / Design
Phase II Develop / Deliver
Project Objectives
Review of operational efficiency and organizational resources and alignments
CRC resources Financial management Research support services CRC utilization CRC technology support
Recommendations for design, optimization, priority, resources, and savings to support UCSF researchers in high quality clinical trials, clinical research and services

UCSF CTSI Clinical Research ServicesUCSF’s CTSI is among the first of the CTSA awardees and is also one of the largest and most complex
7
• 10 research units at 8 siteso 5 university-ownedo 3 affiliate relationships
• 250+ investigators• 365 inpatient and outpatient
protocols annually• Two-thirds of annual budget
provided by CTSA funds
UCSF Clinical & Translational Science
InstituteClinical Research Services
SFGH
Moffitt Hospital Adult
Mount Zion
NICCU
Moffitt Hospital Pediatrics
Tenderloin
CHORI Adult
CHORI Pediatrics
Kaiser
SFVA
1
2
3
4
5
6
7
8
Body Composition & Exercise Labs
Sample Processing Labs
Clinical Coordinators
Bionutrition
Administrative Managers
Core Labs

Information Review & Analysis
8
Huron Proprietary Data
• Database of past opportunities• Ratio analysis• Key performance metrics• Subject matter experts
Internal Data Requests
• Actual financial data – Y3-4, Y5 YTD
• Budgetary data – Y5• Organizational charts: CTSI and
cores• Position descriptions• Training documents• Process maps
Public Research
• Websites• Annual reports• Organizational charts• Process maps• Policy inventories
Meetings and Interviews
• CTSI / CRS Leadership interviews
• One-on-one faculty and staff interviews
• Medical directors• Key PIs• Core directors / managers
• Desk reviews, e.g., • Protocol managers• Admin directors
• Huron’s proprietary network of contacts (external)
Reflective
Informative
Indicative
Requires self-evaluation
Provides perspective
Facilitates learning
Identifies differences
Indicates potential improvements
Quantitative Qualitative
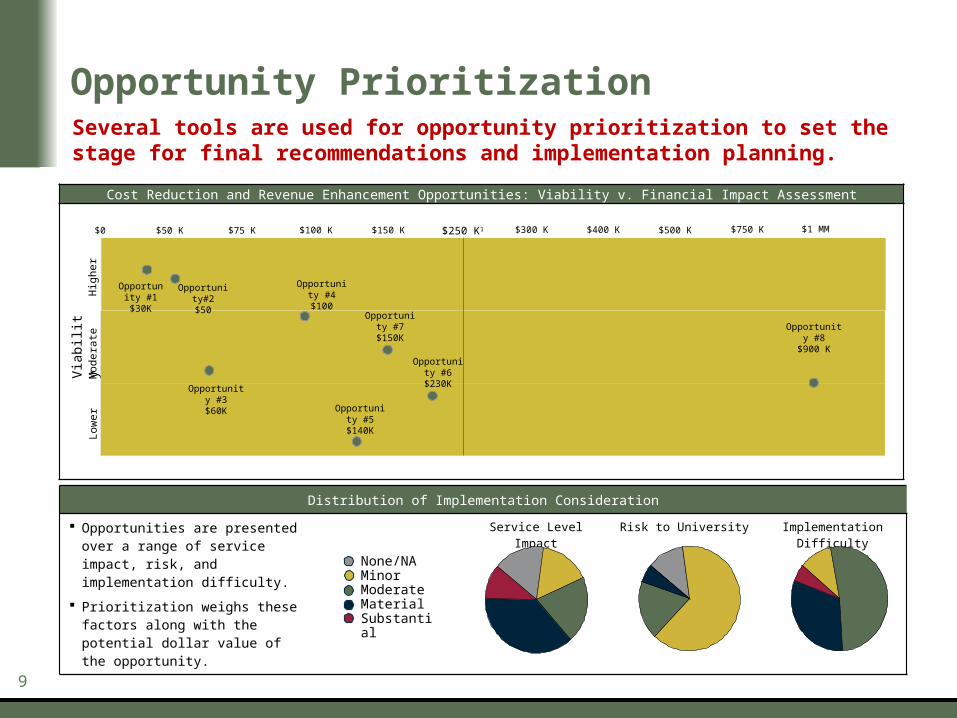
Distribution of Implementation Consideration
Opportunities are presented over a range of service impact, risk, and implementation difficulty.
Prioritization weighs these factors along with the potential dollar value of the opportunity.
Service Level Impact Risk to University Implementation Difficulty
Opportunity PrioritizationSeveral tools are used for opportunity prioritization to set the stage for final recommendations and implementation planning.
9
Cost Reduction and Revenue Enhancement Opportunities: Viability v. Financial Impact Assessment
None/NAMinorModerateMaterialSubstantial
Via
bilit
yLo
wer
Mod
erat
eH
ighe
r
Opportunity #8
$900 K
Opportunity #1
$30K
Opportunity #3
$60K
Opportunity #4
$100
Opportunity #6
$230K
Opportunity#2$50
$250 K1$50 K $75 K $100 K $150 K $1 MM$300 K $400 K $500 K $750 K$0
Opportunity #5
$140K
Opportunity #7
$150K

Topic 2
Cost Recovery Initiative

Cost Recovery
11
As part of its CTSA renewal, UCSF CTSI has made a commitment to expand its cost recovery efforts via a more formal and structured recharge process.
1. Offsets to expected cuts in institutional and CTSA grant support, given California State budget cuts, and expected decreases in CTSA renewal level
2. Increased ability to support early stage research for young and under-represented faculty
3. Incremental funds to enable continued enhancement of services and infrastructure
Charge to Core Programs
1. Reduce dependence upon core CTSA funding
2. Optimize revenue generation from recharge and institutional support
Recharge Goals
Step 1: CostFull cost budget for CRS services
Step 2: Negotiate & Budget
Recharge budget
• Direct costs by core• Facility fees• Administration fees• Indirect costs
• Study type• PI experience / level• Total grant budget• Budget flexibility
Step 3: RechargeActivity / invoicing
• Monthly utilization or volume by study
• Charge master / rate agreements
• Single charge against DPA account
• Activity report to PI
Cost Recovery Process

Core Base Level of Service vs. Full Cost & RechargeThe UCSF CTSI CRS cores have traditionally employed the concept of a base level of service provided “free of charge” to investigators. This concept is changing.
12
• Historical approach describing base level of services provided for clinical studies at no charge to the PI / study
• Constructed around concept of:
• Differentiating service by levels of intensity or complexity;
• Identifying non-standard activities;
• Providing basic level of consultation services to help PIs design studies
• Limited relationship with actual costs of providing services
• Recharge / recovery on Category “D” studies marginally linked to service costs
• Essential business management activity: fully costing all services provided for better assessment, control and management
• Acknowledges cost of doing business and concept of “shared” investment in research across PI/CTSI-CRS/mentor/and department/division
• Formalizes and standardizes, wherever possible, policies
• Clearly differentiates between “cost” and “recovery”
Historical: Base Level of Service New Model: Full Cost + Recharge

Costing Approach
13
Using a costing tool, direct protocol activities are identified and costed based on established use rate / activity level rules. Indirect costs and use fees to cover rent, equipment maintenance and general supplies are charged based on space usage.
a. Hours/unit b. Rate c. Costs (a x b)
d. # of meals, misc. exp. e. Other Costs
Total Costs (c. + e.)
0.00 $0.00 $0.00 - $0.000.00 $0.00 $0.00 $0.000.00 $0.00 $0.00 $0.00
Bionutrition - RD services (hrs.) 0.00 $0.00 $0.000.00 $0.00 $0.00 $0.00
Bionut. - Food costs (snacks) $0.00 $0.00
$0.00$0.00
Bionutrition Use Fee 0.00 $0.00 $0.00 $0.000.00 $0.00 $0.00 $0.000.00 $0.00 $0.00 $0.000.00 $0.00 $0.00 $0.00
BCOMP Use Fee 0.00 $0.00 $0.00 $0.000.00 $0.00 $0.00 $0.00
$0.00 $0.000.00 $0.00 $0.00 $0.00
$0.00 $0.00Administrative Fee - $0.00 $0.00 $0.00
Grand Total: $0 $0 $0
NCRC Personnel Costs (hrs)
BODY COMP /EX P HYS/METAB (hrs)
SECTION B - SUMMARY OF COSTS
Sample Proc. Use Fee
Nursing Use Fee Indirect Nursing Hrs.
CHR Services
Services
Nursing Personnel Costs (hrs.)
Bionut. - Metab Kitchen Staff
Sample Proc. Personnel
Develop/Cog Eval Use FeeDevelop/Cognitive Eval (hrs)
Bionut. - Food costs (meals)Bionutrition formula prep costs

Key Recharge Policies
14
While final recharge policies are still being formalized, CRS leadership has agreed upon a set of key principles.
• Investigators submitting “new” and/or “renewal” grant applications, and who intend to use CRS to conduct their study, should include full, allowable CRS costs in their grant budgets
• All new CRS applications received, where sponsor funding was secured prior to the new cost recovery initiative, will be “grandfathered” in under the old “Core Base Level of Service” policies
• Costs are to reflect actual infrastructure differences by study site, e.g., rent variations
• CRS will recover full costs on studies funded by industry
• Studies funded by NIH and other non-profit entities have some expectation of cost recovery
• Studies led by early career investigators will not have recovery expectations
• Cost recovery is not a mechanism to generate profits, but an initiative to offset a portion of costs

Questions?

16
Related Documents