Fundamental Analysis – looks at financials, product, mgt., history, etc. PE ratio – Price / E.P.S. Zero-Growth Dividend (preferred stock) Constant.
Dec 26, 2015
Welcome message from author
This document is posted to help you gain knowledge. Please leave a comment to let me know what you think about it! Share it to your friends and learn new things together.
Transcript


Fundamental Analysis – looks at financials, product, mgt., history, etc.• PE ratio – Price / E.P.S.• Zero-Growth Dividend (preferred stock)• Constant Growth Dividend (DCF)• Nonconstant Growth
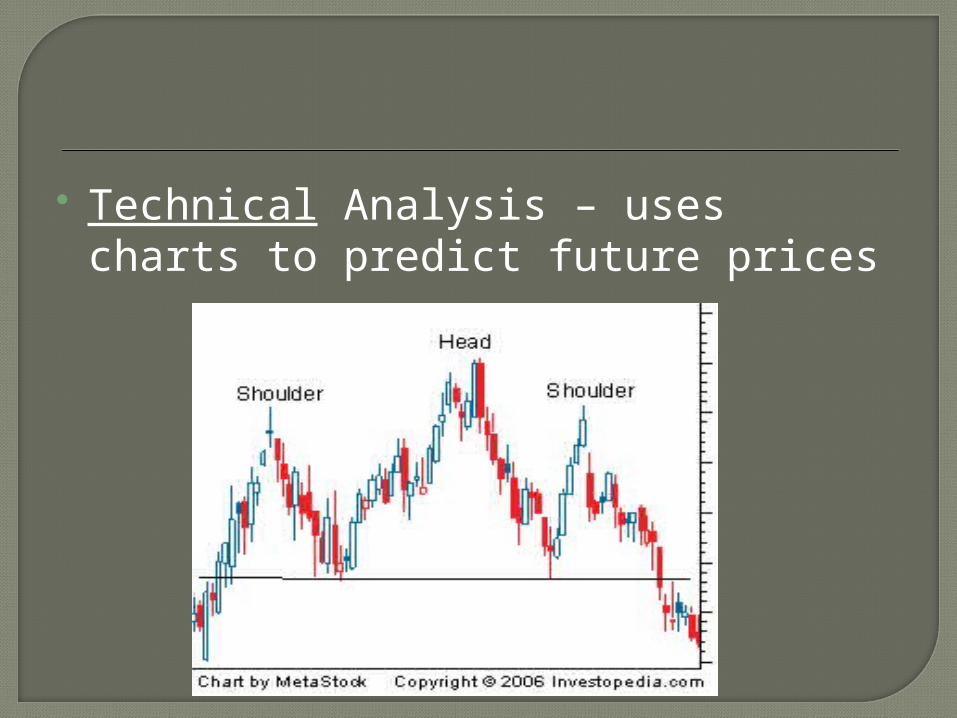
Technical Analysis – uses charts to predict future prices
Industry Average PE X Company’s EPS• If company EPS = $2.20 and industry
average PE = 20, stock should sell around $_____.
• Factors affected a company’s PE include: Risk Expected future growth Management Dividends
Preferred has preference in claims to assets and dividends – must be paid before common.
Preferred dividends – fixed Common dividends – fluctuate Preferred usually have no voting
rights

P0 = Value of Preferred Stock
= PV of ALL dividends discounted at investor’s Required Rate of Return
52 Weeks Yld Vol NetHi Lo Stock Sym Div % PE 100s Hi Lo Close Chg
s 42½ 29 QuakerOats OAT 1.14 3.3 24 5067 35 34¼ 34¼ -¾s 36¼ 25 RJR Nabisco RN .08p ... 12 6263 29¾ 285/8 287/8 -¾
237/8 20 RJR Nab pfB 2.31 9.7 ... 966 24 235/8 23¾ ...
7¼ 5½ RJR Nab pfC .60 9.4 ... 2248 6½ 6¼ 63/8 -1/8
0 1 2 3
P0=23.75 D1=2.31 D2=2.31 D3=2.31 D=2.31
237/8 20 RJR Nab pfB 2.31 9.7 ... 966 24 235/8 23¾ ...
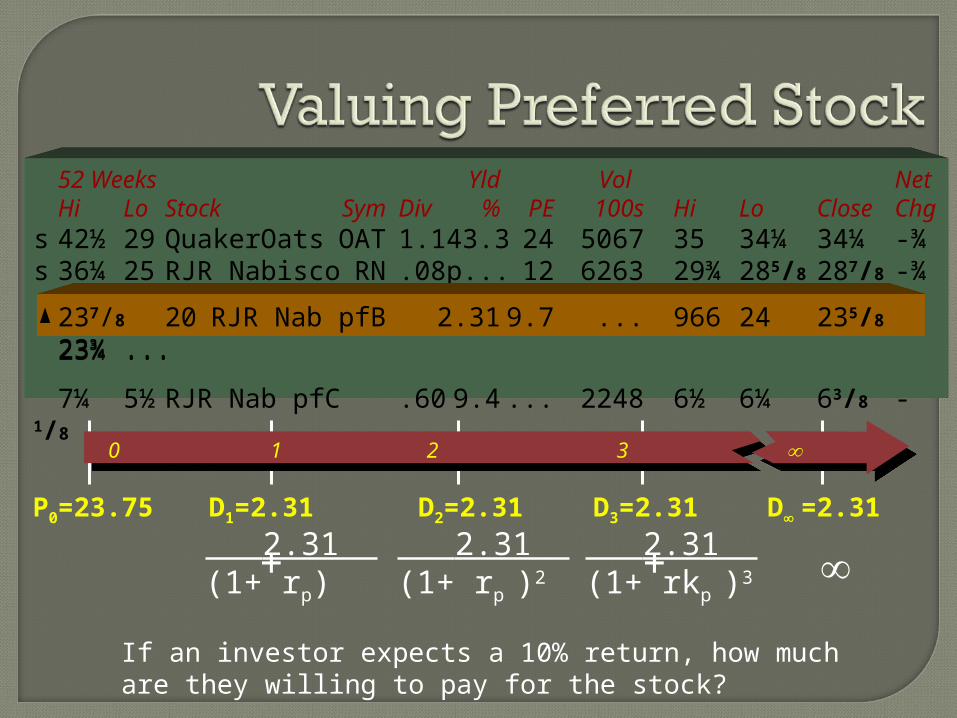
P0 = + + +··· 2.31 (1+ rp)
2.31 (1+ rp )2
2.31 (1+ rkp )3
52 Weeks Yld Vol NetHi Lo Stock Sym Div % PE 100s Hi Lo Close Chg
s 42½ 29 QuakerOats OAT 1.14 3.3 24 5067 35 34¼ 34¼ -¾s 36¼ 25 RJR Nabisco RN .08p ... 12 6263 29¾ 285/8 287/8 -¾
237/8 20 RJR Nab pfB 2.31 9.7 ... 966 24 235/8 23¾ ...
7¼ 5½ RJR Nab pfC .60 9.4 ... 2248 6½ 6¼ 63/8 -1/8
0 1 2 3
P0=23.75 D1=2.31 D2=2.31 D3=2.31 D=2.31
237/8 20 RJR Nab pfB 2.31 9.7 ... 966 24 235/8 23¾ ...
If an investor expects a 10% return, how much are they willing to pay for the stock?
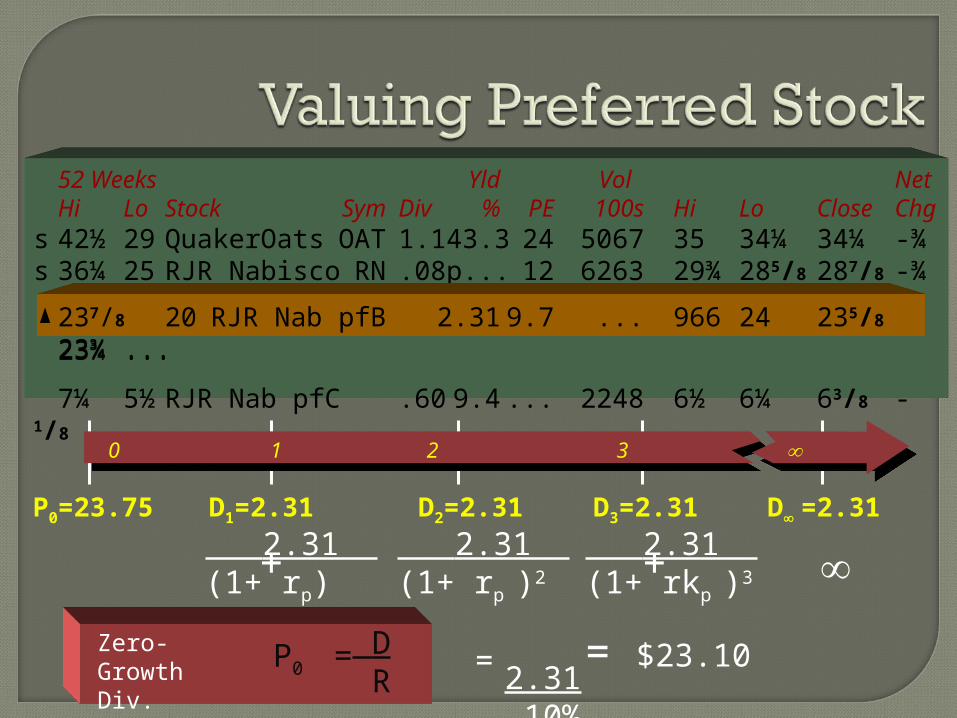
P0 = D R
= 2.31 10%
= $23.10
P0 = + + +··· 2.31 (1+ rp)
2.31 (1+ rp )2
2.31 (1+ rkp )3
52 Weeks Yld Vol NetHi Lo Stock Sym Div % PE 100s Hi Lo Close Chg
s 42½ 29 QuakerOats OAT 1.14 3.3 24 5067 35 34¼ 34¼ -¾s 36¼ 25 RJR Nabisco RN .08p ... 12 6263 29¾ 285/8 287/8 -¾
237/8 20 RJR Nab pfB 2.31 9.7 ... 966 24 235/8 23¾ ...
7¼ 5½ RJR Nab pfC .60 9.4 ... 2248 6½ 6¼ 63/8 -1/8
0 1 2 3
P0=23.75 D1=2.31 D2=2.31 D3=2.31 D=2.31
237/8 20 RJR Nab pfB 2.31 9.7 ... 966 24 235/8 23¾ ...
Zero-GrowthDiv. Model
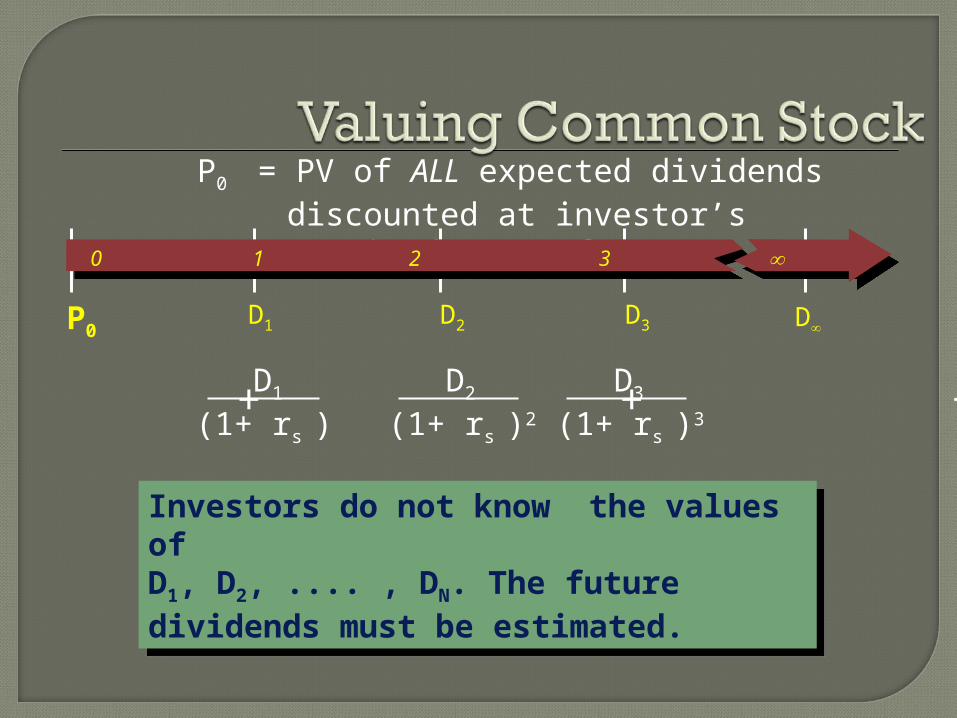
P0 = PV of ALL expected dividends discounted at investor’s Required Rate of Return
Investors do not know the values of D1, D2, .... , DN. The future dividends must be estimated.
Investors do not know the values of D1, D2, .... , DN. The future dividends must be estimated.
D1 D2 D3P0D
0 1 2 3
P0 = + + +··· D1
(1+ rs ) D2
(1+ rs )2
D3
(1+ rs )3
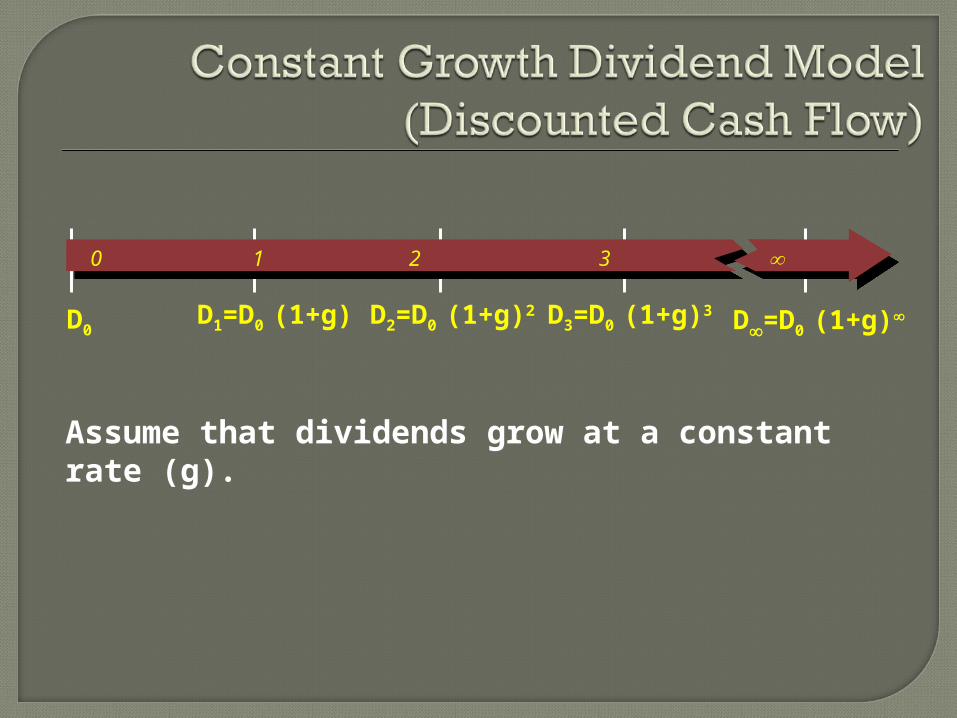
Assume that dividends grow at a constant rate (g).
D1=D0 (1+g)D0D2=D0 (1+g)2 D3=D0 (1+g)3 D=D0 (1+g)
0 1 2 3

Requires r > g
Requires r > g
Reduces to:
P0 = + + + ··· + D0 (1+ g)(1+ rs )
D0 (1+ g)2
(1+ rs )2
D0 (1+ g)3
(1+ rs )3
P0 = = D0(1+g) r – g
D1
r – g
D1=D0 (1+g)D0D2=D0 (1+g)2 D3=D0 (1+g)3 D=D0 (1+g)
0 1 2 3

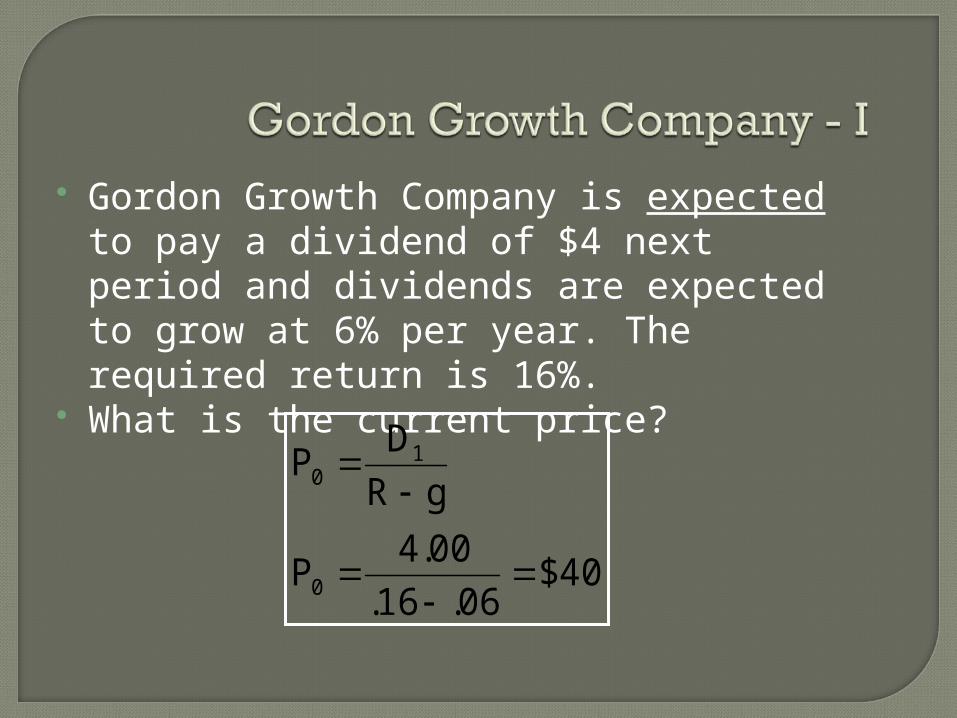
Gordon Growth Company is expected to pay a dividend of $4 next period and dividends are expected to grow at 6% per year. The required return is 16%.
What is the current price?
40$06.16.
00.4P
gR
DP
0
10

What is the price expected to be in year 4?
50.50$06.16.
)06.1(00.4P
)g1(DD
g-R
D
gR
)g1(DP
4
4
415
544
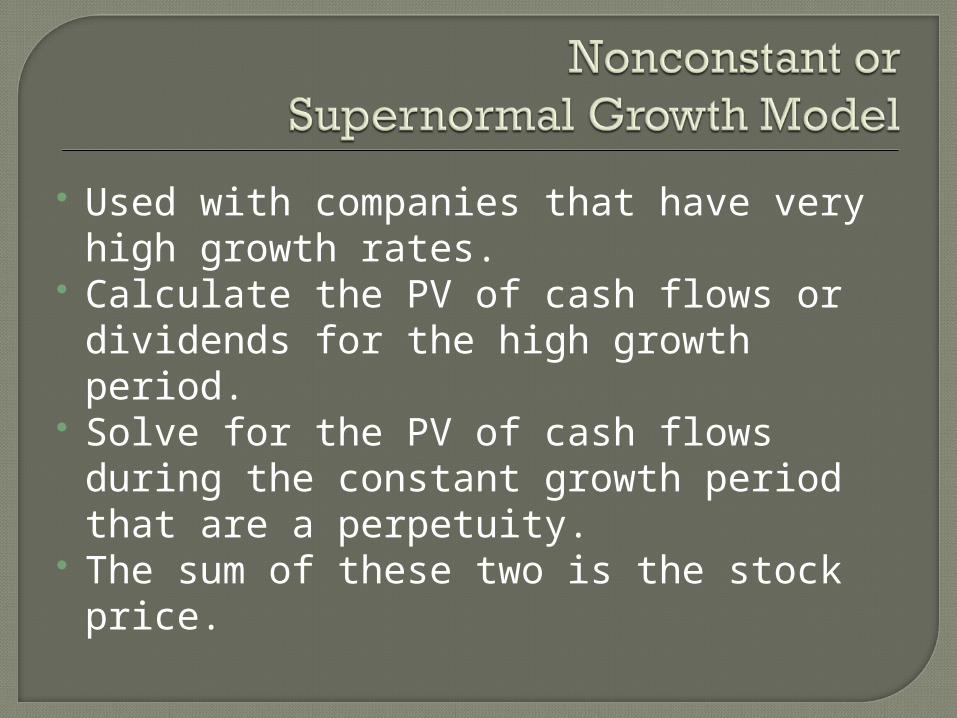
Used with companies that have very high growth rates.
Calculate the PV of cash flows or dividends for the high growth period.
Solve for the PV of cash flows during the constant growth period that are a perpetuity.
The sum of these two is the stock price.

9999 0000 0101 0202 0303 0404 0505 0606 0707 0808 0909 1010 1111 1212
SalesSales .2M.2M 6M6M 86M86M 440M440M 1.4B1.4B 3B3B 6B6B 10B10B 16B16B 21B21B 23B23B 29B29B 37B37B 50B50B
Net Net IncomeIncome -6M-6M -15M-15M 7M7M 100M100M 105M105M 400400
MM1.41.4
BB3B3B 4.2B4.2B 4.2B4.2B 6.5B6.5B 8.5B8.5B 9.7B9.7B 10.710.7
BB

Can no longer only use constant growth model.
However, growth becomes constant after 3 years.
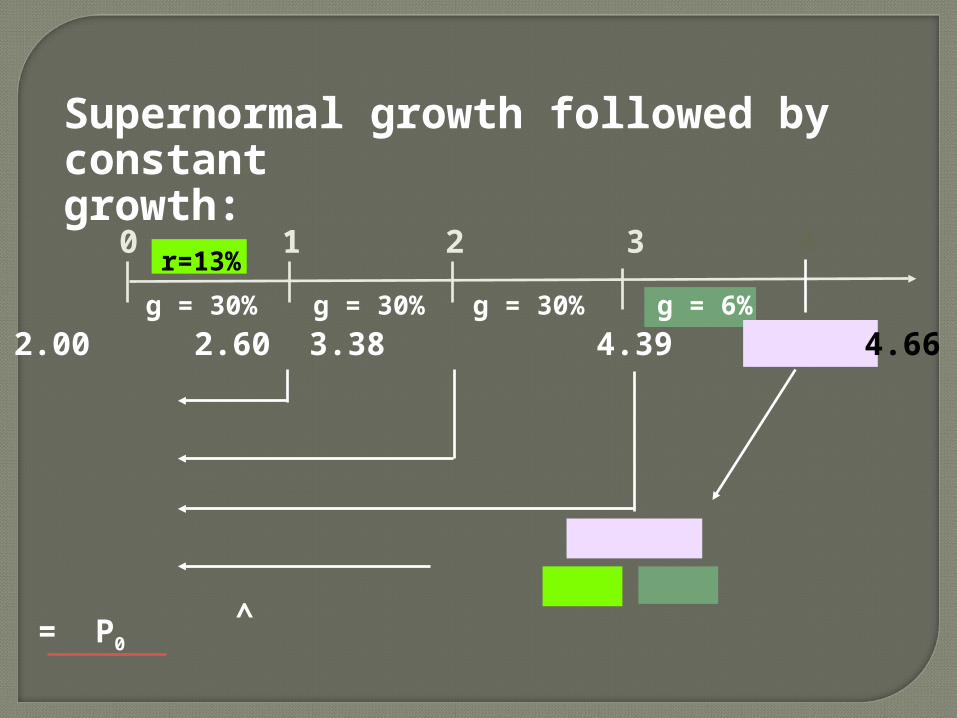
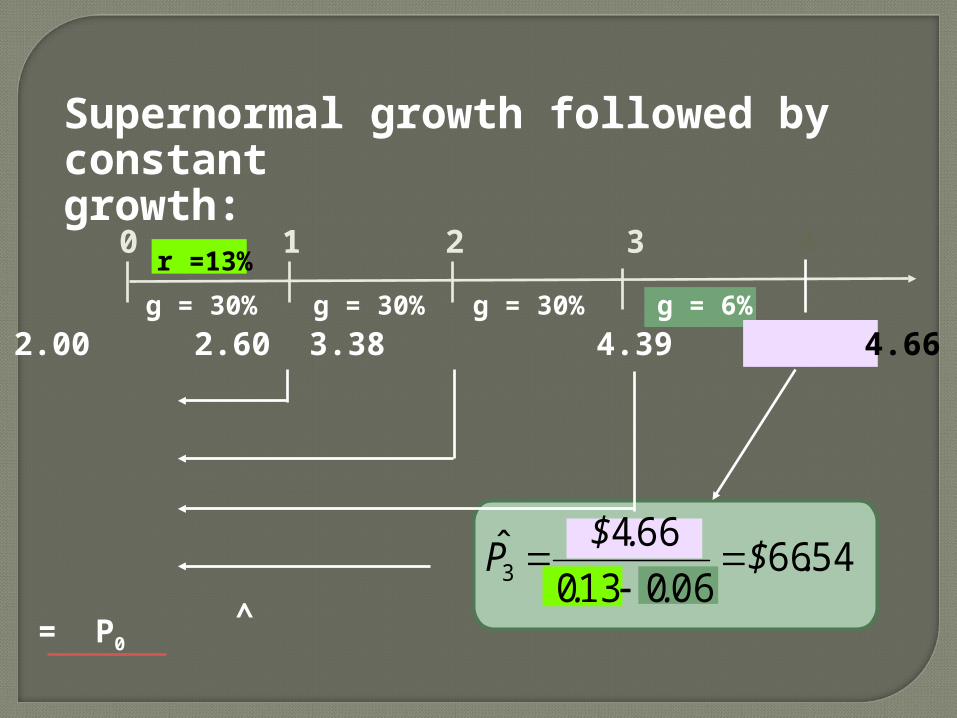
Supernormal growth followed by constantgrowth:
0 1 2 3 4r=13%
= P0
g = 30% g = 30% g = 30% g = 6%
D0 = 2.00 2.60 3.38 4.39 4.66
^
Supernormal growth followed by constantgrowth:
0 1 2 3 4r =13%
= P0
g = 30% g = 30% g = 30% g = 6%
D0 = 2.00 2.60 3.38 4.39 4.66
^
5466060130
6643̂ .$
..
.$P

Supernormal growth followed by constantgrowth:
0
2.30
2.65
3.05
46.11
1 2 3 4rs=13%
54.11 = P0
g = 30% g = 30% g = 30% g = 6%
D0 = 2.00 2.60 3.38 4.39 4.66
^
5466060130
6643̂ .$
..
.$P
Do not add in D0

0 1 2 3 4rs=13%
g = 0% g = 0% g = 0% g = 6%
2.00 2.00 2.00 2.12
.P3
...

0 1 2 3 4rs=13%
g = 0% g = 0% g = 0% g = 6%
2.00 2.00 2.00 2.12
2.12.
P3 0 0730.29
...
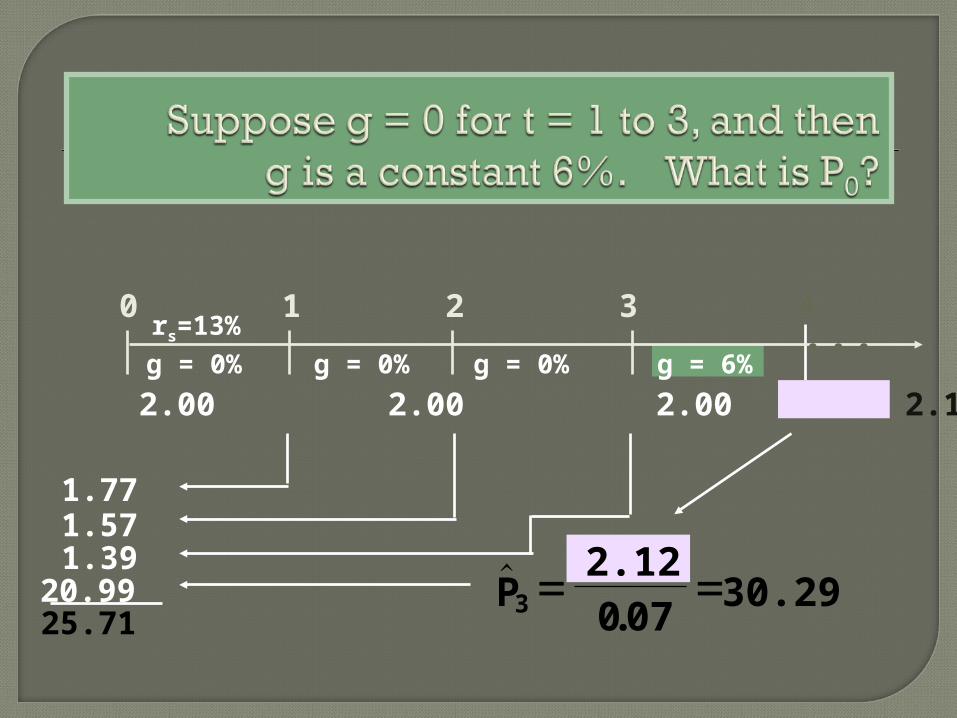
0
1.771.571.39
20.99
1 2 3 4rs=13%
25.71
g = 0% g = 0% g = 0% g = 6%
2.00 2.00 2.00 2.12
2.12.
P3 0 0730.29
...

Terminal Value – the (present) value, at the horizon date, of all future dividends after that date.
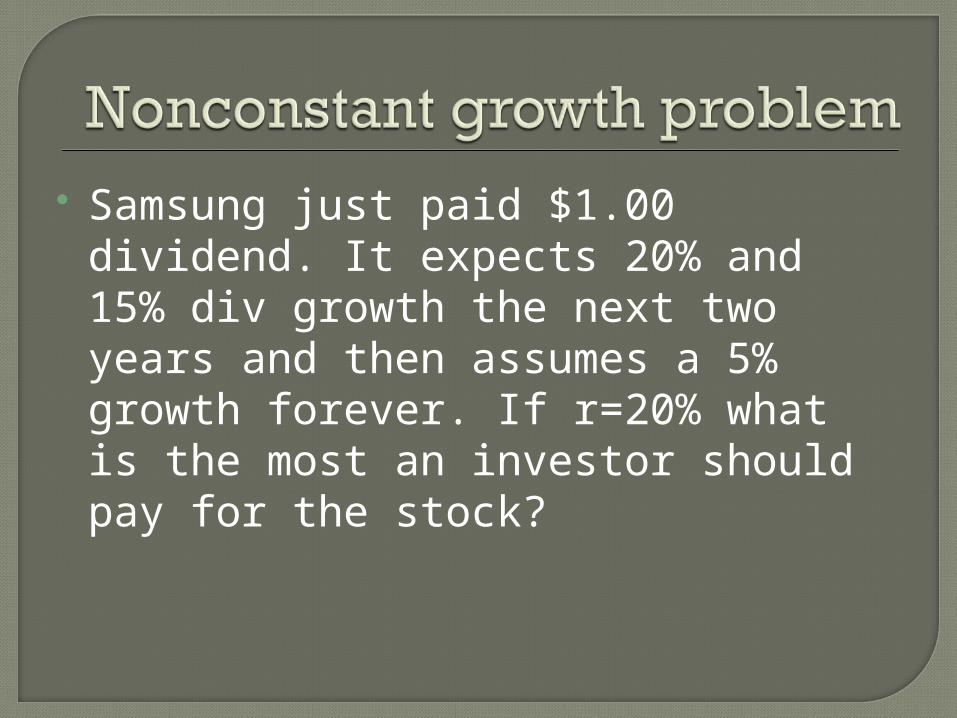
Samsung just paid $1.00 dividend. It expects 20% and 15% div growth the next two years and then assumes a 5% growth forever. If r=20% what is the most an investor should pay for the stock?
22
22
11
0 )R1(
P
R1
D
R1
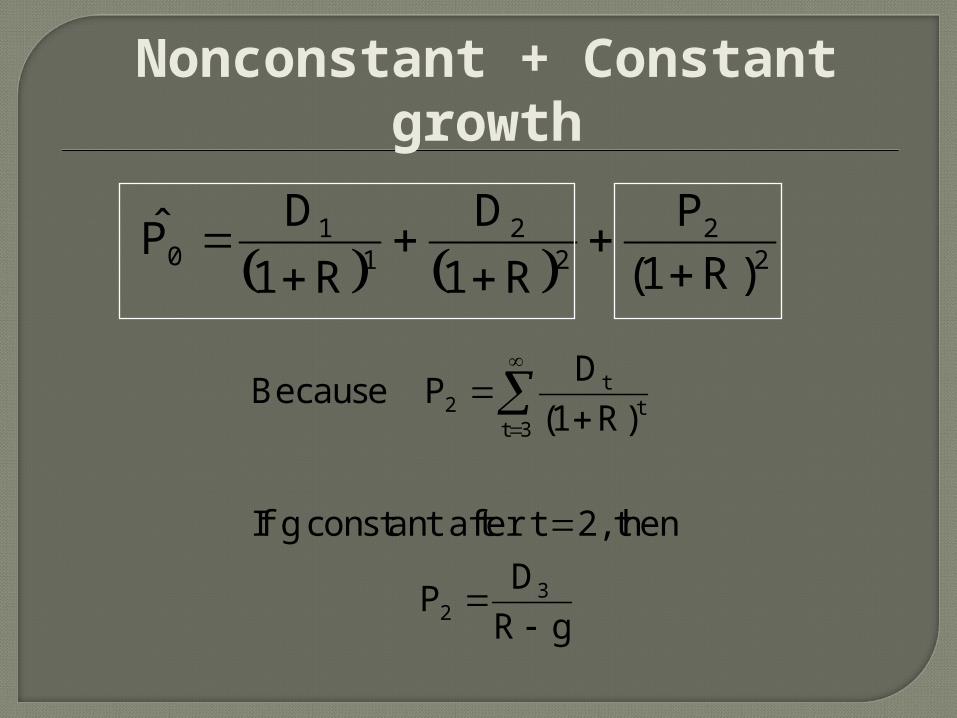
DP̂
gR
DP
then 2,t after constant g If
)R1(
DP Because
32
3tt
t2
Nonconstant + Constant growth

0
1.00
0.96
6.71
1 2 3R = 20%
8.67 = P0
g = 20% g = 15% g = 5%
D0 = 1.00 1.20 1.38 1.449
$1.449P2 = ^
0.20 – 0.05= $9.66

The Jones Company has decided to undertake a large project. Consequently, there is a need for additional funds. The financial manager plans to issue preferred stock with a perpetual annual dividend of $5 per share.
If the required return on this stock is currently 20 percent, what should be the stock's market value?
The Jones Company has decided to undertake a large project. Consequently, there is a need for additional funds. The financial manager plans to issue preferred stock with a perpetual annual dividend of $5 per share. If the required return on this stock is currently 20 percent, what should be the stock's market value?
5 ∕ .20 = 25

A share of preferred stock pays a quarterly dividend of $2.50. If the price of this preferred stock is currently $50, what is the nominal annual rate of return?

A share of preferred stock pays a quarterly dividend of $2.50. If the price of this preferred stock is currently $50, what is the nominal annual rate of return?
2.5 X 4 = 10/year10/50 = 20%
McKenna Motors is expected to pay a $1.00 per-share dividend at the end of the year (D1 = $1.00). The stock sells for $20 per share and its required rate of return is 11 percent. The dividend is expected to grow at a constant rate, g, forever. What is the growth rate, g, for this stock?
P0 = D1
R – g
McKenna Motors is expected to pay a $1.00 per-share dividend at the end of the year (D1 = $1.00). The stock sells for $20 per share and its required rate of return is 11 percent. The dividend is expected to grow at a constant rate, g, forever. What is the growth rate, g, for this stock?
D1/(R-g) = 201/(.11-g) = 201 = 2.2 – 20g
-1.2 = -20g-1.2/-20 = g
.06 = g
A share of common stock has just paid a dividend of $2.00. If the expected long-run growth rate for this stock is 15%, and if investors require a 19% rate of return, what is the price of the stock?

A share of common stock has just paid a dividend of $2.00. If the expected long-run growth rate for this stock is 15%, and if investors require a 19% rate of return, what is the price of the stock?
2.00 X (1.15) = 2.30 = D1
P = 2.30 / (.19 - .15)P = 2.30 / .04
P = $57.5
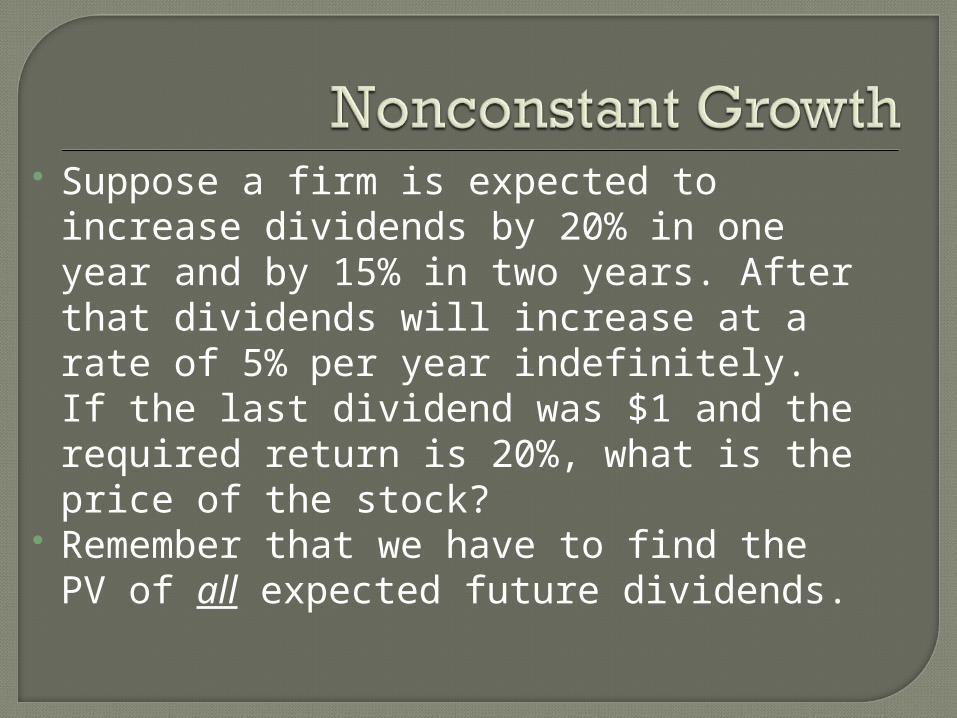
Suppose a firm is expected to increase dividends by 20% in one year and by 15% in two years. After that dividends will increase at a rate of 5% per year indefinitely. If the last dividend was $1 and the required return is 20%, what is the price of the stock?
Remember that we have to find the PV of all expected future dividends.

Compute the dividends until growth levels off• D1 = 1(1.2) = $1.20
• D2 = 1.20(1.15) = $1.38
• D3 = 1.38(1.05) = $1.449 Find the expected future price at the
beginning of the constant growth period:• P2 = D3 / (R – g) = 1.449 / (.2 - .05) = 9.66
Find the present value of the expected future cash flows• P0 = 1.20 / (1.2) + (1.38 + 9.66) / (1.2)2 = 8.67

A firm’s stock is selling for $10.50. They just paid a $1 dividend and dividends are expected to grow at 5% per year.
What is the required return?

P0 = $10.50. D0 = $1 g = 5% per year. What is the required return?
%1505.10.50
1.00(1.05) R
gP
D g
P
g)1(D R
0
1
0
0

P0 = $10.50 D0 = $1 g = 5% per year What is the dividend
yield?1(1.05) / 10.50 = 10%
What is the capital gains yield?
g = 5% Dividend Capital Gains
Yield Yield
%1505. 10.50
1.00(1.05) R
g P
D R
g P
g)1(D R
0
1
0
0
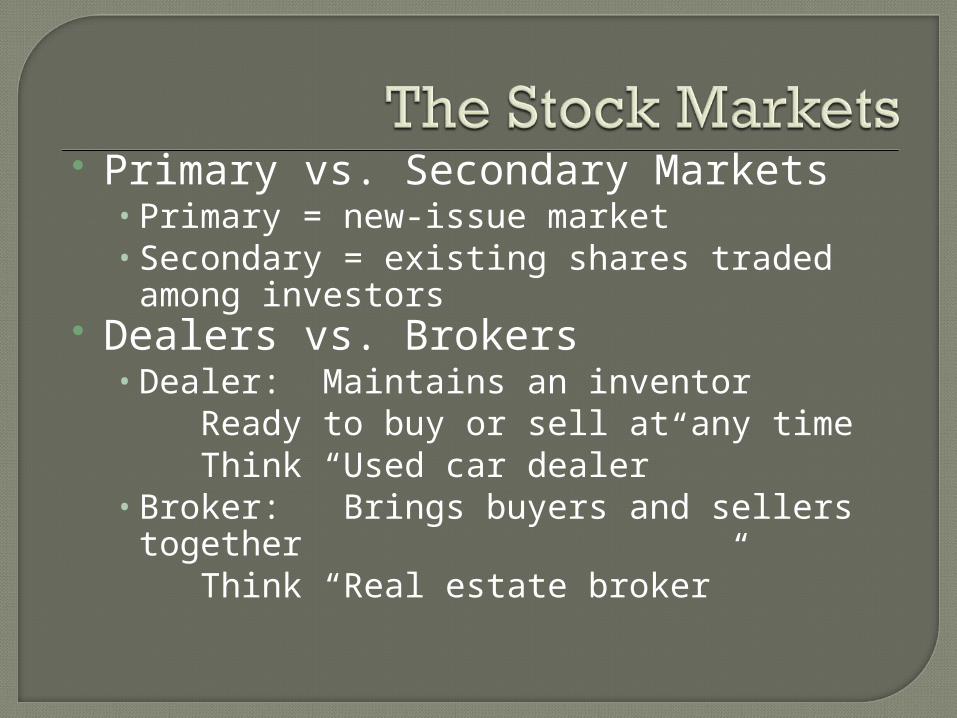
Primary vs. Secondary Markets• Primary = new-issue market• Secondary = existing shares traded among
investors Dealers vs. Brokers
• Dealer: Maintains an inventor Ready to buy or sell at any
time Think “Used car dealer”
• Broker: Brings buyers and sellers together Think “Real estate broker”
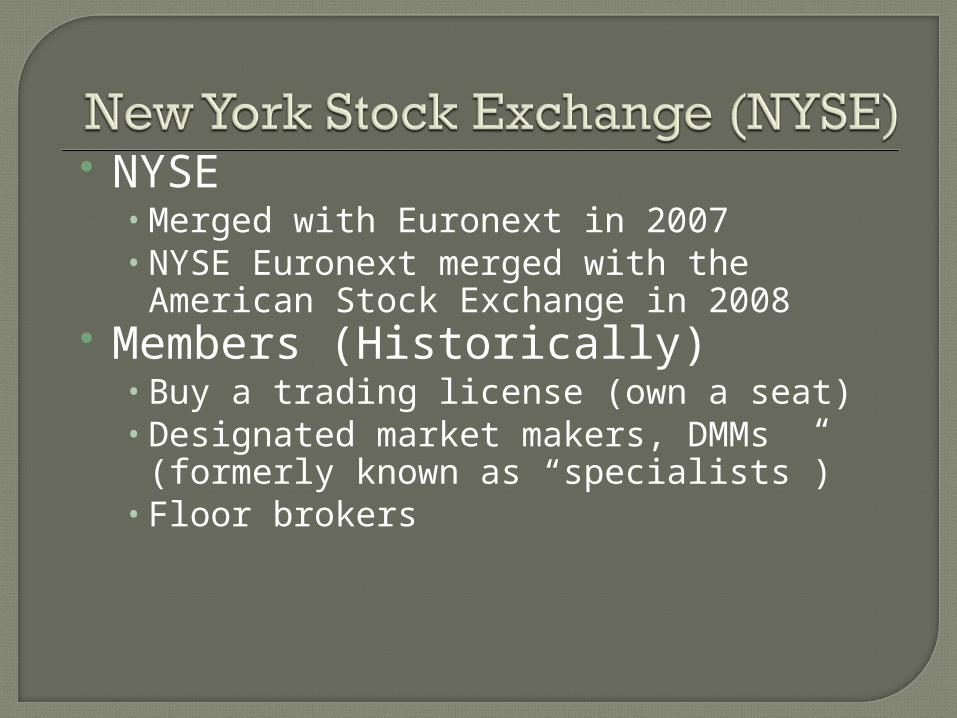
NYSE• Merged with Euronext in 2007• NYSE Euronext merged with the American
Stock Exchange in 2008 Members (Historically)
• Buy a trading license (own a seat)• Designated market makers, DMMs
(formerly known as “specialists”)• Floor brokers

Operational goal = attract order flow
NYSE DMMs:•Assigned broker/dealer Each stock has one assigned DMMAll trading in that stock occurs at the “DMM’s post”
•Trading takes place between customer orders placed with the DMMs and
“the crowd”•“Crowd” = Floor brokers
Related Documents