ウシ子宮・胎盤マイクロアレイの開発と胎盤における遺伝子発 現動態の解析 誌名 誌名 Journal of mammalian ova research = 日本哺乳動物卵子学会誌 ISSN ISSN 13417738 著者 著者 橋爪, 一善 木崎, 景一郎 牛澤, 浩一 ほか3名, 巻/号 巻/号 24巻3号 掲載ページ 掲載ページ p. 79-91 発行年月 発行年月 2007年10月 農林水産省 農林水産技術会議事務局筑波産学連携支援センター Tsukuba Business-Academia Cooperation Support Center, Agriculture, Forestry and Fisheries Research Council Secretariat

Welcome message from author
This document is posted to help you gain knowledge. Please leave a comment to let me know what you think about it! Share it to your friends and learn new things together.
Transcript
ウシ子宮・胎盤マイクロアレイの開発と胎盤における遺伝子発現動態の解析
誌名誌名 Journal of mammalian ova research = 日本哺乳動物卵子学会誌
ISSNISSN 13417738
著者著者
橋爪, 一善木崎, 景一郎牛澤, 浩一ほか3名,
巻/号巻/号 24巻3号
掲載ページ掲載ページ p. 79-91
発行年月発行年月 2007年10月
農林水産省 農林水産技術会議事務局筑波産学連携支援センターTsukuba Business-Academia Cooperation Support Center, Agriculture, Forestry and Fisheries Research CouncilSecretariat
J. Mamm. Ova Res. Vol. 24, 79-91, 2007 79
-Mini Reviewー
Deve/opment of an Uteroplacental Microarray and Analysis of the Expression Profile of Placental Genes during Bovine Gestation
Kazuyoshi Hashizume 1 *, Keiichiro Kizaki1, Koichi Ushizawa2,
Misa Hosoe2, Kei Imai3 and Toru TakahashP
'Laboratory 0/ Veterinary Physiology, Department 0/ Veterinary Medicine, Faculty 0/ Agriculture,
Jwate University, 3-18-8 Ueda, Morioka, Jwate 020-8550, Japan 2Reproductive Biology Research Unit, Division 0/ Animal Sciences, National Jnstitute 0/ Agrobiological Sciences, 2 Jkenodai, Tsukuba, Jbaraki 305-8602, Japan
3 Department 0/ Technology, National Livestock Breeding Center, J Odakurahara, Odakura,
Nishigo, Fukushima 96/-851 J, Japan
Abstract: Microarray technology provides new insights
into the field of reproductive biology as well as other
fields of medicine and biology. We fabricated a bovine
uteroplacental cDNA microarray and investigated the
key factors involved in the establishment and
maintenance of gestation. Microarray-based global
gene expression analyses on bovine placenta and
trophoblast cells suggest that the expression profiles of
specific genes depend on the cells and tissues in which
they are expressed as well as the time of the gestation
period. This custom司 mademicroarray revealed that
trophoblast-specific genes such as placentallactogen,
pregnancy-associated glycoproteins, prolactin-related
proteins, and those of the sulfotransferase family were
mainly expressed in the trophoblast giant cells and that
their expression increased as gestation progressed.
The expression of these genes was extremely temporal
and spatial. Furtheにtheexpression of the transcription
factor AP-2 increased in the trophoblast giant cells as
gestation progressed. Thus, the AP-2 gene family may
playa major role in regulating the functions of bovine
trophoblast giant cells. Microarray technology provides
information not only on thousands of genes
simultaneously but also on their regulatory mechanisms
in cells. Bioinformatic tools could greatly aid biological
and biomedical research; therefore, active efforts must
be undertaken in this field.
Received: May 28, 2007 Accepted: June 14,2007 *To whom correspondence should be addressed e-mail: [email protected]
Key words: Custom-made cDNA microarray, Bovine,
Gestation, Bioinformatics
Introduction
Viviparity is an evolutionary feature of mammals. An
essential feature of mammalian pregnancy is the
presence of a feto・maternalinterface, i.e., the placenta.
The placenta connects the mother and the fetus and
plays a crucial role in fetal growth and the maintenance
of pregnancy. However, despite a large body of
research that has been conducted to elucidate the
mechanisms underlying implantation, placentation,
fetogenesis, and delivery, the detailed mechanisms
remain unclear. The complex cell-to-cell
communication occurring during gestation, which
extends for approximately 280 days in cattle, is
modulated by hormones, cytokines, and growth factors.
Placentomes in cattle are composed of the fetal
cotyledonary and maternal caruncular tissues [1].
Establishment of the placenta involves successive
processes, namely, implantation and placentation.
During these processes, fetal trophoblast cells invade
the maternal endometrium. This is a complex process,
and successful implantation requires appropriate
communication between the embryo and the maternal
endometrium. The onset of gestation is orchestrated by
various molecules that are synthesized and secreted by
the trophoblast cells [2-4]. In cattle, the maternal and
fetal tissues are distinguished as the cotyledon, which is
80 J. Mamm. Ova Res. Vol. 24, 2007
the fetal component, and the caruncle, which is the
maternal component [1]. The main reason for
reproductive wastage川 farmanimals is early
embryonic loss [2, 4]. Placental dysfunction leads to
premature termination of pregnancy. These conditions
eventually decrease animal productivity. To eliminate
or reduce the effects of these factors, more detailed
information is required regarding the mechanisms and
molecular cascade involved in the establishment and
maintenance of pregnancy
Innovating technologies provide new insights into
various fields of scientific; however, they also lead to
misconceptions and unreasonably high expectations
with regard to resolving complex issues. Since the last
decade, molecular technologies have improved our
understanding of genomic information. Molecular
biology techniques such as northern and Southern
blotting have been used on a large scale; however, the
major limitations of these techniques are that they
permit simultaneous analysis of only a limited number of
genes and that they do not provide insights into
differential gene expression [5]. An interesting
molecular tool is microarray analysis, by which
information on several thousands of genes can be
obtained simultaneously. It provides not only genomic
but also functional, proteomic, and metabolic
information [6, 7]. It is a useful tool for research in the
field of reproduction since numerous intricate issues
pertaining to gestation, the functioning of the feto・
maternal interface, immunological regulation in the fetal
semトallograft,production of placenta-specific
molecules, expression and functions of retroviruses in
placenta, etc., are yet to be elucidated. During the last
decade, cDNA and/or oligonucleotide array techniques
have been developed to examine gene expression in
various species of organisms and in various
physiopathological conditions [8-12]. Moreover,
microarray techniques have been used to study the
multigenic regulation of implantation in humans and
mice [13-17].
We have previously developed a bovine-specific
miroarray system to analyze placental functions,
namely, implantation, placentation, and the
maintenance of gestation, in cattle [12, 18]. In this
review, we mainly introduce the fabrication of cDNA
microarray and practical application of this microarray to
bovine uteroplacental tissues. Many reviews regarding
the applications of micro
Construction of the Uteroplacental
cDNA Microarray
Microarray techniques are based on the fundamental
principle of hybridization of 2 complementary DNA
strands, similar to northern blotting and Southern
blotting. It enables simultaneous comparison of the
expression levels of thousands of genes. Microarrays
are generally produced by spotting cDNA or oligo-DNA
onto glass or silicon chips at a high density [9, 13, 21,
24]. We first fabricated cDNA microarrays in 1999 by
using bovine uterine and placental tissues and
subsequently generated a bovine liver microarray
comprising approximately 8,000 spotted clones [12, 18,
25]. Recently, Takahashi et al. of the National Institute
of Agrobiological Sciences (Tsukuba, Japan)
constructed an 11-k oligoarray comprising uterine and
placental genes from the abovementioned microarray
and other bovine gene ESTs obtained from public
genome databases such as DDBJ [12, 25, Takahashi et
al., unpublished data]. In this review, we provide an
overview of cDNA microarray construction.
Tissue collection for constructing cDNA libraries
We collected endometrial and placental tissues from
Japanese black cows in order to establish cDNA
libraries. Tissue collection is one of most crucial factors
involved in constructing microarrays. Further, the
condition of the animals used for tissue collection is also
a significant factor. Therefore, we collected samples
from different pa同sof the endometrium throughout the
estrous cycle and during gestation; further, we also
separately collected the cotyledonary and
intercotyledonary fetal membranes, as described
previously [26, 27].
Library construction
Total RNA was isolated from the tissues by using
Isogen (Nippon Gene, Toyama, Japan), according to
the manufacturer's instructions. After preparing
poly(A)+ RNA from the total RNA, a phage cDNA library
was constructed using the ZAP Express Vector kit
(Stratagene, San Diego, CA). The cDNA fragments
used to construct the library were approximately 500-
2,500 bp in length. A phagemid cDNA library was
excised in vivo from the phage library by using the
ExAssist helper phage (Stratagene)
C/one selection and construction of a normalized cDNA
/ibrary
We constructed a phagemid cDNA library containing
cDNA Hbrary (1,2ωρωdon同
~ pla'血S
剖個7拙1Dg柵仰向}
b配加包lcuJ皿、e
+ PCR
+ lcDNA macrovray I
811国旬世田理
-gly居間1st皿』正
~ elec:trophor・駒
llmatr告別
2400司回旬(鈎凶}
5 spots屋国
ぷ:28/t
+
Hashizume, et al. 81
lden岨刷出DoflI1UIler'OUS doD薗
砂 防brl必Z畠自泊
+ cDNAHbraη
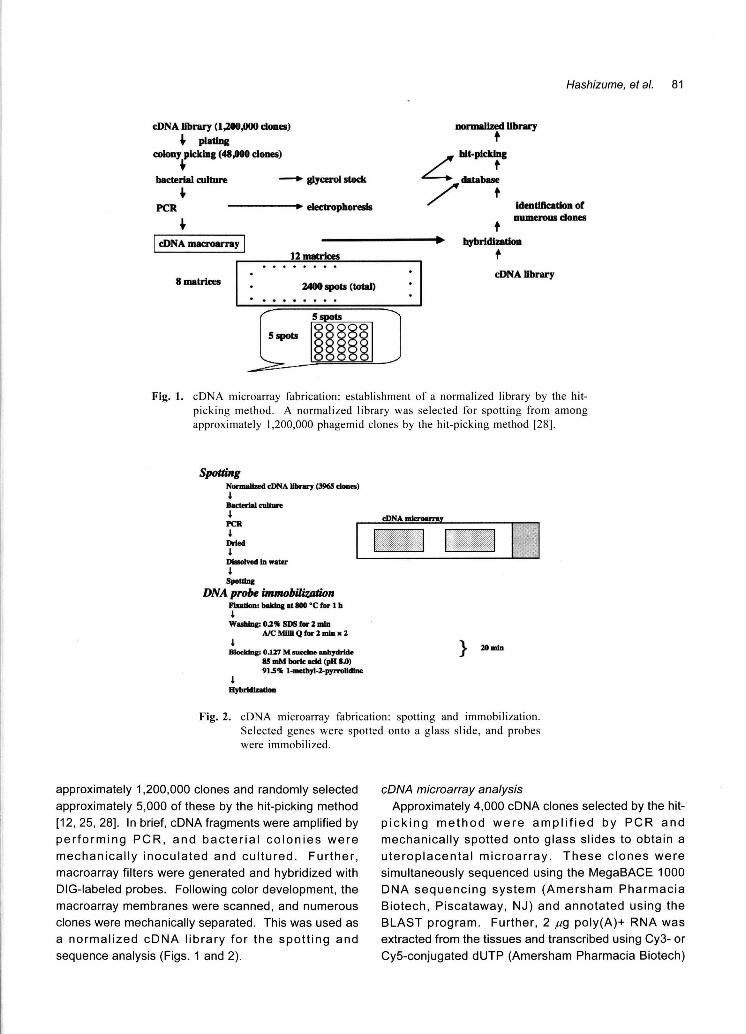
Fig. 1. cDNA microarray fabrication: establishment of a normalized Iibrary by the hit-picking method. A normalized library was selected for spotting from among approximately 1,200,000 phagemid c10nes by the hit-picking method [28]
Spotting N但司副_cDNA Hbnry (l同値d岨由時
4 B・CIeI恒l四量11ft
4 PCR
4 DrI岨4 |四国 II D曲匝耐岨旭w・肱r
4 spc岨喝
DNAprobe加 mobili:zJlliolJPID曲圃, bOId・-皿割陶・CfI町 lb4 W幽.....'0.2鴨 S凶 f置 Z皿掴
A/CP<但IIIQ世訓rZm恒l<Z
4 BIO也凪.:O.trlM .. 陣d融岨bydrlde
舗皿Mbork.. 姐(同I.AI)91.5唖 1.. 瞳叫'11・Z-P)Tn雌畠皿
4 Hyb雌幽抽
} 泊幽
Fig. 2. cDNA microarray fabrication: spotting and immobilization. Selected genes were spotted onto a glass slide, and probes were immobilized
approximately 1,200,000 clones and randomly selected
approximately 5,000 of these by the hit-picking method
[12,25,28]. In brief, cDNA fragments were amplified by
performing PCR, and bacterial colonies were
mechanically inoculated and cultured目 Further,
macroarray filters were generated and hybridized with
DIG-Iabeled probes. Following color development, the
macroarray membranes were scanned, and numerous
clones were mechanically separated. This was used as
a normalized cDNA library for the spotting and
sequence analysis (Figs. 1 and 2).
cDNA microarrayanalysis
Approximately 4,000 cDNA clones selected by the hit-
picking method were amplified by PCR and
mechanically spotted onto glass slides to obtain a
uteroplacental microarray. These clones were
simultaneously sequenced using the MegaBACE 1000
DNA sequencing system (Amersham Pharmacia
Biotech, Piscataway, NJ) and annotated using the
BLAST program. Further, 2μ9 poly(A)+ RNA was
extracted from the tissues and transcribed using Cy3・or
Cy5・conjugateddUTP (Amersham Pharmacia Biotech)
82 J. Mamm. Ova Res. Vol. 24, 2007
極参~::> 官官組制CeIl
RNAex回 dion
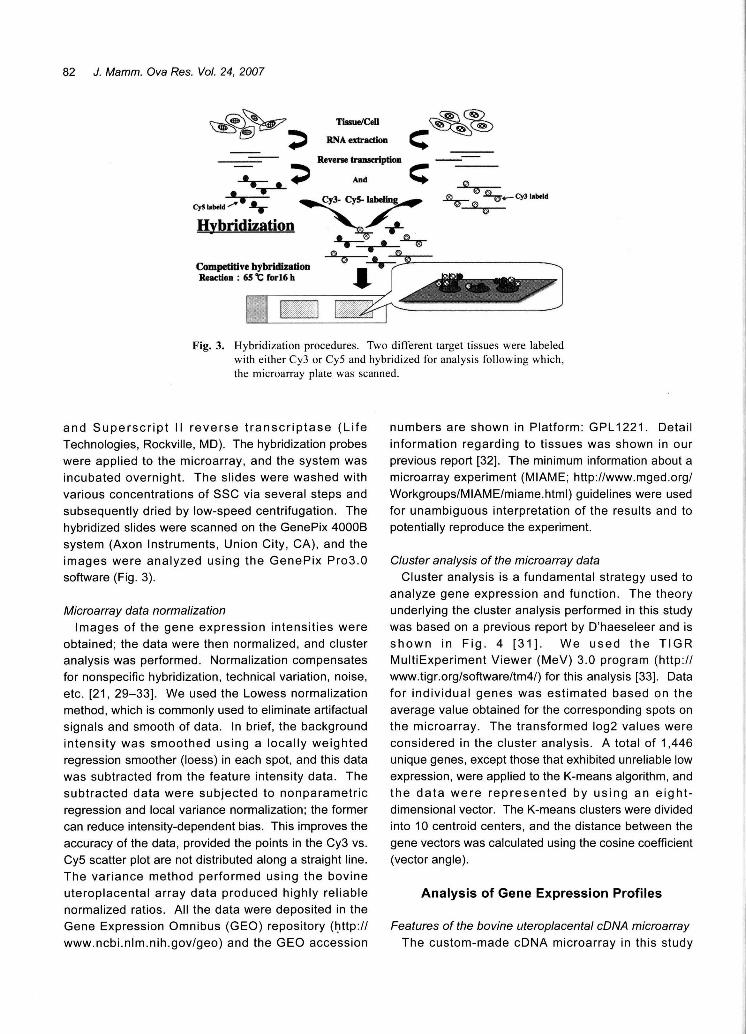
Fig. 3. Hybridization procedures. Two different target tissues were labeled with either Cy3 or Cy5 and hybridized for analysis following which, the microarray plate was scanned.
and Superscript 11 reverse transcriptase (Life numbers are shown in Platform: GPL1221. Detail
Technologies, Rockville, MD). The hybridization probes information regarding to tissues was shown in our
were applied to the microarray, and the system was previous report [32]. The minimum information about a
incubated overnight. The slides were washed with microarray experiment (MIAME; http://www.mged.org/
various concentrations of SSC via several steps and Workgroups/MIAME/miame.html) guidelines were used
subsequently dried by low-speed centrifugation. The for unambiguous interpretation of the results and to
hybridized slides were scanned on the GenePix 4000B potentially reproduce the experiment. system (Axon Instruments, Union City, CA), and the
images were analyzed using the GenePix Pr03.0 C/uster ana/ysis of the microarray data
software (Fig. 3). Cluster analysis is a fundamental strategy used to
analyze gene expression and function. The theory
Microarray data normalization underlying the cluster analysis pe斤ormedin this study
Images of the gene expression intensities were was based on a previous report by D'haeseleer and is
obtained; the data were then normalized, and cluster shown in Fig. 4 [31]. We used the TIGR
analysis was performed. Normalization compensates MultiExperiment Viewer (MeV) 3.0 program (http://
for nonspecific hybridization, technical variation, noise, www.tigr.org/software/tm4/) for this analysis [33]. Data
etc. [21, 29-33]. We used the Lowess normalization for individual genes was estimated based on the
method, which is commonly used to eliminate artifactual average value obtained for the corresponding spots on
signals and smooth of data. In brief, the background the microarray. The transformed log2 values were
intensity was smoothed using a locally weighted considered in the cluster analysis. A total of 1,446
regression smoother (Ioess) in each spot, and this data unique genes, except those that exhibited unreliable low
was subtracted from the feature intensity data. The expression, were applied to the K-means algorithm, and
subtracted data were subjected to nonparametric the data were represented by using an eight-
regression and local variance normalization; the former dimensional vector. The K-means clusters were divided
can reduce intensity-dependent bias. This improves the into 10 centroid centers, and the distance between the
accuracy of the data, provided the points in the Cy3 vs. gene vectors was calculated using the cosine coefficient
Cy5 scatter plot are not distributed along a straight line. (vector angle)
The variance method performed using the bovine
uteroplacental array data produced highly reliable Analysis of Gene Expression Profiles
normalized ratios. AII the data were deposited in the
Gene Expression Omnibus (GEO) repository (~ttp : // Features ofthe bovine uteroplacental cDNA microarray
www.ncbi.nlm.nih.gov/geo) and the GEO accession The custom-made cDNA microarray in this study
B A
.(;) • -・.i 11
. .)
o a ..
• @
•• • .'. • Doy25EBI
D c
• •• ¥ E・・・・・・VL2•
.1. • .
Hashizume, et al. 83
FNl SPARC AKR1BI TKDP4 COLtA2 MMP2 CYPt1Al TIMPI 嗣HBAUMP CLC崎SlC句1>3PAGl CBHl LALBA I4CT自EEF1AI V1L2 CYB5R LVZ
ω剛川引臥糊
ztmmmp臥問
問
削
叩
酬
明
α岱町出内…出向M山川印刷鹿町山…剛山川剛一mmr…組問∞
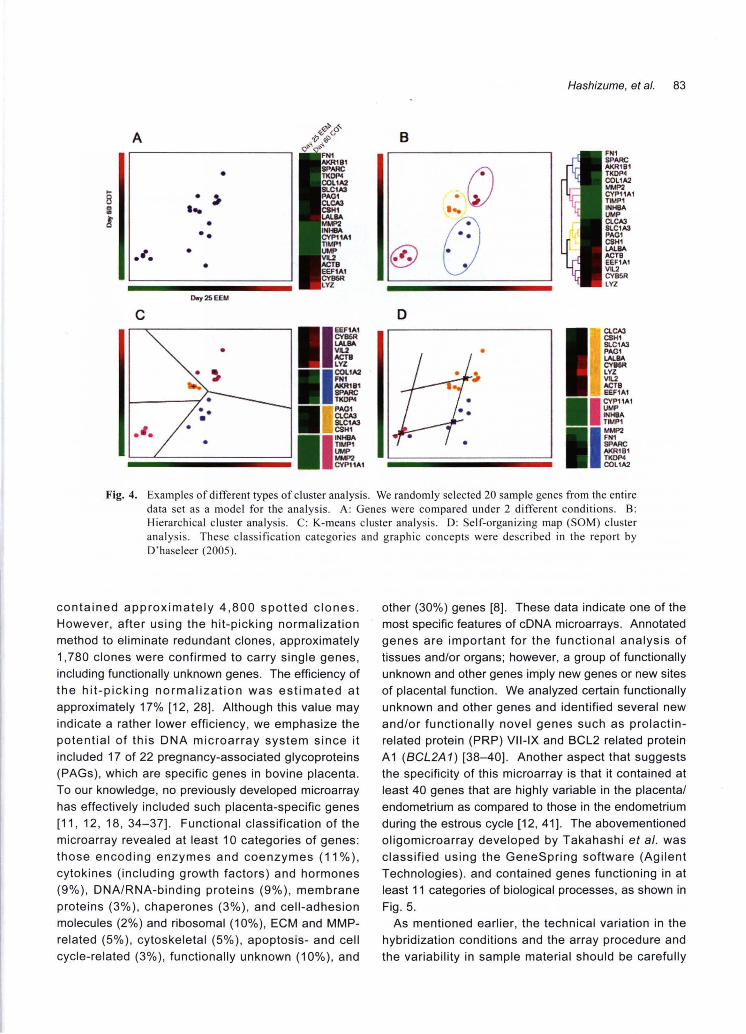
••••••• Fig. 4. Examples of different types of c1uster analysis. We randomly selected 20 sample genes仕omthe entire
data set as a model for the analysis. A: Genes were compared under 2 different conditions. B: Hierarchical c1uster analysis. C: K-means cluster analysis. D: Self-organizing map (SOM) cluster analysis. These classification categories and graphic concepts were described in the report by D'haseleer (2005)
contained approximately 4,800 spotted clones.
However, after using the hit-picking normalization
method to eliminate redundant clones, approximately
1,780 clones were confirmed to carry single genes,
including functionally unknown genes. The efficiency of
the hit-picking normalization was estimated at
approximately 17% [12, 28]. Although this value may
indicate a rather lower efficiency, we emphasize the
potential of this DNA microarray system since it
included 17 of 22 pregnancy-associated glycoproteins
(PAGs), which are specific genes in bovine placenta.
To our knowledge, no previously developed microarray
has effectively included such placenta-specific genes
[11, 12, 18, 34-37]. Functional classification of the
microarray revealed at least 10 categories of genes:
those encoding enzymes and coenzymes (11 %),
cytokines (including growth factors) and hormones
(9%), DNA/RNA-binding proteins (9%), membrane
proteins (3%), chaperones (3%), and cell-adhesion
molecules (2%) and ribosomal (10%), ECM and MMP-
related (5%), cytoskeletal (5%), apoptosis-and cell
cycle-related (3%), functionally unknown (10%), and
other (30%) genes [8]. These data indicate one of the
most specific features of cDNA microarrays. Annotated
genes are important for the functional analysis of
tissues and/or organs; however, a group of functionally
unknown and other genes imply new genes or new sites
of placental function. We analyzed ce巾 infunctionally
unknown and other genes and identified several new
and/or functionally novel genes such as prolactin-
related protein (PRP) VII-IX and BCL2 related protein
A 1 (BCL2A 1) [38-40]. Another aspect that suggests
the specificity of this microarray is that it contained at
least 40 genes that are highly variable in the placenta/
endometrium as compared to those in the endometrium
during the estrous cycle [12, 41]. The abovementioned
oligomicroarray developed by Takahashi et 81. was
classified using the GeneSpring software (Agilent
Technologies). and contained genes functioning in at
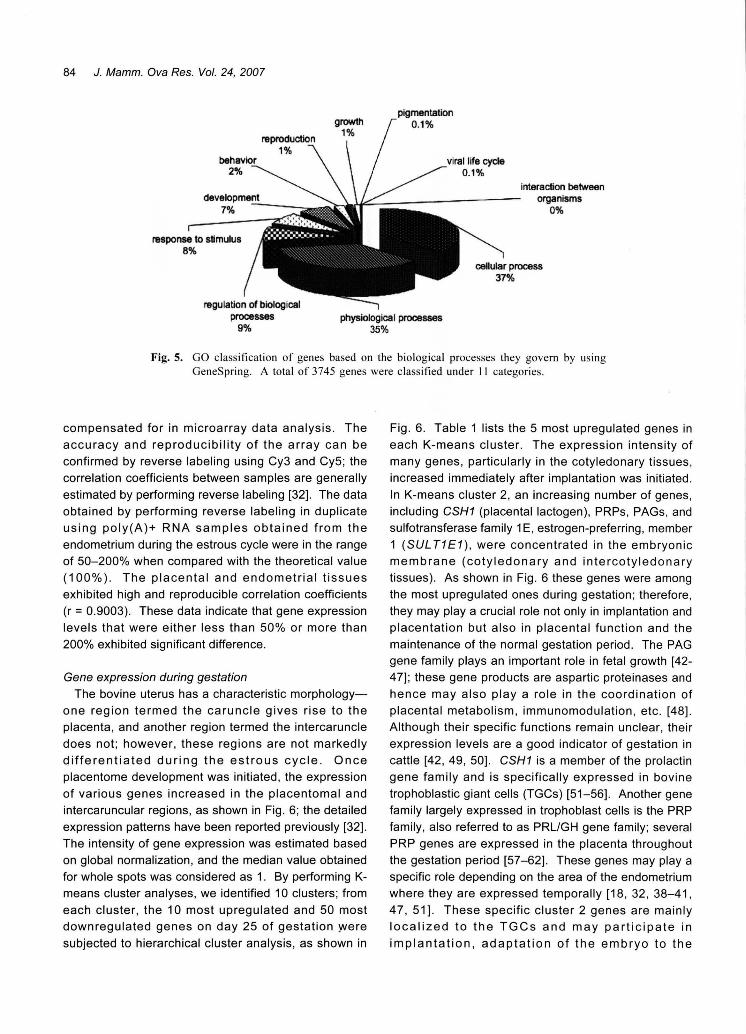
least 11 categories of biological processes, as shown in
Fig.5.
As mentioned earlier, the technical variation in the
hybridization conditions and the array procedure and
the variability in sample material should be carefully
84 J. Mamm. Ova Res. Vol. 24, 2007
l円teractionbetween α-gan隠ms
0%
physiological proces舗宮
35%
Fig. 5. GO classification of genes based on the biological processes they govern by using GeneSpring. A total of 3745 genes were classified under 11 categories
compensated for in microarray data analysis. The
accuracy and reproducibility of the array can be
confirmed by reverse labeling using Cy3 and Cy5; the
correlation coefficients between samples are generally
estimated by performing reverse labeling [32]. The data
obtained by performing reverse labeling in duplicate
using poly(A)+ RNA samples obtained from the
endometrium during the estrous cycle were in the range
of 50-200% when compared with the theoretical value
(100%). The placental and endometrial tissues
exhibited high and reproducible correlation coefficients
(r = 0.9003). These data indicate that gene expression
levels that were either less than 50% or more than
200% exhibited significant difference.
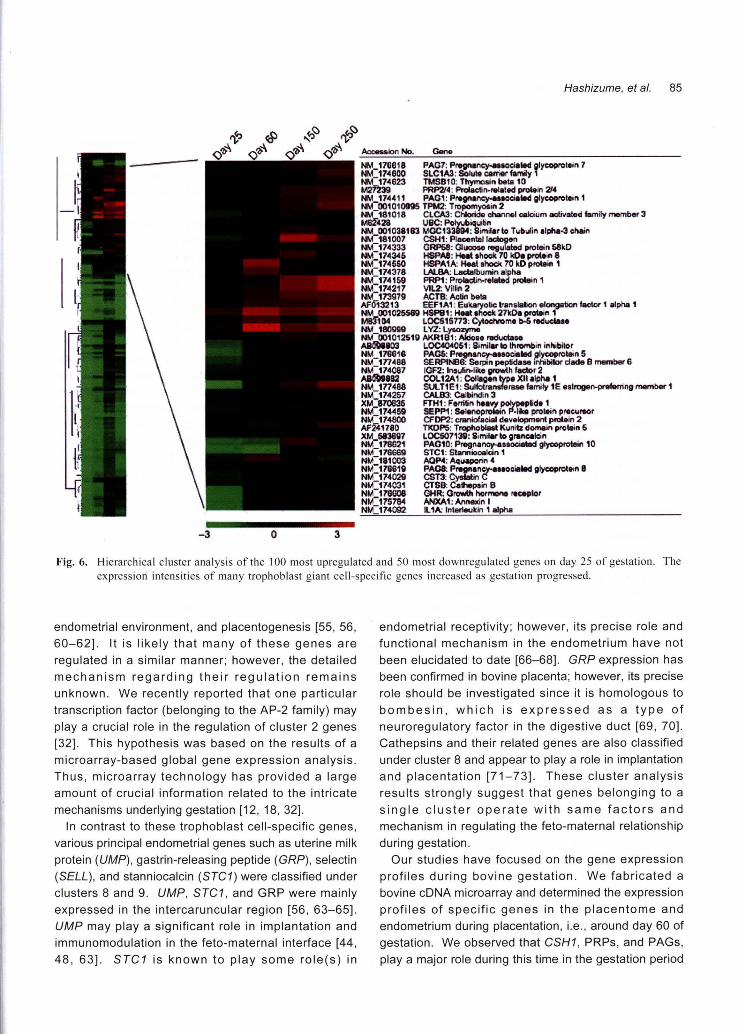
Gene expression during gestation
The bovine uterus has a characteristic morphology-
one region termed the caruncle gives rise to the
placenta, and another region termed the intercaruncle
does not; however, these regions are not markedly
differentiated during the estrous cycle. Once
placentome development was initiated, the expression
of various genes increased in the placentomal and
intercaruncular regions, as shown in Fig. 6; the detailed
expression patterns have been reported previously [32].
The intensity of gene expression was estimated based
on global normalization, and the median value obtained
for whole spots was considered as 1. By performing K-
means cluster analyses, we identified 10 clusters; from
each cluster, the 10 most upregulated and 50 most
downregulated genes on day 25 of gestation yvere
subjected to hierarchical cluster analysis, as shown in
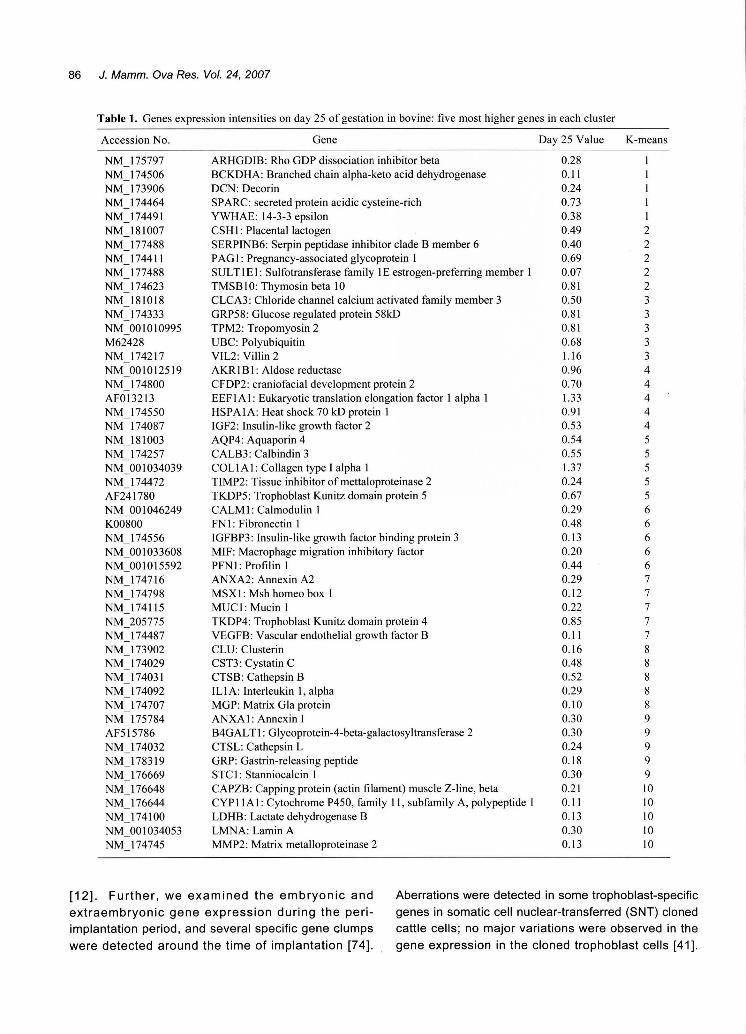
Fig. 6. Table 1 lists the 5 most upregulated genes in
each K-means cluster. The expression intensity of
many genes, particularly in the cotyledonary tissues,
increased immediately after implantation was initiated.
In K-means cluster 2, an increasing number of genes,
including CSH1 (placental lactogen), PRPs, PAGs, and
sulfotransferase family 1 E, estrogen-preferring, member
1 (SUL T1 E1), were concentrated in the embryonic
membrane (cotyledonary and intercotyledonary
tissues). As shown in Fig. 6 these genes were among
the most upregulated ones during gestation; therefore,
they may play a crucial role not only in implantation and
placentation but also in placental function and the
maintenance of the normal gestation period. The PAG
gene family plays an important role in fetal growth [42・
47]; these gene products are aspartic proteinases and
hence may also play a role in the coordination of
placental metabolism, immunomodulation, etc. [48].
Although their specific functions remain unclear, their
expression levels are a good indicator of gestation in
cattle [42, 49, 50]. CSH1 is a member of the prolactin
gene family and is specifically expressed in bovine
trophoblastic giant cells (TGCs) [51-56]. Another gene
family largely expressed in trophoblast cells is the PRP
family, also referred to as PRLlGH gene family; several
PRP genes are expressed in the placenta throughout
the gestation period [57-62]. These genes may play a
specific role depending on the area of the endometrium
where they are expressed temporally [18, 32, 38-41,
47,51]. These specific cluster 2 genes are mainly
localized to the TGCs and may participate in
implantation, adaptation of the embryo to the
J o
。、やや
3
Hashizume, et al. 85
A出制措居n愉). G園、.NMI76818 PA07円F帽g・・ncy.aa.師団除d割問時司ttin7 NM-1748ω SL.C1A3: Sor.i幅岨帥r価柑y;NM-114自23 TMSBfO: TlMnoein同国唱。
M212羽 PRP2I4 : ~n帽・t制問旬inZ・NM唱74411 P-'OI: P幡宮nan句作...0。凶旬dgl)lCOllf唱ttin1 N吃凶101棚 5TPM2: TtoPomy蝿 in2N!.C181 018 ClCA3: C抽 闇 由 d圃m・l圃刷um副蜘曲dlamily IT圃作曲劃3M81拘21 UBC: Poh.w同¥jit柵
Nr.UI01038183 MOCI338114: Similer加 Tubulin.肺・・3的制nNM-181001 cs.刊:P国個nlal畑地酒制附唱74333 GR問 :伽lOSIIregulat剖 prol扇町S抑制M:1743>t5 H$PA8: 陶圃刷出国~'70 kO・w湖・in8NM唱14550 HSPA1A: 陶.h~副車 70 kD p岨ain 1 NM_唱74378 ~L.a曲目bu..... ・ phaNM_17415e PRP1: F'時IKlin・岨-.d問。刷nlNM仁174217 VII.2; Vllin 2 N""'-'唱7397ーI¥CTB:ACI副 b剖aAFd'i3213 庄内州 E山 劇yotic岡崎恒加、810唱曲開白岡町 t・Ipha唱
NM . .J剛0256WHS珂司:H・a・ock27kO・F拘 i門 司
MmCM LOCSI6713:C~m・凶制凶尚・-NM 1ω邸調~ LV2: Lv圃>zotm・NM∞ー0125旬以R1BI:AIdo,. r副知句"A8d1栂803 L.OCω4061:Siml畑,悟ttl帽押由同嗣llibl回p
~-~~~1! ~~~竺~明"。川E国l凶1I1~ゆ聞Itin5NM_唱n498 SER例NB6:Se明内帥倒idoo輔InliibiIorcl副担自 m・m凶d~NM:J740&7 IGF2: In刷励、p.U同 g・叫hfedor2 組制岨 COI..I2Al: C仰向同XII・Ipn.1 NM_ln4鈎 SULT1El:Su恥廿町圃信団組fllri均健闘Itog・作酎胡町TingIT圃mbe什NM-174257 CAI..83: C園以岡山3XM~870835 FT附 : F・n偏向同・W~岬tida 1 NM.:J144ぬ SEPP1: S糊糊油相P・加問凶np帽白幡町
制I唱刊紙崎 a'DP2:町首相fac岨 d8"81opm・ntpr由 in2AF241780 T四時: T~咽陶凶回KI.oni包do<咽副間切inSXM_5・錨111 LOCS071311: Sim陶,胎g閣制調IclnNt.C178G2唱 PA削 0:p,句悼のザe帥恒輔副世"柑曲相官ONM-'唱16Gω 宮TC唱:S回1IIID倒 朗 唱
NM=181 0ω AOP4:伺凶陣。m‘NM:-:I7881骨 "AC8:1'帽pnザ唱"。帽崎dg切首相。t耐内.NM-桝 029 CST3: cvsi凶n~NM日74031 ÇT~B: 白h回in8NM:178808 GH陀 G聞咽h同附晴晴帽偶・,IorNM仔5784 ANXAl:A制帽民inI NM 114白書2 IL 111: Inte,阻Jkin司届同国
Fig. 6. Hierarchical cluster analysis of the 100 most upregulated and 50 most downregulated genes on day 25 of gestation. The
expression intensities of many trophoblast giant cell-specific genes increased as gestation progressed
endometrial environment, and placentogenesis [55, 56,
60-62]. It is likely that many of these genes are
regulated in a similar manner; however, the detailed
mechanism regarding their regulation remains
unknown. We recently reported that one particular
transcription factor (belonging to the AP・2family) may
play a crucial role in the regulation of cluster 2 genes
[32]. This hypothesis was based on the results of a
microarray-based global gene expression analysis
Thus, microarray technology has provided a large
amount of crucial information related to the intricate
mechanisms underlying gestation [12, 18, 32]
1 n contrast to these trophoblast cell-specific genes,
various principal endometrial genes such as uterine milk
protein (UMP), gastrin-releasing peptide (GRP), selectin
(SELL), and stanniocalcin (STC1) were classified under
clusters 8 and 9. UMP, STC1, and GRP were mainly
expressed in the intercaruncular region [56, 63-65].
UMP may play a significant role in implantation and
immunomodulation in the feto・maternalinterface [44,
48, 63]. STC1 is known to play some role(s) in
endometrial receptivity; however, its precise role and
functional mechanis打1in the endometrium have not
been elucidated to date [66-68]. GRP expression has
been confirmed in bovine placenta; however, its precise
role should be investigated since it is homologous to
bombesin, which is expressed as a type of
neuroregulatory factor in the digestive duct [69, 70].
Cathepsins and their related genes are also classified
under cluster 8 and appear to play a role in implantation
and placentation [71-73]. These cluster analysis
results strongly suggest that genes belonging to a
single cluster operate with same factors and
mechanism in regulating the feto・maternalrelationship
during gestation.
Our studies have focused on the gene expression
profiles during bovine gestation. We fabricated a
bovine cDNA microarray and determined the expression
profiles of specific genes in the placentome and
endometrium during placentation, i.e., around day 60 of
gestation. We observed that CSH1, PRPs, and PAGs,
play a major role during this time in the gestation period
J. Mamm. Ova Res. Vol. 24, 2007 86
Table 1. Genes expression intensities on day 25 of gestation in bovine: five most higher genes in each cluster
K-means
ハUAUnリハリハリ
1SIA--113A今
ム
今
ム
今
ム
吋
4
今
ム
令
3
ぺJ
勾
31dtJA守
A-EA守
AH寸
A値T
P
、dpコ『
J『Jqdぷ
り
ぷ
り
ぶ
り
ぶ
り
ぷ
リ
勺
f
ウ
J
勺
r勺
/
7
,。。。O
Q
O
C
0
0
0
0ノ
Qノ
Qノ
Qノ
Qノ
111E'ata--
Day 25 Value
0.28
0.11
0.24
0.73
0.38
0.49 0.40
0.69
0.07
0.81
0.50
0目81
0.81
0.68
1.16
0.96
0.70
1.33 0.91
0.53
0.54
0.55
1.37 0.24
0.67
0.29
0.48
0.13
0.20
0.44 0.29
0.12
0.22
0.85
0.11
0.16 0.48
0.52
0.29
0.10
0.30
0.30
0.24
0.18
0.30
0.21
0.11
0.13
0.30
0.13
Gene
ARHGDIB: Rho GDP dissociation inhibitor beta
BCKDHA: Branched chain alpha司 ketoacid dehydrogenase
DCN: Decorin
SPARC: secreted protein acidic cysteine-rich
YWHAE: 14ふ 3epsilon
CSH 1: Placental lactogen
SERPINB6: Serpin peptidase inhibitor clade B member 6
PAG1目 Pregnancy-associatedglycoprotein 1
SUL T 1 E 1: Sulfotransferase family 1 E estrogen-preferring member 1
TMSB I 0: Thymosin beta 10
CLCA3: Chloride channel calcium activated family member 3
GRP58: Glucose regulated protein 58kD TPM2: Tropomyosin 2
UBC: Polyubiquitin
VIL2: Villin 2
AKRIB1目 Aldosereductase
CFDP2: craniofacial development protein 2
EEF1 A 1: Eukaryotic translation elongation factor 1 alpha 1
HSPAIA目 Heatshock 70 kD protein 1
IGF2・Insulin-likegrowth factor 2
AQP4: Aquaporin 4
CALB3: Calbindin 3
COLlA 1: Collagen type I alpha I
TIMP2: Tissue inhibitor ofmettaloproteinase 2
TKDP5: Trophoblast Kunitz domain protein 5
CALM 1: Calmodulin I
FN 1: Fibronectin I
IGFBP3・lnsulin-likegrowth factor binding protein 3
MIF: Macrophage migration inhibitory factor
PFN 1: Profil in 1
ANXA2: Annexin A2
MSX 1: Msh homeo box 1
MUC 1: Mucin I
TKDP4: Trophoblast Kunitz domain protein 4
VEGFB・Vascularendothelial growth factor B
CLU: Clusterin
CST3目 CystatinC
CTSB: Cathepsin B
IL I A: Interleukin 1, alpha MGP: Matrix Gla protein
ANXA 1: Annexin 1
B4GAL T 1: Glycoprotein-4-beta-galactosyltransferase 2
CTSL: Cathepsin L
GRP: Gastrin-releasing peptide
STC 1: Stanniocalcin 1
CAPZB: Capping protein (actin filament) muscle Z-line, beta CYP 11 A 1: Cytochrome P450, family 11, subfamily A, polypeptide 1
LDHB: Lactate dehydrogenase B
LMNA: Lamin A
MMP2: Matrix metalloproteinase 2
NM 175797
NM 174506
N M 173906
N恥1174464
NM 174491
NM 181007
NM 177488
NM 174411
NM 177488
N M 174623
NM 181018
NM 174333
NM 001010995
M62428
N M 174217
N恥I001012519
N M 174800
AFOl3213
NM 174550
N M 174087
N孔1181003
N M 174257
NM 001034039
N M 174472
AF241780
NM 001046249
K00800
NM 174556
N恥1001033608
NM 001015592
NM 174716
NM 174798
N M 174115
N M 205775
NM 174487
N孔<1173902
NM 174029
NM 174031
NM 174092
NM 174707
NM 175784
AF515786
NM 174032
NM 178319
NM 176669
NM 176648
NM 176644
N恥1174100
N恥1001034053
NM 174745
Accession No.
Aberrations were detected in some trophoblast-specific
genes in somatic cell nuclear-transferred (SNT) cloned
cattle cells; no major variations were observed in the
gene expression in the cloned trophoblast cells [41).
[12). Further, we examined the embryonic and
extraembryonic gene expression during the per卜
implantation period, and several specific gene clu昨lpS
were detected around the time of implantation [74).
Specific gene expression was examined using a bovine
trophoblast cell line (BT-1) as a model for in vitro
analysis. Mononucleate trophoblast cells were
observed to differentiate into placental lactogen-
expressing TGCs [55, 62, 75]. By using microarray
techniques and bioinformatics, recent studies have
investigated global gene expression profiles throughout
the gestation period and have explored a common
regulatory factor for the expression of these genes.
Many trophoblast-and/or endometrium-specific genes
exhibited marked variations with temporal and spatial
specificity [32]. We identified several features of bovine
gene expression during gestation. (1) Of the genes that
were classified by K-means cluster analysis, (i)
trophoblast-specific genes such as CSH1, PAGs, PRP,
and SUL T1E1 were classified under cluster 2, and the
expression levels for most of these genes increased as
gestation progressed and (ii) endometrium-specific
genes such as UMP, cathepsins, and SELL, were
classified under clusters 8 and 9, and their expression
was extremely temporal and spatial. (2) TGCs
simultaneously expressed various molecules, namely,
placental lactogen, PRPs, PAGs, heparanase, the
antiapoptosis gene BCL2A 1, SUL T1 E1, etc. [38-40,
43-47,76]. (3) The transcription factor AP-2 may play a
major role in regulating bovine TGC functions since this
family of transcription factors was also expressed in
TGCs and their expression increased as gestation
progressed. These gene expression analyses
emphasize the significance of the trophoblast cell
lineage since many genes such as CSH1 and AP-2 are
detected in TGCs in various rodent species as well as in
humans and ruminants [32, 77-80].
During the last decade, microarray technology has
developed rapidly and has easy applications. It has
already been applied in various fields such as biology,
toxicology, and medicine, and the data have been
analyzed by bioinfomatic methods [81-86]; however,
the methods of analysis have not been standardized as
yet [19, 20, 24, 87, 88]. Microarray technology can
provide information regarding not only specific genes in
tissues but also gene cascades and/or molecular
interactions in cells and tissues. Currently,
bioinformatics tools are available to analyze this
information; however, there exists a communication gap
between biologists and bioinformatics scientists.
Bridging this gap is of paramount impo
Acknowledgements
The authors express their sincere thanks to Drs.
Hashizume, et al. 87
Hiroko Ishiwata and Herath Chandra B of the National
Institute of Agrobiological Sciences; Drs. Akira Ito and
Takashi Sato of the Tokyo University of Pharmacy and
Life Sciences; and Dr. Gozo Tsujimoto and group
(Department of Genomic Drug Discovery Science,
Graduate School of Pharmaceutical Sciences, Kyoto
University), particularly Susumu Katsuma, Akira
Hirasawa, Satoshi Shiojima, Hiroshi Ikawa, Yasuhito
Suzuki, and Gozo Ts吋imoto,for their assistance in the
cDNA microarray fabrication and data analysis. The
authors also thank Mrs. Misako Akiyama for her kind
assistance. This study was supported in part by the
Organized Research Combination System, Hoga-
kenkyu (16658105); Kiban B (17380172); Kiban C
(17580284) of the Ministry of Education, Science and
Technology; and the Bio-oriented Technology Research
Advancement Institute, Japan. The authors also
received a Research Project for Utilizing Advanced
Technologies grant (05-1770) from the Ministry of
Agriculture, Forestry and Fisheries, Japan, and an
Animal Remodeling Project grant (05-201, 202) from the
Nationallnstitute of Agrobiological Sciences.
References
1) Wooding, F.B.P. and Flint, A.P. (1994) Placentation. In
Marshall's Physiology of Reproduction Vol. 4. 4th ed
(Lamming, G.E., ed.), pp.233-460, Chapman & Hall,
London. 2) Cross, J.c., Werb, Z. and Fisher, S.J. (1994) Implantation
and the placenta: key pieces of the development puzzle.
Science, 266, 1508-1518.
3) Jauniaux, E., Watson, A.L., Hempstock, J., Bao, Y.P.,
Skepper, J.N. and Burton, G.J. (2000) Onset of maternal
arterial blood f10w and placental oxidative stress. A
possible factor in human early pregnancy failure. Am. J.
Pathol., 15,2111-2122. 4) Spencer, T.E., Johnson, G.A., Bazer, F.W., Burghardt, R.C.
and Palmarini, M. (2007) Pregnancy recognition and conceptus implantation in domestic ruminants: roles of
progesterone, interferons and endogenous retroviruses.
Reprod. Fertil. Dev., 19,65-78 5) Hayes, P.c., Wolf, C.R. and Hayes, J.D. (1989) Blotting
techniques for the study of DNA, RNA, and proteins. BMJ,
299, 965-968 6) Schena, M., Shalon, D., Davis, R.W. and Brown, P.O
(1995) Q凶 ntitativemonitoring of gene expressio日 patterns with a complementary DNA microarray. Science, 270,
467-470 7) Shalon, D., Smith, S.J. and Brown, P.O. (1996) A DNA
microarray system for analyzing complex DNA samples
using two-color tluorescent probe hybridization. Genome
Res., 6, 639-645. 8) DeRisi, J., Penland, L., Brown, P.O., Bittner, M.L.,
88 J. Mamm. Ova Res. Vol. 24, 2007
Meltzer, P.S., Ray, M., Chen, Y., Su, Y.A. and Trent, J.M.
(1996) Use of a cONA microarray to analyse gene
expression patterns in human cancer. Nat. Genet., 14,457-
460
9) Ahrendt, S.A., Halachmi, S., Chow, J.T., Wu, L.,
Halachmi, N., Yang, S.C., Wehage, S., Jen, J. and
Sidransky, o. (1999) Rapid p53 sequence analysis in primary lung cancer using an oligonucleotide probe array.
Proc. Natl. Acad. Sci. USA., 96, 7382-7387
10) Brazma, A. and Vilo, J. (2000) Gene expression data
analysis. FEBS Lett., 480, 7-24.
11) Band, M.R., Olmstead, C., Everts, R.E., Liu, Z.L. and
Lewin, H.A. (2002) A 3800 gene microarray for cattle
functional genomics: comparison of gene expression in
spleen, placenta, and brain. Anim. Biotechnol., 13, 163-
172
12) Ishiwata, H., Katsuma, S., Kizaki, K., Patel, O.V., Nakano,
H., Takahashi, T., Imai, K., Hirasawa, A., Shiojima, S.,
Ikawa, H., Suzuki, Y., Tsujimoto, G., Izaike, Y., Todoroki,
J. and Hashizume, K. (2003) Characterization of gene
expression profiles in early bovine pregnancy using a
custom cONA microarray. Mol. Reprod. Oev., 65, 9-18
13) Tanaka, T.S., Jaradat, S.A., Lim, M.K., Kargul, G.J.,
Wang, X., Grahovac, M.J., Pantano, S., Sano, Y., Piao, Y.,
Nagaraja, R., Ooi, H., Wood, W.H. 3rd., Becker, K.G. and
Ko, M.S. (2000) Genome-wide expression profiling of
mid-gestation placenta and embryo using a 15,000 mouse
developmental cONA microarray. Proc. Natl. Acad. Sci.
USA., 97, 9127-9132 14) Yoshioka, K., Matsuda, F., Takakura, K., Noda, Y.,
Imakawa, K. and Sakai, S. (2000) Oetermination of genes
involved in the process of implantation: application of
GeneChip to scan 6500 genes. Biochem. Biophys. Res
Commun., 272, 531-538.
15) Kao, L.C., Tulac, S., Lobo, S., Imani, B., Yang, J.P.,
Germeyer, A., Osteen, K., Taylor, R.N., Lessey, B.A. and
Giudice, L.C. (2002) Global gene profiling in human
endometrium during the window of implantation.
Endocrinology, 143,2119-2138.
16) Aronow, B.J., Richardson, B.O. and Handwerger, S. (2001)
Microarray analysis of trophoblast differentiation: gene
expression reprogramming in key gene function categories
Physiol. Genomics, 6, 105-1 16
17) Chen, H.W., Chen, J.J., Tzeng, C.R., Li, H.N., Cher唱"Y.F.,
Chang, C.W., Wang, R.S., Yang, P.c. and Lee, Y.T. (2002)
Global analysis of differentially expressed genes in early
gestational deciduas and chorionic villi using a 9600
human cONA microarray. Mol. Hum. Reprod., 8, 475-484.
18) Hashizume, K. (2007) Analysis of uteroplacental-specific molecules and their fu
genes from microarray data. BMC. Bioinformatics., 3, 17
21) Tarca, A.L., Romero, R. and Oraghici, S. (2006) Analysis
of microarray experiments of gene expression profiling.
Am. J. Obstet. Gynecol., 195,373-388.
22) Iwahashi, H., Kitagawa, E., Suzuki, Y., Ueda,Y., Ishizawa,
Y.H., Nobumasa, H., Kuboki, Y., Hosoda, H. and
Iwahashi, Y. (2007) Evaluation of toxicity of the
mycotoxin citrinin using yeast ORF ONA microarray and
Oligo ONA microarray. BMC. Genomics, 8,95.
23) Perez-Oiez, A., Morgun, A. and Shulzhenko, N. (2007)
Microarrays for cancer diagnosis and classification. Adv.
Exp. Med. Biol., 593, 74-85.
24) White, C.A. and Salamonsen, L.A. (2005) A guide to issues
in microaπay analysis: application to endometrial biology
Reproduction, 130, 1-13.
25) Herath, C.B., Shiojima, S., Ishiwata, H., Katsuma, S.,
Kadowaki, T., Ushizawa, K., Imai, K., Takahashi, T.,
Hirasawa, A., Tsujimoto, G. and Hashizume, K. (2004)
Pregnancy-associated changes in genome-wide gene
expression profiles in the liver of cow throug.hout pregnancy. Biochem. Biophys. Res. Commun., 313, 666
680.
26) Nikitenko, L., Morgan, G., Kolesnikov, S.l. and Wooding,
F.B.P. (1998) Immunocytochemical and in situ
hybridization studies of the distribution of calbindin 0 9k
in the bovine placenta throughout pregnancy. J. Histchem
Cytochem., 46, 679-688
27) Regnault, T.R., Orbus, R.J., Oe Vrijer, B., Oavidsen, M.L.,
Galan, H.L., Wilkening, R.B. and Anthony, R.V. (2002)
Placental expression ofVEGF, PIGF, and their receptors in a model of placental insufficiency-intrauterine growth
restnctlOr】(PI-IUGR).Placenta., 23, 132-144.
28) Katsuma, S., Shiojima, S., Hirasawa, A., Suzuki, Y.,
Ikawa, H., Takagaki, K., Kaminishi, Y., Murai, M., Ohgi,
T., Yano, J. and Tsujimoto, G. (2001) Functional genomic
search of G-protein coupled receptors (GPCR) using
microarrays with normalized cONA library. Methods
Enzymol., 345, 585-600.
29) Werner, T. (2001) Clust巴ranalysis and promoter modelling
as bioinformatics tools for the identification of target genes
from expression array data. Pharmacogenomicsm, 2, 25-
36.
30) Yang, Y.H., Oudoit, S., Luu, P., Lin, O.M., Peng, V., Ngai,
J. and Speed, T.P. (2002) Normalization for cDNA
microarray data: a robust composite method addressing
single and multiple slide system variation. Nucleic. Acids
Res., 30, e 15.
31) O'haeseleer, P. (2005) How does gene expression
clustering workワNat.Biotechnol., 23, 1499-1501.
32)
Thiagarajan, M., Sturn, A., Snuffin, M., Rezantsev, A.,
Popov, 0., Ryltsov, A., Kostukovich, E., Borisovsky, 1.,
Liu, Z., Vinsavich, A., Trush, V. and Quackenbush, J.
(2003) TM4: a free, open-source system for microarray
data management and analysis. Biotechniques, 34, 374-
378.
34) Bauersachs, S., Ulbrich, S.E., Gross, K., Schmidt, S.E.,
Meyer, H.H., Einspanier, R., Wenigerkind, H., Verrnehren,
M., Blum, H., Sinowatz, F. and Wolf, E. (2005) Gene
expression profiling of bovine endometrium during the
oestrous cycle: detection of molecular pathways involved
in functional changes. J. Mol. Endocrinol., 34, 889-908
35) Everts, R.E., Band, M.R., Liu, Z.L., Kumar, C.G., Liu, L.,
Loor, J.J., Oliveira, R. and Lewin, H.A. (2005) A 7872
cDNA microarray and its use in bovine functior】al
genomics. Vet. Immunol. Immunopathol., 105,235-245.
36) Smith, S.L., Everts, R.E., Tian, X.C., Du, F., Sung, L.Y.,
Rodriguez-Zas, S.L., Jeong, B.S., Renard, J.P., Lewin,
H.A. and Yang, X. (2005) Global gene expression profiles
reveal significant nuclear reprogramming by the blastocyst
stage after cloning. Proc. Natl. Acad. Sci. USA., 102, 17582-17587
37) Bauersachs, S., Ulbrich, S.E., Gross, K., Schmidt, S.E.,
Meyer, H.H., Wenigerkind, H., Vermehren, M., Sinowatz,
F., Blum, H. and Wolf, E. (2006) Embryo-induced
transcriptome changes in bovine endometrium reveal
species-specific and common molecular markers of uterine
receptivity. Reproduction, 132,319-331.
38) Ushizawa, K., Takahashi, T., Hosoe, M., Kaneyama, K.
and Hashizume, K. (2005) Cloning and expression of two new prolactin-related proteins, prolactin-related protein-
VIII and -IX, in bovine placenta. Reprod. Biol.
Endocrinol., 3, 68.
39) Ushizawa, K., Kaneyama, K., Takahashi, T., Tokunaga, T.,
Tsunoda, Y. and Hashizume, K. (2005) Cloni月 and
expression of a new member of prolactin-related protein in
bovine placenta: bovine prolactin-related protein-VIl.
Biochem. Biophys. Res. Commun., 326, 435-441. 40) Ushizawa, K., Takahashi, T., Kaneyama, K., Hosoe, M.
and Hashizume, K. (2006) Cloning of the bovine
antiapoptotic regulator, BCL2-related protein A 1, and its expression in trophoblastic binucleate cells of bovine
placenta. Biol. Reprod., 74, 344-351
41) Hashizume, K., Ishiwata, H., Kizaki, K., Yamada, 0.,
Takahashi, T., Imai, K., Patel, O.V., Akagi, S., Shimizu,
M., Takahashi, S., Katsuma, S., Shiojima, S., Hirasawa, A.,
Tsujimoto, G., Todoroki, J. and Izaike, Y. (20
Hash;zume, et al. 89
the distribution of pregnancy associated glycoproteins
(PAGs) throughout pregnancy in the cow: possible
functional implications. Placenta., 26, 807-827
44) Patel, O.V., Sulon, J., Beckers, J.F., Takahashi, T., Hirako,
M., Sasaki, N. and Domeki, 1. (1997) Plasma bovine
pregnan cy-assoc iated gl ycoprotei n concentrations
throughout gestation in relationship to fetal number in the
cow. Eur. J. Endocrinol., 137,423-428.
45) Patel, O.V., Yamada, 0., Kizaki, K., Takahashi, T., Imai,
K. and Hashizume, K. (2004) Quantitative analysis
throughout pregnancy of placentomal and interplacentomal
expression of pregnancy-associated glycoproteins-I and -9
in the cow. Mol. Reprod. Dev., 67, 257-263. 46) Patel, O.V., Yamada, 0., Kizaki, K., Takahashi, T., Imai,
K., Takahashi, S., Izaike, Y., Schuler, L.A., Takezawa, T.
and Hashizume, K. (2004) Expression of trophoblast cell-
specific pregnancy-related genes in somatic cell-c1oned
bovine pregnancies. Biol. Reprod., 70, 1114-1120. 47) Klisch, K., De Sousa, N.M., Beckers, J.F., Leiser, R. and
Pich, A. (2005) Pregnancy associated glycoprotein-I, -6,-
7, and -17 are major products of bovine binucleate
trophoblast giant cells at midpregnancy. Mol. Reprod
Dev., 71, 453-460.
48) Hansen, P.J. (1995) lnteractions between the immune
system and the ruminant conceptus. J. Reprod. Fertil.
Suppl., 49, 69-82.
49) Zoli, A.P., Guilbault, L.A., Delahaut, P., Ortiz, W.B. and
Beckers, J.F. (1992) Radioimmunoassay of a bovine
pregnancy-associated glycoprotein in serum: its application
for pregnancy diagnosis. Biol. Reprod., 46, 83-92.
50) Green, J.A., Xie, S., Quan, X., Bao, B., Gan, X.,
Mathialagan, N., Beckers, J.F. and Roberts, R.M. (2000)
Pregnancy-associated bovine and ovine glycoproteins
exhibit spatially and t巴mporallydistinct expression pattems
during pregnancy. Biol. Reprod., 62, 1624-1631.
51) Wooding, F.B. (1992) Current topic: the
synepitheliochorial placenta of ruminants: binucleate cell
fusions and hormone production. Placenta., 13, 101ー113.
52) Byatt, J.C., Eppard, P.J., Veenhuizen, J.J., Curran, T.L.,
Curran, D.F., McGrath, M.F. and Collier, R.J. (1994)
Stimulation of mammogenesis and lactogenesis by
recombinant bovine placental lactogen in steroid-primed
dairy heifers. J. Endocrinol., 140,33-43.
53) Lucy,ルI.C.,Bya口, J.C., Curran, T.L., Curran, D.F. and
Collier, R.J. (1994) Placental lactogen and somatotropin:
hormone binding to the corpus luteum and effe
90 J. Mamm. Ova Res. Vol. 24, 2007
56) Yamada, 0., Todoroki, J., Kizaki, K., Takahashi, T., Imai,
K., Patel, O.V., Schuler, L.A. and Hashizume, K. (2002)
Expression of prolactin-related protein 1 at the fetomatemal
interface during the implantation period in cows.
Reproduction, 124,427-437 57) Milosavljevic, M., Duello, T.M. and Schuler, L.A. (1989)
In situ localization of two prolactin・relatedmessenger
ribonuc1eic acids to binuc1eate cells of bovine placentomes.
Endocrinology, 125, 883-889.
58) Kessler, M.A., Duello, T.M. and Schuler, L.A. (1991)
Expression of prolactin・relatedhormones in the early
bovine conceptus, and potential for paracrine effect on the endometrium. Endocrinology, 129, 1885-1895
59) Morgan, G., Wooding, F.B. and Godkin, J.D. (1993)
Localization of bovine trophoblast protein-1 in the cow
blastocyst during implantation: an immunological
cryoultrastructural study. Placenta, 14, 641-649.
60) Kessler, M.A. and Schuler, L.A. (1997) Purification and
properties of placental prolactin-related protein-l.
Placenta., 18, 29-36. 61) Klisch, K., Boos, A., Friedrich, M., Herzog, K., Feldmann,
恥1.,Sousa, N., Beckers, J., Leiser, R. and Schuler, G.
(2006) The glycosylation of pregnancy-associated
glycoproteins and prolactin-related protein-I in bovine
binucleate trophoblast giant cells changes before
parturition. Reproduction, 132, 791-798.
62) Ushizawa, K. and Hashizume, K. (2006) Biology of the
prolactin family in bovine placenta. 11. Bovine prolactin-
re1ated proteins: their expression, structure and proposed roles. Anim. Sci. J., 77,18-27
63) Stewart, M.D., Johnson, G.A., Gray, C.A., Burghardt, R.C.,
Schuler, L.A., Joyce, M.M., Bazer, F.W. and Spencer, T.E.
(2000) Prolactin receptor and uterine milk protein
expression in the ovine endometrium during the estrous
cyc1e and pregnancy. Biol. Reprod., 62, 1779ー1789.
64) Tekin, S. and Hansen, P.J. (2004) Regulation ofnumbers of
macrophages in the endometrium of the sheep by systemic
effects of pregnancy, 10cal presence of the conceptus, and progesterone. Am. J. Reprod. Immunol., 51,56-62.
65) Xie, S., Green, J., Bixby, J.B., Sza仕anska,B., DeMartini,
J.C., Hecht, S. and Roberts, R.M. (1997) The diversity and
evolutionary relationships of the pregnancy-associated
glycoproteins, an aspartic proteinase subfamily consisting
of many trophoblast-expressed genes. Proc. Natl. Acad.
Sci. USA., 94,12809-12816. 66) Olsen, H.S., Cepeda, M.A.
69) Jian, X., Sainz, E., Clark, W.A., Jensen, R.T., Battey, J.F.
and Northup, J.K. (1999) The bombesin receptor subtypes
have distinct G protein specificities. J. Biol. Chem., 274,
11573-11581.
70) Budipitojo, T., Sasaki, M., Cruzana, M.B., Matsuzaki, S.,
Iwanaga, T., Kitamura, N. and Yamada, 1. (2004)
Ultrastructural localization of gastrin-releasing peptide
(GRP) in the uterine gland of cow. Anat. Embryol. (Berl.),
208,1-6.
71) Afonso, S., Romagnano, L. and Babiarz, B. (1997) The
expression and function of cystatin C and cathepsin B and
cathepsin L during mouse embryo implantation and
placentation. Dev巴lopment,124,3415-3425 72) Song, G., Spencer, T.E. and Bazer, F.W. (2005) Cathepsins
in the ovine uterus: regulation by pregnancy, progesterone, and interferon tau. Endocrinology, 146,4825-4833.
73) Satterfield, M.C., Bazer, F.W. and Spencer, T.E. (2006)
Progesterone regulation of preimplantation conceptus
growth and galectin 15 (LGALS 15) in the ovine uterus
Biol. Reprod., 75, 289-296. 74) Ushizawa, K., Herath, C.B., Kaneyama, K., Shiojima, S.,
Hirasawa, A., Takahashi, T., 1mai, K., Ochiai, K.,
Tokunaga, T., Tsunoda, Y., Ts吋imoto,G. and Hashizume,
K. (2004) cDNA microarray analysis of bovine embryo
gene expression profiles during the pre-implantation
period. Reprod. Biol. Endocrinol., 2, 77.
75) Ushizawa, K., Takahashi, T., Kaneyama, K., Tokunaga, T.,
Tsunoda, Y. and Hashizume, K. (2005) Gene expression
profiles of bovine trophoblastic cell line (BT -1) analyzed
by a custom cDNA microarray. J. Reprod. Dev., 51, 211
220.
76) Kizaki, K., Yamada, 0., Nakano, H., Takahashi, T.,
Yamauchi, N., Imai, K. and Hashizume, K. (2003) Cloning
and localization of heparanase in bovine placenta.
Placenta., 24, 424-430.
77) Blackbum, M.R., Wakamiya, M., Caskey, C.T. and
Kel1ems, R.E. (1995) Tissue-specific rescue suggests that
placental adenosine deaminase is important for fetal
development in mice. J. Biol. Chem., 270, 23891-23894 78) Wakamiya, M., Blackbum, M.R., Jurecic, R., McArthur,
M.J., Geske, R.S., Cart-wright, J.Jr., Mitani, K., Vaishnav,
S., Belmont, 1.W., Kellems, R.E., Finegold, M.1.,
Montgomery, C.A.Jr., Bradley, A. and Caskey, C.T. (1995)
Disruption of the adenosine deaminase gene causes
hepatocel1ular impairment and perinatal lethality in mice.
Proc. Natl. Acad. Sci. USA., 92, 3673-3677.
79) Shi, D. and Kellems, R.E. (1998) Transcription factor AP-
2gamma regulates murine adenosine
species hybridization of human and bovine orthologous
genes on high density cDNA microarrays. BMC.
Genomics., 5, 83.
82) Gao, F., Foat, B.C. and Bussemaker, H.J. (2004) Defining
transcriptional networks through integrative modeling of
mRNA expression and transcription factor binding data.
BMC. Bioinformatics, 5, 31.
83) Hvidsten, T.R., Wilczynski, B., Kryshtafovych, A., Tiuryn,
J., Komorowski, J. and Fidelis, K. (2005) Discovering
regulatory binding-site modules using rule-based learning
Genome Res., 15, 856-866
84) Kamalakaran, S., Radhakrishnan, S.K. and Beck, W.T
(2005) Identification of estrogen-responsive genes using a
genome-wide analysis of promoter elements for
transcription factor binding sites. J. Biol. Chem., 280,
Hashizume, et al. 91
21491-21497.
85) Kim, S.Y. and Kim, Y. (2006) Genome-wide prediction of
transcriptional regulatory elements of human promoters
using gene expression and promoter analysis data. BMC.
Bioinformatics., 7, 330.
86) Veerla, S. and Hoglund, M. (2006) Analysis of promoter regions of co-expressed genes identified by microarray
analysis. B恥1C.Bioinforrnatics, 7, 384. 87) Ke打,M.K. and Churchill, G.A. (2001) Bootstrapping
cluster analysis: assessing the reliability of conclusions
from microarray experiments. Proc. Natl. Acad. Sci. USA., 98,8961-8965
88) Yoon, D., Yi, S.G., Kim, J.H. and Park, T. (2004) Two-
stage normalization using background intensities in cDNA
microarray data. BMC. Bioinformatics, 5, 97.
Related Documents