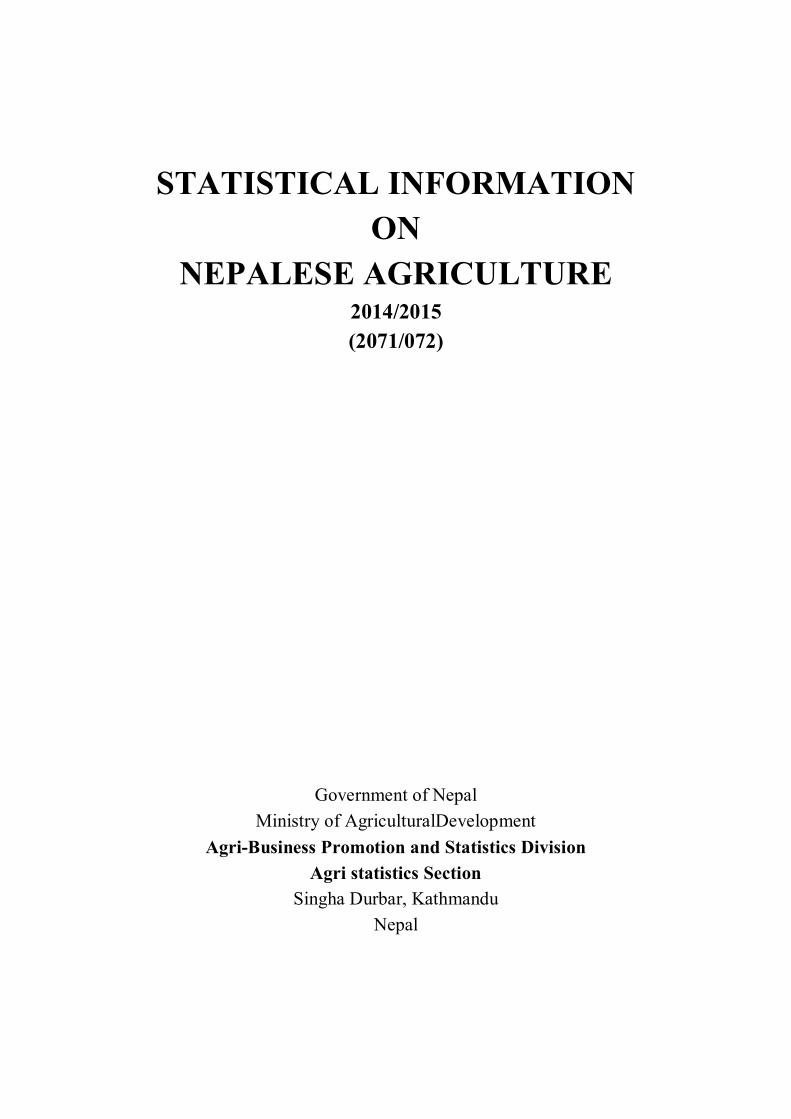
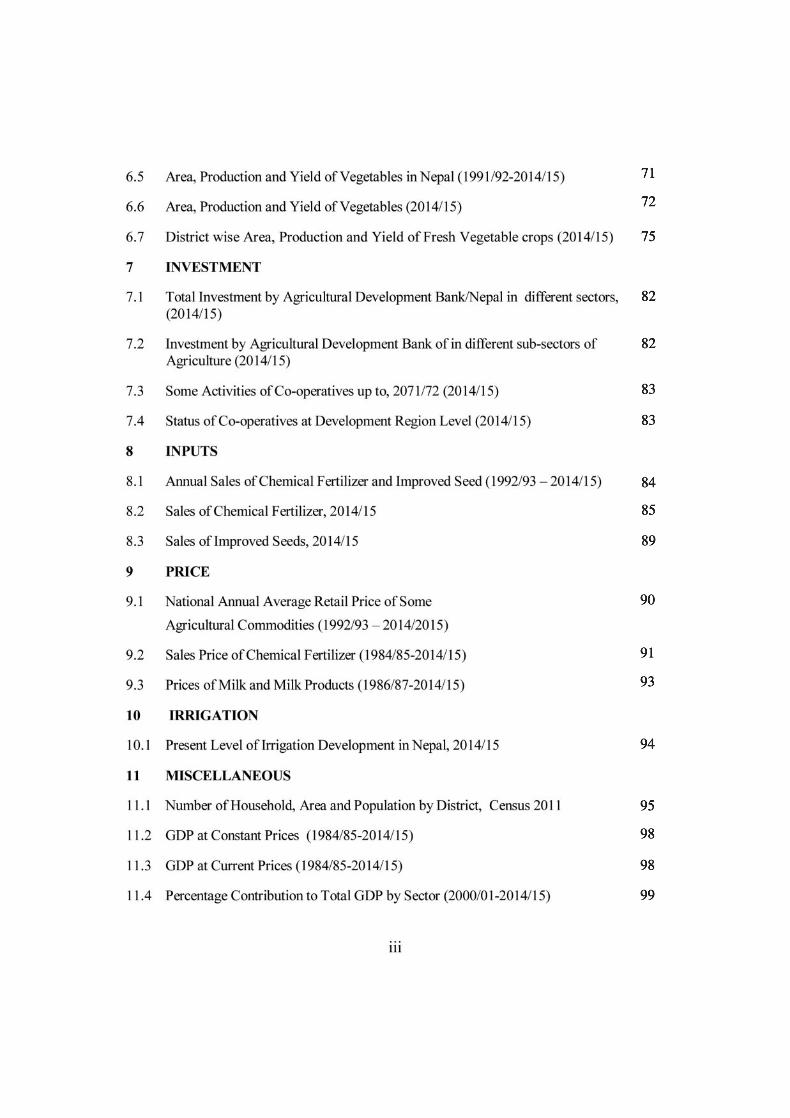
STATISTICAL I N FORMATION ON NEPALESE AGRICULTURE 2AL4l2A,5 1207uo72l INDEX OF MAJOR AGRICUTTURAL PRODUCTION BASE YEAR THREE YEAR AVERAGE (2000/01- 2ao2l03l *"$*"_* :i ,**i 250 200 150 100 50 0 -""t. "-E "-t. ".t- r"""t- ""-t- ".""$ r"-t. ""C """"-" r6,"f "3}e r"f ,69- "-f --+t:.CEREALS -).*.CASH CROPS pULSES -*.-FRUITS VEGETABLES*s$i,-- MiLK -.+_MEAT ._r_EGG Government of Nepal M inistry of Agricultural Development Agri-Business Promotion and statistics Division Statistics Sectieirr Singha Durbar, Kathmandu Nepal

Welcome message from author
This document is posted to help you gain knowledge. Please leave a comment to let me know what you think about it! Share it to your friends and learn new things together.
Transcript
STATISTICAL I N FORMATION
ONNEPALESE AGRICULTURE
2AL4l2A,51207uo72l
INDEX OF MAJOR AGRICUTTURAL PRODUCTIONBASE YEAR THREE YEAR AVERAGE (2000/01-
2ao2l03l
*"$*"_* :i ,**i250
200
150
100
50
0
-""t. "-E "-t. ".t-
r"""t- ""-t- ".""$
r"-t. ""C """"-" r6,"f
"3}e r"f ,69-
"-f--+t:.CEREALS -).*.CASH CROPS pULSES -*.-FRUITS
VEGETABLES*s$i,-- MiLK -.+_MEAT ._r_EGG
Government of NepalM inistry of Agricultural Development
Agri-Business Promotion and statistics DivisionStatistics Sectieirr
Singha Durbar, KathmanduNepal
-
STATI.STICAL INFORMATIONot{
T{EPALESE AGRICULTURE2Ot4l2Or5(2071./072)
Government of NepalMinistry of Agricultural Development
Agri-Business Promotion and Statistics DivisionAgri statistics Section
Singha Durbar, KathmanduNepal
STATISTICAL INFORMATION ON
NEPALESE AGRICULTURE 2014/2015 (2071/072)
Government of Nepal Ministry of AgriculturalDevelopment
Agri-Business Promotion and Statistics Division Agri statistics Section
Singha Durbar, Kathmandu Nepal
Publisher: Government of Nepal Ministry of Agricultural Development Agribusiness Promotion and Statistics Division Agri Statistics section Singha Durbar, Kathmandu Nepal Phone: 4211687 Fax : 977-1-4211839 E-mail: [email protected] December, 2015 Printed, 100 copies
1
5
6
11
12
13
14
15
18
22
22
22
22
23
24
24
25
26
30
31
36
37
38
41
44
47
50
53
53
54
55
56
57
60
62
65
68
71
72
75
82
82
83
83
84
85
89
90
91
93
94
95
98
98
99
100
101
101
102
106
207
208
210
211
212
214
215
217
244
1
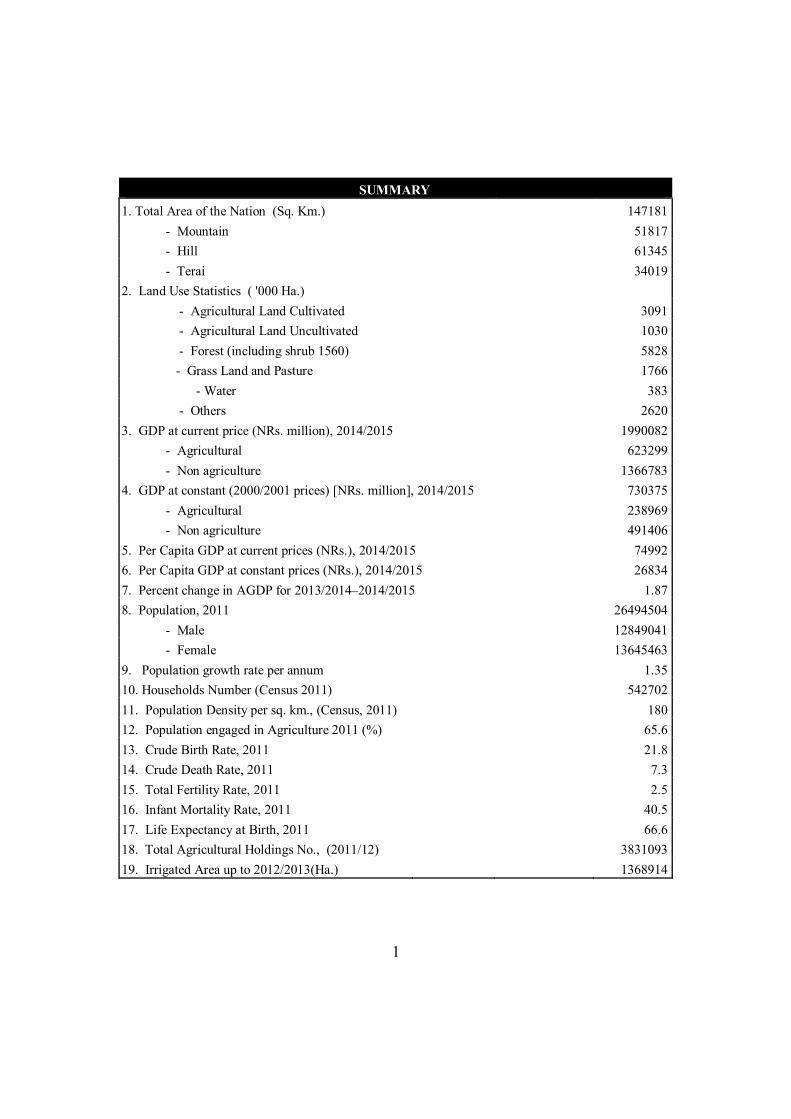
SUMMARY 1. Total Area of the Nation (Sq. Km.) 147181 - Mountain
51817
- Hill
61345 - Terai
34019
2. Land Use Statistics ( '000 Ha.)
- Agricultural Land Cultivated
3091
- Agricultural Land Uncultivated
1030 - Forest (including shrub 1560)
5828
- Grass Land and Pasture
1766 - Water
383
- Others
2620 3. GDP at current price (NRs. million), 2014/2015
1990082
- Agricultural
623299 - Non agriculture
1366783
4. GDP at constant (2000/2001 prices) [NRs. million], 2014/2015 730375 - Agricultural
238969
- Non agriculture
491406 5. Per Capita GDP at current prices (NRs.), 2014/2015
74992
6. Per Capita GDP at constant prices (NRs.), 2014/2015
26834 7. Percent change in AGDP for 2013/2014–2014/2015
1.87
8. Population, 2011
26494504 - Male
12849041
- Female
13645463 9. Population growth rate per annum
1.35
10. Households Number (Census 2011)
542702 11. Population Density per sq. km., (Census, 2011)
180
12. Population engaged in Agriculture 2011 (%)
65.6 13. Crude Birth Rate, 2011
21.8
14. Crude Death Rate, 2011
7.3 15. Total Fertility Rate, 2011
2.5
16. Infant Mortality Rate, 2011
40.5 17. Life Expectancy at Birth, 2011
66.6
18. Total Agricultural Holdings No., (2011/12)
3831093 19. Irrigated Area up to 2012/2013(Ha.)
1368914
2
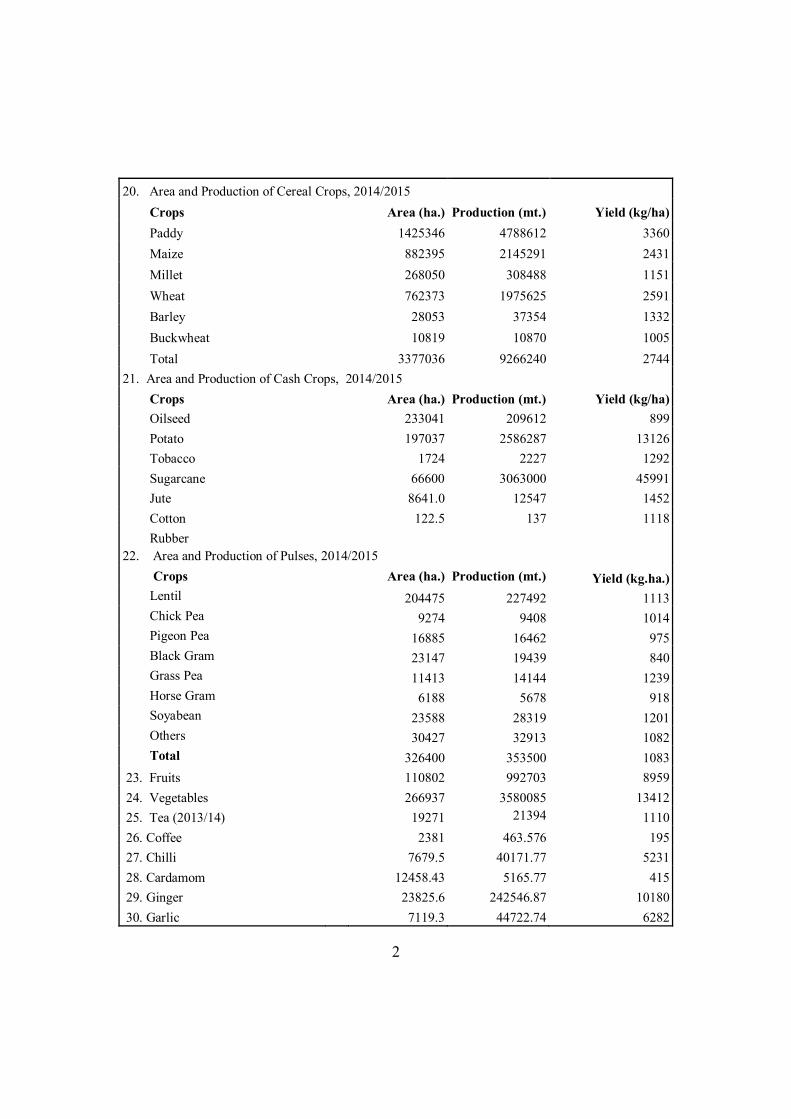
20. Area and Production of Cereal Crops, 2014/2015
Crops Area (ha.) Production (mt.) Yield (kg/ha) Paddy
1425346 4788612 3360
Maize
882395 2145291 2431 Millet
268050 308488 1151
Wheat
762373 1975625 2591 Barley
28053 37354 1332
Buckwheat 10819 10870 1005 Total
3377036 9266240 2744
21. Area and Production of Cash Crops, 2014/2015
Crops
Area (ha.) Production (mt.) Yield (kg/ha)
Oilseed
233041 209612 899 Potato
197037 2586287 13126
Tobacco
1724 2227 1292 Sugarcane
66600 3063000 45991
Jute
8641.0 12547 1452 Cotton 122.5 137 1118
Rubber
22. Area and Production of Pulses, 2014/2015 Crops
Area (ha.) Production (mt.) Yield (kg.ha.)
Lentil
204475 227492 1113 Chick Pea 9274 9408 1014 Pigeon Pea 16885 16462 975 Black Gram 23147 19439 840 Grass Pea 11413 14144 1239 Horse Gram 6188 5678 918 Soyabean 23588 28319 1201 Others
30427 32913 1082
Total
326400 353500 1083 23. Fruits 110802 992703 8959 24. Vegetables 266937 3580085 13412 25. Tea (2013/14)
19271 21394 1110
26. Coffee 2381 463.576 195 27. Chilli 7679.5 40171.77 5231 28. Cardamom 12458.43 5165.77 415 29. Ginger
23825.6 242546.87 10180
30. Garlic
7119.3 44722.74 6282
3
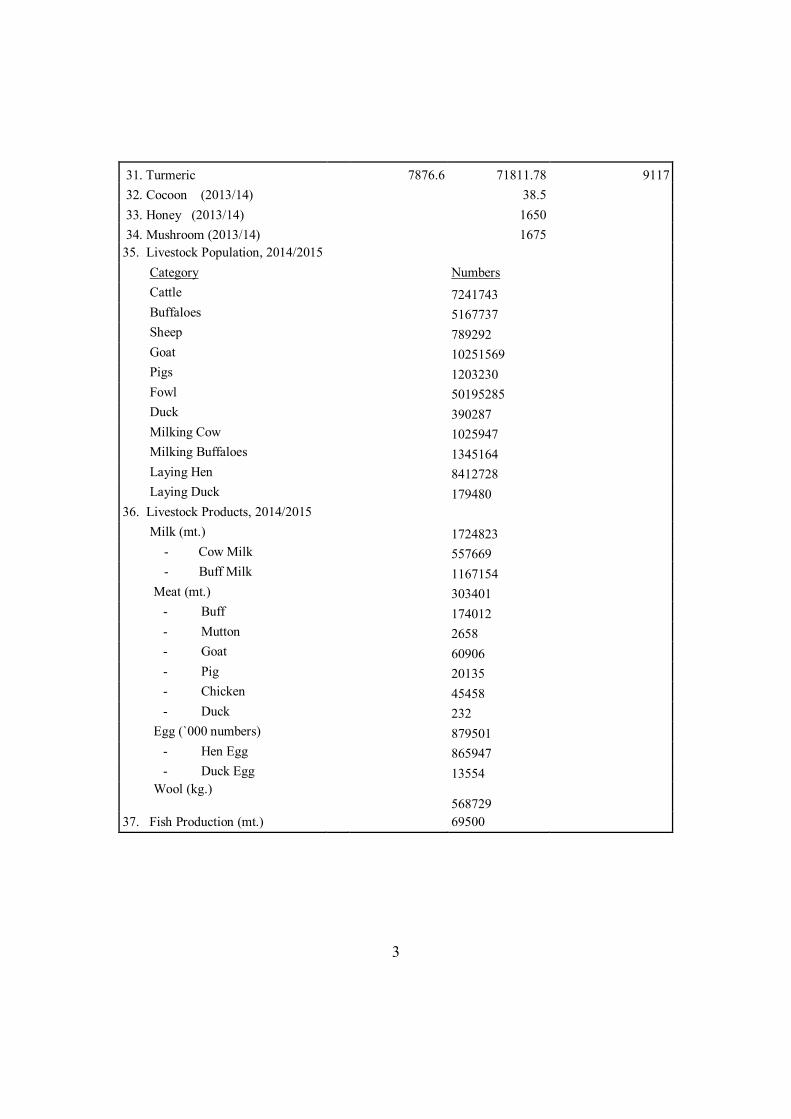
31. Turmeric
7876.6 71811.78 9117 32. Cocoon (2013/14)
38.5
33. Honey (2013/14)
1650 34. Mushroom (2013/14)
1675
35. Livestock Population, 2014/2015
Category
Numbers
Cattle
7241743 Buffaloes
5167737
Sheep
789292 Goat
10251569
Pigs
1203230 Fowl
50195285
Duck
390287 Milking Cow
1025947
Milking Buffaloes
1345164
Laying Hen
8412728
Laying Duck
179480 36. Livestock Products, 2014/2015
Milk (mt.)
1724823
- Cow Milk
557669 - Buff Milk
1167154
Meat (mt.)
303401
- Buff
174012
- Mutton
2658
- Goat
60906
- Pig
20135 - Chicken
45458
- Duck
232
Egg (`000 numbers)
879501 - Hen Egg
865947
- Duck Egg
13554
Wool (kg.)
568729
37. Fish Production (mt.)
69500
4
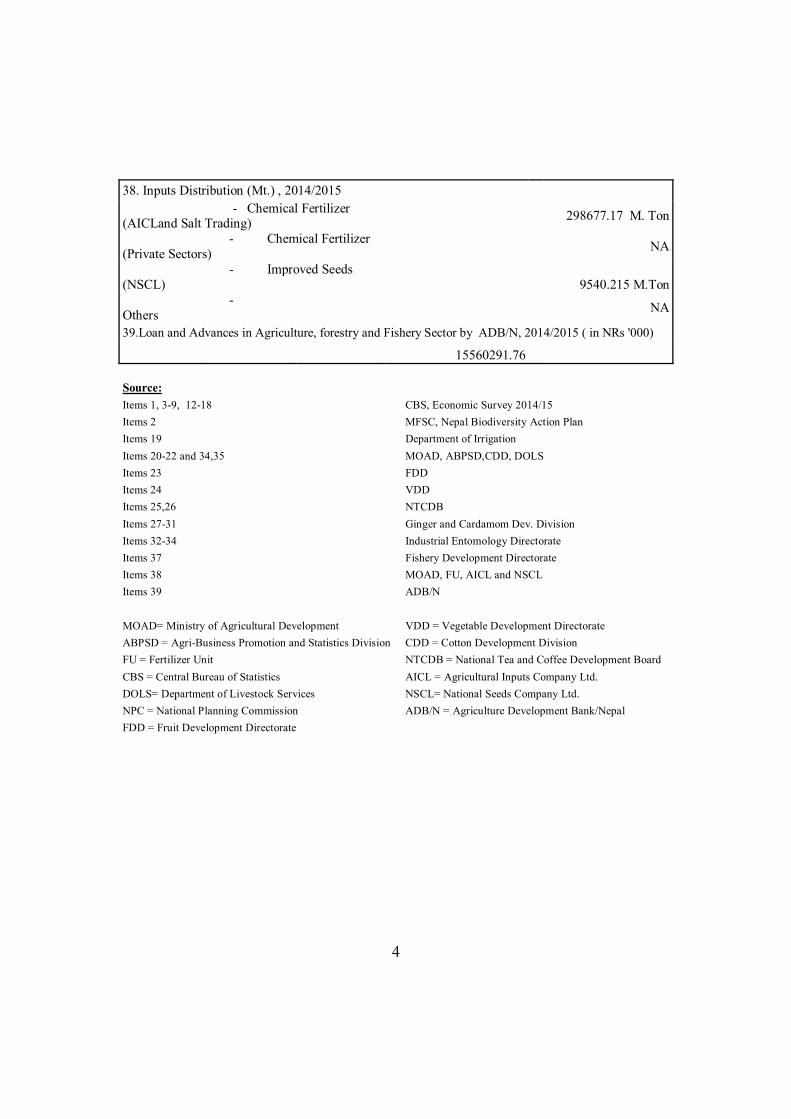
38. Inputs Distribution (Mt.) , 2014/2015
- Chemical Fertilizer (AICLand Salt Trading) 298677.17 M. Ton
- Chemical Fertilizer (Private Sectors) NA
- Improved Seeds (NSCL) 9540.215 M.Ton
- Others
NA
39.Loan and Advances in Agriculture, forestry and Fishery Sector by ADB/N, 2014/2015 ( in NRs '000)
15560291.76 Source: Items 1, 3-9, 12-18 CBS, Economic Survey 2014/15 Items 2 MFSC, Nepal Biodiversity Action Plan Items 19 Department of Irrigation Items 20-22 and 34,35 MOAD, ABPSD,CDD, DOLS Items 23 FDD Items 24 VDD Items 25,26 NTCDB Items 27-31 Ginger and Cardamom Dev. Division Items 32-34 Industrial Entomology Directorate Items 37 Fishery Development Directorate Items 38 MOAD, FU, AICL and NSCL Items 39 ADB/N MOAD= Ministry of Agricultural Development VDD = Vegetable Development Directorate ABPSD = Agri-Business Promotion and Statistics Division CDD = Cotton Development Division FU = Fertilizer Unit NTCDB = National Tea and Coffee Development Board CBS = Central Bureau of Statistics AICL = Agricultural Inputs Company Ltd. DOLS= Department of Livestock Services NSCL= National Seeds Company Ltd. NPC = National Planning Commission ADB/N = Agriculture Development Bank/Nepal FDD = Fruit Development Directorate
5
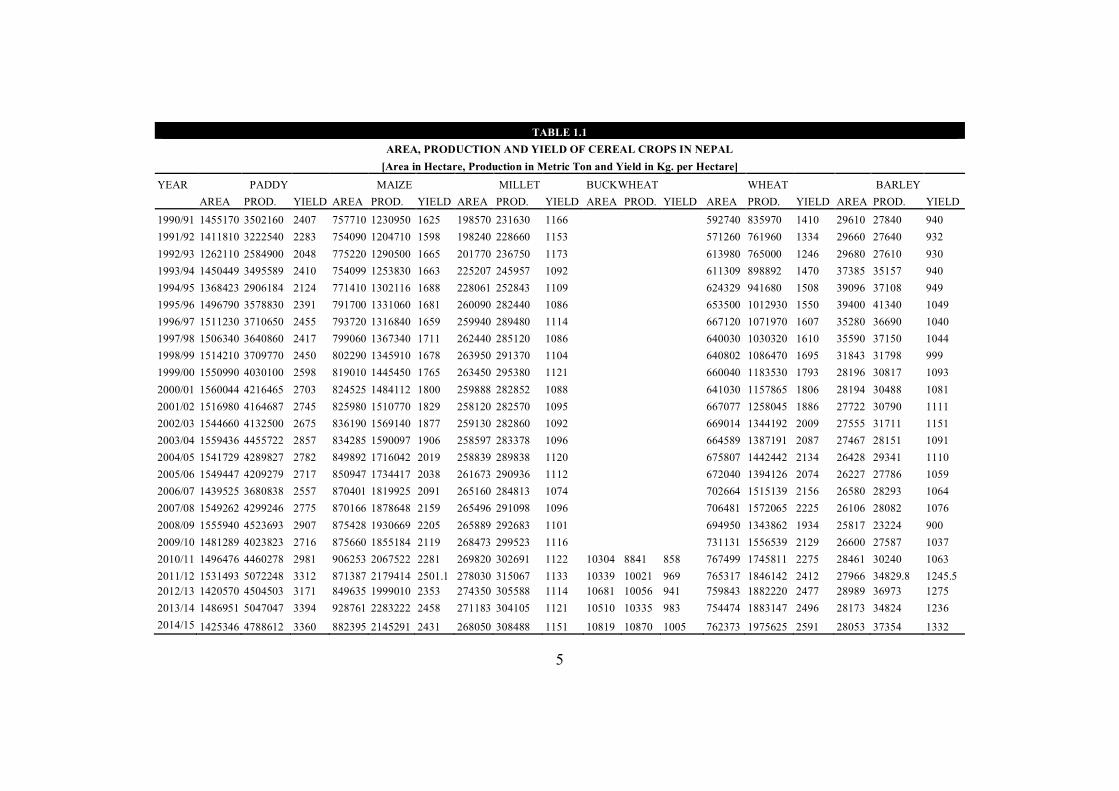
TABLE 1.1 AREA, PRODUCTION AND YIELD OF CEREAL CROPS IN NEPAL
[Area in Hectare, Production in Metric Ton and Yield in Kg. per Hectare] YEAR PADDY MAIZE MILLET BUCKWHEAT WHEAT BARLEY AREA PROD. YIELD AREA PROD. YIELD AREA PROD. YIELD AREA PROD. YIELD AREA PROD. YIELD AREA PROD. YIELD 1990/91 1455170 3502160 2407 757710 1230950 1625 198570 231630 1166 592740 835970 1410 29610 27840 940 1991/92 1411810 3222540 2283 754090 1204710 1598 198240 228660 1153 571260 761960 1334 29660 27640 932 1992/93 1262110 2584900 2048 775220 1290500 1665 201770 236750 1173 613980 765000 1246 29680 27610 930 1993/94 1450449 3495589 2410 754099 1253830 1663 225207 245957 1092 611309 898892 1470 37385 35157 940 1994/95 1368423 2906184 2124 771410 1302116 1688 228061 252843 1109 624329 941680 1508 39096 37108 949 1995/96 1496790 3578830 2391 791700 1331060 1681 260090 282440 1086 653500 1012930 1550 39400 41340 1049 1996/97 1511230 3710650 2455 793720 1316840 1659 259940 289480 1114 667120 1071970 1607 35280 36690 1040 1997/98 1506340 3640860 2417 799060 1367340 1711 262440 285120 1086 640030 1030320 1610 35590 37150 1044 1998/99 1514210 3709770 2450 802290 1345910 1678 263950 291370 1104 640802 1086470 1695 31843 31798 999 1999/00 1550990 4030100 2598 819010 1445450 1765 263450 295380 1121 660040 1183530 1793 28196 30817 1093 2000/01 1560044 4216465 2703 824525 1484112 1800 259888 282852 1088 641030 1157865 1806 28194 30488 1081 2001/02 1516980 4164687 2745 825980 1510770 1829 258120 282570 1095 667077 1258045 1886 27722 30790 1111 2002/03 1544660 4132500 2675 836190 1569140 1877 259130 282860 1092 669014 1344192 2009 27555 31711 1151 2003/04 1559436 4455722 2857 834285 1590097 1906 258597 283378 1096 664589 1387191 2087 27467 28151 1091 2004/05 1541729 4289827 2782 849892 1716042 2019 258839 289838 1120 675807 1442442 2134 26428 29341 1110 2005/06 1549447 4209279 2717 850947 1734417 2038 261673 290936 1112 672040 1394126 2074 26227 27786 1059 2006/07 1439525 3680838 2557 870401 1819925 2091 265160 284813 1074 702664 1515139 2156 26580 28293 1064 2007/08 1549262 4299246 2775 870166 1878648 2159 265496 291098 1096 706481 1572065 2225 26106 28082 1076 2008/09 1555940 4523693 2907 875428 1930669 2205 265889 292683 1101 694950 1343862 1934 25817 23224 900 2009/10 1481289 4023823 2716 875660 1855184 2119 268473 299523 1116
731131 1556539 2129 26600 27587 1037 2010/11 1496476 4460278 2981 906253 2067522 2281 269820 302691 1122 10304 8841 858 767499 1745811 2275 28461 30240 1063 2011/12 1531493 5072248 3312 871387 2179414 2501.1 278030 315067 1133 10339 10021 969 765317 1846142 2412 27966 34829.8 1245.5 2012/13 1420570 4504503 3171 849635 1999010 2353 274350 305588 1114 10681 10056 941 759843 1882220 2477 28989 36973 1275 2013/14 1486951 5047047 3394 928761 2283222 2458 271183 304105 1121 10510 10335 983 754474 1883147 2496 28173 34824 1236 2014/15 1425346 4788612 3360 882395 2145291 2431 268050 308488 1151 10819 10870 1005 762373 1975625 2591 28053 37354 1332
6
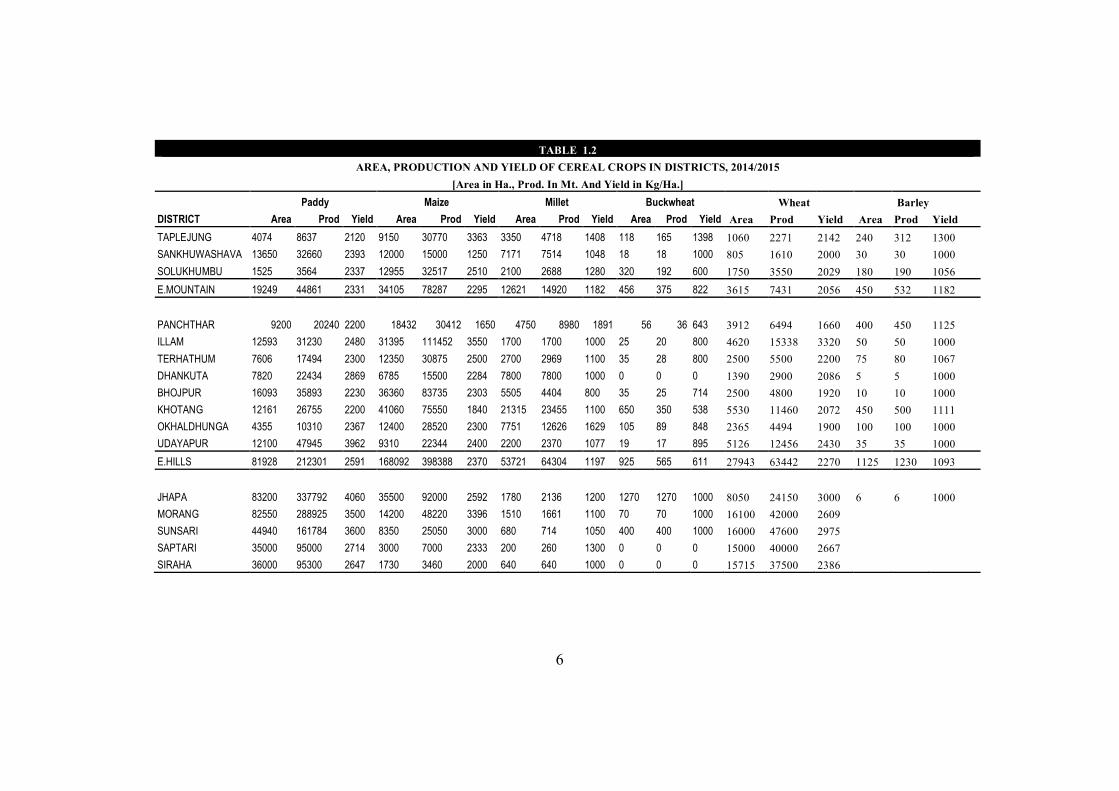
TABLE 1.2
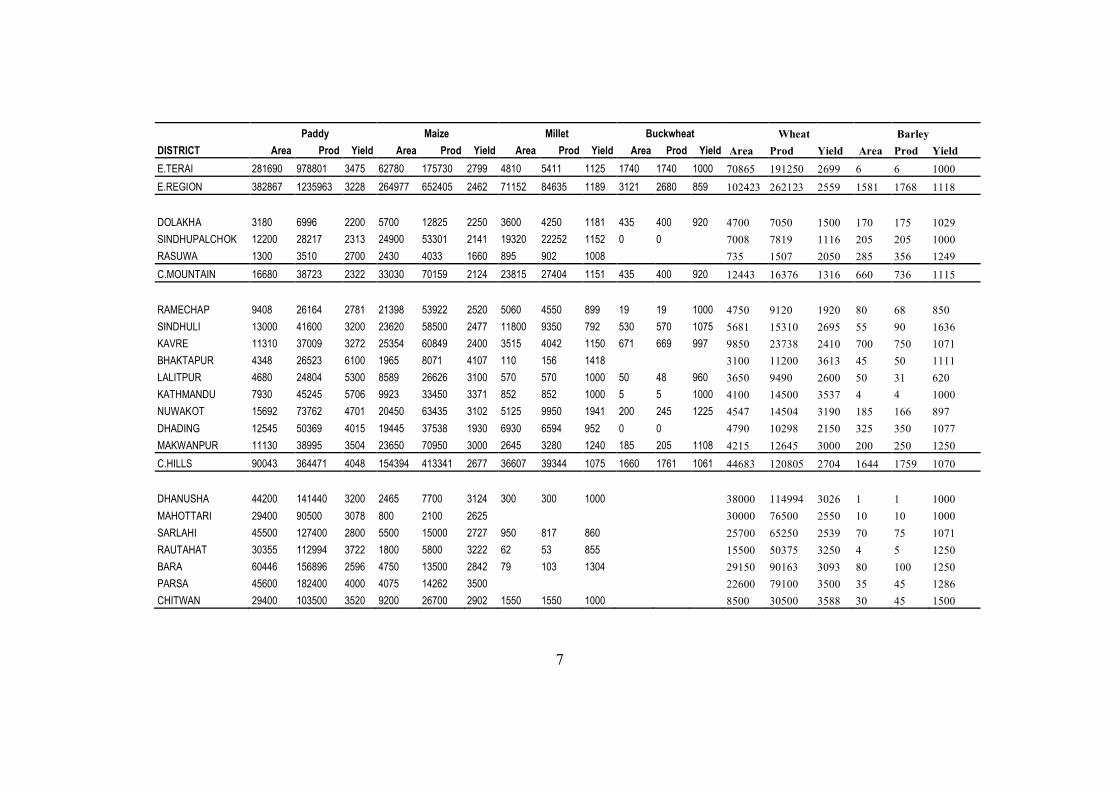
AREA, PRODUCTION AND YIELD OF CEREAL CROPS IN DISTRICTS, 2014/2015 [Area in Ha., Prod. In Mt. And Yield in Kg/Ha.]
Paddy Maize Millet Buckwheat Wheat Barley DISTRICT Area Prod Yield Area Prod Yield Area Prod Yield Area Prod Yield Area Prod Yield Area Prod Yield TAPLEJUNG 4074 8637 2120 9150 30770 3363 3350 4718 1408 118 165 1398 1060 2271 2142 240 312 1300 SANKHUWASHAVA 13650 32660 2393 12000 15000 1250 7171 7514 1048 18 18 1000 805 1610 2000 30 30 1000 SOLUKHUMBU 1525 3564 2337 12955 32517 2510 2100 2688 1280 320 192 600 1750 3550 2029 180 190 1056 E.MOUNTAIN 19249 44861 2331 34105 78287 2295 12621 14920 1182 456 375 822 3615 7431 2056 450 532 1182
PANCHTHAR 9200 20240 2200 18432 30412 1650 4750 8980 1891 56 36 643 3912 6494 1660 400 450 1125 ILLAM 12593 31230 2480 31395 111452 3550 1700 1700 1000 25 20 800 4620 15338 3320 50 50 1000 TERHATHUM 7606 17494 2300 12350 30875 2500 2700 2969 1100 35 28 800 2500 5500 2200 75 80 1067 DHANKUTA 7820 22434 2869 6785 15500 2284 7800 7800 1000 0 0 0 1390 2900 2086 5 5 1000 BHOJPUR 16093 35893 2230 36360 83735 2303 5505 4404 800 35 25 714 2500 4800 1920 10 10 1000 KHOTANG 12161 26755 2200 41060 75550 1840 21315 23455 1100 650 350 538 5530 11460 2072 450 500 1111 OKHALDHUNGA 4355 10310 2367 12400 28520 2300 7751 12626 1629 105 89 848 2365 4494 1900 100 100 1000 UDAYAPUR 12100 47945 3962 9310 22344 2400 2200 2370 1077 19 17 895 5126 12456 2430 35 35 1000 E.HILLS 81928 212301 2591 168092 398388 2370 53721 64304 1197 925 565 611 27943 63442 2270 1125 1230 1093
JHAPA 83200 337792 4060 35500 92000 2592 1780 2136 1200 1270 1270 1000 8050 24150 3000 6 6 1000 MORANG 82550 288925 3500 14200 48220 3396 1510 1661 1100 70 70 1000 16100 42000 2609 SUNSARI 44940 161784 3600 8350 25050 3000 680 714 1050 400 400 1000 16000 47600 2975 SAPTARI 35000 95000 2714 3000 7000 2333 200 260 1300 0 0 0 15000 40000 2667 SIRAHA 36000 95300 2647 1730 3460 2000 640 640 1000 0 0 0 15715 37500 2386
7
Paddy Maize Millet Buckwheat Wheat Barley DISTRICT Area Prod Yield Area Prod Yield Area Prod Yield Area Prod Yield Area Prod Yield Area Prod Yield E.TERAI 281690 978801 3475 62780 175730 2799 4810 5411 1125 1740 1740 1000 70865 191250 2699 6 6 1000 E.REGION 382867 1235963 3228 264977 652405 2462 71152 84635 1189 3121 2680 859 102423 262123 2559 1581 1768 1118
DOLAKHA 3180 6996 2200 5700 12825 2250 3600 4250 1181 435 400 920 4700 7050 1500 170 175 1029 SINDHUPALCHOK 12200 28217 2313 24900 53301 2141 19320 22252 1152 0 0
7008 7819 1116 205 205 1000
RASUWA 1300 3510 2700 2430 4033 1660 895 902 1008
735 1507 2050 285 356 1249 C.MOUNTAIN 16680 38723 2322 33030 70159 2124 23815 27404 1151 435 400 920 12443 16376 1316 660 736 1115
RAMECHAP 9408 26164 2781 21398 53922 2520 5060 4550 899 19 19 1000 4750 9120 1920 80 68 850 SINDHULI 13000 41600 3200 23620 58500 2477 11800 9350 792 530 570 1075 5681 15310 2695 55 90 1636 KAVRE 11310 37009 3272 25354 60849 2400 3515 4042 1150 671 669 997 9850 23738 2410 700 750 1071 BHAKTAPUR 4348 26523 6100 1965 8071 4107 110 156 1418
3100 11200 3613 45 50 1111
LALITPUR 4680 24804 5300 8589 26626 3100 570 570 1000 50 48 960 3650 9490 2600 50 31 620 KATHMANDU 7930 45245 5706 9923 33450 3371 852 852 1000 5 5 1000 4100 14500 3537 4 4 1000 NUWAKOT 15692 73762 4701 20450 63435 3102 5125 9950 1941 200 245 1225 4547 14504 3190 185 166 897 DHADING 12545 50369 4015 19445 37538 1930 6930 6594 952 0 0
4790 10298 2150 325 350 1077
MAKWANPUR 11130 38995 3504 23650 70950 3000 2645 3280 1240 185 205 1108 4215 12645 3000 200 250 1250 C.HILLS 90043 364471 4048 154394 413341 2677 36607 39344 1075 1660 1761 1061 44683 120805 2704 1644 1759 1070
DHANUSHA 44200 141440 3200 2465 7700 3124 300 300 1000
38000 114994 3026 1 1 1000 MAHOTTARI 29400 90500 3078 800 2100 2625
30000 76500 2550 10 10 1000
SARLAHI 45500 127400 2800 5500 15000 2727 950 817 860
25700 65250 2539 70 75 1071 RAUTAHAT 30355 112994 3722 1800 5800 3222 62 53 855
15500 50375 3250 4 5 1250
BARA 60446 156896 2596 4750 13500 2842 79 103 1304
29150 90163 3093 80 100 1250 PARSA 45600 182400 4000 4075 14262 3500
22600 79100 3500 35 45 1286
CHITWAN 29400 103500 3520 9200 26700 2902 1550 1550 1000
8500 30500 3588 30 45 1500
8
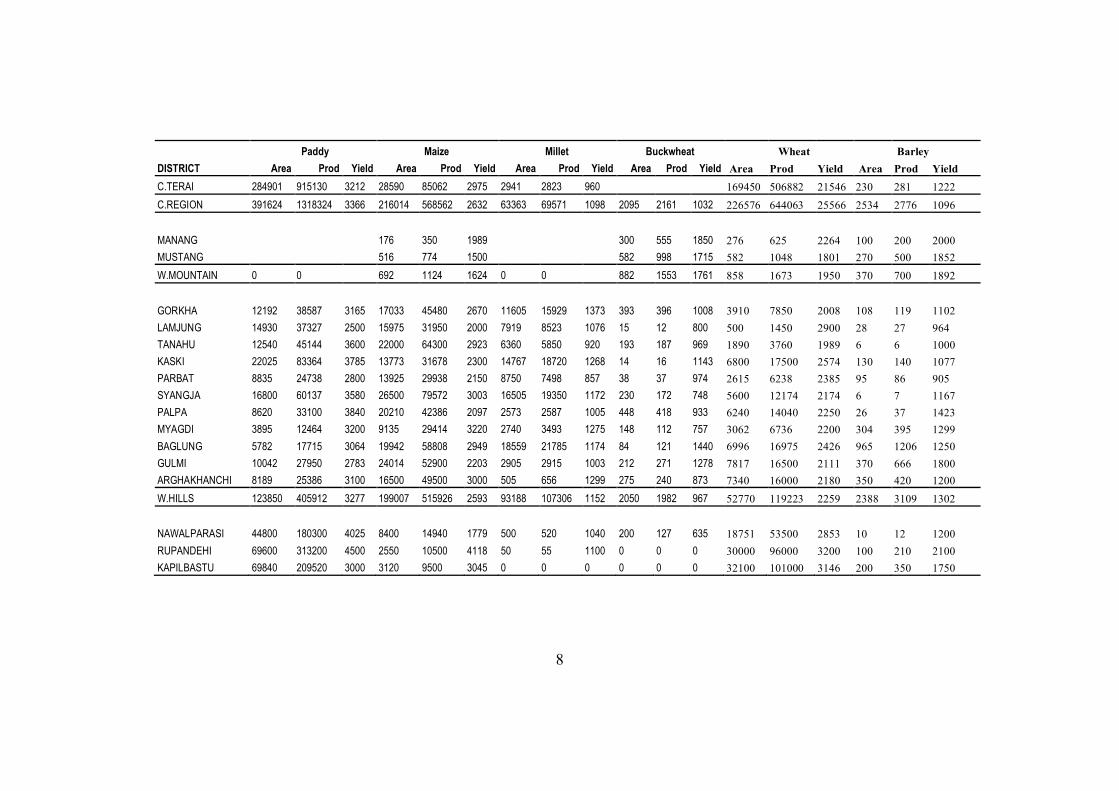
Paddy Maize Millet Buckwheat Wheat Barley DISTRICT Area Prod Yield Area Prod Yield Area Prod Yield Area Prod Yield Area Prod Yield Area Prod Yield C.TERAI 284901 915130 3212 28590 85062 2975 2941 2823 960 169450 506882 21546 230 281 1222 C.REGION 391624 1318324 3366 216014 568562 2632 63363 69571 1098 2095 2161 1032 226576 644063 25566 2534 2776 1096
MANANG
176 350 1989
300 555 1850 276 625 2264 100 200 2000 MUSTANG
516 774 1500
582 998 1715 582 1048 1801 270 500 1852
W.MOUNTAIN 0 0 692 1124 1624 0 0 882 1553 1761 858 1673 1950 370 700 1892
GORKHA 12192 38587 3165 17033 45480 2670 11605 15929 1373 393 396 1008 3910 7850 2008 108 119 1102 LAMJUNG 14930 37327 2500 15975 31950 2000 7919 8523 1076 15 12 800 500 1450 2900 28 27 964 TANAHU 12540 45144 3600 22000 64300 2923 6360 5850 920 193 187 969 1890 3760 1989 6 6 1000 KASKI 22025 83364 3785 13773 31678 2300 14767 18720 1268 14 16 1143 6800 17500 2574 130 140 1077 PARBAT 8835 24738 2800 13925 29938 2150 8750 7498 857 38 37 974 2615 6238 2385 95 86 905 SYANGJA 16800 60137 3580 26500 79572 3003 16505 19350 1172 230 172 748 5600 12174 2174 6 7 1167 PALPA 8620 33100 3840 20210 42386 2097 2573 2587 1005 448 418 933 6240 14040 2250 26 37 1423 MYAGDI 3895 12464 3200 9135 29414 3220 2740 3493 1275 148 112 757 3062 6736 2200 304 395 1299 BAGLUNG 5782 17715 3064 19942 58808 2949 18559 21785 1174 84 121 1440 6996 16975 2426 965 1206 1250 GULMI 10042 27950 2783 24014 52900 2203 2905 2915 1003 212 271 1278 7817 16500 2111 370 666 1800 ARGHAKHANCHI 8189 25386 3100 16500 49500 3000 505 656 1299 275 240 873 7340 16000 2180 350 420 1200 W.HILLS 123850 405912 3277 199007 515926 2593 93188 107306 1152 2050 1982 967 52770 119223 2259 2388 3109 1302
NAWALPARASI 44800 180300 4025 8400 14940 1779 500 520 1040 200 127 635 18751 53500 2853 10 12 1200 RUPANDEHI 69600 313200 4500 2550 10500 4118 50 55 1100 0 0 0 30000 96000 3200 100 210 2100 KAPILBASTU 69840 209520 3000 3120 9500 3045 0 0 0 0 0 0 32100 101000 3146 200 350 1750
9
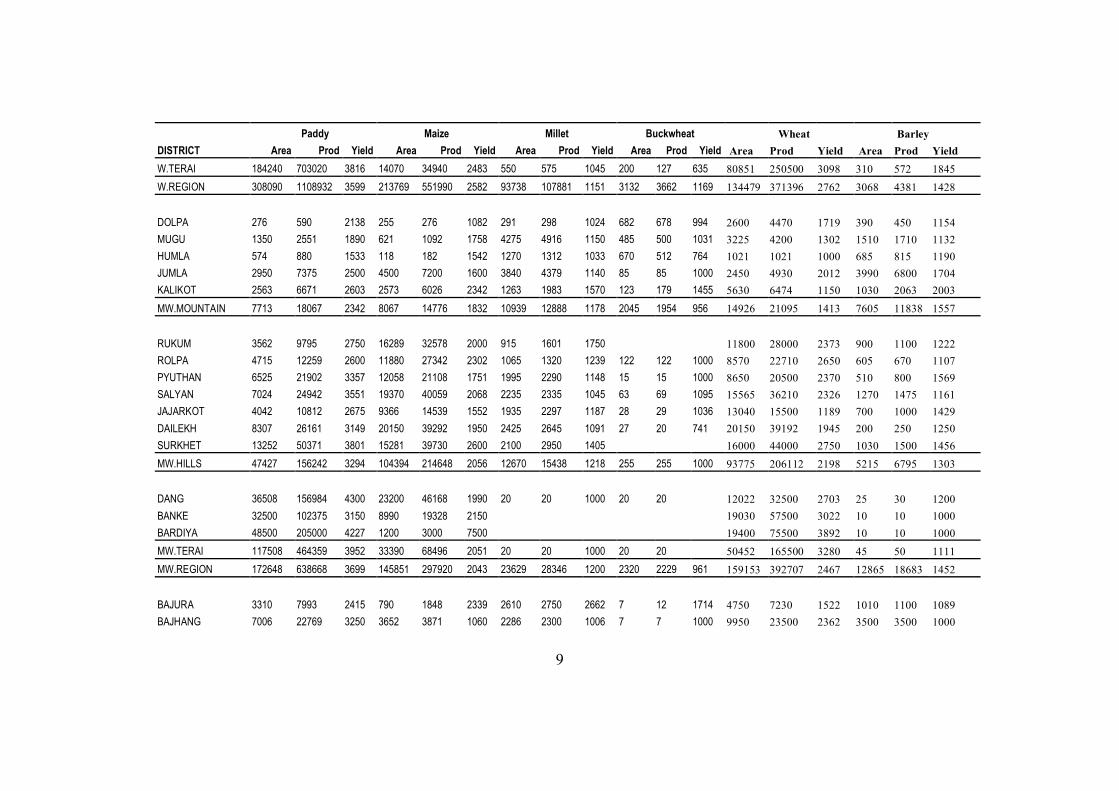
Paddy Maize Millet Buckwheat Wheat Barley DISTRICT Area Prod Yield Area Prod Yield Area Prod Yield Area Prod Yield Area Prod Yield Area Prod Yield W.TERAI 184240 703020 3816 14070 34940 2483 550 575 1045 200 127 635 80851 250500 3098 310 572 1845 W.REGION 308090 1108932 3599 213769 551990 2582 93738 107881 1151 3132 3662 1169 134479 371396 2762 3068 4381 1428
DOLPA 276 590 2138 255 276 1082 291 298 1024 682 678 994 2600 4470 1719 390 450 1154 MUGU 1350 2551 1890 621 1092 1758 4275 4916 1150 485 500 1031 3225 4200 1302 1510 1710 1132 HUMLA 574 880 1533 118 182 1542 1270 1312 1033 670 512 764 1021 1021 1000 685 815 1190 JUMLA 2950 7375 2500 4500 7200 1600 3840 4379 1140 85 85 1000 2450 4930 2012 3990 6800 1704 KALIKOT 2563 6671 2603 2573 6026 2342 1263 1983 1570 123 179 1455 5630 6474 1150 1030 2063 2003 MW.MOUNTAIN 7713 18067 2342 8067 14776 1832 10939 12888 1178 2045 1954 956 14926 21095 1413 7605 11838 1557
RUKUM 3562 9795 2750 16289 32578 2000 915 1601 1750
11800 28000 2373 900 1100 1222 ROLPA 4715 12259 2600 11880 27342 2302 1065 1320 1239 122 122 1000 8570 22710 2650 605 670 1107 PYUTHAN 6525 21902 3357 12058 21108 1751 1995 2290 1148 15 15 1000 8650 20500 2370 510 800 1569 SALYAN 7024 24942 3551 19370 40059 2068 2235 2335 1045 63 69 1095 15565 36210 2326 1270 1475 1161 JAJARKOT 4042 10812 2675 9366 14539 1552 1935 2297 1187 28 29 1036 13040 15500 1189 700 1000 1429 DAILEKH 8307 26161 3149 20150 39292 1950 2425 2645 1091 27 20 741 20150 39192 1945 200 250 1250 SURKHET 13252 50371 3801 15281 39730 2600 2100 2950 1405
16000 44000 2750 1030 1500 1456
MW.HILLS 47427 156242 3294 104394 214648 2056 12670 15438 1218 255 255 1000 93775 206112 2198 5215 6795 1303
DANG 36508 156984 4300 23200 46168 1990 20 20 1000 20 20
12022 32500 2703 25 30 1200 BANKE 32500 102375 3150 8990 19328 2150
19030 57500 3022 10 10 1000
BARDIYA 48500 205000 4227 1200 3000 7500
19400 75500 3892 10 10 1000 MW.TERAI 117508 464359 3952 33390 68496 2051 20 20 1000 20 20 50452 165500 3280 45 50 1111 MW.REGION 172648 638668 3699 145851 297920 2043 23629 28346 1200 2320 2229 961 159153 392707 2467 12865 18683 1452
BAJURA 3310 7993 2415 790 1848 2339 2610 2750 2662 7 12 1714 4750 7230 1522 1010 1100 1089 BAJHANG 7006 22769 3250 3652 3871 1060 2286 2300 1006 7 7 1000 9950 23500 2362 3500 3500 1000
10
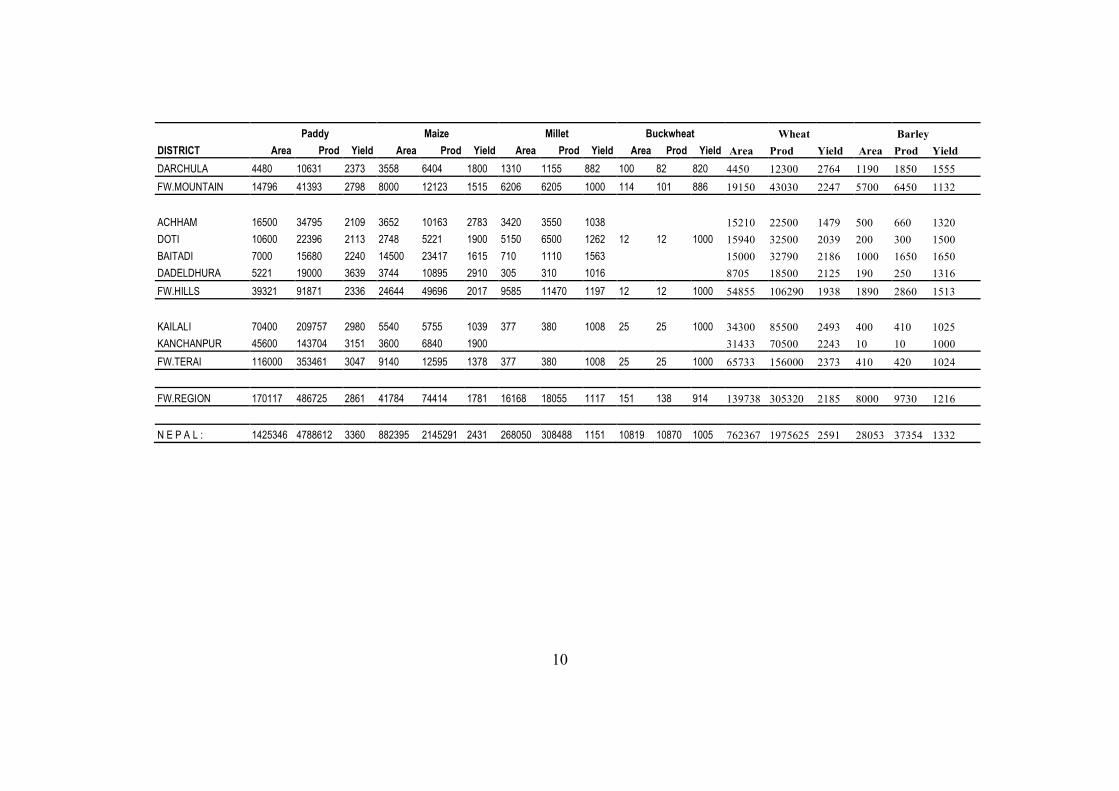
Paddy Maize Millet Buckwheat Wheat Barley DISTRICT Area Prod Yield Area Prod Yield Area Prod Yield Area Prod Yield Area Prod Yield Area Prod Yield DARCHULA 4480 10631 2373 3558 6404 1800 1310 1155 882 100 82 820 4450 12300 2764 1190 1850 1555 FW.MOUNTAIN 14796 41393 2798 8000 12123 1515 6206 6205 1000 114 101 886 19150 43030 2247 5700 6450 1132
ACHHAM 16500 34795 2109 3652 10163 2783 3420 3550 1038
15210 22500 1479 500 660 1320 DOTI 10600 22396 2113 2748 5221 1900 5150 6500 1262 12 12 1000 15940 32500 2039 200 300 1500 BAITADI 7000 15680 2240 14500 23417 1615 710 1110 1563
15000 32790 2186 1000 1650 1650
DADELDHURA 5221 19000 3639 3744 10895 2910 305 310 1016
8705 18500 2125 190 250 1316 FW.HILLS 39321 91871 2336 24644 49696 2017 9585 11470 1197 12 12 1000 54855 106290 1938 1890 2860 1513
KAILALI 70400 209757 2980 5540 5755 1039 377 380 1008 25 25 1000 34300 85500 2493 400 410 1025 KANCHANPUR 45600 143704 3151 3600 6840 1900
31433 70500 2243 10 10 1000
FW.TERAI 116000 353461 3047 9140 12595 1378 377 380 1008 25 25 1000 65733 156000 2373 410 420 1024
FW.REGION 170117 486725 2861 41784 74414 1781 16168 18055 1117 151 138 914 139738 305320 2185 8000 9730 1216
N E P A L : 1425346 4788612 3360 882395 2145291 2431 268050 308488 1151 10819 10870 1005 762367 1975625 2591 28053 37354 1332
11
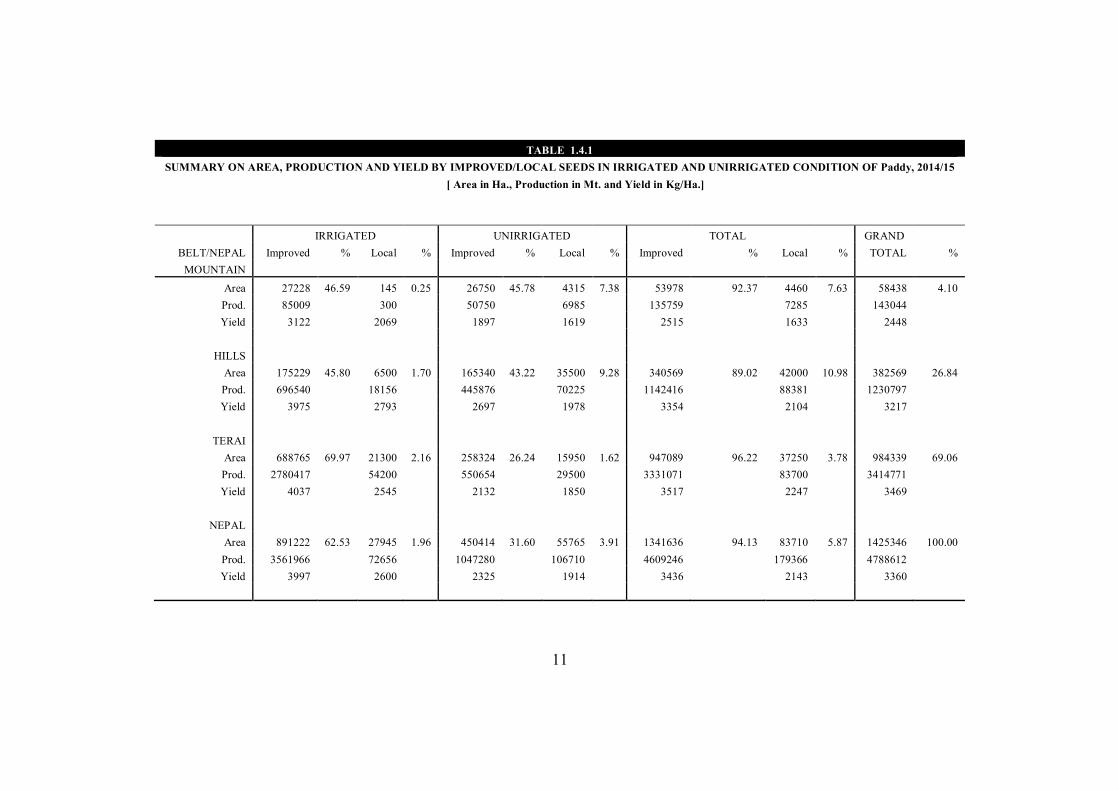
TABLE 1.4.1
SUMMARY ON AREA, PRODUCTION AND YIELD BY IMPROVED/LOCAL SEEDS IN IRRIGATED AND UNIRRIGATED CONDITION OF Paddy, 2014/15 [ Area in Ha., Production in Mt. and Yield in Kg/Ha.]
IRRIGATED UNIRRIGATED TOTAL GRAND
BELT/NEPAL Improved % Local % Improved % Local % Improved % Local % TOTAL % MOUNTAIN
Area 27228 46.59 145 0.25 26750 45.78 4315 7.38 53978 92.37 4460 7.63 58438 4.10 Prod. 85009 300 50750 6985 135759 7285 143044 Yield 3122 2069 1897 1619 2515 1633 2448
HILLS
Area 175229 45.80 6500 1.70 165340 43.22 35500 9.28 340569 89.02 42000 10.98 382569 26.84 Prod. 696540 18156 445876 70225 1142416 88381 1230797 Yield 3975 2793 2697 1978 3354 2104 3217
TERAI
Area 688765 69.97 21300 2.16 258324 26.24 15950 1.62 947089 96.22 37250 3.78 984339 69.06 Prod. 2780417 54200 550654 29500 3331071 83700 3414771 Yield 4037 2545 2132 1850 3517 2247 3469
NEPAL
Area 891222 62.53 27945 1.96 450414 31.60 55765 3.91 1341636 94.13 83710 5.87 1425346 100.00 Prod. 3561966 72656 1047280 106710 4609246 179366 4788612 Yield 3997 2600 2325 1914 3436 2143 3360
12
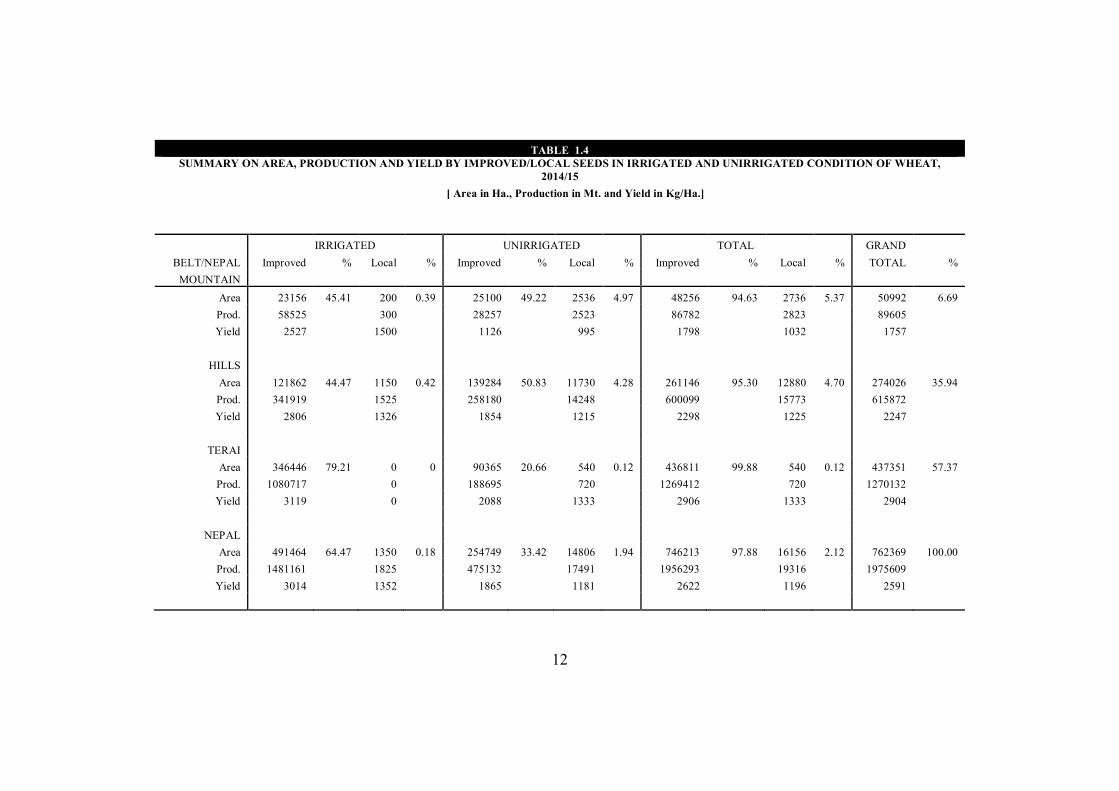
TABLE 1.4
SUMMARY ON AREA, PRODUCTION AND YIELD BY IMPROVED/LOCAL SEEDS IN IRRIGATED AND UNIRRIGATED CONDITION OF WHEAT, 2014/15
[ Area in Ha., Production in Mt. and Yield in Kg/Ha.]
IRRIGATED UNIRRIGATED TOTAL GRAND
BELT/NEPAL Improved % Local % Improved % Local % Improved % Local % TOTAL % MOUNTAIN
Area 23156 45.41 200 0.39 25100 49.22 2536 4.97 48256 94.63 2736 5.37 50992 6.69 Prod. 58525 300 28257 2523 86782 2823 89605 Yield 2527 1500 1126 995 1798 1032 1757
HILLS
Area 121862 44.47 1150 0.42 139284 50.83 11730 4.28 261146 95.30 12880 4.70 274026 35.94 Prod. 341919 1525 258180 14248 600099 15773 615872 Yield 2806 1326 1854 1215 2298 1225 2247
TERAI
Area 346446 79.21 0 0 90365 20.66 540 0.12 436811 99.88 540 0.12 437351 57.37 Prod. 1080717 0 188695 720 1269412 720 1270132 Yield 3119 0 2088 1333 2906 1333 2904
NEPAL
Area 491464 64.47 1350 0.18 254749 33.42 14806 1.94 746213 97.88 16156 2.12 762369 100.00 Prod. 1481161 1825 475132 17491 1956293 19316 1975609 Yield 3014 1352 1865 1181 2622 1196 2591
13
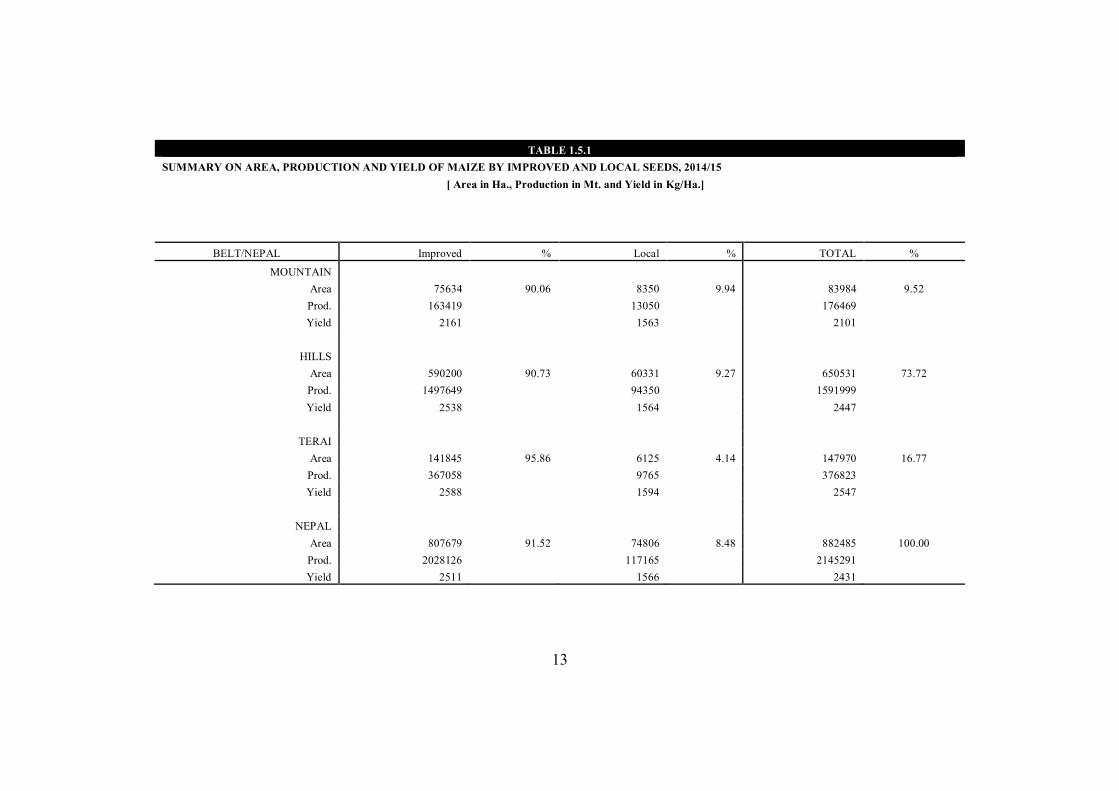
TABLE 1.5.1
SUMMARY ON AREA, PRODUCTION AND YIELD OF MAIZE BY IMPROVED AND LOCAL SEEDS, 2014/15 [ Area in Ha., Production in Mt. and Yield in Kg/Ha.]
BELT/NEPAL Improved % Local % TOTAL %
MOUNTAIN Area 75634 90.06 8350 9.94 83984 9.52 Prod. 163419 13050 176469 Yield 2161 1563 2101
HILLS
Area 590200 90.73 60331 9.27 650531 73.72 Prod. 1497649 94350 1591999 Yield 2538 1564 2447
TERAI
Area 141845 95.86 6125 4.14 147970 16.77 Prod. 367058 9765 376823 Yield 2588 1594 2547
NEPAL
Area 807679 91.52 74806 8.48 882485 100.00 Prod. 2028126 117165 2145291 Yield 2511 1566 2431
14
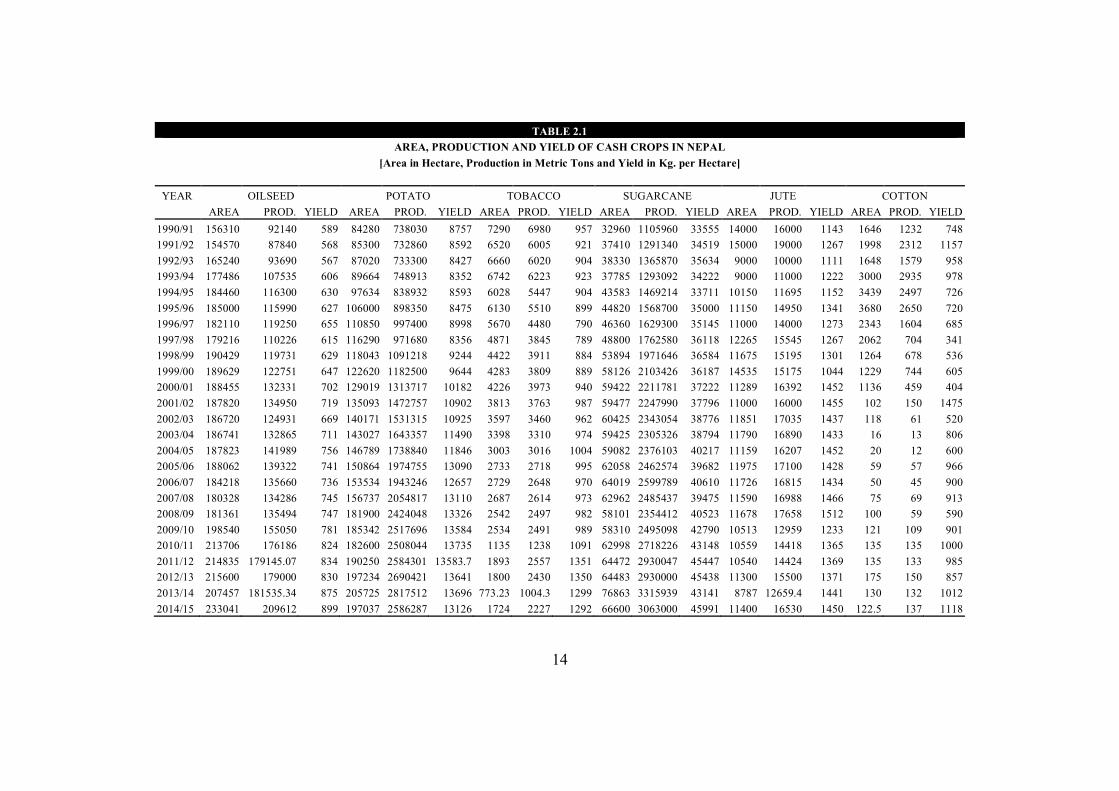
TABLE 2.1 AREA, PRODUCTION AND YIELD OF CASH CROPS IN NEPAL
[Area in Hectare, Production in Metric Tons and Yield in Kg. per Hectare]
YEAR OILSEED POTATO TOBACCO SUGARCANE JUTE COTTON AREA PROD. YIELD AREA PROD. YIELD AREA PROD. YIELD AREA PROD. YIELD AREA PROD. YIELD AREA PROD. YIELD 1990/91 156310 92140 589 84280 738030 8757 7290 6980 957 32960 1105960 33555 14000 16000 1143 1646 1232 748 1991/92 154570 87840 568 85300 732860 8592 6520 6005 921 37410 1291340 34519 15000 19000 1267 1998 2312 1157 1992/93 165240 93690 567 87020 733300 8427 6660 6020 904 38330 1365870 35634 9000 10000 1111 1648 1579 958 1993/94 177486 107535 606 89664 748913 8352 6742 6223 923 37785 1293092 34222 9000 11000 1222 3000 2935 978 1994/95 184460 116300 630 97634 838932 8593 6028 5447 904 43583 1469214 33711 10150 11695 1152 3439 2497 726 1995/96 185000 115990 627 106000 898350 8475 6130 5510 899 44820 1568700 35000 11150 14950 1341 3680 2650 720 1996/97 182110 119250 655 110850 997400 8998 5670 4480 790 46360 1629300 35145 11000 14000 1273 2343 1604 685 1997/98 179216 110226 615 116290 971680 8356 4871 3845 789 48800 1762580 36118 12265 15545 1267 2062 704 341 1998/99 190429 119731 629 118043 1091218 9244 4422 3911 884 53894 1971646 36584 11675 15195 1301 1264 678 536 1999/00 189629 122751 647 122620 1182500 9644 4283 3809 889 58126 2103426 36187 14535 15175 1044 1229 744 605 2000/01 188455 132331 702 129019 1313717 10182 4226 3973 940 59422 2211781 37222 11289 16392 1452 1136 459 404 2001/02 187820 134950 719 135093 1472757 10902 3813 3763 987 59477 2247990 37796 11000 16000 1455 102 150 1475 2002/03 186720 124931 669 140171 1531315 10925 3597 3460 962 60425 2343054 38776 11851 17035 1437 118 61 520 2003/04 186741 132865 711 143027 1643357 11490 3398 3310 974 59425 2305326 38794 11790 16890 1433 16 13 806 2004/05 187823 141989 756 146789 1738840 11846 3003 3016 1004 59082 2376103 40217 11159 16207 1452 20 12 600 2005/06 188062 139322 741 150864 1974755 13090 2733 2718 995 62058 2462574 39682 11975 17100 1428 59 57 966 2006/07 184218 135660 736 153534 1943246 12657 2729 2648 970 64019 2599789 40610 11726 16815 1434 50 45 900 2007/08 180328 134286 745 156737 2054817 13110 2687 2614 973 62962 2485437 39475 11590 16988 1466 75 69 913 2008/09 181361 135494 747 181900 2424048 13326 2542 2497 982 58101 2354412 40523 11678 17658 1512 100 59 590 2009/10 198540 155050 781 185342 2517696 13584 2534 2491 989 58310 2495098 42790 10513 12959 1233 121 109 901 2010/11 213706 176186 824 182600 2508044 13735 1135 1238 1091 62998 2718226 43148 10559 14418 1365 135 135 1000 2011/12 214835 179145.07 834 190250 2584301 13583.7 1893 2557 1351 64472 2930047 45447 10540 14424 1369 135 133 985 2012/13 215600 179000 830 197234 2690421 13641 1800 2430 1350 64483 2930000 45438 11300 15500 1371 175 150 857 2013/14 207457 181535.34 875 205725 2817512 13696 773.23 1004.3 1299 76863 3315939 43141 8787 12659.4 1441 130 132 1012 2014/15 233041 209612 899 197037 2586287 13126 1724 2227 1292 66600 3063000 45991 11400 16530 1450 122.5 137 1118
15
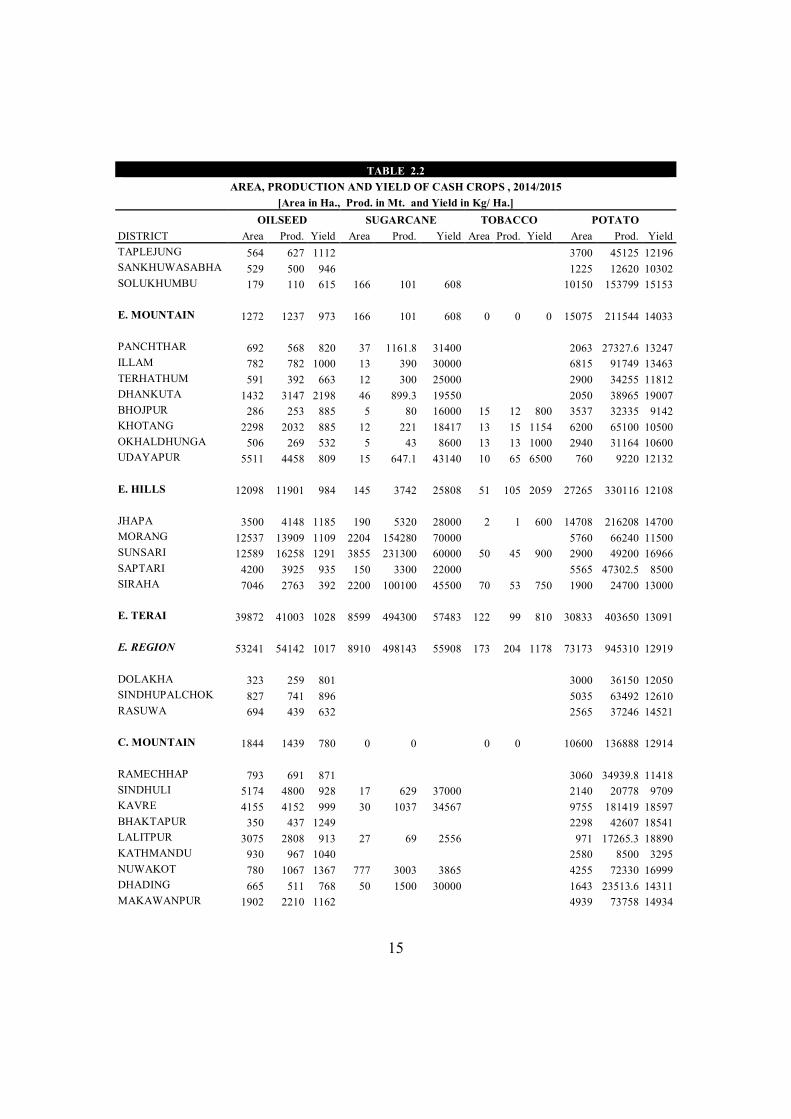
TABLE 2.2 AREA, PRODUCTION AND YIELD OF CASH CROPS , 2014/2015
[Area in Ha., Prod. in Mt. and Yield in Kg/ Ha.] OILSEED SUGARCANE TOBACCO POTATO
DISTRICT Area Prod. Yield Area Prod. Yield Area Prod. Yield Area Prod. Yield TAPLEJUNG 564 627 1112 3700 45125 12196 SANKHUWASABHA 529 500 946 1225 12620 10302 SOLUKHUMBU 179 110 615 166 101 608 10150 153799 15153 E. MOUNTAIN 1272 1237 973 166 101 608 0 0 0 15075 211544 14033 PANCHTHAR 692 568 820 37 1161.8 31400 2063 27327.6 13247 ILLAM 782 782 1000 13 390 30000 6815 91749 13463 TERHATHUM 591 392 663 12 300 25000 2900 34255 11812 DHANKUTA 1432 3147 2198 46 899.3 19550 2050 38965 19007 BHOJPUR 286 253 885 5 80 16000 15 12 800 3537 32335 9142 KHOTANG 2298 2032 885 12 221 18417 13 15 1154 6200 65100 10500 OKHALDHUNGA 506 269 532 5 43 8600 13 13 1000 2940 31164 10600 UDAYAPUR 5511 4458 809 15 647.1 43140 10 65 6500 760 9220 12132 E. HILLS 12098 11901 984 145 3742 25808 51 105 2059 27265 330116 12108 JHAPA 3500 4148 1185 190 5320 28000 2 1 600 14708 216208 14700 MORANG 12537 13909 1109 2204 154280 70000 5760 66240 11500 SUNSARI 12589 16258 1291 3855 231300 60000 50 45 900 2900 49200 16966 SAPTARI 4200 3925 935 150 3300 22000 5565 47302.5 8500 SIRAHA 7046 2763 392 2200 100100 45500 70 53 750 1900 24700 13000 E. TERAI 39872 41003 1028 8599 494300 57483 122 99 810 30833 403650 13091 E. REGION 53241 54142 1017 8910 498143 55908 173 204 1178 73173 945310 12919 DOLAKHA 323 259 801 3000 36150 12050 SINDHUPALCHOK 827 741 896 5035 63492 12610 RASUWA 694 439 632 2565 37246 14521 C. MOUNTAIN 1844 1439 780 0 0 0 0 10600 136888 12914 RAMECHHAP 793 691 871 3060 34939.8 11418 SINDHULI 5174 4800 928 17 629 37000 2140 20778 9709 KAVRE 4155 4152 999 30 1037 34567 9755 181419 18597 BHAKTAPUR 350 437 1249 2298 42607 18541 LALITPUR 3075 2808 913 27 69 2556 971 17265.3 18890 KATHMANDU 930 967 1040 2580 8500 3295 NUWAKOT 780 1067 1367 777 3003 3865 4255 72330 16999 DHADING 665 511 768 50 1500 30000 1643 23513.6 14311 MAKAWANPUR 1902 2210 1162 4939 73758 14934
16
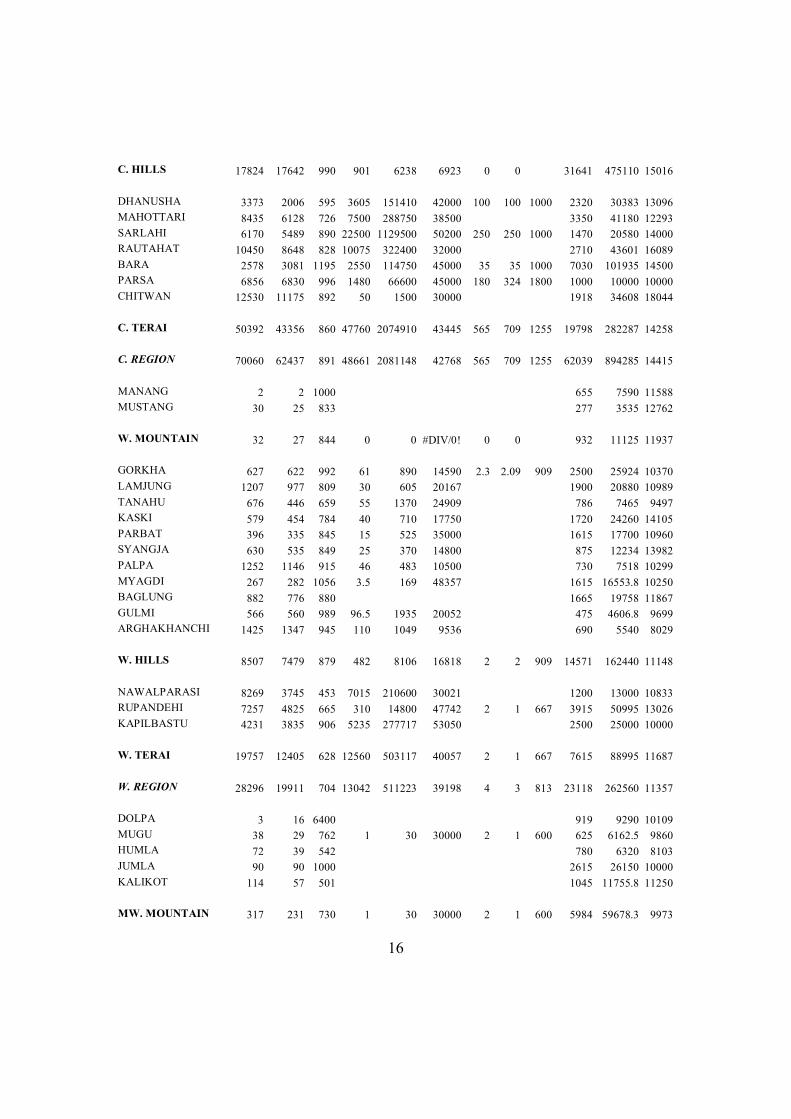
C. HILLS 17824 17642 990 901 6238 6923 0 0 31641 475110 15016 DHANUSHA 3373 2006 595 3605 151410 42000 100 100 1000 2320 30383 13096 MAHOTTARI 8435 6128 726 7500 288750 38500 3350 41180 12293 SARLAHI 6170 5489 890 22500 1129500 50200 250 250 1000 1470 20580 14000 RAUTAHAT 10450 8648 828 10075 322400 32000 2710 43601 16089 BARA 2578 3081 1195 2550 114750 45000 35 35 1000 7030 101935 14500 PARSA 6856 6830 996 1480 66600 45000 180 324 1800 1000 10000 10000 CHITWAN 12530 11175 892 50 1500 30000 1918 34608 18044 C. TERAI 50392 43356 860 47760 2074910 43445 565 709 1255 19798 282287 14258 C. REGION 70060 62437 891 48661 2081148 42768 565 709 1255 62039 894285 14415 MANANG 2 2 1000 655 7590 11588 MUSTANG 30 25 833 277 3535 12762 W. MOUNTAIN 32 27 844 0 0 #DIV/0! 0 0 932 11125 11937 GORKHA 627 622 992 61 890 14590 2.3 2.09 909 2500 25924 10370 LAMJUNG 1207 977 809 30 605 20167 1900 20880 10989 TANAHU 676 446 659 55 1370 24909 786 7465 9497 KASKI 579 454 784 40 710 17750 1720 24260 14105 PARBAT 396 335 845 15 525 35000 1615 17700 10960 SYANGJA 630 535 849 25 370 14800 875 12234 13982 PALPA 1252 1146 915 46 483 10500 730 7518 10299 MYAGDI 267 282 1056 3.5 169 48357 1615 16553.8 10250 BAGLUNG 882 776 880 1665 19758 11867 GULMI 566 560 989 96.5 1935 20052 475 4606.8 9699 ARGHAKHANCHI 1425 1347 945 110 1049 9536 690 5540 8029 W. HILLS 8507 7479 879 482 8106 16818 2 2 909 14571 162440 11148 NAWALPARASI 8269 3745 453 7015 210600 30021 1200 13000 10833 RUPANDEHI 7257 4825 665 310 14800 47742 2 1 667 3915 50995 13026 KAPILBASTU 4231 3835 906 5235 277717 53050 2500 25000 10000 W. TERAI 19757 12405 628 12560 503117 40057 2 1 667 7615 88995 11687 W. REGION 28296 19911 704 13042 511223 39198 4 3 813 23118 262560 11357 DOLPA 3 16 6400 919 9290 10109 MUGU 38 29 762 1 30 30000 2 1 600 625 6162.5 9860 HUMLA 72 39 542 780 6320 8103 JUMLA 90 90 1000 2615 26150 10000 KALIKOT 114 57 501 1045 11755.8 11250 MW. MOUNTAIN 317 231 730 1 30 30000 2 1 600 5984 59678.3 9973
17
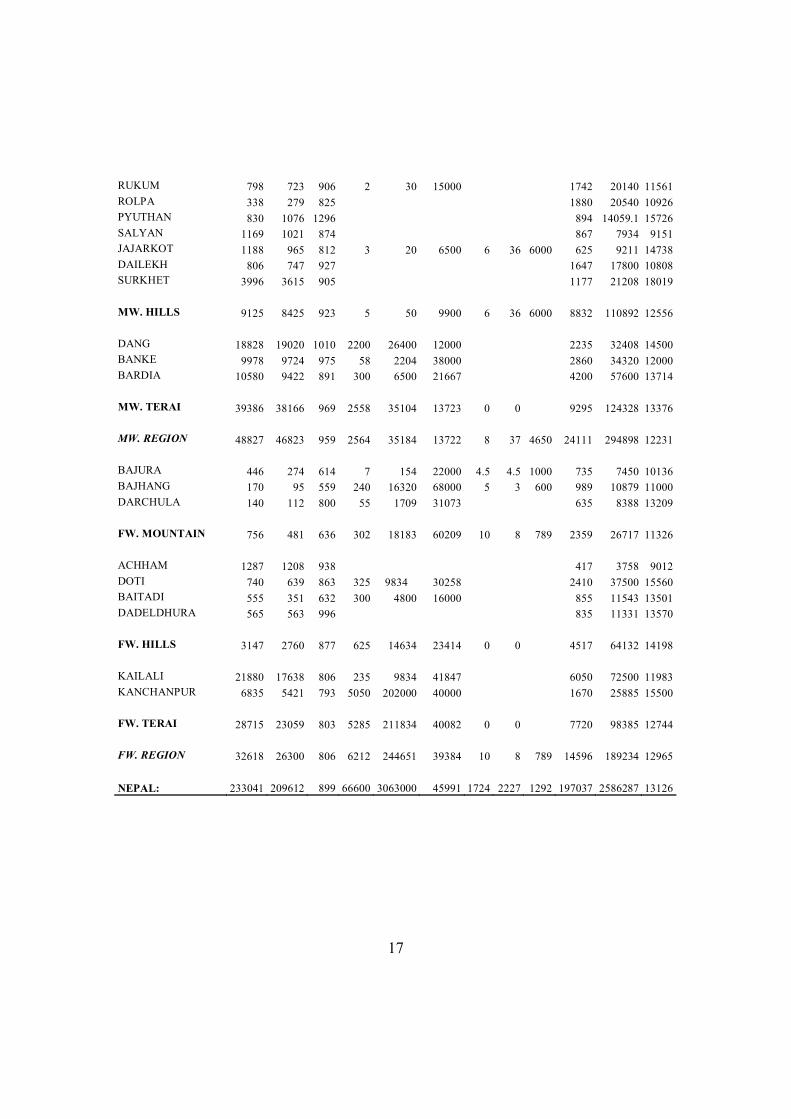
RUKUM 798 723 906 2 30 15000 1742 20140 11561 ROLPA 338 279 825 1880 20540 10926 PYUTHAN 830 1076 1296 894 14059.1 15726 SALYAN 1169 1021 874 867 7934 9151 JAJARKOT 1188 965 812 3 20 6500 6 36 6000 625 9211 14738 DAILEKH 806 747 927 1647 17800 10808 SURKHET 3996 3615 905 1177 21208 18019 MW. HILLS 9125 8425 923 5 50 9900 6 36 6000 8832 110892 12556 DANG 18828 19020 1010 2200 26400 12000 2235 32408 14500 BANKE 9978 9724 975 58 2204 38000 2860 34320 12000 BARDIA 10580 9422 891 300 6500 21667 4200 57600 13714 MW. TERAI 39386 38166 969 2558 35104 13723 0 0 9295 124328 13376 MW. REGION 48827 46823 959 2564 35184 13722 8 37 4650 24111 294898 12231 BAJURA 446 274 614 7 154 22000 4.5 4.5 1000 735 7450 10136 BAJHANG 170 95 559 240 16320 68000 5 3 600 989 10879 11000 DARCHULA 140 112 800 55 1709 31073 635 8388 13209 FW. MOUNTAIN 756 481 636 302 18183 60209 10 8 789 2359 26717 11326 ACHHAM 1287 1208 938 417 3758 9012 DOTI 740 639 863 325 9834 30258 2410 37500 15560 BAITADI 555 351 632 300 4800 16000 855 11543 13501 DADELDHURA 565 563 996 835 11331 13570 FW. HILLS 3147 2760 877 625 14634 23414 0 0 4517 64132 14198 KAILALI 21880 17638 806 235 9834 41847 6050 72500 11983 KANCHANPUR 6835 5421 793 5050 202000 40000 1670 25885 15500 FW. TERAI 28715 23059 803 5285 211834 40082 0 0 7720 98385 12744 FW. REGION 32618 26300 806 6212 244651 39384 10 8 789 14596 189234 12965 NEPAL: 233041 209612 899 66600 3063000 45991 1724 2227 1292 197037 2586287 13126
18
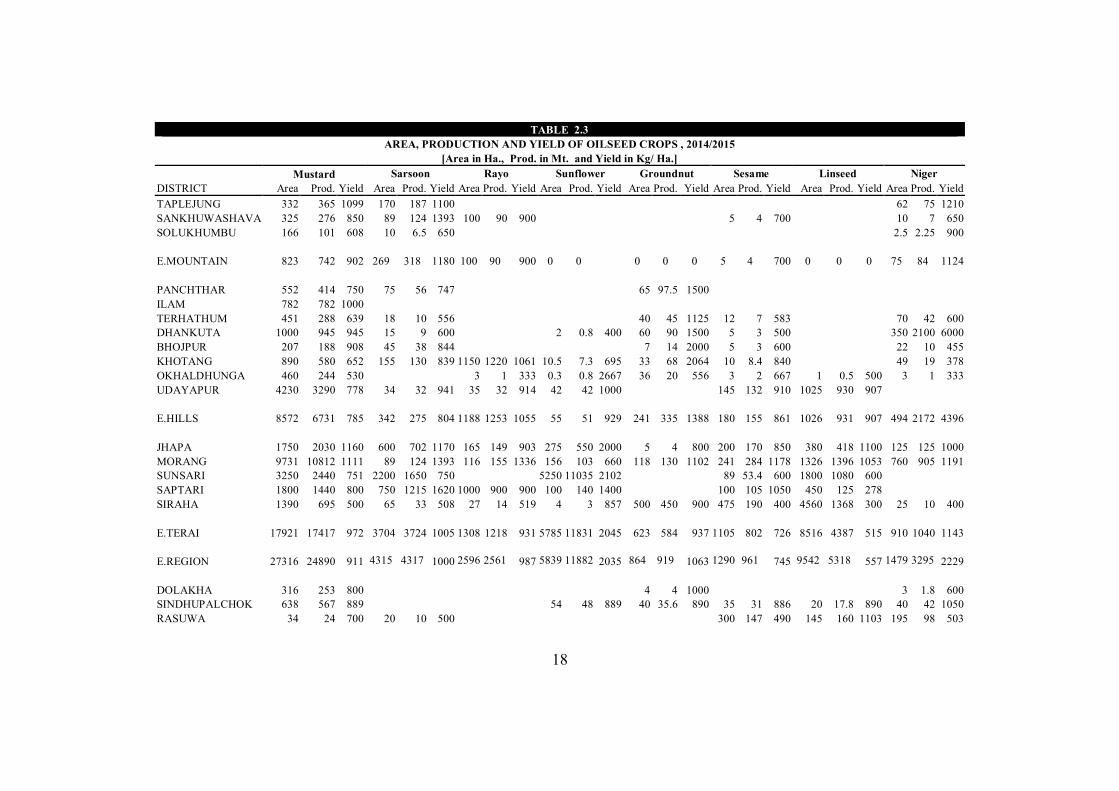
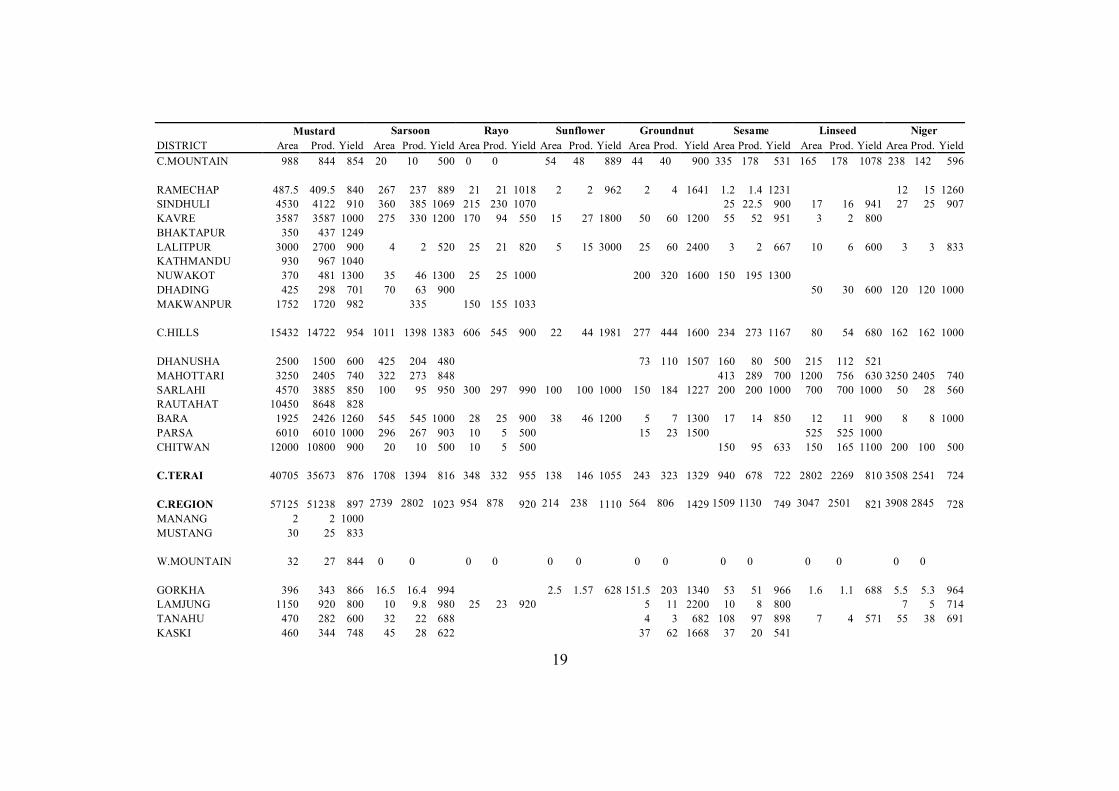
TABLE 2.3 AREA, PRODUCTION AND YIELD OF OILSEED CROPS , 2014/2015
[Area in Ha., Prod. in Mt. and Yield in Kg/ Ha.] Mustard Sarsoon Rayo Sunflower Groundnut Sesame Linseed Niger
DISTRICT Area Prod. Yield Area Prod. Yield Area Prod. Yield Area Prod. Yield Area Prod. Yield Area Prod. Yield Area Prod. Yield Area Prod. Yield TAPLEJUNG 332 365 1099 170 187 1100 62 75 1210 SANKHUWASHAVA 325 276 850 89 124 1393 100 90 900 5 4 700 10 7 650 SOLUKHUMBU 166 101 608 10 6.5 650 2.5 2.25 900
E.MOUNTAIN 823 742 902 269 318 1180 100 90 900 0 0 0 0 0 5 4 700 0 0 0 75 84 1124
PANCHTHAR 552 414 750 75 56 747 65 97.5 1500 ILAM 782 782 1000 TERHATHUM 451 288 639 18 10 556 40 45 1125 12 7 583 70 42 600 DHANKUTA 1000 945 945 15 9 600 2 0.8 400 60 90 1500 5 3 500 350 2100 6000 BHOJPUR 207 188 908 45 38 844 7 14 2000 5 3 600 22 10 455 KHOTANG 890 580 652 155 130 839 1150 1220 1061 10.5 7.3 695 33 68 2064 10 8.4 840 49 19 378 OKHALDHUNGA 460 244 530 3 1 333 0.3 0.8 2667 36 20 556 3 2 667 1 0.5 500 3 1 333 UDAYAPUR 4230 3290 778 34 32 941 35 32 914 42 42 1000 145 132 910 1025 930 907
E.HILLS 8572 6731 785 342 275 804 1188 1253 1055 55 51 929 241 335 1388 180 155 861 1026 931 907 494 2172 4396
JHAPA 1750 2030 1160 600 702 1170 165 149 903 275 550 2000 5 4 800 200 170 850 380 418 1100 125 125 1000 MORANG 9731 10812 1111 89 124 1393 116 155 1336 156 103 660 118 130 1102 241 284 1178 1326 1396 1053 760 905 1191 SUNSARI 3250 2440 751 2200 1650 750 5250 11035 2102 89 53.4 600 1800 1080 600 SAPTARI 1800 1440 800 750 1215 1620 1000 900 900 100 140 1400 100 105 1050 450 125 278 SIRAHA 1390 695 500 65 33 508 27 14 519 4 3 857 500 450 900 475 190 400 4560 1368 300 25 10 400
E.TERAI 17921 17417 972 3704 3724 1005 1308 1218 931 5785 11831 2045 623 584 937 1105 802 726 8516 4387 515 910 1040 1143
E.REGION 27316 24890 911 4315 4317 1000 2596 2561 987 5839 11882 2035 864 919 1063 1290 961 745 9542 5318 557 1479 3295 2229
DOLAKHA 316 253 800 4 4 1000 3 1.8 600 SINDHUPALCHOK 638 567 889 54 48 889 40 35.6 890 35 31 886 20 17.8 890 40 42 1050 RASUWA 34 24 700 20 10 500 300 147 490 145 160 1103 195 98 503
19
Mustard Sarsoon Rayo Sunflower Groundnut Sesame Linseed Niger DISTRICT Area Prod. Yield Area Prod. Yield Area Prod. Yield Area Prod. Yield Area Prod. Yield Area Prod. Yield Area Prod. Yield Area Prod. Yield C.MOUNTAIN 988 844 854 20 10 500 0 0 54 48 889 44 40 900 335 178 531 165 178 1078 238 142 596
RAMECHAP 487.5 409.5 840 267 237 889 21 21 1018 2 2 962 2 4 1641 1.2 1.4 1231 12 15 1260 SINDHULI 4530 4122 910 360 385 1069 215 230 1070 25 22.5 900 17 16 941 27 25 907 KAVRE 3587 3587 1000 275 330 1200 170 94 550 15 27 1800 50 60 1200 55 52 951 3 2 800 BHAKTAPUR 350 437 1249 LALITPUR 3000 2700 900 4 2 520 25 21 820 5 15 3000 25 60 2400 3 2 667 10 6 600 3 3 833 KATHMANDU 930 967 1040 NUWAKOT 370 481 1300 35 46 1300 25 25 1000 200 320 1600 150 195 1300 DHADING 425 298 701 70 63 900 50 30 600 120 120 1000 MAKWANPUR 1752 1720 982 335 150 155 1033
C.HILLS 15432 14722 954 1011 1398 1383 606 545 900 22 44 1981 277 444 1600 234 273 1167 80 54 680 162 162 1000
DHANUSHA 2500 1500 600 425 204 480 73 110 1507 160 80 500 215 112 521 MAHOTTARI 3250 2405 740 322 273 848 413 289 700 1200 756 630 3250 2405 740 SARLAHI 4570 3885 850 100 95 950 300 297 990 100 100 1000 150 184 1227 200 200 1000 700 700 1000 50 28 560 RAUTAHAT 10450 8648 828 BARA 1925 2426 1260 545 545 1000 28 25 900 38 46 1200 5 7 1300 17 14 850 12 11 900 8 8 1000 PARSA 6010 6010 1000 296 267 903 10 5 500 15 23 1500 525 525 1000 CHITWAN 12000 10800 900 20 10 500 10 5 500 150 95 633 150 165 1100 200 100 500
C.TERAI 40705 35673 876 1708 1394 816 348 332 955 138 146 1055 243 323 1329 940 678 722 2802 2269 810 3508 2541 724
C.REGION 57125 51238 897 2739 2802 1023 954 878 920 214 238 1110 564 806 1429 1509 1130 749 3047 2501 821 3908 2845 728 MANANG 2 2 1000 MUSTANG 30 25 833
W.MOUNTAIN 32 27 844 0 0 0 0 0 0 0 0 0 0 0 0 0 0
GORKHA 396 343 866 16.5 16.4 994 2.5 1.57 628 151.5 203 1340 53 51 966 1.6 1.1 688 5.5 5.3 964 LAMJUNG 1150 920 800 10 9.8 980 25 23 920 5 11 2200 10 8 800 7 5 714 TANAHU 470 282 600 32 22 688 4 3 682 108 97 898 7 4 571 55 38 691 KASKI 460 344 748 45 28 622 37 62 1668 37 20 541
20
Mustard Sarsoon Rayo Sunflower Groundnut Sesame Linseed Niger DISTRICT Area Prod. Yield Area Prod. Yield Area Prod. Yield Area Prod. Yield Area Prod. Yield Area Prod. Yield Area Prod. Yield Area Prod. Yield PARBAT 350 310 886 9 9.2 1000 8.9 7.1 798 9.4 3 319 9 2.5 266 9.5 3.2 337 SYANGJA 275 202 735 20 11 550 300 290 967 3 3 1000 19 18 947 13 11 846 PALPA 1138 1049 922 105 90 857 2 2 800 5 4 780 2 2 825 MYAGDI 244 254 1041 5 5 979 6 4 649 12 19 1600 BAGLUNG 882 776 880 GULMI 400 406 1015 140 130 929 2 0.4 200 5 4.5 900 12 13 1083 7 6 857 ARGHAKHANCHI 1100 1049 954 325 298 917
W.HILLS 6865 5935 865 708 619 875 331 317 957 3 2 628 226 310 1373 246 206 834 45 33 739 84 58 685
NAWALPARASI 3797 1785 470 2655 1195 450 98 39 398 3 3.6 1200 94 94 1000 100 50 500 1515 576 380 7 2.8 400 RUPANDEHI 6140 3684 600 155 200 1290 300 380 1267 90 140 1556 32 36 1125 540 385 713 KAPILBASTU 2625 2363 900 1315 1056 803 85 89 1047 26 52 2000 180 275 1528
W.TERAI 12562 7832 623 4125 2451 594 98 39 398 388 473 1218 210 286 1362 132 86 652 2235 1236 553 7 3 400
W.REGION 19459 13794 709 4833 3070 635 429 356 830 391 474 1214 436 596 1368 378 292 771 2280 1269 557 91 60 663 DOLPA 2 1 500 0.5 15 30000 MUGU 25 18 750 3 3 800 9 6 751 2 2 900 HUMLA 63 30 476 9 9 1000 JUMLA 90 90 1000 KALIKOT 76 23 300 3 2 500 5 5 1000 22 24 1100 8 4 455
MW.MOUNTAIN 256 162 635 3 2 500 8 8 921 0 0 31 46 1470 10 5 544 0 0 9 9 1000
RUKUM 596 536 899 170 136 800 16 42 2600 16 10 600 ROLPA 307 250 814 23 23 1000 8 6 750 PYUTHAN 720 946 1314 45 40 889 50 80 1600 3 1 520 11 7 607 2 2 1013 SALYAN 810 729 900 18 15 844 6 9 1500 216 168 778 60 48 800 56 49 875 3 3 1007 JAJARKOT 1000 800 800 110 70 636 46 55 1196 32 40 1250 DAILEKH 721 632 877 56 96 1714 25 12 480 4 7 1750 SURKHET 3740 3361 899 57 97 1702 88 46 523 111 111 1000
MW.HILLS 7894 7254 919 343 261 762 0 0 6 9 1500 464 560 1208 224 157 702 182 174 954 13 11 843
21
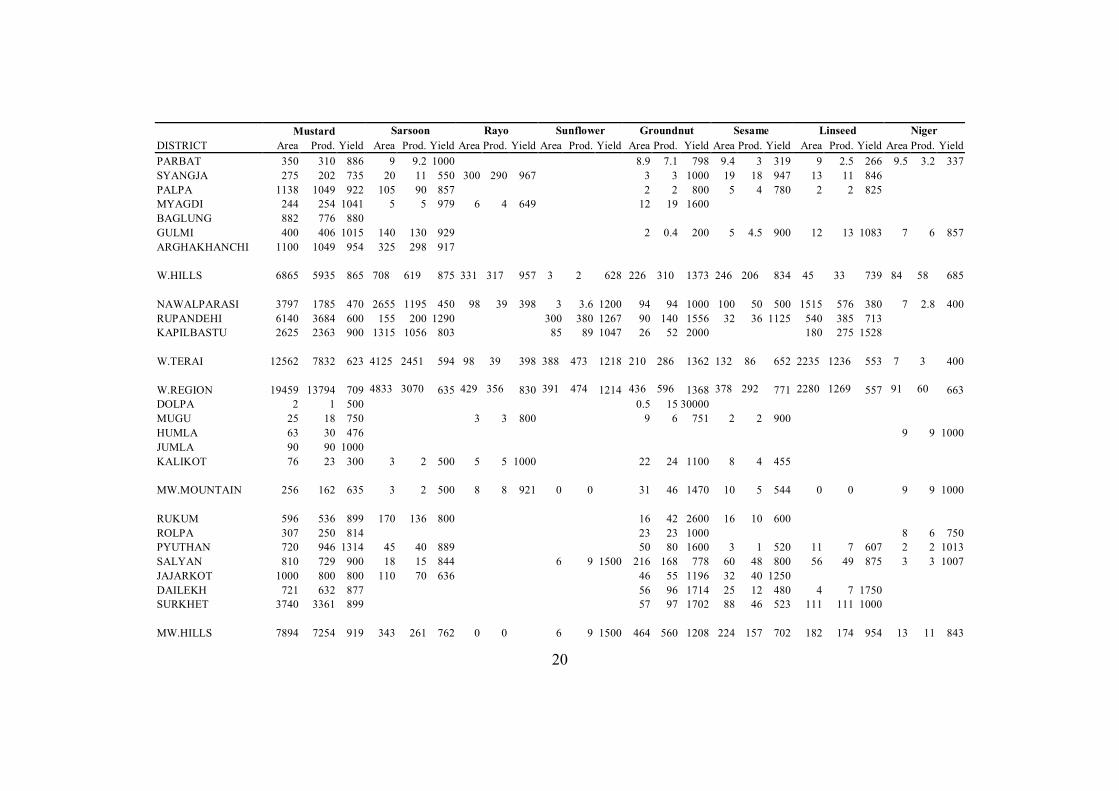
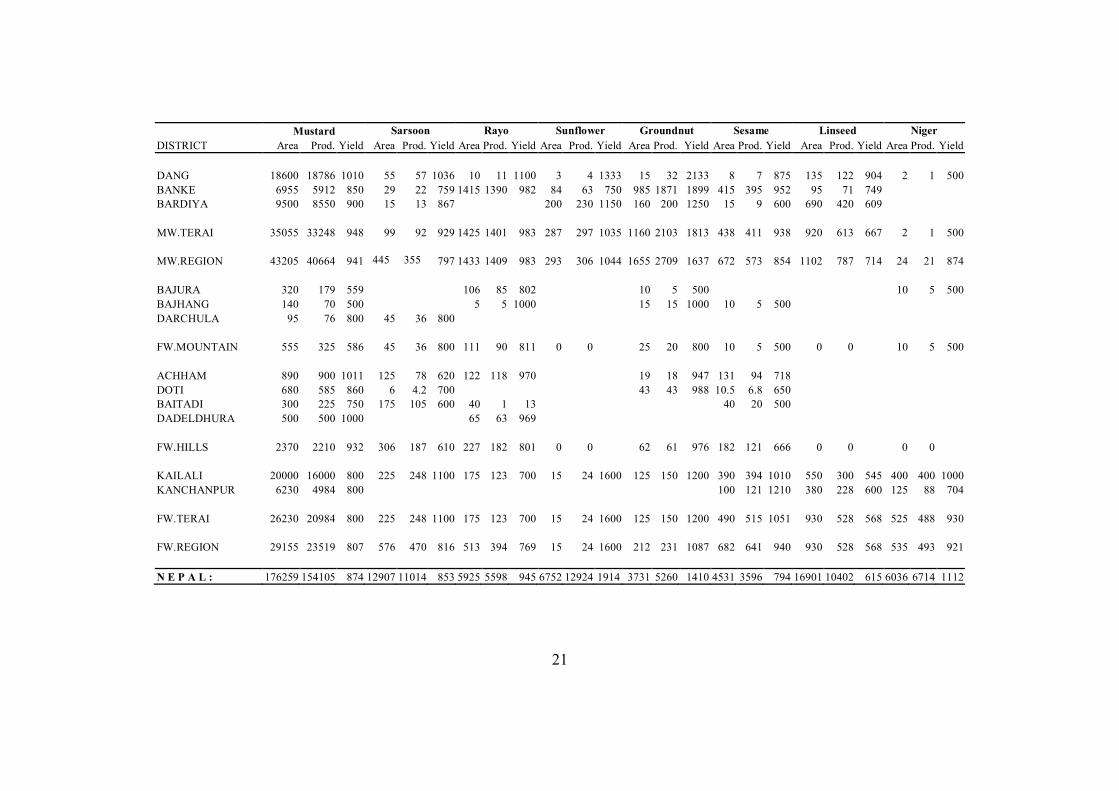
Mustard Sarsoon Rayo Sunflower Groundnut Sesame Linseed Niger DISTRICT Area Prod. Yield Area Prod. Yield Area Prod. Yield Area Prod. Yield Area Prod. Yield Area Prod. Yield Area Prod. Yield Area Prod. Yield
DANG 18600 18786 1010 55 57 1036 10 11 1100 3 4 1333 15 32 2133 8 7 875 135 122 904 2 1 500 BANKE 6955 5912 850 29 22 759 1415 1390 982 84 63 750 985 1871 1899 415 395 952 95 71 749 BARDIYA 9500 8550 900 15 13 867 200 230 1150 160 200 1250 15 9 600 690 420 609
MW.TERAI 35055 33248 948 99 92 929 1425 1401 983 287 297 1035 1160 2103 1813 438 411 938 920 613 667 2 1 500
MW.REGION 43205 40664 941 445 355 797 1433 1409 983 293 306 1044 1655 2709 1637 672 573 854 1102 787 714 24 21 874
BAJURA 320 179 559 106 85 802 10 5 500 10 5 500 BAJHANG 140 70 500 5 5 1000 15 15 1000 10 5 500 DARCHULA 95 76 800 45 36 800
FW.MOUNTAIN 555 325 586 45 36 800 111 90 811 0 0 25 20 800 10 5 500 0 0 10 5 500
ACHHAM 890 900 1011 125 78 620 122 118 970 19 18 947 131 94 718 DOTI 680 585 860 6 4.2 700 43 43 988 10.5 6.8 650 BAITADI 300 225 750 175 105 600 40 1 13 40 20 500 DADELDHURA 500 500 1000 65 63 969
FW.HILLS 2370 2210 932 306 187 610 227 182 801 0 0 62 61 976 182 121 666 0 0 0 0
KAILALI 20000 16000 800 225 248 1100 175 123 700 15 24 1600 125 150 1200 390 394 1010 550 300 545 400 400 1000 KANCHANPUR 6230 4984 800 100 121 1210 380 228 600 125 88 704
FW.TERAI 26230 20984 800 225 248 1100 175 123 700 15 24 1600 125 150 1200 490 515 1051 930 528 568 525 488 930
FW.REGION 29155 23519 807 576 470 816 513 394 769 15 24 1600 212 231 1087 682 641 940 930 528 568 535 493 921
N E P A L : 176259 154105 874 12907 11014 853 5925 5598 945 6752 12924 1914 3731 5260 1410 4531 3596 794 16901 10402 615 6036 6714 1112
22
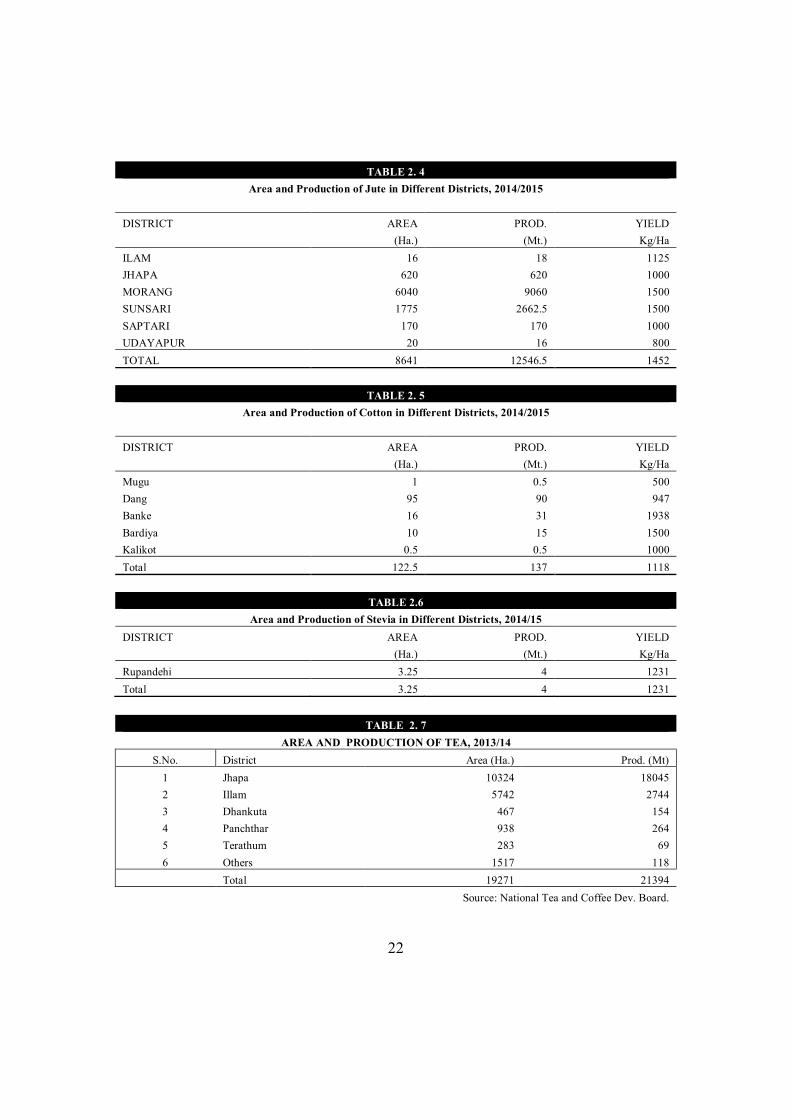
TABLE 2. 4 Area and Production of Jute in Different Districts, 2014/2015
DISTRICT AREA PROD. YIELD (Ha.) (Mt.) Kg/Ha ILAM 16 18 1125 JHAPA 620 620 1000 MORANG 6040 9060 1500 SUNSARI 1775 2662.5 1500 SAPTARI 170 170 1000 UDAYAPUR 20 16 800 TOTAL 8641 12546.5 1452
TABLE 2. 5 Area and Production of Cotton in Different Districts, 2014/2015
DISTRICT AREA PROD. YIELD (Ha.) (Mt.) Kg/Ha Mugu 1 0.5 500 Dang 95 90 947 Banke 16 31 1938 Bardiya 10 15 1500 Kalikot 0.5 0.5 1000 Total 122.5 137 1118
TABLE 2.6 Area and Production of Stevia in Different Districts, 2014/15
DISTRICT AREA PROD. YIELD (Ha.) (Mt.) Kg/Ha Rupandehi 3.25 4 1231 Total 3.25 4 1231
TABLE 2. 7 AREA AND PRODUCTION OF TEA, 2013/14
S.No. District Area (Ha.) Prod. (Mt) 1 Jhapa 10324 18045 2 Illam 5742 2744 3 Dhankuta 467 154 4 Panchthar 938 264 5 Terathum 283 69 6 Others 1517 118
Total 19271 21394 Source: National Tea and Coffee Dev. Board.
23
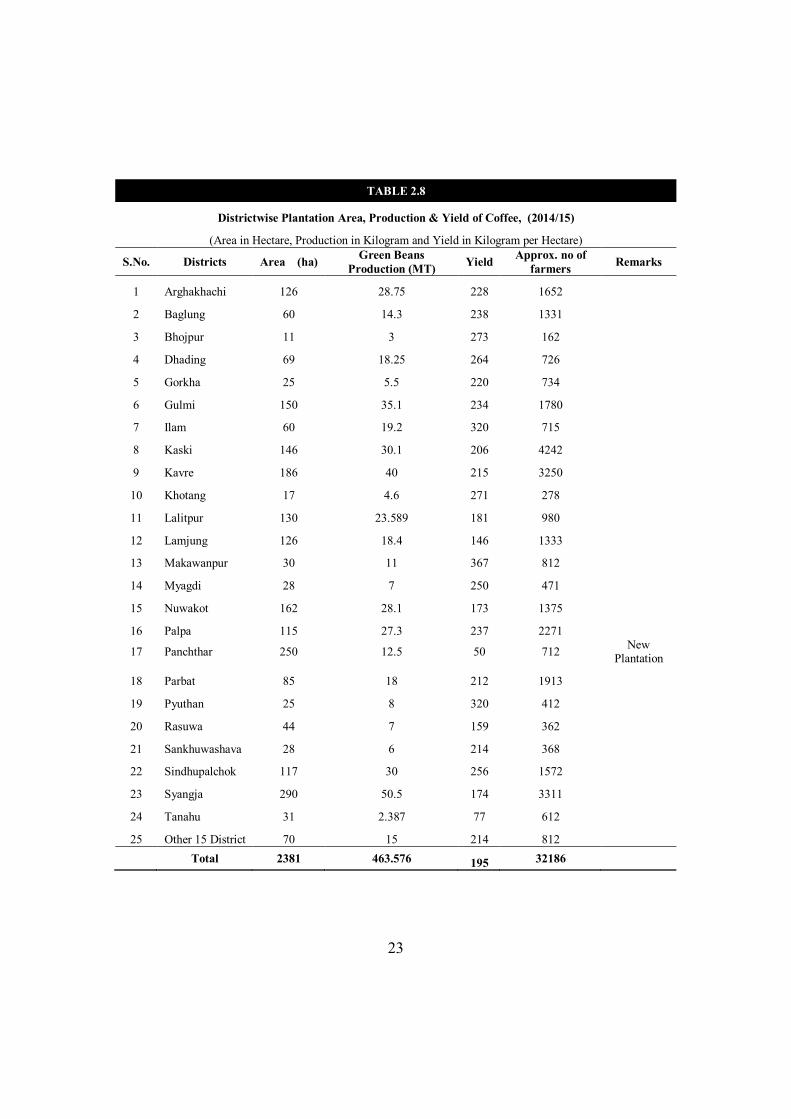
TABLE 2.8
Districtwise Plantation Area, Production & Yield of Coffee, (2014/15)
(Area in Hectare, Production in Kilogram and Yield in Kilogram per Hectare)
S.No. Districts Area (ha) Green Beans Production (MT) Yield Approx. no of
farmers Remarks
1 Arghakhachi 126 28.75 228 1652
2 Baglung 60 14.3 238 1331
3 Bhojpur 11 3 273 162
4 Dhading 69 18.25 264 726
5 Gorkha 25 5.5 220 734
6 Gulmi 150 35.1 234 1780
7 Ilam 60 19.2 320 715
8 Kaski 146 30.1 206 4242
9 Kavre 186 40 215 3250
10 Khotang 17 4.6 271 278
11 Lalitpur 130 23.589 181 980
12 Lamjung 126 18.4 146 1333
13 Makawanpur 30 11 367 812
14 Myagdi 28 7 250 471
15 Nuwakot 162 28.1 173 1375
16 Palpa 115 27.3 237 2271
17 Panchthar 250 12.5 50 712 New Plantation
18 Parbat 85 18 212 1913
19 Pyuthan 25 8 320 412
20 Rasuwa 44 7 159 362
21 Sankhuwashava 28 6 214 368
22 Sindhupalchok 117 30 256 1572
23 Syangja 290 50.5 174 3311
24 Tanahu 31 2.387 77 612
25 Other 15 District 70 15 214 812 Total 2381 463.576 195 32186
24
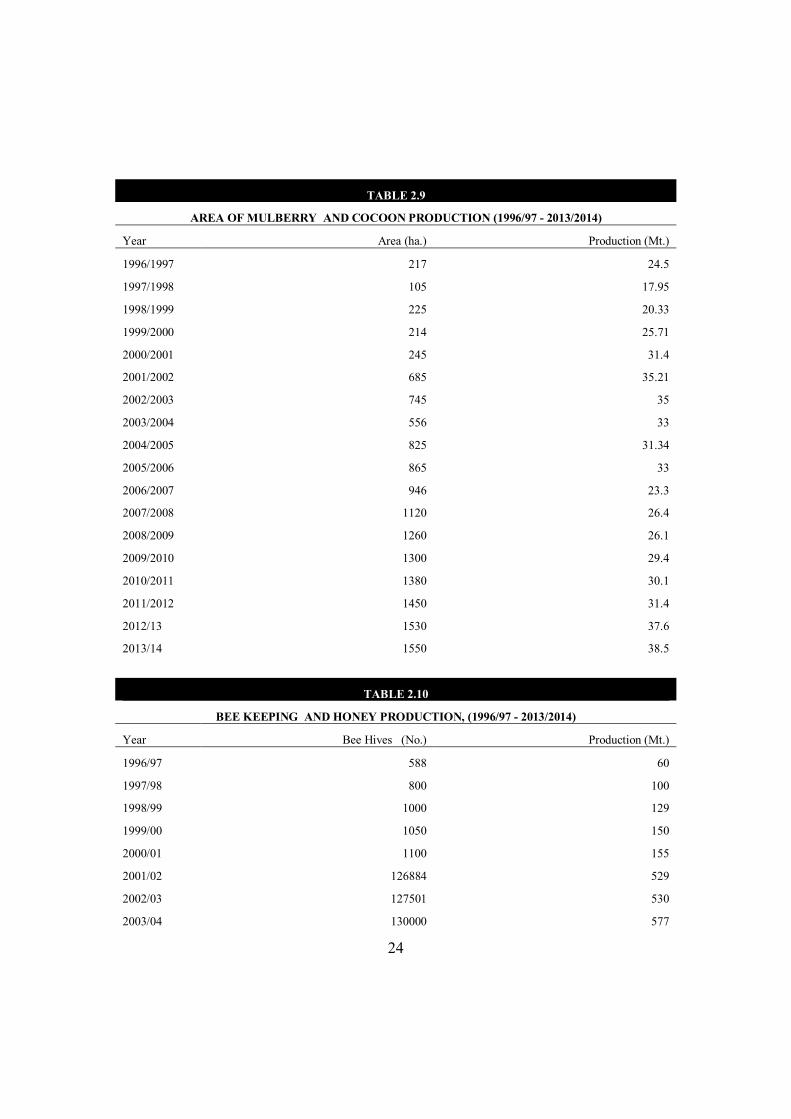
TABLE 2.9
AREA OF MULBERRY AND COCOON PRODUCTION (1996/97 - 2013/2014)
Year Area (ha.) Production (Mt.)
1996/1997 217 24.5
1997/1998 105 17.95
1998/1999 225 20.33
1999/2000 214 25.71
2000/2001 245 31.4
2001/2002 685 35.21
2002/2003 745 35
2003/2004 556 33
2004/2005 825 31.34
2005/2006 865 33
2006/2007 946 23.3
2007/2008 1120 26.4
2008/2009 1260 26.1
2009/2010 1300 29.4
2010/2011 1380 30.1
2011/2012 1450 31.4
2012/13 1530 37.6
2013/14 1550 38.5
TABLE 2.10
BEE KEEPING AND HONEY PRODUCTION, (1996/97 - 2013/2014)
Year Bee Hives (No.) Production (Mt.)
1996/97 588 60
1997/98 800 100
1998/99 1000 129
1999/00 1050 150
2000/01 1100 155
2001/02 126884 529
2002/03 127501 530
2003/04 130000 577
25
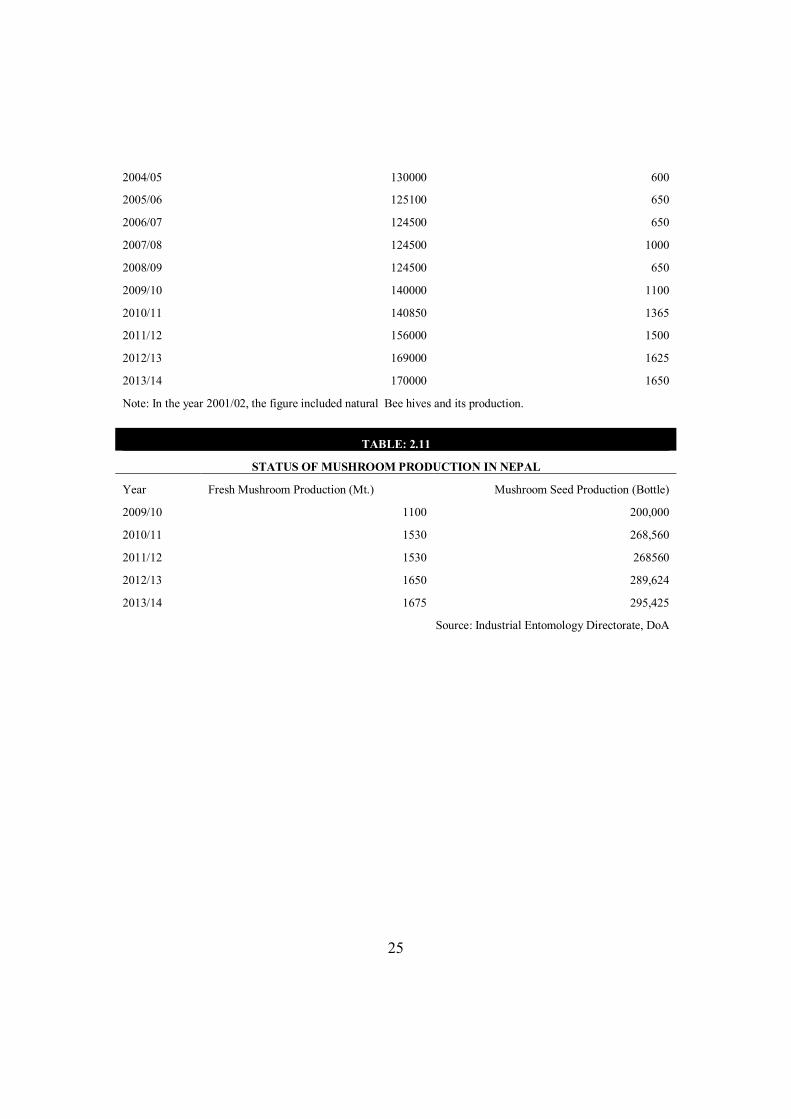
2004/05 130000 600
2005/06 125100 650
2006/07 124500 650
2007/08 124500 1000
2008/09 124500 650
2009/10 140000 1100
2010/11 140850 1365
2011/12 156000 1500
2012/13 169000 1625
2013/14 170000 1650
Note: In the year 2001/02, the figure included natural Bee hives and its production.
TABLE: 2.11
STATUS OF MUSHROOM PRODUCTION IN NEPAL
Year Fresh Mushroom Production (Mt.) Mushroom Seed Production (Bottle)
2009/10 1100 200,000
2010/11 1530 268,560
2011/12 1530 268560
2012/13 1650 289,624
2013/14 1675 295,425
Source: Industrial Entomology Directorate, DoA
26
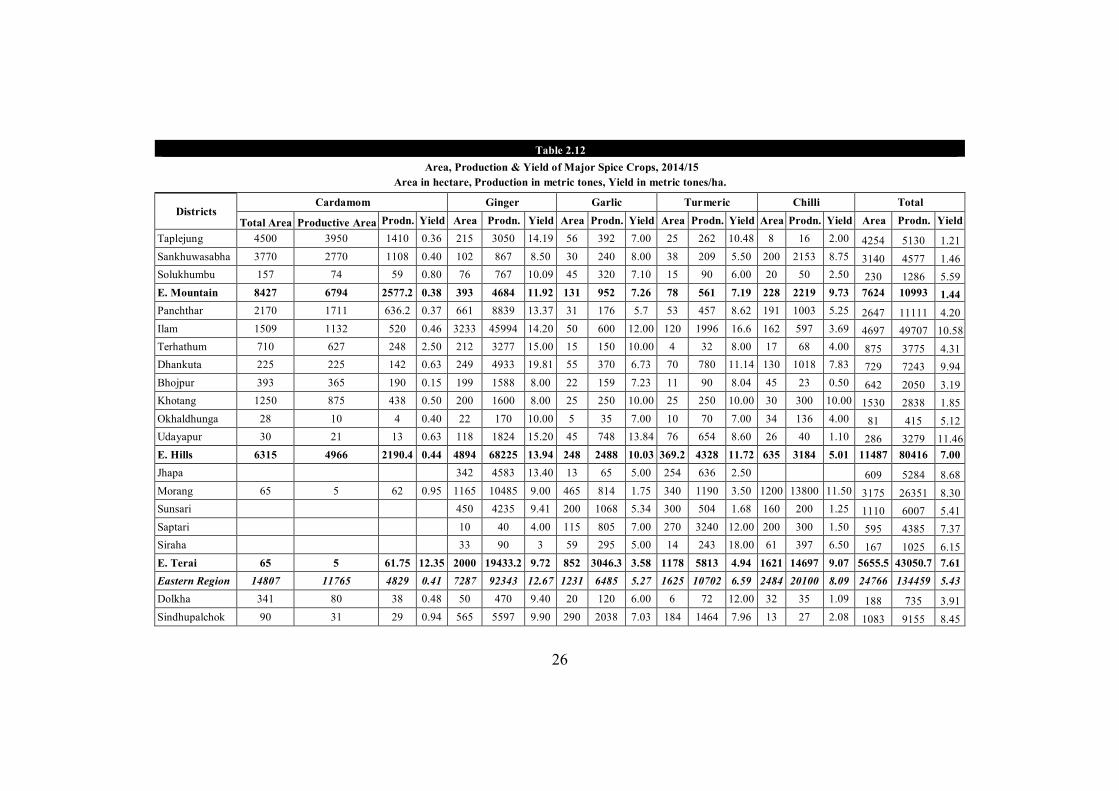
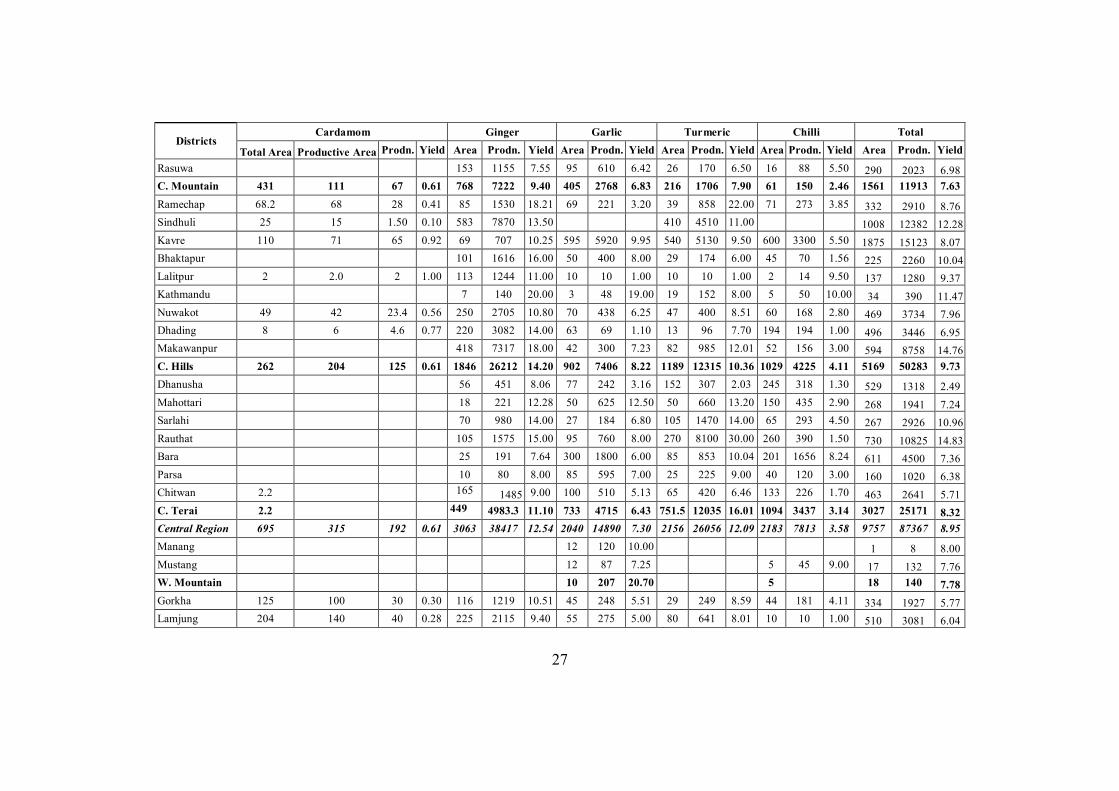
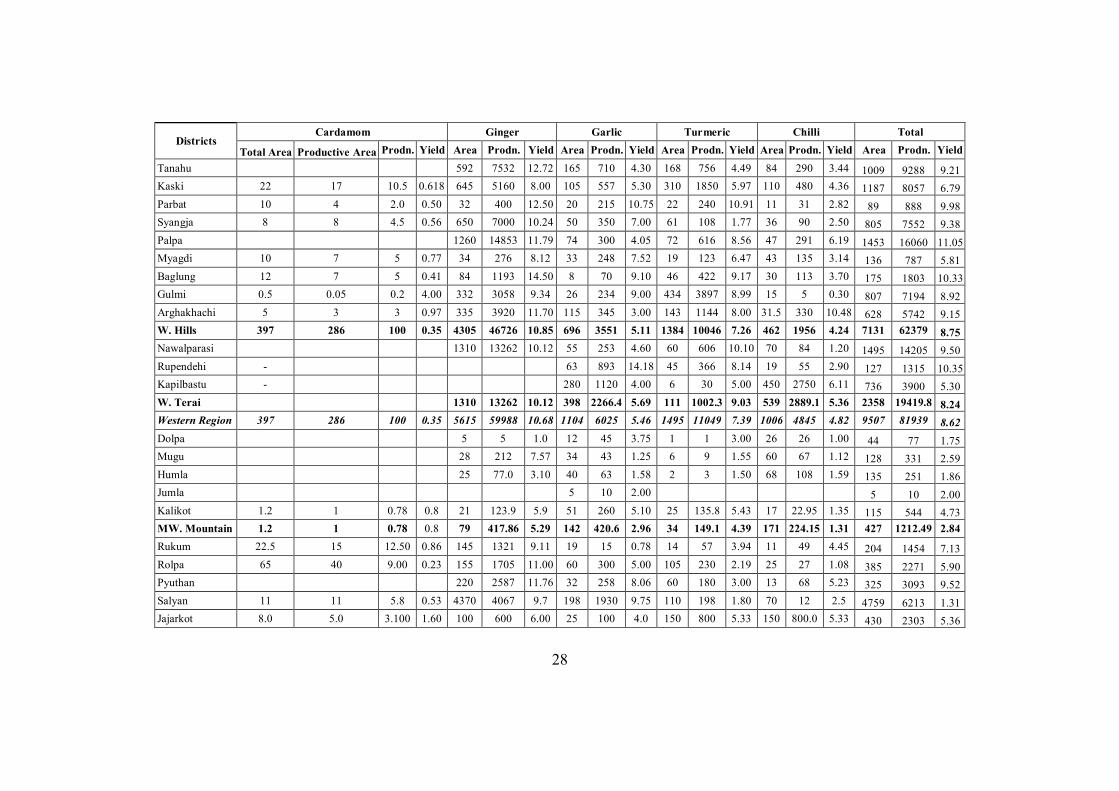
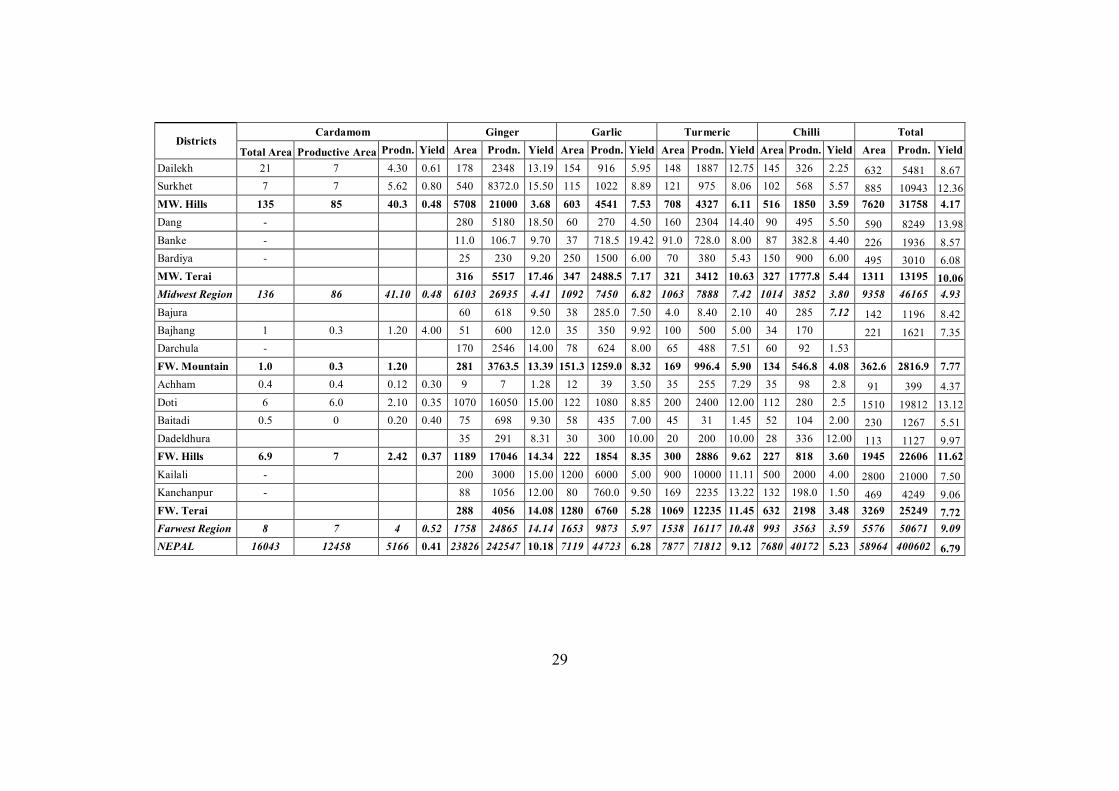
Table 2.12
Area, Production & Yield of Major Spice Crops, 2014/15 Area in hectare, Production in metric tones, Yield in metric tones/ha.
Districts Cardamom Ginger Garlic Turmeric Chilli Total
Total Area Productive Area Prodn. Yield Area Prodn. Yield Area Prodn. Yield Area Prodn. Yield Area Prodn. Yield Area Prodn. Yield Taplejung 4500 3950 1410 0.36 215 3050 14.19 56 392 7.00 25 262 10.48 8 16 2.00 4254 5130 1.21 Sankhuwasabha 3770 2770 1108 0.40 102 867 8.50 30 240 8.00 38 209 5.50 200 2153 8.75 3140 4577 1.46 Solukhumbu 157 74 59 0.80 76 767 10.09 45 320 7.10 15 90 6.00 20 50 2.50 230 1286 5.59 E. Mountain 8427 6794 2577.2 0.38 393 4684 11.92 131 952 7.26 78 561 7.19 228 2219 9.73 7624 10993 1.44 Panchthar 2170 1711 636.2 0.37 661 8839 13.37 31 176 5.7 53 457 8.62 191 1003 5.25 2647 11111 4.20 Ilam 1509 1132 520 0.46 3233 45994 14.20 50 600 12.00 120 1996 16.6 162 597 3.69 4697 49707 10.58 Terhathum 710 627 248 2.50 212 3277 15.00 15 150 10.00 4 32 8.00 17 68 4.00 875 3775 4.31 Dhankuta 225 225 142 0.63 249 4933 19.81 55 370 6.73 70 780 11.14 130 1018 7.83 729 7243 9.94 Bhojpur 393 365 190 0.15 199 1588 8.00 22 159 7.23 11 90 8.04 45 23 0.50 642 2050 3.19 Khotang 1250 875 438 0.50 200 1600 8.00 25 250 10.00 25 250 10.00 30 300 10.00 1530 2838 1.85 Okhaldhunga 28 10 4 0.40 22 170 10.00 5 35 7.00 10 70 7.00 34 136 4.00 81 415 5.12 Udayapur 30 21 13 0.63 118 1824 15.20 45 748 13.84 76 654 8.60 26 40 1.10 286 3279 11.46 E. Hills 6315 4966 2190.4 0.44 4894 68225 13.94 248 2488 10.03 369.2 4328 11.72 635 3184 5.01 11487 80416 7.00 Jhapa 342 4583 13.40 13 65 5.00 254 636 2.50 609 5284 8.68 Morang 65 5 62 0.95 1165 10485 9.00 465 814 1.75 340 1190 3.50 1200 13800 11.50 3175 26351 8.30 Sunsari 450 4235 9.41 200 1068 5.34 300 504 1.68 160 200 1.25 1110 6007 5.41 Saptari 10 40 4.00 115 805 7.00 270 3240 12.00 200 300 1.50 595 4385 7.37 Siraha 33 90 3 59 295 5.00 14 243 18.00 61 397 6.50 167 1025 6.15 E. Terai 65 5 61.75 12.35 2000 19433.2 9.72 852 3046.3 3.58 1178 5813 4.94 1621 14697 9.07 5655.5 43050.7 7.61 Eastern Region 14807 11765 4829 0.41 7287 92343 12.67 1231 6485 5.27 1625 10702 6.59 2484 20100 8.09 24766 134459 5.43 Dolkha 341 80 38 0.48 50 470 9.40 20 120 6.00 6 72 12.00 32 35 1.09 188 735 3.91 Sindhupalchok 90 31 29 0.94 565 5597 9.90 290 2038 7.03 184 1464 7.96 13 27 2.08 1083 9155 8.45
27
Districts Cardamom Ginger Garlic Turmeric Chilli Total
Total Area Productive Area Prodn. Yield Area Prodn. Yield Area Prodn. Yield Area Prodn. Yield Area Prodn. Yield Area Prodn. Yield Rasuwa 153 1155 7.55 95 610 6.42 26 170 6.50 16 88 5.50 290 2023 6.98 C. Mountain 431 111 67 0.61 768 7222 9.40 405 2768 6.83 216 1706 7.90 61 150 2.46 1561 11913 7.63 Ramechap 68.2 68 28 0.41 85 1530 18.21 69 221 3.20 39 858 22.00 71 273 3.85 332 2910 8.76 Sindhuli 25 15 1.50 0.10 583 7870 13.50 410 4510 11.00 1008 12382 12.28 Kavre 110 71 65 0.92 69 707 10.25 595 5920 9.95 540 5130 9.50 600 3300 5.50 1875 15123 8.07 Bhaktapur 101 1616 16.00 50 400 8.00 29 174 6.00 45 70 1.56 225 2260 10.04 Lalitpur 2 2.0 2 1.00 113 1244 11.00 10 10 1.00 10 10 1.00 2 14 9.50 137 1280 9.37 Kathmandu 7 140 20.00 3 48 19.00 19 152 8.00 5 50 10.00 34 390 11.47 Nuwakot 49 42 23.4 0.56 250 2705 10.80 70 438 6.25 47 400 8.51 60 168 2.80 469 3734 7.96 Dhading 8 6 4.6 0.77 220 3082 14.00 63 69 1.10 13 96 7.70 194 194 1.00 496 3446 6.95 Makawanpur 418 7317 18.00 42 300 7.23 82 985 12.01 52 156 3.00 594 8758 14.76 C. Hills 262 204 125 0.61 1846 26212 14.20 902 7406 8.22 1189 12315 10.36 1029 4225 4.11 5169 50283 9.73 Dhanusha 56 451 8.06 77 242 3.16 152 307 2.03 245 318 1.30 529 1318 2.49 Mahottari 18 221 12.28 50 625 12.50 50 660 13.20 150 435 2.90 268 1941 7.24 Sarlahi 70 980 14.00 27 184 6.80 105 1470 14.00 65 293 4.50 267 2926 10.96 Rauthat 105 1575 15.00 95 760 8.00 270 8100 30.00 260 390 1.50 730 10825 14.83 Bara 25 191 7.64 300 1800 6.00 85 853 10.04 201 1656 8.24 611 4500 7.36 Parsa 10 80 8.00 85 595 7.00 25 225 9.00 40 120 3.00 160 1020 6.38 Chitwan 2.2 165 1485 9.00 100 510 5.13 65 420 6.46 133 226 1.70 463 2641 5.71 C. Terai 2.2 449 4983.3 11.10 733 4715 6.43 751.5 12035 16.01 1094 3437 3.14 3027 25171 8.32 Central Region 695 315 192 0.61 3063 38417 12.54 2040 14890 7.30 2156 26056 12.09 2183 7813 3.58 9757 87367 8.95 Manang 12 120 10.00 1 8 8.00 Mustang 12 87 7.25 5 45 9.00 17 132 7.76 W. Mountain 10 207 20.70 5 18 140 7.78 Gorkha 125 100 30 0.30 116 1219 10.51 45 248 5.51 29 249 8.59 44 181 4.11 334 1927 5.77 Lamjung 204 140 40 0.28 225 2115 9.40 55 275 5.00 80 641 8.01 10 10 1.00 510 3081 6.04
28
Districts Cardamom Ginger Garlic Turmeric Chilli Total
Total Area Productive Area Prodn. Yield Area Prodn. Yield Area Prodn. Yield Area Prodn. Yield Area Prodn. Yield Area Prodn. Yield Tanahu 592 7532 12.72 165 710 4.30 168 756 4.49 84 290 3.44 1009 9288 9.21 Kaski 22 17 10.5 0.618 645 5160 8.00 105 557 5.30 310 1850 5.97 110 480 4.36 1187 8057 6.79 Parbat 10 4 2.0 0.50 32 400 12.50 20 215 10.75 22 240 10.91 11 31 2.82 89 888 9.98 Syangja 8 8 4.5 0.56 650 7000 10.24 50 350 7.00 61 108 1.77 36 90 2.50 805 7552 9.38 Palpa 1260 14853 11.79 74 300 4.05 72 616 8.56 47 291 6.19 1453 16060 11.05 Myagdi 10 7 5 0.77 34 276 8.12 33 248 7.52 19 123 6.47 43 135 3.14 136 787 5.81 Baglung 12 7 5 0.41 84 1193 14.50 8 70 9.10 46 422 9.17 30 113 3.70 175 1803 10.33 Gulmi 0.5 0.05 0.2 4.00 332 3058 9.34 26 234 9.00 434 3897 8.99 15 5 0.30 807 7194 8.92 Arghakhachi 5 3 3 0.97 335 3920 11.70 115 345 3.00 143 1144 8.00 31.5 330 10.48 628 5742 9.15 W. Hills 397 286 100 0.35 4305 46726 10.85 696 3551 5.11 1384 10046 7.26 462 1956 4.24 7131 62379 8.75 Nawalparasi 1310 13262 10.12 55 253 4.60 60 606 10.10 70 84 1.20 1495 14205 9.50 Rupendehi - 63 893 14.18 45 366 8.14 19 55 2.90 127 1315 10.35 Kapilbastu - 280 1120 4.00 6 30 5.00 450 2750 6.11 736 3900 5.30 W. Terai 1310 13262 10.12 398 2266.4 5.69 111 1002.3 9.03 539 2889.1 5.36 2358 19419.8 8.24 Western Region 397 286 100 0.35 5615 59988 10.68 1104 6025 5.46 1495 11049 7.39 1006 4845 4.82 9507 81939 8.62 Dolpa 5 5 1.0 12 45 3.75 1 1 3.00 26 26 1.00 44 77 1.75 Mugu 28 212 7.57 34 43 1.25 6 9 1.55 60 67 1.12 128 331 2.59 Humla 25 77.0 3.10 40 63 1.58 2 3 1.50 68 108 1.59 135 251 1.86 Jumla 5 10 2.00 5 10 2.00 Kalikot 1.2 1 0.78 0.8 21 123.9 5.9 51 260 5.10 25 135.8 5.43 17 22.95 1.35 115 544 4.73 MW. Mountain 1.2 1 0.78 0.8 79 417.86 5.29 142 420.6 2.96 34 149.1 4.39 171 224.15 1.31 427 1212.49 2.84 Rukum 22.5 15 12.50 0.86 145 1321 9.11 19 15 0.78 14 57 3.94 11 49 4.45 204 1454 7.13 Rolpa 65 40 9.00 0.23 155 1705 11.00 60 300 5.00 105 230 2.19 25 27 1.08 385 2271 5.90 Pyuthan 220 2587 11.76 32 258 8.06 60 180 3.00 13 68 5.23 325 3093 9.52 Salyan 11 11 5.8 0.53 4370 4067 9.7 198 1930 9.75 110 198 1.80 70 12 2.5 4759 6213 1.31 Jajarkot 8.0 5.0 3.100 1.60 100 600 6.00 25 100 4.0 150 800 5.33 150 800.0 5.33 430 2303 5.36
29
Districts Cardamom Ginger Garlic Turmeric Chilli Total
Total Area Productive Area Prodn. Yield Area Prodn. Yield Area Prodn. Yield Area Prodn. Yield Area Prodn. Yield Area Prodn. Yield Dailekh 21 7 4.30 0.61 178 2348 13.19 154 916 5.95 148 1887 12.75 145 326 2.25 632 5481 8.67 Surkhet 7 7 5.62 0.80 540 8372.0 15.50 115 1022 8.89 121 975 8.06 102 568 5.57 885 10943 12.36 MW. Hills 135 85 40.3 0.48 5708 21000 3.68 603 4541 7.53 708 4327 6.11 516 1850 3.59 7620 31758 4.17 Dang - 280 5180 18.50 60 270 4.50 160 2304 14.40 90 495 5.50 590 8249 13.98 Banke - 11.0 106.7 9.70 37 718.5 19.42 91.0 728.0 8.00 87 382.8 4.40 226 1936 8.57 Bardiya - 25 230 9.20 250 1500 6.00 70 380 5.43 150 900 6.00 495 3010 6.08 MW. Terai 316 5517 17.46 347 2488.5 7.17 321 3412 10.63 327 1777.8 5.44 1311 13195 10.06 Midwest Region 136 86 41.10 0.48 6103 26935 4.41 1092 7450 6.82 1063 7888 7.42 1014 3852 3.80 9358 46165 4.93 Bajura 60 618 9.50 38 285.0 7.50 4.0 8.40 2.10 40 285 7.12 142 1196 8.42 Bajhang 1 0.3 1.20 4.00 51 600 12.0 35 350 9.92 100 500 5.00 34 170 221 1621 7.35 Darchula - 170 2546 14.00 78 624 8.00 65 488 7.51 60 92 1.53 FW. Mountain 1.0 0.3 1.20 281 3763.5 13.39 151.3 1259.0 8.32 169 996.4 5.90 134 546.8 4.08 362.6 2816.9 7.77 Achham 0.4 0.4 0.12 0.30 9 7 1.28 12 39 3.50 35 255 7.29 35 98 2.8 91 399 4.37 Doti 6 6.0 2.10 0.35 1070 16050 15.00 122 1080 8.85 200 2400 12.00 112 280 2.5 1510 19812 13.12 Baitadi 0.5 0 0.20 0.40 75 698 9.30 58 435 7.00 45 31 1.45 52 104 2.00 230 1267 5.51 Dadeldhura 35 291 8.31 30 300 10.00 20 200 10.00 28 336 12.00 113 1127 9.97 FW. Hills 6.9 7 2.42 0.37 1189 17046 14.34 222 1854 8.35 300 2886 9.62 227 818 3.60 1945 22606 11.62 Kailali - 200 3000 15.00 1200 6000 5.00 900 10000 11.11 500 2000 4.00 2800 21000 7.50 Kanchanpur - 88 1056 12.00 80 760.0 9.50 169 2235 13.22 132 198.0 1.50 469 4249 9.06 FW. Terai 288 4056 14.08 1280 6760 5.28 1069 12235 11.45 632 2198 3.48 3269 25249 7.72 Farwest Region 8 7 4 0.52 1758 24865 14.14 1653 9873 5.97 1538 16117 10.48 993 3563 3.59 5576 50671 9.09 NEPAL 16043 12458 5166 0.41 23826 242547 10.18 7119 44723 6.28 7877 71812 9.12 7680 40172 5.23 58964 400602 6.79
30
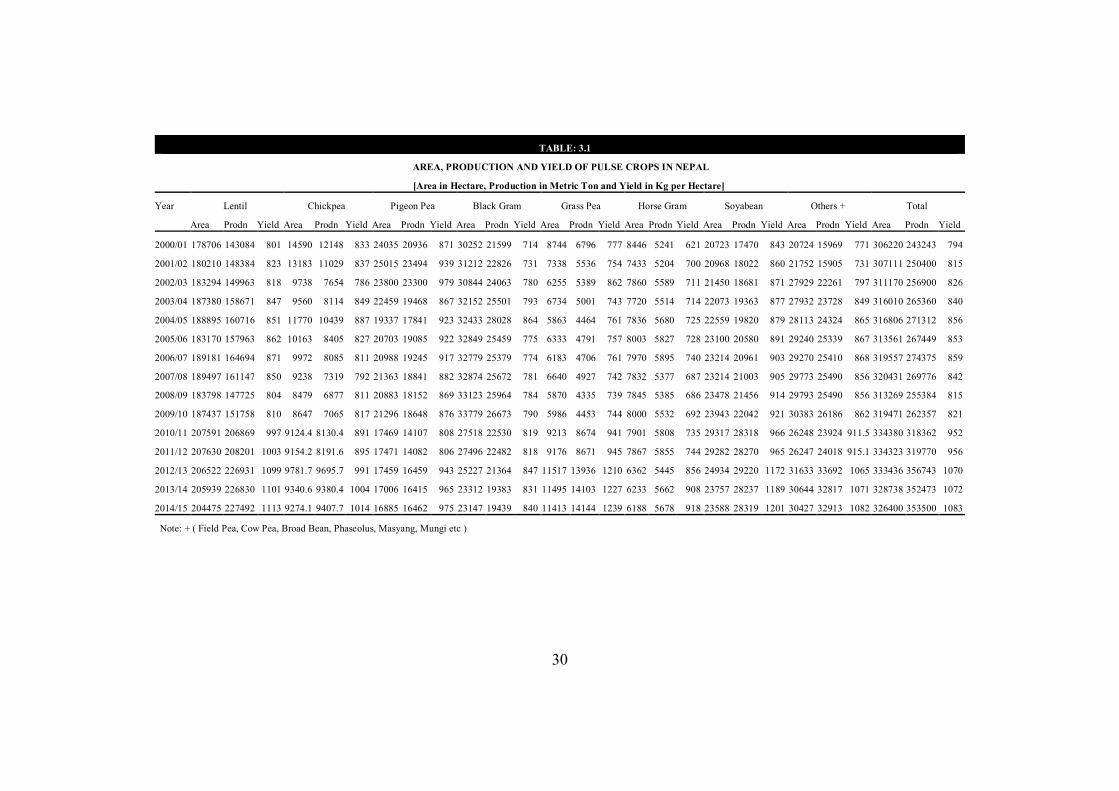
TABLE: 3.1
AREA, PRODUCTION AND YIELD OF PULSE CROPS IN NEPAL
[Area in Hectare, Production in Metric Ton and Yield in Kg per Hectare]
Year Lentil Chickpea Pigeon Pea Black Gram Grass Pea Horse Gram Soyabean Others + Total
Area Prodn Yield Area Prodn Yield Area Prodn Yield Area Prodn Yield Area Prodn Yield Area Prodn Yield Area Prodn Yield Area Prodn Yield Area Prodn Yield
2000/01 178706 143084 801 14590 12148 833 24035 20936 871 30252 21599 714 8744 6796 777 8446 5241 621 20723 17470 843 20724 15969 771 306220 243243 794
2001/02 180210 148384 823 13183 11029 837 25015 23494 939 31212 22826 731 7338 5536 754 7433 5204 700 20968 18022 860 21752 15905 731 307111 250400 815
2002/03 183294 149963 818 9738 7654 786 23800 23300 979 30844 24063 780 6255 5389 862 7860 5589 711 21450 18681 871 27929 22261 797 311170 256900 826
2003/04 187380 158671 847 9560 8114 849 22459 19468 867 32152 25501 793 6734 5001 743 7720 5514 714 22073 19363 877 27932 23728 849 316010 265360 840
2004/05 188895 160716 851 11770 10439 887 19337 17841 923 32433 28028 864 5863 4464 761 7836 5680 725 22559 19820 879 28113 24324 865 316806 271312 856
2005/06 183170 157963 862 10163 8405 827 20703 19085 922 32849 25459 775 6333 4791 757 8003 5827 728 23100 20580 891 29240 25339 867 313561 267449 853
2006/07 189181 164694 871 9972 8085 811 20988 19245 917 32779 25379 774 6183 4706 761 7970 5895 740 23214 20961 903 29270 25410 868 319557 274375 859
2007/08 189497 161147 850 9238 7319 792 21363 18841 882 32874 25672 781 6640 4927 742 7832 5377 687 23214 21003 905 29773 25490 856 320431 269776 842
2008/09 183798 147725 804 8479 6877 811 20883 18152 869 33123 25964 784 5870 4335 739 7845 5385 686 23478 21456 914 29793 25490 856 313269 255384 815
2009/10 187437 151758 810 8647 7065 817 21296 18648 876 33779 26673 790 5986 4453 744 8000 5532 692 23943 22042 921 30383 26186 862 319471 262357 821
2010/11 207591 206869 997 9124.4 8130.4 891 17469 14107 808 27518 22530 819 9213 8674 941 7901 5808 735 29317 28318 966 26248 23924 911.5 334380 318362 952
2011/12 207630 208201 1003 9154.2 8191.6 895 17471 14082 806 27496 22482 818 9176 8671 945 7867 5855 744 29282 28270 965 26247 24018 915.1 334323 319770 956
2012/13 206522 226931 1099 9781.7 9695.7 991 17459 16459 943 25227 21364 847 11517 13936 1210 6362 5445 856 24934 29220 1172 31633 33692 1065 333436 356743 1070
2013/14 205939 226830 1101 9340.6 9380.4 1004 17006 16415 965 23312 19383 831 11495 14103 1227 6233 5662 908 23757 28237 1189 30644 32817 1071 328738 352473 1072
2014/15 204475 227492 1113 9274.1 9407.7 1014 16885 16462 975 23147 19439 840 11413 14144 1239 6188 5678 918 23588 28319 1201 30427 32913 1082 326400 353500 1083
Note: + ( Field Pea, Cow Pea, Broad Bean, Phaseolus, Masyang, Mungi etc )
31
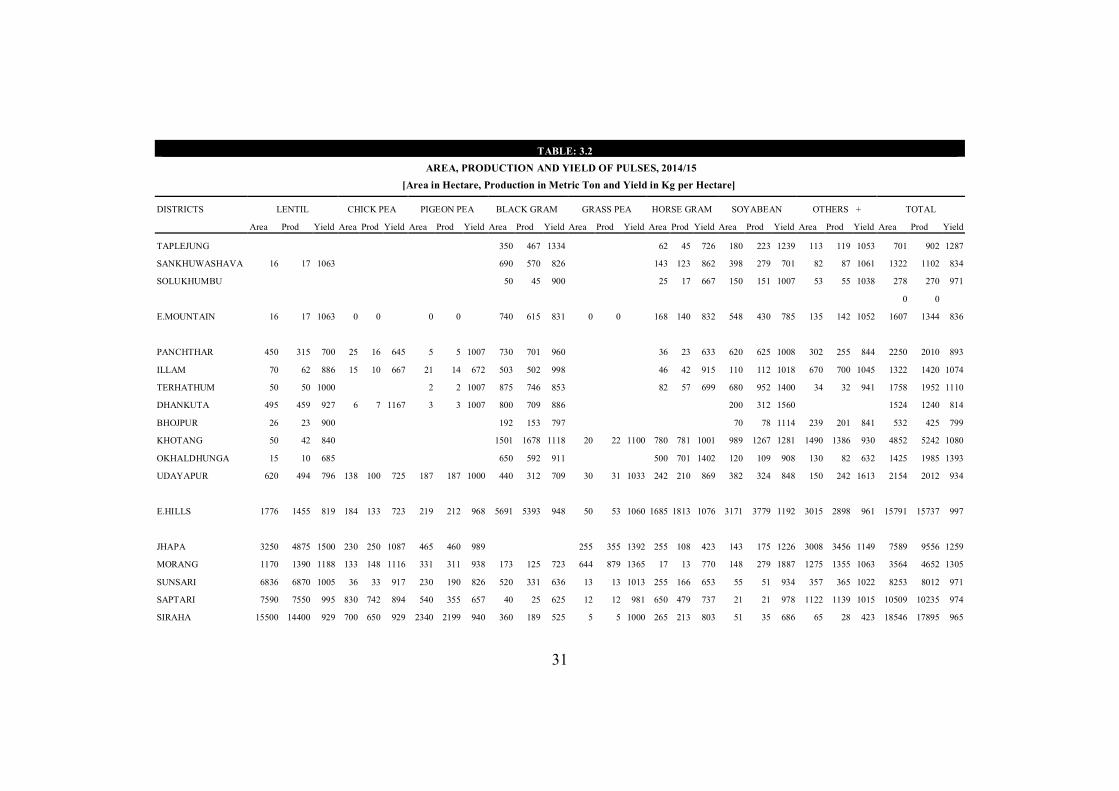
TABLE: 3.2
AREA, PRODUCTION AND YIELD OF PULSES, 2014/15 [Area in Hectare, Production in Metric Ton and Yield in Kg per Hectare]
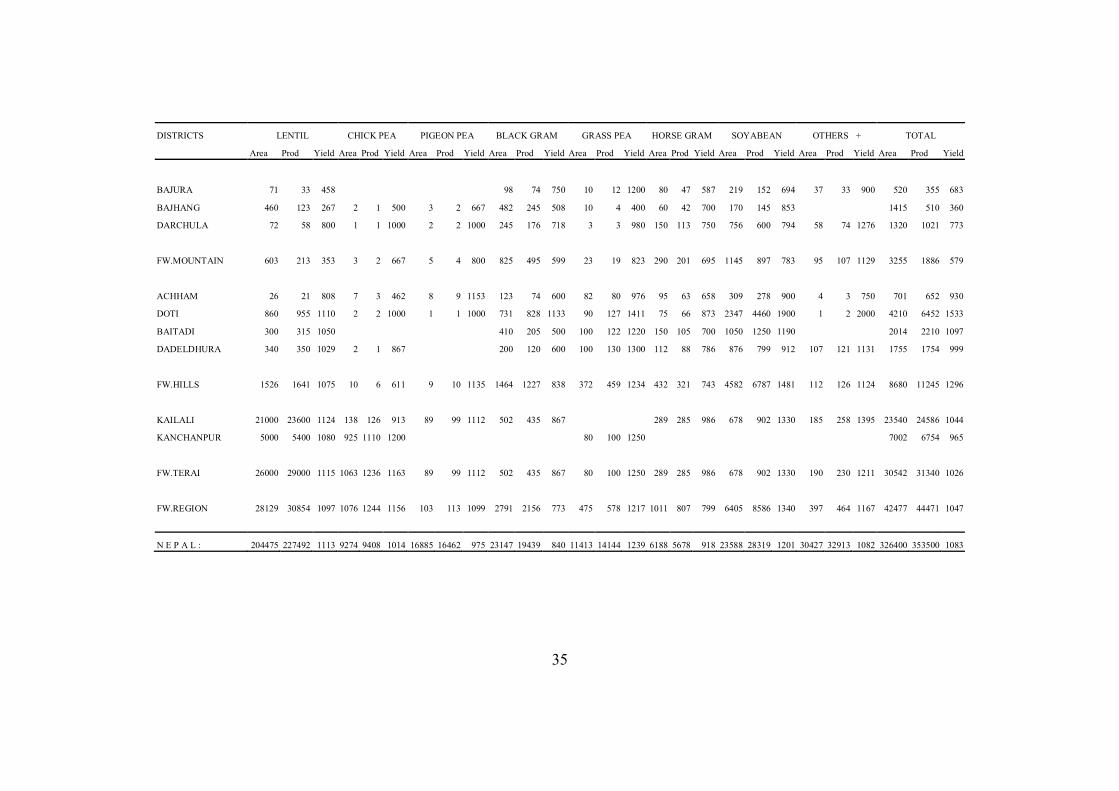
DISTRICTS LENTIL CHICK PEA PIGEON PEA BLACK GRAM GRASS PEA HORSE GRAM SOYABEAN OTHERS + TOTAL
Area Prod Yield Area Prod Yield Area Prod Yield Area Prod Yield Area Prod Yield Area Prod Yield Area Prod Yield Area Prod Yield Area Prod Yield
TAPLEJUNG 350 467 1334 62 45 726 180 223 1239 113 119 1053 701 902 1287
SANKHUWASHAVA 16 17 1063 690 570 826 143 123 862 398 279 701 82 87 1061 1322 1102 834
SOLUKHUMBU 50 45 900 25 17 667 150 151 1007 53 55 1038 278 270 971
0 0
E.MOUNTAIN 16 17 1063 0 0 0 0 740 615 831 0 0 168 140 832 548 430 785 135 142 1052 1607 1344 836
PANCHTHAR 450 315 700 25 16 645 5 5 1007 730 701 960 36 23 633 620 625 1008 302 255 844 2250 2010 893
ILLAM 70 62 886 15 10 667 21 14 672 503 502 998 46 42 915 110 112 1018 670 700 1045 1322 1420 1074
TERHATHUM 50 50 1000 2 2 1007 875 746 853 82 57 699 680 952 1400 34 32 941 1758 1952 1110
DHANKUTA 495 459 927 6 7 1167 3 3 1007 800 709 886 200 312 1560 1524 1240 814
BHOJPUR 26 23 900 192 153 797 70 78 1114 239 201 841 532 425 799
KHOTANG 50 42 840 1501 1678 1118 20 22 1100 780 781 1001 989 1267 1281 1490 1386 930 4852 5242 1080
OKHALDHUNGA 15 10 685 650 592 911 500 701 1402 120 109 908 130 82 632 1425 1985 1393
UDAYAPUR 620 494 796 138 100 725 187 187 1000 440 312 709 30 31 1033 242 210 869 382 324 848 150 242 1613 2154 2012 934
E.HILLS 1776 1455 819 184 133 723 219 212 968 5691 5393 948 50 53 1060 1685 1813 1076 3171 3779 1192 3015 2898 961 15791 15737 997
JHAPA 3250 4875 1500 230 250 1087 465 460 989 255 355 1392 255 108 423 143 175 1226 3008 3456 1149 7589 9556 1259
MORANG 1170 1390 1188 133 148 1116 331 311 938 173 125 723 644 879 1365 17 13 770 148 279 1887 1275 1355 1063 3564 4652 1305
SUNSARI 6836 6870 1005 36 33 917 230 190 826 520 331 636 13 13 1013 255 166 653 55 51 934 357 365 1022 8253 8012 971
SAPTARI 7590 7550 995 830 742 894 540 355 657 40 25 625 12 12 981 650 479 737 21 21 978 1122 1139 1015 10509 10235 974
SIRAHA 15500 14400 929 700 650 929 2340 2199 940 360 189 525 5 5 1000 265 213 803 51 35 686 65 28 423 18546 17895 965
32
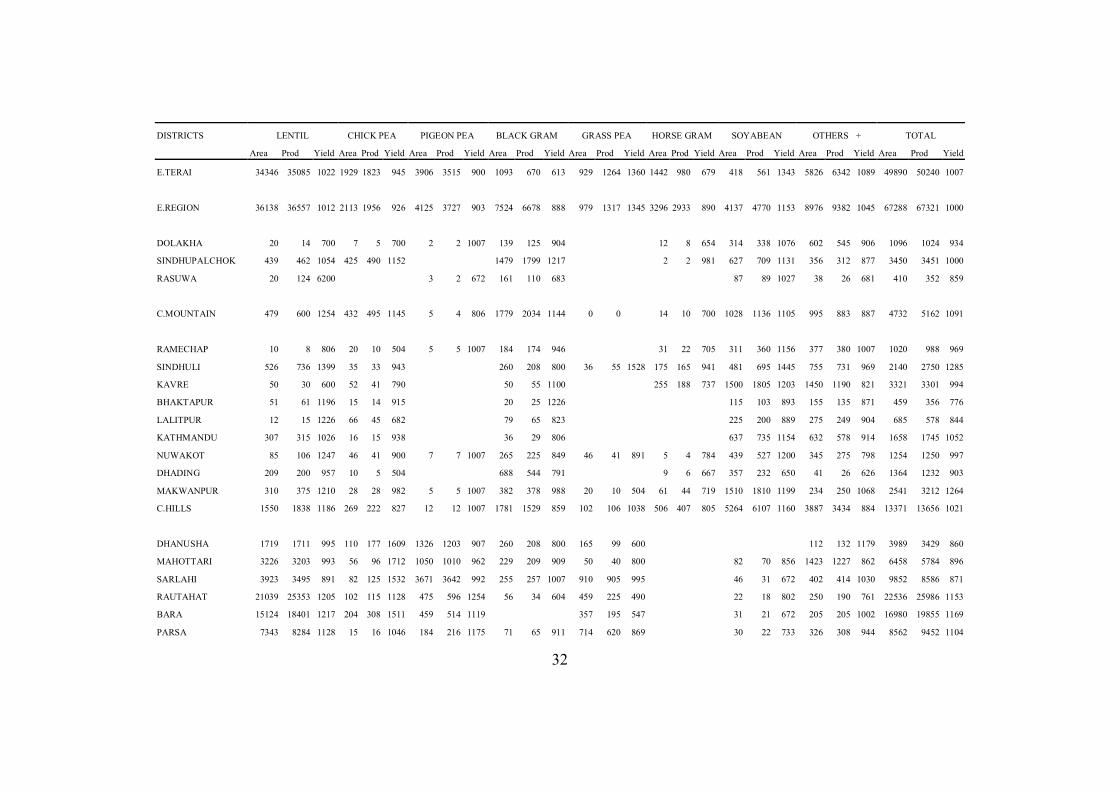
DISTRICTS LENTIL CHICK PEA PIGEON PEA BLACK GRAM GRASS PEA HORSE GRAM SOYABEAN OTHERS + TOTAL
Area Prod Yield Area Prod Yield Area Prod Yield Area Prod Yield Area Prod Yield Area Prod Yield Area Prod Yield Area Prod Yield Area Prod Yield
E.TERAI 34346 35085 1022 1929 1823 945 3906 3515 900 1093 670 613 929 1264 1360 1442 980 679 418 561 1343 5826 6342 1089 49890 50240 1007
E.REGION 36138 36557 1012 2113 1956 926 4125 3727 903 7524 6678 888 979 1317 1345 3296 2933 890 4137 4770 1153 8976 9382 1045 67288 67321 1000
DOLAKHA 20 14 700 7 5 700 2 2 1007 139 125 904 12 8 654 314 338 1076 602 545 906 1096 1024 934
SINDHUPALCHOK 439 462 1054 425 490 1152 1479 1799 1217 2 2 981 627 709 1131 356 312 877 3450 3451 1000
RASUWA 20 124 6200 3 2 672 161 110 683 87 89 1027 38 26 681 410 352 859
C.MOUNTAIN 479 600 1254 432 495 1145 5 4 806 1779 2034 1144 0 0 14 10 700 1028 1136 1105 995 883 887 4732 5162 1091
RAMECHAP 10 8 806 20 10 504 5 5 1007 184 174 946 31 22 705 311 360 1156 377 380 1007 1020 988 969
SINDHULI 526 736 1399 35 33 943 260 208 800 36 55 1528 175 165 941 481 695 1445 755 731 969 2140 2750 1285
KAVRE 50 30 600 52 41 790 50 55 1100 255 188 737 1500 1805 1203 1450 1190 821 3321 3301 994
BHAKTAPUR 51 61 1196 15 14 915 20 25 1226 115 103 893 155 135 871 459 356 776
LALITPUR 12 15 1226 66 45 682 79 65 823 225 200 889 275 249 904 685 578 844
KATHMANDU 307 315 1026 16 15 938 36 29 806 637 735 1154 632 578 914 1658 1745 1052
NUWAKOT 85 106 1247 46 41 900 7 7 1007 265 225 849 46 41 891 5 4 784 439 527 1200 345 275 798 1254 1250 997
DHADING 209 200 957 10 5 504 688 544 791 9 6 667 357 232 650 41 26 626 1364 1232 903
MAKWANPUR 310 375 1210 28 28 982 5 5 1007 382 378 988 20 10 504 61 44 719 1510 1810 1199 234 250 1068 2541 3212 1264
C.HILLS 1550 1838 1186 269 222 827 12 12 1007 1781 1529 859 102 106 1038 506 407 805 5264 6107 1160 3887 3434 884 13371 13656 1021
DHANUSHA 1719 1711 995 110 177 1609 1326 1203 907 260 208 800 165 99 600 112 132 1179 3989 3429 860
MAHOTTARI 3226 3203 993 56 96 1712 1050 1010 962 229 209 909 50 40 800 82 70 856 1423 1227 862 6458 5784 896
SARLAHI 3923 3495 891 82 125 1532 3671 3642 992 255 257 1007 910 905 995 46 31 672 402 414 1030 9852 8586 871
RAUTAHAT 21039 25353 1205 102 115 1128 475 596 1254 56 34 604 459 225 490 22 18 802 250 190 761 22536 25986 1153
BARA 15124 18401 1217 204 308 1511 459 514 1119 357 195 547 31 21 672 205 205 1002 16980 19855 1169
PARSA 7343 8284 1128 15 16 1046 184 216 1175 71 65 911 714 620 869 30 22 733 326 308 944 8562 9452 1104
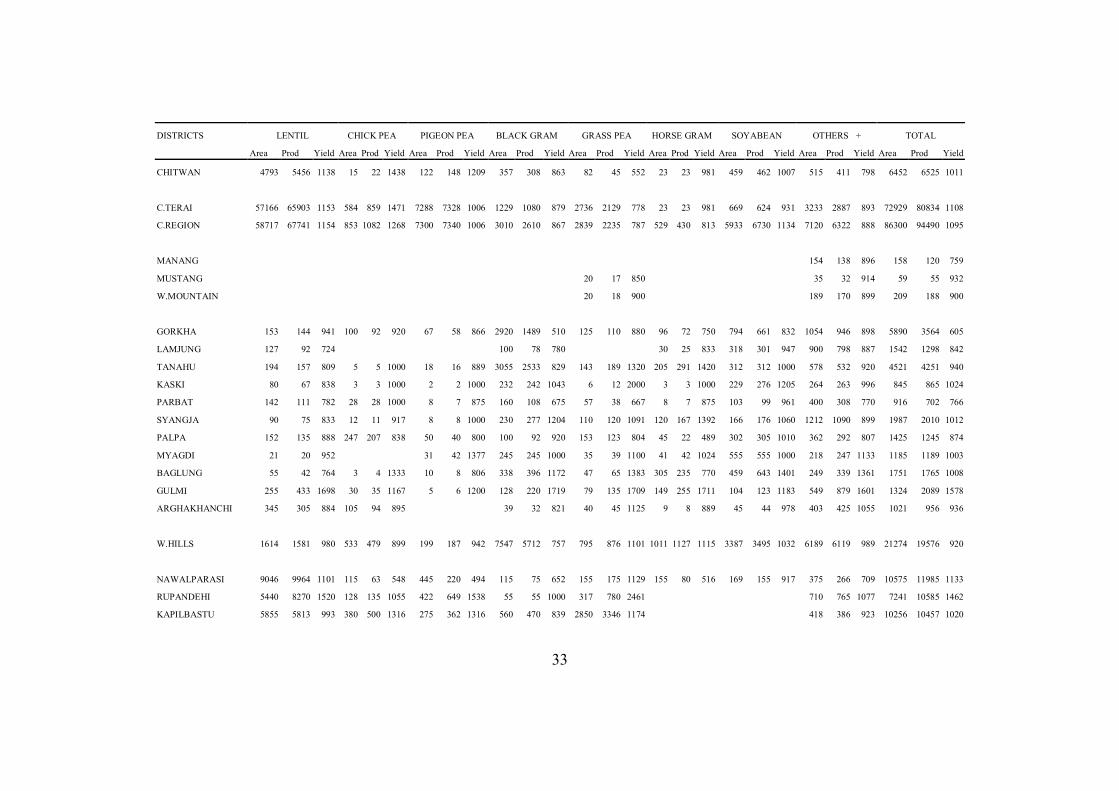
33
DISTRICTS LENTIL CHICK PEA PIGEON PEA BLACK GRAM GRASS PEA HORSE GRAM SOYABEAN OTHERS + TOTAL
Area Prod Yield Area Prod Yield Area Prod Yield Area Prod Yield Area Prod Yield Area Prod Yield Area Prod Yield Area Prod Yield Area Prod Yield
CHITWAN 4793 5456 1138 15 22 1438 122 148 1209 357 308 863 82 45 552 23 23 981 459 462 1007 515 411 798 6452 6525 1011
C.TERAI 57166 65903 1153 584 859 1471 7288 7328 1006 1229 1080 879 2736 2129 778 23 23 981 669 624 931 3233 2887 893 72929 80834 1108
C.REGION 58717 67741 1154 853 1082 1268 7300 7340 1006 3010 2610 867 2839 2235 787 529 430 813 5933 6730 1134 7120 6322 888 86300 94490 1095
MANANG 154 138 896 158 120 759
MUSTANG 20 17 850 35 32 914 59 55 932
W.MOUNTAIN 20 18 900 189 170 899 209 188 900
GORKHA 153 144 941 100 92 920 67 58 866 2920 1489 510 125 110 880 96 72 750 794 661 832 1054 946 898 5890 3564 605
LAMJUNG 127 92 724 100 78 780 30 25 833 318 301 947 900 798 887 1542 1298 842
TANAHU 194 157 809 5 5 1000 18 16 889 3055 2533 829 143 189 1320 205 291 1420 312 312 1000 578 532 920 4521 4251 940
KASKI 80 67 838 3 3 1000 2 2 1000 232 242 1043 6 12 2000 3 3 1000 229 276 1205 264 263 996 845 865 1024
PARBAT 142 111 782 28 28 1000 8 7 875 160 108 675 57 38 667 8 7 875 103 99 961 400 308 770 916 702 766
SYANGJA 90 75 833 12 11 917 8 8 1000 230 277 1204 110 120 1091 120 167 1392 166 176 1060 1212 1090 899 1987 2010 1012
PALPA 152 135 888 247 207 838 50 40 800 100 92 920 153 123 804 45 22 489 302 305 1010 362 292 807 1425 1245 874
MYAGDI 21 20 952 31 42 1377 245 245 1000 35 39 1100 41 42 1024 555 555 1000 218 247 1133 1185 1189 1003
BAGLUNG 55 42 764 3 4 1333 10 8 806 338 396 1172 47 65 1383 305 235 770 459 643 1401 249 339 1361 1751 1765 1008
GULMI 255 433 1698 30 35 1167 5 6 1200 128 220 1719 79 135 1709 149 255 1711 104 123 1183 549 879 1601 1324 2089 1578
ARGHAKHANCHI 345 305 884 105 94 895 39 32 821 40 45 1125 9 8 889 45 44 978 403 425 1055 1021 956 936
W.HILLS 1614 1581 980 533 479 899 199 187 942 7547 5712 757 795 876 1101 1011 1127 1115 3387 3495 1032 6189 6119 989 21274 19576 920
NAWALPARASI 9046 9964 1101 115 63 548 445 220 494 115 75 652 155 175 1129 155 80 516 169 155 917 375 266 709 10575 11985 1133
RUPANDEHI 5440 8270 1520 128 135 1055 422 649 1538 55 55 1000 317 780 2461 710 765 1077 7241 10585 1462
KAPILBASTU 5855 5813 993 380 500 1316 275 362 1316 560 470 839 2850 3346 1174 418 386 923 10256 10457 1020
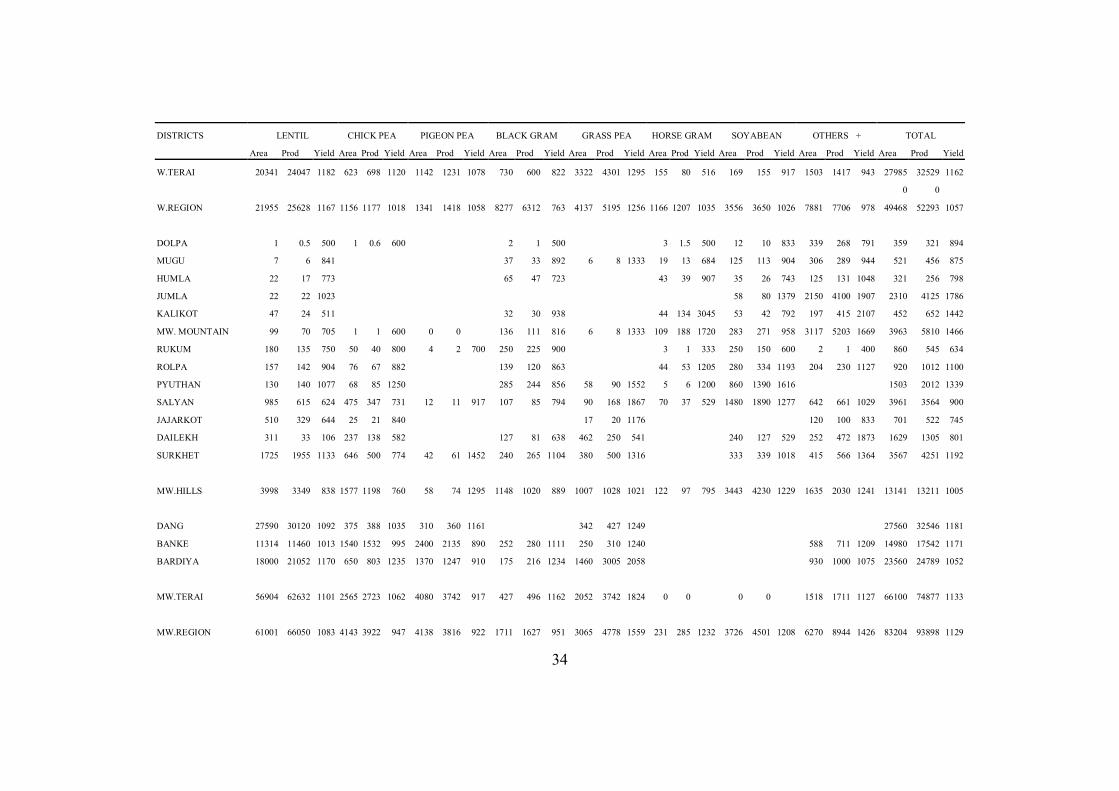
34
DISTRICTS LENTIL CHICK PEA PIGEON PEA BLACK GRAM GRASS PEA HORSE GRAM SOYABEAN OTHERS + TOTAL
Area Prod Yield Area Prod Yield Area Prod Yield Area Prod Yield Area Prod Yield Area Prod Yield Area Prod Yield Area Prod Yield Area Prod Yield
W.TERAI 20341 24047 1182 623 698 1120 1142 1231 1078 730 600 822 3322 4301 1295 155 80 516 169 155 917 1503 1417 943 27985 32529 1162
0 0
W.REGION 21955 25628 1167 1156 1177 1018 1341 1418 1058 8277 6312 763 4137 5195 1256 1166 1207 1035 3556 3650 1026 7881 7706 978 49468 52293 1057
DOLPA 1 0.5 500 1 0.6 600 2 1 500 3 1.5 500 12 10 833 339 268 791 359 321 894
MUGU 7 6 841 37 33 892 6 8 1333 19 13 684 125 113 904 306 289 944 521 456 875
HUMLA 22 17 773 65 47 723 43 39 907 35 26 743 125 131 1048 321 256 798
JUMLA 22 22 1023 58 80 1379 2150 4100 1907 2310 4125 1786
KALIKOT 47 24 511 32 30 938 44 134 3045 53 42 792 197 415 2107 452 652 1442
MW. MOUNTAIN 99 70 705 1 1 600 0 0 136 111 816 6 8 1333 109 188 1720 283 271 958 3117 5203 1669 3963 5810 1466
RUKUM 180 135 750 50 40 800 4 2 700 250 225 900 3 1 333 250 150 600 2 1 400 860 545 634
ROLPA 157 142 904 76 67 882 139 120 863 44 53 1205 280 334 1193 204 230 1127 920 1012 1100
PYUTHAN 130 140 1077 68 85 1250 285 244 856 58 90 1552 5 6 1200 860 1390 1616 1503 2012 1339
SALYAN 985 615 624 475 347 731 12 11 917 107 85 794 90 168 1867 70 37 529 1480 1890 1277 642 661 1029 3961 3564 900
JAJARKOT 510 329 644 25 21 840 17 20 1176 120 100 833 701 522 745
DAILEKH 311 33 106 237 138 582 127 81 638 462 250 541 240 127 529 252 472 1873 1629 1305 801
SURKHET 1725 1955 1133 646 500 774 42 61 1452 240 265 1104 380 500 1316 333 339 1018 415 566 1364 3567 4251 1192
MW.HILLS 3998 3349 838 1577 1198 760 58 74 1295 1148 1020 889 1007 1028 1021 122 97 795 3443 4230 1229 1635 2030 1241 13141 13211 1005
DANG 27590 30120 1092 375 388 1035 310 360 1161 342 427 1249 27560 32546 1181
BANKE 11314 11460 1013 1540 1532 995 2400 2135 890 252 280 1111 250 310 1240 588 711 1209 14980 17542 1171
BARDIYA 18000 21052 1170 650 803 1235 1370 1247 910 175 216 1234 1460 3005 2058 930 1000 1075 23560 24789 1052
MW.TERAI 56904 62632 1101 2565 2723 1062 4080 3742 917 427 496 1162 2052 3742 1824 0 0 0 0 1518 1711 1127 66100 74877 1133
MW.REGION 61001 66050 1083 4143 3922 947 4138 3816 922 1711 1627 951 3065 4778 1559 231 285 1232 3726 4501 1208 6270 8944 1426 83204 93898 1129
35
DISTRICTS LENTIL CHICK PEA PIGEON PEA BLACK GRAM GRASS PEA HORSE GRAM SOYABEAN OTHERS + TOTAL
Area Prod Yield Area Prod Yield Area Prod Yield Area Prod Yield Area Prod Yield Area Prod Yield Area Prod Yield Area Prod Yield Area Prod Yield
BAJURA 71 33 458 98 74 750 10 12 1200 80 47 587 219 152 694 37 33 900 520 355 683
BAJHANG 460 123 267 2 1 500 3 2 667 482 245 508 10 4 400 60 42 700 170 145 853 1415 510 360
DARCHULA 72 58 800 1 1 1000 2 2 1000 245 176 718 3 3 980 150 113 750 756 600 794 58 74 1276 1320 1021 773
FW.MOUNTAIN 603 213 353 3 2 667 5 4 800 825 495 599 23 19 823 290 201 695 1145 897 783 95 107 1129 3255 1886 579
ACHHAM 26 21 808 7 3 462 8 9 1153 123 74 600 82 80 976 95 63 658 309 278 900 4 3 750 701 652 930
DOTI 860 955 1110 2 2 1000 1 1 1000 731 828 1133 90 127 1411 75 66 873 2347 4460 1900 1 2 2000 4210 6452 1533
BAITADI 300 315 1050 410 205 500 100 122 1220 150 105 700 1050 1250 1190 2014 2210 1097
DADELDHURA 340 350 1029 2 1 867 200 120 600 100 130 1300 112 88 786 876 799 912 107 121 1131 1755 1754 999
FW.HILLS 1526 1641 1075 10 6 611 9 10 1135 1464 1227 838 372 459 1234 432 321 743 4582 6787 1481 112 126 1124 8680 11245 1296
KAILALI 21000 23600 1124 138 126 913 89 99 1112 502 435 867 289 285 986 678 902 1330 185 258 1395 23540 24586 1044
KANCHANPUR 5000 5400 1080 925 1110 1200 80 100 1250 7002 6754 965
FW.TERAI 26000 29000 1115 1063 1236 1163 89 99 1112 502 435 867 80 100 1250 289 285 986 678 902 1330 190 230 1211 30542 31340 1026
FW.REGION 28129 30854 1097 1076 1244 1156 103 113 1099 2791 2156 773 475 578 1217 1011 807 799 6405 8586 1340 397 464 1167 42477 44471 1047
N E P A L : 204475 227492 1113 9274 9408 1014 16885 16462 975 23147 19439 840 11413 14144 1239 6188 5678 918 23588 28319 1201 30427 32913 1082 326400 353500 1083
36
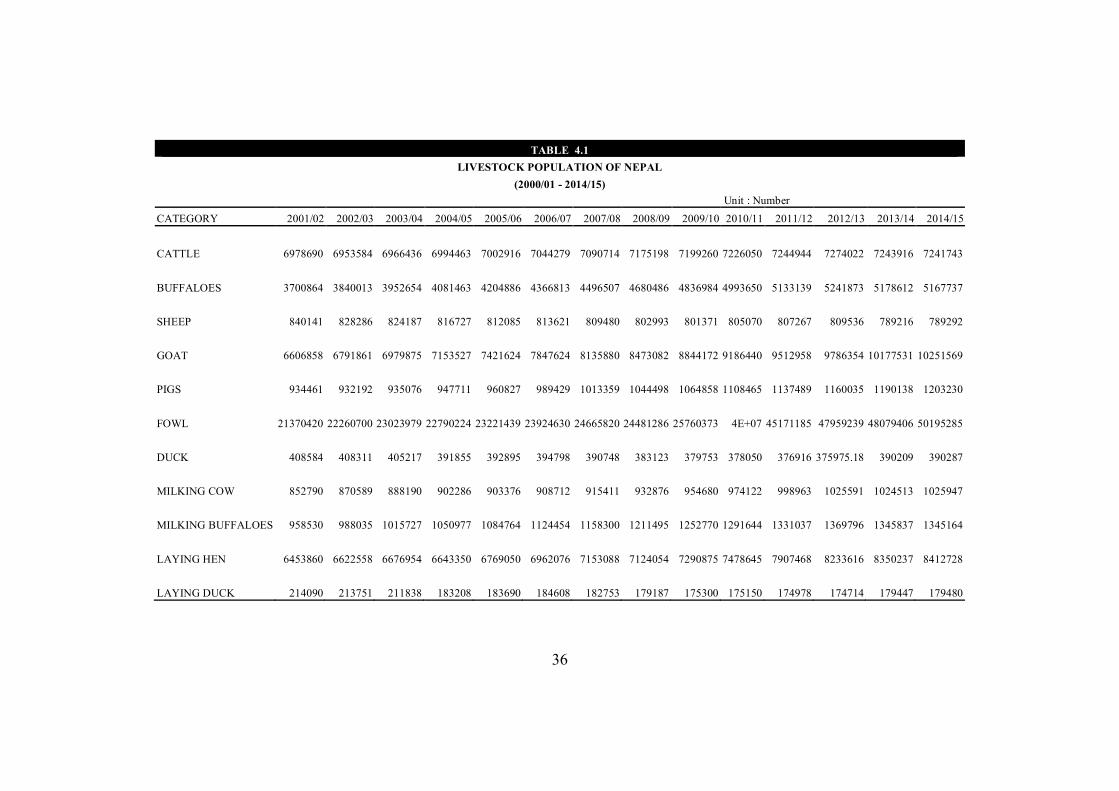
TABLE 4.1
LIVESTOCK POPULATION OF NEPAL (2000/01 - 2014/15)
Unit : Number CATEGORY 2001/02 2002/03 2003/04 2004/05 2005/06 2006/07 2007/08 2008/09 2009/10 2010/11 2011/12 2012/13 2013/14 2014/15
CATTLE 6978690 6953584 6966436 6994463 7002916 7044279 7090714 7175198 7199260 7226050 7244944 7274022 7243916 7241743
BUFFALOES 3700864 3840013 3952654 4081463 4204886 4366813 4496507 4680486 4836984 4993650 5133139 5241873 5178612 5167737
SHEEP 840141 828286 824187 816727 812085 813621 809480 802993 801371 805070 807267 809536 789216 789292
GOAT 6606858 6791861 6979875 7153527 7421624 7847624 8135880 8473082 8844172 9186440 9512958 9786354 10177531 10251569
PIGS 934461 932192 935076 947711 960827 989429 1013359 1044498 1064858 1108465 1137489 1160035 1190138 1203230
FOWL 21370420 22260700 23023979 22790224 23221439 23924630 24665820 24481286 25760373 4E+07 45171185 47959239 48079406 50195285
DUCK 408584 408311 405217 391855 392895 394798 390748 383123 379753 378050 376916 375975.18 390209 390287
MILKING COW 852790 870589 888190 902286 903376 908712 915411 932876 954680 974122 998963 1025591 1024513 1025947
MILKING BUFFALOES 958530 988035 1015727 1050977 1084764 1124454 1158300 1211495 1252770 1291644 1331037 1369796 1345837 1345164
LAYING HEN 6453860 6622558 6676954 6643350 6769050 6962076 7153088 7124054 7290875 7478645 7907468 8233616 8350237 8412728
LAYING DUCK 214090 213751 211838 183208 183690 184608 182753 179187 175300 175150 174978 174714 179447 179480
37
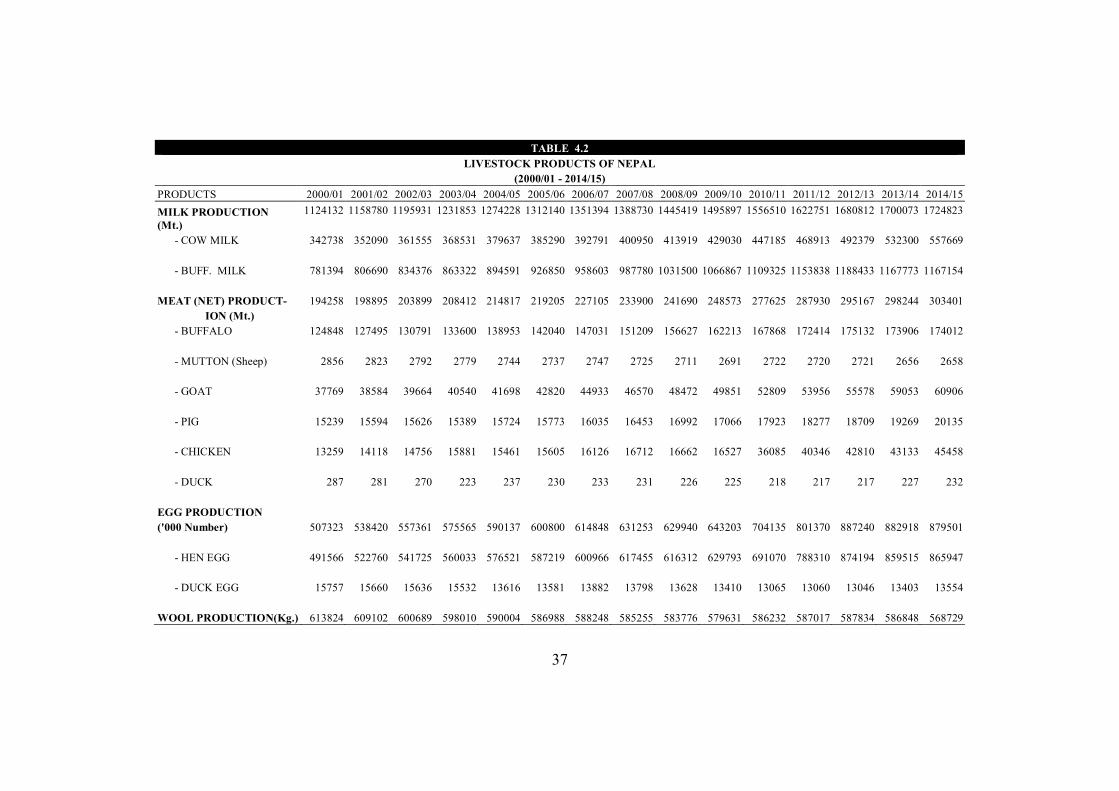
TABLE 4.2
LIVESTOCK PRODUCTS OF NEPAL (2000/01 - 2014/15)
PRODUCTS 2000/01 2001/02 2002/03 2003/04 2004/05 2005/06 2006/07 2007/08 2008/09 2009/10 2010/11 2011/12 2012/13 2013/14 2014/15 MILK PRODUCTION (Mt.)
1124132 1158780 1195931 1231853 1274228 1312140 1351394 1388730 1445419 1495897 1556510 1622751 1680812 1700073 1724823
- COW MILK 342738 352090 361555 368531 379637 385290 392791 400950 413919 429030 447185 468913 492379 532300 557669
- BUFF. MILK 781394 806690 834376 863322 894591 926850 958603 987780 1031500 1066867 1109325 1153838 1188433 1167773 1167154 MEAT (NET) PRODUCT- 194258 198895 203899 208412 214817 219205 227105 233900 241690 248573 277625 287930 295167 298244 303401
ION (Mt.) - BUFFALO 124848 127495 130791 133600 138953 142040 147031 151209 156627 162213 167868 172414 175132 173906 174012
- MUTTON (Sheep) 2856 2823 2792 2779 2744 2737 2747 2725 2711 2691 2722 2720 2721 2656 2658
- GOAT 37769 38584 39664 40540 41698 42820 44933 46570 48472 49851 52809 53956 55578 59053 60906
- PIG 15239 15594 15626 15389 15724 15773 16035 16453 16992 17066 17923 18277 18709 19269 20135
- CHICKEN 13259 14118 14756 15881 15461 15605 16126 16712 16662 16527 36085 40346 42810 43133 45458
- DUCK 287 281 270 223 237 230 233 231 226 225 218 217 217 227 232
EGG PRODUCTION ('000 Number) 507323 538420 557361 575565 590137 600800 614848 631253 629940 643203 704135 801370 887240 882918 879501
- HEN EGG 491566 522760 541725 560033 576521 587219 600966 617455 616312 629793 691070 788310 874194 859515 865947
- DUCK EGG 15757 15660 15636 15532 13616 13581 13882 13798 13628 13410 13065 13060 13046 13403 13554
WOOL PRODUCTION(Kg.) 613824 609102 600689 598010 590004 586988 588248 585255 583776 579631 586232 587017 587834 586848 568729
38
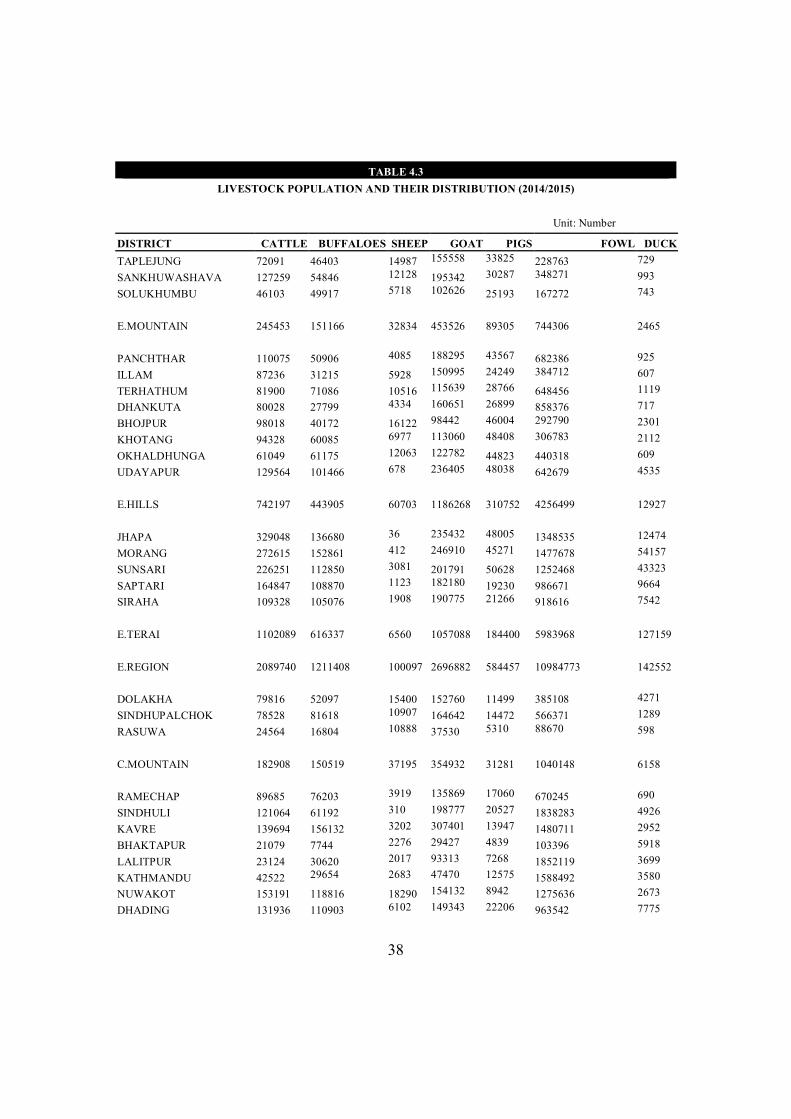
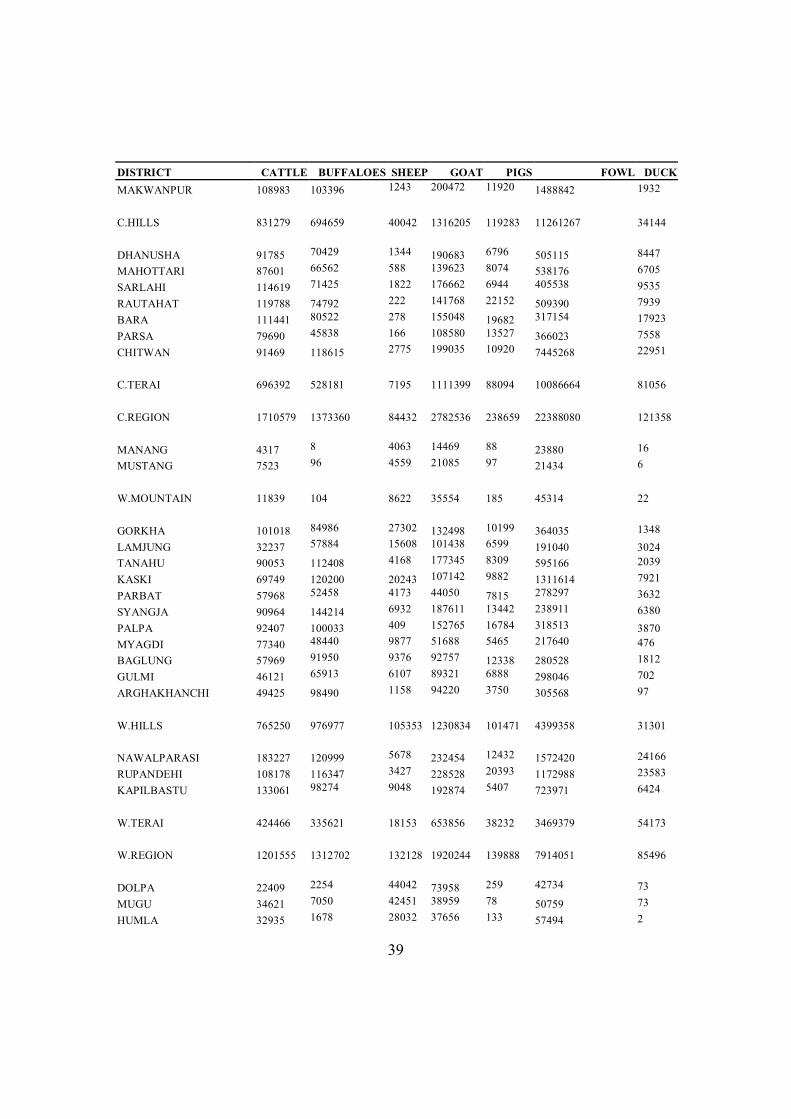
TABLE 4.3 LIVESTOCK POPULATION AND THEIR DISTRIBUTION (2014/2015)
Unit: Number
DISTRICT CATTLE BUFFALOES SHEEP GOAT PIGS FOWL DUCK TAPLEJUNG 72091 46403 14987 155558 33825 228763 729 SANKHUWASHAVA 127259 54846 12128 195342 30287 348271 993 SOLUKHUMBU 46103 49917 5718 102626 25193 167272 743
E.MOUNTAIN 245453 151166 32834 453526 89305 744306 2465
PANCHTHAR 110075 50906 4085 188295 43567 682386 925 ILLAM 87236 31215 5928 150995 24249 384712 607 TERHATHUM 81900 71086 10516 115639 28766 648456 1119 DHANKUTA 80028 27799 4334 160651 26899 858376 717 BHOJPUR 98018 40172 16122 98442 46004 292790 2301 KHOTANG 94328 60085 6977 113060 48408 306783 2112 OKHALDHUNGA 61049 61175 12063 122782 44823 440318 609 UDAYAPUR 129564 101466 678 236405 48038 642679 4535
E.HILLS 742197 443905 60703 1186268 310752 4256499 12927
JHAPA 329048 136680 36 235432 48005 1348535 12474 MORANG 272615 152861 412 246910 45271 1477678 54157 SUNSARI 226251 112850 3081 201791 50628 1252468 43323 SAPTARI 164847 108870 1123 182180 19230 986671 9664 SIRAHA 109328 105076 1908 190775 21266 918616 7542
E.TERAI 1102089 616337 6560 1057088 184400 5983968 127159
E.REGION 2089740 1211408 100097 2696882 584457 10984773 142552
DOLAKHA 79816 52097 15400 152760 11499 385108 4271 SINDHUPALCHOK 78528 81618 10907 164642 14472 566371 1289 RASUWA 24564 16804 10888 37530 5310 88670 598
C.MOUNTAIN 182908 150519 37195 354932 31281 1040148 6158
RAMECHAP 89685 76203 3919 135869 17060 670245 690 SINDHULI 121064 61192 310 198777 20527 1838283 4926 KAVRE 139694 156132 3202 307401 13947 1480711 2952 BHAKTAPUR 21079 7744 2276 29427 4839 103396 5918 LALITPUR 23124 30620 2017 93313 7268 1852119 3699 KATHMANDU 42522 29654 2683 47470 12575 1588492 3580 NUWAKOT 153191 118816 18290 154132 8942 1275636 2673 DHADING 131936 110903 6102 149343 22206 963542 7775
39
DISTRICT CATTLE BUFFALOES SHEEP GOAT PIGS FOWL DUCK MAKWANPUR 108983 103396 1243 200472 11920 1488842 1932
C.HILLS 831279 694659 40042 1316205 119283 11261267 34144
DHANUSHA 91785 70429 1344 190683 6796 505115 8447 MAHOTTARI 87601 66562 588 139623 8074 538176 6705 SARLAHI 114619 71425 1822 176662 6944 405538 9535 RAUTAHAT 119788 74792 222 141768 22152 509390 7939 BARA 111441 80522 278 155048 19682 317154 17923 PARSA 79690 45838 166 108580 13527 366023 7558 CHITWAN 91469 118615 2775 199035 10920 7445268 22951
C.TERAI 696392 528181 7195 1111399 88094 10086664 81056
C.REGION 1710579 1373360 84432 2782536 238659 22388080 121358
MANANG 4317 8 4063 14469 88 23880 16 MUSTANG 7523 96 4559 21085 97 21434 6
W.MOUNTAIN 11839 104 8622 35554 185 45314 22
GORKHA 101018 84986 27302 132498 10199 364035 1348 LAMJUNG 32237 57884 15608 101438 6599 191040 3024 TANAHU 90053 112408 4168 177345 8309 595166 2039 KASKI 69749 120200 20243 107142 9882 1311614 7921 PARBAT 57968 52458 4173 44050 7815 278297 3632 SYANGJA 90964 144214 6932 187611 13442 238911 6380 PALPA 92407 100033 409 152765 16784 318513 3870 MYAGDI 77340 48440 9877 51688 5465 217640 476 BAGLUNG 57969 91950 9376 92757 12338 280528 1812 GULMI 46121 65913 6107 89321 6888 298046 702 ARGHAKHANCHI 49425 98490 1158 94220 3750 305568 97
W.HILLS 765250 976977 105353 1230834 101471 4399358 31301
NAWALPARASI 183227 120999 5678 232454 12432 1572420 24166 RUPANDEHI 108178 116347 3427 228528 20393 1172988 23583 KAPILBASTU 133061 98274 9048 192874 5407 723971 6424
W.TERAI 424466 335621 18153 653856 38232 3469379 54173
W.REGION 1201555 1312702 132128 1920244 139888 7914051 85496
DOLPA 22409 2254 44042 73958 259 42734 73 MUGU 34621 7050 42451 38959 78 50759 73 HUMLA 32935 1678 28032 37656 133 57494 2
40
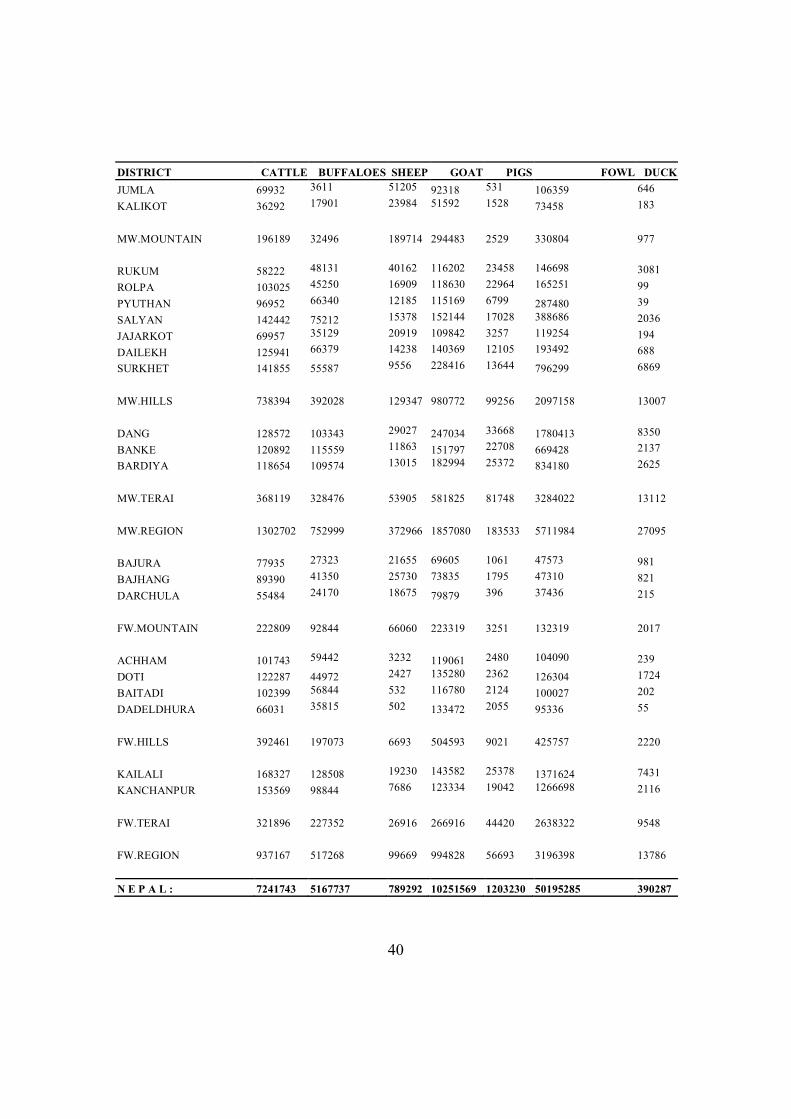
DISTRICT CATTLE BUFFALOES SHEEP GOAT PIGS FOWL DUCK JUMLA 69932 3611 51205 92318 531 106359 646 KALIKOT 36292 17901 23984 51592 1528 73458 183
MW.MOUNTAIN 196189 32496 189714 294483 2529 330804 977
RUKUM 58222 48131 40162 116202 23458 146698 3081 ROLPA 103025 45250 16909 118630 22964 165251 99 PYUTHAN 96952 66340 12185 115169 6799 287480 39 SALYAN 142442 75212 15378 152144 17028 388686 2036 JAJARKOT 69957 35129 20919 109842 3257 119254 194 DAILEKH 125941 66379 14238 140369 12105 193492 688 SURKHET 141855 55587 9556 228416 13644 796299 6869
MW.HILLS 738394 392028 129347 980772 99256 2097158 13007
DANG 128572 103343 29027 247034 33668 1780413 8350 BANKE 120892 115559 11863 151797 22708 669428 2137 BARDIYA 118654 109574 13015 182994 25372 834180 2625
MW.TERAI 368119 328476 53905 581825 81748 3284022 13112
MW.REGION 1302702 752999 372966 1857080 183533 5711984 27095
BAJURA 77935 27323 21655 69605 1061 47573 981 BAJHANG 89390 41350 25730 73835 1795 47310 821 DARCHULA 55484 24170 18675 79879 396 37436 215
FW.MOUNTAIN 222809 92844 66060 223319 3251 132319 2017
ACHHAM 101743 59442 3232 119061 2480 104090 239 DOTI 122287 44972 2427 135280 2362 126304 1724 BAITADI 102399 56844 532 116780 2124 100027 202 DADELDHURA 66031 35815 502 133472 2055 95336 55
FW.HILLS 392461 197073 6693 504593 9021 425757 2220
KAILALI 168327 128508 19230 143582 25378 1371624 7431 KANCHANPUR 153569 98844 7686 123334 19042 1266698 2116
FW.TERAI 321896 227352 26916 266916 44420 2638322 9548
FW.REGION 937167 517268 99669 994828 56693 3196398 13786
N E P A L : 7241743 5167737 789292 10251569 1203230 50195285 390287
41
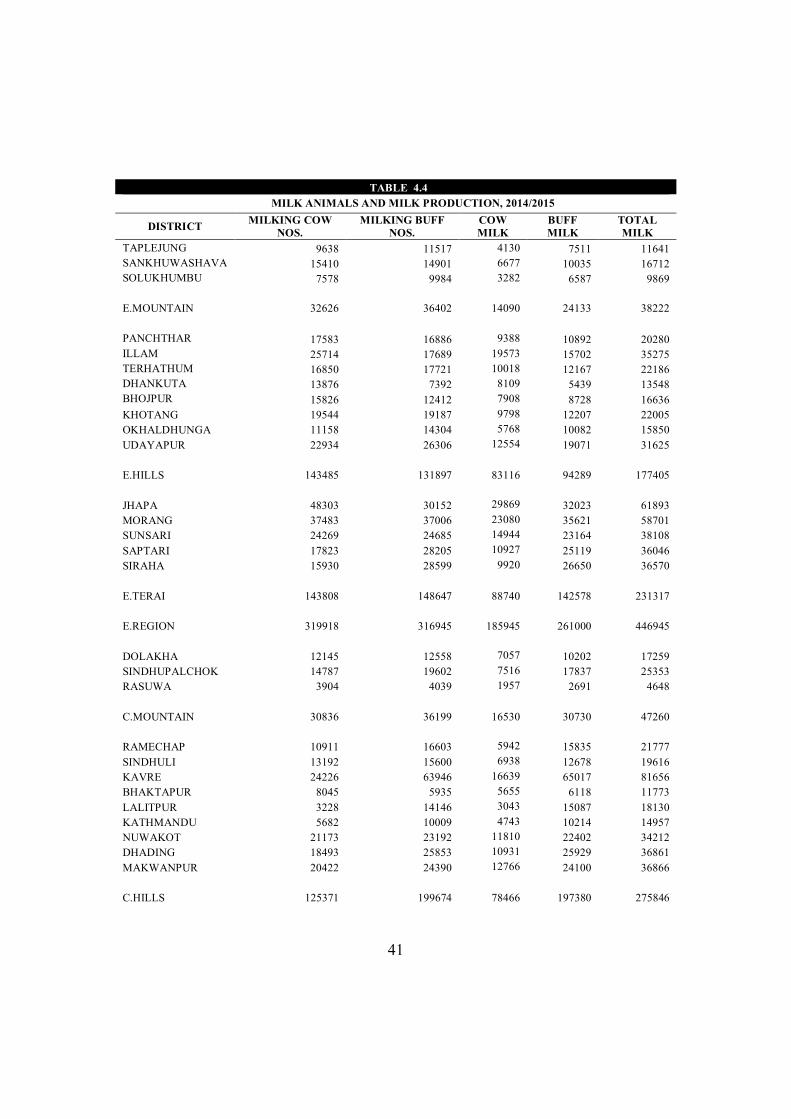
TABLE 4.4
MILK ANIMALS AND MILK PRODUCTION, 2014/2015
DISTRICT MILKING COW NOS.
MILKING BUFF NOS.
COW MILK
BUFF MILK
TOTAL MILK
TAPLEJUNG 9638 11517 4130 7511 11641 SANKHUWASHAVA 15410 14901 6677 10035 16712 SOLUKHUMBU 7578 9984 3282 6587 9869
E.MOUNTAIN 32626 36402 14090 24133 38222
PANCHTHAR 17583 16886 9388 10892 20280 ILLAM 25714 17689 19573 15702 35275 TERHATHUM 16850 17721 10018 12167 22186 DHANKUTA 13876 7392 8109 5439 13548 BHOJPUR 15826 12412 7908 8728 16636 KHOTANG 19544 19187 9798 12207 22005 OKHALDHUNGA 11158 14304 5768 10082 15850 UDAYAPUR 22934 26306 12554 19071 31625
E.HILLS 143485 131897 83116 94289 177405
JHAPA 48303 30152 29869 32023 61893 MORANG 37483 37006 23080 35621 58701 SUNSARI 24269 24685 14944 23164 38108 SAPTARI 17823 28205 10927 25119 36046 SIRAHA 15930 28599 9920 26650 36570
E.TERAI 143808 148647 88740 142578 231317
E.REGION 319918 316945 185945 261000 446945
DOLAKHA 12145 12558 7057 10202 17259 SINDHUPALCHOK 14787 19602 7516 17837 25353 RASUWA 3904 4039 1957 2691 4648
C.MOUNTAIN 30836 36199 16530 30730 47260
RAMECHAP 10911 16603 5942 15835 21777 SINDHULI 13192 15600 6938 12678 19616 KAVRE 24226 63946 16639 65017 81656 BHAKTAPUR 8045 5935 5655 6118 11773 LALITPUR 3228 14146 3043 15087 18130 KATHMANDU 5682 10009 4743 10214 14957 NUWAKOT 21173 23192 11810 22402 34212 DHADING 18493 25853 10931 25929 36861 MAKWANPUR 20422 24390 12766 24100 36866
C.HILLS 125371 199674 78466 197380 275846
42
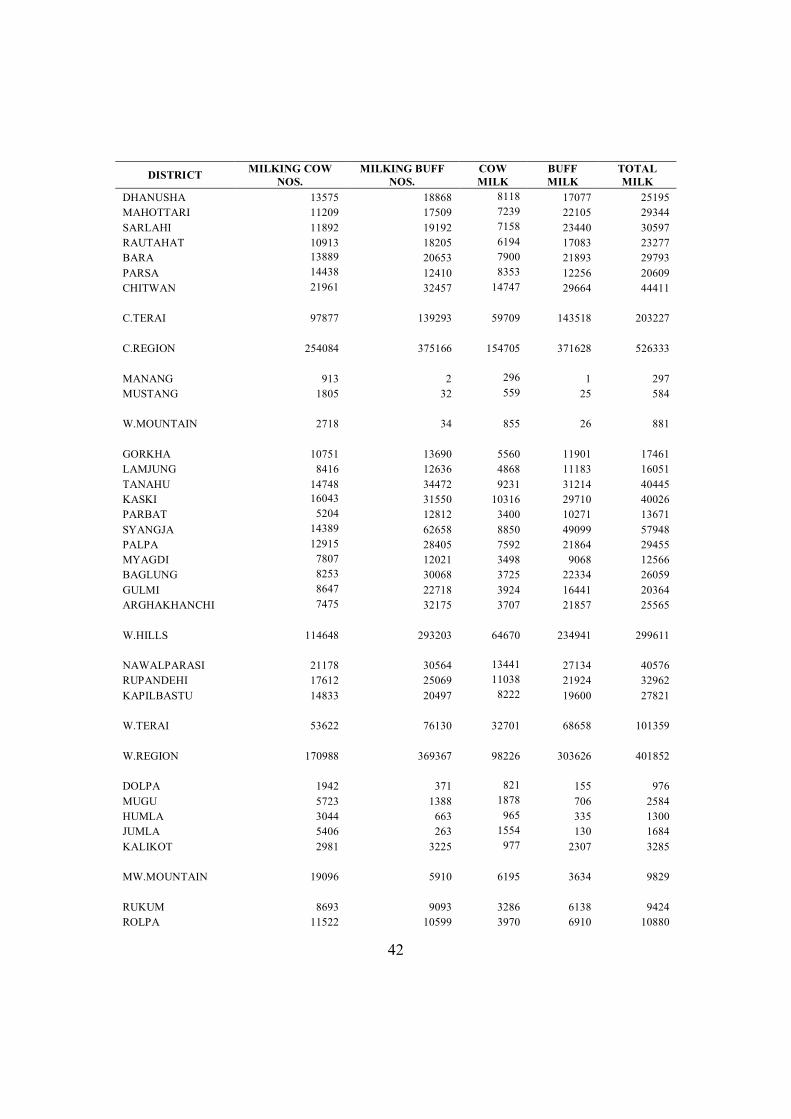
DISTRICT MILKING COW NOS.
MILKING BUFF NOS.
COW MILK
BUFF MILK
TOTAL MILK
DHANUSHA 13575 18868 8118 17077 25195 MAHOTTARI 11209 17509 7239 22105 29344 SARLAHI 11892 19192 7158 23440 30597 RAUTAHAT 10913 18205 6194 17083 23277 BARA 13889 20653 7900 21893 29793 PARSA 14438 12410 8353 12256 20609 CHITWAN 21961 32457 14747 29664 44411
C.TERAI 97877 139293 59709 143518 203227
C.REGION 254084 375166 154705 371628 526333
MANANG 913 2 296 1 297 MUSTANG 1805 32 559 25 584
W.MOUNTAIN 2718 34 855 26 881
GORKHA 10751 13690 5560 11901 17461 LAMJUNG 8416 12636 4868 11183 16051 TANAHU 14748 34472 9231 31214 40445 KASKI 16043 31550 10316 29710 40026 PARBAT 5204 12812 3400 10271 13671 SYANGJA 14389 62658 8850 49099 57948 PALPA 12915 28405 7592 21864 29455 MYAGDI 7807 12021 3498 9068 12566 BAGLUNG 8253 30068 3725 22334 26059 GULMI 8647 22718 3924 16441 20364 ARGHAKHANCHI 7475 32175 3707 21857 25565
W.HILLS 114648 293203 64670 234941 299611
NAWALPARASI 21178 30564 13441 27134 40576 RUPANDEHI 17612 25069 11038 21924 32962 KAPILBASTU 14833 20497 8222 19600 27821
W.TERAI 53622 76130 32701 68658 101359
W.REGION 170988 369367 98226 303626 401852
DOLPA 1942 371 821 155 976 MUGU 5723 1388 1878 706 2584 HUMLA 3044 663 965 335 1300 JUMLA 5406 263 1554 130 1684 KALIKOT 2981 3225 977 2307 3285
MW.MOUNTAIN 19096 5910 6195 3634 9829
RUKUM 8693 9093 3286 6138 9424 ROLPA 11522 10599 3970 6910 10880
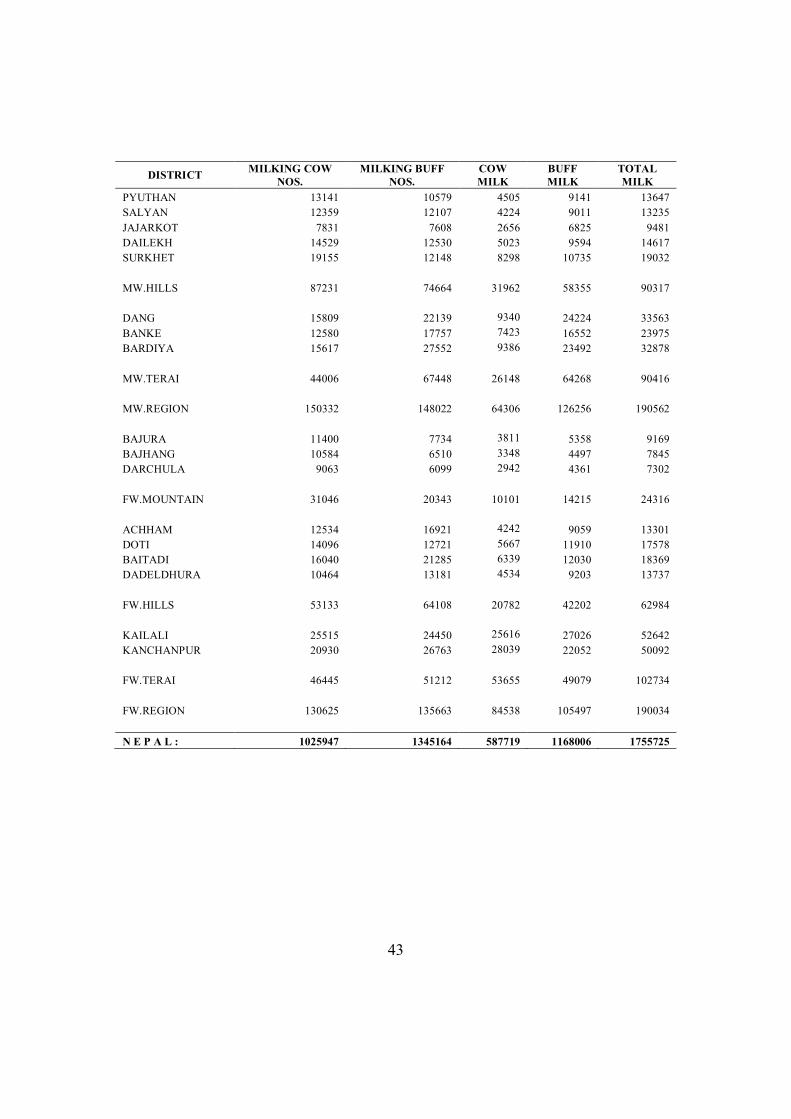
43
DISTRICT MILKING COW NOS.
MILKING BUFF NOS.
COW MILK
BUFF MILK
TOTAL MILK
PYUTHAN 13141 10579 4505 9141 13647 SALYAN 12359 12107 4224 9011 13235 JAJARKOT 7831 7608 2656 6825 9481 DAILEKH 14529 12530 5023 9594 14617 SURKHET 19155 12148 8298 10735 19032
MW.HILLS 87231 74664 31962 58355 90317
DANG 15809 22139 9340 24224 33563 BANKE 12580 17757 7423 16552 23975 BARDIYA 15617 27552 9386 23492 32878
MW.TERAI 44006 67448 26148 64268 90416
MW.REGION 150332 148022 64306 126256 190562
BAJURA 11400 7734 3811 5358 9169 BAJHANG 10584 6510 3348 4497 7845 DARCHULA 9063 6099 2942 4361 7302
FW.MOUNTAIN 31046 20343 10101 14215 24316
ACHHAM 12534 16921 4242 9059 13301 DOTI 14096 12721 5667 11910 17578 BAITADI 16040 21285 6339 12030 18369 DADELDHURA 10464 13181 4534 9203 13737
FW.HILLS 53133 64108 20782 42202 62984
KAILALI 25515 24450 25616 27026 52642 KANCHANPUR 20930 26763 28039 22052 50092
FW.TERAI 46445 51212 53655 49079 102734
FW.REGION 130625 135663 84538 105497 190034
N E P A L : 1025947 1345164 587719 1168006 1755725
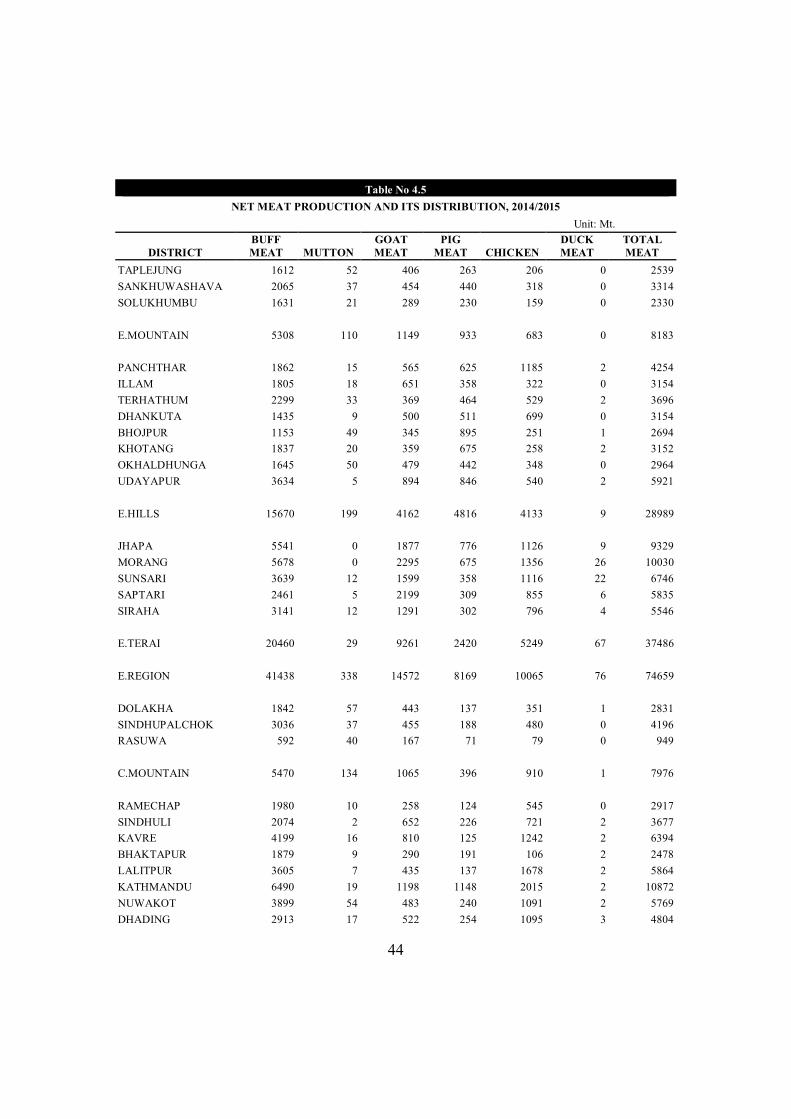
44
Table No 4.5
NET MEAT PRODUCTION AND ITS DISTRIBUTION, 2014/2015 Unit: Mt.
DISTRICT BUFF MEAT MUTTON
GOAT MEAT
PIG MEAT CHICKEN
DUCK MEAT
TOTAL MEAT
TAPLEJUNG 1612 52 406 263 206 0 2539 SANKHUWASHAVA 2065 37 454 440 318 0 3314 SOLUKHUMBU 1631 21 289 230 159 0 2330
E.MOUNTAIN 5308 110 1149 933 683 0 8183
PANCHTHAR 1862 15 565 625 1185 2 4254 ILLAM 1805 18 651 358 322 0 3154 TERHATHUM 2299 33 369 464 529 2 3696 DHANKUTA 1435 9 500 511 699 0 3154 BHOJPUR 1153 49 345 895 251 1 2694 KHOTANG 1837 20 359 675 258 2 3152 OKHALDHUNGA 1645 50 479 442 348 0 2964 UDAYAPUR 3634 5 894 846 540 2 5921
E.HILLS 15670 199 4162 4816 4133 9 28989
JHAPA 5541 0 1877 776 1126 9 9329 MORANG 5678 0 2295 675 1356 26 10030 SUNSARI 3639 12 1599 358 1116 22 6746 SAPTARI 2461 5 2199 309 855 6 5835 SIRAHA 3141 12 1291 302 796 4 5546
E.TERAI 20460 29 9261 2420 5249 67 37486
E.REGION 41438 338 14572 8169 10065 76 74659
DOLAKHA 1842 57 443 137 351 1 2831 SINDHUPALCHOK 3036 37 455 188 480 0 4196 RASUWA 592 40 167 71 79 0 949
C.MOUNTAIN 5470 134 1065 396 910 1 7976
RAMECHAP 1980 10 258 124 545 0 2917 SINDHULI 2074 2 652 226 721 2 3677 KAVRE 4199 16 810 125 1242 2 6394 BHAKTAPUR 1879 9 290 191 106 2 2478 LALITPUR 3605 7 435 137 1678 2 5864 KATHMANDU 6490 19 1198 1148 2015 2 10872 NUWAKOT 3899 54 483 240 1091 2 5769 DHADING 2913 17 522 254 1095 3 4804
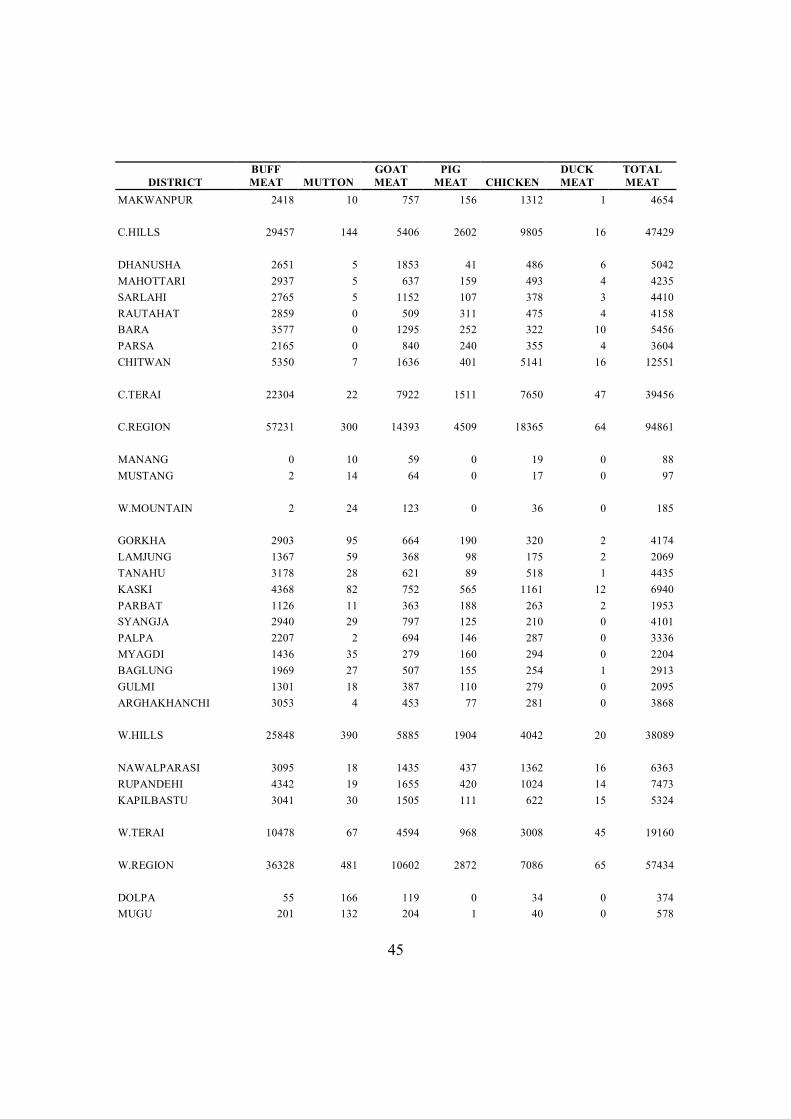
45
DISTRICT BUFF MEAT MUTTON
GOAT MEAT
PIG MEAT CHICKEN
DUCK MEAT
TOTAL MEAT
MAKWANPUR 2418 10 757 156 1312 1 4654
C.HILLS 29457 144 5406 2602 9805 16 47429
DHANUSHA 2651 5 1853 41 486 6 5042 MAHOTTARI 2937 5 637 159 493 4 4235 SARLAHI 2765 5 1152 107 378 3 4410 RAUTAHAT 2859 0 509 311 475 4 4158 BARA 3577 0 1295 252 322 10 5456 PARSA 2165 0 840 240 355 4 3604 CHITWAN 5350 7 1636 401 5141 16 12551
C.TERAI 22304 22 7922 1511 7650 47 39456
C.REGION 57231 300 14393 4509 18365 64 94861
MANANG 0 10 59 0 19 0 88 MUSTANG 2 14 64 0 17 0 97
W.MOUNTAIN 2 24 123 0 36 0 185
GORKHA 2903 95 664 190 320 2 4174 LAMJUNG 1367 59 368 98 175 2 2069 TANAHU 3178 28 621 89 518 1 4435 KASKI 4368 82 752 565 1161 12 6940 PARBAT 1126 11 363 188 263 2 1953 SYANGJA 2940 29 797 125 210 0 4101 PALPA 2207 2 694 146 287 0 3336 MYAGDI 1436 35 279 160 294 0 2204 BAGLUNG 1969 27 507 155 254 1 2913 GULMI 1301 18 387 110 279 0 2095 ARGHAKHANCHI 3053 4 453 77 281 0 3868
W.HILLS 25848 390 5885 1904 4042 20 38089
NAWALPARASI 3095 18 1435 437 1362 16 6363 RUPANDEHI 4342 19 1655 420 1024 14 7473 KAPILBASTU 3041 30 1505 111 622 15 5324
W.TERAI 10478 67 4594 968 3008 45 19160
W.REGION 36328 481 10602 2872 7086 65 57434
DOLPA 55 166 119 0 34 0 374 MUGU 201 132 204 1 40 0 578
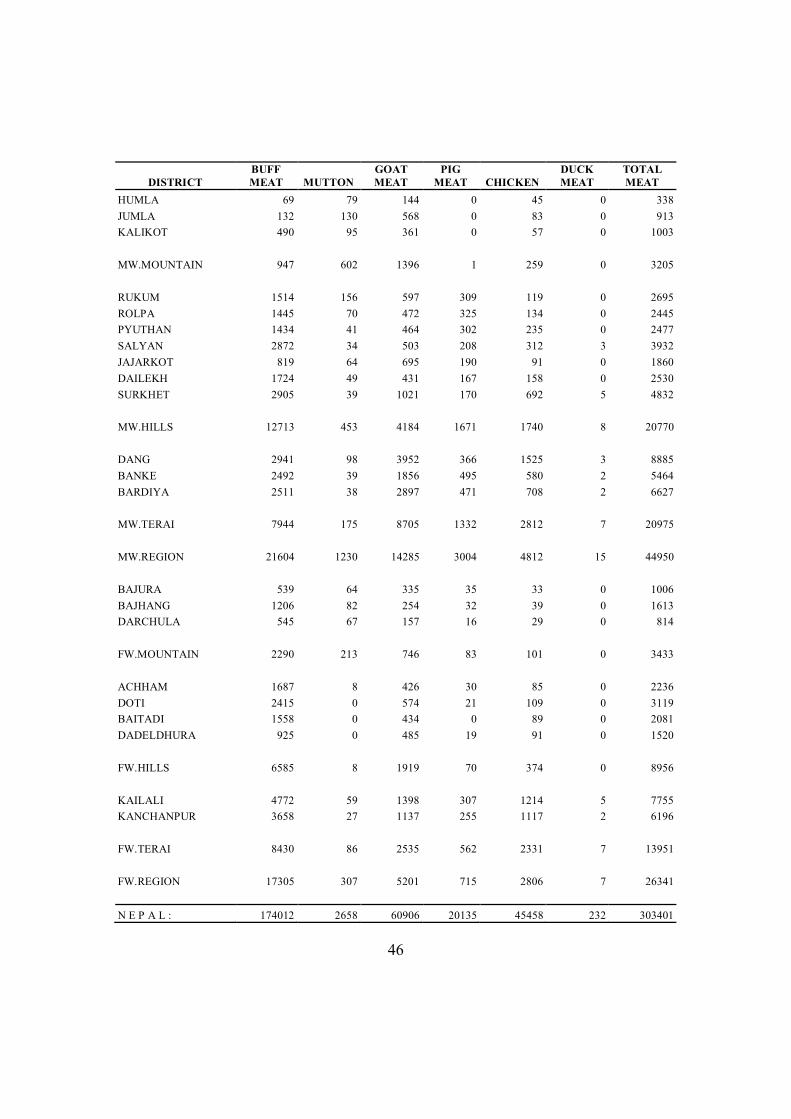
46
DISTRICT BUFF MEAT MUTTON
GOAT MEAT
PIG MEAT CHICKEN
DUCK MEAT
TOTAL MEAT
HUMLA 69 79 144 0 45 0 338 JUMLA 132 130 568 0 83 0 913 KALIKOT 490 95 361 0 57 0 1003
MW.MOUNTAIN 947 602 1396 1 259 0 3205
RUKUM 1514 156 597 309 119 0 2695 ROLPA 1445 70 472 325 134 0 2445 PYUTHAN 1434 41 464 302 235 0 2477 SALYAN 2872 34 503 208 312 3 3932 JAJARKOT 819 64 695 190 91 0 1860 DAILEKH 1724 49 431 167 158 0 2530 SURKHET 2905 39 1021 170 692 5 4832
MW.HILLS 12713 453 4184 1671 1740 8 20770
DANG 2941 98 3952 366 1525 3 8885 BANKE 2492 39 1856 495 580 2 5464 BARDIYA 2511 38 2897 471 708 2 6627
MW.TERAI 7944 175 8705 1332 2812 7 20975
MW.REGION 21604 1230 14285 3004 4812 15 44950
BAJURA 539 64 335 35 33 0 1006 BAJHANG 1206 82 254 32 39 0 1613 DARCHULA 545 67 157 16 29 0 814
FW.MOUNTAIN 2290 213 746 83 101 0 3433
ACHHAM 1687 8 426 30 85 0 2236 DOTI 2415 0 574 21 109 0 3119 BAITADI 1558 0 434 0 89 0 2081 DADELDHURA 925 0 485 19 91 0 1520
FW.HILLS 6585 8 1919 70 374 0 8956
KAILALI 4772 59 1398 307 1214 5 7755 KANCHANPUR 3658 27 1137 255 1117 2 6196
FW.TERAI 8430 86 2535 562 2331 7 13951
FW.REGION 17305 307 5201 715 2806 7 26341
N E P A L : 174012 2658 60906 20135 45458 232 303401
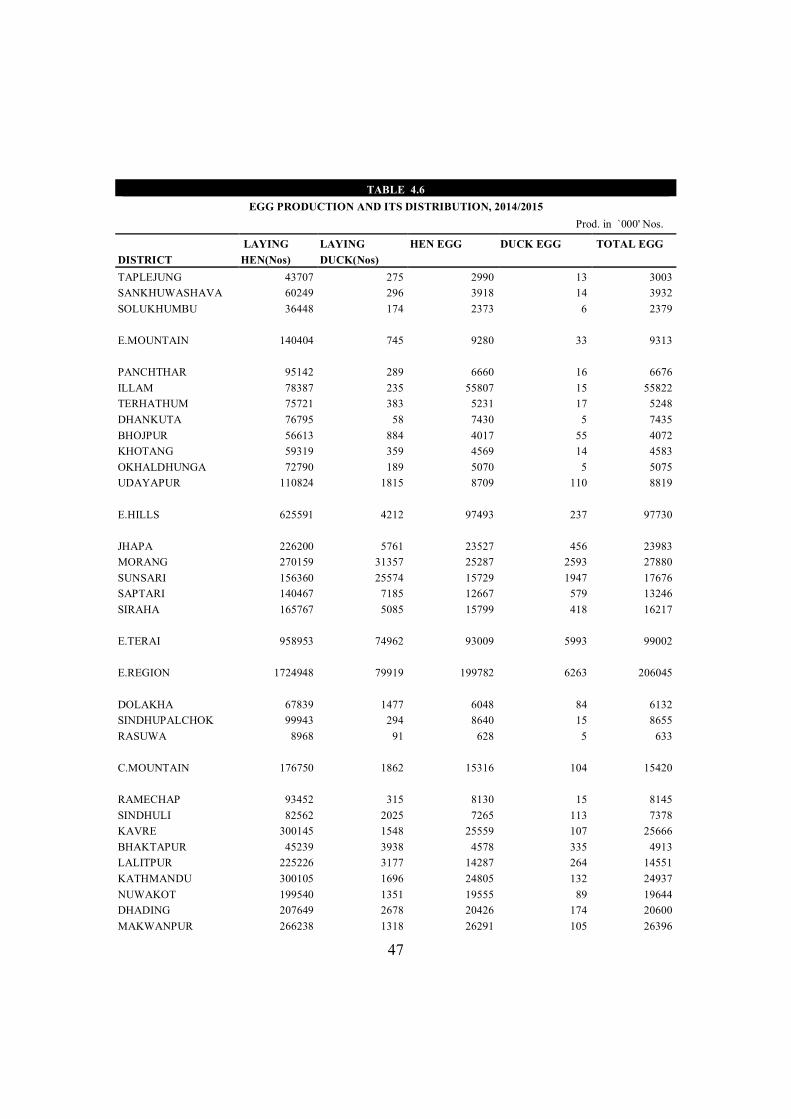
47
TABLE 4.6
EGG PRODUCTION AND ITS DISTRIBUTION, 2014/2015 Prod. in `000' Nos.
LAYING LAYING HEN EGG DUCK EGG TOTAL EGG DISTRICT HEN(Nos) DUCK(Nos) TAPLEJUNG 43707 275 2990 13 3003 SANKHUWASHAVA 60249 296 3918 14 3932 SOLUKHUMBU 36448 174 2373 6 2379
E.MOUNTAIN 140404 745 9280 33 9313
PANCHTHAR 95142 289 6660 16 6676 ILLAM 78387 235 55807 15 55822 TERHATHUM 75721 383 5231 17 5248 DHANKUTA 76795 58 7430 5 7435 BHOJPUR 56613 884 4017 55 4072 KHOTANG 59319 359 4569 14 4583 OKHALDHUNGA 72790 189 5070 5 5075 UDAYAPUR 110824 1815 8709 110 8819
E.HILLS 625591 4212 97493 237 97730
JHAPA 226200 5761 23527 456 23983 MORANG 270159 31357 25287 2593 27880 SUNSARI 156360 25574 15729 1947 17676 SAPTARI 140467 7185 12667 579 13246 SIRAHA 165767 5085 15799 418 16217
E.TERAI 958953 74962 93009 5993 99002
E.REGION 1724948 79919 199782 6263 206045
DOLAKHA 67839 1477 6048 84 6132 SINDHUPALCHOK 99943 294 8640 15 8655 RASUWA 8968 91 628 5 633
C.MOUNTAIN 176750 1862 15316 104 15420
RAMECHAP 93452 315 8130 15 8145 SINDHULI 82562 2025 7265 113 7378 KAVRE 300145 1548 25559 107 25666 BHAKTAPUR 45239 3938 4578 335 4913 LALITPUR 225226 3177 14287 264 14551 KATHMANDU 300105 1696 24805 132 24937 NUWAKOT 199540 1351 19555 89 19644 DHADING 207649 2678 20426 174 20600 MAKWANPUR 266238 1318 26291 105 26396
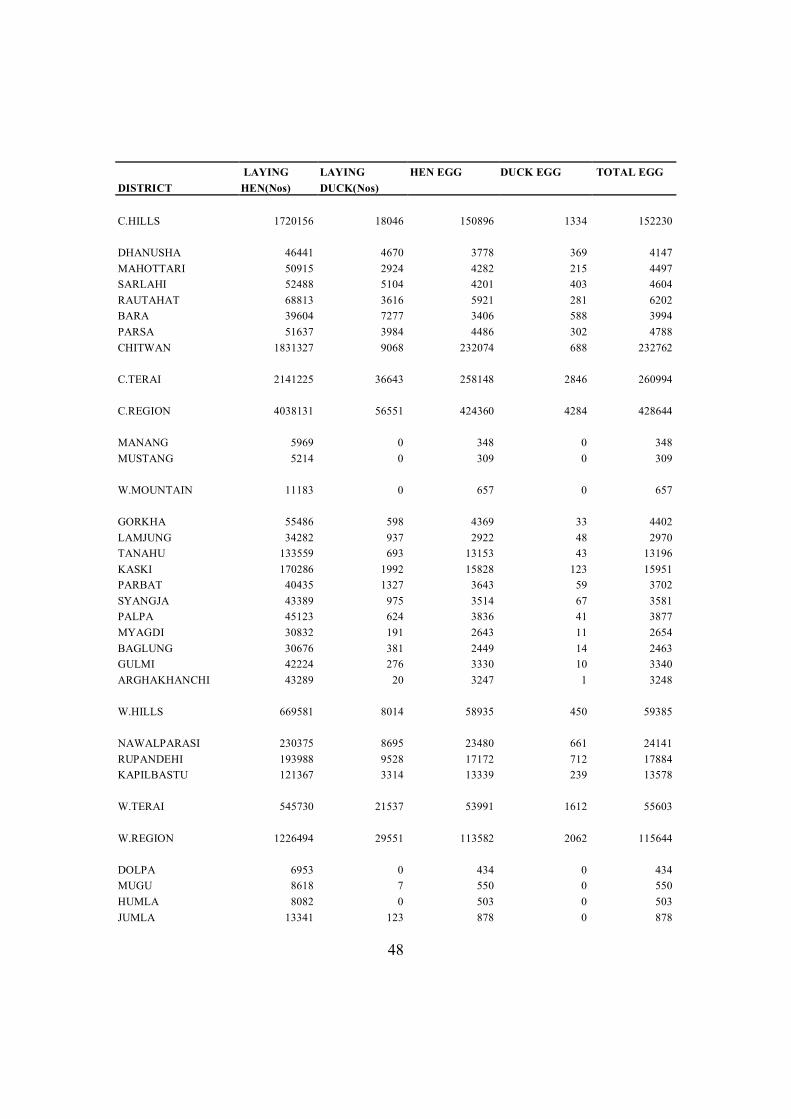
48
LAYING LAYING HEN EGG DUCK EGG TOTAL EGG DISTRICT HEN(Nos) DUCK(Nos)
C.HILLS 1720156 18046 150896 1334 152230
DHANUSHA 46441 4670 3778 369 4147 MAHOTTARI 50915 2924 4282 215 4497 SARLAHI 52488 5104 4201 403 4604 RAUTAHAT 68813 3616 5921 281 6202 BARA 39604 7277 3406 588 3994 PARSA 51637 3984 4486 302 4788 CHITWAN 1831327 9068 232074 688 232762
C.TERAI 2141225 36643 258148 2846 260994
C.REGION 4038131 56551 424360 4284 428644
MANANG 5969 0 348 0 348 MUSTANG 5214 0 309 0 309
W.MOUNTAIN 11183 0 657 0 657
GORKHA 55486 598 4369 33 4402 LAMJUNG 34282 937 2922 48 2970 TANAHU 133559 693 13153 43 13196 KASKI 170286 1992 15828 123 15951 PARBAT 40435 1327 3643 59 3702 SYANGJA 43389 975 3514 67 3581 PALPA 45123 624 3836 41 3877 MYAGDI 30832 191 2643 11 2654 BAGLUNG 30676 381 2449 14 2463 GULMI 42224 276 3330 10 3340 ARGHAKHANCHI 43289 20 3247 1 3248
W.HILLS 669581 8014 58935 450 59385
NAWALPARASI 230375 8695 23480 661 24141 RUPANDEHI 193988 9528 17172 712 17884 KAPILBASTU 121367 3314 13339 239 13578
W.TERAI 545730 21537 53991 1612 55603
W.REGION 1226494 29551 113582 2062 115644
DOLPA 6953 0 434 0 434 MUGU 8618 7 550 0 550 HUMLA 8082 0 503 0 503 JUMLA 13341 123 878 0 878
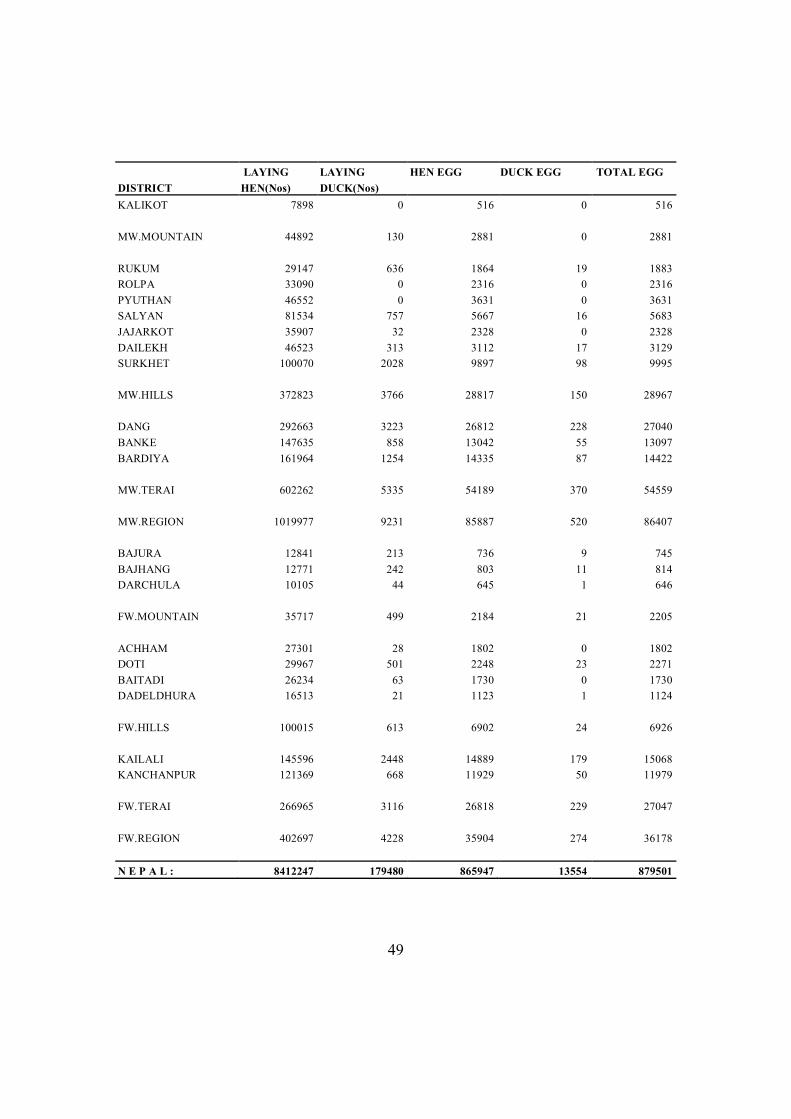
49
LAYING LAYING HEN EGG DUCK EGG TOTAL EGG DISTRICT HEN(Nos) DUCK(Nos) KALIKOT 7898 0 516 0 516
MW.MOUNTAIN 44892 130 2881 0 2881
RUKUM 29147 636 1864 19 1883 ROLPA 33090 0 2316 0 2316 PYUTHAN 46552 0 3631 0 3631 SALYAN 81534 757 5667 16 5683 JAJARKOT 35907 32 2328 0 2328 DAILEKH 46523 313 3112 17 3129 SURKHET 100070 2028 9897 98 9995
MW.HILLS 372823 3766 28817 150 28967
DANG 292663 3223 26812 228 27040 BANKE 147635 858 13042 55 13097 BARDIYA 161964 1254 14335 87 14422 MW.TERAI 602262 5335 54189 370 54559
MW.REGION 1019977 9231 85887 520 86407
BAJURA 12841 213 736 9 745 BAJHANG 12771 242 803 11 814 DARCHULA 10105 44 645 1 646
FW.MOUNTAIN 35717 499 2184 21 2205
ACHHAM 27301 28 1802 0 1802 DOTI 29967 501 2248 23 2271 BAITADI 26234 63 1730 0 1730 DADELDHURA 16513 21 1123 1 1124
FW.HILLS 100015 613 6902 24 6926
KAILALI 145596 2448 14889 179 15068 KANCHANPUR 121369 668 11929 50 11979
FW.TERAI 266965 3116 26818 229 27047
FW.REGION 402697 4228 35904 274 36178
N E P A L : 8412247 179480 865947 13554 879501
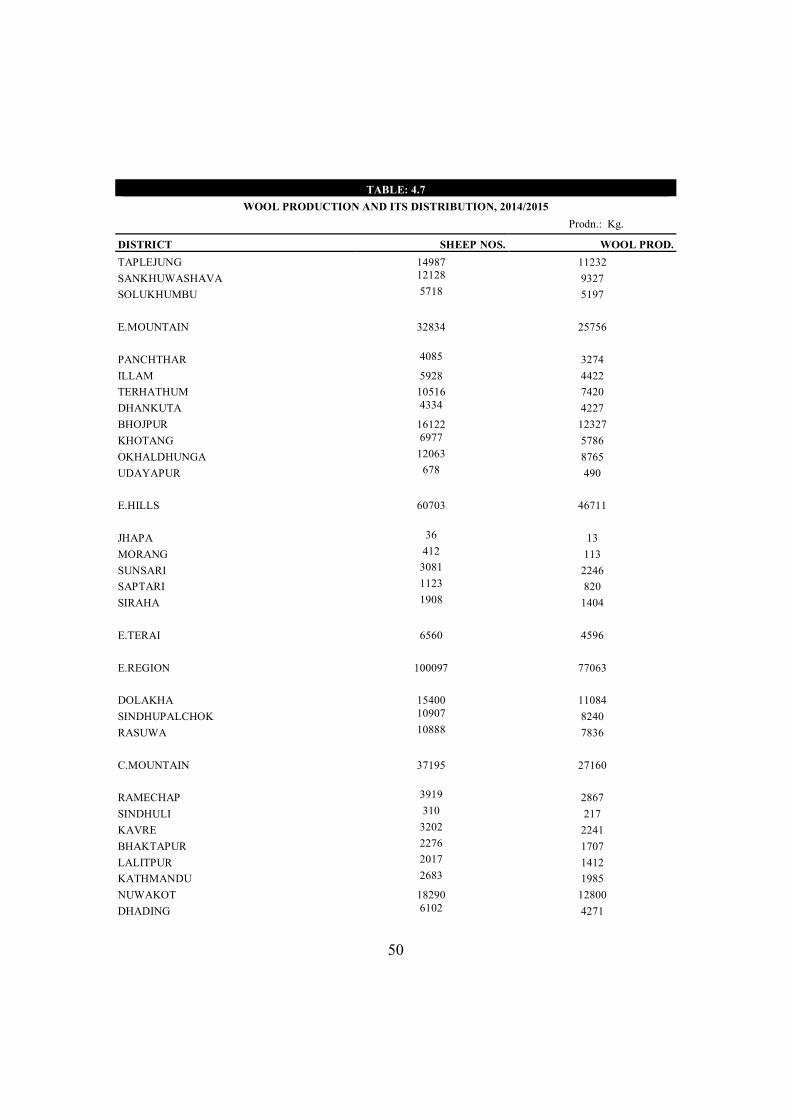
50
TABLE: 4.7
WOOL PRODUCTION AND ITS DISTRIBUTION, 2014/2015 Prodn.: Kg.
DISTRICT SHEEP NOS. WOOL PROD. TAPLEJUNG 14987 11232 SANKHUWASHAVA 12128 9327 SOLUKHUMBU 5718 5197
E.MOUNTAIN 32834 25756
PANCHTHAR 4085 3274 ILLAM 5928 4422 TERHATHUM 10516 7420 DHANKUTA 4334 4227 BHOJPUR 16122 12327 KHOTANG 6977 5786 OKHALDHUNGA 12063 8765 UDAYAPUR 678 490
E.HILLS 60703 46711
JHAPA 36 13 MORANG 412 113 SUNSARI 3081 2246 SAPTARI 1123 820 SIRAHA 1908 1404
E.TERAI 6560 4596
E.REGION 100097 77063
DOLAKHA 15400 11084 SINDHUPALCHOK 10907 8240 RASUWA 10888 7836
C.MOUNTAIN 37195 27160
RAMECHAP 3919 2867 SINDHULI 310 217 KAVRE 3202 2241 BHAKTAPUR 2276 1707 LALITPUR 2017 1412 KATHMANDU 2683 1985 NUWAKOT 18290 12800 DHADING 6102 4271
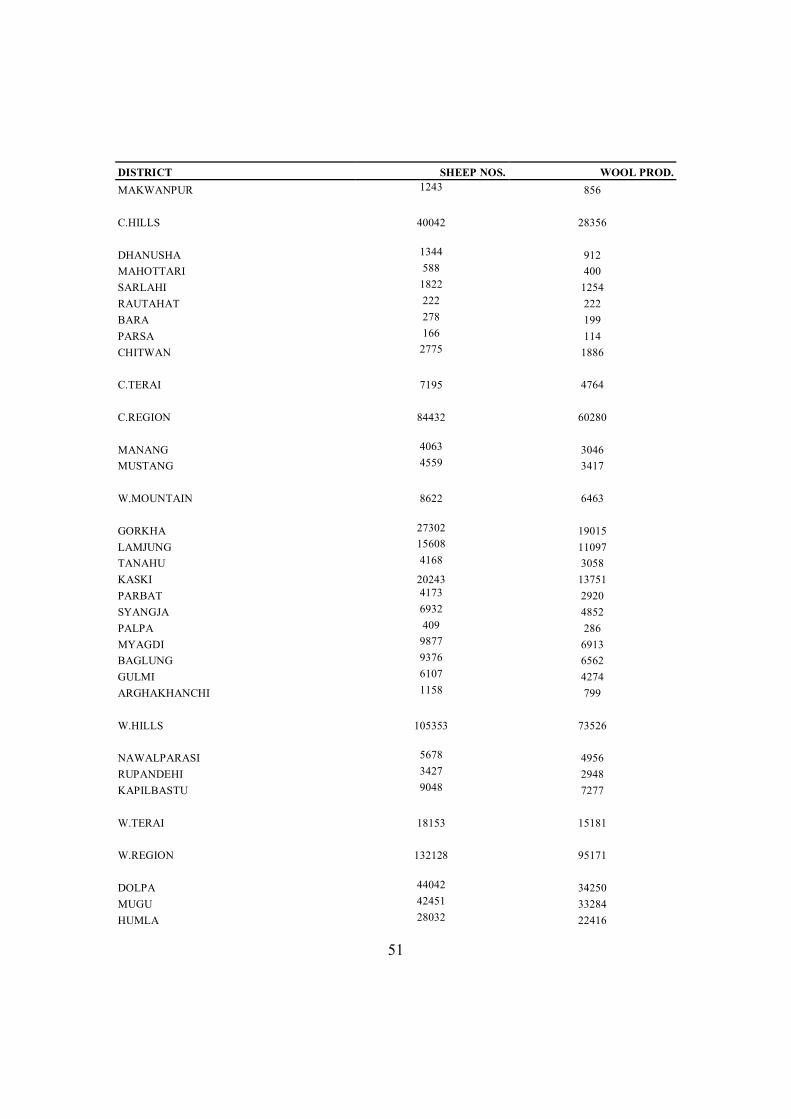
51
DISTRICT SHEEP NOS. WOOL PROD. MAKWANPUR 1243 856
C.HILLS 40042 28356
DHANUSHA 1344 912 MAHOTTARI 588 400 SARLAHI 1822 1254 RAUTAHAT 222 222 BARA 278 199 PARSA 166 114 CHITWAN 2775 1886
C.TERAI 7195 4764
C.REGION 84432 60280
MANANG 4063 3046 MUSTANG 4559 3417
W.MOUNTAIN 8622 6463
GORKHA 27302 19015 LAMJUNG 15608 11097 TANAHU 4168 3058 KASKI 20243 13751 PARBAT 4173 2920 SYANGJA 6932 4852 PALPA 409 286 MYAGDI 9877 6913 BAGLUNG 9376 6562 GULMI 6107 4274 ARGHAKHANCHI 1158 799
W.HILLS 105353 73526
NAWALPARASI 5678 4956 RUPANDEHI 3427 2948 KAPILBASTU 9048 7277
W.TERAI 18153 15181
W.REGION 132128 95171
DOLPA 44042 34250 MUGU 42451 33284 HUMLA 28032 22416
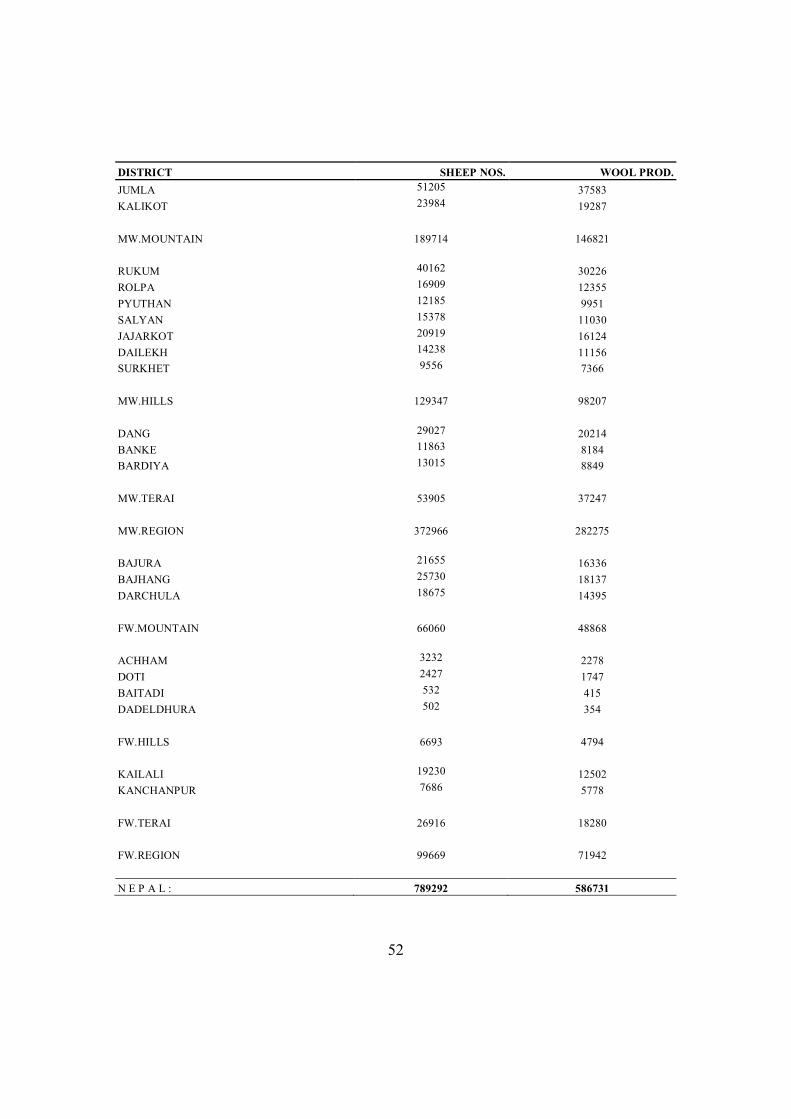
52
DISTRICT SHEEP NOS. WOOL PROD. JUMLA 51205 37583 KALIKOT 23984 19287
MW.MOUNTAIN 189714 146821
RUKUM 40162 30226 ROLPA 16909 12355 PYUTHAN 12185 9951 SALYAN 15378 11030 JAJARKOT 20919 16124 DAILEKH 14238 11156 SURKHET 9556 7366
MW.HILLS 129347 98207
DANG 29027 20214 BANKE 11863 8184 BARDIYA 13015 8849
MW.TERAI 53905 37247
MW.REGION 372966 282275
BAJURA 21655 16336 BAJHANG 25730 18137 DARCHULA 18675 14395
FW.MOUNTAIN 66060 48868
ACHHAM 3232 2278 DOTI 2427 1747 BAITADI 532 415 DADELDHURA 502 354
FW.HILLS 6693 4794
KAILALI 19230 12502 KANCHANPUR 7686 5778
FW.TERAI 26916 18280
FW.REGION 99669 71942
N E P A L : 789292 586731
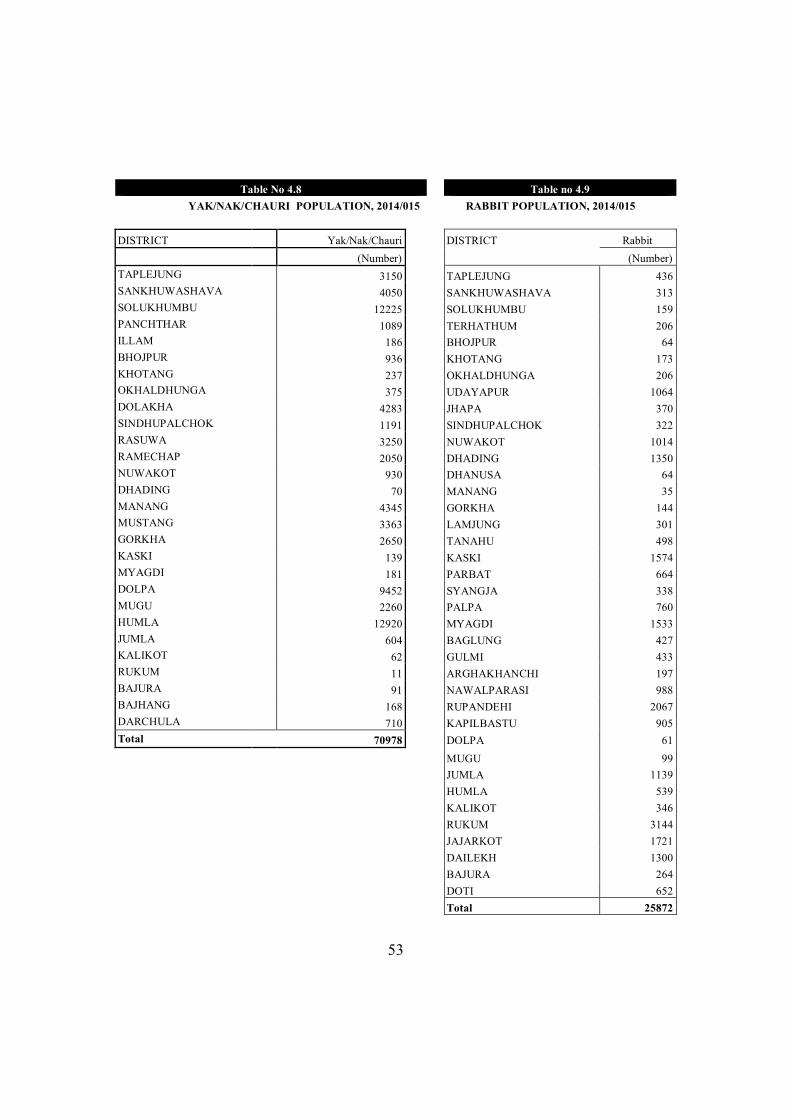
53
Table No 4.8 Table no 4.9
YAK/NAK/CHAURI POPULATION, 2014/015 RABBIT POPULATION, 2014/015
DISTRICT Yak/Nak/Chauri DISTRICT Rabbit (Number) (Number) TAPLEJUNG 3150 TAPLEJUNG 436 SANKHUWASHAVA 4050 SANKHUWASHAVA 313 SOLUKHUMBU 12225 SOLUKHUMBU 159 PANCHTHAR 1089 TERHATHUM 206 ILLAM 186 BHOJPUR 64 BHOJPUR 936 KHOTANG 173 KHOTANG 237 OKHALDHUNGA 206 OKHALDHUNGA 375 UDAYAPUR 1064 DOLAKHA 4283 JHAPA 370 SINDHUPALCHOK 1191 SINDHUPALCHOK 322 RASUWA 3250 NUWAKOT 1014 RAMECHAP 2050 DHADING 1350 NUWAKOT 930 DHANUSA 64 DHADING 70 MANANG 35 MANANG 4345 GORKHA 144 MUSTANG 3363 LAMJUNG 301 GORKHA 2650 TANAHU 498 KASKI 139 KASKI 1574 MYAGDI 181 PARBAT 664 DOLPA 9452 SYANGJA 338 MUGU 2260 PALPA 760 HUMLA 12920 MYAGDI 1533 JUMLA 604 BAGLUNG 427 KALIKOT 62 GULMI 433 RUKUM 11 ARGHAKHANCHI 197 BAJURA 91 NAWALPARASI 988 BAJHANG 168 RUPANDEHI 2067 DARCHULA 710 KAPILBASTU 905 Total 70978 DOLPA 61
MUGU 99 JUMLA 1139 HUMLA 539 KALIKOT 346 RUKUM 3144 JAJARKOT 1721 DAILEKH 1300 BAJURA 264 DOTI 652 Total 25872
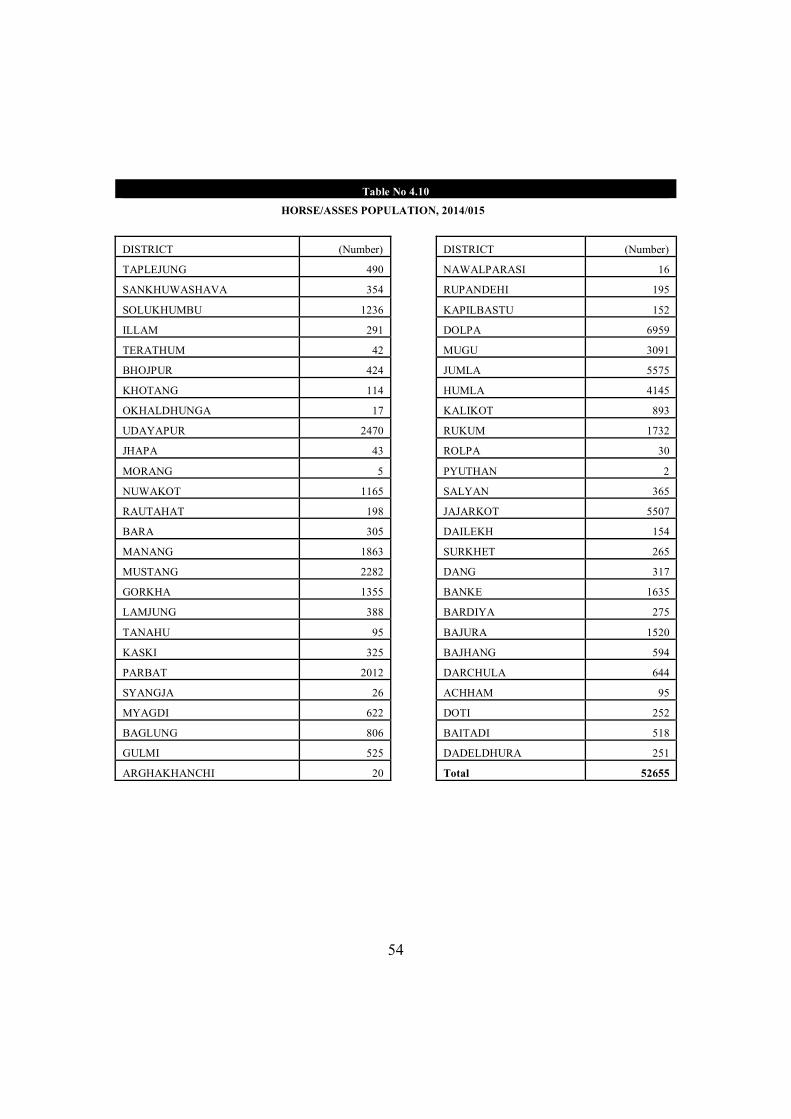
54
Table No 4.10
HORSE/ASSES POPULATION, 2014/015
DISTRICT (Number) DISTRICT (Number)
TAPLEJUNG 490 NAWALPARASI 16
SANKHUWASHAVA 354 RUPANDEHI 195
SOLUKHUMBU 1236 KAPILBASTU 152
ILLAM 291 DOLPA 6959
TERATHUM 42 MUGU 3091
BHOJPUR 424 JUMLA 5575
KHOTANG 114 HUMLA 4145
OKHALDHUNGA 17 KALIKOT 893
UDAYAPUR 2470 RUKUM 1732
JHAPA 43 ROLPA 30
MORANG 5 PYUTHAN 2
NUWAKOT 1165 SALYAN 365
RAUTAHAT 198 JAJARKOT 5507
BARA 305 DAILEKH 154
MANANG 1863 SURKHET 265
MUSTANG 2282 DANG 317
GORKHA 1355 BANKE 1635
LAMJUNG 388 BARDIYA 275
TANAHU 95 BAJURA 1520
KASKI 325 BAJHANG 594
PARBAT 2012 DARCHULA 644
SYANGJA 26 ACHHAM 95
MYAGDI 622 DOTI 252
BAGLUNG 806 BAITADI 518
GULMI 525 DADELDHURA 251
ARGHAKHANCHI 20 Total 52655
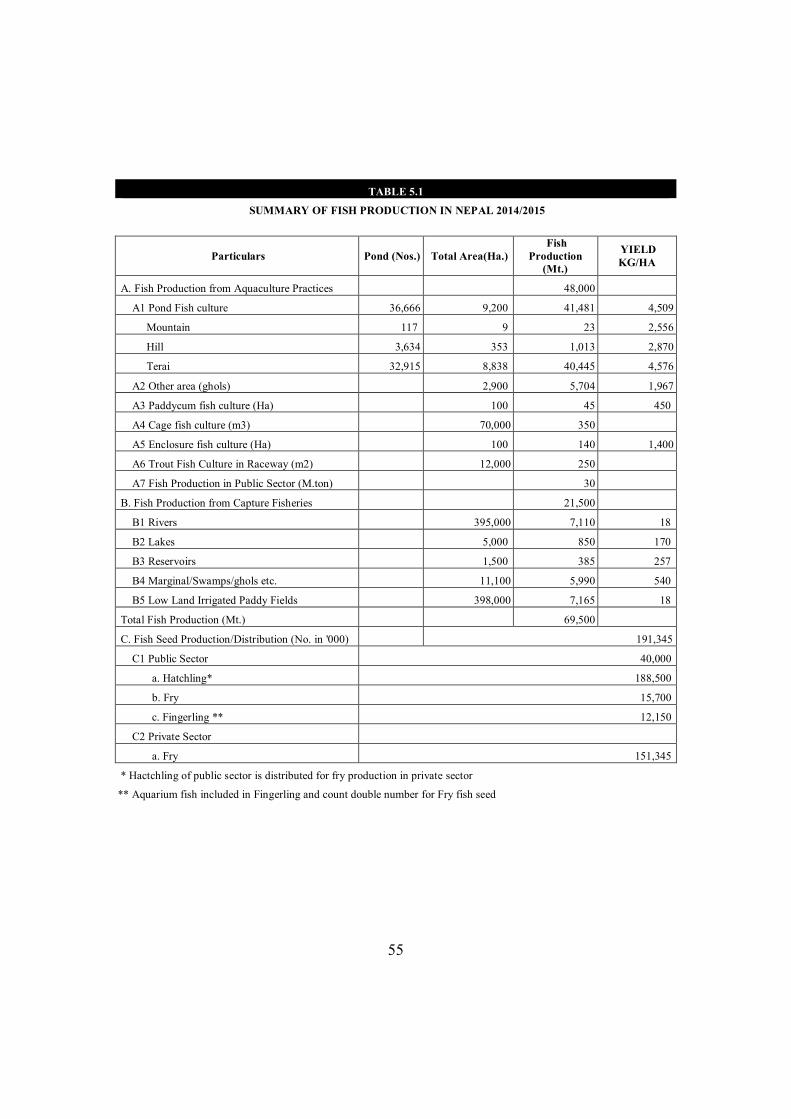
55
TABLE 5.1
SUMMARY OF FISH PRODUCTION IN NEPAL 2014/2015
Particulars Pond (Nos.) Total Area(Ha.) Fish
Production (Mt.)
YIELD KG/HA
A. Fish Production from Aquaculture Practices 48,000
A1 Pond Fish culture 36,666 9,200 41,481 4,509
Mountain 117 9 23 2,556
Hill 3,634 353 1,013 2,870
Terai 32,915 8,838 40,445 4,576
A2 Other area (ghols) 2,900 5,704 1,967
A3 Paddycum fish culture (Ha) 100 45 450
A4 Cage fish culture (m3) 70,000 350
A5 Enclosure fish culture (Ha) 100 140 1,400
A6 Trout Fish Culture in Raceway (m2) 12,000 250
A7 Fish Production in Public Sector (M.ton) 30
B. Fish Production from Capture Fisheries 21,500
B1 Rivers 395,000 7,110 18
B2 Lakes 5,000 850 170
B3 Reservoirs 1,500 385 257
B4 Marginal/Swamps/ghols etc. 11,100 5,990 540
B5 Low Land Irrigated Paddy Fields 398,000 7,165 18
Total Fish Production (Mt.) 69,500
C. Fish Seed Production/Distribution (No. in '000) 191,345
C1 Public Sector 40,000
a. Hatchling* 188,500
b. Fry 15,700
c. Fingerling ** 12,150
C2 Private Sector
a. Fry 151,345
* Hactchling of public sector is distributed for fry production in private sector
** Aquarium fish included in Fingerling and count double number for Fry fish seed
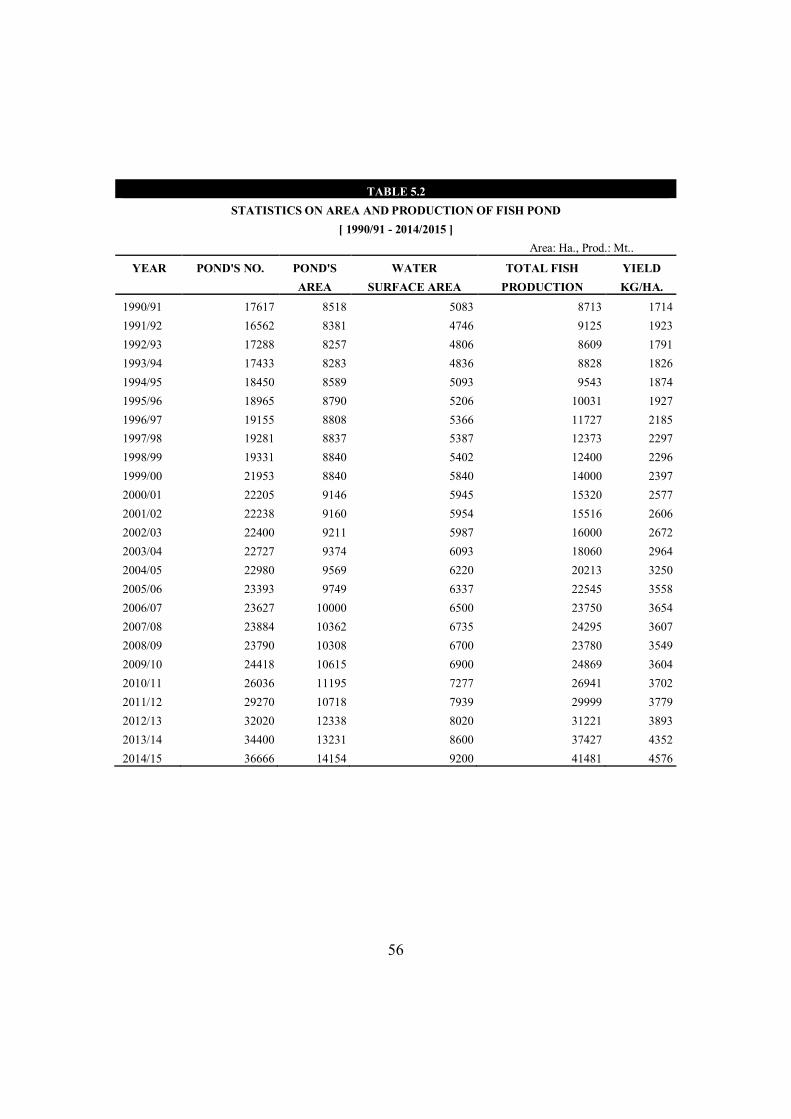
56
TABLE 5.2
STATISTICS ON AREA AND PRODUCTION OF FISH POND [ 1990/91 - 2014/2015 ]
Area: Ha., Prod.: Mt..
YEAR POND'S NO. POND'S WATER TOTAL FISH YIELD AREA SURFACE AREA PRODUCTION KG/HA.
1990/91 17617 8518 5083 8713 1714 1991/92 16562 8381 4746 9125 1923 1992/93 17288 8257 4806 8609 1791 1993/94 17433 8283 4836 8828 1826 1994/95 18450 8589 5093 9543 1874 1995/96 18965 8790 5206 10031 1927 1996/97 19155 8808 5366 11727 2185 1997/98 19281 8837 5387 12373 2297 1998/99 19331 8840 5402 12400 2296 1999/00 21953 8840 5840 14000 2397 2000/01 22205 9146 5945 15320 2577 2001/02 22238 9160 5954 15516 2606 2002/03 22400 9211 5987 16000 2672 2003/04 22727 9374 6093 18060 2964 2004/05 22980 9569 6220 20213 3250 2005/06 23393 9749 6337 22545 3558 2006/07 23627 10000 6500 23750 3654 2007/08 23884 10362 6735 24295 3607 2008/09 23790 10308 6700 23780 3549 2009/10 24418 10615 6900 24869 3604 2010/11 26036 11195 7277 26941 3702 2011/12 29270 10718 7939 29999 3779 2012/13 32020 12338 8020 31221 3893 2013/14 34400 13231 8600 37427 4352 2014/15 36666 14154 9200 41481 4576
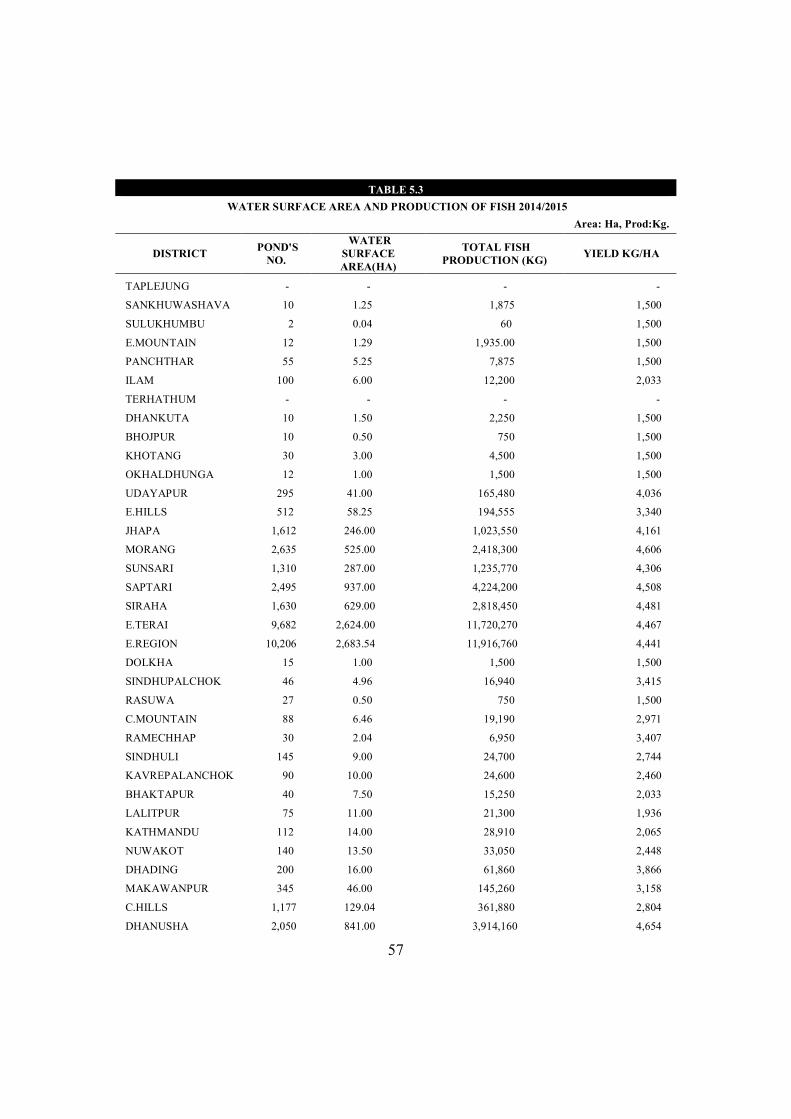
57
TABLE 5.3
WATER SURFACE AREA AND PRODUCTION OF FISH 2014/2015 Area: Ha, Prod:Kg.
DISTRICT POND'S NO.
WATER SURFACE AREA(HA)
TOTAL FISH PRODUCTION (KG) YIELD KG/HA
TAPLEJUNG - - - -
SANKHUWASHAVA 10 1.25 1,875 1,500
SULUKHUMBU 2 0.04 60 1,500
E.MOUNTAIN 12 1.29 1,935.00 1,500
PANCHTHAR 55 5.25 7,875 1,500
ILAM 100 6.00 12,200 2,033
TERHATHUM - - - -
DHANKUTA 10 1.50 2,250 1,500
BHOJPUR 10 0.50 750 1,500
KHOTANG 30 3.00 4,500 1,500
OKHALDHUNGA 12 1.00 1,500 1,500
UDAYAPUR 295 41.00 165,480 4,036
E.HILLS 512 58.25 194,555 3,340
JHAPA 1,612 246.00 1,023,550 4,161
MORANG 2,635 525.00 2,418,300 4,606
SUNSARI 1,310 287.00 1,235,770 4,306
SAPTARI 2,495 937.00 4,224,200 4,508
SIRAHA 1,630 629.00 2,818,450 4,481
E.TERAI 9,682 2,624.00 11,720,270 4,467
E.REGION 10,206 2,683.54 11,916,760 4,441
DOLKHA 15 1.00 1,500 1,500
SINDHUPALCHOK 46 4.96 16,940 3,415
RASUWA 27 0.50 750 1,500
C.MOUNTAIN 88 6.46 19,190 2,971
RAMECHHAP 30 2.04 6,950 3,407
SINDHULI 145 9.00 24,700 2,744
KAVREPALANCHOK 90 10.00 24,600 2,460
BHAKTAPUR 40 7.50 15,250 2,033
LALITPUR 75 11.00 21,300 1,936
KATHMANDU 112 14.00 28,910 2,065
NUWAKOT 140 13.50 33,050 2,448
DHADING 200 16.00 61,860 3,866
MAKAWANPUR 345 46.00 145,260 3,158
C.HILLS 1,177 129.04 361,880 2,804
DHANUSHA 2,050 841.00 3,914,160 4,654
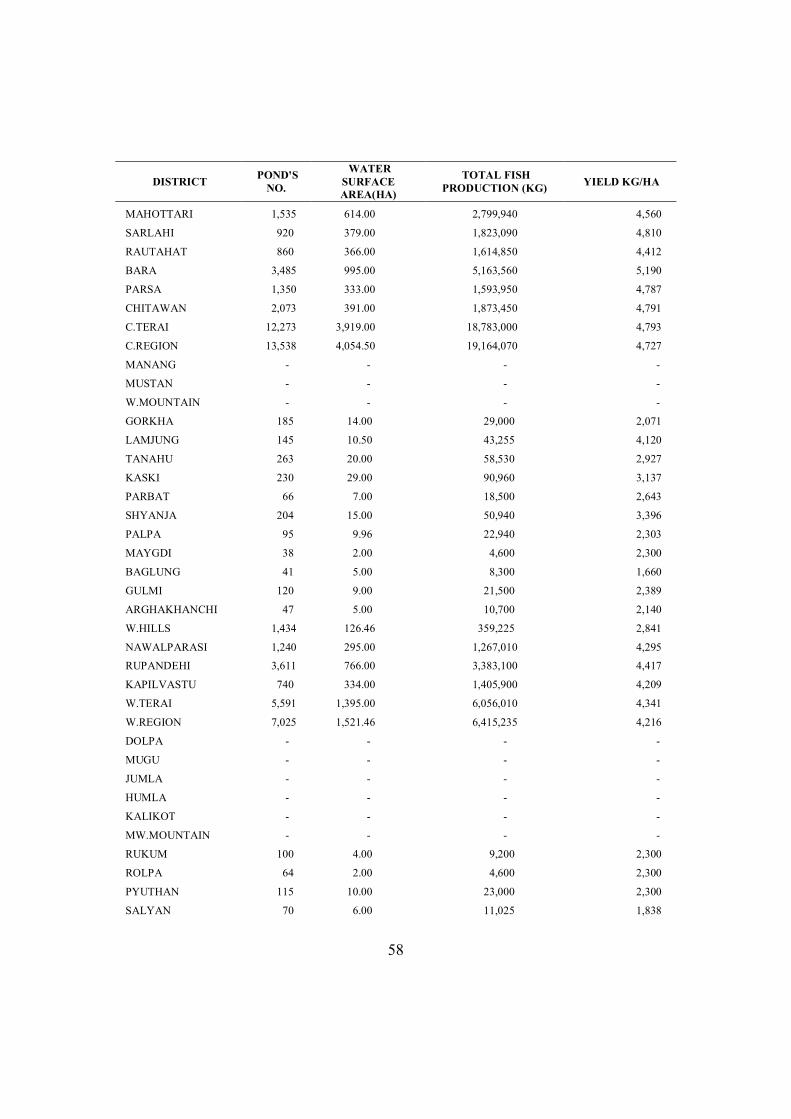
58
DISTRICT POND'S NO.
WATER SURFACE AREA(HA)
TOTAL FISH PRODUCTION (KG) YIELD KG/HA
MAHOTTARI 1,535 614.00 2,799,940 4,560
SARLAHI 920 379.00 1,823,090 4,810
RAUTAHAT 860 366.00 1,614,850 4,412
BARA 3,485 995.00 5,163,560 5,190
PARSA 1,350 333.00 1,593,950 4,787
CHITAWAN 2,073 391.00 1,873,450 4,791
C.TERAI 12,273 3,919.00 18,783,000 4,793
C.REGION 13,538 4,054.50 19,164,070 4,727
MANANG - - - -
MUSTAN - - - -
W.MOUNTAIN - - - -
GORKHA 185 14.00 29,000 2,071
LAMJUNG 145 10.50 43,255 4,120
TANAHU 263 20.00 58,530 2,927
KASKI 230 29.00 90,960 3,137
PARBAT 66 7.00 18,500 2,643
SHYANJA 204 15.00 50,940 3,396
PALPA 95 9.96 22,940 2,303
MAYGDI 38 2.00 4,600 2,300
BAGLUNG 41 5.00 8,300 1,660
GULMI 120 9.00 21,500 2,389
ARGHAKHANCHI 47 5.00 10,700 2,140
W.HILLS 1,434 126.46 359,225 2,841
NAWALPARASI 1,240 295.00 1,267,010 4,295
RUPANDEHI 3,611 766.00 3,383,100 4,417
KAPILVASTU 740 334.00 1,405,900 4,209
W.TERAI 5,591 1,395.00 6,056,010 4,341
W.REGION 7,025 1,521.46 6,415,235 4,216
DOLPA - - - -
MUGU - - - -
JUMLA - - - -
HUMLA - - - -
KALIKOT - - - -
MW.MOUNTAIN - - - -
RUKUM 100 4.00 9,200 2,300
ROLPA 64 2.00 4,600 2,300
PYUTHAN 115 10.00 23,000 2,300
SALYAN 70 6.00 11,025 1,838
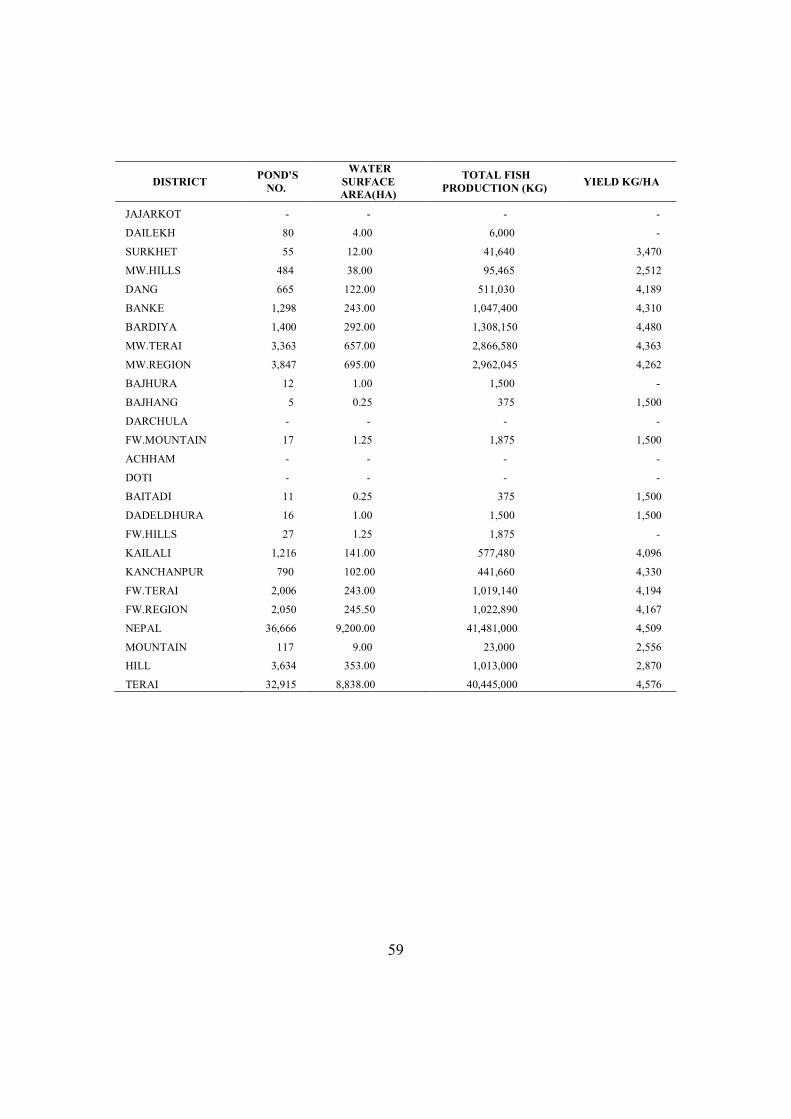
59
DISTRICT POND'S NO.
WATER SURFACE AREA(HA)
TOTAL FISH PRODUCTION (KG) YIELD KG/HA
JAJARKOT - - - -
DAILEKH 80 4.00 6,000 -
SURKHET 55 12.00 41,640 3,470
MW.HILLS 484 38.00 95,465 2,512
DANG 665 122.00 511,030 4,189
BANKE 1,298 243.00 1,047,400 4,310
BARDIYA 1,400 292.00 1,308,150 4,480
MW.TERAI 3,363 657.00 2,866,580 4,363
MW.REGION 3,847 695.00 2,962,045 4,262
BAJHURA 12 1.00 1,500 -
BAJHANG 5 0.25 375 1,500
DARCHULA - - - -
FW.MOUNTAIN 17 1.25 1,875 1,500
ACHHAM - - - -
DOTI - - - -
BAITADI 11 0.25 375 1,500
DADELDHURA 16 1.00 1,500 1,500
FW.HILLS 27 1.25 1,875 -
KAILALI 1,216 141.00 577,480 4,096
KANCHANPUR 790 102.00 441,660 4,330
FW.TERAI 2,006 243.00 1,019,140 4,194
FW.REGION 2,050 245.50 1,022,890 4,167
NEPAL 36,666 9,200.00 41,481,000 4,509
MOUNTAIN 117 9.00 23,000 2,556
HILL 3,634 353.00 1,013,000 2,870
TERAI 32,915 8,838.00 40,445,000 4,576
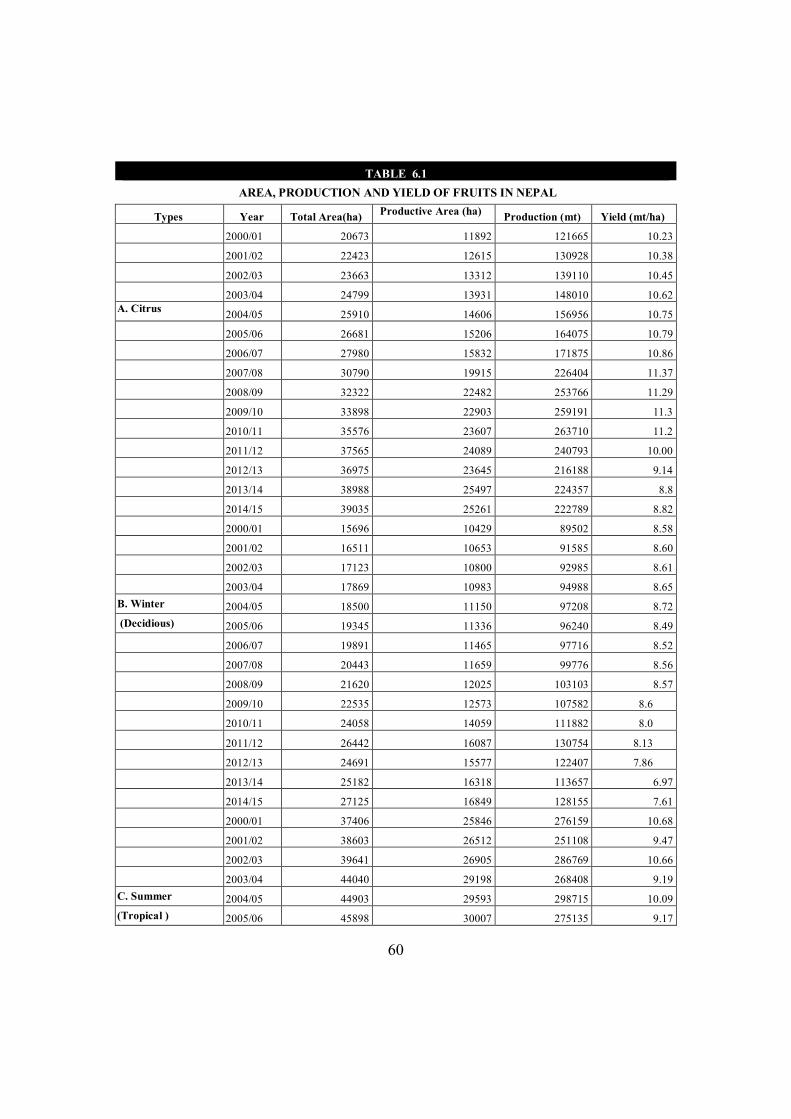
60
TABLE 6.1 AREA, PRODUCTION AND YIELD OF FRUITS IN NEPAL
Types Year Total Area(ha) Productive Area (ha) Production (mt) Yield (mt/ha) 2000/01 20673 11892 121665 10.23 2001/02 22423 12615 130928 10.38 2002/03 23663 13312 139110 10.45 2003/04 24799 13931 148010 10.62 A. Citrus 2004/05 25910 14606 156956 10.75 2005/06 26681 15206 164075 10.79 2006/07 27980 15832 171875 10.86 2007/08 30790 19915 226404 11.37 2008/09 32322 22482 253766 11.29 2009/10 33898 22903 259191 11.3 2010/11 35576 23607 263710 11.2 2011/12 37565 24089 240793 10.00 2012/13 36975 23645 216188 9.14
2013/14 38988 25497 224357 8.8 2014/15 39035 25261 222789 8.82 2000/01 15696 10429 89502 8.58 2001/02 16511 10653 91585 8.60 2002/03 17123 10800 92985 8.61 2003/04 17869 10983 94988 8.65 B. Winter 2004/05 18500 11150 97208 8.72 (Decidious) 2005/06 19345 11336 96240 8.49
2006/07 19891 11465 97716 8.52 2007/08 20443 11659 99776 8.56 2008/09 21620 12025 103103 8.57 2009/10 22535 12573 107582 8.6 2010/11 24058 14059 111882 8.0 2011/12 26442 16087 130754 8.13 2012/13 24691 15577 122407 7.86 2013/14 25182 16318 113657 6.97 2014/15 27125 16849 128155 7.61 2000/01 37406 25846 276159 10.68 2001/02 38603 26512 251108 9.47 2002/03 39641 26905 286769 10.66 2003/04 44040 29198 268408 9.19 C. Summer 2004/05 44903 29593 298715 10.09 (Tropical ) 2005/06 45898 30007 275135 9.17
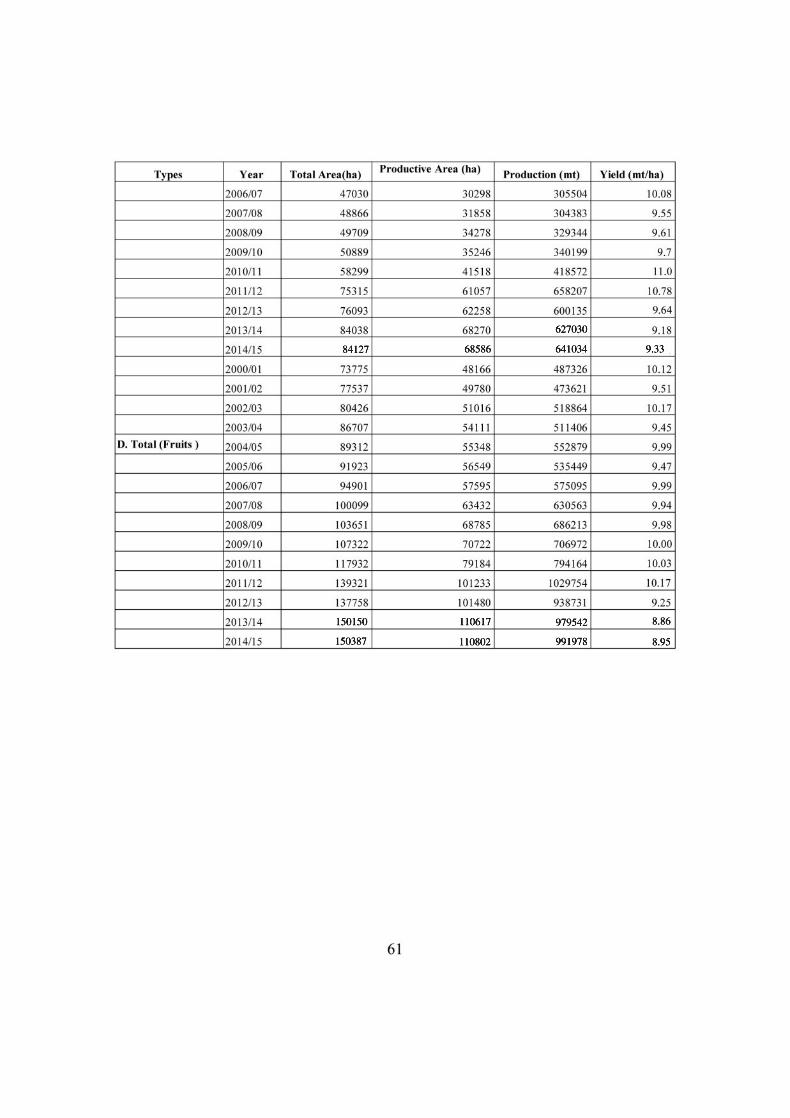
150150
150387
110617
110802 991978 8.95
8.86979542
84127 68586
627030
641034 9.33
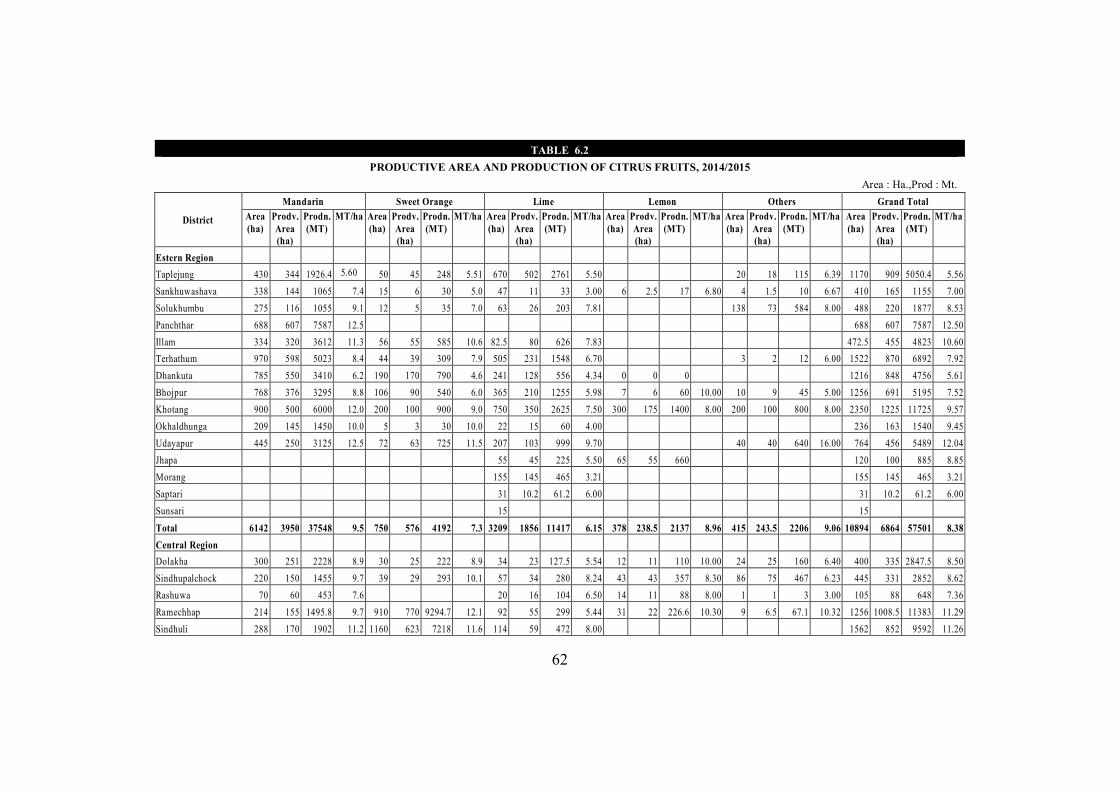
62
TABLE 6.2
PRODUCTIVE AREA AND PRODUCTION OF CITRUS FRUITS, 2014/2015 Area : Ha.,Prod : Mt.
District
Mandarin Sweet Orange Lime Lemon Others Grand Total Area (ha)
Prodv. Area (ha)
Prodn. (MT)
MT/ha Area (ha)
Prodv. Area (ha)
Prodn. (MT)
MT/ha Area (ha)
Prodv. Area (ha)
Prodn. (MT)
MT/ha Area (ha)
Prodv. Area (ha)
Prodn. (MT)
MT/ha Area (ha)
Prodv. Area (ha)
Prodn. (MT)
MT/ha Area (ha)
Prodv. Area (ha)
Prodn. (MT)
MT/ha
Estern Region Taplejung 430 344 1926.4 5.60 50 45 248 5.51 670 502 2761 5.50 20 18 115 6.39 1170 909 5050.4 5.56 Sankhuwashava 338 144 1065 7.4 15 6 30 5.0 47 11 33 3.00 6 2.5 17 6.80 4 1.5 10 6.67 410 165 1155 7.00 Solukhumbu 275 116 1055 9.1 12 5 35 7.0 63 26 203 7.81 138 73 584 8.00 488 220 1877 8.53 Panchthar 688 607 7587 12.5 688 607 7587 12.50 Illam 334 320 3612 11.3 56 55 585 10.6 82.5 80 626 7.83 472.5 455 4823 10.60 Terhathum 970 598 5023 8.4 44 39 309 7.9 505 231 1548 6.70 3 2 12 6.00 1522 870 6892 7.92 Dhankuta 785 550 3410 6.2 190 170 790 4.6 241 128 556 4.34 0 0 0 1216 848 4756 5.61 Bhojpur 768 376 3295 8.8 106 90 540 6.0 365 210 1255 5.98 7 6 60 10.00 10 9 45 5.00 1256 691 5195 7.52 Khotang 900 500 6000 12.0 200 100 900 9.0 750 350 2625 7.50 300 175 1400 8.00 200 100 800 8.00 2350 1225 11725 9.57 Okhaldhunga 209 145 1450 10.0 5 3 30 10.0 22 15 60 4.00 236 163 1540 9.45 Udayapur 445 250 3125 12.5 72 63 725 11.5 207 103 999 9.70 40 40 640 16.00 764 456 5489 12.04 Jhapa 55 45 225 5.50 65 55 660 120 100 885 8.85 Morang 155 145 465 3.21 155 145 465 3.21 Saptari 31 10.2 61.2 6.00 31 10.2 61.2 6.00 Sunsari 15 15 Total 6142 3950 37548 9.5 750 576 4192 7.3 3209 1856 11417 6.15 378 238.5 2137 8.96 415 243.5 2206 9.06 10894 6864 57501 8.38 Central Region Dolakha 300 251 2228 8.9 30 25 222 8.9 34 23 127.5 5.54 12 11 110 10.00 24 25 160 6.40 400 335 2847.5 8.50 Sindhupalchock 220 150 1455 9.7 39 29 293 10.1 57 34 280 8.24 43 43 357 8.30 86 75 467 6.23 445 331 2852 8.62 Rashuwa 70 60 453 7.6 20 16 104 6.50 14 11 88 8.00 1 1 3 3.00 105 88 648 7.36 Ramechhap 214 155 1495.8 9.7 910 770 9294.7 12.1 92 55 299 5.44 31 22 226.6 10.30 9 6.5 67.1 10.32 1256 1008.5 11383 11.29 Sindhuli 288 170 1902 11.2 1160 623 7218 11.6 114 59 472 8.00 1562 852 9592 11.26
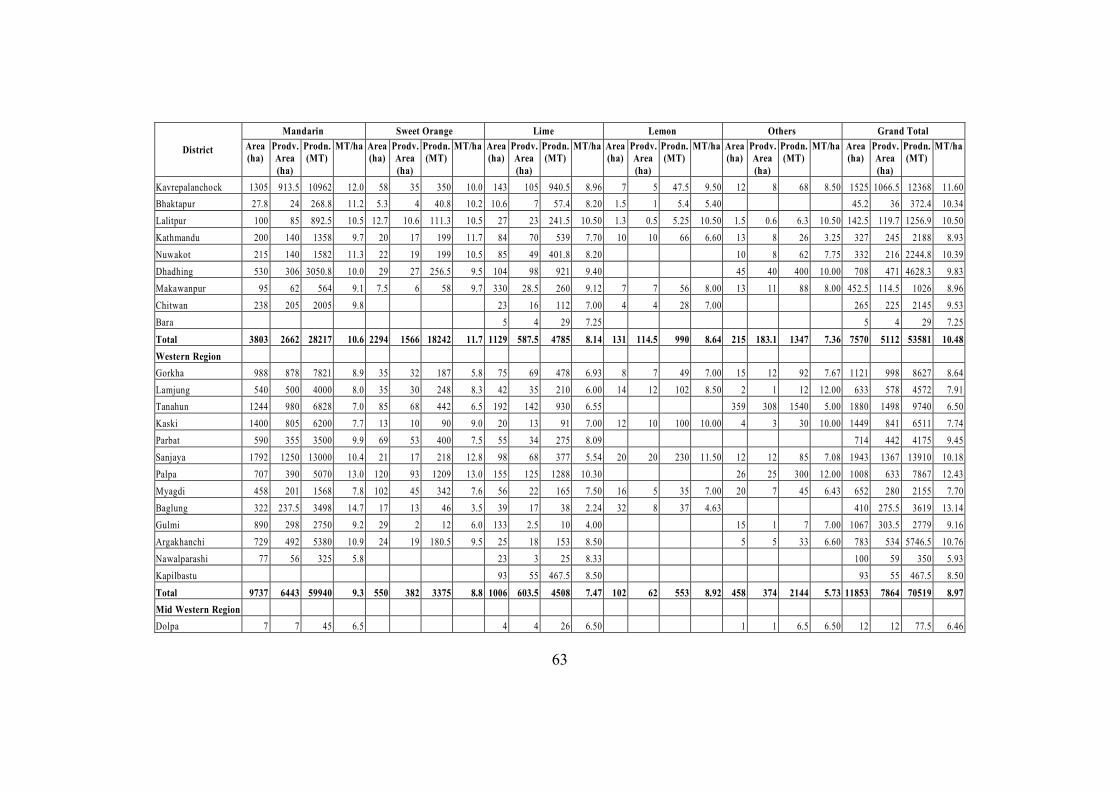
63
District
Mandarin Sweet Orange Lime Lemon Others Grand Total Area (ha)
Prodv. Area (ha)
Prodn. (MT)
MT/ha Area (ha)
Prodv. Area (ha)
Prodn. (MT)
MT/ha Area (ha)
Prodv. Area (ha)
Prodn. (MT)
MT/ha Area (ha)
Prodv. Area (ha)
Prodn. (MT)
MT/ha Area (ha)
Prodv. Area (ha)
Prodn. (MT)
MT/ha Area (ha)
Prodv. Area (ha)
Prodn. (MT)
MT/ha
Kavrepalanchock 1305 913.5 10962 12.0 58 35 350 10.0 143 105 940.5 8.96 7 5 47.5 9.50 12 8 68 8.50 1525 1066.5 12368 11.60 Bhaktapur 27.8 24 268.8 11.2 5.3 4 40.8 10.2 10.6 7 57.4 8.20 1.5 1 5.4 5.40 45.2 36 372.4 10.34 Lalitpur 100 85 892.5 10.5 12.7 10.6 111.3 10.5 27 23 241.5 10.50 1.3 0.5 5.25 10.50 1.5 0.6 6.3 10.50 142.5 119.7 1256.9 10.50 Kathmandu 200 140 1358 9.7 20 17 199 11.7 84 70 539 7.70 10 10 66 6.60 13 8 26 3.25 327 245 2188 8.93 Nuwakot 215 140 1582 11.3 22 19 199 10.5 85 49 401.8 8.20 10 8 62 7.75 332 216 2244.8 10.39 Dhadhing 530 306 3050.8 10.0 29 27 256.5 9.5 104 98 921 9.40 45 40 400 10.00 708 471 4628.3 9.83 Makawanpur 95 62 564 9.1 7.5 6 58 9.7 330 28.5 260 9.12 7 7 56 8.00 13 11 88 8.00 452.5 114.5 1026 8.96 Chitwan 238 205 2005 9.8 23 16 112 7.00 4 4 28 7.00 265 225 2145 9.53 Bara 5 4 29 7.25 5 4 29 7.25 Total 3803 2662 28217 10.6 2294 1566 18242 11.7 1129 587.5 4785 8.14 131 114.5 990 8.64 215 183.1 1347 7.36 7570 5112 53581 10.48 Western Region Gorkha 988 878 7821 8.9 35 32 187 5.8 75 69 478 6.93 8 7 49 7.00 15 12 92 7.67 1121 998 8627 8.64 Lamjung 540 500 4000 8.0 35 30 248 8.3 42 35 210 6.00 14 12 102 8.50 2 1 12 12.00 633 578 4572 7.91 Tanahun 1244 980 6828 7.0 85 68 442 6.5 192 142 930 6.55 359 308 1540 5.00 1880 1498 9740 6.50 Kaski 1400 805 6200 7.7 13 10 90 9.0 20 13 91 7.00 12 10 100 10.00 4 3 30 10.00 1449 841 6511 7.74 Parbat 590 355 3500 9.9 69 53 400 7.5 55 34 275 8.09 714 442 4175 9.45 Sanjaya 1792 1250 13000 10.4 21 17 218 12.8 98 68 377 5.54 20 20 230 11.50 12 12 85 7.08 1943 1367 13910 10.18 Palpa 707 390 5070 13.0 120 93 1209 13.0 155 125 1288 10.30 26 25 300 12.00 1008 633 7867 12.43 Myagdi 458 201 1568 7.8 102 45 342 7.6 56 22 165 7.50 16 5 35 7.00 20 7 45 6.43 652 280 2155 7.70 Baglung 322 237.5 3498 14.7 17 13 46 3.5 39 17 38 2.24 32 8 37 4.63 410 275.5 3619 13.14 Gulmi 890 298 2750 9.2 29 2 12 6.0 133 2.5 10 4.00 15 1 7 7.00 1067 303.5 2779 9.16 Argakhanchi 729 492 5380 10.9 24 19 180.5 9.5 25 18 153 8.50 5 5 33 6.60 783 534 5746.5 10.76 Nawalparashi 77 56 325 5.8 23 3 25 8.33 100 59 350 5.93 Kapilbastu 93 55 467.5 8.50 93 55 467.5 8.50 Total 9737 6443 59940 9.3 550 382 3375 8.8 1006 603.5 4508 7.47 102 62 553 8.92 458 374 2144 5.73 11853 7864 70519 8.97 Mid Western Region Dolpa 7 7 45 6.5 4 4 26 6.50 1 1 6.5 6.50 12 12 77.5 6.46
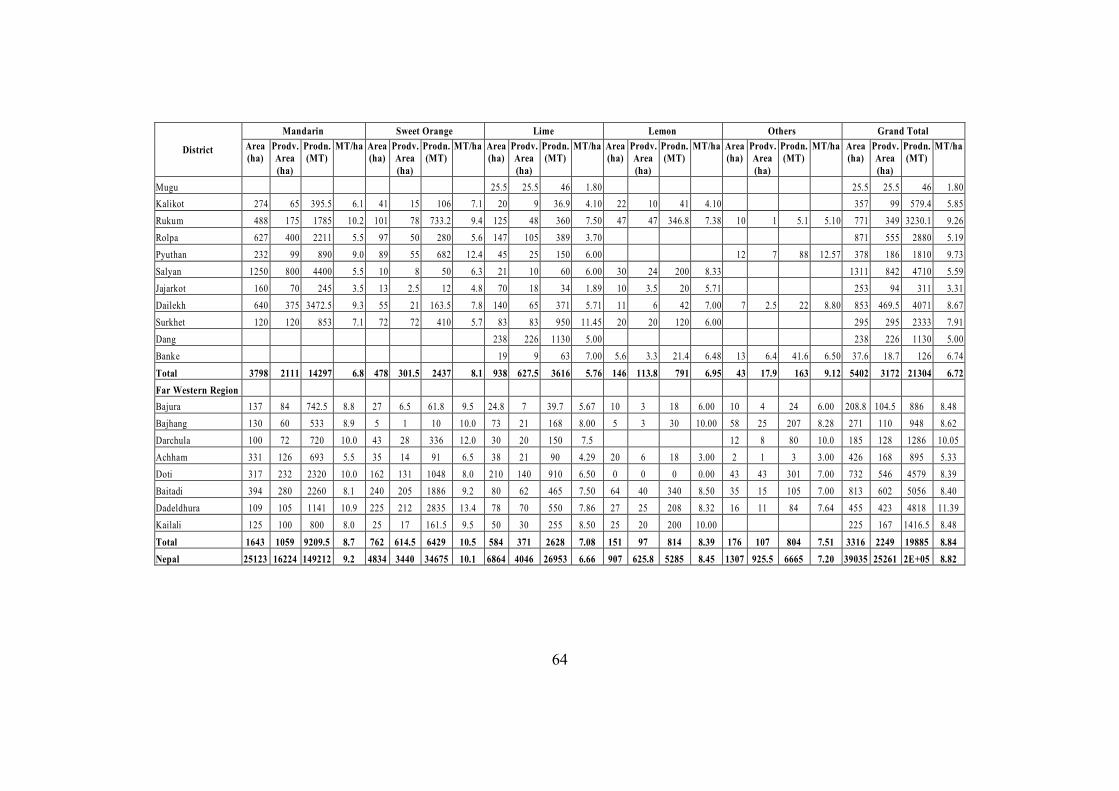
64
District
Mandarin Sweet Orange Lime Lemon Others Grand Total Area (ha)
Prodv. Area (ha)
Prodn. (MT)
MT/ha Area (ha)
Prodv. Area (ha)
Prodn. (MT)
MT/ha Area (ha)
Prodv. Area (ha)
Prodn. (MT)
MT/ha Area (ha)
Prodv. Area (ha)
Prodn. (MT)
MT/ha Area (ha)
Prodv. Area (ha)
Prodn. (MT)
MT/ha Area (ha)
Prodv. Area (ha)
Prodn. (MT)
MT/ha
Mugu 25.5 25.5 46 1.80 25.5 25.5 46 1.80 Kalikot 274 65 395.5 6.1 41 15 106 7.1 20 9 36.9 4.10 22 10 41 4.10 357 99 579.4 5.85 Rukum 488 175 1785 10.2 101 78 733.2 9.4 125 48 360 7.50 47 47 346.8 7.38 10 1 5.1 5.10 771 349 3230.1 9.26 Rolpa 627 400 2211 5.5 97 50 280 5.6 147 105 389 3.70 871 555 2880 5.19 Pyuthan 232 99 890 9.0 89 55 682 12.4 45 25 150 6.00 12 7 88 12.57 378 186 1810 9.73 Salyan 1250 800 4400 5.5 10 8 50 6.3 21 10 60 6.00 30 24 200 8.33 1311 842 4710 5.59 Jajarkot 160 70 245 3.5 13 2.5 12 4.8 70 18 34 1.89 10 3.5 20 5.71 253 94 311 3.31 Dailekh 640 375 3472.5 9.3 55 21 163.5 7.8 140 65 371 5.71 11 6 42 7.00 7 2.5 22 8.80 853 469.5 4071 8.67 Surkhet 120 120 853 7.1 72 72 410 5.7 83 83 950 11.45 20 20 120 6.00 295 295 2333 7.91 Dang 238 226 1130 5.00 238 226 1130 5.00 Banke 19 9 63 7.00 5.6 3.3 21.4 6.48 13 6.4 41.6 6.50 37.6 18.7 126 6.74 Total 3798 2111 14297 6.8 478 301.5 2437 8.1 938 627.5 3616 5.76 146 113.8 791 6.95 43 17.9 163 9.12 5402 3172 21304 6.72 Far Western Region Bajura 137 84 742.5 8.8 27 6.5 61.8 9.5 24.8 7 39.7 5.67 10 3 18 6.00 10 4 24 6.00 208.8 104.5 886 8.48 Bajhang 130 60 533 8.9 5 1 10 10.0 73 21 168 8.00 5 3 30 10.00 58 25 207 8.28 271 110 948 8.62 Darchula 100 72 720 10.0 43 28 336 12.0 30 20 150 7.5 12 8 80 10.0 185 128 1286 10.05 Achham 331 126 693 5.5 35 14 91 6.5 38 21 90 4.29 20 6 18 3.00 2 1 3 3.00 426 168 895 5.33 Doti 317 232 2320 10.0 162 131 1048 8.0 210 140 910 6.50 0 0 0 0.00 43 43 301 7.00 732 546 4579 8.39 Baitadi 394 280 2260 8.1 240 205 1886 9.2 80 62 465 7.50 64 40 340 8.50 35 15 105 7.00 813 602 5056 8.40 Dadeldhura 109 105 1141 10.9 225 212 2835 13.4 78 70 550 7.86 27 25 208 8.32 16 11 84 7.64 455 423 4818 11.39 Kailali 125 100 800 8.0 25 17 161.5 9.5 50 30 255 8.50 25 20 200 10.00 225 167 1416.5 8.48 Total 1643 1059 9209.5 8.7 762 614.5 6429 10.5 584 371 2628 7.08 151 97 814 8.39 176 107 804 7.51 3316 2249 19885 8.84 Nepal 25123 16224 149212 9.2 4834 3440 34675 10.1 6864 4046 26953 6.66 907 625.8 5285 8.45 1307 925.5 6665 7.20 39035 25261 2E+05 8.82
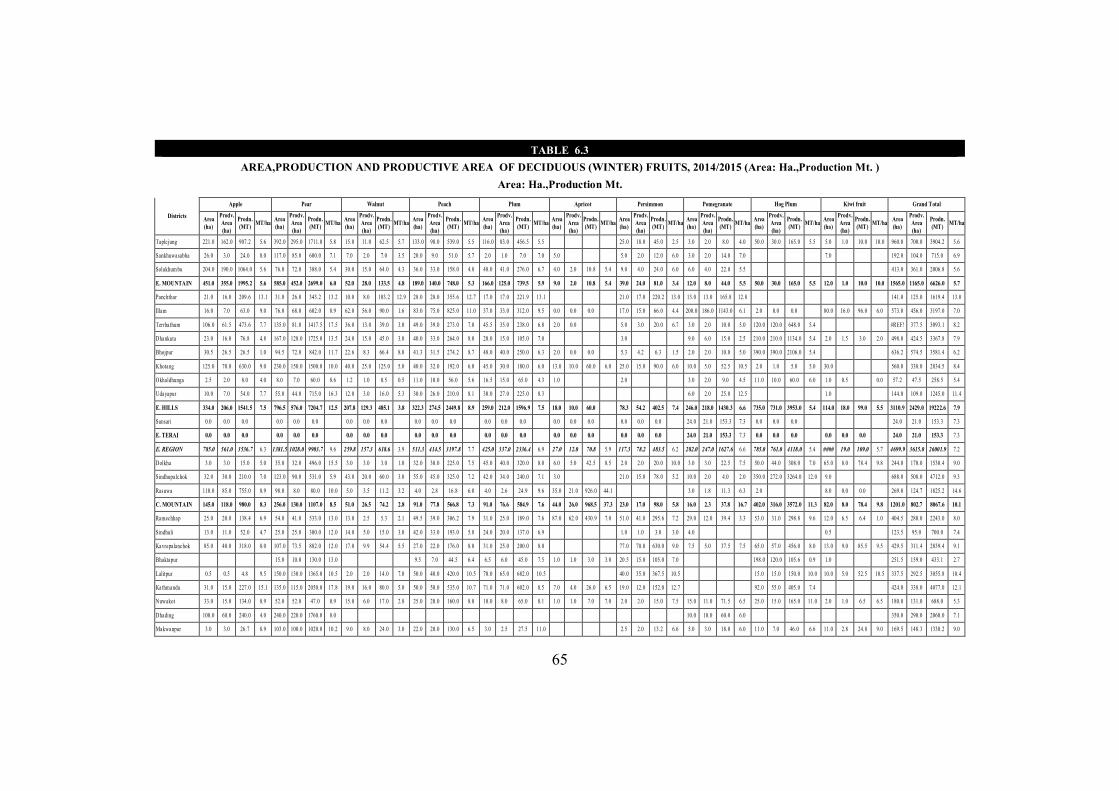
65
TABLE 6.3
AREA,PRODUCTION AND PRODUCTIVE AREA OF DECIDUOUS (WINTER) FRUITS, 2014/2015 (Area: Ha.,Production Mt. ) Area: Ha.,Production Mt.
Districts
Apple Pear Walnut Peach Plum Apricot Persimmon Pomegranate Hog Plum Kiwi fruit Grand Total
Area (ha)
Prodv. Area (ha)
Prodn. (MT) MT/ha Area
(ha)
Prodv. Area (ha)
Prodn. (MT) MT/ha Area
(ha)
Prodv. Area (ha)
Prodn. (MT) MT/ha Area
(ha)
Prodv. Area (ha)
Prodn. (MT) MT/ha Area
(ha)
Prodv. Area (ha)
Prodn. (MT) MT/ha Area
(ha)
Prodv. Area (ha)
Prodn. (MT) MT/ha Area
(ha)
Prodv. Area (ha)
Prodn. (MT) MT/ha Area
(ha)
Prodv. Area (ha)
Prodn. (MT) MT/ha Area
(ha)
Prodv. Area (ha)
Prodn. (MT) MT/ha Area
(ha)
Prodv. Area (ha)
Prodn. (MT) MT/ha Area
(ha)
Prodv. Area (ha)
Prodn. (MT) MT/ha
Taplejung 221.0 162.0 907.2 5.6 392.0 295.0 1711.0 5.8 15.0 11.0 62.5 5.7 133.0 98.0 539.0 5.5 116.0 83.0 456.5 5.5 25.0 18.0 45.0 2.5 3.0 2.0 8.0 4.0 50.0 30.0 165.0 5.5 5.0 1.0 10.0 10.0 960.0 700.0 3904.2 5.6
Sankhuwasabha 26.0 3.0 24.0 8.0 117.0 85.0 600.0 7.1 7.0 2.0 7.0 3.5 20.0 9.0 51.0 5.7 2.0 1.0 7.0 7.0 5.0 5.0 2.0 12.0 6.0 3.0 2.0 14.0 7.0 7.0 192.0 104.0 715.0 6.9
Solukhum bu 204.0 190.0 1064.0 5.6 76.0 72.0 388.0 5.4 30.0 15.0 64.0 4.3 36.0 33.0 158.0 4.8 48.0 41.0 276.0 6.7 4.0 2.0 10.8 5.4 9.0 4.0 24.0 6.0 6.0 4.0 22.0 5.5 413.0 361.0 2006.8 5.6
E. MOUNTAIN 451.0 355.0 1995.2 5.6 585.0 452.0 2699.0 6.0 52.0 28.0 133.5 4.8 189.0 140.0 748.0 5.3 166.0 125.0 739.5 5.9 9.0 2.0 10.8 5.4 39.0 24.0 81.0 3.4 12.0 8.0 44.0 5.5 50.0 30.0 165.0 5.5 12.0 1.0 10.0 10.0 1565.0 1165.0 6626.0 5.7
Panchthar 21.0 16.0 209.6 13.1 31.0 26.0 343.2 13.2 10.0 8.0 103.2 12.9 28.0 28.0 355.6 12.7 17.0 17.0 221.9 13.1 21.0 17.0 220.2 13.0 13.0 13.0 165.8 12.8 141.0 125.0 1619.4 13.0
Illam 16.0 7.0 63.0 9.0 76.0 68.0 602.0 8.9 62.0 56.0 90.0 1.6 83.0 75.0 825.0 11.0 37.0 33.0 312.0 9.5 0.0 0.0 0.0 17.0 15.0 66.0 4.4 200.0 186.0 1143.0 6.1 2.0 0.0 0.0 80.0 16.0 96.0 6.0 573.0 456.0 3197.0 7.0
Terrhathum 106.0 61.5 473.6 7.7 135.0 81.0 1417.5 17.5 36.0 13.0 39.0 3.0 49.0 39.0 273.0 7.0 45.5 35.0 238.0 6.8 2.0 0.0 5.0 3.0 20.0 6.7 3.0 2.0 10.0 5.0 120.0 120.0 648.0 5.4 #REF! 377.5 3093.1 8.2
Dhankuta 23.0 16.0 76.8 4.8 167.0 128.0 1725.0 13.5 24.0 15.0 45.0 3.0 40.0 33.0 264.0 8.0 20.0 15.0 105.0 7.0 3.0 9.0 6.0 15.0 2.5 210.0 210.0 1134.0 5.4 2.0 1.5 3.0 2.0 498.0 424.5 3367.8 7.9
Bhojpur 30.5 26.5 26.5 1.0 94.5 72.0 842.0 11.7 22.6 8.3 66.4 8.0 41.3 31.5 274.2 8.7 48.0 40.0 250.0 6.3 2.0 0.0 0.0 5.3 4.2 6.3 1.5 2.0 2.0 10.0 5.0 390.0 390.0 2106.0 5.4 636.2 574.5 3581.4 6.2
Khotang 125.0 70.0 630.0 9.0 230.0 150.0 1500.0 10.0 40.0 25.0 125.0 5.0 40.0 32.0 192.0 6.0 45.0 30.0 180.0 6.0 13.0 10.0 60.0 6.0 25.0 15.0 90.0 6.0 10.0 5.0 52.5 10.5 2.0 1.0 5.0 5.0 30.0 560.0 338.0 2834.5 8.4
Okhaldhunga 2.5 2.0 8.0 4.0 8.0 7.0 60.0 8.6 1.2 1.0 0.5 0.5 11.0 10.0 56.0 5.6 16.5 15.0 65.0 4.3 1.0 2.0 3.0 2.0 9.0 4.5 11.0 10.0 60.0 6.0 1.0 0.5 0.0 57.2 47.5 258.5 5.4
Udayapur 10.0 7.0 54.0 7.7 55.0 44.0 715.0 16.3 12.0 3.0 16.0 5.3 30.0 26.0 210.0 8.1 30.0 27.0 225.0 8.3 6.0 2.0 25.0 12.5 1.0 144.0 109.0 1245.0 11.4
E. HILLS 334.0 206.0 1541.5 7.5 796.5 576.0 7204.7 12.5 207.8 129.3 485.1 3.8 322.3 274.5 2449.8 8.9 259.0 212.0 1596.9 7.5 18.0 10.0 60.0 78.3 54.2 402.5 7.4 246.0 218.0 1430.3 6.6 735.0 731.0 3953.0 5.4 114.0 18.0 99.0 5.5 3110.9 2429.0 19222.6 7.9
Sunsari 0.0 0.0 0.0 0.0 0.0 0.0 0.0 0.0 0.0 0.0 0.0 0.0 0.0 0.0 0.0 0.0 0.0 0.0 0.0 0.0 0.0 24.0 21.0 153.3 7.3 0.0 0.0 0.0 24.0 21.0 153.3 7.3
E. TERAI 0.0 0.0 0.0 0.0 0.0 0.0 0.0 0.0 0.0 0.0 0.0 0.0 0.0 0.0 0.0 0.0 0.0 0.0 0.0 0.0 0.0 24.0 21.0 153.3 7.3 0.0 0.0 0.0 0.0 0.0 0.0 24.0 21.0 153.3 7.3
E. REGION 785.0 561.0 3536.7 6.3 1381.5 1028.0 9903.7 9.6 259.8 157.3 618.6 3.9 511.3 414.5 3197.8 7.7 425.0 337.0 2336.4 6.9 27.0 12.0 70.8 5.9 117.3 78.2 483.5 6.2 282.0 247.0 1627.6 6.6 785.0 761.0 4118.0 5.4 #### 19.0 109.0 5.7 4699.9 3615.0 26001.9 7.2
Dolkha 3.0 3.0 15.0 5.0 35.0 32.0 496.0 15.5 3.0 3.0 3.0 1.0 32.0 30.0 225.0 7.5 45.0 40.0 320.0 8.0 6.0 5.0 42.5 8.5 2.0 2.0 20.0 10.0 3.0 3.0 22.5 7.5 50.0 44.0 308.0 7.0 65.0 8.0 78.4 9.8 244.0 170.0 1530.4 9.0
Sindhupalchok 32.0 30.0 210.0 7.0 123.0 90.0 531.0 5.9 43.0 20.0 60.0 3.0 55.0 45.0 325.0 7.2 42.0 34.0 240.0 7.1 3.0 21.0 15.0 78.0 5.2 10.0 2.0 4.0 2.0 350.0 272.0 3264.0 12.0 9.0 688.0 508.0 4712.0 9.3
Rasuwa 110.0 85.0 755.0 8.9 98.0 8.0 80.0 10.0 5.0 3.5 11.2 3.2 4.0 2.8 16.8 6.0 4.0 2.6 24.9 9.6 35.0 21.0 926.0 44.1 3.0 1.8 11.3 6.3 2.0 8.0 0.0 0.0 269.0 124.7 1825.2 14.6
C. MOUNTAIN 145.0 118.0 980.0 8.3 256.0 130.0 1107.0 8.5 51.0 26.5 74.2 2.8 91.0 77.8 566.8 7.3 91.0 76.6 584.9 7.6 44.0 26.0 968.5 37.3 23.0 17.0 98.0 5.8 16.0 2.3 37.8 16.7 402.0 316.0 3572.0 11.3 82.0 8.0 78.4 9.8 1201.0 802.7 8067.6 10.1
Ramechhap 25.0 20.0 138.4 6.9 54.0 41.0 533.0 13.0 13.0 2.5 5.3 2.1 49.5 39.0 306.2 7.9 31.0 25.0 189.0 7.6 87.0 62.0 430.9 7.0 51.0 41.0 295.6 7.2 29.0 12.0 39.4 3.3 53.0 31.0 298.8 9.6 12.0 6.5 6.4 1.0 404.5 280.0 2243.0 8.0
Sindhuli 13.0 11.0 52.0 4.7 25.0 25.0 300.0 12.0 14.0 5.0 15.0 3.0 42.0 33.0 193.0 5.8 24.0 20.0 137.0 6.9 1.0 1.0 3.0 3.0 4.0 0.5 123.5 95.0 700.0 7.4
Kavrepalanchok 85.0 40.0 318.0 8.0 107.0 73.5 882.0 12.0 17.0 9.9 54.4 5.5 27.0 22.0 176.0 8.0 31.0 25.0 200.0 8.0 77.0 70.0 630.0 9.0 7.5 5.0 37.5 7.5 65.0 57.0 456.0 8.0 13.0 9.0 85.5 9.5 429.5 311.4 2839.4 9.1
Bhaktapur 15.0 10.0 130.0 13.0 9.5 7.0 44.5 6.4 6.5 6.0 45.0 7.5 1.0 1.0 3.0 3.0 20.5 15.0 105.0 7.0 198.0 120.0 105.6 0.9 1.0 251.5 159.0 433.1 2.7
Lalitpur 0.5 0.5 4.8 9.5 150.0 130.0 1365.0 10.5 2.0 2.0 14.0 7.0 50.0 40.0 420.0 10.5 70.0 65.0 682.0 10.5 40.0 35.0 367.5 10.5 15.0 15.0 150.0 10.0 10.0 5.0 52.5 10.5 337.5 292.5 3055.8 10.4
Kathmandu 31.0 15.0 227.0 15.1 135.0 115.0 2050.0 17.8 19.0 16.0 80.0 5.0 50.0 50.0 535.0 10.7 71.0 71.0 602.0 8.5 7.0 4.0 26.0 6.5 19.0 12.0 152.0 12.7 92.0 55.0 405.0 7.4 424.0 338.0 4077.0 12.1
Nuwakot 33.0 15.0 134.0 8.9 52.0 52.0 47.0 0.9 15.0 6.0 17.0 2.8 25.0 20.0 160.0 8.0 10.0 8.0 65.0 8.1 1.0 1.0 7.0 7.0 2.0 2.0 15.0 7.5 15.0 11.0 71.5 6.5 25.0 15.0 165.0 11.0 2.0 1.0 6.5 6.5 180.0 131.0 688.0 5.3
Dhading 100.0 60.0 240.0 4.0 240.0 220.0 1760.0 8.0 10.0 10.0 60.0 6.0 350.0 290.0 2060.0 7.1
Makwanpur 3.0 3.0 26.7 8.9 103.0 100.0 1020.0 10.2 9.0 8.0 24.0 3.0 22.0 20.0 130.0 6.5 3.0 2.5 27.5 11.0 2.5 2.0 13.2 6.6 5.0 3.0 18.0 6.0 11.0 7.0 46.0 6.6 11.0 2.8 24.8 9.0 169.5 148.3 1330.2 9.0
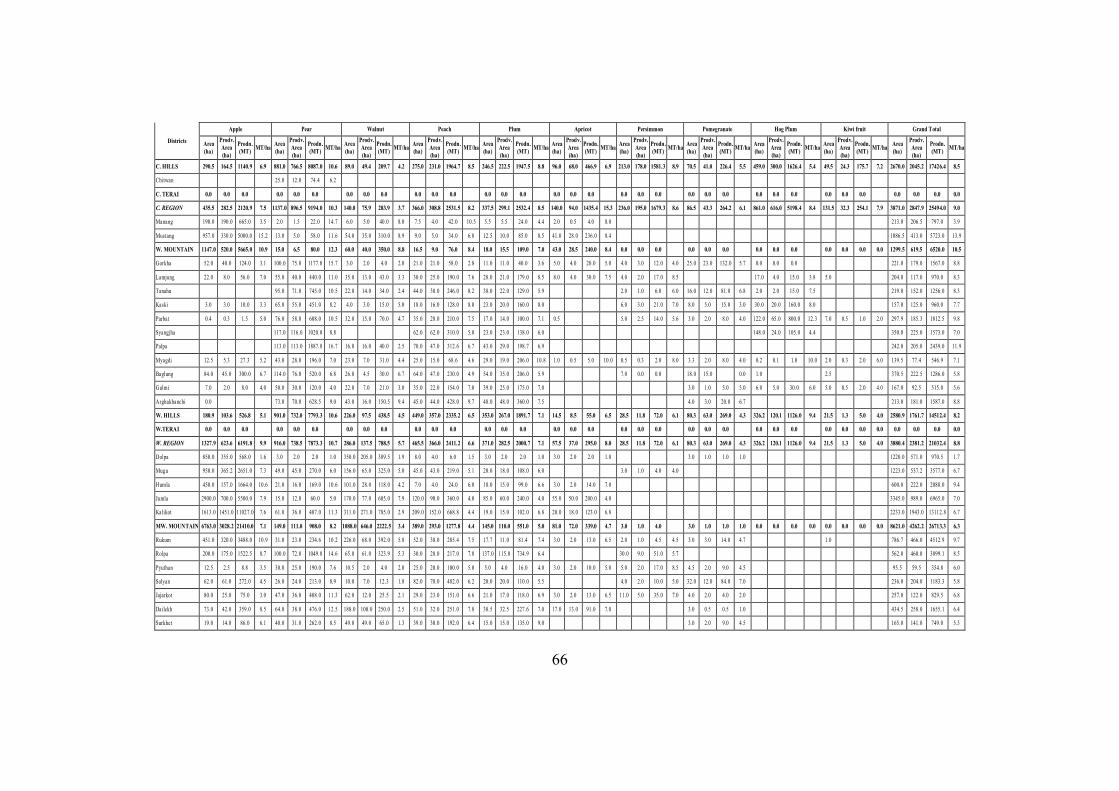
66
Districts
Apple Pear Walnut Peach Plum Apricot Persimmon Pomegranate Hog Plum Kiwi fruit Grand Total
Area (ha)
Prodv. Area (ha)
Prodn. (MT) MT/ha Area
(ha)
Prodv. Area (ha)
Prodn. (MT) MT/ha Area
(ha)
Prodv. Area (ha)
Prodn. (MT) MT/ha Area
(ha)
Prodv. Area (ha)
Prodn. (MT) MT/ha Area
(ha)
Prodv. Area (ha)
Prodn. (MT) MT/ha Area
(ha)
Prodv. Area (ha)
Prodn. (MT) MT/ha Area
(ha)
Prodv. Area (ha)
Prodn. (MT) MT/ha Area
(ha)
Prodv. Area (ha)
Prodn. (MT) MT/ha Area
(ha)
Prodv. Area (ha)
Prodn. (MT) MT/ha Area
(ha)
Prodv. Area (ha)
Prodn. (MT) MT/ha Area
(ha)
Prodv. Area (ha)
Prodn. (MT) MT/ha
C. HILLS 290.5 164.5 1140.9 6.9 881.0 766.5 8087.0 10.6 89.0 49.4 209.7 4.2 275.0 231.0 1964.7 8.5 246.5 222.5 1947.5 8.8 96.0 68.0 466.9 6.9 213.0 178.0 1581.3 8.9 70.5 41.0 226.4 5.5 459.0 300.0 1626.4 5.4 49.5 24.3 175.7 7.2 2670.0 2045.2 17426.4 8.5
Chitwan 25.0 12.0 74.4 6.2
C. TERAI 0.0 0.0 0.0 0.0 0.0 0.0 0.0 0.0 0.0 0.0 0.0 0.0 0.0 0.0 0.0 0.0 0.0 0.0 0.0 0.0 0.0 0.0 0.0 0.0 0.0 0.0 0.0 0.0 0.0 0.0 0.0 0.0 0.0 0.0
C. REGION 435.5 282.5 2120.9 7.5 1137.0 896.5 9194.0 10.3 140.0 75.9 283.9 3.7 366.0 308.8 2531.5 8.2 337.5 299.1 2532.4 8.5 140.0 94.0 1435.4 15.3 236.0 195.0 1679.3 8.6 86.5 43.3 264.2 6.1 861.0 616.0 5198.4 8.4 131.5 32.3 254.1 7.9 3871.0 2847.9 25494.0 9.0
Manang 190.0 190.0 665.0 3.5 2.0 1.5 22.0 14.7 6.0 5.0 40.0 8.0 7.5 4.0 42.0 10.5 5.5 5.5 24.0 4.4 2.0 0.5 4.0 8.0 213.0 206.5 797.0 3.9
Mustang 957.0 330.0 5000.0 15.2 13.0 5.0 58.0 11.6 54.0 35.0 310.0 8.9 9.0 5.0 34.0 6.8 12.5 10.0 85.0 8.5 41.0 28.0 236.0 8.4 1086.5 413.0 5723.0 13.9
W. MOUNTAIN 1147.0 520.0 5665.0 10.9 15.0 6.5 80.0 12.3 60.0 40.0 350.0 8.8 16.5 9.0 76.0 8.4 18.0 15.5 109.0 7.0 43.0 28.5 240.0 8.4 0.0 0.0 0.0 0.0 0.0 0.0 0.0 0.0 0.0 0.0 0.0 0.0 0.0 1299.5 619.5 6520.0 10.5
Gorkha 52.0 40.0 124.0 3.1 100.0 75.0 1177.0 15.7 3.0 2.0 4.0 2.0 21.0 21.0 58.0 2.8 11.0 11.0 40.0 3.6 5.0 4.0 20.0 5.0 4.0 3.0 12.0 4.0 25.0 23.0 132.0 5.7 0.0 0.0 0.0 221.0 179.0 1567.0 8.8
Lamjung 22.0 8.0 56.0 7.0 55.0 40.0 440.0 11.0 35.0 13.0 43.0 3.3 30.0 25.0 190.0 7.6 28.0 21.0 179.0 8.5 8.0 4.0 30.0 7.5 4.0 2.0 17.0 8.5 17.0 4.0 15.0 3.8 5.0 204.0 117.0 970.0 8.3
Tanahu 95.0 71.0 745.0 10.5 22.0 14.0 34.0 2.4 44.0 30.0 246.0 8.2 38.0 22.0 129.0 5.9 2.0 1.0 6.0 6.0 16.0 12.0 81.0 6.8 2.0 2.0 15.0 7.5 219.0 152.0 1256.0 8.3
Kaski 3.0 3.0 10.0 3.3 65.0 55.0 451.0 8.2 4.0 3.0 15.0 5.0 18.0 16.0 128.0 8.0 23.0 20.0 160.0 8.0 6.0 3.0 21.0 7.0 8.0 5.0 15.0 3.0 30.0 20.0 160.0 8.0 157.0 125.0 960.0 7.7
Parbat 0.4 0.3 1.5 5.0 76.0 58.0 608.0 10.5 32.0 15.0 70.0 4.7 35.0 28.0 210.0 7.5 17.0 14.0 100.0 7.1 0.5 5.0 2.5 14.0 5.6 3.0 2.0 8.0 4.0 122.0 65.0 800.0 12.3 7.0 0.5 1.0 2.0 297.9 185.3 1812.5 9.8
Syangjha 117.0 116.0 1020.0 8.8 62.0 62.0 310.0 5.0 23.0 23.0 138.0 6.0 148.0 24.0 105.0 4.4 350.0 225.0 1573.0 7.0
Palpa 113.0 113.0 1887.8 16.7 16.0 16.0 40.0 2.5 70.0 47.0 312.6 6.7 43.0 29.0 198.7 6.9 242.0 205.0 2439.0 11.9
Myagdi 12.5 5.3 27.3 5.2 43.0 28.0 196.0 7.0 23.0 7.0 31.0 4.4 25.0 15.0 68.6 4.6 29.0 19.0 206.0 10.8 1.0 0.5 5.0 10.0 0.5 0.3 2.0 8.0 3.3 2.0 8.0 4.0 0.2 0.1 1.0 10.0 2.0 0.3 2.0 6.0 139.5 77.4 546.9 7.1
Baglung 84.0 45.0 300.0 6.7 114.0 76.0 520.0 6.8 26.0 4.5 30.0 6.7 64.0 47.0 230.0 4.9 54.0 35.0 206.0 5.9 7.0 0.0 0.0 18.0 15.0 0.0 1.0 2.5 370.5 222.5 1286.0 5.8
Gulmi 7.0 2.0 8.0 4.0 50.0 30.0 120.0 4.0 22.0 7.0 21.0 3.0 35.0 22.0 154.0 7.0 39.0 25.0 175.0 7.0 3.0 1.0 5.0 5.0 6.0 5.0 30.0 6.0 5.0 0.5 2.0 4.0 167.0 92.5 515.0 5.6
Arghakhanchi 0.0 73.0 70.0 628.5 9.0 43.0 16.0 150.5 9.4 45.0 44.0 428.0 9.7 48.0 48.0 360.0 7.5 4.0 3.0 20.0 6.7 213.0 181.0 1587.0 8.8
W. HILLS 180.9 103.6 526.8 5.1 901.0 732.0 7793.3 10.6 226.0 97.5 438.5 4.5 449.0 357.0 2335.2 6.5 353.0 267.0 1891.7 7.1 14.5 8.5 55.0 6.5 28.5 11.8 72.0 6.1 80.3 63.0 269.0 4.3 326.2 120.1 1126.0 9.4 21.5 1.3 5.0 4.0 2580.9 1761.7 14512.4 8.2
W.TERAI 0.0 0.0 0.0 0.0 0.0 0.0 0.0 0.0 0.0 0.0 0.0 0.0 0.0 0.0 0.0 0.0 0.0 0.0 0.0 0.0 0.0 0.0 0.0 0.0 0.0 0.0 0.0 0.0 0.0 0.0 0.0 0.0 0.0 0.0 0.0
W. REGION 1327.9 623.6 6191.8 9.9 916.0 738.5 7873.3 10.7 286.0 137.5 788.5 5.7 465.5 366.0 2411.2 6.6 371.0 282.5 2000.7 7.1 57.5 37.0 295.0 8.0 28.5 11.8 72.0 6.1 80.3 63.0 269.0 4.3 326.2 120.1 1126.0 9.4 21.5 1.3 5.0 4.0 3880.4 2381.2 21032.4 8.8
Dolpa 850.0 355.0 568.0 1.6 3.0 2.0 2.0 1.0 350.0 205.0 389.5 1.9 8.0 4.0 6.0 1.5 3.0 2.0 2.0 1.0 3.0 2.0 2.0 1.0 3.0 1.0 1.0 1.0 1220.0 571.0 970.5 1.7
Mugu 950.0 365.2 2651.0 7.3 49.0 45.0 270.0 6.0 156.0 65.0 325.0 5.0 45.0 43.0 219.0 5.1 20.0 18.0 108.0 6.0 3.0 1.0 4.0 4.0 1223.0 537.2 3577.0 6.7
Humla 450.0 157.0 1664.0 10.6 21.0 16.0 169.0 10.6 101.0 28.0 118.0 4.2 7.0 4.0 24.0 6.0 18.0 15.0 99.0 6.6 3.0 2.0 14.0 7.0 600.0 222.0 2088.0 9.4
Jumla 2900.0 700.0 5500.0 7.9 15.0 12.0 60.0 5.0 170.0 77.0 605.0 7.9 120.0 90.0 360.0 4.0 85.0 60.0 240.0 4.0 55.0 50.0 200.0 4.0 3345.0 989.0 6965.0 7.0
Kalikot 1613.0 1451.0 11027.0 7.6 61.0 36.0 407.0 11.3 311.0 271.0 785.0 2.9 209.0 152.0 668.8 4.4 19.0 15.0 102.0 6.8 20.0 18.0 123.0 6.8 2233.0 1943.0 13112.8 6.7
MW. MOUNTAIN 6763.0 3028.2 21410.0 7.1 149.0 111.0 908.0 8.2 1088.0 646.0 2222.5 3.4 389.0 293.0 1277.8 4.4 145.0 110.0 551.0 5.0 81.0 72.0 339.0 4.7 3.0 1.0 4.0 3.0 1.0 1.0 1.0 0.0 0.0 0.0 0.0 0.0 0.0 0.0 0.0 8621.0 4262.2 26713.3 6.3
Rukum 451.0 320.0 3488.0 10.9 31.0 23.0 234.6 10.2 226.0 68.0 392.0 5.8 52.0 38.0 285.4 7.5 17.7 11.0 81.4 7.4 3.0 2.0 13.0 6.5 2.0 1.0 4.5 4.5 3.0 3.0 14.0 4.7 1.0 786.7 466.0 4512.9 9.7
Rolpa 200.0 175.0 1522.5 8.7 100.0 72.0 1049.8 14.6 65.0 61.0 323.9 5.3 30.0 28.0 217.0 7.8 137.0 115.0 734.9 6.4 30.0 9.0 51.0 5.7 562.0 460.0 3899.1 8.5
Pyuthan 12.5 2.5 8.8 3.5 30.0 25.0 190.0 7.6 10.5 2.0 4.0 2.0 25.0 20.0 100.0 5.0 5.0 4.0 16.0 4.0 3.0 2.0 10.0 5.0 5.0 2.0 17.0 8.5 4.5 2.0 9.0 4.5 95.5 59.5 354.8 6.0
Salyan 62.0 61.0 272.0 4.5 26.0 24.0 213.0 8.9 10.0 7.0 12.3 1.8 82.0 78.0 482.0 6.2 20.0 20.0 110.0 5.5 4.0 2.0 10.0 5.0 32.0 12.0 84.0 7.0 236.0 204.0 1183.3 5.8
Jajarkot 80.0 25.0 75.0 3.0 47.0 36.0 408.0 11.3 62.0 12.0 25.5 2.1 29.0 23.0 151.0 6.6 21.0 17.0 118.0 6.9 3.0 2.0 13.0 6.5 11.0 5.0 35.0 7.0 4.0 2.0 4.0 2.0 257.0 122.0 829.5 6.8
Dailekh 73.0 42.0 359.0 8.5 64.0 38.0 476.0 12.5 188.0 100.0 250.0 2.5 51.0 32.0 251.0 7.8 38.5 32.5 227.6 7.0 17.0 13.0 91.0 7.0 3.0 0.5 0.5 1.0 434.5 258.0 1655.1 6.4
Surkhet 19.0 14.0 86.0 6.1 40.0 31.0 262.0 8.5 49.0 49.0 65.0 1.3 39.0 30.0 192.0 6.4 15.0 15.0 135.0 9.0 3.0 2.0 9.0 4.5 165.0 141.0 749.0 5.3
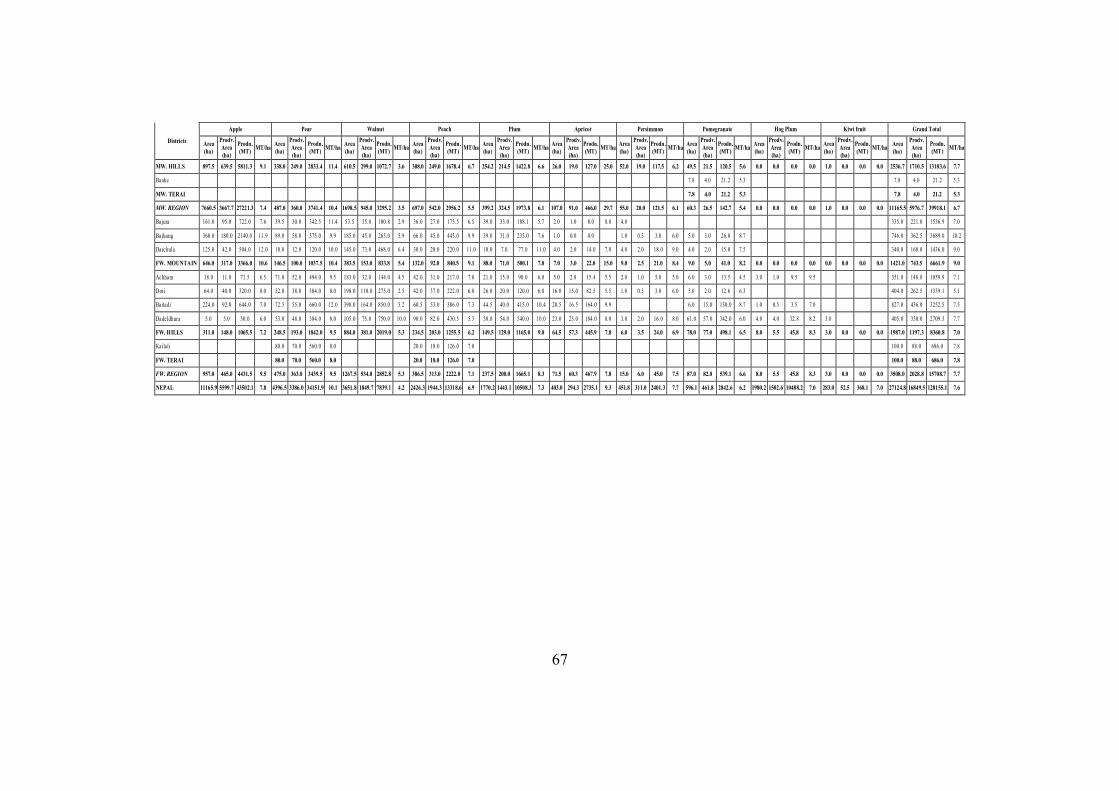
67
Districts
Apple Pear Walnut Peach Plum Apricot Persimmon Pomegranate Hog Plum Kiwi fruit Grand Total
Area (ha)
Prodv. Area (ha)
Prodn. (MT) MT/ha Area
(ha)
Prodv. Area (ha)
Prodn. (MT) MT/ha Area
(ha)
Prodv. Area (ha)
Prodn. (MT) MT/ha Area
(ha)
Prodv. Area (ha)
Prodn. (MT) MT/ha Area
(ha)
Prodv. Area (ha)
Prodn. (MT) MT/ha Area
(ha)
Prodv. Area (ha)
Prodn. (MT) MT/ha Area
(ha)
Prodv. Area (ha)
Prodn. (MT) MT/ha Area
(ha)
Prodv. Area (ha)
Prodn. (MT) MT/ha Area
(ha)
Prodv. Area (ha)
Prodn. (MT) MT/ha Area
(ha)
Prodv. Area (ha)
Prodn. (MT) MT/ha Area
(ha)
Prodv. Area (ha)
Prodn. (MT) MT/ha
MW. HILLS 897.5 639.5 5811.3 9.1 338.0 249.0 2833.4 11.4 610.5 299.0 1072.7 3.6 308.0 249.0 1678.4 6.7 254.2 214.5 1422.8 6.6 26.0 19.0 127.0 25.0 52.0 19.0 117.5 6.2 49.5 21.5 120.5 5.6 0.0 0.0 0.0 0.0 1.0 0.0 0.0 0.0 2536.7 1710.5 13183.6 7.7
Banke 7.8 4.0 21.2 5.3 7.8 4.0 21.2 5.3
MW. TERAI 7.8 4.0 21.2 5.3 7.8 4.0 21.2 5.3
MW. REGION 7660.5 3667.7 27221.3 7.4 487.0 360.0 3741.4 10.4 1698.5 945.0 3295.2 3.5 697.0 542.0 2956.2 5.5 399.2 324.5 1973.8 6.1 107.0 91.0 466.0 29.7 55.0 20.0 121.5 6.1 60.3 26.5 142.7 5.4 0.0 0.0 0.0 0.0 1.0 0.0 0.0 0.0 11165.5 5976.7 39918.1 6.7
Bajura 161.0 95.0 722.0 7.6 39.5 30.0 342.5 11.4 53.5 35.0 100.8 2.9 36.0 27.0 175.5 6.5 39.0 33.0 188.1 5.7 2.0 1.0 8.0 8.0 4.0 335.0 221.0 1536.9 7.0
Bajhang 360.0 180.0 2140.0 11.9 89.0 58.0 575.0 9.9 185.0 45.0 265.0 5.9 66.0 45.0 445.0 9.9 39.0 31.0 235.0 7.6 1.0 0.0 0.0 1.0 0.5 3.0 6.0 5.0 3.0 26.0 8.7 746.0 362.5 3689.0 10.2
Darchula 125.0 42.0 504.0 12.0 18.0 12.0 120.0 10.0 145.0 73.0 468.0 6.4 30.0 20.0 220.0 11.0 10.0 7.0 77.0 11.0 4.0 2.0 14.0 7.0 4.0 2.0 18.0 9.0 4.0 2.0 15.0 7.5 340.0 160.0 1436.0 9.0
FW. MOUNTAIN 646.0 317.0 3366.0 10.6 146.5 100.0 1037.5 10.4 383.5 153.0 833.8 5.4 132.0 92.0 840.5 9.1 88.0 71.0 500.1 7.0 7.0 3.0 22.0 15.0 9.0 2.5 21.0 8.4 9.0 5.0 41.0 8.2 0.0 0.0 0.0 0.0 0.0 0.0 0.0 0.0 1421.0 743.5 6661.9 9.0
Achham 18.0 11.0 71.5 6.5 71.0 52.0 494.0 9.5 183.0 32.0 144.0 4.5 42.0 31.0 217.0 7.0 21.0 15.0 90.0 6.0 5.0 2.8 15.4 5.5 2.0 1.0 5.0 5.0 6.0 3.0 13.5 4.5 3.0 1.0 9.5 9.5 351.0 148.8 1059.9 7.1
Doti 64.0 40.0 320.0 8.0 52.0 38.0 304.0 8.0 198.0 110.0 275.0 2.5 42.0 37.0 222.0 6.0 26.0 20.0 120.0 6.0 16.0 15.0 82.5 5.5 1.0 0.5 3.0 6.0 5.0 2.0 12.6 6.3 404.0 262.5 1339.1 5.1
Baitadi 224.0 92.0 644.0 7.0 72.5 55.0 660.0 12.0 398.0 164.0 850.0 5.2 60.5 53.0 386.0 7.3 44.5 40.0 415.0 10.4 20.5 16.5 164.0 9.9 6.0 15.0 130.0 8.7 1.0 0.5 3.5 7.0 827.0 436.0 3252.5 7.5
Dadeldhura 5.0 5.0 30.0 6.0 53.0 48.0 384.0 8.0 105.0 75.0 750.0 10.0 90.0 82.0 430.5 5.3 58.0 54.0 540.0 10.0 23.0 23.0 184.0 8.0 3.0 2.0 16.0 8.0 61.0 57.0 342.0 6.0 4.0 4.0 32.8 8.2 3.0 405.0 350.0 2709.3 7.7
FW. HILLS 311.0 148.0 1065.5 7.2 248.5 193.0 1842.0 9.5 884.0 381.0 2019.0 5.3 234.5 203.0 1255.5 6.2 149.5 129.0 1165.0 9.0 64.5 57.3 445.9 7.8 6.0 3.5 24.0 6.9 78.0 77.0 498.1 6.5 8.0 5.5 45.8 8.3 3.0 0.0 0.0 0.0 1987.0 1197.3 8360.8 7.0
Kailali 80.0 70.0 560.0 8.0 20.0 18.0 126.0 7.0 100.0 88.0 686.0 7.8
FW. TERAI 80.0 70.0 560.0 8.0 20.0 18.0 126.0 7.0 100.0 88.0 686.0 7.8
FW. REGION 957.0 465.0 4431.5 9.5 475.0 363.0 3439.5 9.5 1267.5 534.0 2852.8 5.3 386.5 313.0 2222.0 7.1 237.5 200.0 1665.1 8.3 71.5 60.3 467.9 7.8 15.0 6.0 45.0 7.5 87.0 82.0 539.1 6.6 8.0 5.5 45.8 8.3 3.0 0.0 0.0 0.0 3508.0 2028.8 15708.7 7.7
NEPAL 11165.9 5599.7 43502.1 7.8 4396.5 3386.0 34151.9 10.1 3651.8 1849.7 7839.1 4.2 2426.3 1944.3 13318.6 6.9 1770.2 1443.1 10508.3 7.3 403.0 294.3 2735.1 9.3 451.8 311.0 2401.3 7.7 596.1 461.8 2842.6 6.2 1980.2 1502.6 10488.2 7.0 283.0 52.5 368.1 7.0 27124.8 16849.5 128155.1 7.6
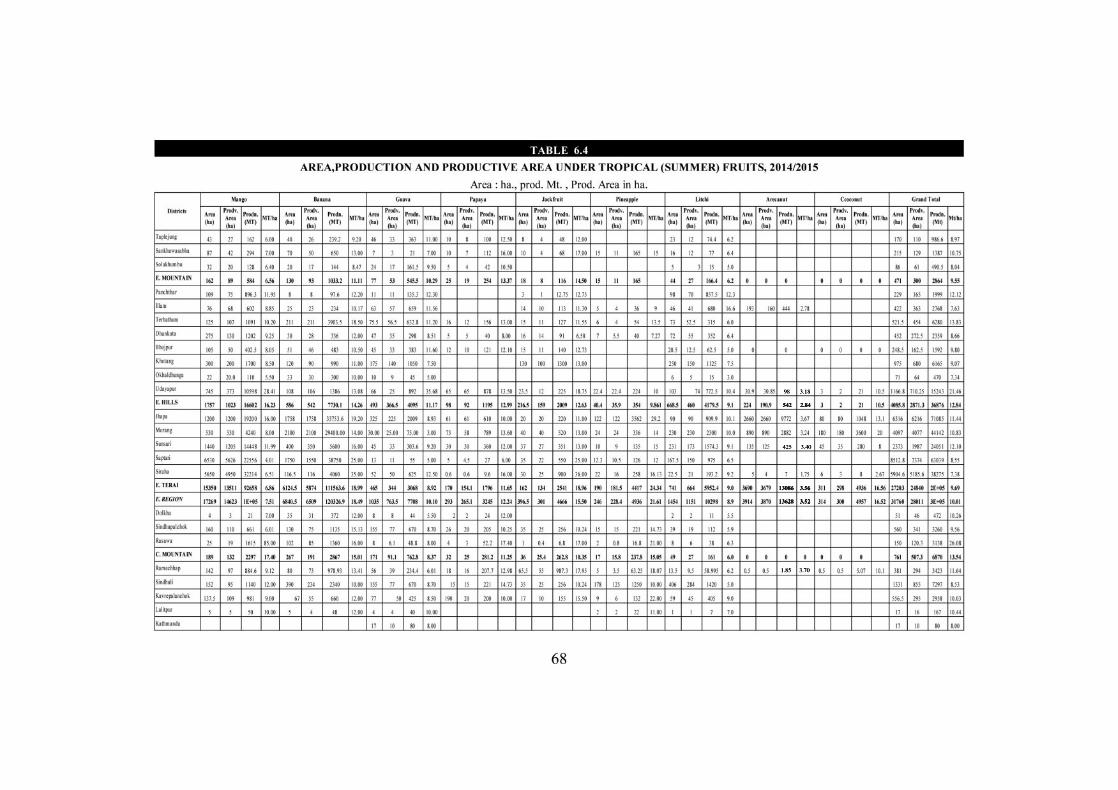
98
425
1.85 3.70
3.40
542
13086
13628 3.52
3.56
2.84
3.18
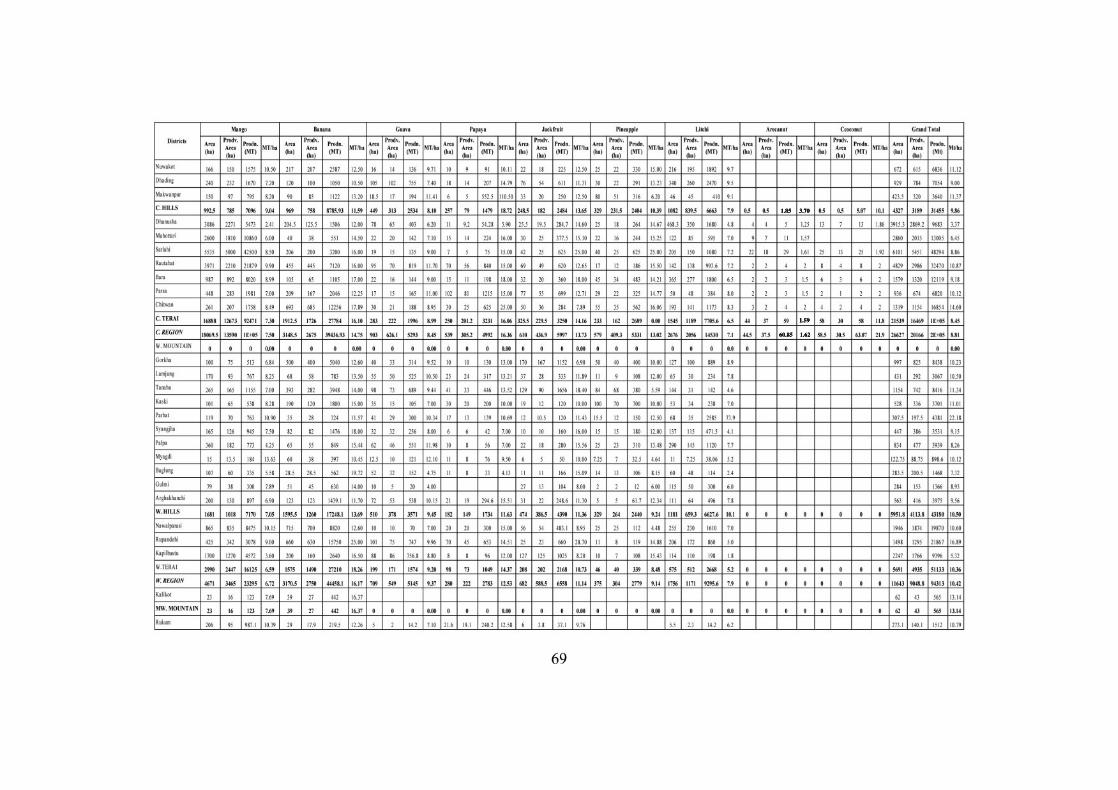
1.85 3.70
1.59
60.85 1.62
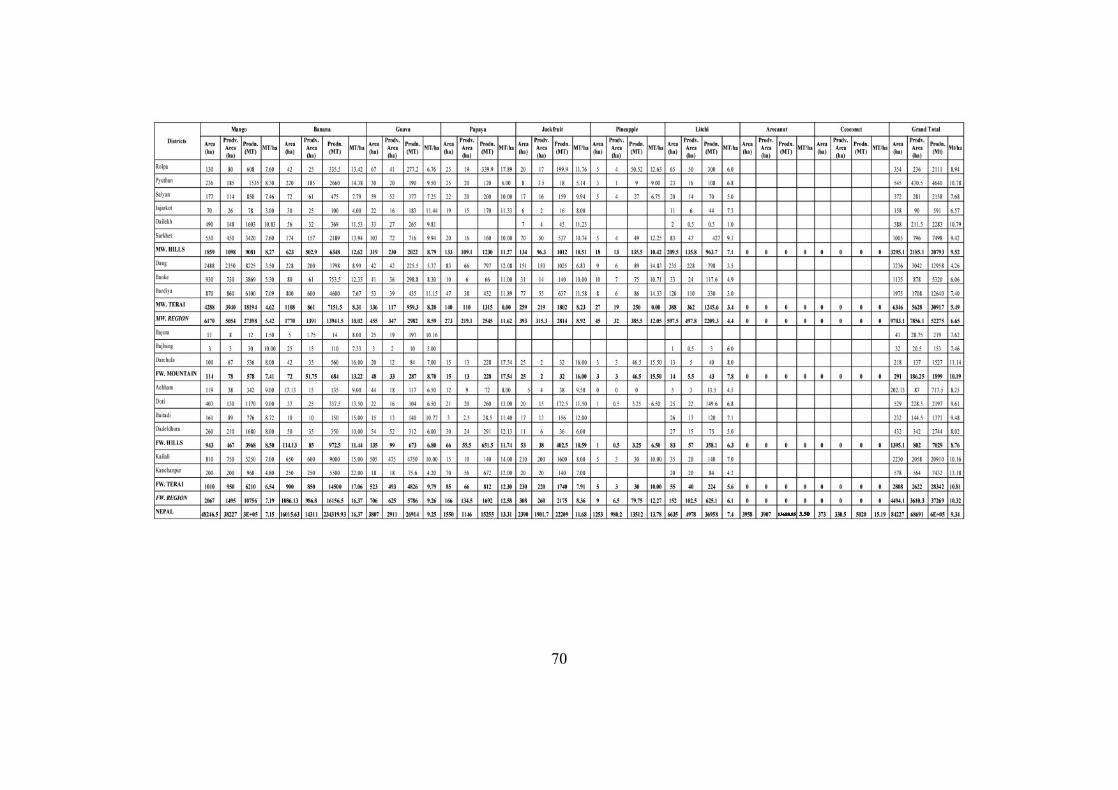
3.5013688.85
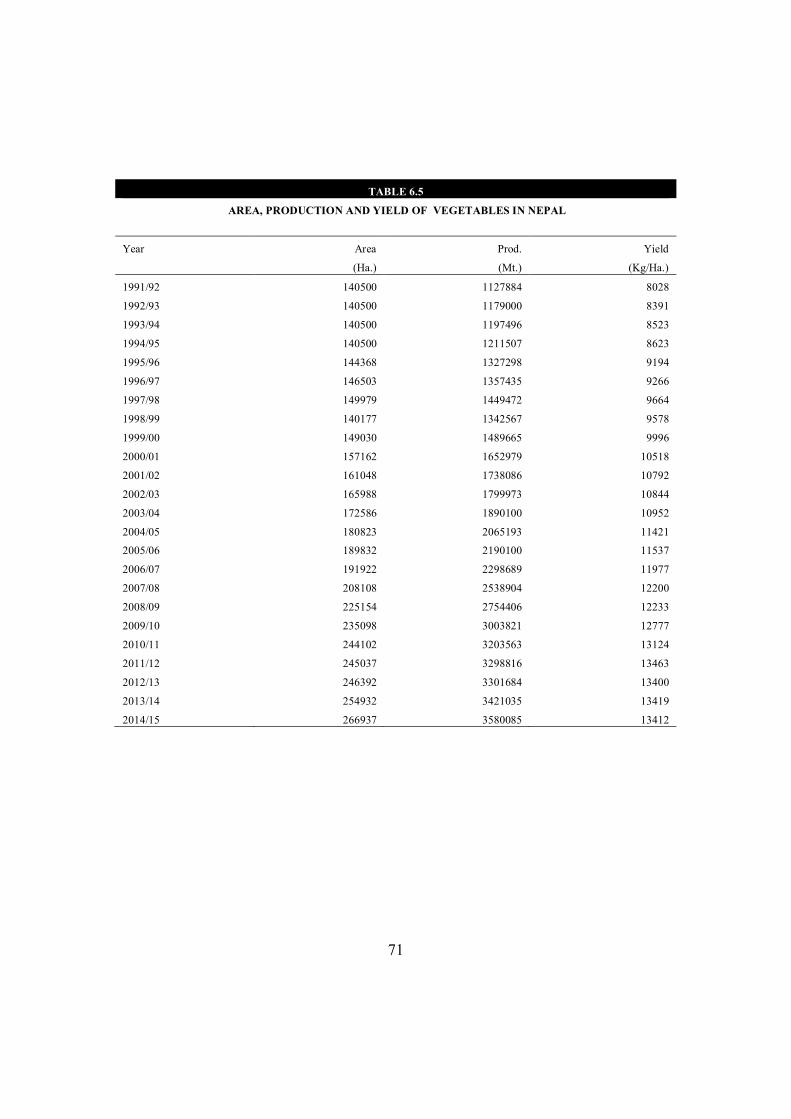
71
TABLE 6.5
AREA, PRODUCTION AND YIELD OF VEGETABLES IN NEPAL
Year Area Prod. Yield
(Ha.) (Mt.) (Kg/Ha.)
1991/92 140500 1127884 8028
1992/93 140500 1179000 8391
1993/94 140500 1197496 8523
1994/95 140500 1211507 8623
1995/96 144368 1327298 9194
1996/97 146503 1357435 9266
1997/98 149979 1449472 9664
1998/99 140177 1342567 9578
1999/00 149030 1489665 9996
2000/01 157162 1652979 10518
2001/02 161048 1738086 10792
2002/03 165988 1799973 10844
2003/04 172586 1890100 10952
2004/05 180823 2065193 11421
2005/06 189832 2190100 11537
2006/07 191922 2298689 11977
2007/08 208108 2538904 12200
2008/09 225154 2754406 12233
2009/10 235098 3003821 12777
2010/11 244102 3203563 13124
2011/12 245037 3298816 13463
2012/13 246392 3301684 13400
2013/14 254932 3421035 13419
2014/15 266937 3580085 13412
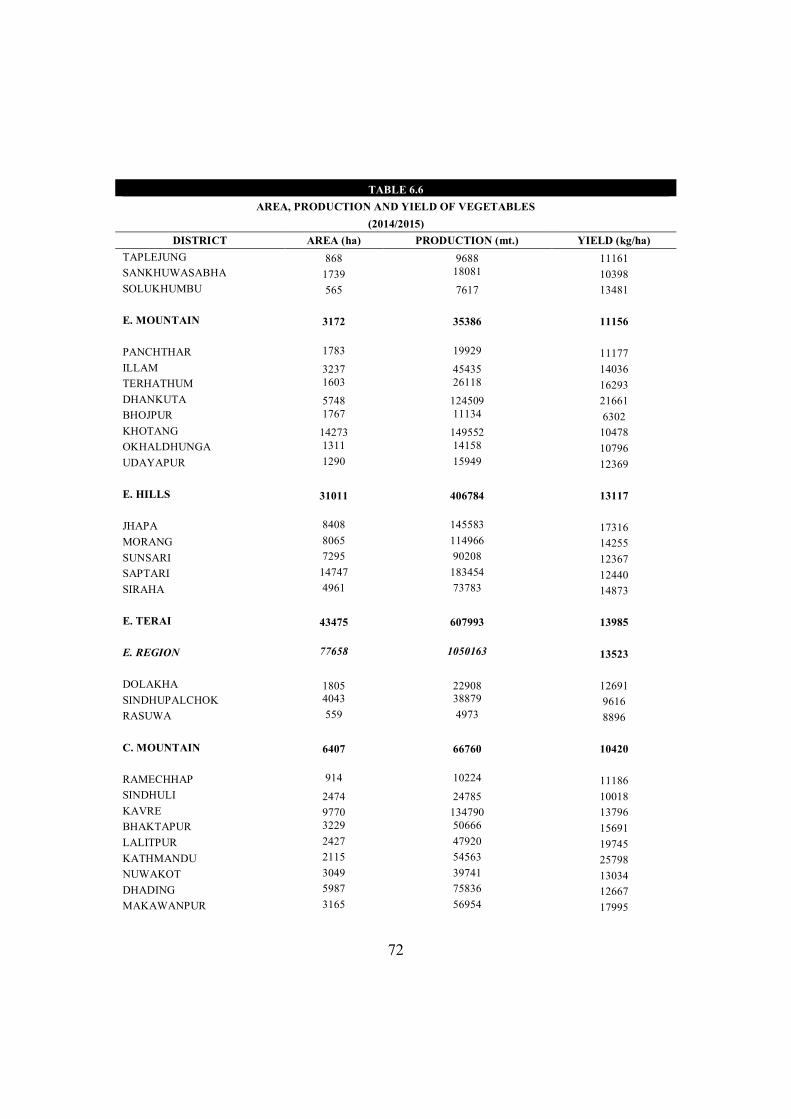
72
TABLE 6.6
AREA, PRODUCTION AND YIELD OF VEGETABLES (2014/2015)
DISTRICT AREA (ha) PRODUCTION (mt.) YIELD (kg/ha) TAPLEJUNG 868 9688 11161 SANKHUWASABHA 1739 18081 10398 SOLUKHUMBU 565 7617 13481
E. MOUNTAIN 3172 35386 11156
PANCHTHAR 1783 19929 11177 ILLAM 3237 45435 14036 TERHATHUM 1603 26118 16293 DHANKUTA 5748 124509 21661 BHOJPUR 1767 11134 6302 KHOTANG 14273 149552 10478 OKHALDHUNGA 1311 14158 10796 UDAYAPUR 1290 15949 12369
E. HILLS 31011 406784 13117
JHAPA 8408 145583 17316 MORANG 8065 114966 14255 SUNSARI 7295 90208 12367 SAPTARI 14747 183454 12440 SIRAHA 4961 73783 14873
E. TERAI 43475 607993 13985
E. REGION 77658 1050163 13523
DOLAKHA 1805 22908 12691 SINDHUPALCHOK 4043 38879 9616 RASUWA 559 4973 8896
C. MOUNTAIN 6407 66760 10420
RAMECHHAP 914 10224 11186 SINDHULI 2474 24785 10018 KAVRE 9770 134790 13796 BHAKTAPUR 3229 50666 15691 LALITPUR 2427 47920 19745 KATHMANDU 2115 54563 25798 NUWAKOT 3049 39741 13034 DHADING 5987 75836 12667 MAKAWANPUR 3165 56954 17995
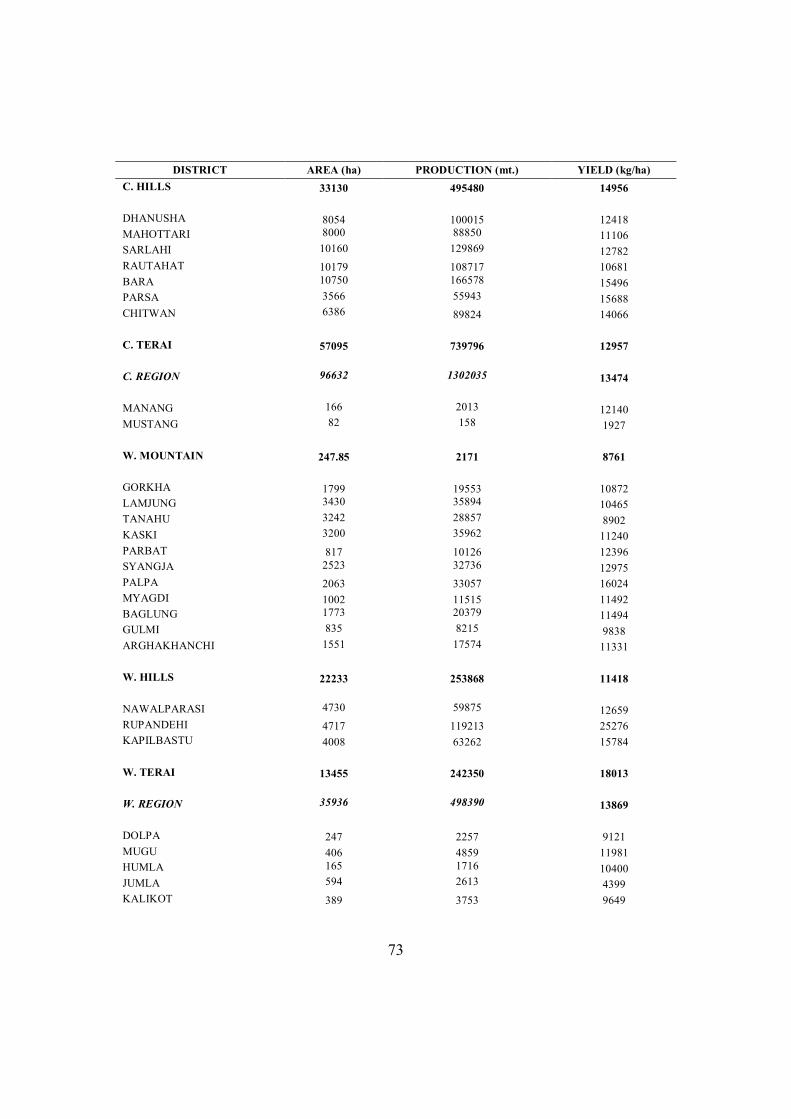
73
DISTRICT AREA (ha) PRODUCTION (mt.) YIELD (kg/ha) C. HILLS 33130 495480 14956
DHANUSHA 8054 100015 12418 MAHOTTARI 8000 88850 11106 SARLAHI 10160 129869 12782 RAUTAHAT 10179 108717 10681 BARA 10750 166578 15496 PARSA 3566 55943 15688 CHITWAN 6386 89824 14066
C. TERAI 57095 739796 12957
C. REGION 96632 1302035 13474
MANANG 166 2013 12140 MUSTANG 82 158 1927
W. MOUNTAIN 247.85 2171 8761
GORKHA 1799 19553 10872 LAMJUNG 3430 35894 10465 TANAHU 3242 28857 8902 KASKI 3200 35962 11240 PARBAT 817 10126 12396 SYANGJA 2523 32736 12975 PALPA 2063 33057 16024 MYAGDI 1002 11515 11492 BAGLUNG 1773 20379 11494 GULMI 835 8215 9838 ARGHAKHANCHI 1551 17574 11331
W. HILLS 22233 253868 11418
NAWALPARASI 4730 59875 12659 RUPANDEHI 4717 119213 25276 KAPILBASTU 4008 63262 15784
W. TERAI 13455 242350 18013
W. REGION 35936 498390 13869
DOLPA 247 2257 9121 MUGU 406 4859 11981 HUMLA 165 1716 10400 JUMLA 594 2613 4399 KALIKOT 389 3753 9649
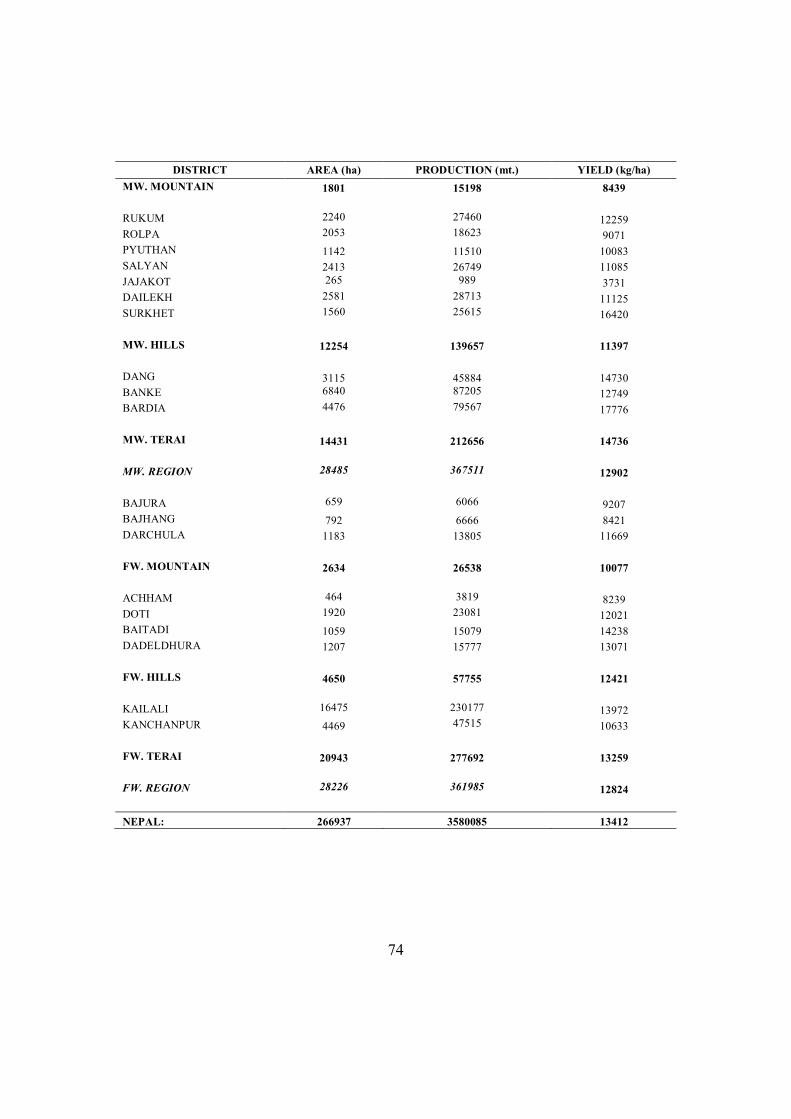
74
DISTRICT AREA (ha) PRODUCTION (mt.) YIELD (kg/ha) MW. MOUNTAIN 1801 15198 8439
RUKUM 2240 27460 12259 ROLPA 2053 18623 9071 PYUTHAN 1142 11510 10083 SALYAN 2413 26749 11085 JAJAKOT 265 989 3731 DAILEKH 2581 28713 11125 SURKHET 1560 25615 16420
MW. HILLS 12254 139657 11397
DANG 3115 45884 14730 BANKE 6840 87205 12749 BARDIA 4476 79567 17776
MW. TERAI 14431 212656 14736
MW. REGION 28485 367511 12902
BAJURA 659 6066 9207 BAJHANG 792 6666 8421 DARCHULA 1183 13805 11669
FW. MOUNTAIN 2634 26538 10077
ACHHAM 464 3819 8239 DOTI 1920 23081 12021 BAITADI 1059 15079 14238 DADELDHURA 1207 15777 13071
FW. HILLS 4650 57755 12421
KAILALI 16475 230177 13972 KANCHANPUR 4469 47515 10633
FW. TERAI 20943 277692 13259
FW. REGION 28226 361985 12824
NEPAL: 266937 3580085 13412
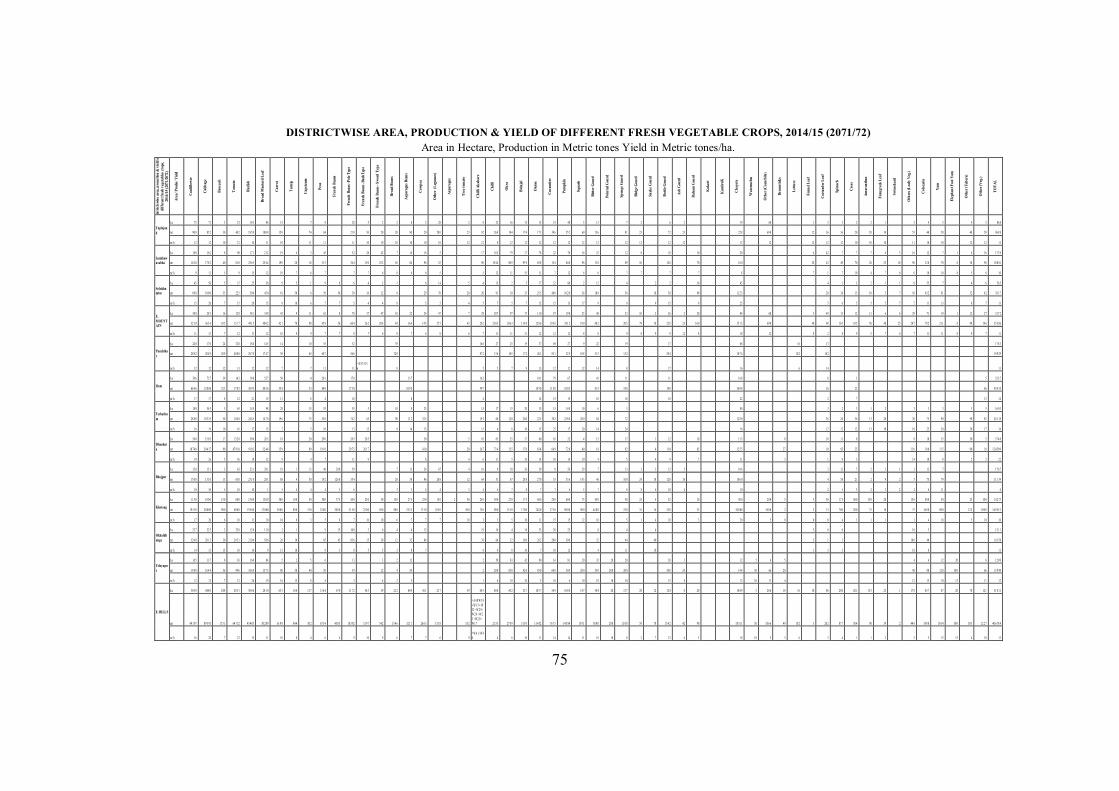
75
DISTRICTWISE AREA, PRODUCTION & YIELD OF DIFFERENT FRESH VEGETABLE CROPS, 2014/15 (2071/72) Area in Hectare, Production in Metric tones Yield in Metric tones/ha.
Di
stric
tswi
se a
rea,
pro
uctio
n &
yield
of
diffe
rent
fres
h ve
geta
bles
crop
s,
2014
/15 (
2071
/2072
)
Area
/ Pro
dn/ Y
ield
Caul
iflow
er
Cabb
age
Broc
coli
Tom
ato
Radi
sh
Broa
d M
usta
rd L
eaf
Carr
ot
Turn
ip
Caps
icum
Peas
Fren
ch B
eans
Fren
ch B
eans
-Pol
e Typ
e
Fren
ch B
eans
-Bus
hTyp
e
Fren
ch B
eans
- Swo
rd T
ype
Broa
d Be
ans
Aspa
ragu
s Bea
ns
Cowp
ea
Oth
er (
Legu
mes
)
Aspa
ragu
s
Tree
tom
ato
Chill
i Aka
bare
Chill
i
Okr
a
Brin
jal
Oni
on
Cucu
mbe
r
Pum
pkin
Squa
sh
Bitte
r Gou
rd
Poin
ted G
ourd
Spon
ge G
ourd
Ridg
e Gou
rd
Snak
e Gou
rd
Bottl
e Gou
rd
Ash
Gou
rd
Balsa
m G
ourd
Kak
ari
Kun
druK
Chay
ote
Wat
erm
elon
Oth
er (C
ucur
bits)
Drum
stick
s
Lettu
ce
Fenn
el Le
af
Coria
nder
Lea
f
Spin
ach
Cres
s
Amar
anth
us
Fenu
gree
k Le
af
Swiss
char
d
Oth
ers (
Leaf
y Ve
g.)
Colo
casia
Yam
Elep
hant
Foo
t Yam
Oth
er (T
uber
s)
Oth
er (V
eg.)
TOTA
L
Taplejung
h a 75 71 3 23 18 5 96 15 7 8 20 5 2 2 8 2 28 2 8 32 16 15 15 33 48 5 13 7 2 6 2 19 60 1 3 3 2 2 1 5 4 5 4 5 86 8
m t 90 0 85 2 30 48 2 18 5 0 10 0 8 15 0 74 84 21 0 50 20 20 80 20 28 0 23 92 26 8 18 4 17 4 17 3 39 6 55 2 60 15 6 81 23 72 23 22 8 69 0 12 36 36 20 20 10 55 40 50 48 58 96 8 8
m /h 12 12 10 21 10 11 10 11 11 11 10 10 10 10 10 10 12 12 8 12 12 12 12 12 12 12 12 12 12 12 12 12 12 12 12 10 10 10 11 10 10 12 12 11
Sankhuwasabha
h a 18 0 16 2 8 90 17 1 21 2 19 4 3 45 52 28 42 7 14 16 5 17 16 2 79 17 78 22 70 16 23 12 8 18 10 20 4 42 7 7 7 4 3 16 12 7 1 4 16 17 3 9
m t 16 2 0 17 8 2 40 81 0 25 6 5 25 4 4 19 0 28 18 31 5 36 4 19 6 25 2 56 84 96 25 90 19 4 4 86 9 93 9 85 8 15 4 84 0 96 13 8 89 56 12 6 70 16 0 28 42 49 70 28 25 18 96 12 0 70 8 18 96 18 0 81
m /h 9 11 5 9 15 12 10 7 6 7 7 7 6 8 6 6 5 5 12 11 55 11 7 12 6 6 7 7 7 7 8 7 1 7 10 4 7 6 6 10 10 8 5 6 10
Solukhumbu
h a 45 50 5 15 25 30 9 5 1 9 8 6 4 3 1 6 14 5 4 13 2 5 17 32 80 2 12 4 2 2 10 45 4 3 3 2 1 1 8 55 7 4 6 56 5
m t 69 0 10 0 0 35 22 5 50 0 45 0 81 50 6 59 56 30 16 12 8 29 70 20 20 91 10 35 25 5 48 0 10 2 0 34 10 8 36 18 30 90 11 2 5 20 18 15 10 5 7 56 63 2 91 32 42 76 1 7
m /h 15 20 7 15 20 15 9 10 6 7 7 5 4 4 8 5 5 4 5 7 5 7 15 15 13 17 9 9 9 15 9 25 5 6 5 5 5 7 7 11 13 8 7 13
E. MOUNTAIN
h a 30 0 28 3 16 12 8 38 1 33 8 43 9 11 62 8 78 37 47 10 22 24 47 7 29 20 7 97 37 11 0 87 19 8 23 48 23 10 2 26 2 20 84 60 5 49 13 12 11 6 4 29 71 19 1 12 27 31 7 2
m t 32 1 0 36 3 4 10 5 15 1 7 49 1 5 40 0 2 42 1 78 98 45 8 56 60 4 26 2 28 4 84 16 4 14 5 37 5 43 20 2 23 0 3 10 6 3 11 4 8 12 8 6 10 3 0 24 1 2 19 0 40 2 20 5 79 18 22 8 23 16 0 15 1 3 69 0 40 98 10 3 10 5 58 40 25 20 7 79 2 21 1 8 98 19 6 35 3 86
m /h 11 13 7 12 13 12 10 9 9 7 7 8 7 6 8 7 6 8 6 7 11 11 31 12 12 12 8 8 9 8 9 9 12 8 18 12 8 2 8 9 5 7 6 7 11 11 8 9 7 11
Panchthar
h a 24 0 17 0 24 32 0 18 0 14 5 14 10 55 52 39 16 6 27 25 19 37 69 27 9 22 19 17 68 16 13 17 8 3
m t 28 9 2 20 4 9 28 9 40 0 0 20 7 0 17 4 7 95 65 60 7 56 6 32 0 87 2 13 6 18 5 17 2 48 1 83 1 32 5 10 8 31 3 15 2 29 4 10 7 4 10 2 18 2 19 9 29
m /h 12 12 12 13 12 12 7 7 11 11
=X4 7 /O16 8 5 5 7 9 13 12 12 12 14 8 17 16 6 14 11
Ilam
h a 39 6 72 7 39 14 2 18 0 52 7 50 4 20 1 17 8 13 7 16 2 10 1 79 67 41 11 11 16 8 8 3 5 32 3 7
m t 66 4 6 12 0 08 32 3 17 0 5 36 9 5 80 3 6 55 4 33 84 0 17 3 0 10 5 0 59 7 14 5 0 11 5 0 10 0 5 41 5 19 8 19 8 36 9 8 16 22 66 45 4 35
m /h 17 17 8 12 21 15 11 8 4 10 8 4 14 15 15 10 18 18 22 2 7 13 14
Terhathum
h a 18 0 54 5 5 65 14 5 98 28 15 55 55 5 10 8 25 15 17 15 20 15 15 14 0 10 6 3 80 3 2 3 1 2 3 3 3 3 5 16 0 3
m t 28 8 0 10 3 55 50 10 4 0 24 6 5 14 7 0 19 6 75 55 0 74 2 65 90 11 2 32 5 19 3 68 12 0 20 0 22 5 38 2 23 8 0 20 0 84 72 12 8 0 36 24 36 13 20 30 75 90 90 85 26 1 18
m /h 16 19 10 16 17 15 7 5 10 13 13 9 14 13 13 4 8 10 15 25 17 20 14 24 16 12 12 12 13 10 10 25 30 30 17 16
Dhankuta
h a 56 0 15 0 5 17 13 2 0 50 0 26 5 18 20 29 0 26 5 28 5 50 5 65 65 25 17 60 65 52 4 15 17 1 12 10 11 5 8 10 11 8 8 10 15 50 5 57 4 8
m t 10 7 49 39 4 17 90 47 9 10 91 0 3 32 4 4 15 9 89 19 1 0 29 7 5 26 1 7 41 0 20 36 7 71 4 12 5 17 0 83 4 66 9 72 8 40 61 92 4 11 0 65 12 5 5 27 10 95 25 11 0 10 0 11 5 90 10 12 4 50 9
m /h 19 26 5 36 18 12 9 4 7 11 9 8 4 6 11 5 10 14 10 14 10 4 5 4 9 7 11 3 1 9 3 14 10 8 2 2 22
Bhojpur
h a 13 0 13 1 3 63 23 1 28 1 18 1 13 48 28 0 59 7 13 24 67 4 16 9 10 36 39 8 56 29 7 13 3 3 12 5 10 6 2 12 7 2 3 1 3 13 7 17 6 7
m t 13 0 0 13 1 0 13 63 0 23 1 0 28 1 88 4 50 19 2 12 6 0 35 4 20 38 96 26 8 12 64 51 67 28 8 27 0 53 33 6 14 3 46 10 0 24 18 12 0 18 10 6 0 4 58 21 2 9 2 5 75 79 11 1 34
m /h 10 10 5 10 10 1 5 4 4 4 5 6 3 3 4 4 3 4 6 7 8 7 7 6 5 7 8 8 6 10 4 10 2 5 3 2 3 2 2 6 11 6
Khotang
h a 11 5 0 10 0 0 15 0 60 0 15 0 0 13 0 0 50 0 10 0 50 50 0 37 5 45 0 25 0 50 15 0 27 5 25 0 15 0 2 50 25 0 30 0 27 0 17 5 68 0 25 0 60 0 75 45 0 50 25 4 52 10 50 0 20 0 5 5 50 17 5 40 0 15 0 20 15 0 40 0 50 25 10 0 14 2 73
m t 19 5 50 20 0 00 90 0 60 0 0 19 5 00 13 0 00 50 0 0 80 0 15 0 25 0 0 30 0 0 31 5 0 25 0 0 50 0 90 0 19 2 5 17 5 0 10 5 0 50 0 75 0 90 0 13 5 0 17 0 0 74 8 0 37 5 0 90 0 0 90 0 45 0 0 25 0 35 16 52 0 25 10 0 00 10 0 0 2 2 13 70 0 20 0 75 10 75 16 0 0 90 0 12 5 10 0 0 14 9 55 2
m /h 17 20 6 10 13 10 10 8 3 5 8 7 10 10 6 7 7 7 10 3 3 5 10 11 15 15 12 10 5 1 4 10 3 20 5 0 0 0 4 1 1 1 1 4 18 5 10 10
Okhaldhunga
h a 23 7 22 5 2 25 8 15 0 11 0 2 1 9 15 10 0 3 6 4 4 12 19 16 4 18 35 20 25 8 4 4 5 0 0 10 5 13 1 1
m t 32 0 0 28 1 3 30 24 5 1 21 0 0 93 6 26 10 85 45 83 6 15 30 12 32 84 76 64 32 18 0 26 2 20 0 30 0 32 44 40 3 1 1 18 0 40 14 1 58
m /h 14 13 15 10 14 9 13 10 9 3 8 5 5 3 8 7 4 4 8 10 7 10 12 4 11 10 1 3 3 18 8 11
Udayapur
h a 16 5 13 7 8 83 16 0 84 5 2 5 6 13 3 2 12 2 50 83 42 90 63 81 20 35 20 20 20 3 12 5 6 5 4 6 12 20 6 12 9 0
m t 19 8 0 16 4 4 56 99 6 41 6 0 15 7 5 80 30 40 50 39 12 4 54 2 20 0 83 0 42 0 45 0 64 0 50 9 20 0 35 0 20 0 20 0 30 0 24 14 4 50 66 20 48 90 12 0 30 0 66 15 9 49
m /h 12 12 7 12 26 19 16 15 8 8 3 4 2 5 1 4 10 10 5 10 6 10 10 10 10 15 8 12 10 11 4 12 15 10 15 11 12
E. HILLS
h a 30 5 8 44 4 0 24 8 28 5 1 30 4 6 28 1 0 63 5 10 4 11 7 11 6 4 67 0 11 7 2 54 3 59 21 2 44 9 36 1 21 7 59 69 5 48 4 43 2 32 7 10 5 7 56 9 10 4 8 14 7 58 4 20 13 7 28 12 12 4 8 20 10 4 9 5 20 6 18 16 10 86 20 0 42 1 15 3 25 1 17 8 43 7 87 20 78 12 1 31 0 11
m t 49 1 97 89 5 95 17 5 1 64 7 32 45 4 03 30 2 89 61 9 8 84 4 50 2 67 3 4 43 0 5 10 3 92 51 9 7 54 2 13 4 6 32 1 1 26 6 5 13 1 8 53 2
=A4 0 W3 8+W3 5 + W32 +W2 9 +W2 6 +W23 +W2 0 +W1 7 21 3 3 27 0 9 31 3 0 11 4 52 76 7 5 14 5 84 15 9 1 58 0 0 20 0 11 0 8 59 78 15 4 2 42 90 18 5 11 50 10 6 6 49 10 2 5 26 2 87 7 30 4 90 39 2 44 8 19 8 0 13 0 4 30 0 30 5 12 2 7 40 6 78 4
m /h 16 20 7 23 15 11 10 8 4 6 6 9 10 9 6 7 7 6 9
=W4 1 /W40 4 6 10 11 14 14 11 10 10 8 2 7 12 6 5 18 10 5 3 6 3 4 1 1 2 3 5 15 15 4 10 13
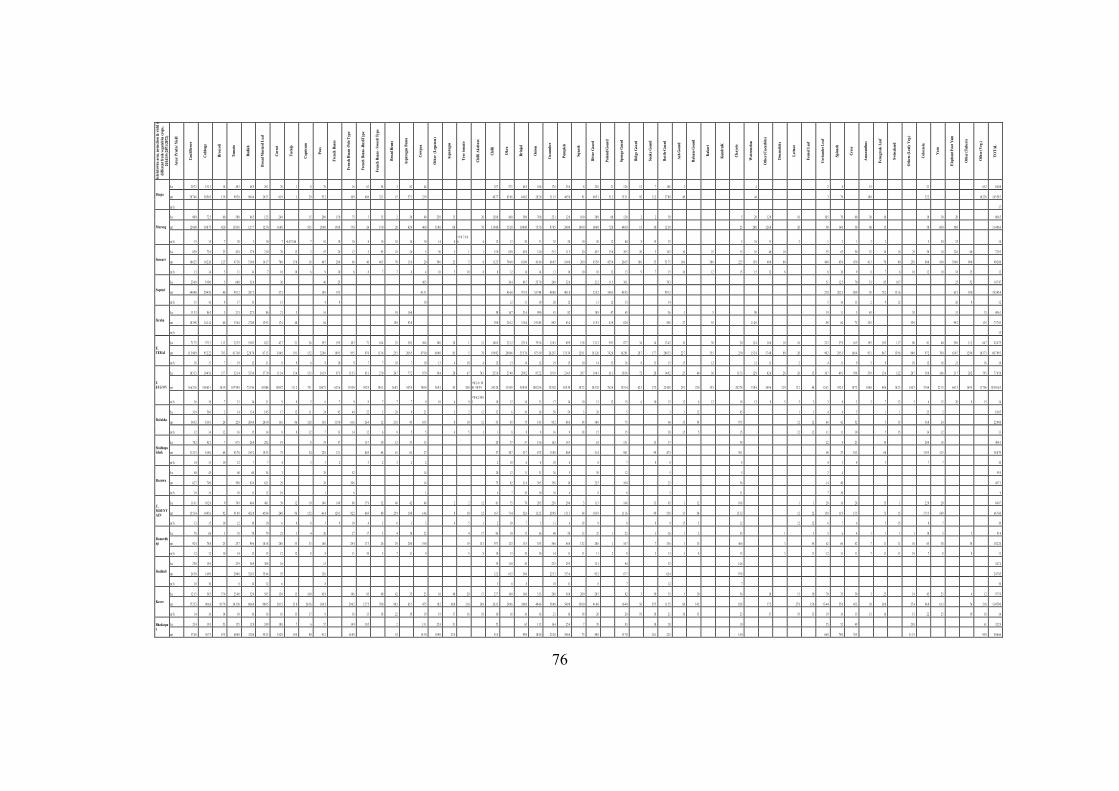
76
Dist
ricts
wise
are
a, p
rouc
tion
& yi
eld of
di
ffere
nt fr
esh
vege
tabl
es cr
ops,
20
14/1
5 (20
71/20
72)
Area
/ Pro
dn/ Y
ield
Caul
iflow
er
Cabb
age
Broc
coli
Tom
ato
Radi
sh
Broa
d M
usta
rd L
eaf
Carr
ot
Turn
ip
Caps
icum
Peas
Fren
ch B
eans
Fren
ch B
eans
-Pol
e Typ
e
Fren
ch B
eans
-Bus
hTyp
e
Fren
ch B
eans
- Swo
rd T
ype
Broa
d Be
ans
Aspa
ragu
s Bea
ns
Cowp
ea
Oth
er (
Legu
mes
)
Aspa
ragu
s
Tree
tom
ato
Chill
i Aka
bare
Chill
i
Okr
a
Brin
jal
Oni
on
Cucu
mbe
r
Pum
pkin
Squa
sh
Bitte
r Gou
rd
Poin
ted G
ourd
Spon
ge G
ourd
Ridg
e Gou
rd
Snak
e Gou
rd
Bottl
e Gou
rd
Ash
Gou
rd
Balsa
m G
ourd
Kak
ari
Kun
druK
Chay
ote
Wat
erm
elon
Oth
er (C
ucur
bits)
Drum
stick
s
Lettu
ce
Fenn
el Le
af
Coria
nder
Lea
f
Spin
ach
Cres
s
Amar
anth
us
Fenu
gree
k Le
af
Swiss
char
d
Oth
ers (
Leaf
y Ve
g.)
Colo
casia
Yam
Elep
hant
Foo
t Yam
Oth
er (T
uber
s)
Oth
er (V
eg.)
TOTA
L
Jhapa
h a 20 7 2 15 1 3 18 49 2 48 5 20 1 76 1 8 76 16 63 54 3 82 44 25 7 57 1 48 5 18 6 17 6 25 6 8 23 6 21 12 6 12 7 18 8 3 4 2 8 15 21 63 2 84 0 8
m t 38 7 46 30 5 63 13 9 99 3 8 98 4 6 26 5 3 61 9 1 29 53 2 10 9 40 6 32 1 15 57 1 23 9 46 7 7 83 8 6 64 0 2 28 2 0 31 1 5 46 5 0 91 40 5 1 31 2 15 3 1 92 11 2 37 8 8 40 44 3 76 10 8 32 2 10 2 38 14 5 58 3
m /h 17
Morang
h a 80 0 72 5 60 50 0 46 5 12 5 24 0 15 20 0 15 0 75 3 15 2 30 40 25 0 15 20 12 0 0 46 0 50 0 70 0 25 1 12 0 10 0 30 0 60 12 0 2 2 50 5 20 12 0 10 10 5 70 40 30 10 10 30 20 80 6 5
m t 12 0 00 10 8 75 42 0 13 8 65 12 7 7 12 5 0 16 0 0 10 5 20 0 0 15 0 0 75 0 24 15 0 20 42 0 40 0 35 0 0 60 70 13 8 00 55 2 0 10 0 00 73 5 0 87 8 5 24 0 0 10 0 0 60 0 0 72 0 48 0 0 15 30 12 5 0 25 20 0 12 6 0 20 90 14 0 50 60 15 50 60 0 50 0 11 4 96 6
m /h 15 15 7 28 3 10 7 =J 4 7/ J 46 7 10 10 10 8 10 10 14 10 14 4
=V4 7 /V46 4 12 12 20 11 35 20 10 20 12 40 8 15 25 5 10 11 2 1 2 1 2 2 5 20 25 14
Sunsari
h a 85 0 73 0 25 43 0 37 0 21 0 70 15 3 55 20 12 5 95 10 26 5 50 5 1 1 15 0 65 0 45 0 31 0 51 5 11 5 20 45 5 35 0 20 5 20 5 34 5 10 25 15 10 40 10 55 65 50 52 10 10 25 50 10 22 0 60 72 9 5
m t 10 6 25 10 2 20 12 5 47 3 0 51 8 0 14 1 7 70 0 15 0 18 49 5 20 0 96 40 66 5 70 15 6 20 50 0 25 5 8 11 2 5 78 0 0 63 0 0 43 4 0 66 9 5 18 4 0 20 0 45 5 0 45 5 0 26 6 5 18 0 35 51 7 5 16 0 30 0 22 5 15 0 48 0 80 44 0 65 0 45 0 41 3 70 80 25 0 60 0 10 0 39 6 0 90 0 90 2 08
m /h 13 14 5 11 14 7 10 10 6 9 10 8 8 7 7 6 4 10 5 10 8 8 12 14 14 13 16 10 10 13 13 9 7 15 16 12 15 15 12 8 8 10 9 8 7 8 10 12 10 18 15 12
Saptari
h a 23 0 0 19 0 0 5 60 0 31 0 30 46 25 40 5 36 4 86 7 53 7 0 24 0 32 6 21 2 11 5 36 1 70 3 51 12 5 70 53 85 10 7 25 52 14 7 47
m t 34 0 40 29 4 50 40 99 1 2 38 7 5 37 5 18 9 19 5 41 3 1 43 6 8 97 1 0 53 7 04 48 0 0 40 1 0 23 3 2 14 0 3 45 8 5 99 1 2 27 0 20 2 5 88 9 95 78 2 13 1 6 65 5 39 0 18 3 45 4
m /h 15 16 8 17 13 13 4 8 10 12 11 10 20 12 11 12 13 14 5 16 13 2 9 12 26 8 12
Siraha
h a 11 5 3 86 5 5 21 3 27 3 86 21 5 16 10 16 4 58 16 7 21 6 99 0 81 82 10 9 47 65 56 3 5 90 19 11 5 45 55 31 15 49 6 1
m t 18 3 98 14 1 14 60 33 0 4 27 0 0 13 9 3 17 4 40 64 15 0 93 8 29 0 20 1 2 31 6 4 19 3 05 89 2 63 4 11 9 3 43 9 62 0 50 8 27 55 11 4 0 98 64 75 25 5 55 0 99 2 13 5 73 7 83
m /h 15
E. TERAI
h a 71 7 5 57 3 3 11 3 22 3 5 19 0 3 62 2 43 7 21 26 39 3 19 5 10 3 71 16 4 25 30 2 49 4 30 0 20 1 21 16 6 5 22 1 2 25 1 8 75 5 6 12 6 3 89 9 12 8 13 1 2 59 3 87 7 34 14 13 4 2 16 30 20 12 4 16 0 10 10 23 2 27 9 16 5 19 5 10 5 11 7 80 81 40 29 6 11 2 64 7 43 4 75
m t 11 3 80 9 95 2 22 78 3 41 7 49 22 8 78 67 1 3 34 6 8 19 1 15 2 32 8 0 18 9 5 95 5 47 0 11 3 6 25 5 20 8 5 47 9 0 40 0 0 85 5 78 19 8 92 28 0 86 35 5 76 87 5 19 24 2 87 13 5 34 12 9 1 18 1 26 74 2 4 14 2 01 28 7 17 7 20 6 33 22 7 35 5 25 0 15 3 4 17 4 0 80 20 90 2 29 5 5 14 6 4 93 1 86 7 13 9 6 80 0 97 2 70 0 61 0 7 12 9 0 10 3 73 60 7 99 3
m /h 16 17 7 19 12 11 8 9 6 8 10 9 7 7 10 7 10 13 4 10 4 12 13 14 12 19 15 10 14 13 16 8 13 15 15 12 12 11 2 4 11 9 5 8 10 12 18 21 16 14
E . R E GI ON
h a 10 5 33 10 4 56 37 7 52 1 4 53 3 0 37 7 0 11 1 4 13 4 15 3 16 1 9 87 3 13 5 3 65 1 27 0 24 7 77 2 87 9 56 4 20 67 74 5 23 5 6 27 4 0 28 8 2 87 2 2 19 1 9 21 4 5 29 7 19 4 3 61 3 10 3 6 72 28 14 9 2 25 40 30 11 5 3 12 9 42 6 28 26 15 36 7 49 1 59 8 35 9 13 6 12 2 28 7 58 8 14 6 31 7 20 2 79 5 77 6 58
m t 16 6 21 6 18 8 45 1 26 3 9 10 7 99 8 73 1 96 41 0 04 10 0 87 11 1 2 75 1 10 4 71 62 5 6 11 9 50 59 2 9 19 6 2 16 8 5 54 5 9 76 0 0 56 9 3 85 58 0
=W1 4 + W41 +W5 9 24 3 28 31 8 58 39 8 54 10 0 25 6 32 9 92 30 5 30 30 7 2 24 3 28 76 2 4 15 5 14 42 5 27 3 22 4 03 29 2 25 0 35 5 20 2 74 15 8 4 34 9 6 12 9 12 2 44 12 6 1 39 3 5 18 7 3 10 8 0 94 6 14 2 3 14 5 5 37 4 4 22 1 5 64 1 5 16 9 3 11 7 96 10 5 01 6 3
m /h 16 18 7 21 14 11 9 8 5 6 7 9 9 7 7 7 9 10 4 9
=W6 2 /W61 10 12 14 11 17 14 10 13 12 15 6 10 15 12 6 12 18 12 8 5 5 3 3 8 3 3 7 12 5 6 15 20 8 15 14
Dolakha
h a 31 9 56 0 2 14 13 6 14 5 17 12 11 24 92 44 22 2 28 9 21 2 2 12 32 6 10 18 58 54 3 20 5 3 1 12 65 1 1 4 4 5 1 1 25 2 18 0 5
m t 36 9 2 81 0 1 24 22 9 20 4 0 20 3 0 13 6 96 12 8 15 6 11 5 0 61 6 26 4 12 21 8 45 10 5 8 10 12 35 45 75 14 3 95 2 48 6 54 30 0 75 60 15 54 97 5 12 12 46 42 52 5 15 36 0 24 22 9 08
m /h 12 14 12 16 15 14 8 8 12 7 13 14 12 6 8 5 5 4 5 1 1 8 8 8 16 9 18 15 15 20 15 5 15 12 12 11 11 10 5 15 14 12 13
Sindhupalchok
h a 78 2 42 3 7 67 5 26 8 28 2 19 8 78 57 15 7 30 12 33 13 29 57 57 15 6 16 2 14 7 63 13 1 13 57 38 22 8 23 14 20 4 18 40 4 3
m t 11 2 15 61 8 0 68 83 7 0 18 5 2 19 3 3 75 24 22 0 13 1 40 5 68 41 63 27 57 58 7 33 7 67 5 15 8 8 80 9 51 4 94 1 99 47 3 30 1 98 37 10 3 68 13 9 5 12 5 38 8 79
m /h 14 15 10 12 7 7 4 3 3 2 3 2 3 2 2 2 10 6 4 10 6 8 7 8 8 8 4 5 4 5 7 7 10
Rasuwa
h a 60 45 60 60 54 3 38 52 14 20 12 11 31 36 5 30 12 5 5 2 4 55 9
m t 62 7 70 0 59 0 63 6 62 1 29 38 30 6 14 75 82 11 4 30 5 35 8 18 22 5 10 0 25 56 14 40 49 7 3
m /h 10 16 10 11 12 10 1 6 1 4 7 10 10 10 4 8 8 5 11 7 10 9
C. MOUNTAIN
h a 11 6 1 10 2 8 9 74 9 46 4 48 1 39 12 19 14 0 14 9 96 17 9 32 40 42 48 2 2 12 81 75 78 20 5 25 6 20 6 3 11 3 14 8 13 65 1 12 10 8 1 1 28 16 28 15 1 22 9 20 64 0 7
m t 15 5 34 14 9 81 92 91 8 9 45 2 8 45 8 4 24 0 96 15 2 41 4 12 8 1 92 2 66 9 80 25 9 10 8 14 6 8 10 12 16 7 71 4 52 6 11 2 3 28 9 8 13 1 3 54 10 3 9 11 1 6 99 55 8 15 54 13 3 2 12 12 15 8 11 9 15 5 73 15 17 5 5 14 9 66 7 60
m /h 13 15 10 12 10 10 6 8 8 3 9 10 4 3 6 3 3 4 5 1 2 10 7 5 11 6 18 9 8 8 9 15 5 12 12 12 6 7 6 5 15 8 7 10
Ramechhap
h a 78 68 3 18 78 79 23 3 4 20 27 17 5 4 18 22 4 17 96 10 15 36 40 58 12 25 1 22 3 26 1 2 35 1 5 5 6 4 1 1 1 1 10 5 5 91 4
m t 92 4 78 8 25 25 7 99 6 10 1 8 28 0 35 33 16 0 29 4 17 3 26 29 20 0 19 0 19 13 3 97 3 12 5 15 5 35 5 56 8 64 8 13 2 28 6 1 16 7 7 33 6 3 15 46 6 3 54 62 66 42 7 11 11 10 65 38 38 10 2 24
m /h 12 12 10 14 13 13 12 12 8 8 11 10 5 7 11 9 5 8 10 13 10 10 14 11 11 11 2 8 2 13 3 8 13 3 11 12 11 11 7 11 11 10 7 8 8 11
Sindhuli
h a 25 0 15 0 23 9 36 9 30 8 10 15 35 11 0 45 23 5 29 5 12 1 94 52 14 6 24 7 4
m t 24 5 0 14 9 0 20 0 8 52 4 3 35 4 4 55 12 0 12 2 61 5 36 0 22 3 3 33 3 4 93 2 67 7 62 4 97 8 24 7 85
m /h 10 10 8 14 12 6 8 3 6 8 10 11 8 7 12 7 10
Kavre
h a 12 1 5 58 5 57 6 25 4 0 52 0 58 3 13 0 15 16 0 45 8 18 6 85 40 42 35 25 10 40 20 17 27 7 16 0 16 0 31 5 28 0 34 8 20 0 20 5 82 3 50 55 5 10 36 10 15 10 70 35 30 3 25 18 45 25 4 12 97 7 0
m t 17 2 53 90 6 8 81 7 9 24 1 30 80 6 0 90 9 5 20 1 5 21 8 26 5 6 38 9 3 29 0 2 12 7 5 70 0 90 3 65 1 47 5 18 5 68 0 31 0 30 8 26 3 2 24 9 6 24 8 0 49 4 6 58 8 0 54 9 8 35 0 0 41 0 0 16 4 0 56 87 5 11 5 5 88 14 5 82 8 17 2 27 8 15 0 13 4 4 55 0 45 3 39 38 8 27 4 96 8 61 3 74 21 8 13 4 79 0
m /h 14 16 14 10 16 16 16 15 17 9 16 15 18 22 19 19 19 17 16 18 10 16 16 16 21 16 18 20 20 19 18 21 18 15 23 17 19 15 19 16 15 13 16 15 22 25 19 18 14
Bhaktapur
h a 23 4 19 3 53 15 5 12 8 24 9 18 0 7 6 57 14 9 10 5 2 13 1 22 4 51 52 65 11 5 16 4 25 4 7 70 83 18 20 10 55 52 49 23 0 61 32 2 9
m t 37 6 0 36 7 5 67 5 60 0 0 32 0 0 55 2 5 34 2 0 10 5 80 91 2 16 8 0 34 14 3 0 10 9 0 25 5 41 4 99 0 18 4 0 25 2 0 38 6 0 75 88 0 13 7 0 26 1 22 5 14 0 66 0 78 0 76 5 31 1 5 93 0 50 6 66
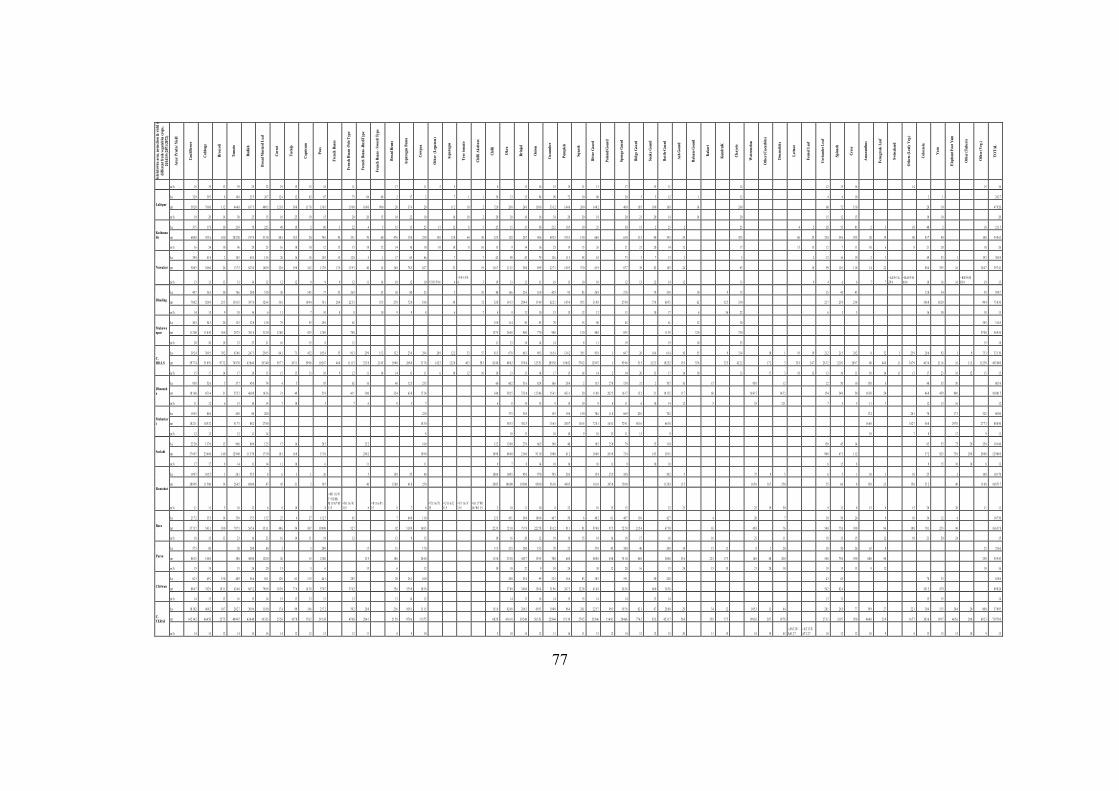
77
Dist
ricts
wise
are
a, p
rouc
tion
& yi
eld of
di
ffere
nt fr
esh
vege
tabl
es cr
ops,
20
14/1
5 (20
71/20
72)
Area
/ Pro
dn/ Y
ield
Caul
iflow
er
Cabb
age
Broc
coli
Tom
ato
Radi
sh
Broa
d M
usta
rd L
eaf
Carr
ot
Turn
ip
Caps
icum
Peas
Fren
ch B
eans
Fren
ch B
eans
-Pol
e Typ
e
Fren
ch B
eans
-Bus
hTyp
e
Fren
ch B
eans
- Swo
rd T
ype
Broa
d Be
ans
Aspa
ragu
s Bea
ns
Cowp
ea
Oth
er (
Legu
mes
)
Aspa
ragu
s
Tree
tom
ato
Chill
i Aka
bare
Chill
i
Okr
a
Brin
jal
Oni
on
Cucu
mbe
r
Pum
pkin
Squa
sh
Bitte
r Gou
rd
Poin
ted G
ourd
Spon
ge G
ourd
Ridg
e Gou
rd
Snak
e Gou
rd
Bottl
e Gou
rd
Ash
Gou
rd
Balsa
m G
ourd
Kak
ari
Kun
druK
Chay
ote
Wat
erm
elon
Oth
er (C
ucur
bits)
Drum
stick
s
Lettu
ce
Fenn
el Le
af
Coria
nder
Lea
f
Spin
ach
Cres
s
Amar
anth
us
Fenu
gree
k Le
af
Swiss
char
d
Oth
ers (
Leaf
y Ve
g.)
Colo
casia
Yam
Elep
hant
Foo
t Yam
Oth
er (T
uber
s)
Oth
er (V
eg.)
TOTA
L
m /h 16 19 13 39 25 22 19 15 13 16 11 17 11 5 5 8 15 16 15 15 11 13 17 15 11 14 12 15 16 14 15 16
Lalitpur
h a 32 0 39 3 8 14 8 25 5 26 7 12 4 12 62 87 75 84 66 2 17 2 7 1 1 36 13 15 94 98 72 10 80 20 5 5 12 1 12 4 6 10 2 1 24 2 7
m t 59 2 0 78 6 0 11 2 44 4 0 63 7 5 40 0 5 12 3 8 30 0 11 7 8 13 0 5 15 0 0 16 8 0 99 0 20 37 4 20 11 2 10 2 72 0 26 0 24 0 15 0 6 33 3 2 14 4 0 20 0 14 4 2 40 0 10 5 10 0 16 8 14 24 0 60 72 15 0 20 10 47 9 20
m /h 19 20 14 30 25 15 10 25 19 15 20 20 15 10 22 10 16 10 2 20 20 16 16 34 20 20 18 20 21 20 14 14 20 15 12 15 10 10 20
Kathmandu
h a 37 5 17 8 10 21 0 70 22 5 49 18 2 60 3 22 4 5 35 15 25 15 12 8 5 25 15 15 30 21 2 10 5 10 25 30 15 2 25 2 25 4 2 20 55 85 2 3 10 40 2 10 21 1 5
m t 60 0 0 42 3 6 10 0 20 2 50 19 7 4 51 3 0 80 3 18 3 20 74 6 45 33 1 70 60 47 6 15 0 25 0 15 0 12 0 64 50 32 5 12 8 20 7 48 6 49 2 5 19 5 3 15 0 66 0 63 0 31 5 40 34 5 24 42 5 60 25 23 0 39 6 93 5 20 19 80 83 7 40 10 0 54 5 63
m /h 16 24 10 96 28 23 16 10 10 12 15 15 18 12 14 10 10 10 10 8 10 13 9 14 16 23 19 15 26 21 21 20 14 12 17 15 13 12 7 11 10 6 8 21 20 10 26
Nuwakot
h a 39 0 41 8 2 10 5 44 5 13 4 20 16 18 13 0 15 12 0 4 1 17 65 66 7 7 62 90 42 79 12 6 11 5 58 63 73 3 7 13 2 5 2 23 16 19 2 3 49 25 1 19 2 30 4 9
m t 50 8 5 54 6 0 26 13 7 5 62 3 0 16 0 9 23 0 19 0 16 2 11 7 0 13 5 13 9 3 40 14 16 8 78 5 62 7 23 19 11 6 7 11 2 5 50 8 89 9 22 7 1 14 9 5 57 0 61 9 87 7 39 82 18 5 24 65 18 99 10 1 11 8 14 22 88 4 39 5 16 34 0 7 39 7 41
m /h 13 13 13 13 14 12 12 12 9 9 9 12 11 14 10 12 10 =T 95 /T9 4 4
=V9 5 /V94 3 19 13 12 11 18 13 10 10 12 13 12 14 12 13 9 4 6 6 7 7
=AZ 9 5 /AZ9 4
=B A9 5 /BA9 4 18 16 16
=B E 9 5/BE9 4 18 13
Dhading
h a 49 7 56 5 30 76 6 28 0 51 0 30 14 5 77 35 26 9 35 30 80 23 5 10 80 16 6 25 6 16 9 42 9 95 83 26 9 21 8 79 35 0 10 9 15 35 45 45 12 0 34 93 59 8 7
m t 70 8 2 82 6 9 25 5 13 6 35 39 7 6 32 6 4 33 6 10 4 4 76 1 28 4 22 3 3 35 5 27 0 72 0 18 6 30 72 32 0 14 5 3 29 4 4 17 4 9 62 2 1 14 5 4 95 5 31 8 8 27 8 0 75 8 60 5 5 62 32 5 33 0 21 7 23 9 23 4 18 6 0 10 2 0 90 4 75 8 36
m /h 14 15 9 18 14 6 11 7 10 8 8 10 9 9 8 6 7 4 9 12 10 15 15 12 12 13 10 17 6 36 22 6 5 5 16 30 10 13
Makawanpur
h a 56 5 54 5 20 12 5 32 8 15 0 75 55 15 0 65 15 0 11 4 50 55 70 15 80 45 61 32 30 38 5 31 6 5
m t 11 3 00 11 0 45 36 0 28 7 5 76 1 0 31 5 0 12 0 0 82 5 12 0 0 78 0 15 7 5 26 0 0 90 0 77 0 98 0 12 0 88 0 85 5 11 5 9 32 0 75 0 57 0 0 56 9 54
m /h 20 20 18 23 23 21 16 15 8 12 11 23 18 14 14 8 11 19 19 10 25 15 18
C. HILLS
h a 39 2 4 30 9 5 70 2 43 0 6 24 7 3 25 0 5 64 1 71 45 2 10 5 4 53 91 3 29 9 15 2 13 2 23 0 29 4 24 9 12 2 33 57 81 3 67 8 66 3 89 3 16 5 4 13 4 2 39 5 93 8 1 66 7 26 16 4 61 4 10 55 9 31 4 10 1 19 19 21 2 21 5 24 2 8 32 1 25 9 26 6 92 1 9 75 3 33 1 30
m t 59 7 74 51 8 91 97 3 2 74 9 70 43 6 64 36 3 40 95 7 7 10 3 1 59 9 8 10 2 67 46 4 11 1 13 32 3 8 21 4 5 19 0 0 28 8 0 31 7 8 14 2 5 12 2 0 40 3 58 3 82 4 8 88 0 2 87 8 4 12 5 51 28 9 30 19 6 82 57 0 2 12 9 87 1 93 9 6 51 5 21 2 3 10 2 52 13 9 55 6 32 5 42 2 2 17 2 3 33 8 24 7 26 7 2 22 0 3 26 9 7 80 44 0 11 34 7 9 46 3 4 21 1 6 16 11 2 11 2 59 49 5 48 0
m /h 15 17 14 17 18 15 15 15 13 10 9 12 11 14 14 13 11 6 10 12 10 10 13 13 14 17 15 14 14 2 14 20 13 17 14 10 13 17 3 18 13 13 10 11 10 14 11 13 17 23 16 12 15 15
Dhanusha
h a 95 0 52 6 5 37 7 45 0 74 4 5 95 62 16 40 12 5 23 5 60 60 2 51 6 82 4 16 6 28 4 2 13 5 27 0 15 0 21 2 70 7 10 15 95 0 12 22 50 10 15 0 8 40 35 50 80 5 4
m t 10 1 60 65 1 4 31 55 5 2 46 0 8 10 3 6 31 49 51 8 41 1 10 0 32 4 63 8 17 2 4 34 0 50 2 5 73 2 4 12 3 06 15 6 1 43 3 1 20 11 8 0 20 2 5 16 1 7 13 2 21 10 1 35 11 7 68 16 8 15 14 5 2 15 4 24 8 50 16 5 0 24 46 8 45 9 80 0 10 0 01 5
m /h 11 12 6 15 10 14 7 10 5 7 6 8 5 7 6 8 14 15 9 15 10 9 8 11 6 10 14 12 5 18 12 1 7 5 5 11 3 12 13 16 12
Mohattari
h a 15 0 5 80 4 45 0 80 20 0 22 0 37 5 30 5 15 5 19 6 15 0 70 6 11 0 66 9 43 0 70 2 17 4 20 1 70 17 3 32 5 80 0 0
m t 18 2 11 10 5 32 51 7 5 88 2 27 8 0 18 3 0 38 5 3 38 2 5 15 6 5 20 0 7 13 6 5 72 4 1 14 4 1 72 9 1 48 1 6 66 3 8 16 6 0 14 2 7 56 8 29 7 0 27 7 3 88 8 50
m /h 12 13 12 11 14 8 10 13 10 10 9 10 13 11 11 9 10 7 8 17 9 11
Sarlahi
h a 22 5 0 13 7 0 15 96 0 89 0 12 5 17 16 28 5 23 2 18 0 12 2 12 0 0 27 0 66 5 19 0 40 10 5 25 0 79 15 11 0 15 0 45 14 65 55 75 20 35 0 10 1 60
m t 37 6 87 23 6 04 14 0 12 9 60 11 5 70 17 5 0 18 1 16 0 17 1 0 24 8 2 18 9 0 10 9 8 84 0 0 21 6 0 93 1 0 19 0 0 41 2 10 4 0 26 5 0 73 4 14 3 10 5 5 90 0 67 5 11 2 57 2 82 5 75 0 20 0 28 0 0 12 9 86 9
m /h 17 17 9 14 13 14 11 10 6 11 11 9 7 8 14 10 10 10 11 9 10 10 6 15 8 9 15 10 10 8 13
Rautahat
h a 19 0 7 10 5 5 3 26 1 55 5 8 6 3 1 26 5 15 0 55 40 10 0 4 10 0 5 95 0 97 0 70 5 20 3 15 4 25 5 10 0 50 2 5 75 9 5 6 5 1 10 3 10 25 2 10 0 10 1 79
m t 20 8 95 11 5 00 14 26 4 5 69 0 0 47 45 31 2 19 5 40 12 0 0 41 0 25 0 20 0 5 10 0 00 10 5 00 95 0 0 56 1 0 44 0 5 16 1 0 38 5 0 15 0 0 11 2 83 11 5 16 5 0 16 7 25 0 55 60 8 15 0 23 15 0 51 2 40 11 0 0 10 8 71 7
m /h 11 11 5 10 12 6 8 10 2 8
=M 1 1 6/N3 +SUM (M 1 19 )* M11 5
=N1 1 6 /N11 5 8
=P1 1 6/P115 8 7 6
=T 11 6 /T 115
=U1 1 6 /U11 5
=V1 1 6 /V11 5
=S1 1 7 W116 /W1 1 5 2 10 11 10 8 22 10 15 15 22 23 22 19 50 9 12 8 15 8 15 20 20 11 11
Bara
h a 23 7 2 35 5 14 35 0 35 5 15 2 25 4 27 11 2 5 45 7 64 0 11 0 21 5 45 1 38 8 18 8 0 46 7 50 6 48 2 61 40 7 13 0 42 7 4 20 7 30 50 26 8 10 34 12 4 10 7 50
m t 37 7 17 54 3 1 18 0 79 7 5 56 5 6 35 3 1 40 6 54 30 7 19 8 09 52 7 92 51 8 9 16 8 5 22 3 5 72 1 0 75 7 8 22 2 78 83 1 2 91 1 91 87 4 8 97 5 72 7 8 21 5 4 67 5 0 65 45 0 76 54 0 75 0 39 0 96 10 0 70 1 23 5 96 16 6 57 8
m /h 16 15 13 23 16 23 16 14 11 18 12 13 8 15 10 16 20 12 18 18 15 18 16 18 17 16 16 23 11 18 15 15 12 10 21 20 24 15
Parsa
h a 57 5 80 20 20 0 60 2 3 20 0 15 31 17 0 11 5 33 5 20 0 15 5 70 25 37 0 45 38 0 40 20 0 14 15 12 8 2 20 30 50 26 65 8 25 35 6 6
m t 86 2 5 14 4 0 30 0 48 0 0 12 0 0 26 15 12 0 0 21 9 18 6 20 4 0 11 5 0 33 5 0 44 5 7 13 9 5 70 0 60 0 88 8 0 54 0 74 1 0 64 0 30 0 0 33 6 22 5 17 5 16 8 40 20 0 54 0 75 0 39 0 60 0 96 25 0 55 9 43
m /h 15 18 15 24 20 13 5 6 15 6 12 10 10 22 9 10 24 24 12 20 16 15 24 15 15 21 20 10 18 15 15 9 12 10 16
Chitwan
h a 62 3 49 2 15 0 40 9 56 6 56 1 12 0 61 11 5 44 1 28 5 28 26 1 16 0 28 0 25 4 99 23 5 16 6 83 30 5 19 1 50 24 0 43 65 70 33 63 8 6
m t 88 4 7 74 2 9 19 1 1 63 4 0 86 3 2 79 8 9 18 3 0 77 6 14 3 8 57 0 7 37 6 2 35 6 35 5 0 18 5 6 37 8 0 34 0 4 15 6 4 31 9 6 24 7 3 12 2 8 41 4 8 26 3 6 66 0 34 5 6 54 2 82 4 10 1 5 47 9 89 8 24
m /h 14 15 13 16 15 14 15 13 13 13 13 13 14 12 14 13 16 14 15 15 14 14 13 14 13 13 15 15 14
C. TERAI
h a 10 1 82 46 8 2 18 7 28 2 7 30 9 6 11 8 0 17 4 89 14 6 21 7 2 39 2 26 8 25 6 10 8 1 11 1 5 15 1 6 42 4 8 28 8 3 45 9 3 19 8 8 96 4 24 1 22 5 7 99 1 19 7 6 62 1 67 28 8 8 29 34 12 10 5 3 11 44 28 1 26 5 77 39 9 27 22 1 30 4 13 5 30 4 20 80 0 57 0 95
m t 14 2 14 2 66 4 50 22 7 5 40 9 47 43 0 48 18 3 33 25 2 0 10 7 0 17 6 2 29 1 38 47 0 0 28 4 1 21 5 8 97 8 6 11 2 75 68 2 8 41 6 18 39 2 48 56 3 53 22 8 44 15 1 39 27 0 5 32 8 46 11 4 81 28 4 66 77 4 2 82 3 42 3 17 56 8 35 8 17 5 19 0 83 20 7 19 7 8 27 3 1 33 0 7 95 0 40 6 0 23 9 16 7 7 38 3 6 19 9 7 46 5 6 20 0 69 2 3 73 9 79 6
m /h 14 14 12 14 14 16 14 12 12 13 12 11 8 9 10 5 10 14 12 11 16 11 15 12 14 12 12 15 20 11 15 18 19 45
=AS1 2 8 /AS1 2 7
=AT 1 2 8/AT 1 2 7 10 12 12 10 9 8 13 15 15 10 9 13
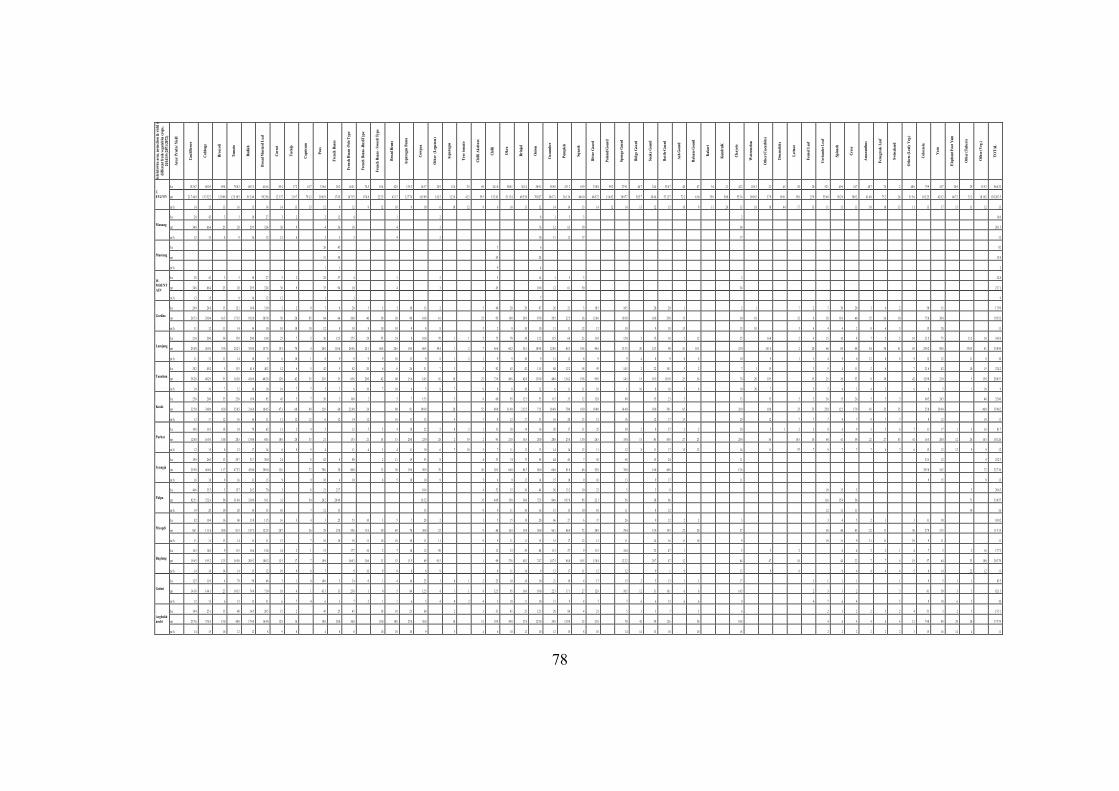
78
Dist
ricts
wise
are
a, p
rouc
tion
& yi
eld of
di
ffere
nt fr
esh
vege
tabl
es cr
ops,
20
14/1
5 (20
71/20
72)
Area
/ Pro
dn/ Y
ield
Caul
iflow
er
Cabb
age
Broc
coli
Tom
ato
Radi
sh
Broa
d M
usta
rd L
eaf
Carr
ot
Turn
ip
Caps
icum
Peas
Fren
ch B
eans
Fren
ch B
eans
-Pol
e Typ
e
Fren
ch B
eans
-Bus
hTyp
e
Fren
ch B
eans
- Swo
rd T
ype
Broa
d Be
ans
Aspa
ragu
s Bea
ns
Cowp
ea
Oth
er (
Legu
mes
)
Aspa
ragu
s
Tree
tom
ato
Chill
i Aka
bare
Chill
i
Okr
a
Brin
jal
Oni
on
Cucu
mbe
r
Pum
pkin
Squa
sh
Bitte
r Gou
rd
Poin
ted G
ourd
Spon
ge G
ourd
Ridg
e Gou
rd
Snak
e Gou
rd
Bottl
e Gou
rd
Ash
Gou
rd
Balsa
m G
ourd
Kak
ari
Kun
druK
Chay
ote
Wat
erm
elon
Oth
er (C
ucur
bits)
Drum
stick
s
Lettu
ce
Fenn
el Le
af
Coria
nder
Lea
f
Spin
ach
Cres
s
Amar
anth
us
Fenu
gree
k Le
af
Swiss
char
d
Oth
ers (
Leaf
y Ve
g.)
Colo
casia
Yam
Elep
hant
Foo
t Yam
Oth
er (T
uber
s)
Oth
er (V
eg.)
TOTA
L
C . R E GI ON
h a 15 2 67 88 0 5 89 8 78 8 2 60 3 3 41 6 6 85 4 17 2 61 7 33 6 6 20 2 14 0 1 74 5 18 4 42 8 13 5 3 14 5 7 24 9 12 4 35 69 24 1 0 50 0 1 36 2 4 56 9 1 38 9 8 25 1 2 63 9 33 0 8 99 2 27 9 1 64 7 24 4 35 6 7 40 67 34 21 42 2 10 5 3 21 45 20 20 52 1 49 6 34 7 40 7 74 2 48 0 79 9 24 7 30 5 29 15 5 3 96 6 32
m t 21 7 44 9 13 3 32 2 12 0 99 12 5 10 5 91 2 40 59 2 56 12 3 37 21 9 7 79 1 2 39 8 19 17 4 5 16 7 35 67 4 8 22 2 5 43 1 7 12 7 74 14 5 99 14 2 5 12 2 8 41 3 59 5 15 2 43 51 1 34 48 5 58 70 0 27 54 6 71 36 1 34 84 6 0 46 8 72 11 4 82 38 9 77 82 5 7 30 4 6 53 1 27 72 2 61 0 35 8 50 0 55 5 4 19 0 83 37 9 19 8 1 35 0 25 9 55 6 0 56 2 9 38 0 2 41 4 0 75 2 26 51 5 6 10 2 25 42 6 2 46 7 2 31 2 18 1 82 13 0 20 3 5
m /h 14 15 13 16 15 14 14 13 13 12 9 12 9 12 10 9 10 6 10 12 9 6 10 13 12 14 14 13 14 12 14 13 12 15 18 9 11 24 13 18 18 44 17 13 11 11 11 10 10 13 11 13 17 15 11 12 13
Manang
h a 28 43 3 3 18 27 3 2 2 12 4 1 2 8 1 5 3 2 16 6
m t 34 8 66 4 25 28 29 5 32 4 30 9 4 36 10 4 3 76 12 61 50 34 20 1 3
m /h 12 15 8 9 16 12 12 6 2 3 3 4 2 10 11 12 17 17 12
Mustang
h a 26 45 5 6 82
m t 31 58 45 24 15 8
m /h 1 1 9 4 2
W. MOUNTAIN
h a 28 43 3 3 18 27 3 2 28 57 4 1 2 5 14 1 5 3 2 24 8
m t 34 8 66 4 25 28 29 5 32 4 30 9 35 94 10 4 3 45 10 0 12 61 50 34 21 7 1
m /h 12 15 9 16 12 12 1 3 7 9
Gorkha
h a 24 9 24 8 15 12 1 14 0 31 0 5 2 9 7 8 20 5 5 3 10 13 2 5 40 20 29 87 26 21 3 10 5 10 5 20 20 1 2 1 7 2 7 30 20 3 6 2 50 15 17 9 9
m t 26 7 3 29 0 4 16 5 17 3 5 19 2 0 30 5 0 50 20 85 84 64 20 0 40 50 30 90 10 8 16 25 95 18 0 28 9 87 0 29 5 22 5 36 12 6 0 10 5 0 18 0 35 0 15 30 10 32 8 28 13 0 40 25 36 10 75 0 30 0 19 5 53
m /h 11 12 11 14 14 10 10 10 10 12 8 10 8 10 10 9 8 8 5 2 9 10 10 11 11 12 12 10 9 18 15 15 10 5 4 4 4 2 8 6 5 15 20 11
Lamjung
h a 21 0 20 0 30 17 0 20 0 18 0 25 7 5 30 12 5 27 5 28 55 24 8 10 0 70 1 1 5 75 70 38 12 2 11 5 68 23 11 0 15 0 5 15 10 5 12 25 16 0 2 4 15 10 8 7 5 5 10 21 5 75 31 2 10 34 3 0
m t 23 0 0 26 5 0 33 0 24 2 3 35 0 0 15 7 5 15 5 70 4 24 0 11 0 6 24 0 6 24 1 46 8 24 6 10 4 86 5 59 4 1 2 7 65 6 60 2 36 1 10 9 8 12 0 8 84 3 18 4 94 6 13 3 5 20 12 3 90 41 10 1 25 0 14 1 4 2 20 60 85 48 84 38 41 85 25 8 2 90 8 33 0 5 81 35 8 94
m /h 11 13 11 14 18 9 6 10 1 8 9 9 9 9 10 13 9 8 1 2 1 9 9 10 9 11 12 8 9 9 4 8 9 8 8 10 9 1 5 4 9 6 12 8 8 9 12 12 11 8 10
Tanahun
h a 38 2 40 2 5 13 5 41 6 40 2 12 6 5 42 5 82 20 6 6 26 31 7 3 3 92 62 42 11 5 80 12 2 18 95 14 5 2 22 10 1 5 2 7 1 15 3 5 4 11 2 6 7 21 6 42 10 15 32 4 2
m t 38 2 0 40 2 0 35 16 2 0 41 6 0 40 2 0 12 0 42 35 21 0 35 65 6 20 0 42 60 15 6 14 5 56 18 23 73 6 49 6 42 0 13 8 0 48 0 13 4 2 19 8 95 0 14 5 15 16 5 10 1 0 25 16 70 20 10 5 15 25 16 33 8 18 42 12 9 0 21 0 5 15 0 28 8 57
m /h 10 10 7 12 10 10 10 7 7 5 7 8 10 7 10 6 5 8 7 9 8 8 10 12 6 11 11 10 1 10 8 10 5 8 10 20 7 5 5 4 3 4 3 6 6 5 1 10 9
Kaski
h a 25 0 20 0 35 23 0 19 8 95 45 5 7 20 5 16 0 2 5 7 15 3 5 8 60 95 12 5 55 11 5 35 12 12 0 90 15 23 5 13 15 5 5 36 15 26 5 5 5 60 5 24 5 40 32 0 0
m t 32 5 0 34 0 0 42 0 35 6 5 31 6 8 10 4 5 47 3 60 84 12 0 60 22 4 0 24 80 91 19 8 9 20 52 48 0 11 4 0 21 2 5 71 5 18 4 0 70 0 18 0 18 0 0 14 4 0 18 0 39 1 65 26 0 18 0 35 35 25 0 12 2 17 9 45 35 35 25 0 29 4 0 40 0 35 9 62
m /h 13 17 12 16 16 11 11 12 12 6 12 14 12 16 13 13 4 7 8 12 17 13 16 20 15 15 16 12 17 13 20 12 7 7 7 8 7 9 7 7 0 12 10 11
Parbat
h a 10 0 11 0 18 24 78 62 13 2 4 5 12 5 5 4 18 22 5 0 2 1 13 20 14 16 20 17 11 25 30 2 8 27 2 2 20 5 1 2 2 8 6 9 3 5 6 7 11 17 1 3 16 81 7
m t 12 0 0 16 5 0 14 0 28 5 13 0 0 84 5 10 0 20 33 21 13 5 21 14 15 20 0 23 0 28 2 19 2 95 21 0 16 5 20 0 28 0 23 0 13 0 26 5 35 0 15 85 45 0 27 23 28 0 56 14 5 14 68 41 59 22 27 43 41 16 3 20 0 12 26 14 5 10 1 26
m /h 12 15 8 12 17 14 8 8 9 4 11 4 3 4 11 10 6 7 10 5 7 11 12 13 14 14 12 11 12 8 11 17 13 12 14 11 97 7 9 7 7 7 6 7 6 15 12 12 9 9 12
Syangja
h a 19 0 26 0 13 29 7 33 7 30 0 14 8 82 8 80 2 11 19 53 8 4 33 74 73 58 44 45 7 50 58 15 24 11 32 5 12 8 25 2 3
m t 29 5 0 46 6 0 11 7 47 5 2 45 0 0 39 0 0 12 6 72 78 0 30 80 0 12 50 19 0 50 9 70 20 20 5 64 0 86 7 80 0 66 0 81 0 66 52 0 76 0 14 0 40 0 12 6 29 5 0 18 2 72 32 7 36
m /h 16 18 9 16 13 13 9 9 10 4 10 6 5 10 10 9 5 6 9 12 14 15 18 9 10 13 9 17 11 9 15 9 13
Palpa
h a 44 6 35 5 5 15 7 24 2 70 3 8 21 22 7 10 4 4 52 15 36 44 56 13 2 10 23 5 5 8 10 15 5 5 20 6 3
m t 82 5 1 72 2 6 50 31 4 8 33 8 0 91 1 31 54 24 2 29 4 9 13 5 2 35 44 9 15 8 36 0 72 5 84 0 19 7 8 95 23 1 56 38 96 11 6 15 9 56 71 33 0 57
m /h 19 20 10 20 14 13 10 7 12 13 13 9 9 11 10 16 15 15 10 10 11 8 12 12 11 11 14 16
Myagdi
h a 82 10 4 16 60 13 8 11 5 16 3 4 3 25 53 10 3 5 7 28 2 1 5 15 18 20 66 27 6 37 26 9 12 2 2 3 3 4 5 2 1 3 31 30 10 0 2
m t 86 1 11 1 4 20 0 81 5 15 7 3 12 2 5 20 7 26 29 25 0 55 6 11 0 30 49 70 30 8 22 9 44 16 5 19 8 30 0 96 1 46 9 72 38 9 29 4 12 9 19 5 22 20 27 30 44 45 22 11 30 27 9 31 5 11 5 15
m /h 11 11 13 14 11 11 13 7 10 10 10 11 10 10 10 11 11 9 9 11 11 15 15 17 12 11 11 14 16 11 10 9 10 11 9 11 11 10 9 11 11
Baglung
h a 14 3 14 0 9 11 5 16 6 15 4 14 2 1 15 17 7 10 2 7 14 12 98 1 12 33 29 84 11 3 57 9 11 5 10 4 32 47 1 5 5 2 6 4 2 2 1 4 7 5 2 16 17 7 3
m t 19 4 5 19 5 2 12 5 16 5 0 20 9 2 18 0 2 13 5 17 7 10 9 16 0 3 10 6 13 53 11 5 69 91 5 1 99 37 6 40 2 74 7 14 7 5 94 8 10 5 13 8 4 12 2 2 29 7 47 12 64 47 10 44 22 7 7 4 18 57 64 33 18 0 20 3 79
m /h 14 14 14 14 13 12 10 9 6 7 9 10 9 8 8 6 9 1 8 11 14 9 13 17 11 12 12 9 1 9 13 9 6 8 6 4 4 4 5 8 14 22 12 11
Gulmi
h a 12 5 11 0 4 79 59 66 3 1 0 10 6 5 34 0 1 4 14 25 1 0 1 2 25 10 18 10 21 19 4 17 15 2 5 13 1 1 17 1 1 1 1 1 9 5 1 1 83 5
m t 14 3 8 14 4 1 25 10 3 5 74 9 71 0 18 4 1 63 3 13 23 8 1 0 5 84 12 5 4 1 1 8 12 5 95 19 6 10 0 22 3 17 1 27 12 6 10 5 12 31 16 1 6 6 14 5 2 3 3 2 5 81 50 3 5 82 1 5
m /h 12 13 6 13 13 11 6 7 4 6 3 7 2 1 1 6 5 4 4 2 4 5 10 11 10 11 9 8 7 7 6 6 12 6 6 9 4 7 6 4 5 9 10 6 5 10
Arghakhanchi
h a 18 4 25 1 15 40 14 5 20 5 15 2 45 25 45 18 10 25 60 2 3 31 45 23 12 5 20 86 4 21 5 3 3 7 3 6 2 3 2 2 3 2 4 51 3 2 5 15 5 1
m t 25 7 6 37 6 5 15 0 48 0 17 4 0 16 4 0 12 8 16 18 0 20 0 36 0 18 0 10 0 25 0 56 0 10 12 18 9 45 0 27 6 12 5 0 24 0 12 9 0 32 21 0 70 42 39 12 6 30 10 8 4 6 4 4 6 4 12 74 0 48 28 20 17 5 74
m /h 14 15 10 12 12 8 9 8 4 8 8 10 10 10 9 5 4 6 10 12 10 12 15 8 10 14 14 13 18 10 18 2 2 2 2 2 2 3 15 16 14 4 11
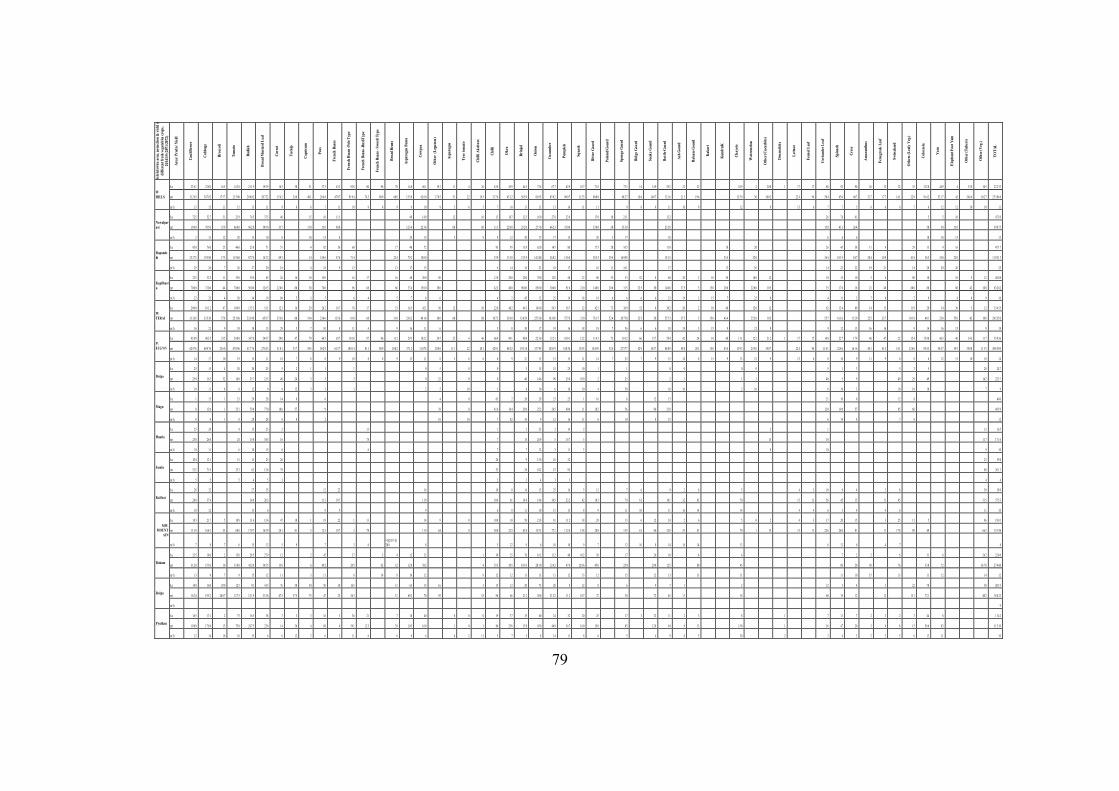
79
Dist
ricts
wise
are
a, p
rouc
tion
& yi
eld of
di
ffere
nt fr
esh
vege
tabl
es cr
ops,
20
14/1
5 (20
71/20
72)
Area
/ Pro
dn/ Y
ield
Caul
iflow
er
Cabb
age
Broc
coli
Tom
ato
Radi
sh
Broa
d M
usta
rd L
eaf
Carr
ot
Turn
ip
Caps
icum
Peas
Fren
ch B
eans
Fren
ch B
eans
-Pol
e Typ
e
Fren
ch B
eans
-Bus
hTyp
e
Fren
ch B
eans
- Swo
rd T
ype
Broa
d Be
ans
Aspa
ragu
s Bea
ns
Cowp
ea
Oth
er (
Legu
mes
)
Aspa
ragu
s
Tree
tom
ato
Chill
i Aka
bare
Chill
i
Okr
a
Brin
jal
Oni
on
Cucu
mbe
r
Pum
pkin
Squa
sh
Bitte
r Gou
rd
Poin
ted G
ourd
Spon
ge G
ourd
Ridg
e Gou
rd
Snak
e Gou
rd
Bottl
e Gou
rd
Ash
Gou
rd
Balsa
m G
ourd
Kak
ari
Kun
druK
Chay
ote
Wat
erm
elon
Oth
er (C
ucur
bits)
Drum
stick
s
Lettu
ce
Fenn
el Le
af
Coria
nder
Lea
f
Spin
ach
Cres
s
Amar
anth
us
Fenu
gree
k Le
af
Swiss
char
d
Oth
ers (
Leaf
y Ve
g.)
Colo
casia
Yam
Elep
hant
Foo
t Yam
Oth
er (T
uber
s)
Oth
er (V
eg.)
TOTA
L
W HILLS
h a 23 6 1 23 8 0 16 5 14 2 8 21 1 9 19 5 9 16 5 30 51 37 5 43 3 93 8 80 96 78 14 8 60 1 19 3 11 4 36 43 8 45 9 44 5 73 6 67 7 62 9 10 7 71 8 73 3 14 14 9 29 2 22 22 10 9 2 20 0 1 17 17 86 93 90 26 32 22 35 15 2 0 44 9 4 33 8 10 5 22 2 33
m t 31 2 63 34 7 82 17 5 7 21 5 08 28 0 82 20 7 22 15 4 2 24 8 40 1 26 4 8 47 0 7 91 9 4 74 3 80 9 68 8 13 5 0 62 6 0 17 0 5 51 22 19 3 31 7 4 45 1 2 56 5 9 81 8 5 85 0 2 90 0 7 11 2 5 80 8 0 68 2 7 10 4 14 0 7 33 1 6 21 3 19 6 13 5 9 30 18 0 2 22 4 94 58 4 65 0 48 7 21 7 17 7 14 1 22 8 91 4 2 52 1 7 43 34 6 6 10 2 7 25 3 86 8
m /h 13 15 11 15 13 11 9 8 8 7 11 10 9 8 9 9 10 9 5 6 5 7 10 13 11 13 14 11 11 9 8 9 11 10 9 12 9 13 6 7 7 5 8 6 6 7 6 12 12 10 10 11
Nawalparasi
h a 72 5 52 7 31 23 9 74 5 37 5 46 15 10 11 1 49 14 9 12 10 13 18 7 12 5 16 0 27 8 23 9 17 0 10 21 1 13 2 26 74 41 5 5 10 47 3 0
m t 10 9 0 70 5 0 35 9 66 0 0 96 2 8 38 9 0 35 7 15 0 15 0 88 0 12 3 4 22 3 4 60 88 11 1 22 0 0 25 2 0 27 5 0 46 2 3 35 0 0 33 8 0 30 35 3 0 23 5 8 15 8 43 1 26 4 50 50 15 0 59 8 75
m /h 2 13 12 28 13 10 8 10 15 8 25 15 5 9 9 12 20 17 17 15 20 3 17 18 6 6 6 10 10 15 13
Rupandehi
h a 95 0 76 0 25 46 0 23 8 71 51 4 82 56 60 17 48 72 93 95 13 8 62 0 14 5 80 17 5 28 10 5 11 0 18 20 26 45 38 11 9 29 13 9 16 47 1 7
m t 23 2 75 19 3 80 17 5 11 9 60 87 7 0 14 3 2 89 3 14 14 9 6 47 6 71 4 22 4 79 2 10 8 0 53 9 13 3 0 21 3 9 14 2 60 26 8 2 13 6 0 28 3 5 29 4 16 9 05 18 1 5 23 4 32 0 36 4 10 3 5 84 7 20 4 18 9 41 8 26 3 18 0 32 0 11 9 21 3
m /h 25 26 7 26 37 20 18 4 18 9 12 13 17 15 6 14 16 23 18 17 16 11 16 1 17 13 16 14 23 22 19 21 14 20 20 20 25
Kapilbastu
h a 32 5 32 5 11 35 0 35 0 65 26 16 10 15 0 16 17 16 48 20 0 50 12 0 20 0 20 0 70 0 12 0 48 12 80 35 53 52 8 60 20 2 10 30 10 0 12 10 15 10 3 6 90 10 10 5 12 40 0 8
m t 70 0 0 71 0 0 44 70 0 0 50 0 0 12 6 5 22 8 0 80 30 70 0 96 68 86 33 6 15 0 0 30 0 42 2 40 0 90 0 0 85 0 0 30 0 0 91 0 21 0 14 0 0 20 0 31 5 32 5 50 14 0 0 37 5 5 15 0 20 0 22 0 0 10 5 35 17 0 18 21 48 60 0 88 80 42 10 8 63 2 62
m /h 22 22 4 20 14 19 88 5 3 5 6 4 5 7 8 6 4 2 45 12 25 19 18 18 6 6 6 6 23 19 3 15 7 22 9 4 11 2 7 8 7 9 8 8 9 16
W. TERAI
h a 20 0 0 16 1 2 67 10 4 9 13 3 3 51 1 12 3 16 29 24 2 16 7 76 17 33 14 5 42 1 50 12 10 22 6 48 2 46 3 14 8 0 54 3 36 7 12 42 5 73 36 9 52 8 30 2 20 2 10 48 12 0 12 62 13 4 89 14 15 11 9 28 14 36 5 12 13 4 55
m t 31 3 65 33 5 30 57 8 25 5 60 23 3 98 65 8 7 35 3 0 80 19 4 23 4 6 13 5 6 81 0 68 31 0 23 6 2 48 1 4 30 0 60 88 10 7 2 39 3 0 13 6 59 25 5 10 10 3 05 57 7 0 21 0 76 1 5 52 4 20 7 50 32 5 50 55 7 3 37 5 5 15 0 43 4 25 2 0 10 5 55 7 16 3 6 11 2 9 22 5 23 7 10 1 8 40 1 23 0 55 0 42 10 8 24 2 35 0
m /h 16 21 9 24 18 13 29 5 7 10 8 11 4 9 16 11 6 5 8 30 17 19 16 18 18 7 56 6 6 18 19 3 15 9 21 9 9 12 13 16 16 9 14 16 15 9 18
W. R E GI ON
h a 43 8 9 40 3 5 23 5 24 8 0 34 7 0 24 9 7 29 0 47 79 64 5 65 7 10 1 8 97 96 11 2 29 3 10 2 2 24 5 23 4 46 66 9 94 1 90 8 22 3 0 12 2 1 10 0 1 12 2 11 4 3 73 11 0 2 66 15 7 59 4 42 24 10 48 11 1 12 2 21 2 1 17 17 14 8 22 7 17 9 40 47 22 15 4 15 4 8 46 3 40 34 3 11 7 35 9 36
m t 62 9 76 68 9 76 23 6 0 47 0 96 51 7 76 27 6 33 51 0 1 33 7 59 5 50 2 9 61 5 7 10 0 14 81 1 80 9 10 0 2 37 1 2 11 0 74 20 0 8 11 1 22 28 1 42 9 1 84 4 2 19 3 18 33 7 95 18 8 19 14 8 38 13 8 5 15 6 95 52 4 27 5 77 42 9 14 5 7 88 8 9 58 8 20 1 15 0 43 4 13 9 3 25 5 0 19 0 7 22 4 94 11 4 1 22 8 6 16 1 6 44 1 41 4 14 1 12 4 6 95 4 3 54 4 7 59 3 35 0 8 11 3 5 49 8 39 0
m /h 14 17 10 19 15 11 18 7 8 8 9 10 8 8 9 13 11 8 5 6 6 6 9 21 15 15 15 11 14 7 25 7 9 15 14 8 15 9 13 21 9 13 6 8 10 9 11 9 6 8 6 12 15 10 10 14
Dolpa
h a 25 15 4 20 30 25 5 2 1 1 1 0 5 0 0 5 15 15 25 10 1 1 0 0 0 0 5 1 3 5 3 5 20 24 7
m t 25 0 16 5 32 16 0 35 7 21 5 40 24 3 3 3 0 25 0 0 40 14 6 90 25 0 10 0 2 25 2 1 1 1 40 5 9 49 29 49 14 2 22 5 7
m /h 10 11 8 8 12 9 8 12 3 3 3 2 5 10 3 8 10 6 10 10 4 50 10 10 2 10 8 10 3 10 10 10 7 9
Mugu
h a 1 15 1 33 29 28 14 8 6 4 0 63 2 20 29 23 25 1 16 6 12 15 21 10 8 12 8 40 6
m t 8 12 0 1 25 1 79 8 77 0 10 6 57 9 39 0 41 6 16 4 20 8 25 2 26 5 40 0 11 10 2 56 96 21 8 12 0 19 0 57 85 60 48 5 9
m /h 8 8 1 8 28 28 8 8 2 10 10 7 82 10 9 12 16 11 6 10 8 15 6 19 8 7 8 12
Humla
h a 25 24 4 15 23 2 13 1 2 23 2 14 2 2 1 13 16 5
m t 25 0 26 4 24 15 0 34 5 16 78 7 14 26 9 5 14 7 5 15 10 11 7 17 1 6
m /h 10 11 6 10 15 8 6 7 7 12 3 11 3 8 10 9 10
Jumla
h a 10 4 13 1 51 15 25 26 26 9 13 6 16 32 23 59 4
m t 52 2 71 9 25 3 62 12 6 79 52 28 54 2 47 95 88 26 1 3
m /h 5 5 5 4 5 3 2 3 4 3 3 4 4
Kalikot
h a 28 32 27 35 12 22 14 18 8 14 15 25 16 5 12 7 6 9 2 6 5 4 3 10 9 4 3 8 30 38 9
m t 28 8 37 4 34 0 20 3 11 3 18 7 11 9 10 4 61 14 8 14 4 36 5 23 2 42 10 3 74 61 10 1 32 81 70 15 11 56 45 15 11 45 31 5 37 5 3
m /h 10 12 13 6 9 9 9 6 8 11 10 15 15 8 9 11 10 11 16 14 14 4 4 6 5 4 4 6 11 10
MW. MOUNT
AIN
h a 18 3 21 7 5 10 8 11 6 13 6 47 10 1 19 22 1 13 14 9 0 10 8 10 50 21 8 81 11 2 18 29 13 6 12 24 2 6 5 0 2 4 3 37 20 15 3 25 11 5 86 18 0 1
m t 13 1 8 16 4 2 33 68 8 17 0 7 16 5 9 24 1 81 3 12 5 18 7 3 78 11 9 64 0 58 0 22 5 43 8 13 5 3 77 2 11 2 4 15 8 20 8 15 5 61 96 32 0 33 81 70 1 15 15 11 22 6 24 0 81 11 17 8 89 49 66 2 15 1 98
m /h 7 8 7 6 15 12 5 9 7 3 6
=Q2 0 9 /Q20 8 8 5 22 9 6 10 10 9 7 12 10 8 14 16 14 13 6 12 6 4 7 8
Rukum
h a 23 5 18 0 2 15 0 28 5 27 9 12 2 45 37 3 4 12 32 1 30 25 76 16 2 11 2 40 10 2 38 17 24 10 6 4 7 2 2 6 31 6 26 2 22 4 0
m t 31 2 0 15 3 0 10 13 8 0 43 2 0 34 5 5 13 0 6 49 2 20 5 42 32 12 0 38 2 4 35 3 30 5 10 1 0 20 3 0 12 4 2 47 0 12 9 6 45 0 25 0 29 8 12 5 80 45 80 20 30 76 33 0 72 36 7 0 27 4 60
m /h 13 9 7 9 15 12 11 3 11 6 14 8 10 12 8 12 12 13 13 11 12 13 12 15 12 13 13 11 11 10 15 13 11 12 14 12
Rolpa
h a 14 0 16 0 29 0 12 5 91 41 5 76 50 30 50 10 16 5 11 65 15 16 3 15 12 20 75 20 8 12 8 6 9 7 1 2 12 5 4 3 22 70 30 20 5 3
m t 16 2 4 19 5 2 24 0 7 12 7 5 12 1 9 31 5 4 47 5 57 5 75 47 23 36 3 31 60 2 70 92 18 96 66 21 2 30 0 21 2 2 11 2 10 7 72 30 72 45 11 18 60 19 12 12 13 1 72 1 40 2 18 6 23
m /h 9
Pyuthan
h a 16 5 13 1 2 75 16 5 38 3 3 3 16 3 36 21 7 18 40 0 0 0 19 37 35 60 34 32 20 25 17 3 32 11 2 3 8 1 7 11 7 2 3 2 3 44 8 11 4 2
m t 19 8 0 17 6 9 15 75 0 24 7 5 23 8 14 36 4 88 6 39 1 12 3 39 10 5 16 0 1 0 1 86 25 6 15 8 45 0 46 9 34 7 16 0 15 0 85 12 8 94 9 13 15 0 1 16 47 20 3 8 8 15 56 6 83 11 5 10
m /h 12 14 10 10 15 6 6 12 2 6 2 11 6 6 6 4 6 2 11 5 7 5 8 14 11 8 6 5 4 9 6 5 20 2 3 4 3 2 3 5 6 13 11 10
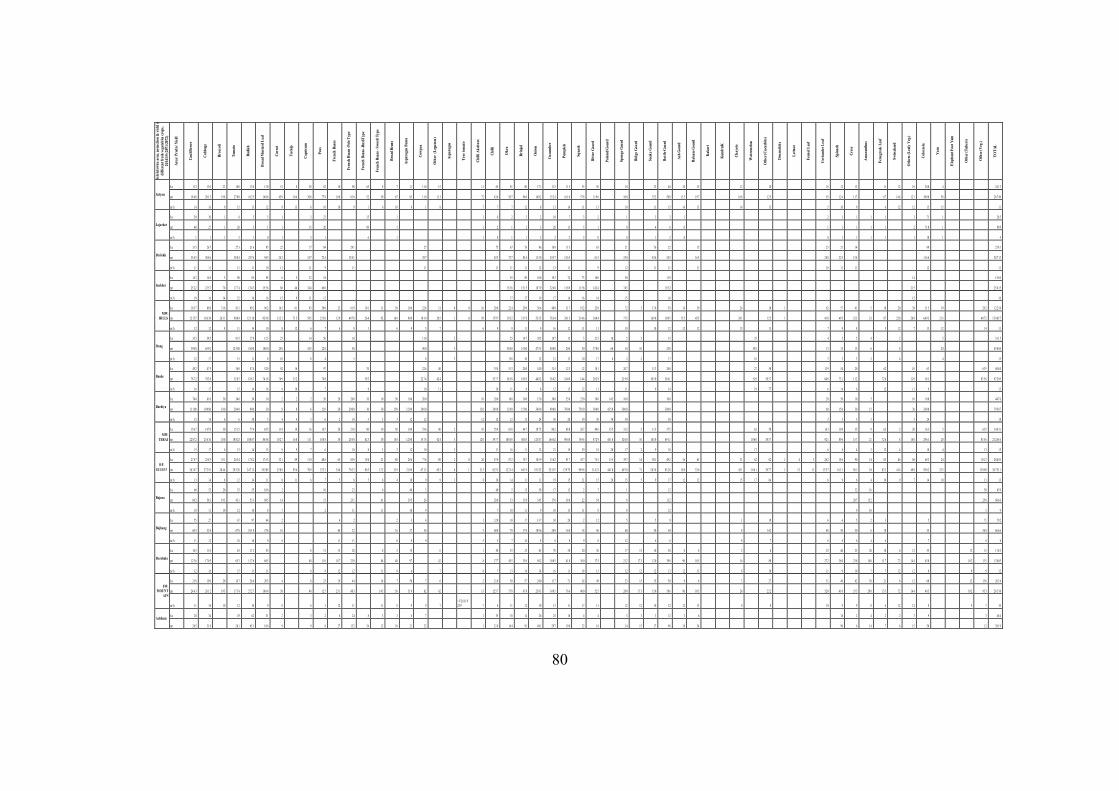
80
Dist
ricts
wise
are
a, p
rouc
tion
& yi
eld of
di
ffere
nt fr
esh
vege
tabl
es cr
ops,
20
14/1
5 (20
71/20
72)
Area
/ Pro
dn/ Y
ield
Caul
iflow
er
Cabb
age
Broc
coli
Tom
ato
Radi
sh
Broa
d M
usta
rd L
eaf
Carr
ot
Turn
ip
Caps
icum
Peas
Fren
ch B
eans
Fren
ch B
eans
-Pol
e Typ
e
Fren
ch B
eans
-Bus
hTyp
e
Fren
ch B
eans
- Swo
rd T
ype
Broa
d Be
ans
Aspa
ragu
s Bea
ns
Cowp
ea
Oth
er (
Legu
mes
)
Aspa
ragu
s
Tree
tom
ato
Chill
i Aka
bare
Chill
i
Okr
a
Brin
jal
Oni
on
Cucu
mbe
r
Pum
pkin
Squa
sh
Bitte
r Gou
rd
Poin
ted G
ourd
Spon
ge G
ourd
Ridg
e Gou
rd
Snak
e Gou
rd
Bottl
e Gou
rd
Ash
Gou
rd
Balsa
m G
ourd
Kak
ari
Kun
druK
Chay
ote
Wat
erm
elon
Oth
er (C
ucur
bits)
Drum
stick
s
Lettu
ce
Fenn
el Le
af
Coria
nder
Lea
f
Spin
ach
Cres
s
Amar
anth
us
Fenu
gree
k Le
af
Swiss
char
d
Oth
ers (
Leaf
y Ve
g.)
Colo
casia
Yam
Elep
hant
Foo
t Yam
Oth
er (T
uber
s)
Oth
er (V
eg.)
TOTA
L
Salyan
h a 13 2 13 0 22 18 0 13 0 13 0 51 8 38 82 10 90 65 8 7 11 11 0 15 11 65 81 80 17 1 11 5 11 5 55 92 10 32 40 10 15 12 10 18 12 13 11 12 10 20 0 4 24 1 3
m t 18 4 8 20 1 5 19 8 27 0 0 16 2 5 16 0 6 45 9 10 4 30 8 77 9 10 0 81 0 52 50 67 83 11 0 11 3 72 43 6 56 7 96 0 14 0 2 15 2 4 16 1 0 57 8 11 9 6 10 0 35 2 58 0 13 5 19 7 16 8 12 5 93 12 4 11 7 67 14 4 12 1 30 0 0 58 26 7 49
m /h 14 16 9 15 13 12 9 13 8 10 10 9 1 6 10 8 1 8 7 7 7 12 8 13 14 11 13 10 11 15 14 13 14 13 5 10 9 6 12 12 15 15 11
Jajarkot
h a 50 30 1 8 5 5 1 3 23 15 1 1 4 2 3 2 10 7 3 2 1 3 3 1 2 1 1 1 1 3 71 1 26 5
m t 40 27 1 20 3 1 1 15 20 89 1 1 2 1 2 3 20 11 5 1 0 4 6 0 1 1 1 1 1 2 71 0 1 98 9
m /h 1 1 1 3 1 0 1 5 1 6 1 1 0 1 1 2 2 2 2 0 0 1 2 0 0 1 1 1 1 1 10 1 4
Dailekh
h a 31 5 26 7 27 3 21 6 95 22 17 84 29 1 27 75 67 76 96 18 9 11 5 65 21 76 22 15 23 21 14 99 25 8 1
m t 35 4 5 30 4 6 28 8 4 24 7 6 94 5 24 2 18 7 72 4 32 0 1 29 7 82 5 73 7 83 6 11 5 0 24 5 7 12 6 5 61 5 25 0 83 6 24 5 16 5 24 0 22 5 15 4 11 6 6 28 7 13
m /h 11 11 11 11 10 11 11 9 11 11 11 11 11 12 13 11 9 12 11 11 11 10 11 11 12 11
Surkhet
h a 14 3 14 8 5 80 85 98 6 5 32 54 93 89 10 0 19 2 74 73 10 0 50 11 9 14 15 6 0
m t 25 2 2 23 5 3 70 17 7 4 13 4 3 15 5 6 88 46 34 4 66 0 15 3 6 15 1 5 18 7 9 32 6 8 11 8 9 11 5 6 14 2 4 74 5 19 3 2 21 5 25 6 15
m /h 18 16 14 22 16 16 15 9 11 12 17 17 19 17 16 16 14 15 16 15 16
MW. HILLS
h a 10 3 7 89 8 31 6 81 1 89 2 96 2 16 5 61 93 30 0 23 61 9 10 1 11 30 10 6 22 4 31 0 0 16 20 8 22 4 29 0 56 6 48 0 31 7 19 2 23 0 72 3 17 6 93 14 39 26 10 1 62 57 41 5 18 20 38 51 5 19 29 2 12 2 54
m t 12 1 57 10 3 39 26 3 1 90 0 9 12 1 18 93 9 8 13 2 1 71 5 59 5 21 5 0 12 9 49 7 0 26 4 92 16 9 90 9 10 1 9 20 5 1 0 95 17 9 7 19 3 2 31 7 8 53 3 5 78 3 4 38 1 5 21 4 6 24 8 4 71 5 16 9 0 10 9 5 15 5 45 5 38 1 12 5 1 41 0 49 5 32 3 33 87 22 8 26 9 64 9 3 21 3 40 7 2 13 9 65 7
m /h 12 12 8 11 14 10 8 12 6 7 6 8 3 6 9 5 7 6 9 9 11 9 16 12 11 11 10 10 12 12 12 15 13 7 9 8 5 12 7 13 12 14 11
Dang
h a 33 5 38 5 81 5 17 0 12 5 25 14 50 10 11 0 2 25 14 7 38 5 18 7 15 5 21 5 10 5 5 15 35 4 5 5 4 2 5 31 1 5
m t 39 0 0 65 9 2 12 5 00 18 0 0 10 0 0 25 0 10 5 22 0 50 90 0 5 34 0 0 15 0 0 47 5 5 40 0 0 20 0 50 37 0 0 60 10 10 25 0 55 0 13 15 15 6 8 20 45 8 84
m /h 12 17 15 11 8 10 8 4 5 8 3 13 6 10 12 21 13 10 17 6 2 2 17 16 3 3 3 2 4 4 15
Banke
h a 49 2 47 5 36 0 57 4 52 0 92 16 97 70 22 6 40 35 4 51 3 20 0 54 0 31 5 12 3 12 18 1 20 7 11 3 26 0 27 50 13 9 54 20 62 10 63 63 5 68 4 0
m t 78 7 2 78 3 8 52 8 3 81 8 7 74 1 8 76 9 15 2 70 8 59 3 22 7 4 42 4 35 7 7 54 5 8 18 0 3 44 8 2 36 6 2 18 4 0 14 4 20 2 9 21 9 0 10 5 0 36 6 1 51 0 38 3 7 84 8 73 1 11 2 72 6 11 0 56 1 83 5 6 87 2 05
m /h 16 17 15 14 14 8 10 7 8 10 11 10 11 9 8 12 15 12 11 11 9 14 19 77 6 14 6 12 11 9 13
Bardiya
h a 74 0 61 0 30 34 0 30 10 2 2 2 20 20 20 0 10 10 50 10 0 20 0 10 20 0 10 0 10 0 15 0 30 0 35 0 25 0 10 0 14 5 10 0 10 0 20 50 10 5 10 10 0 44 7 6
m t 11 1 00 10 9 80 18 0 20 4 0 90 0 30 8 8 6 12 0 30 20 0 0 30 30 15 0 12 0 0 24 0 0 12 0 24 0 0 12 0 0 15 0 0 36 0 0 90 0 0 70 0 0 75 0 0 30 0 0 43 5 0 30 0 0 30 0 0 60 15 0 30 15 30 24 0 0 79 5 67
m /h 15 18 6 6 30 3 4 4 3 6 2 10 3 3 3 12 12 12 12 12 15 24 30 20 30 30 30 30 30 3 3 3 3 3 24 18
MW. TERAI
h a 15 6 7 14 7 0 30 15 1 5 77 4 65 5 11 9 18 16 16 7 20 21 0 80 10 50 10 0 53 6 40 2 10 55 4 63 8 44 7 10 7 5 80 2 48 8 26 7 49 6 15 5 31 2 5 11 3 37 5 62 50 16 3 10 9 35 9 62 2 20 16 3 5 63 5 14 4 31
m t 22 8 72 25 4 10 18 0 19 8 23 10 8 87 84 4 8 10 2 7 16 0 11 1 10 4 8 30 20 5 0 62 3 30 15 0 12 0 0 55 7 4 42 4 5 12 0 59 7 7 10 0 58 48 0 3 12 8 37 16 6 62 90 4 0 76 9 4 87 2 9 44 1 0 52 0 0 10 10 5 0 69 1 1 10 6 0 38 3 7 92 1 89 6 15 7 21 72 6 8 14 0 29 6 1 20 83 5 6 21 2 65 6
m /h 15 17 6 13 14 13 9 9 7 6 10 8 3 3 12 10 3 11 16 11 12 21 19 29 18 28 17 2 9 18 17 6 8 4 2 12 4 18 4 13 15
M W. R E GI ON
h a 27 8 7 25 8 5 35 1 24 3 4 17 8 2 17 5 3 33 1 89 11 0 48 6 65 83 0 19 4 21 80 20 6 77 4 80 2 0 26 87 0 87 2 78 7 18 5 9 13 6 2 91 7 47 7 75 5 15 5 39 7 14 30 1 49 2 16 45 31 62 62 1 4 3 26 2 18 6 90 14 83 46 68 68 3 24 10 1 3 28 4 85
m t 36 3 47 37 3 91 28 4 4 29 5 20 24 7 13 19 5 05 25 8 9 95 6 70 9 33 2 3 34 6 70 2 3 96 5 12 2 31 9 21 0 9 67 1 2 69 3 6 1 21 5 83 5 3 12 2 14 84 1 9 19 5 25 25 2 67 13 9 79 99 9 8 11 4 21 44 1 0 60 7 0 71 28 3 6 83 2 6 18 8 53 6 45 1 10 6 1 39 7 7 1 15 11 15 5 7 16 3 1 56 1 54 82 3 41 4 49 8 95 0 2 23 3 13 0 90 36 7 51 1
m /h 13 14 8 12 14 11 8 11 6 7 5 8 5 6 4 10 9 9 3 8 10 14 11 11 19 15 21 15 28 15 5 9 17 12 12 15 17 64 6 9 6 4 10 9 7 14 10 13 13
Bajura
h a 60 53 20 35 55 10 6 2 10 22 6 40 3 40 5 15 38 17 13 2 7 1 12 32 16 50 65 9
m t 60 2 58 3 19 3 43 1 53 3 88 5 14 15 23 1 61 39 5 26 28 0 53 15 8 34 5 17 0 18 8 22 54 8 13 2 28 7 15 2 25 0 60 6 6
m /h 10 11 10 12 10 8 7 2 11 11 10 9 7 10 11 9 10 15 11 8 8 12 9 10 5 9
Bajhang
h a 55 27 67 97 44 2 4 2 2 3 4 1 12 0 10 17 13 7 30 20 2 12 5 5 8 1 19 6 6 5 2 3 5 71 79 2
m t 60 5 32 4 67 0 10 1 8 37 4 16 44 22 16 27 36 5 60 0 70 17 0 10 9 6 24 0 16 0 18 96 60 30 64 8 14 2 48 50 30 6 18 35 56 8 66 6 6
m /h 11 12 10 10 9 8 11 11 8 9 9 5 5 7 10 8 8 8 9 8 12 6 8 8 7 8 8 6 4 6 7 8 8
Darchula
h a 10 3 11 0 45 11 2 55 8 13 15 20 8 5 15 6 1 58 35 25 65 70 38 20 30 17 15 10 30 8 8 2 8 25 40 25 20 18 6 12 55 12 15 11 8 3
m t 12 3 6 17 0 5 65 3 11 7 6 60 5 48 11 0 18 7 23 0 84 40 97 42 8 37 7 45 5 35 0 94 2 10 8 5 41 8 36 0 37 5 21 2 17 3 12 0 39 0 96 10 5 16 80 27 2 36 0 23 8 14 0 11 7 72 14 4 45 0 10 2 13 5 13 8 05
m /h 12 16 15 11 11 6 8 12 12 11 8 6 7 8 7 13 14 14 16 11 18 13 12 12 12 13 12 13 8 10 11 9 10 7 7 12 12 8 9 9 12
FW. MOUNT
AIN
h a 21 8 19 0 20 14 7 26 4 20 5 4 8 23 19 44 14 7 58 7 6 2 21 8 50 57 24 0 11 7 71 24 49 23 15 15 50 8 8 3 27 31 46 62 38 21 6 12 60 12 13 6 26 3 4
m t 24 4 3 26 1 2 19 3 17 5 4 27 2 7 18 6 4 30 48 12 5 23 1 48 3 14 5 56 51 9 62 42 13 12 5 7 57 8 67 8 23 8 3 14 9 5 76 6 40 0 52 5 28 0 17 3 15 0 58 6 96 10 5 24 22 2 32 0 41 0 55 5 29 8 13 5 72 14 4 48 5 10 2 95 3 26 5 38
m /h 11 14 10 12 10 9 8 6 5 12 11 11 8 9 9 7
=V2 6 0 /V25 9 7 6 11 12 10 13 11 17 11 12 12 10 12 12 13 8 8 10 9 9 8 6 12 12 8 9 7 10
Achham h a 28 34 29 62 31 2 3 2 6 24 8 3 3 6 7 1 35 18 14 26 25 18 4 4 3 3 3 12 3 6 18 2 4 2 2 3 9 3 46 4
m t 24 5 31 8 26 1 65 1 18 6 9 9 8 27 13 2 34 12 10 21 32 1 21 0 14 4 91 48 1 29 7 19 8 32 18 14 15 17 96 18 34 90 6 14 7 6 15 50 12 38 1 9
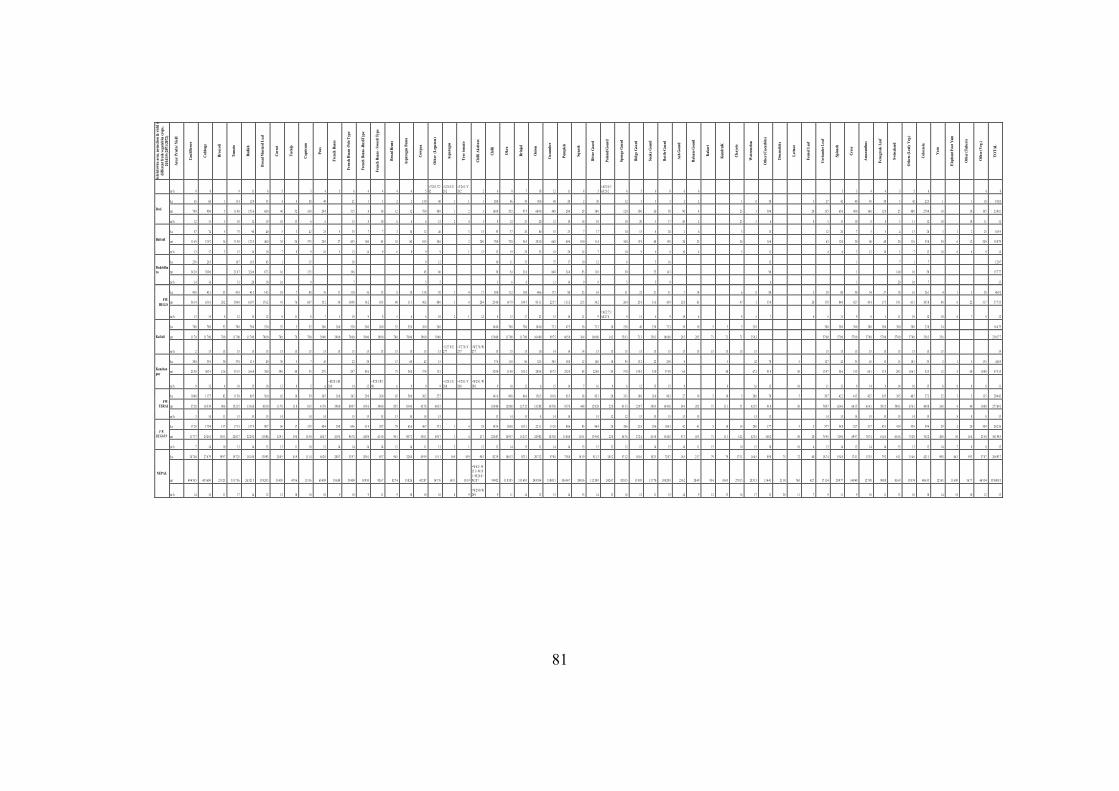
81
Dist
ricts
wise
are
a, p
rouc
tion
& yi
eld of
di
ffere
nt fr
esh
vege
tabl
es cr
ops,
20
14/1
5 (20
71/20
72)
Area
/ Pro
dn/ Y
ield
Caul
iflow
er
Cabb
age
Broc
coli
Tom
ato
Radi
sh
Broa
d M
usta
rd L
eaf
Carr
ot
Turn
ip
Caps
icum
Peas
Fren
ch B
eans
Fren
ch B
eans
-Pol
e Typ
e
Fren
ch B
eans
-Bus
hTyp
e
Fren
ch B
eans
- Swo
rd T
ype
Broa
d Be
ans
Aspa
ragu
s Bea
ns
Cowp
ea
Oth
er (
Legu
mes
)
Aspa
ragu
s
Tree
tom
ato
Chill
i Aka
bare
Chill
i
Okr
a
Brin
jal
Oni
on
Cucu
mbe
r
Pum
pkin
Squa
sh
Bitte
r Gou
rd
Poin
ted G
ourd
Spon
ge G
ourd
Ridg
e Gou
rd
Snak
e Gou
rd
Bottl
e Gou
rd
Ash
Gou
rd
Balsa
m G
ourd
Kak
ari
Kun
druK
Chay
ote
Wat
erm
elon
Oth
er (C
ucur
bits)
Drum
stick
s
Lettu
ce
Fenn
el Le
af
Coria
nder
Lea
f
Spin
ach
Cres
s
Amar
anth
us
Fenu
gree
k Le
af
Swiss
char
d
Oth
ers (
Leaf
y Ve
g.)
Colo
casia
Yam
Elep
hant
Foo
t Yam
Oth
er (T
uber
s)
Oth
er (V
eg.)
TOTA
L
m /h 9 9 9 11 6 5 3 4 5 6 4 4 4 4 5
=T 26 3 /T 262
=U2 6 3 /U26 2
=V2 6 3 /V26 2 2 6 8 7 19 12 11 8 5
=AF2 6 3 /AF2 6 2 6 5 6 8 6 6 5 3 4 4 3 5 6 4 8
Doti
h a 65 60 1 11 4 12 9 35 4 4 28 49 21 1 3 2 2 13 0 40 1 1 1 20 0 46 39 30 0 40 20 2 30 12 5 5 3 2 2 1 0 50 5 27 42 40 45 30 5 42 22 5 1 1 10 19 2 0
m t 78 0 90 0 5 11 4 0 15 3 6 68 0 40 52 16 8 29 4 31 5 8 30 12 12 78 0 48 0 1 2 3 16 0 0 55 2 97 5 60 0 0 48 0 20 0 28 30 0 12 0 10 0 26 50 90 4 23 1 30 0 20 13 5 63 0 40 0 36 0 12 0 25 48 0 27 0 0 10 10 10 5 23 0 81
m /h 12 15 5 10 12 19 10 13 6 6 15 8 10 6 6 6 12 2 4 3 8 12 25 20 12 10 14 10 10 20 5 17 45 2 23 5 6 4 5 15 10 8 4 5 11 12 10 10 11 12
Baitadi
h a 87 74 5 75 90 40 5 3 42 25 5 35 7 7 3 10 12 40 3 15 55 37 20 80 35 25 7 17 10 15 8 20 2 6 5 15 12 20 7 5 5 4 15 20 3 1 2 25 10 5 9
m t 11 6 9 12 9 2 16 11 5 0 12 3 5 40 0 35 24 37 5 25 0 27 45 5 10 0 63 18 80 10 5 34 0 2 20 0 70 0 72 0 56 5 28 3 0 64 0 49 0 10 0 11 4 10 0 13 9 48 15 0 20 25 24 16 0 43 12 0 20 60 48 20 11 0 25 0 30 6 12 20 0 15 0 79
m /h 13 17 3 15 14 10 7 8 9 10 5 13 14 9 6 8 9 9 1 13 13 19 28 35 18 20 14 7 10 9 6 8 10 4 5 11 4 6 3 12 10 5 7 13 10 6 6 8 14
Dadeldhura
h a 25 0 26 5 16 7 16 5 65 1 15 30 9 12 10 11 35 75 17 10 12 6 5 16 15 1 7 1 7 12 0 7
m t 34 2 0 38 0 0 21 0 7 32 4 0 67 3 16 13 5 19 6 45 60 30 63 21 6 84 0 24 4 93 11 0 30 25 14 3 90 1 14 0 10 50 15 7 77
m /h 14 14 13 20 10 16 9 7 5 5 3 6 6 11 14 9 9 5 5 9 6 1 20 10 7 13
FW. HILLS
h a 43 0 43 3 35 41 8 41 5 14 2 10 7 88 76 11 11 0 16 13 8 18 15 8 92 1 4 17 30 0 11 2 10 8 40 6 17 5 80 23 63 31 23 21 51 7 14 6 0 80 5 39 80 50 54 37 18 61 26 1 4 1 3 38 46 5 0
m t 56 1 4 63 1 0 28 2 50 4 8 61 9 7 17 6 2 91 76 68 7 55 2 54 10 9 8 14 2 10 5 40 11 3 96 2 88 0 1 4 20 4 25 4 0 14 7 9 18 4 7 93 1 1 22 5 7 11 3 2 25 3 54 2 26 4 25 4 11 6 43 9 12 8 63 47 1 55 0 20 17 8 84 0 42 7 43 4 17 5 19 1 61 5 30 5 0 40 6 22 31 7 57 7 55
m /h 13 15 8 12 15 12 9 11 8 7 5 10 9 8 5 6 6 10 2 1 12 8 13 17 23 13 14 11 9
=AF2 7 5 /AF2 7 4 9 11 6 9 18 4 8 5 7 4 5 11 9 8 5 11 10 12 10 6 7 8 12
Kailali
h a 78 0 78 0 52 78 0 78 0 52 0 52 5 52 26 0 26 0 52 0 26 0 26 0 52 52 0 26 0 26 0 10 4 0 78 0 78 0 10 4 0 71 3 47 5 26 71 3 10 23 8 48 23 8 71 3 19 19 5 5 5 23 8 38 0 38 0 38 0 38 0 38 0 38 0 38 0 23 8 24 16 4 75
m t 11 7 0 11 7 00 78 0 11 7 00 11 7 00 78 0 0 78 0 78 78 0 39 0 0 39 0 0 78 0 0 39 0 0 39 0 0 78 0 78 0 0 39 0 0 39 0 0 15 6 00 11 7 00 11 7 00 10 4 00 99 7 5 66 5 0 36 4 10 6 88 14 3 35 6 3 71 3 35 6 3 10 6 88 28 5 28 5 71 71 71 35 6 3 57 0 0 57 0 0 57 0 0 57 0 0 57 0 0 57 0 0 57 0 0 35 6 3 35 6 23 0 17 7
m /h 2 15 15 15 15 15 15 15 15 15 15 15 15 15 15 15 15 15
=U2 7 8 /U27 7
=V2 7 8 /V27 7
=W2 7 8 /W27 7 15 15 15 10 14 14 14 15 15 15 15 15 15 15 15 15 15 15 15 15 15 15 15 15 15 15 15 15 14
Kanchanpur
h a 30 0 39 5 30 37 0 11 5 40 30 5 7 45 22 38 13 60 42 15 37 6 11 8 86 52 5 30 5 18 0 12 14 0 10 95 13 2 22 25 0 8 5 42 70 5 12 7 42 35 45 15 15 10 5 35 2 1 5 13 5 44 6 9
m t 25 5 0 48 3 9 12 6 35 1 5 16 6 8 38 0 39 0 40 35 27 0 29 7 45 6 75 54 0 37 8 13 5 32 9 0 11 8 0 10 3 2 28 8 8 45 7 5 25 2 0 84 22 4 0 85 57 0 15 8 4 33 0 37 5 0 64 40 67 2 91 0 50 13 9 7 54 6 31 5 64 1 13 5 20 3 10 6 1 52 5 12 4 40 10 8 0 47 5 15
m /h 9 12 4 10 15 10 13 8 5 6
=M 2 8 1/M28 0 14 12
=P2 8 1/P280 6 9 9 9
=U2 8 1 /U28 0
=V2 8 1 /V28 0
=W2 8 1 /W28 0 9 10 12 6 15 14 7 16 9 6 12 15 15 8 8 16 13 10 11 13 9 14 9 14 10 15 8 8 8 8 11
FW. TERAI
h a 10 8 0 11 7 5 82 11 5 0 89 5 56 0 82 10 59 30 5 26 0 54 2 29 8 26 0 65 58 0 30 2 27 5 14 1 6 89 8 86 6 15 6 5 10 1 8 65 5 38 85 3 20 33 3 18 0 26 0 96 3 27 19 5 10 5 28 0 70 5 50 7 42 2 41 5 42 5 39 5 39 5 48 5 27 3 25 1 5 13 5 20 9 43
m t 37 2 0 16 5 39 90 6 15 2 15 13 3 68 81 8 0 11 7 0 11 8 81 5 41 7 0 39 0 0 80 9 7 43 5 6 39 0 0 85 5 83 4 0 42 7 8 40 3 5 18 8 90 12 8 80 12 7 32 13 2 88 14 5 50 91 7 0 44 8 12 9 28 22 8 41 3 3 22 9 7 38 9 3 14 4 38 34 9 28 5 71 11 1 71 42 3 5 91 0 50 70 9 7 62 4 6 60 1 5 63 4 1 58 3 5 59 0 3 67 6 1 40 8 8 36 8 4 40 10 8 0 27 7 69 2
m /h 3 14 11 13 15 15 14 14 14 15 15 15 13 14 14 15 13 14 15 8 14 14 15 12 12 13 15 15 13 15 15 13 14 15 14 15 15 15 14 15 8 8 8 13
F W. R E GI ON
h a 17 2 8 17 9 8 13 7 17 1 5 15 7 4 90 7 96 17 15 5 40 4 29 0 69 6 31 4 28 7 79 65 6 46 7 37 3 1 4 19 19 3 4 10 6 0 10 3 1 22 1 1 13 1 0 80 6 85 96 4 20 38 6 21 8 29 6 10 6 3 42 41 5 10 14 28 0 17 7 5 5 57 7 54 8 52 7 51 7 45 3 41 9 55 8 59 4 29 2 20 30 9 28 2 26
m t 11 7 77 25 4 61 13 8 1 22 0 17 22 2 92 11 8 06 12 9 1 19 4 15 5 0 48 4 7 41 8 5 96 7 8 44 9 8 41 5 0 95 1 89 7 2 53 0 1 49 5 7 1 4 21 7 22 6 87 14 9 37 15 2 57 24 9 82 18 3 02 11 0 68 11 0 1 13 9 94 22 8 46 7 6 27 2 4 41 5 8 15 4 63 57 3 45 3 71 11 1 14 2 42 3 5 16 8 2 50 20 75 9 5 74 9 6 69 9 7 70 7 4 61 4 5 61 6 6 75 2 0 76 2 2 40 8 10 16 4 23 5 0 36 1 98 5
m /h 7 14 10 13 14 13 13 11 10 12 14 14 14 14 12 14 11 13 2 1 12 12 14 15 11 14 14 13 15 12 12 13 14 15 14 11 15 10 15 10 10 4 13 14 13 14 14 15 13 13 14 7 8 8 13
NEPAL
h a 34 7 04 27 6 79 19 9 7 19 7 25 18 1 88 13 0 93 26 8 5 45 9 11 1 4 65 2 0 20 8 7 52 9 7 20 0 1 85 7 94 5 32 8 0 45 9 9 15 1 1 16 9 10 9 90 3 82 3 9 10 6 13 92 3 1 20 7 12 97 0 8 73 8 0 16 1 9 81 1 3 18 5 2 57 1 2 10 1 6 10 2 5 72 0 7 16 5 21 7 79 79 17 3 1 16 4 5 89 8 75 72 60 18 7 4 19 4 8 17 4 1 13 3 5 79 2 61 1 15 4 6 42 1 1 90 8 66 3 59 3 37 8 7 26 6 93 7
m t 49 4 76 5 45 3 60 0 21 3 23 33 1 73 6 26 3 21 5 15 9 20 5 31 4 05 47 9 6 11 5 16 63 4 89 18 6 88 55 4 00 18 9 50 92 6 7 82 7 4 33 0 26 45 2 87 14 7 76 14 3 1 10 1 9
=W6 2 + W13 1 +W1 91 +W2 4 8 +W2 8 7 74 9 02 11 8 58 5 13 1 40 5 24 8 58 4 15 0 05 1 10 6 54 7 24 0 16 11 2 30 9 24 2 67 92 8 15 11 9 05 11 7 70 10 8 20 8 23 6 2 20 4 9 93 4 10 4 5 27 8 15 28 5 13 11 4 41 21 1 0 76 0 42 7 17 1 14 20 9 77 14 8 49 12 7 89 90 8 0 81 6 9 15 8 74 40 6 35 12 5 65 11 6 90 56 7 7 46 5 54 35 8 00 8 5
m /h 14 16 11 17 14 12 12 10 10 10 9 10 9 11 9 10 10 10 8 9
=W2 9 0 /W28 9 9 11 14 12 15 14 15 14 13 16 12 11 15 14 9 12 13 16 17 13 28 11 7 9 11 9 10 11 13 10 10 14 18 10 12 13
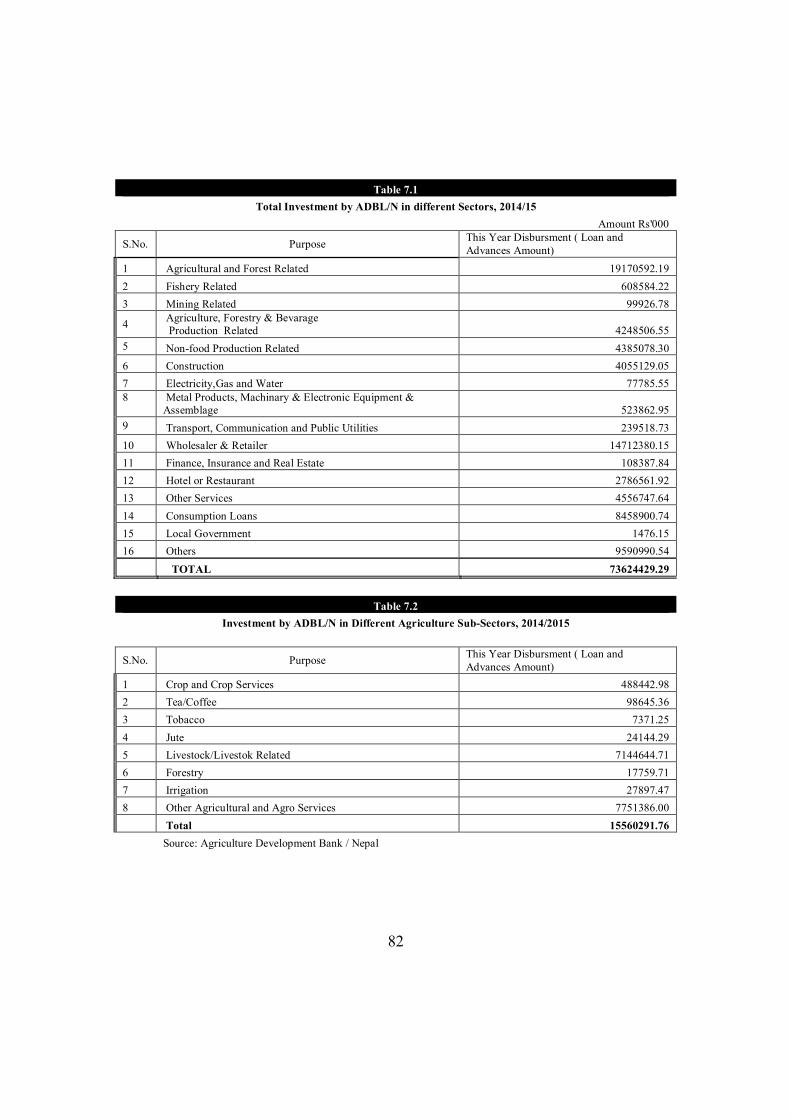
82
Table 7.1
Total Investment by ADBL/N in different Sectors, 2014/15 Amount Rs'000
S.No. Purpose This Year Disbursment ( Loan and Advances Amount)
1 Agricultural and Forest Related 19170592.19 2 Fishery Related 608584.22 3 Mining Related 99926.78
4 Agriculture, Forestry & Bevarage Production Related 4248506.55
5 Non-food Production Related 4385078.30 6 Construction 4055129.05 7 Electricity,Gas and Water 77785.55 8 Metal Products, Machinary & Electronic Equipment &
Assemblage 523862.95 9 Transport, Communication and Public Utilities 239518.73 10 Wholesaler & Retailer 14712380.15 11 Finance, Insurance and Real Estate 108387.84 12 Hotel or Restaurant 2786561.92 13 Other Services 4556747.64 14 Consumption Loans 8458900.74 15 Local Government 1476.15 16 Others 9590990.54 TOTAL 73624429.29
Table 7.2
Investment by ADBL/N in Different Agriculture Sub-Sectors, 2014/2015
S.No. Purpose This Year Disbursment ( Loan and Advances Amount)
1 Crop and Crop Services 488442.98 2 Tea/Coffee 98645.36 3 Tobacco 7371.25 4 Jute 24144.29 5 Livestock/Livestok Related 7144644.71 6 Forestry 17759.71 7 Irrigation 27897.47 8 Other Agricultural and Agro Services 7751386.00 Total 15560291.76
Source: Agriculture Development Bank / Nepal
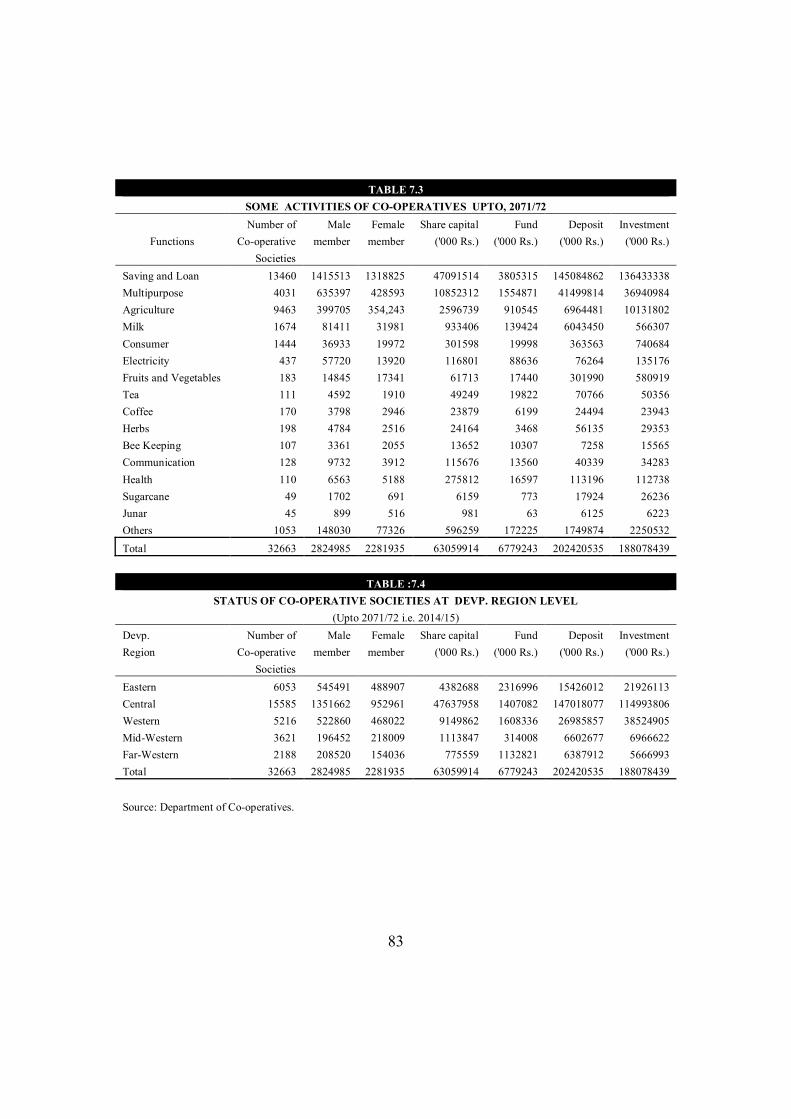
83
TABLE 7.3
SOME ACTIVITIES OF CO-OPERATIVES UPTO, 2071/72 Number of Male Female Share capital Fund Deposit Investment
Functions Co-operative member member ('000 Rs.) ('000 Rs.) ('000 Rs.) ('000 Rs.) Societies Saving and Loan 13460 1415513 1318825 47091514 3805315 145084862 136433338 Multipurpose 4031 635397 428593 10852312 1554871 41499814 36940984 Agriculture 9463 399705 354,243 2596739 910545 6964481 10131802 Milk 1674 81411 31981 933406 139424 6043450 566307 Consumer 1444 36933 19972 301598 19998 363563 740684 Electricity 437 57720 13920 116801 88636 76264 135176 Fruits and Vegetables 183 14845 17341 61713 17440 301990 580919 Tea 111 4592 1910 49249 19822 70766 50356 Coffee 170 3798 2946 23879 6199 24494 23943 Herbs 198 4784 2516 24164 3468 56135 29353 Bee Keeping 107 3361 2055 13652 10307 7258 15565 Communication 128 9732 3912 115676 13560 40339 34283 Health 110 6563 5188 275812 16597 113196 112738 Sugarcane 49 1702 691 6159 773 17924 26236 Junar 45 899 516 981 63 6125 6223 Others 1053 148030 77326 596259 172225 1749874 2250532 Total 32663 2824985 2281935 63059914 6779243 202420535 188078439
TABLE :7.4 STATUS OF CO-OPERATIVE SOCIETIES AT DEVP. REGION LEVEL
(Upto 2071/72 i.e. 2014/15) Devp. Number of Male Female Share capital Fund Deposit Investment Region Co-operative member member ('000 Rs.) ('000 Rs.) ('000 Rs.) ('000 Rs.) Societies Eastern 6053 545491 488907 4382688 2316996 15426012 21926113 Central 15585 1351662 952961 47637958 1407082 147018077 114993806 Western 5216 522860 468022 9149862 1608336 26985857 38524905 Mid-Western 3621 196452 218009 1113847 314008 6602677 6966622 Far-Western 2188 208520 154036 775559 1132821 6387912 5666993 Total 32663 2824985 2281935 63059914 6779243 202420535 188078439
Source: Department of Co-operatives.
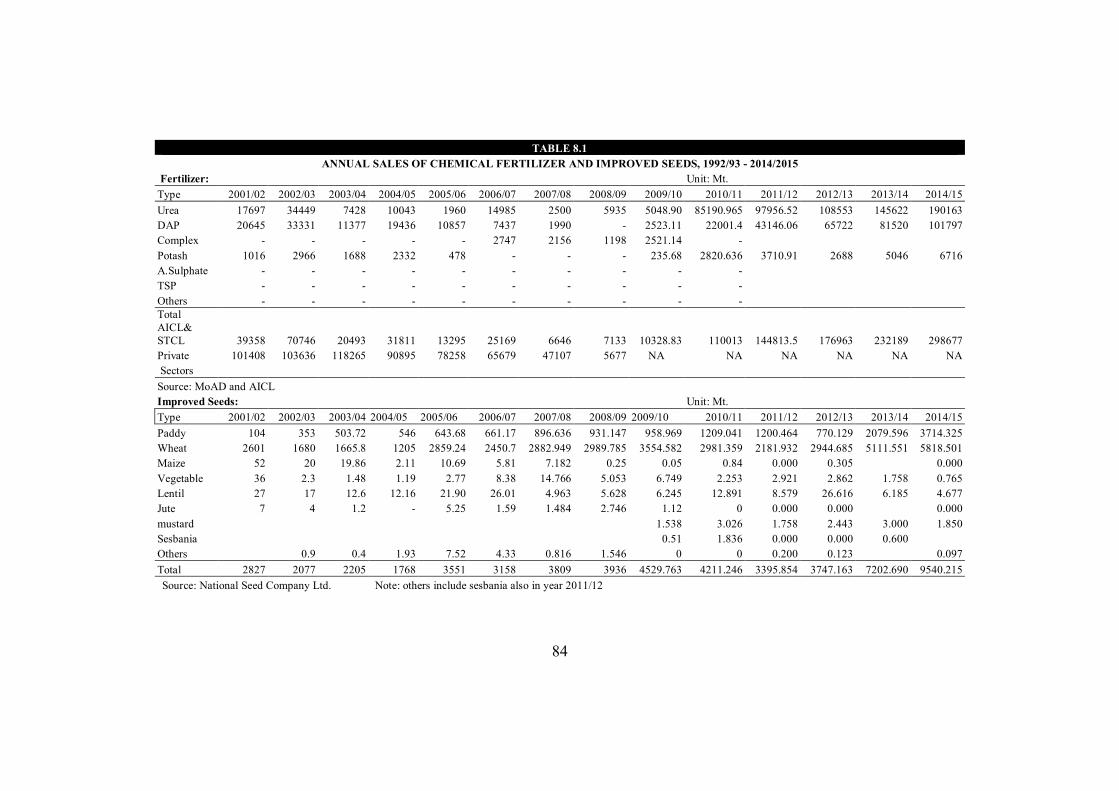
84
TABLE 8.1
ANNUAL SALES OF CHEMICAL FERTILIZER AND IMPROVED SEEDS, 1992/93 - 2014/2015 Fertilizer: Unit: Mt. Type 2001/02 2002/03 2003/04 2004/05 2005/06 2006/07 2007/08 2008/09 2009/10 2010/11 2011/12 2012/13 2013/14 2014/15 Urea 17697 34449 7428 10043 1960 14985 2500 5935 5048.90 85190.965 97956.52 108553 145622 190163 DAP 20645 33331 11377 19436 10857 7437 1990 - 2523.11 22001.4 43146.06 65722 81520 101797 Complex - - - - - 2747 2156 1198 2521.14 - Potash 1016 2966 1688 2332 478 - - - 235.68 2820.636 3710.91 2688 5046 6716 A.Sulphate - - - - - - - - - - TSP - - - - - - - - - - Others - - - - - - - - - - Total AICL& STCL 39358 70746 20493 31811 13295 25169 6646 7133 10328.83 110013 144813.5 176963 232189 298677 Private 101408 103636 118265 90895 78258 65679 47107 5677 NA NA NA NA NA NA Sectors Source: MoAD and AICL Improved Seeds: Unit: Mt. Type 2001/02 2002/03 2003/04 2004/05 2005/06 2006/07 2007/08 2008/09 2009/10 2010/11 2011/12 2012/13 2013/14 2014/15 Paddy 104 353 503.72 546 643.68 661.17 896.636 931.147 958.969 1209.041 1200.464 770.129 2079.596 3714.325 Wheat 2601 1680 1665.8 1205 2859.24 2450.7 2882.949 2989.785 3554.582 2981.359 2181.932 2944.685 5111.551 5818.501 Maize 52 20 19.86 2.11 10.69 5.81 7.182 0.25 0.05 0.84 0.000 0.305 0.000 Vegetable 36 2.3 1.48 1.19 2.77 8.38 14.766 5.053 6.749 2.253 2.921 2.862 1.758 0.765 Lentil 27 17 12.6 12.16 21.90 26.01 4.963 5.628 6.245 12.891 8.579 26.616 6.185 4.677 Jute 7 4 1.2 - 5.25 1.59 1.484 2.746 1.12 0 0.000 0.000 0.000 mustard 1.538 3.026 1.758 2.443 3.000 1.850 Sesbania 0.51 1.836 0.000 0.000 0.600 Others 0.9 0.4 1.93 7.52 4.33 0.816 1.546 0 0 0.200 0.123 0.097 Total 2827 2077 2205 1768 3551 3158 3809 3936 4529.763 4211.246 3395.854 3747.163 7202.690 9540.215 Source: National Seed Company Ltd. Note: others include sesbania also in year 2011/12
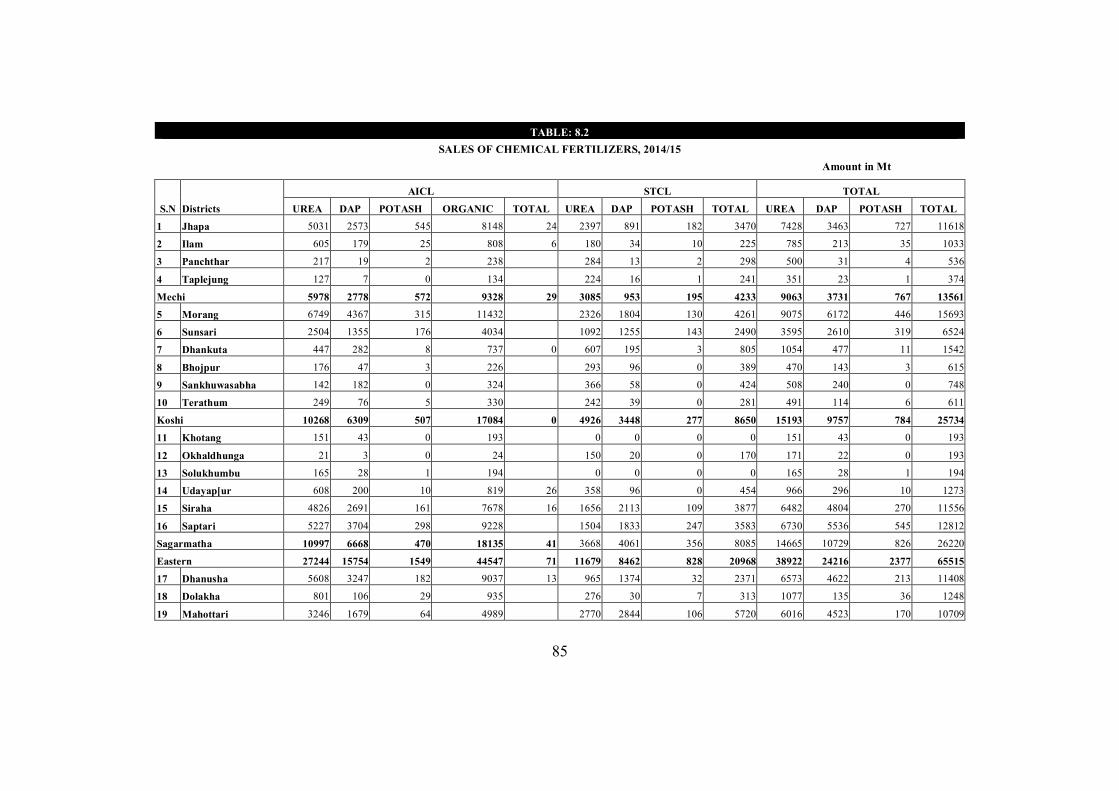
85
TABLE: 8.2 SALES OF CHEMICAL FERTILIZERS, 2014/15
Amount in Mt
S.N Districts
AICL STCL TOTAL
UREA DAP POTASH ORGANIC TOTAL UREA DAP POTASH TOTAL UREA DAP POTASH TOTAL
1 Jhapa 5031 2573 545 8148 24 2397 891 182 3470 7428 3463 727 11618
2 Ilam 605 179 25 808 6 180 34 10 225 785 213 35 1033
3 Panchthar 217 19 2 238 284 13 2 298 500 31 4 536
4 Taplejung 127 7 0 134 224 16 1 241 351 23 1 374
Mechi 5978 2778 572 9328 29 3085 953 195 4233 9063 3731 767 13561
5 Morang 6749 4367 315 11432 2326 1804 130 4261 9075 6172 446 15693
6 Sunsari 2504 1355 176 4034 1092 1255 143 2490 3595 2610 319 6524
7 Dhankuta 447 282 8 737 0 607 195 3 805 1054 477 11 1542
8 Bhojpur 176 47 3 226 293 96 0 389 470 143 3 615
9 Sankhuwasabha 142 182 0 324 366 58 0 424 508 240 0 748
10 Terathum 249 76 5 330 242 39 0 281 491 114 6 611
Koshi 10268 6309 507 17084 0 4926 3448 277 8650 15193 9757 784 25734
11 Khotang 151 43 0 193 0 0 0 0 151 43 0 193
12 Okhaldhunga 21 3 0 24 150 20 0 170 171 22 0 193
13 Solukhumbu 165 28 1 194 0 0 0 0 165 28 1 194
14 Udayap[ur 608 200 10 819 26 358 96 0 454 966 296 10 1273
15 Siraha 4826 2691 161 7678 16 1656 2113 109 3877 6482 4804 270 11556
16 Saptari 5227 3704 298 9228 1504 1833 247 3583 6730 5536 545 12812
Sagarmatha 10997 6668 470 18135 41 3668 4061 356 8085 14665 10729 826 26220
Eastern 27244 15754 1549 44547 71 11679 8462 828 20968 38922 24216 2377 65515
17 Dhanusha 5608 3247 182 9037 13 965 1374 32 2371 6573 4622 213 11408
18 Dolakha 801 106 29 935 276 30 7 313 1077 135 36 1248
19 Mahottari 3246 1679 64 4989 2770 2844 106 5720 6016 4523 170 10709
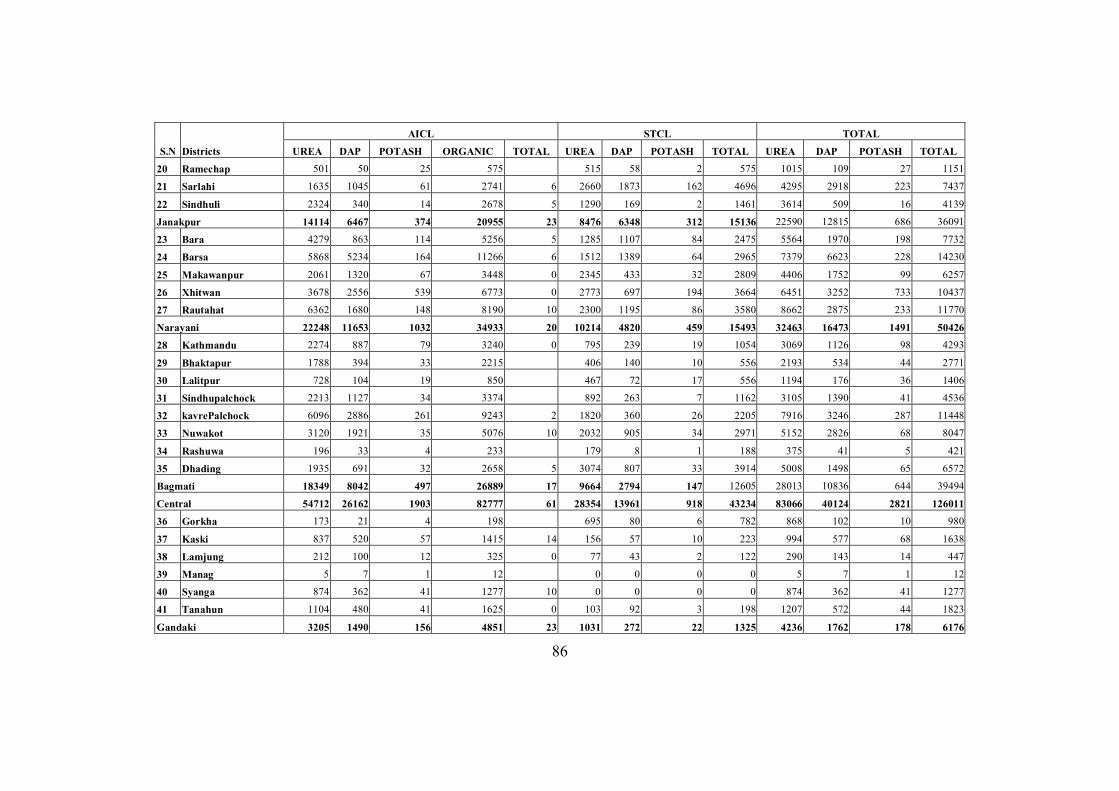
86
S.N Districts
AICL STCL TOTAL
UREA DAP POTASH ORGANIC TOTAL UREA DAP POTASH TOTAL UREA DAP POTASH TOTAL
20 Ramechap 501 50 25 575 515 58 2 575 1015 109 27 1151
21 Sarlahi 1635 1045 61 2741 6 2660 1873 162 4696 4295 2918 223 7437
22 Sindhuli 2324 340 14 2678 5 1290 169 2 1461 3614 509 16 4139
Janakpur 14114 6467 374 20955 23 8476 6348 312 15136 22590 12815 686 36091
23 Bara 4279 863 114 5256 5 1285 1107 84 2475 5564 1970 198 7732
24 Barsa 5868 5234 164 11266 6 1512 1389 64 2965 7379 6623 228 14230
25 Makawanpur 2061 1320 67 3448 0 2345 433 32 2809 4406 1752 99 6257
26 Xhitwan 3678 2556 539 6773 0 2773 697 194 3664 6451 3252 733 10437
27 Rautahat 6362 1680 148 8190 10 2300 1195 86 3580 8662 2875 233 11770
Narayani 22248 11653 1032 34933 20 10214 4820 459 15493 32463 16473 1491 50426
28 Kathmandu 2274 887 79 3240 0 795 239 19 1054 3069 1126 98 4293
29 Bhaktapur 1788 394 33 2215 406 140 10 556 2193 534 44 2771
30 Lalitpur 728 104 19 850 467 72 17 556 1194 176 36 1406
31 Sindhupalchock 2213 1127 34 3374 892 263 7 1162 3105 1390 41 4536
32 kavrePalchock 6096 2886 261 9243 2 1820 360 26 2205 7916 3246 287 11448
33 Nuwakot 3120 1921 35 5076 10 2032 905 34 2971 5152 2826 68 8047
34 Rashuwa 196 33 4 233 179 8 1 188 375 41 5 421
35 Dhading 1935 691 32 2658 5 3074 807 33 3914 5008 1498 65 6572
Bagmati 18349 8042 497 26889 17 9664 2794 147 12605 28013 10836 644 39494
Central 54712 26162 1903 82777 61 28354 13961 918 43234 83066 40124 2821 126011
36 Gorkha 173 21 4 198 695 80 6 782 868 102 10 980
37 Kaski 837 520 57 1415 14 156 57 10 223 994 577 68 1638
38 Lamjung 212 100 12 325 0 77 43 2 122 290 143 14 447
39 Manag 5 7 1 12 0 0 0 0 5 7 1 12
40 Syanga 874 362 41 1277 10 0 0 0 0 874 362 41 1277
41 Tanahun 1104 480 41 1625 0 103 92 3 198 1207 572 44 1823
Gandaki 3205 1490 156 4851 23 1031 272 22 1325 4236 1762 178 6176
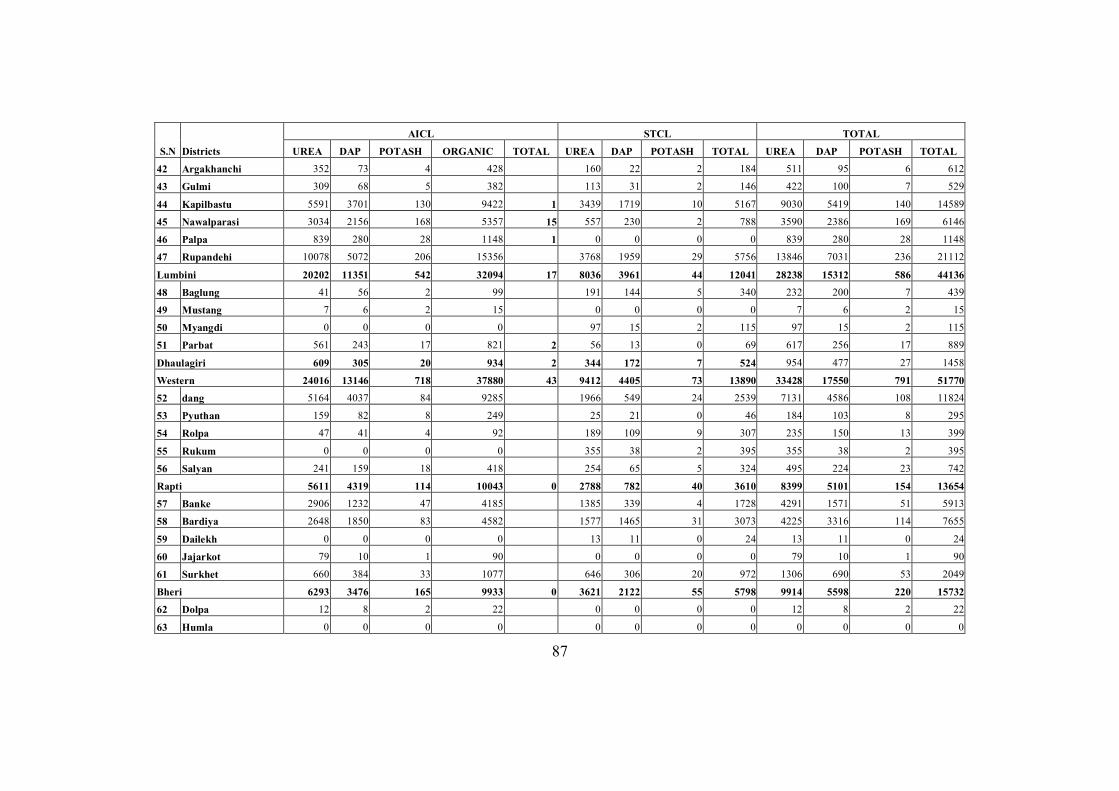
87
S.N Districts
AICL STCL TOTAL
UREA DAP POTASH ORGANIC TOTAL UREA DAP POTASH TOTAL UREA DAP POTASH TOTAL
42 Argakhanchi 352 73 4 428 160 22 2 184 511 95 6 612
43 Gulmi 309 68 5 382 113 31 2 146 422 100 7 529
44 Kapilbastu 5591 3701 130 9422 1 3439 1719 10 5167 9030 5419 140 14589
45 Nawalparasi 3034 2156 168 5357 15 557 230 2 788 3590 2386 169 6146
46 Palpa 839 280 28 1148 1 0 0 0 0 839 280 28 1148
47 Rupandehi 10078 5072 206 15356 3768 1959 29 5756 13846 7031 236 21112
Lumbini 20202 11351 542 32094 17 8036 3961 44 12041 28238 15312 586 44136
48 Baglung 41 56 2 99 191 144 5 340 232 200 7 439
49 Mustang 7 6 2 15 0 0 0 0 7 6 2 15
50 Myangdi 0 0 0 0 97 15 2 115 97 15 2 115
51 Parbat 561 243 17 821 2 56 13 0 69 617 256 17 889
Dhaulagiri 609 305 20 934 2 344 172 7 524 954 477 27 1458
Western 24016 13146 718 37880 43 9412 4405 73 13890 33428 17550 791 51770
52 dang 5164 4037 84 9285 1966 549 24 2539 7131 4586 108 11824
53 Pyuthan 159 82 8 249 25 21 0 46 184 103 8 295
54 Rolpa 47 41 4 92 189 109 9 307 235 150 13 399
55 Rukum 0 0 0 0 355 38 2 395 355 38 2 395
56 Salyan 241 159 18 418 254 65 5 324 495 224 23 742
Rapti 5611 4319 114 10043 0 2788 782 40 3610 8399 5101 154 13654
57 Banke 2906 1232 47 4185 1385 339 4 1728 4291 1571 51 5913
58 Bardiya 2648 1850 83 4582 1577 1465 31 3073 4225 3316 114 7655
59 Dailekh 0 0 0 0 13 11 0 24 13 11 0 24
60 Jajarkot 79 10 1 90 0 0 0 0 79 10 1 90
61 Surkhet 660 384 33 1077 646 306 20 972 1306 690 53 2049
Bheri 6293 3476 165 9933 0 3621 2122 55 5798 9914 5598 220 15732
62 Dolpa 12 8 2 22 0 0 0 0 12 8 2 22
63 Humla 0 0 0 0 0 0 0 0 0 0 0 0
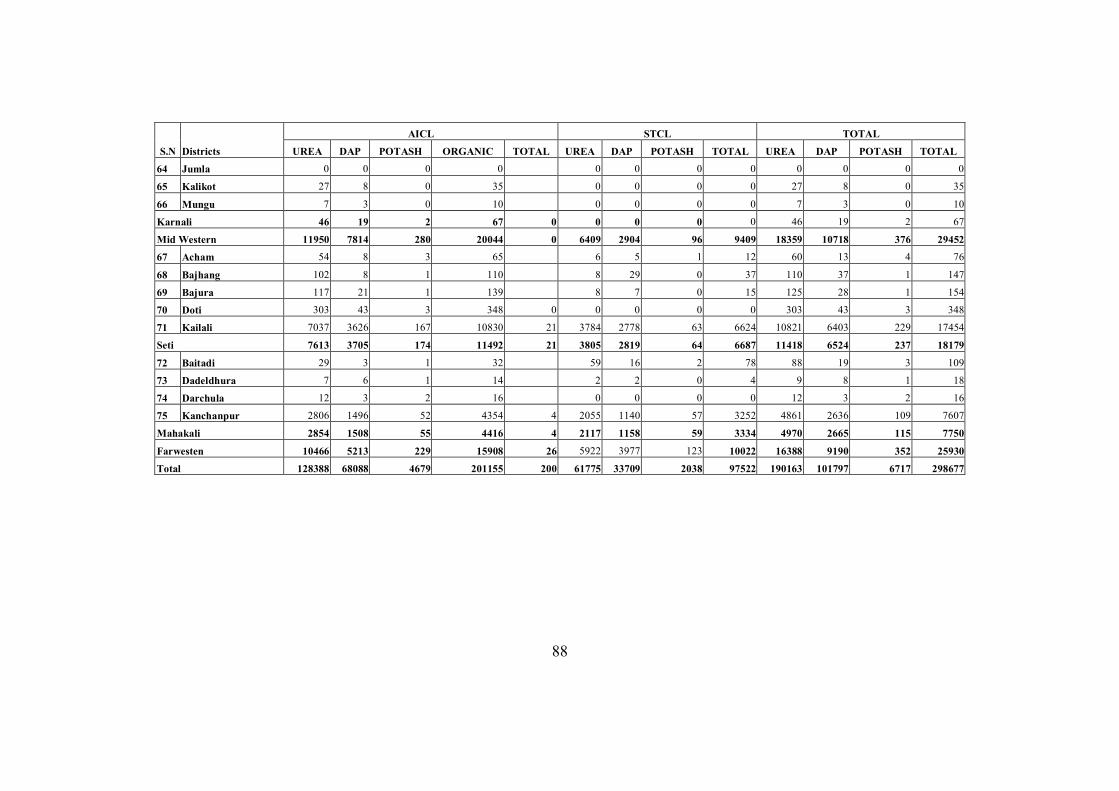
88
S.N Districts
AICL STCL TOTAL
UREA DAP POTASH ORGANIC TOTAL UREA DAP POTASH TOTAL UREA DAP POTASH TOTAL
64 Jumla 0 0 0 0 0 0 0 0 0 0 0 0
65 Kalikot 27 8 0 35 0 0 0 0 27 8 0 35
66 Mungu 7 3 0 10 0 0 0 0 7 3 0 10
Karnali 46 19 2 67 0 0 0 0 0 46 19 2 67
Mid Western 11950 7814 280 20044 0 6409 2904 96 9409 18359 10718 376 29452
67 Acham 54 8 3 65 6 5 1 12 60 13 4 76
68 Bajhang 102 8 1 110 8 29 0 37 110 37 1 147
69 Bajura 117 21 1 139 8 7 0 15 125 28 1 154
70 Doti 303 43 3 348 0 0 0 0 0 303 43 3 348
71 Kailali 7037 3626 167 10830 21 3784 2778 63 6624 10821 6403 229 17454
Seti 7613 3705 174 11492 21 3805 2819 64 6687 11418 6524 237 18179
72 Baitadi 29 3 1 32 59 16 2 78 88 19 3 109
73 Dadeldhura 7 6 1 14 2 2 0 4 9 8 1 18
74 Darchula 12 3 2 16 0 0 0 0 12 3 2 16
75 Kanchanpur 2806 1496 52 4354 4 2055 1140 57 3252 4861 2636 109 7607
Mahakali 2854 1508 55 4416 4 2117 1158 59 3334 4970 2665 115 7750
Farwesten 10466 5213 229 15908 26 5922 3977 123 10022 16388 9190 352 25930
Total 128388 68088 4679 201155 200 61775 33709 2038 97522 190163 101797 6717 298677
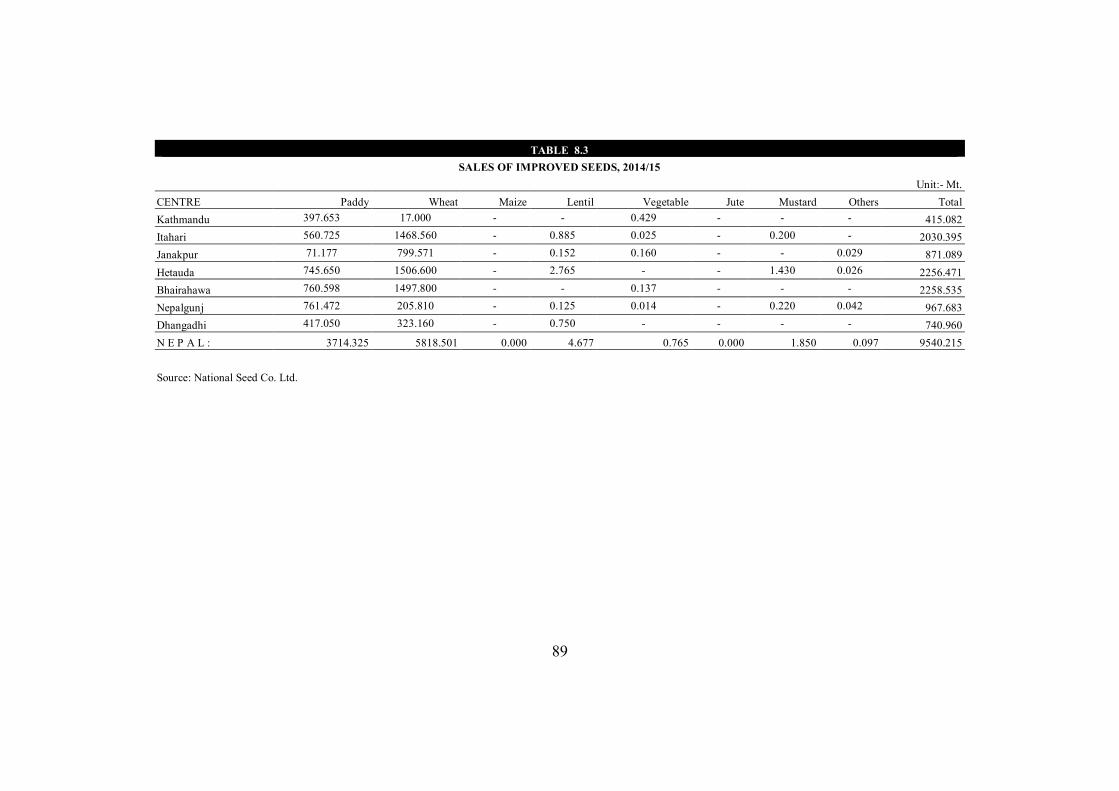
89
TABLE 8.3
SALES OF IMPROVED SEEDS, 2014/15 Unit:- Mt.
CENTRE Paddy Wheat Maize Lentil Vegetable Jute Mustard Others Total Kathmandu 397.653 17.000 - - 0.429 - - - 415.082 Itahari 560.725 1468.560 - 0.885 0.025 - 0.200 - 2030.395 Janakpur 71.177 799.571 - 0.152 0.160 - - 0.029 871.089 Hetauda 745.650 1506.600 - 2.765 - - 1.430 0.026 2256.471 Bhairahawa 760.598 1497.800 - - 0.137 - - - 2258.535 Nepalgunj 761.472 205.810 - 0.125 0.014 - 0.220 0.042 967.683 Dhangadhi 417.050 323.160 - 0.750 - - - - 740.960 N E P A L : 3714.325 5818.501 0.000 4.677 0.765 0.000 1.850 0.097 9540.215
Source: National Seed Co. Ltd.
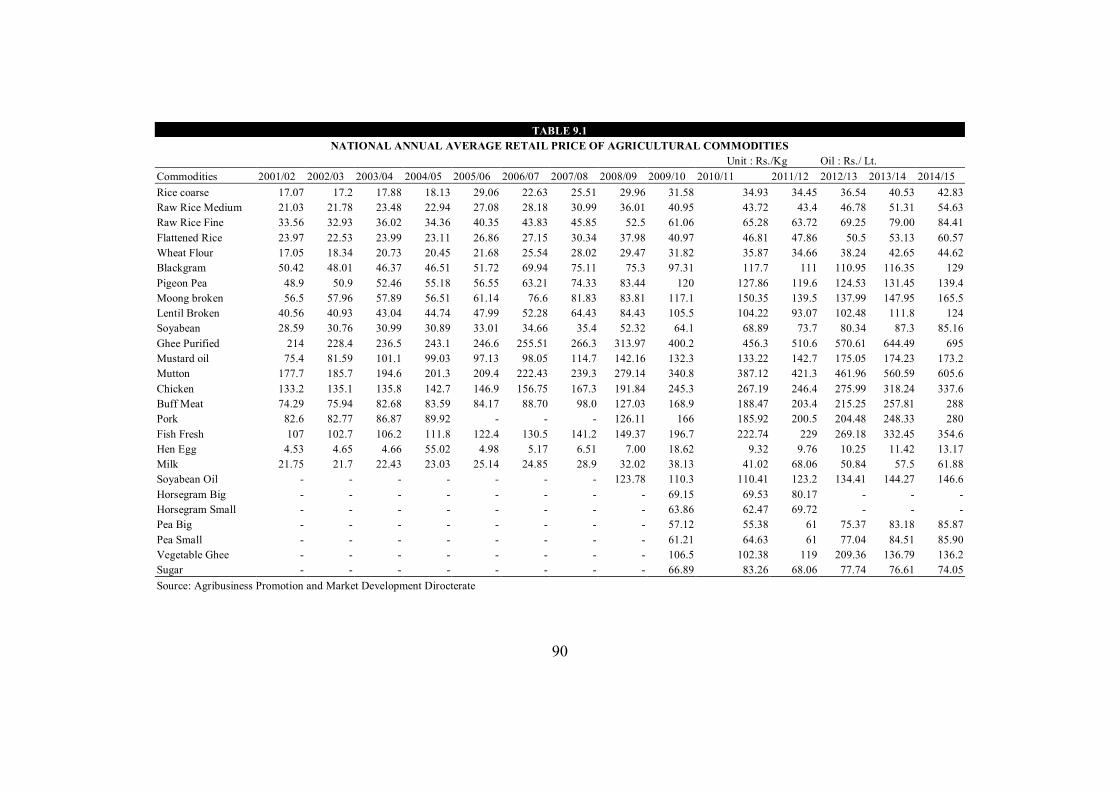
90
TABLE 9.1 NATIONAL ANNUAL AVERAGE RETAIL PRICE OF AGRICULTURAL COMMODITIES
Unit : Rs./Kg Oil : Rs./ Lt. Commodities 2001/02 2002/03 2003/04 2004/05 2005/06 2006/07 2007/08 2008/09 2009/10 2010/11 2011/12 2012/13 2013/14 2014/15 Rice coarse 17.07 17.2 17.88 18.13 29.06 22.63 25.51 29.96 31.58 34.93 34.45 36.54 40.53 42.83 Raw Rice Medium 21.03 21.78 23.48 22.94 27.08 28.18 30.99 36.01 40.95 43.72 43.4 46.78 51.31 54.63 Raw Rice Fine 33.56 32.93 36.02 34.36 40.35 43.83 45.85 52.5 61.06 65.28 63.72 69.25 79.00 84.41 Flattened Rice 23.97 22.53 23.99 23.11 26.86 27.15 30.34 37.98 40.97 46.81 47.86 50.5 53.13 60.57 Wheat Flour 17.05 18.34 20.73 20.45 21.68 25.54 28.02 29.47 31.82 35.87 34.66 38.24 42.65 44.62 Blackgram 50.42 48.01 46.37 46.51 51.72 69.94 75.11 75.3 97.31 117.7 111 110.95 116.35 129 Pigeon Pea 48.9 50.9 52.46 55.18 56.55 63.21 74.33 83.44 120 127.86 119.6 124.53 131.45 139.4 Moong broken 56.5 57.96 57.89 56.51 61.14 76.6 81.83 83.81 117.1 150.35 139.5 137.99 147.95 165.5 Lentil Broken 40.56 40.93 43.04 44.74 47.99 52.28 64.43 84.43 105.5 104.22 93.07 102.48 111.8 124 Soyabean 28.59 30.76 30.99 30.89 33.01 34.66 35.4 52.32 64.1 68.89 73.7 80.34 87.3 85.16 Ghee Purified 214 228.4 236.5 243.1 246.6 255.51 266.3 313.97 400.2 456.3 510.6 570.61 644.49 695 Mustard oil 75.4 81.59 101.1 99.03 97.13 98.05 114.7 142.16 132.3 133.22 142.7 175.05 174.23 173.2 Mutton 177.7 185.7 194.6 201.3 209.4 222.43 239.3 279.14 340.8 387.12 421.3 461.96 560.59 605.6 Chicken 133.2 135.1 135.8 142.7 146.9 156.75 167.3 191.84 245.3 267.19 246.4 275.99 318.24 337.6 Buff Meat 74.29 75.94 82.68 83.59 84.17 88.70 98.0 127.03 168.9 188.47 203.4 215.25 257.81 288 Pork 82.6 82.77 86.87 89.92 - - - 126.11 166 185.92 200.5 204.48 248.33 280 Fish Fresh 107 102.7 106.2 111.8 122.4 130.5 141.2 149.37 196.7 222.74 229 269.18 332.45 354.6 Hen Egg 4.53 4.65 4.66 55.02 4.98 5.17 6.51 7.00 18.62 9.32 9.76 10.25 11.42 13.17 Milk 21.75 21.7 22.43 23.03 25.14 24.85 28.9 32.02 38.13 41.02 68.06 50.84 57.5 61.88 Soyabean Oil - - - - - - - 123.78 110.3 110.41 123.2 134.41 144.27 146.6 Horsegram Big - - - - - - - - 69.15 69.53 80.17 - - - Horsegram Small - - - - - - - - 63.86 62.47 69.72 - - - Pea Big - - - - - - - - 57.12 55.38 61 75.37 83.18 85.87 Pea Small - - - - - - - - 61.21 64.63 61 77.04 84.51 85.90 Vegetable Ghee - - - - - - - - 106.5 102.38 119 209.36 136.79 136.2 Sugar - - - - - - - - 66.89 83.26 68.06 77.74 76.61 74.05 Source: Agribusiness Promotion and Market Development Dirocterate
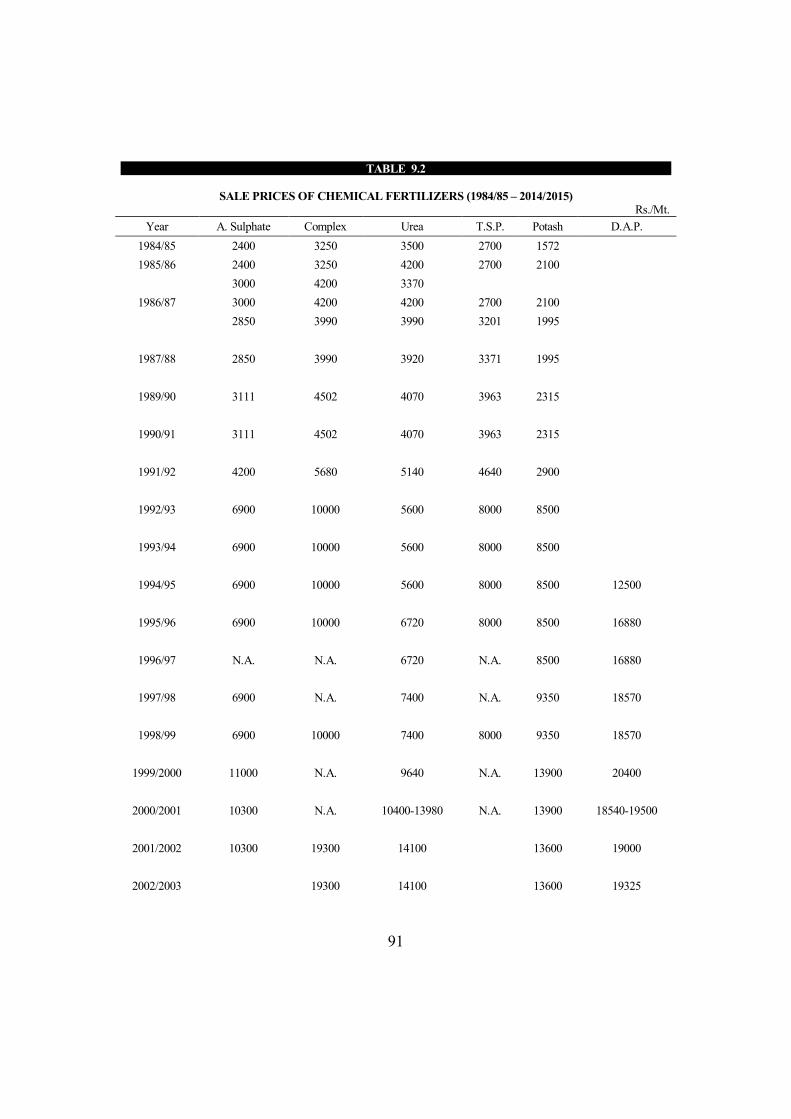
91
TABLE 9.2
SALE PRICES OF CHEMICAL FERTILIZERS (1984/85 – 2014/2015) Rs./Mt.
Year A. Sulphate Complex Urea T.S.P. Potash D.A.P. 1984/85 2400 3250 3500 2700 1572 1985/86 2400 3250 4200 2700 2100
3000 4200 3370 1986/87 3000 4200 4200 2700 2100
2850 3990 3990 3201 1995
1987/88 2850 3990 3920 3371 1995
1989/90 3111 4502 4070 3963 2315
1990/91 3111 4502 4070 3963 2315
1991/92 4200 5680 5140 4640 2900
1992/93 6900 10000 5600 8000 8500
1993/94 6900 10000 5600 8000 8500
1994/95 6900 10000 5600 8000 8500 12500
1995/96 6900 10000 6720 8000 8500 16880
1996/97 N.A. N.A. 6720 N.A. 8500 16880
1997/98 6900 N.A. 7400 N.A. 9350 18570
1998/99 6900 10000 7400 8000 9350 18570
1999/2000 11000 N.A. 9640 N.A. 13900 20400
2000/2001 10300 N.A. 10400-13980 N.A. 13900 18540-19500
2001/2002 10300 19300 14100 13600 19000
2002/2003 19300 14100 13600 19325
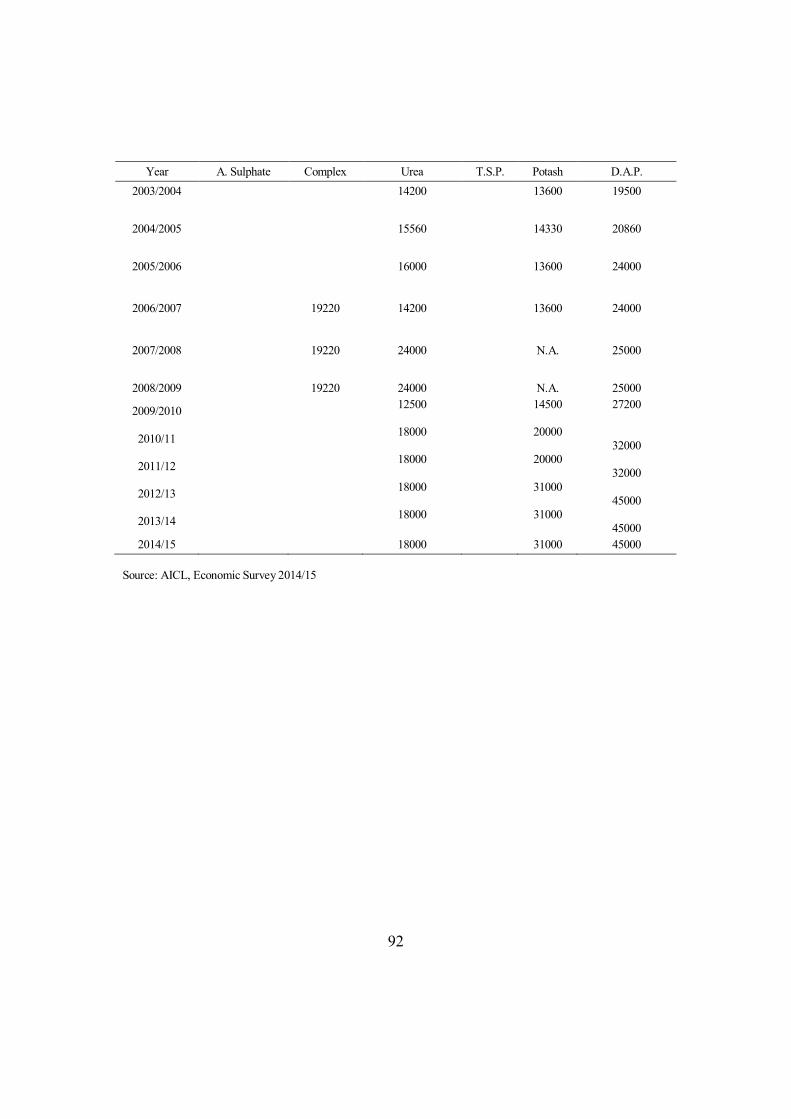
92
Year A. Sulphate Complex Urea T.S.P. Potash D.A.P. 2003/2004 14200 13600 19500
2004/2005 15560 14330 20860
2005/2006 16000 13600 24000
2006/2007 19220 14200 13600 24000
2007/2008 19220 24000 N.A. 25000
2008/2009 19220 24000 N.A. 25000
2009/2010
12500
14500
27200
2010/11
18000 20000
32000
2011/12
18000 20000
32000
2012/13
18000 31000
45000
2013/14
18000 31000
45000 2014/15 18000 31000 45000
Source: AICL, Economic Survey 2014/15
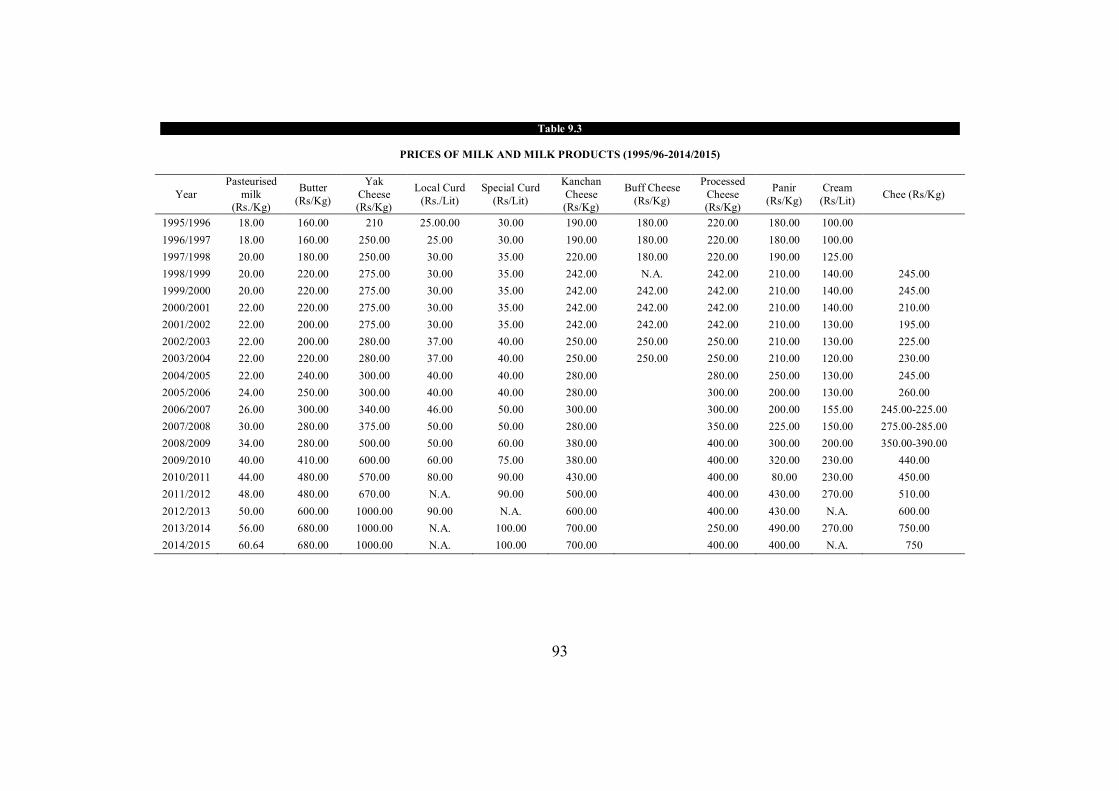
93
Table 9.3
PRICES OF MILK AND MILK PRODUCTS (1995/96-2014/2015)
Year Pasteurised
milk (Rs./Kg)
Butter (Rs/Kg)
Yak Cheese (Rs/Kg)
Local Curd (Rs./Lit)
Special Curd (Rs/Lit)
Kanchan Cheese (Rs/Kg)
Buff Cheese (Rs/Kg)
Processed Cheese (Rs/Kg)
Panir (Rs/Kg)
Cream (Rs/Lit) Chee (Rs/Kg)
1995/1996 18.00 160.00 210 25.00.00 30.00 190.00 180.00 220.00 180.00 100.00 1996/1997 18.00 160.00 250.00 25.00 30.00 190.00 180.00 220.00 180.00 100.00 1997/1998 20.00 180.00 250.00 30.00 35.00 220.00 180.00 220.00 190.00 125.00 1998/1999 20.00 220.00 275.00 30.00 35.00 242.00 N.A. 242.00 210.00 140.00 245.00 1999/2000 20.00 220.00 275.00 30.00 35.00 242.00 242.00 242.00 210.00 140.00 245.00 2000/2001 22.00 220.00 275.00 30.00 35.00 242.00 242.00 242.00 210.00 140.00 210.00 2001/2002 22.00 200.00 275.00 30.00 35.00 242.00 242.00 242.00 210.00 130.00 195.00 2002/2003 22.00 200.00 280.00 37.00 40.00 250.00 250.00 250.00 210.00 130.00 225.00 2003/2004 22.00 220.00 280.00 37.00 40.00 250.00 250.00 250.00 210.00 120.00 230.00 2004/2005 22.00 240.00 300.00 40.00 40.00 280.00 280.00 250.00 130.00 245.00 2005/2006 24.00 250.00 300.00 40.00 40.00 280.00 300.00 200.00 130.00 260.00 2006/2007 26.00 300.00 340.00 46.00 50.00 300.00 300.00 200.00 155.00 245.00-225.00 2007/2008 30.00 280.00 375.00 50.00 50.00 280.00 350.00 225.00 150.00 275.00-285.00 2008/2009 34.00 280.00 500.00 50.00 60.00 380.00 400.00 300.00 200.00 350.00-390.00 2009/2010 40.00 410.00 600.00 60.00 75.00 380.00 400.00 320.00 230.00 440.00 2010/2011 44.00 480.00 570.00 80.00 90.00 430.00 400.00 80.00 230.00 450.00 2011/2012 48.00 480.00 670.00 N.A. 90.00 500.00 400.00 430.00 270.00 510.00 2012/2013 50.00 600.00 1000.00 90.00 N.A. 600.00 400.00 430.00 N.A. 600.00 2013/2014 56.00 680.00 1000.00 N.A. 100.00 700.00 250.00 490.00 270.00 750.00 2014/2015 60.64 680.00 1000.00 N.A. 100.00 700.00 400.00 400.00 N.A. 750
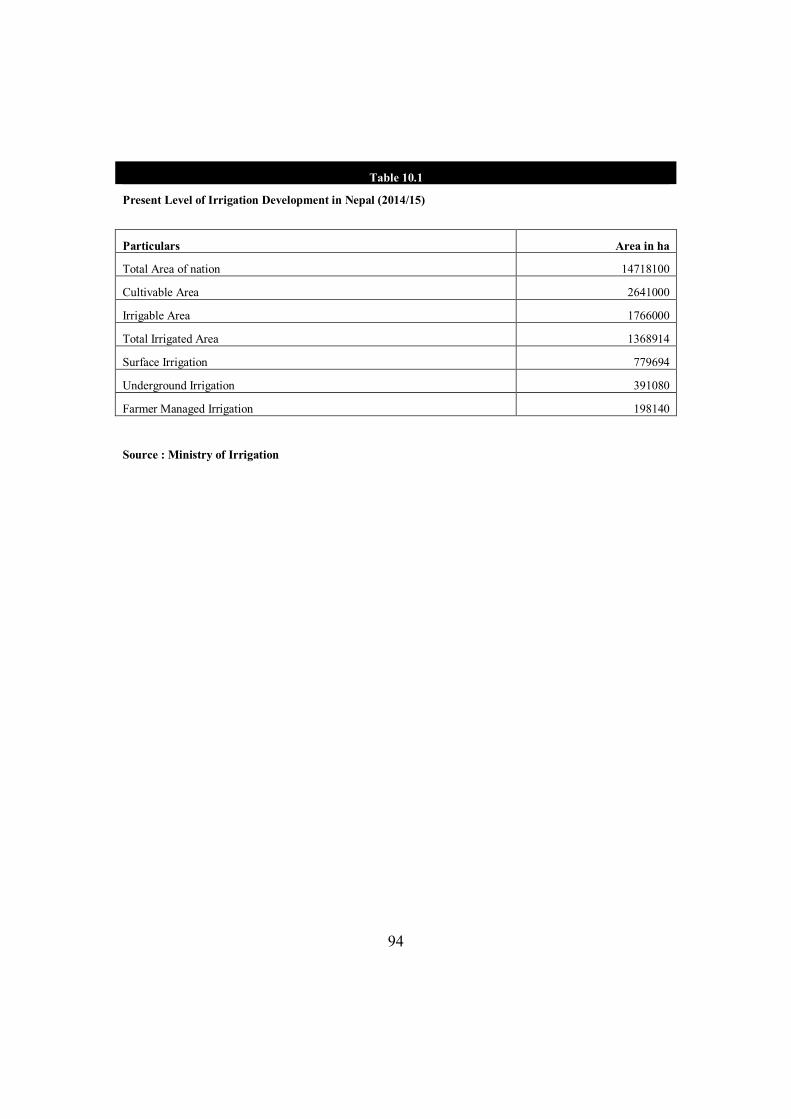
94
Table 10.1
Present Level of Irrigation Development in Nepal (2014/15)
Particulars Area in ha
Total Area of nation 14718100
Cultivable Area 2641000
Irrigable Area 1766000
Total Irrigated Area 1368914
Surface Irrigation 779694
Underground Irrigation 391080
Farmer Managed Irrigation 198140
Source : Ministry of Irrigation
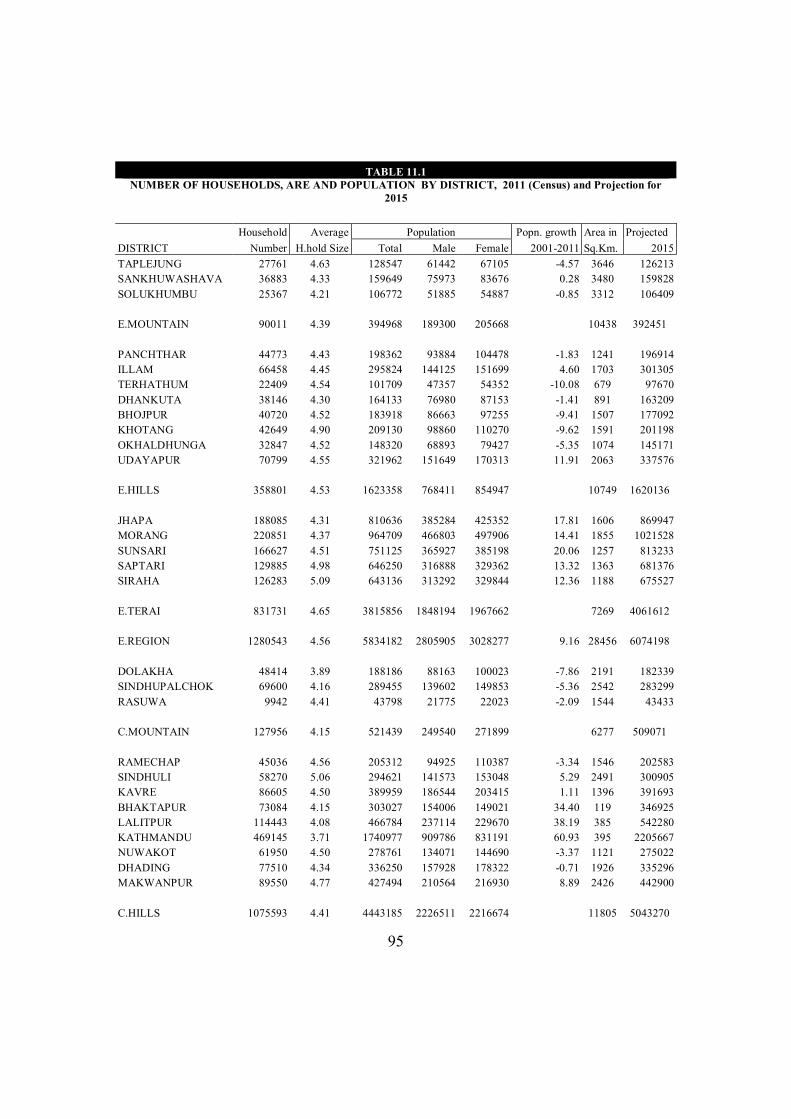
95
TABLE 11.1 NUMBER OF HOUSEHOLDS, ARE AND POPULATION BY DISTRICT, 2011 (Census) and Projection for
2015
Household Average Population Popn. growth Area in Projected DISTRICT Number H.hold Size Total Male Female 2001-2011 Sq.Km. 2015 TAPLEJUNG 27761 4.63 128547 61442 67105 -4.57 3646 126213 SANKHUWASHAVA 36883 4.33 159649 75973 83676 0.28 3480 159828 SOLUKHUMBU 25367 4.21 106772 51885 54887 -0.85 3312 106409
E.MOUNTAIN 90011 4.39 394968 189300 205668 10438 392451
PANCHTHAR 44773 4.43 198362 93884 104478 -1.83 1241 196914 ILLAM 66458 4.45 295824 144125 151699 4.60 1703 301305 TERHATHUM 22409 4.54 101709 47357 54352 -10.08 679 97670 DHANKUTA 38146 4.30 164133 76980 87153 -1.41 891 163209 BHOJPUR 40720 4.52 183918 86663 97255 -9.41 1507 177092 KHOTANG 42649 4.90 209130 98860 110270 -9.62 1591 201198 OKHALDHUNGA 32847 4.52 148320 68893 79427 -5.35 1074 145171 UDAYAPUR 70799 4.55 321962 151649 170313 11.91 2063 337576
E.HILLS 358801 4.53 1623358 768411 854947 10749 1620136
JHAPA 188085 4.31 810636 385284 425352 17.81 1606 869947 MORANG 220851 4.37 964709 466803 497906 14.41 1855 1021528 SUNSARI 166627 4.51 751125 365927 385198 20.06 1257 813233 SAPTARI 129885 4.98 646250 316888 329362 13.32 1363 681376 SIRAHA 126283 5.09 643136 313292 329844 12.36 1188 675527
E.TERAI 831731 4.65 3815856 1848194 1967662 7269 4061612
E.REGION 1280543 4.56 5834182 2805905 3028277 9.16 28456 6074198
DOLAKHA 48414 3.89 188186 88163 100023 -7.86 2191 182339 SINDHUPALCHOK 69600 4.16 289455 139602 149853 -5.36 2542 283299 RASUWA 9942 4.41 43798 21775 22023 -2.09 1544 43433
C.MOUNTAIN 127956 4.15 521439 249540 271899 6277 509071
RAMECHAP 45036 4.56 205312 94925 110387 -3.34 1546 202583 SINDHULI 58270 5.06 294621 141573 153048 5.29 2491 300905 KAVRE 86605 4.50 389959 186544 203415 1.11 1396 391693 BHAKTAPUR 73084 4.15 303027 154006 149021 34.40 119 346925 LALITPUR 114443 4.08 466784 237114 229670 38.19 385 542280 KATHMANDU 469145 3.71 1740977 909786 831191 60.93 395 2205667 NUWAKOT 61950 4.50 278761 134071 144690 -3.37 1121 275022 DHADING 77510 4.34 336250 157928 178322 -0.71 1926 335296 MAKWANPUR 89550 4.77 427494 210564 216930 8.89 2426 442900
C.HILLS 1075593 4.41 4443185 2226511 2216674 11805 5043270
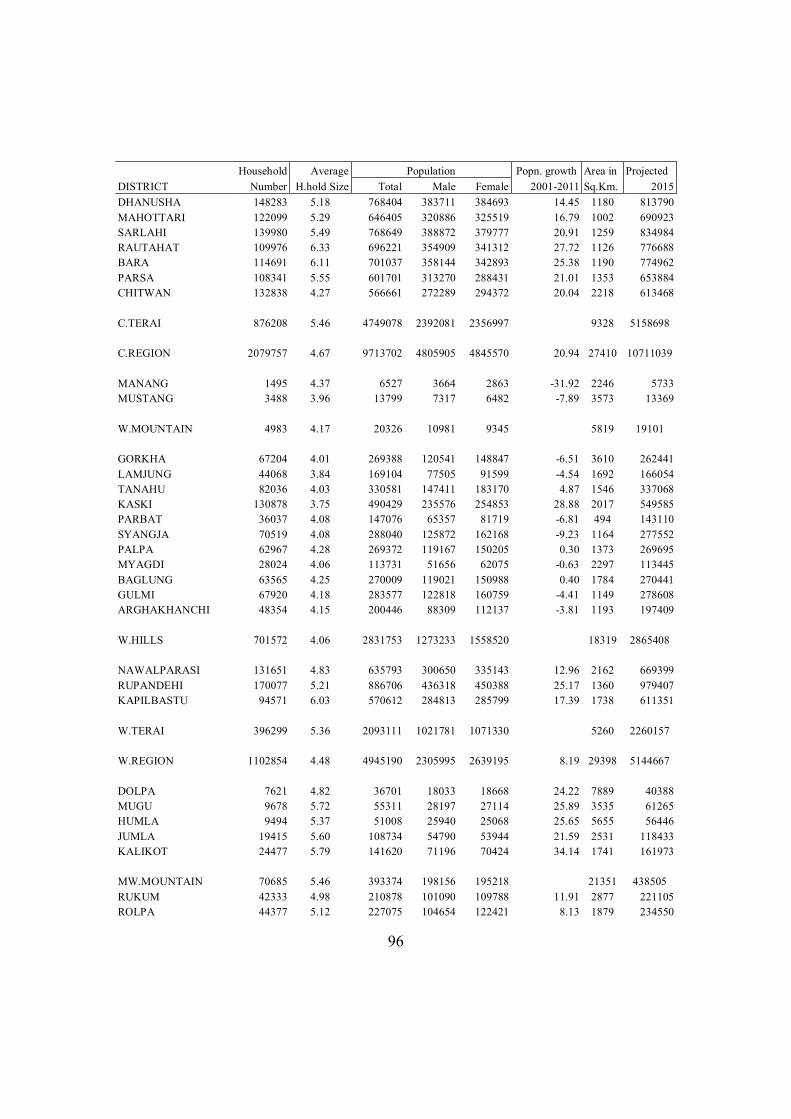
96
Household Average Population Popn. growth Area in Projected DISTRICT Number H.hold Size Total Male Female 2001-2011 Sq.Km. 2015 DHANUSHA 148283 5.18 768404 383711 384693 14.45 1180 813790 MAHOTTARI 122099 5.29 646405 320886 325519 16.79 1002 690923 SARLAHI 139980 5.49 768649 388872 379777 20.91 1259 834984 RAUTAHAT 109976 6.33 696221 354909 341312 27.72 1126 776688 BARA 114691 6.11 701037 358144 342893 25.38 1190 774962 PARSA 108341 5.55 601701 313270 288431 21.01 1353 653884 CHITWAN 132838 4.27 566661 272289 294372 20.04 2218 613468
C.TERAI 876208 5.46 4749078 2392081 2356997 9328 5158698
C.REGION 2079757 4.67 9713702 4805905 4845570 20.94 27410 10711039
MANANG 1495 4.37 6527 3664 2863 -31.92 2246 5733 MUSTANG 3488 3.96 13799 7317 6482 -7.89 3573 13369
W.MOUNTAIN 4983 4.17 20326 10981 9345 5819 19101
GORKHA 67204 4.01 269388 120541 148847 -6.51 3610 262441 LAMJUNG 44068 3.84 169104 77505 91599 -4.54 1692 166054 TANAHU 82036 4.03 330581 147411 183170 4.87 1546 337068 KASKI 130878 3.75 490429 235576 254853 28.88 2017 549585 PARBAT 36037 4.08 147076 65357 81719 -6.81 494 143110 SYANGJA 70519 4.08 288040 125872 162168 -9.23 1164 277552 PALPA 62967 4.28 269372 119167 150205 0.30 1373 269695 MYAGDI 28024 4.06 113731 51656 62075 -0.63 2297 113445 BAGLUNG 63565 4.25 270009 119021 150988 0.40 1784 270441 GULMI 67920 4.18 283577 122818 160759 -4.41 1149 278608 ARGHAKHANCHI 48354 4.15 200446 88309 112137 -3.81 1193 197409
W.HILLS 701572 4.06 2831753 1273233 1558520 18319 2865408
NAWALPARASI 131651 4.83 635793 300650 335143 12.96 2162 669399 RUPANDEHI 170077 5.21 886706 436318 450388 25.17 1360 979407 KAPILBASTU 94571 6.03 570612 284813 285799 17.39 1738 611351
W.TERAI 396299 5.36 2093111 1021781 1071330 5260 2260157
W.REGION 1102854 4.48 4945190 2305995 2639195 8.19 29398 5144667
DOLPA 7621 4.82 36701 18033 18668 24.22 7889 40388 MUGU 9678 5.72 55311 28197 27114 25.89 3535 61265 HUMLA 9494 5.37 51008 25940 25068 25.65 5655 56446 JUMLA 19415 5.60 108734 54790 53944 21.59 2531 118433 KALIKOT 24477 5.79 141620 71196 70424 34.14 1741 161973
MW.MOUNTAIN 70685 5.46 393374 198156 195218 21351 438505 RUKUM 42333 4.98 210878 101090 109788 11.91 2877 221105 ROLPA 44377 5.12 227075 104654 122421 8.13 1879 234550
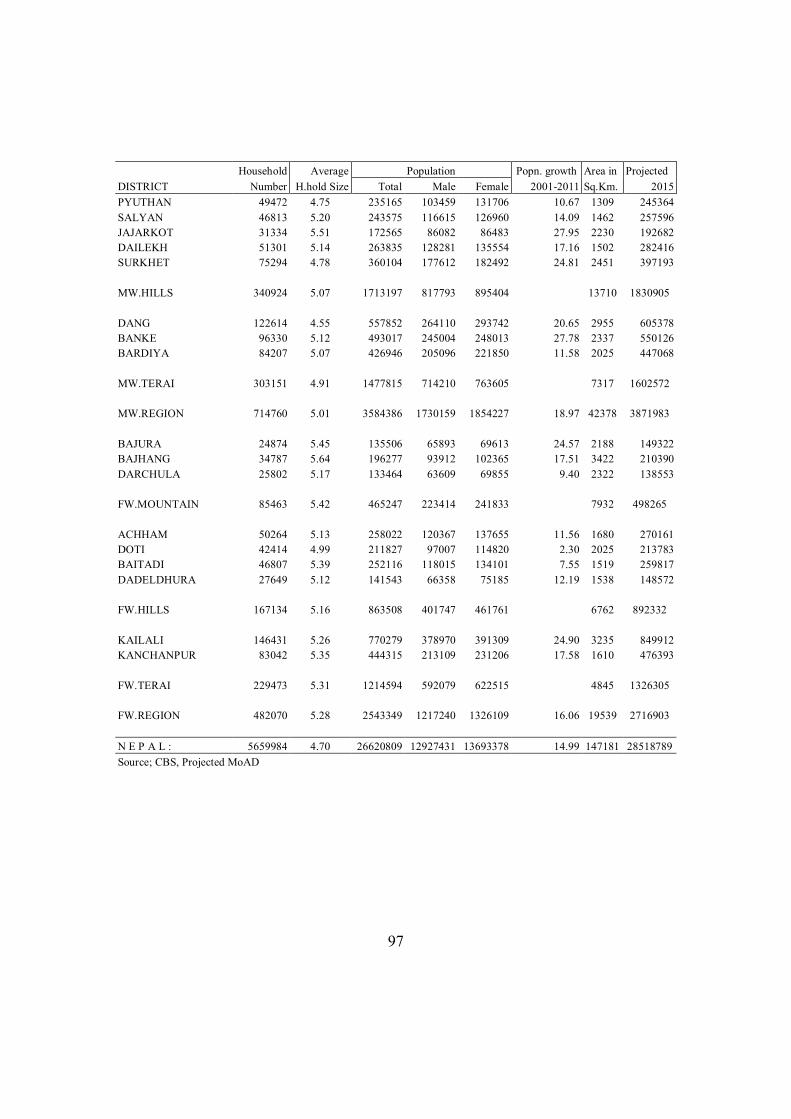
97
Household Average Population Popn. growth Area in Projected DISTRICT Number H.hold Size Total Male Female 2001-2011 Sq.Km. 2015 PYUTHAN 49472 4.75 235165 103459 131706 10.67 1309 245364 SALYAN 46813 5.20 243575 116615 126960 14.09 1462 257596 JAJARKOT 31334 5.51 172565 86082 86483 27.95 2230 192682 DAILEKH 51301 5.14 263835 128281 135554 17.16 1502 282416 SURKHET 75294 4.78 360104 177612 182492 24.81 2451 397193
MW.HILLS 340924 5.07 1713197 817793 895404 13710 1830905
DANG 122614 4.55 557852 264110 293742 20.65 2955 605378 BANKE 96330 5.12 493017 245004 248013 27.78 2337 550126 BARDIYA 84207 5.07 426946 205096 221850 11.58 2025 447068
MW.TERAI 303151 4.91 1477815 714210 763605 7317 1602572
MW.REGION 714760 5.01 3584386 1730159 1854227 18.97 42378 3871983
BAJURA 24874 5.45 135506 65893 69613 24.57 2188 149322 BAJHANG 34787 5.64 196277 93912 102365 17.51 3422 210390 DARCHULA 25802 5.17 133464 63609 69855 9.40 2322 138553
FW.MOUNTAIN 85463 5.42 465247 223414 241833 7932 498265
ACHHAM 50264 5.13 258022 120367 137655 11.56 1680 270161 DOTI 42414 4.99 211827 97007 114820 2.30 2025 213783 BAITADI 46807 5.39 252116 118015 134101 7.55 1519 259817 DADELDHURA 27649 5.12 141543 66358 75185 12.19 1538 148572
FW.HILLS 167134 5.16 863508 401747 461761 6762 892332
KAILALI 146431 5.26 770279 378970 391309 24.90 3235 849912 KANCHANPUR 83042 5.35 444315 213109 231206 17.58 1610 476393
FW.TERAI 229473 5.31 1214594 592079 622515 4845 1326305
FW.REGION 482070 5.28 2543349 1217240 1326109 16.06 19539 2716903
N E P A L : 5659984 4.70 26620809 12927431 13693378 14.99 147181 28518789 Source; CBS, Projected MoAD
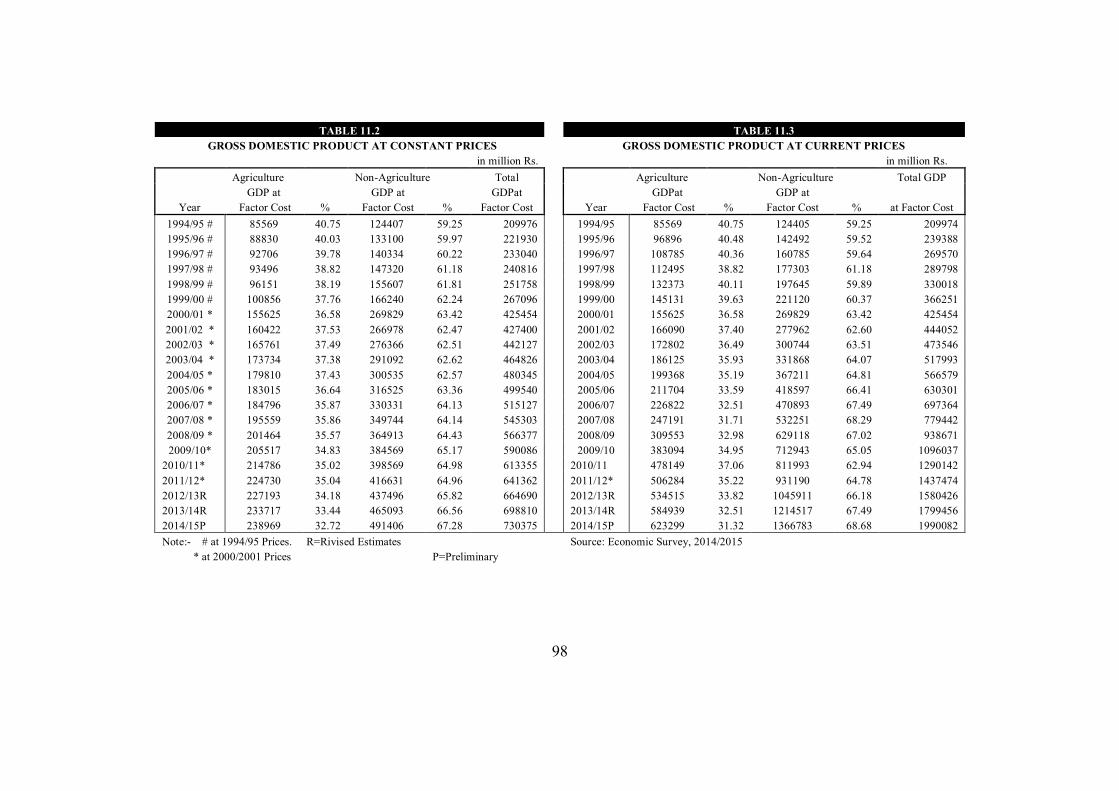
98
TABLE 11.2 TABLE 11.3 GROSS DOMESTIC PRODUCT AT CONSTANT PRICES GROSS DOMESTIC PRODUCT AT CURRENT PRICES
in million Rs. in million Rs. Agriculture Non-Agriculture Total Agriculture Non-Agriculture Total GDP GDP at GDP at GDPat GDPat GDP at
Year Factor Cost % Factor Cost % Factor Cost Year Factor Cost % Factor Cost % at Factor Cost 1994/95 # 85569 40.75 124407 59.25 209976 1994/95 85569 40.75 124405 59.25 209974 1995/96 # 88830 40.03 133100 59.97 221930 1995/96 96896 40.48 142492 59.52 239388 1996/97 # 92706 39.78 140334 60.22 233040 1996/97 108785 40.36 160785 59.64 269570 1997/98 # 93496 38.82 147320 61.18 240816 1997/98 112495 38.82 177303 61.18 289798 1998/99 # 96151 38.19 155607 61.81 251758 1998/99 132373 40.11 197645 59.89 330018 1999/00 # 100856 37.76 166240 62.24 267096 1999/00 145131 39.63 221120 60.37 366251 2000/01 * 155625 36.58 269829 63.42 425454 2000/01 155625 36.58 269829 63.42 425454 2001/02 * 160422 37.53 266978 62.47 427400 2001/02 166090 37.40 277962 62.60 444052 2002/03 * 165761 37.49 276366 62.51 442127 2002/03 172802 36.49 300744 63.51 473546 2003/04 * 173734 37.38 291092 62.62 464826 2003/04 186125 35.93 331868 64.07 517993 2004/05 * 179810 37.43 300535 62.57 480345 2004/05 199368 35.19 367211 64.81 566579 2005/06 * 183015 36.64 316525 63.36 499540 2005/06 211704 33.59 418597 66.41 630301 2006/07 * 184796 35.87 330331 64.13 515127 2006/07 226822 32.51 470893 67.49 697364 2007/08 * 195559 35.86 349744 64.14 545303 2007/08 247191 31.71 532251 68.29 779442 2008/09 * 201464 35.57 364913 64.43 566377 2008/09 309553 32.98 629118 67.02 938671 2009/10* 205517 34.83 384569 65.17 590086 2009/10 383094 34.95 712943 65.05 1096037
2010/11* 214786 35.02 398569 64.98 613355 2010/11 478149 37.06 811993 62.94 1290142 2011/12* 224730 35.04 416631 64.96 641362 2011/12* 506284 35.22 931190 64.78 1437474 2012/13R 227193 34.18 437496 65.82 664690 2012/13R 534515 33.82 1045911 66.18 1580426 2013/14R 233717 33.44 465093 66.56 698810 2013/14R 584939 32.51 1214517 67.49 1799456 2014/15P 238969 32.72 491406 67.28 730375 2014/15P 623299 31.32 1366783 68.68 1990082 Note:- # at 1994/95 Prices. R=Rivised Estimates Source: Economic Survey, 2014/2015 * at 2000/2001 Prices P=Preliminary
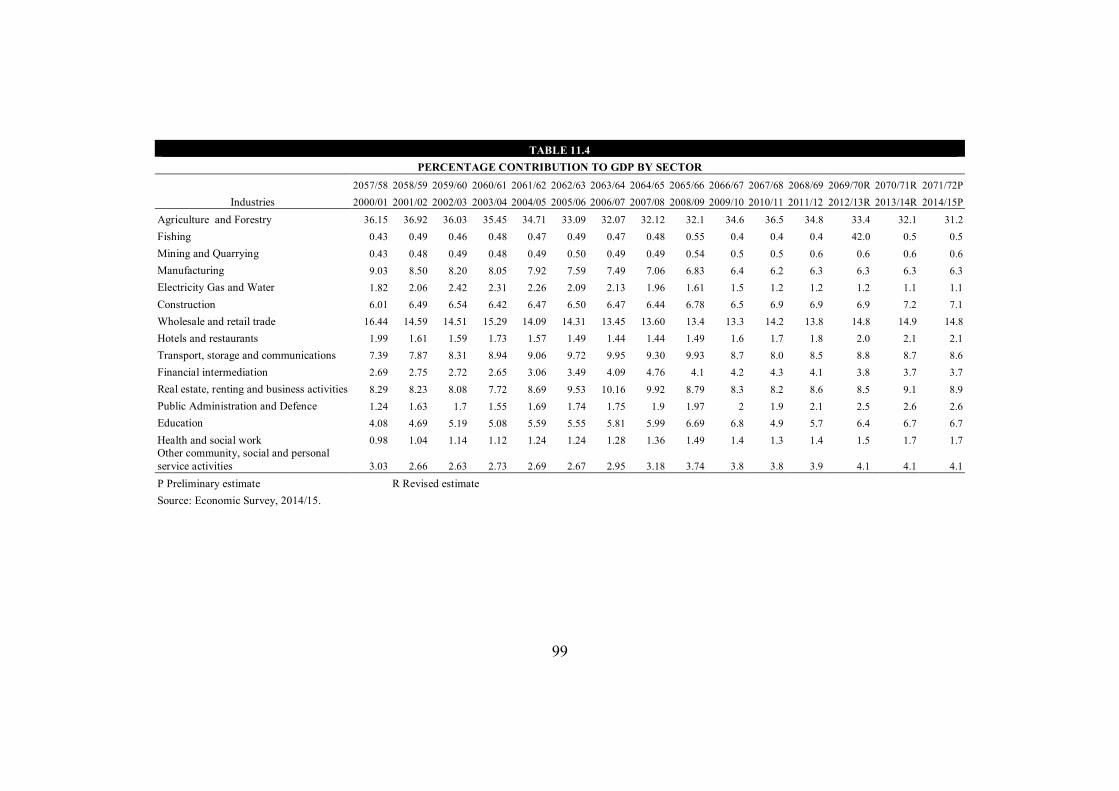
99
TABLE 11.4
PERCENTAGE CONTRIBUTION TO GDP BY SECTOR 2057/58 2058/59 2059/60 2060/61 2061/62 2062/63 2063/64 2064/65 2065/66 2066/67 2067/68 2068/69 2069/70R 2070/71R 2071/72P
Industries 2000/01 2001/02 2002/03 2003/04 2004/05 2005/06 2006/07 2007/08 2008/09 2009/10 2010/11 2011/12 2012/13R 2013/14R 2014/15P
Agriculture and Forestry 36.15 36.92 36.03 35.45 34.71 33.09 32.07 32.12 32.1 34.6 36.5 34.8 33.4 32.1 31.2 Fishing 0.43 0.49 0.46 0.48 0.47 0.49 0.47 0.48 0.55 0.4 0.4 0.4 42.0 0.5 0.5 Mining and Quarrying 0.43 0.48 0.49 0.48 0.49 0.50 0.49 0.49 0.54 0.5 0.5 0.6 0.6 0.6 0.6 Manufacturing 9.03 8.50 8.20 8.05 7.92 7.59 7.49 7.06 6.83 6.4 6.2 6.3 6.3 6.3 6.3 Electricity Gas and Water 1.82 2.06 2.42 2.31 2.26 2.09 2.13 1.96 1.61 1.5 1.2 1.2 1.2 1.1 1.1 Construction 6.01 6.49 6.54 6.42 6.47 6.50 6.47 6.44 6.78 6.5 6.9 6.9 6.9 7.2 7.1 Wholesale and retail trade 16.44 14.59 14.51 15.29 14.09 14.31 13.45 13.60 13.4 13.3 14.2 13.8 14.8 14.9 14.8 Hotels and restaurants 1.99 1.61 1.59 1.73 1.57 1.49 1.44 1.44 1.49 1.6 1.7 1.8 2.0 2.1 2.1 Transport, storage and communications 7.39 7.87 8.31 8.94 9.06 9.72 9.95 9.30 9.93 8.7 8.0 8.5 8.8 8.7 8.6 Financial intermediation 2.69 2.75 2.72 2.65 3.06 3.49 4.09 4.76 4.1 4.2 4.3 4.1 3.8 3.7 3.7 Real estate, renting and business activities 8.29 8.23 8.08 7.72 8.69 9.53 10.16 9.92 8.79 8.3 8.2 8.6 8.5 9.1 8.9 Public Administration and Defence 1.24 1.63 1.7 1.55 1.69 1.74 1.75 1.9 1.97 2 1.9 2.1 2.5 2.6 2.6 Education 4.08 4.69 5.19 5.08 5.59 5.55 5.81 5.99 6.69 6.8 4.9 5.7 6.4 6.7 6.7 Health and social work 0.98 1.04 1.14 1.12 1.24 1.24 1.28 1.36 1.49 1.4 1.3 1.4 1.5 1.7 1.7 Other community, social and personal service activities 3.03 2.66 2.63 2.73 2.69 2.67 2.95 3.18 3.74 3.8 3.8 3.9 4.1 4.1 4.1
P Preliminary estimate R Revised estimate Source: Economic Survey, 2014/15.
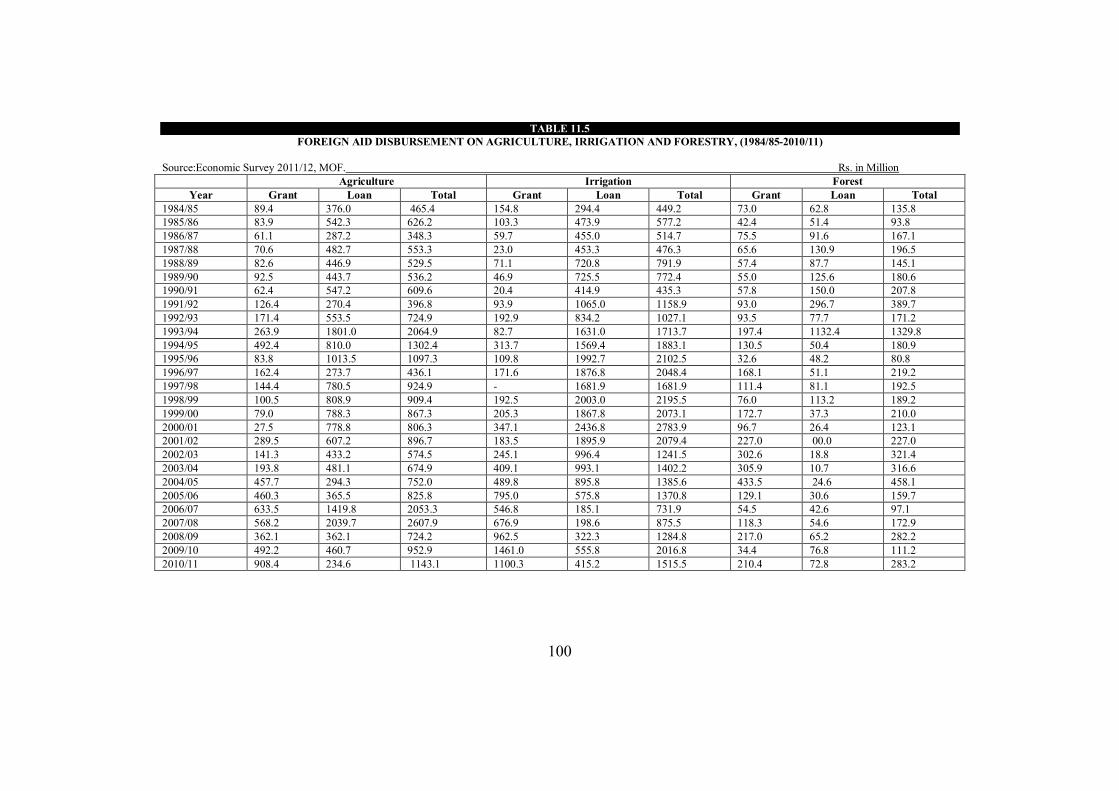
100
TABLE 11.5 FOREIGN AID DISBURSEMENT ON AGRICULTURE, IRRIGATION AND FORESTRY, (1984/85-2010/11)
Source:Economic Survey 2011/12, MOF. Rs. in Million Agriculture Irrigation Forest
Year Grant Loan Total Grant Loan Total Grant Loan Total 1984/85 89.4 376.0 465.4 154.8 294.4 449.2 73.0 62.8 135.8 1985/86 83.9 542.3 626.2 103.3 473.9 577.2 42.4 51.4 93.8 1986/87 61.1 287.2 348.3 59.7 455.0 514.7 75.5 91.6 167.1 1987/88 70.6 482.7 553.3 23.0 453.3 476.3 65.6 130.9 196.5 1988/89 82.6 446.9 529.5 71.1 720.8 791.9 57.4 87.7 145.1 1989/90 92.5 443.7 536.2 46.9 725.5 772.4 55.0 125.6 180.6 1990/91 62.4 547.2 609.6 20.4 414.9 435.3 57.8 150.0 207.8 1991/92 126.4 270.4 396.8 93.9 1065.0 1158.9 93.0 296.7 389.7 1992/93 171.4 553.5 724.9 192.9 834.2 1027.1 93.5 77.7 171.2 1993/94 263.9 1801.0 2064.9 82.7 1631.0 1713.7 197.4 1132.4 1329.8 1994/95 492.4 810.0 1302.4 313.7 1569.4 1883.1 130.5 50.4 180.9 1995/96 83.8 1013.5 1097.3 109.8 1992.7 2102.5 32.6 48.2 80.8 1996/97 162.4 273.7 436.1 171.6 1876.8 2048.4 168.1 51.1 219.2 1997/98 144.4 780.5 924.9 - 1681.9 1681.9 111.4 81.1 192.5 1998/99 100.5 808.9 909.4 192.5 2003.0 2195.5 76.0 113.2 189.2 1999/00 79.0 788.3 867.3 205.3 1867.8 2073.1 172.7 37.3 210.0 2000/01 27.5 778.8 806.3 347.1 2436.8 2783.9 96.7 26.4 123.1 2001/02 289.5 607.2 896.7 183.5 1895.9 2079.4 227.0 00.0 227.0 2002/03 141.3 433.2 574.5 245.1 996.4 1241.5 302.6 18.8 321.4 2003/04 193.8 481.1 674.9 409.1 993.1 1402.2 305.9 10.7 316.6 2004/05 457.7 294.3 752.0 489.8 895.8 1385.6 433.5 24.6 458.1 2005/06 460.3 365.5 825.8 795.0 575.8 1370.8 129.1 30.6 159.7 2006/07 633.5 1419.8 2053.3 546.8 185.1 731.9 54.5 42.6 97.1 2007/08 568.2 2039.7 2607.9 676.9 198.6 875.5 118.3 54.6 172.9 2008/09 362.1 362.1 724.2 962.5 322.3 1284.8 217.0 65.2 282.2 2009/10 492.2 460.7 952.9 1461.0 555.8 2016.8 34.4 76.8 111.2 2010/11 908.4 234.6 1143.1 1100.3 415.2 1515.5 210.4 72.8 283.2
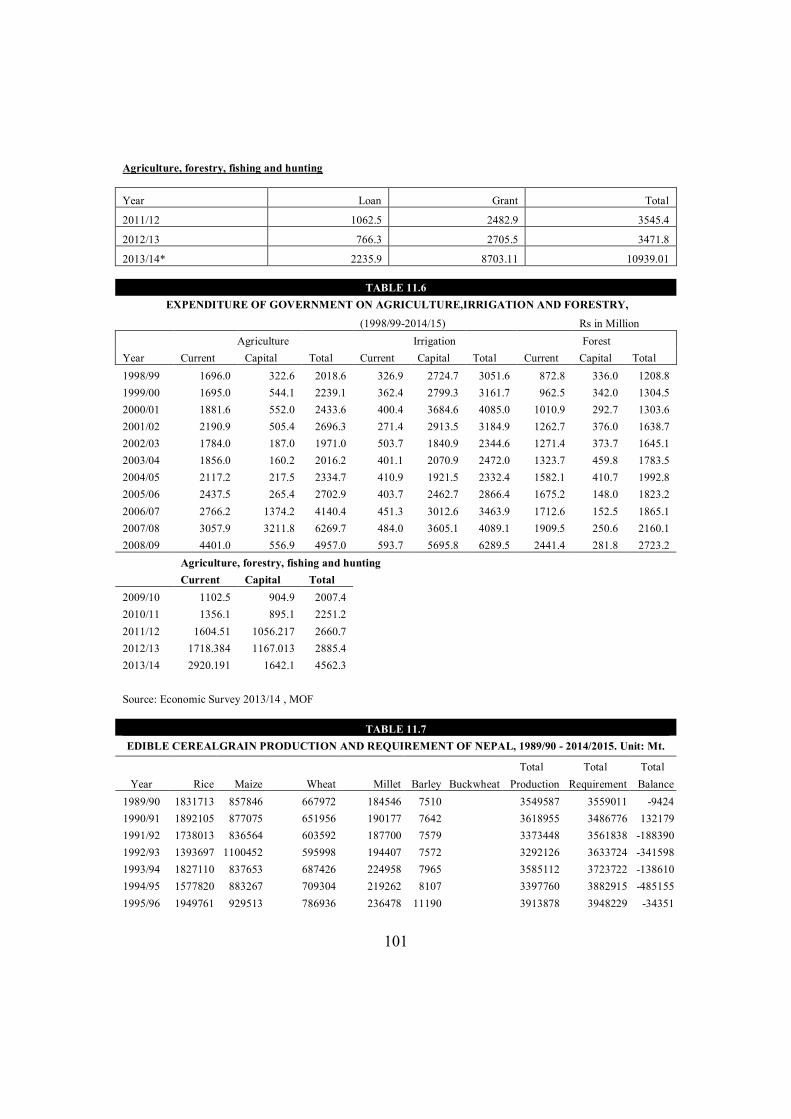
101
Agriculture, forestry, fishing and hunting
Year Loan Grant Total
2011/12 1062.5 2482.9 3545.4
2012/13 766.3 2705.5 3471.8
2013/14* 2235.9 8703.11 10939.01
TABLE 11.6 EXPENDITURE OF GOVERNMENT ON AGRICULTURE,IRRIGATION AND FORESTRY,
(1998/99-2014/15) Rs in Million Agriculture Irrigation Forest Year Current Capital Total Current Capital Total Current Capital Total 1998/99 1696.0 322.6 2018.6 326.9 2724.7 3051.6 872.8 336.0 1208.8 1999/00 1695.0 544.1 2239.1 362.4 2799.3 3161.7 962.5 342.0 1304.5 2000/01 1881.6 552.0 2433.6 400.4 3684.6 4085.0 1010.9 292.7 1303.6 2001/02 2190.9 505.4 2696.3 271.4 2913.5 3184.9 1262.7 376.0 1638.7 2002/03 1784.0 187.0 1971.0 503.7 1840.9 2344.6 1271.4 373.7 1645.1 2003/04 1856.0 160.2 2016.2 401.1 2070.9 2472.0 1323.7 459.8 1783.5 2004/05 2117.2 217.5 2334.7 410.9 1921.5 2332.4 1582.1 410.7 1992.8 2005/06 2437.5 265.4 2702.9 403.7 2462.7 2866.4 1675.2 148.0 1823.2 2006/07 2766.2 1374.2 4140.4 451.3 3012.6 3463.9 1712.6 152.5 1865.1 2007/08 3057.9 3211.8 6269.7 484.0 3605.1 4089.1 1909.5 250.6 2160.1 2008/09 4401.0 556.9 4957.0 593.7 5695.8 6289.5 2441.4 281.8 2723.2
Agriculture, forestry, fishing and hunting Current Capital Total 2009/10 1102.5 904.9 2007.4 2010/11 1356.1 895.1 2251.2 2011/12 1604.51 1056.217 2660.7 2012/13 1718.384 1167.013 2885.4 2013/14 2920.191 1642.1 4562.3
Source: Economic Survey 2013/14 , MOF
TABLE 11.7 EDIBLE CEREALGRAIN PRODUCTION AND REQUIREMENT OF NEPAL, 1989/90 - 2014/2015. Unit: Mt.
Total Total Total Year Rice Maize Wheat Millet Barley Buckwheat Production Requirement Balance
1989/90 1831713 857846 667972 184546 7510 3549587 3559011 -9424 1990/91 1892105 877075 651956 190177 7642 3618955 3486776 132179 1991/92 1738013 836564 603592 187700 7579 3373448 3561838 -188390 1992/93 1393697 1100452 595998 194407 7572 3292126 3633724 -341598 1993/94 1827110 837653 687426 224958 7965 3585112 3723722 -138610 1994/95 1577820 883267 709304 219262 8107 3397760 3882915 -485155 1995/96 1949761 929513 786936 236478 11190 3913878 3948229 -34351
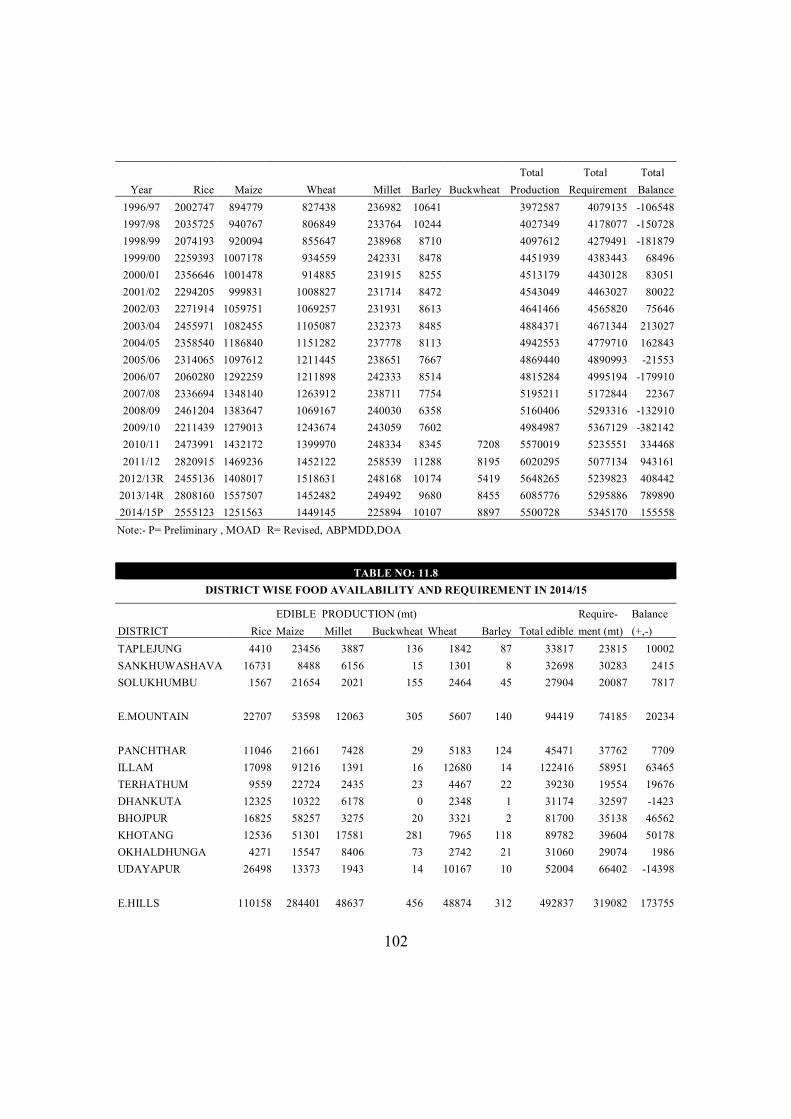
102
Total Total Total Year Rice Maize Wheat Millet Barley Buckwheat Production Requirement Balance
1996/97 2002747 894779 827438 236982 10641 3972587 4079135 -106548 1997/98 2035725 940767 806849 233764 10244 4027349 4178077 -150728 1998/99 2074193 920094 855647 238968 8710 4097612 4279491 -181879 1999/00 2259393 1007178 934559 242331 8478 4451939 4383443 68496 2000/01 2356646 1001478 914885 231915 8255 4513179 4430128 83051 2001/02 2294205 999831 1008827 231714 8472 4543049 4463027 80022 2002/03 2271914 1059751 1069257 231931 8613 4641466 4565820 75646 2003/04 2455971 1082455 1105087 232373 8485 4884371 4671344 213027 2004/05 2358540 1186840 1151282 237778 8113 4942553 4779710 162843 2005/06 2314065 1097612 1211445 238651 7667 4869440 4890993 -21553 2006/07 2060280 1292259 1211898 242333 8514 4815284 4995194 -179910 2007/08 2336694 1348140 1263912 238711 7754 5195211 5172844 22367 2008/09 2461204 1383647 1069167 240030 6358 5160406 5293316 -132910 2009/10 2211439 1279013 1243674 243059 7602 4984987 5367129 -382142 2010/11 2473991 1432172 1399970 248334 8345 7208 5570019 5235551 334468 2011/12 2820915 1469236 1452122 258539 11288 8195 6020295 5077134 943161
2012/13R 2455136 1408017 1518631 248168 10174 5419 5648265 5239823 408442 2013/14R 2808160 1557507 1452482 249492 9680 8455 6085776 5295886 789890 2014/15P 2555123 1251563 1449145 225894 10107 8897 5500728 5345170 155558 Note:- P= Preliminary , MOAD R= Revised, ABPMDD,DOA
TABLE NO: 11.8 DISTRICT WISE FOOD AVAILABILITY AND REQUIREMENT IN 2014/15
EDIBLE PRODUCTION (mt) Require- Balance DISTRICT Rice Maize Millet Buckwheat Wheat Barley Total edible ment (mt) (+,-) TAPLEJUNG 4410 23456 3887 136 1842 87 33817 23815 10002 SANKHUWASHAVA 16731 8488 6156 15 1301 8 32698 30283 2415 SOLUKHUMBU 1567 21654 2021 155 2464 45 27904 20087 7817 E.MOUNTAIN 22707 53598 12063 305 5607 140 94419 74185 20234 PANCHTHAR 11046 21661 7428 29 5183 124 45471 37762 7709 ILLAM 17098 91216 1391 16 12680 14 122416 58951 63465 TERHATHUM 9559 22724 2435 23 4467 22 39230 19554 19676 DHANKUTA 12325 10322 6178 0 2348 1 31174 32597 -1423 BHOJPUR 16825 58257 3275 20 3321 2 81700 35138 46562 KHOTANG 12536 51301 17581 281 7965 118 89782 39604 50178 OKHALDHUNGA 4271 15547 8406 73 2742 21 31060 29074 1986 UDAYAPUR 26498 13373 1943 14 10167 10 52004 66402 -14398 E.HILLS 110158 284401 48637 456 48874 312 492837 319082 173755
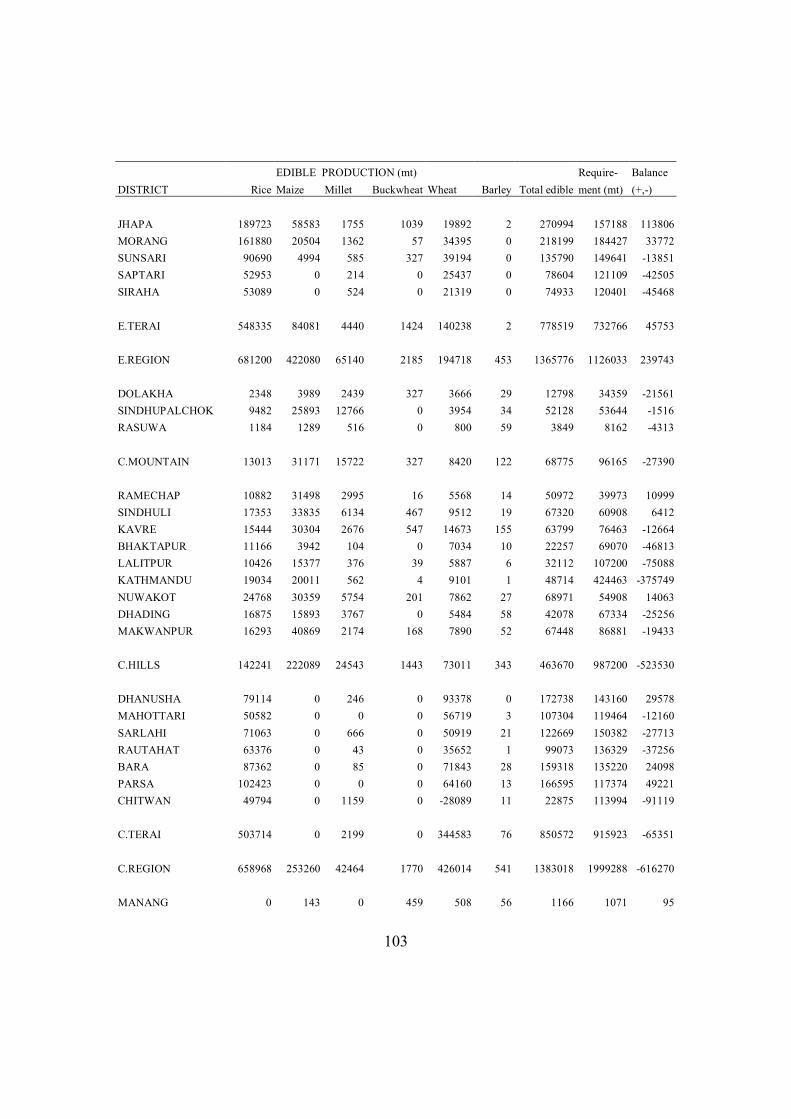
103
EDIBLE PRODUCTION (mt) Require- Balance DISTRICT Rice Maize Millet Buckwheat Wheat Barley Total edible ment (mt) (+,-) JHAPA 189723 58583 1755 1039 19892 2 270994 157188 113806 MORANG 161880 20504 1362 57 34395 0 218199 184427 33772 SUNSARI 90690 4994 585 327 39194 0 135790 149641 -13851 SAPTARI 52953 0 214 0 25437 0 78604 121109 -42505 SIRAHA 53089 0 524 0 21319 0 74933 120401 -45468 E.TERAI 548335 84081 4440 1424 140238 2 778519 732766 45753 E.REGION 681200 422080 65140 2185 194718 453 1365776 1126033 239743 DOLAKHA 2348 3989 2439 327 3666 29 12798 34359 -21561 SINDHUPALCHOK 9482 25893 12766 0 3954 34 52128 53644 -1516 RASUWA 1184 1289 516 0 800 59 3849 8162 -4313 C.MOUNTAIN 13013 31171 15722 327 8420 122 68775 96165 -27390 RAMECHAP 10882 31498 2995 16 5568 14 50972 39973 10999 SINDHULI 17353 33835 6134 467 9512 19 67320 60908 6412 KAVRE 15444 30304 2676 547 14673 155 63799 76463 -12664 BHAKTAPUR 11166 3942 104 0 7034 10 22257 69070 -46813 LALITPUR 10426 15377 376 39 5887 6 32112 107200 -75088 KATHMANDU 19034 20011 562 4 9101 1 48714 424463 -375749 NUWAKOT 24768 30359 5754 201 7862 27 68971 54908 14063 DHADING 16875 15893 3767 0 5484 58 42078 67334 -25256 MAKWANPUR 16293 40869 2174 168 7890 52 67448 86881 -19433 C.HILLS 142241 222089 24543 1443 73011 343 463670 987200 -523530
DHANUSHA 79114 0 246 0 93378 0 172738 143160 29578 MAHOTTARI 50582 0 0 0 56719 3 107304 119464 -12160 SARLAHI 71063 0 666 0 50919 21 122669 150382 -27713 RAUTAHAT 63376 0 43 0 35652 1 99073 136329 -37256 BARA 87362 0 85 0 71843 28 159318 135220 24098 PARSA 102423 0 0 0 64160 13 166595 117374 49221 CHITWAN 49794 0 1159 0 -28089 11 22875 113994 -91119 C.TERAI 503714 0 2199 0 344583 76 850572 915923 -65351 C.REGION 658968 253260 42464 1770 426014 541 1383018 1999288 -616270 MANANG 0 143 0 459 508 56 1166 1071 95
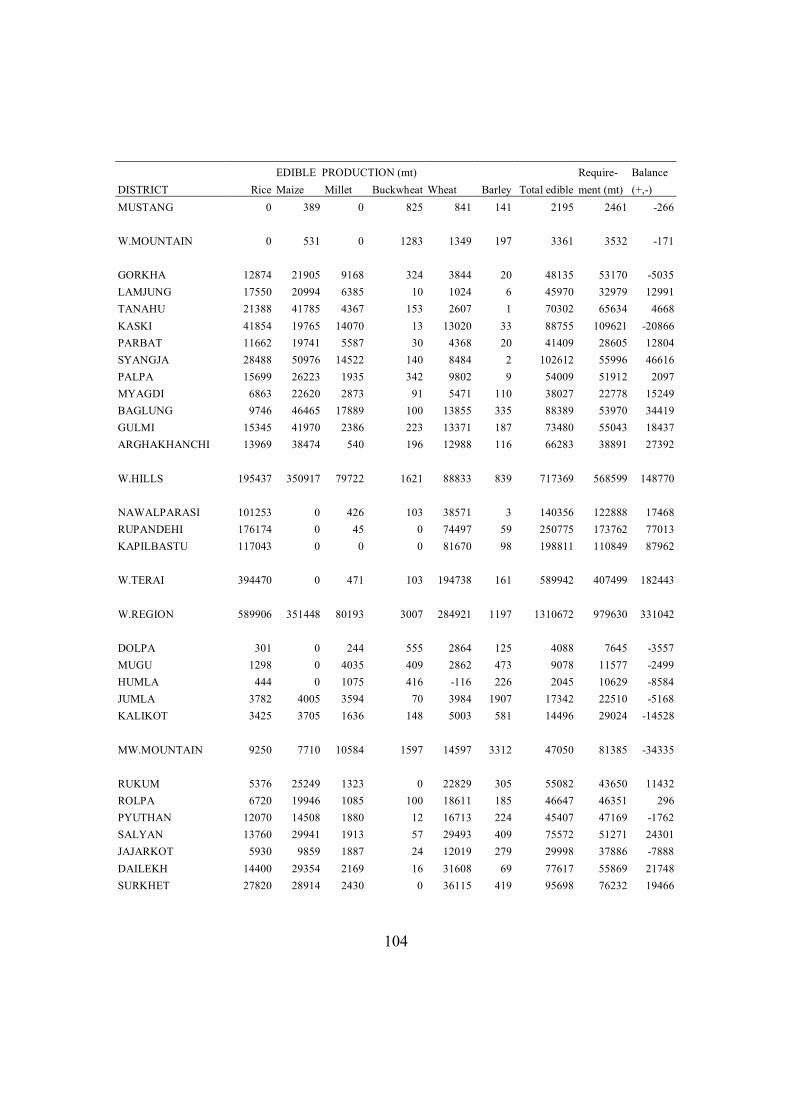
104
EDIBLE PRODUCTION (mt) Require- Balance DISTRICT Rice Maize Millet Buckwheat Wheat Barley Total edible ment (mt) (+,-) MUSTANG 0 389 0 825 841 141 2195 2461 -266 W.MOUNTAIN 0 531 0 1283 1349 197 3361 3532 -171 GORKHA 12874 21905 9168 324 3844 20 48135 53170 -5035 LAMJUNG 17550 20994 6385 10 1024 6 45970 32979 12991 TANAHU 21388 41785 4367 153 2607 1 70302 65634 4668 KASKI 41854 19765 14070 13 13020 33 88755 109621 -20866 PARBAT 11662 19741 5587 30 4368 20 41409 28605 12804 SYANGJA 28488 50976 14522 140 8484 2 102612 55996 46616 PALPA 15699 26223 1935 342 9802 9 54009 51912 2097 MYAGDI 6863 22620 2873 91 5471 110 38027 22778 15249 BAGLUNG 9746 46465 17889 100 13855 335 88389 53970 34419 GULMI 15345 41970 2386 223 13371 187 73480 55043 18437 ARGHAKHANCHI 13969 38474 540 196 12988 116 66283 38891 27392 W.HILLS 195437 350917 79722 1621 88833 839 717369 568599 148770 NAWALPARASI 101253 0 426 103 38571 3 140356 122888 17468 RUPANDEHI 176174 0 45 0 74497 59 250775 173762 77013 KAPILBASTU 117043 0 0 0 81670 98 198811 110849 87962 W.TERAI 394470 0 471 103 194738 161 589942 407499 182443 W.REGION 589906 351448 80193 3007 284921 1197 1310672 979630 331042 DOLPA 301 0 244 555 2864 125 4088 7645 -3557 MUGU 1298 0 4035 409 2862 473 9078 11577 -2499 HUMLA 444 0 1075 416 -116 226 2045 10629 -8584 JUMLA 3782 4005 3594 70 3984 1907 17342 22510 -5168 KALIKOT 3425 3705 1636 148 5003 581 14496 29024 -14528
MW.MOUNTAIN 9250 7710 10584 1597 14597 3312 47050 81385 -34335
RUKUM 5376 25249 1323 0 22829 305 55082 43650 11432 ROLPA 6720 19946 1085 100 18611 185 46647 46351 296 PYUTHAN 12070 14508 1880 12 16713 224 45407 47169 -1762 SALYAN 13760 29941 1913 57 29493 409 75572 51271 24301 JAJARKOT 5930 9859 1887 24 12019 279 29998 37886 -7888 DAILEKH 14400 29354 2169 16 31608 69 77617 55869 21748 SURKHET 27820 28914 2430 0 36115 419 95698 76232 19466
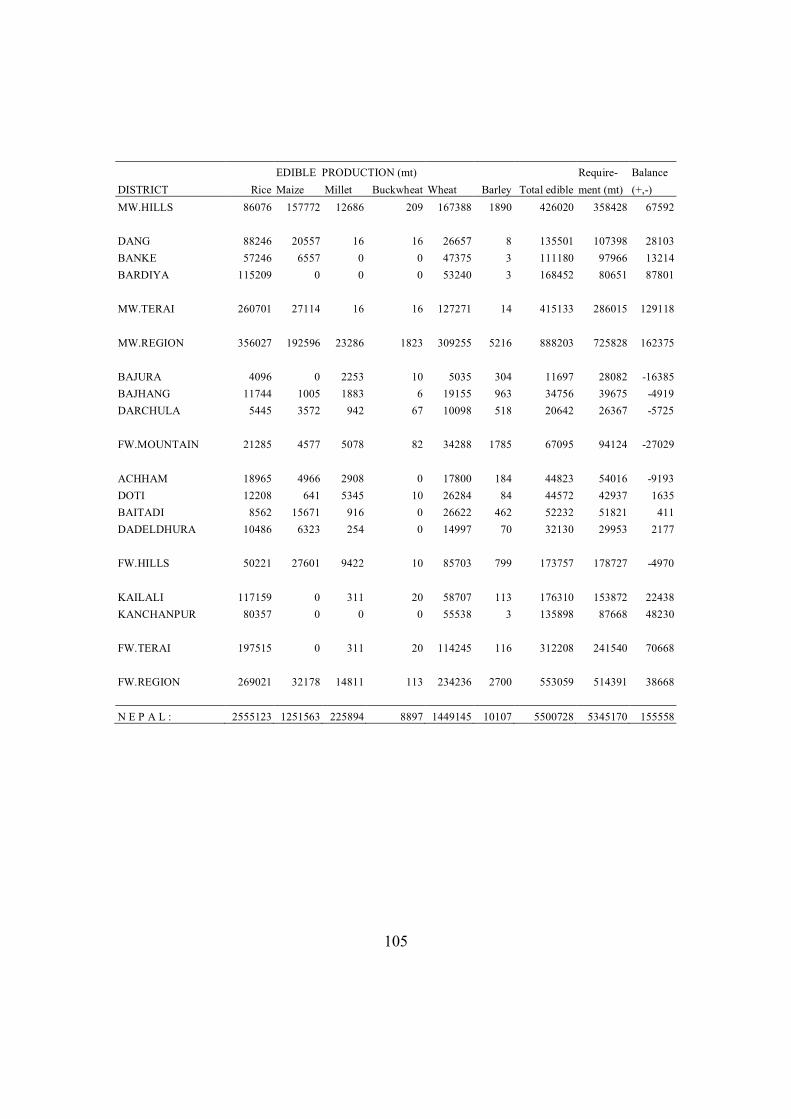
105
EDIBLE PRODUCTION (mt) Require- Balance DISTRICT Rice Maize Millet Buckwheat Wheat Barley Total edible ment (mt) (+,-) MW.HILLS 86076 157772 12686 209 167388 1890 426020 358428 67592 DANG 88246 20557 16 16 26657 8 135501 107398 28103 BANKE 57246 6557 0 0 47375 3 111180 97966 13214 BARDIYA 115209 0 0 0 53240 3 168452 80651 87801 MW.TERAI 260701 27114 16 16 127271 14 415133 286015 129118 MW.REGION 356027 192596 23286 1823 309255 5216 888203 725828 162375 BAJURA 4096 0 2253 10 5035 304 11697 28082 -16385 BAJHANG 11744 1005 1883 6 19155 963 34756 39675 -4919 DARCHULA 5445 3572 942 67 10098 518 20642 26367 -5725 FW.MOUNTAIN 21285 4577 5078 82 34288 1785 67095 94124 -27029 ACHHAM 18965 4966 2908 0 17800 184 44823 54016 -9193 DOTI 12208 641 5345 10 26284 84 44572 42937 1635 BAITADI 8562 15671 916 0 26622 462 52232 51821 411 DADELDHURA 10486 6323 254 0 14997 70 32130 29953 2177 FW.HILLS 50221 27601 9422 10 85703 799 173757 178727 -4970 KAILALI 117159 0 311 20 58707 113 176310 153872 22438 KANCHANPUR 80357 0 0 0 55538 3 135898 87668 48230 FW.TERAI 197515 0 311 20 114245 116 312208 241540 70668 FW.REGION 269021 32178 14811 113 234236 2700 553059 514391 38668 N E P A L : 2555123 1251563 225894 8897 1449145 10107 5500728 5345170 155558
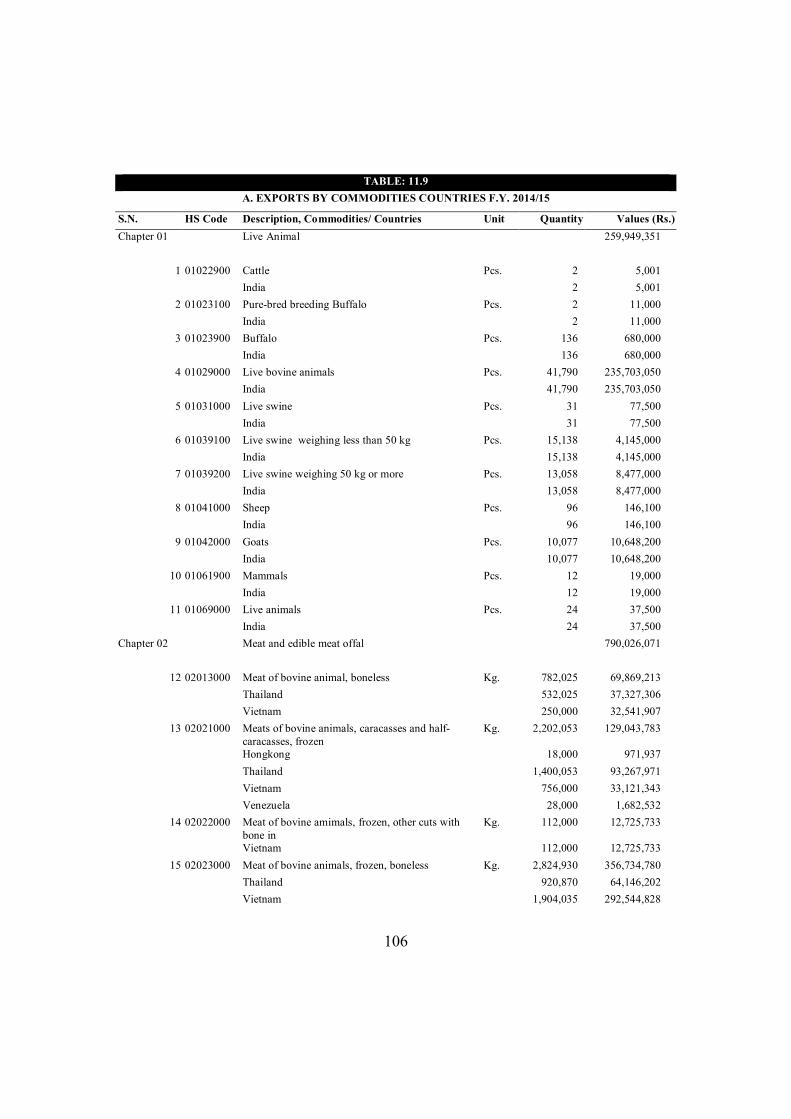
106
TABLE: 11.9
A. EXPORTS BY COMMODITIES COUNTRIES F.Y. 2014/15
S.N. HS Code Description, Commodities/ Countries Unit Quantity Values (Rs.) Chapter 01 Live Animal 259,949,351
1 01022900 Cattle Pcs. 2 5,001 India 2 5,001
2 01023100 Pure-bred breeding Buffalo Pcs. 2 11,000 India 2 11,000
3 01023900 Buffalo Pcs. 136 680,000 India 136 680,000
4 01029000 Live bovine animals Pcs. 41,790 235,703,050 India 41,790 235,703,050
5 01031000 Live swine Pcs. 31 77,500 India 31 77,500
6 01039100 Live swine weighing less than 50 kg Pcs. 15,138 4,145,000 India 15,138 4,145,000
7 01039200 Live swine weighing 50 kg or more Pcs. 13,058 8,477,000 India 13,058 8,477,000
8 01041000 Sheep Pcs. 96 146,100 India 96 146,100
9 01042000 Goats Pcs. 10,077 10,648,200 India 10,077 10,648,200
10 01061900 Mammals Pcs. 12 19,000 India 12 19,000
11 01069000 Live animals Pcs. 24 37,500 India 24 37,500
Chapter 02 Meat and edible meat offal 790,026,071
12 02013000 Meat of bovine animal, boneless Kg. 782,025 69,869,213 Thailand 532,025 37,327,306 Vietnam 250,000 32,541,907
13 02021000 Meats of bovine animals, caracasses and half-caracasses, frozen
Kg. 2,202,053 129,043,783
Hongkong 18,000 971,937 Thailand 1,400,053 93,267,971 Vietnam 756,000 33,121,343 Venezuela 28,000 1,682,532
14 02022000 Meat of bovine amimals, frozen, other cuts with bone in
Kg. 112,000 12,725,733
Vietnam 112,000 12,725,733 15 02023000 Meat of bovine animals, frozen, boneless Kg. 2,824,930 356,734,780
Thailand 920,870 64,146,202 Vietnam 1,904,035 292,544,828
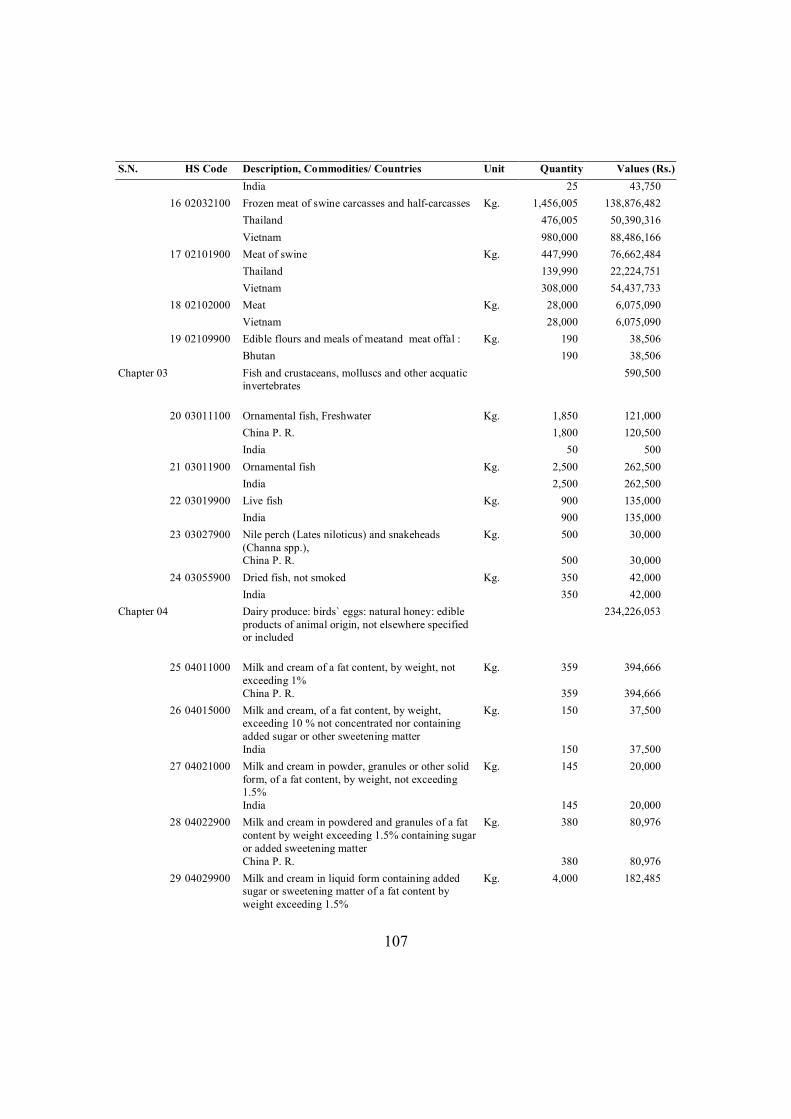
107
S.N. HS Code Description, Commodities/ Countries Unit Quantity Values (Rs.) India 25 43,750
16 02032100 Frozen meat of swine carcasses and half-carcasses Kg. 1,456,005 138,876,482 Thailand 476,005 50,390,316 Vietnam 980,000 88,486,166
17 02101900 Meat of swine Kg. 447,990 76,662,484 Thailand 139,990 22,224,751 Vietnam 308,000 54,437,733
18 02102000 Meat Kg. 28,000 6,075,090 Vietnam 28,000 6,075,090
19 02109900 Edible flours and meals of meatand meat offal : Kg. 190 38,506 Bhutan 190 38,506
Chapter 03 Fish and crustaceans, molluscs and other acquatic invertebrates
590,500
20 03011100 Ornamental fish, Freshwater Kg. 1,850 121,000 China P. R. 1,800 120,500 India 50 500
21 03011900 Ornamental fish Kg. 2,500 262,500 India 2,500 262,500
22 03019900 Live fish Kg. 900 135,000 India 900 135,000
23 03027900 Nile perch (Lates niloticus) and snakeheads (Channa spp.),
Kg. 500 30,000
China P. R. 500 30,000 24 03055900 Dried fish, not smoked Kg. 350 42,000
India 350 42,000 Chapter 04 Dairy produce: birds` eggs: natural honey: edible
products of animal origin, not elsewhere specified or included
234,226,053
25 04011000 Milk and cream of a fat content, by weight, not exceeding 1%
Kg. 359 394,666
China P. R. 359 394,666 26 04015000 Milk and cream, of a fat content, by weight,
exceeding 10 % not concentrated nor containing added sugar or other sweetening matter
Kg. 150 37,500
India 150 37,500 27 04021000 Milk and cream in powder, granules or other solid
form, of a fat content, by weight, not exceeding 1.5%
Kg. 145 20,000
India 145 20,000 28 04022900 Milk and cream in powdered and granules of a fat
content by weight exceeding 1.5% containing sugar or added sweetening matter
Kg. 380 80,976
China P. R. 380 80,976 29 04029900 Milk and cream in liquid form containing added
sugar or sweetening matter of a fat content by weight exceeding 1.5%
Kg. 4,000 182,485

108
S.N. HS Code Description, Commodities/ Countries Unit Quantity Values (Rs.) China P. R. 3,900 179,285 India 100 3,200
30 04039000 Buttermilk, curdled milk and cream Kg. 22,399 2,960,300 India 22,399 2,960,300
31 04041000 Whey and modified whey Kg. 133,910 639,602 China P. R. 500 42,500 India 133,060 304,400 U.S.A. 350 292,702
32 04049000 Product consisting of natural milk constituents whether or not containing added sugar or sweetening matter
Kg. 1,500 236,500
China P. R. 1,500 236,500 33 04051000 Butter Kg. 5,965 1,007,351
China P. R. 3,165 307,351 India 2,800 700,000
34 04059000 Fats and oils derived from milk Kg. 532,151 191,740,605 China P. R. 450 87,000 India 531,701 191,653,605
35 04061000 Fresh cheese including whey cheese, and curd Kg. 47 14,396 U.S.A. 47 14,396
36 04063000 Processed cheese Kg. 309 86,928 Canada 100 82,418 U.S.A. 209 4,510
37 04069000 Cheese Kg. 43,872 35,668,766 Japan 14,240 1,874,503 Taiwan 74 75,331 India 35 7,000 U.S.A. 29,523 33,711,932
38 04090000 Natural Honey Kg. 3,800 726,183 China P. R. 3,740 699,493 Japan 60 26,690
39 04100000 Edible products of animal origin, not elsewhere specified or included
Kg. 571 429,795
India 571 429,795 Chapter 05 Products of animal origin, not elsewher specified or
included 72,131,059
40 05010000 Human hair Kg. 5,479 17,331,624 China P. R. 5,437 17,203,872 Korea R 42 127,752
41 05021000 Pigs, hogs or boars bristle Kg. 1,329 293,000 India 1,329 293,000
42 05029000 Badger hair and other brush-making hair Kg. 4,955 1,152,200 India 4,955 1,152,200
43 05061000 Ossein and bones treated with acid Kg. 1,802,000 16,021,000
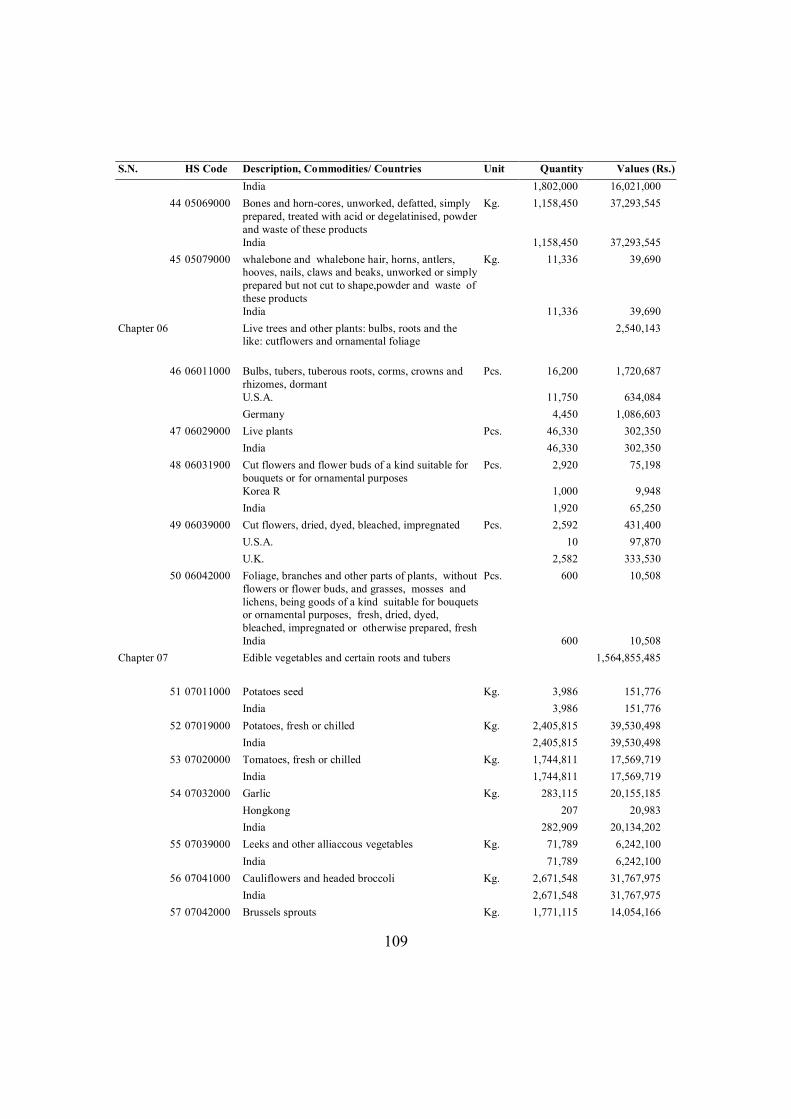
109
S.N. HS Code Description, Commodities/ Countries Unit Quantity Values (Rs.) India 1,802,000 16,021,000
44 05069000 Bones and horn-cores, unworked, defatted, simply prepared, treated with acid or degelatinised, powder and waste of these products
Kg. 1,158,450 37,293,545
India 1,158,450 37,293,545 45 05079000 whalebone and whalebone hair, horns, antlers,
hooves, nails, claws and beaks, unworked or simply prepared but not cut to shape,powder and waste of these products
Kg. 11,336 39,690
India 11,336 39,690 Chapter 06 Live trees and other plants: bulbs, roots and the
like: cutflowers and ornamental foliage 2,540,143
46 06011000 Bulbs, tubers, tuberous roots, corms, crowns and rhizomes, dormant
Pcs. 16,200 1,720,687
U.S.A. 11,750 634,084 Germany 4,450 1,086,603
47 06029000 Live plants Pcs. 46,330 302,350 India 46,330 302,350
48 06031900 Cut flowers and flower buds of a kind suitable for bouquets or for ornamental purposes
Pcs. 2,920 75,198
Korea R 1,000 9,948 India 1,920 65,250
49 06039000 Cut flowers, dried, dyed, bleached, impregnated Pcs. 2,592 431,400 U.S.A. 10 97,870 U.K. 2,582 333,530
50 06042000 Foliage, branches and other parts of plants, without flowers or flower buds, and grasses, mosses and lichens, being goods of a kind suitable for bouquets or ornamental purposes, fresh, dried, dyed, bleached, impregnated or otherwise prepared, fresh
Pcs. 600 10,508
India 600 10,508 Chapter 07 Edible vegetables and certain roots and tubers 1,564,855,485
51 07011000 Potatoes seed Kg. 3,986 151,776 India 3,986 151,776
52 07019000 Potatoes, fresh or chilled Kg. 2,405,815 39,530,498 India 2,405,815 39,530,498
53 07020000 Tomatoes, fresh or chilled Kg. 1,744,811 17,569,719 India 1,744,811 17,569,719
54 07032000 Garlic Kg. 283,115 20,155,185 Hongkong 207 20,983 India 282,909 20,134,202
55 07039000 Leeks and other alliaccous vegetables Kg. 71,789 6,242,100 India 71,789 6,242,100
56 07041000 Cauliflowers and headed broccoli Kg. 2,671,548 31,767,975 India 2,671,548 31,767,975
57 07042000 Brussels sprouts Kg. 1,771,115 14,054,166
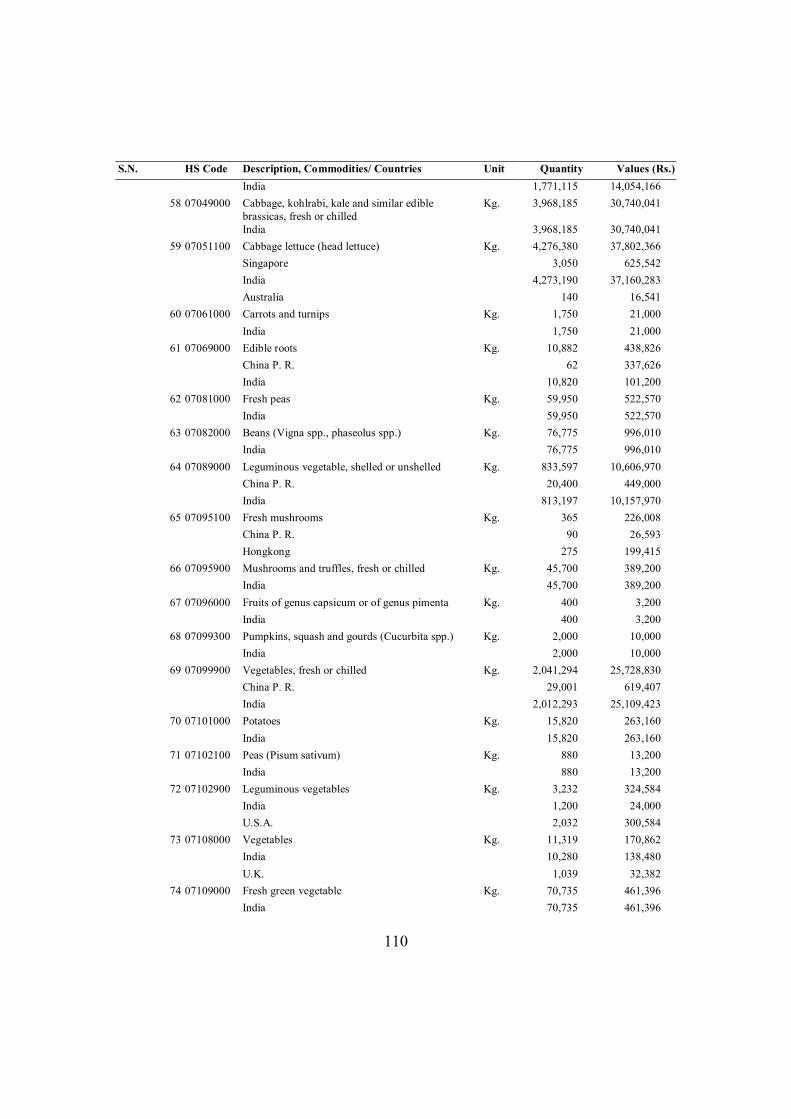
110
S.N. HS Code Description, Commodities/ Countries Unit Quantity Values (Rs.) India 1,771,115 14,054,166
58 07049000 Cabbage, kohlrabi, kale and similar edible brassicas, fresh or chilled
Kg. 3,968,185 30,740,041
India 3,968,185 30,740,041 59 07051100 Cabbage lettuce (head lettuce) Kg. 4,276,380 37,802,366
Singapore 3,050 625,542 India 4,273,190 37,160,283 Australia 140 16,541
60 07061000 Carrots and turnips Kg. 1,750 21,000 India 1,750 21,000
61 07069000 Edible roots Kg. 10,882 438,826 China P. R. 62 337,626 India 10,820 101,200
62 07081000 Fresh peas Kg. 59,950 522,570 India 59,950 522,570
63 07082000 Beans (Vigna spp., phaseolus spp.) Kg. 76,775 996,010 India 76,775 996,010
64 07089000 Leguminous vegetable, shelled or unshelled Kg. 833,597 10,606,970 China P. R. 20,400 449,000 India 813,197 10,157,970
65 07095100 Fresh mushrooms Kg. 365 226,008 China P. R. 90 26,593 Hongkong 275 199,415
66 07095900 Mushrooms and truffles, fresh or chilled Kg. 45,700 389,200 India 45,700 389,200
67 07096000 Fruits of genus capsicum or of genus pimenta Kg. 400 3,200 India 400 3,200
68 07099300 Pumpkins, squash and gourds (Cucurbita spp.) Kg. 2,000 10,000 India 2,000 10,000
69 07099900 Vegetables, fresh or chilled Kg. 2,041,294 25,728,830 China P. R. 29,001 619,407 India 2,012,293 25,109,423
70 07101000 Potatoes Kg. 15,820 263,160 India 15,820 263,160
71 07102100 Peas (Pisum sativum) Kg. 880 13,200 India 880 13,200
72 07102900 Leguminous vegetables Kg. 3,232 324,584 India 1,200 24,000 U.S.A. 2,032 300,584
73 07108000 Vegetables Kg. 11,319 170,862 India 10,280 138,480 U.K. 1,039 32,382
74 07109000 Fresh green vegetable Kg. 70,735 461,396 India 70,735 461,396
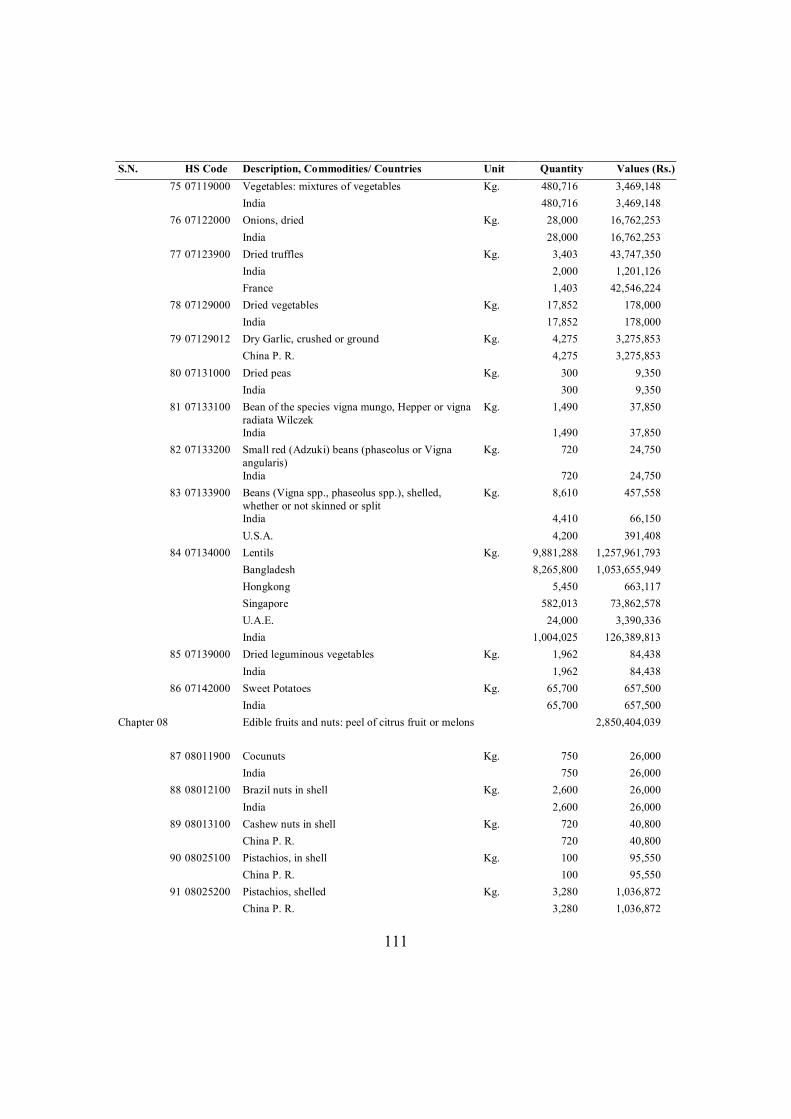
111
S.N. HS Code Description, Commodities/ Countries Unit Quantity Values (Rs.) 75 07119000 Vegetables: mixtures of vegetables Kg. 480,716 3,469,148
India 480,716 3,469,148 76 07122000 Onions, dried Kg. 28,000 16,762,253
India 28,000 16,762,253 77 07123900 Dried truffles Kg. 3,403 43,747,350
India 2,000 1,201,126 France 1,403 42,546,224
78 07129000 Dried vegetables Kg. 17,852 178,000 India 17,852 178,000
79 07129012 Dry Garlic, crushed or ground Kg. 4,275 3,275,853 China P. R. 4,275 3,275,853
80 07131000 Dried peas Kg. 300 9,350 India 300 9,350
81 07133100 Bean of the species vigna mungo, Hepper or vigna radiata Wilczek
Kg. 1,490 37,850
India 1,490 37,850 82 07133200 Small red (Adzuki) beans (phaseolus or Vigna
angularis) Kg. 720 24,750
India 720 24,750 83 07133900 Beans (Vigna spp., phaseolus spp.), shelled,
whether or not skinned or split Kg. 8,610 457,558
India 4,410 66,150 U.S.A. 4,200 391,408
84 07134000 Lentils Kg. 9,881,288 1,257,961,793 Bangladesh 8,265,800 1,053,655,949 Hongkong 5,450 663,117 Singapore 582,013 73,862,578 U.A.E. 24,000 3,390,336 India 1,004,025 126,389,813
85 07139000 Dried leguminous vegetables Kg. 1,962 84,438 India 1,962 84,438
86 07142000 Sweet Potatoes Kg. 65,700 657,500 India 65,700 657,500
Chapter 08 Edible fruits and nuts: peel of citrus fruit or melons 2,850,404,039
87 08011900 Cocunuts Kg. 750 26,000 India 750 26,000
88 08012100 Brazil nuts in shell Kg. 2,600 26,000 India 2,600 26,000
89 08013100 Cashew nuts in shell Kg. 720 40,800 China P. R. 720 40,800
90 08025100 Pistachios, in shell Kg. 100 95,550 China P. R. 100 95,550
91 08025200 Pistachios, shelled Kg. 3,280 1,036,872 China P. R. 3,280 1,036,872
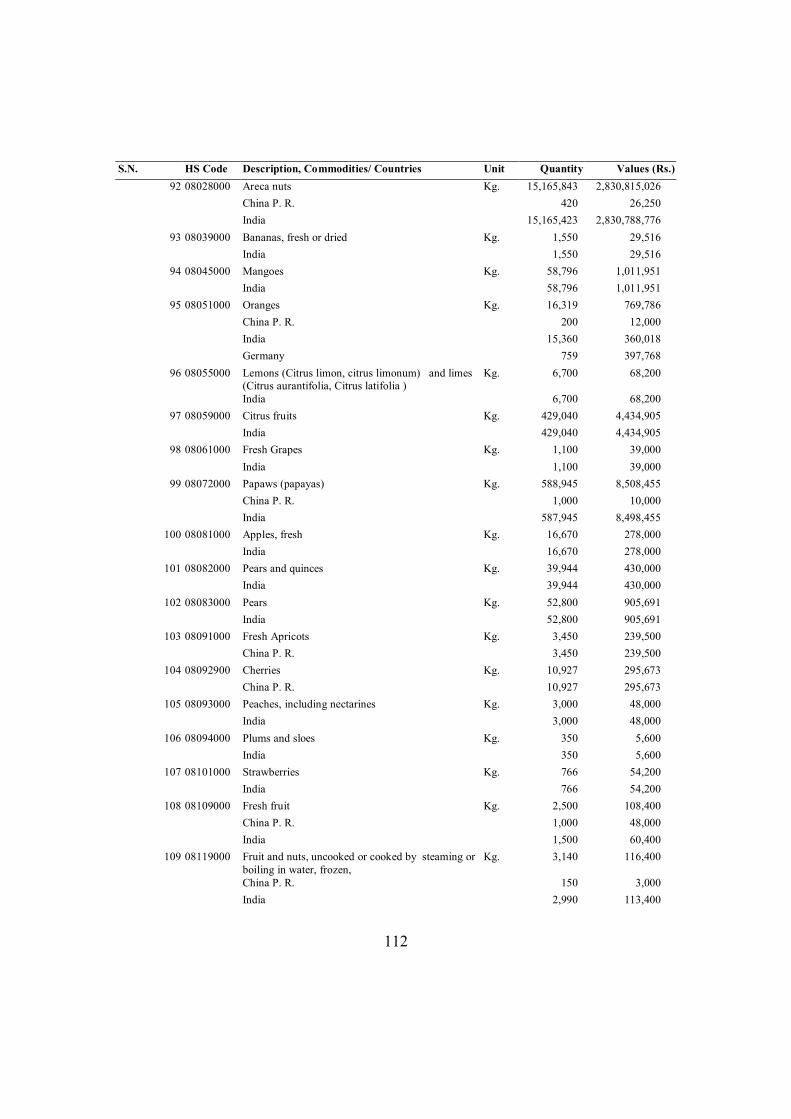
112
S.N. HS Code Description, Commodities/ Countries Unit Quantity Values (Rs.) 92 08028000 Areca nuts Kg. 15,165,843 2,830,815,026
China P. R. 420 26,250 India 15,165,423 2,830,788,776
93 08039000 Bananas, fresh or dried Kg. 1,550 29,516 India 1,550 29,516
94 08045000 Mangoes Kg. 58,796 1,011,951 India 58,796 1,011,951
95 08051000 Oranges Kg. 16,319 769,786 China P. R. 200 12,000 India 15,360 360,018 Germany 759 397,768
96 08055000 Lemons (Citrus limon, citrus limonum) and limes (Citrus aurantifolia, Citrus latifolia )
Kg. 6,700 68,200
India 6,700 68,200 97 08059000 Citrus fruits Kg. 429,040 4,434,905
India 429,040 4,434,905 98 08061000 Fresh Grapes Kg. 1,100 39,000
India 1,100 39,000 99 08072000 Papaws (papayas) Kg. 588,945 8,508,455
China P. R. 1,000 10,000 India 587,945 8,498,455
100 08081000 Apples, fresh Kg. 16,670 278,000 India 16,670 278,000
101 08082000 Pears and quinces Kg. 39,944 430,000 India 39,944 430,000
102 08083000 Pears Kg. 52,800 905,691 India 52,800 905,691
103 08091000 Fresh Apricots Kg. 3,450 239,500 China P. R. 3,450 239,500
104 08092900 Cherries Kg. 10,927 295,673 China P. R. 10,927 295,673
105 08093000 Peaches, including nectarines Kg. 3,000 48,000 India 3,000 48,000
106 08094000 Plums and sloes Kg. 350 5,600 India 350 5,600
107 08101000 Strawberries Kg. 766 54,200 India 766 54,200
108 08109000 Fresh fruit Kg. 2,500 108,400 China P. R. 1,000 48,000 India 1,500 60,400
109 08119000 Fruit and nuts, uncooked or cooked by steaming or boiling in water, frozen,
Kg. 3,140 116,400
China P. R. 150 3,000 India 2,990 113,400
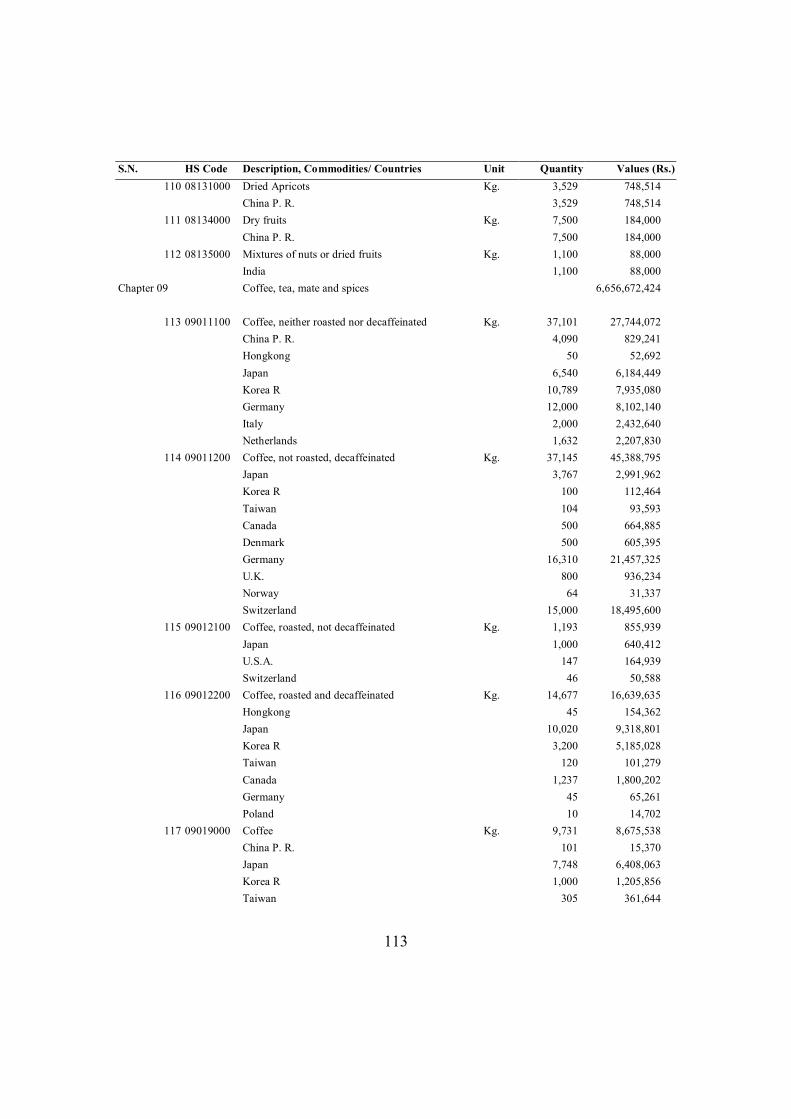
113
S.N. HS Code Description, Commodities/ Countries Unit Quantity Values (Rs.) 110 08131000 Dried Apricots Kg. 3,529 748,514
China P. R. 3,529 748,514 111 08134000 Dry fruits Kg. 7,500 184,000
China P. R. 7,500 184,000 112 08135000 Mixtures of nuts or dried fruits Kg. 1,100 88,000
India 1,100 88,000 Chapter 09 Coffee, tea, mate and spices 6,656,672,424
113 09011100 Coffee, neither roasted nor decaffeinated Kg. 37,101 27,744,072 China P. R. 4,090 829,241 Hongkong 50 52,692 Japan 6,540 6,184,449 Korea R 10,789 7,935,080 Germany 12,000 8,102,140 Italy 2,000 2,432,640 Netherlands 1,632 2,207,830
114 09011200 Coffee, not roasted, decaffeinated Kg. 37,145 45,388,795 Japan 3,767 2,991,962 Korea R 100 112,464 Taiwan 104 93,593 Canada 500 664,885 Denmark 500 605,395 Germany 16,310 21,457,325 U.K. 800 936,234 Norway 64 31,337 Switzerland 15,000 18,495,600
115 09012100 Coffee, roasted, not decaffeinated Kg. 1,193 855,939 Japan 1,000 640,412 U.S.A. 147 164,939 Switzerland 46 50,588
116 09012200 Coffee, roasted and decaffeinated Kg. 14,677 16,639,635 Hongkong 45 154,362 Japan 10,020 9,318,801 Korea R 3,200 5,185,028 Taiwan 120 101,279 Canada 1,237 1,800,202 Germany 45 65,261 Poland 10 14,702
117 09019000 Coffee Kg. 9,731 8,675,538 China P. R. 101 15,370 Japan 7,748 6,408,063 Korea R 1,000 1,205,856 Taiwan 305 361,644
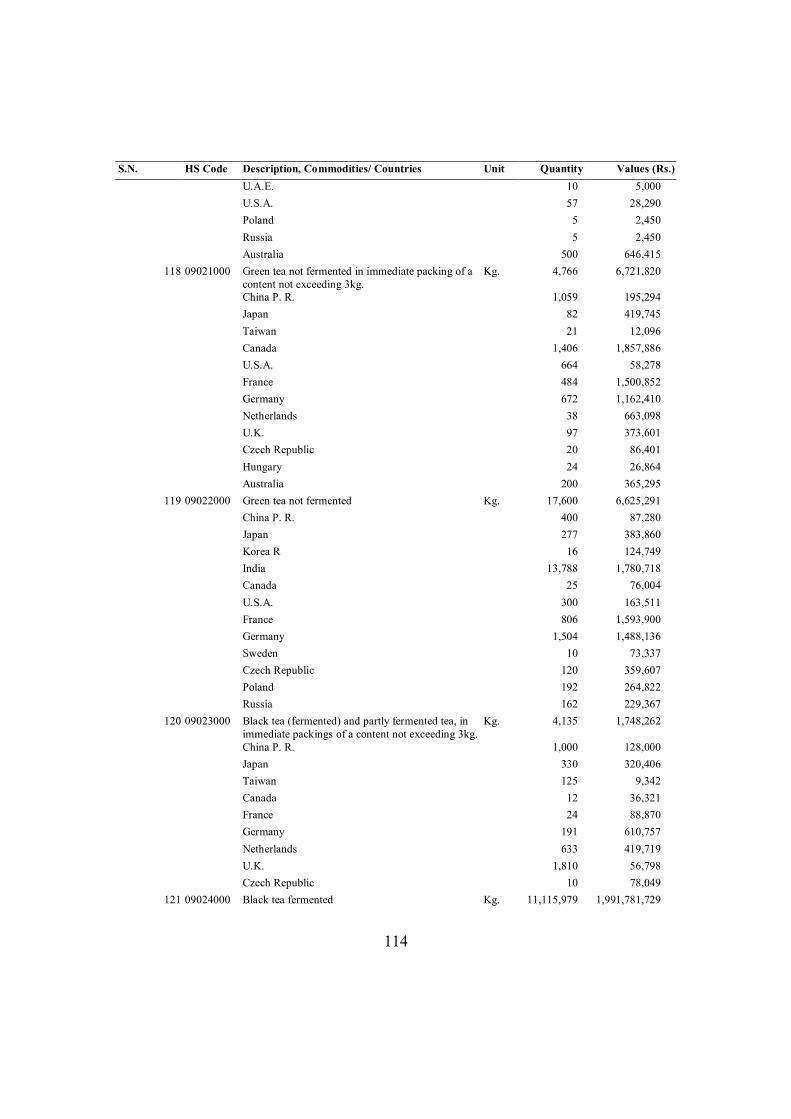
114
S.N. HS Code Description, Commodities/ Countries Unit Quantity Values (Rs.) U.A.E. 10 5,000 U.S.A. 57 28,290 Poland 5 2,450 Russia 5 2,450 Australia 500 646,415
118 09021000 Green tea not fermented in immediate packing of a content not exceeding 3kg.
Kg. 4,766 6,721,820
China P. R. 1,059 195,294 Japan 82 419,745 Taiwan 21 12,096 Canada 1,406 1,857,886 U.S.A. 664 58,278 France 484 1,500,852 Germany 672 1,162,410 Netherlands 38 663,098 U.K. 97 373,601 Czech Republic 20 86,401 Hungary 24 26,864 Australia 200 365,295
119 09022000 Green tea not fermented Kg. 17,600 6,625,291 China P. R. 400 87,280 Japan 277 383,860 Korea R 16 124,749 India 13,788 1,780,718 Canada 25 76,004 U.S.A. 300 163,511 France 806 1,593,900 Germany 1,504 1,488,136 Sweden 10 73,337 Czech Republic 120 359,607 Poland 192 264,822 Russia 162 229,367
120 09023000 Black tea (fermented) and partly fermented tea, in immediate packings of a content not exceeding 3kg.
Kg. 4,135 1,748,262
China P. R. 1,000 128,000 Japan 330 320,406 Taiwan 125 9,342 Canada 12 36,321 France 24 88,870 Germany 191 610,757 Netherlands 633 419,719 U.K. 1,810 56,798 Czech Republic 10 78,049
121 09024000 Black tea fermented Kg. 11,115,979 1,991,781,729
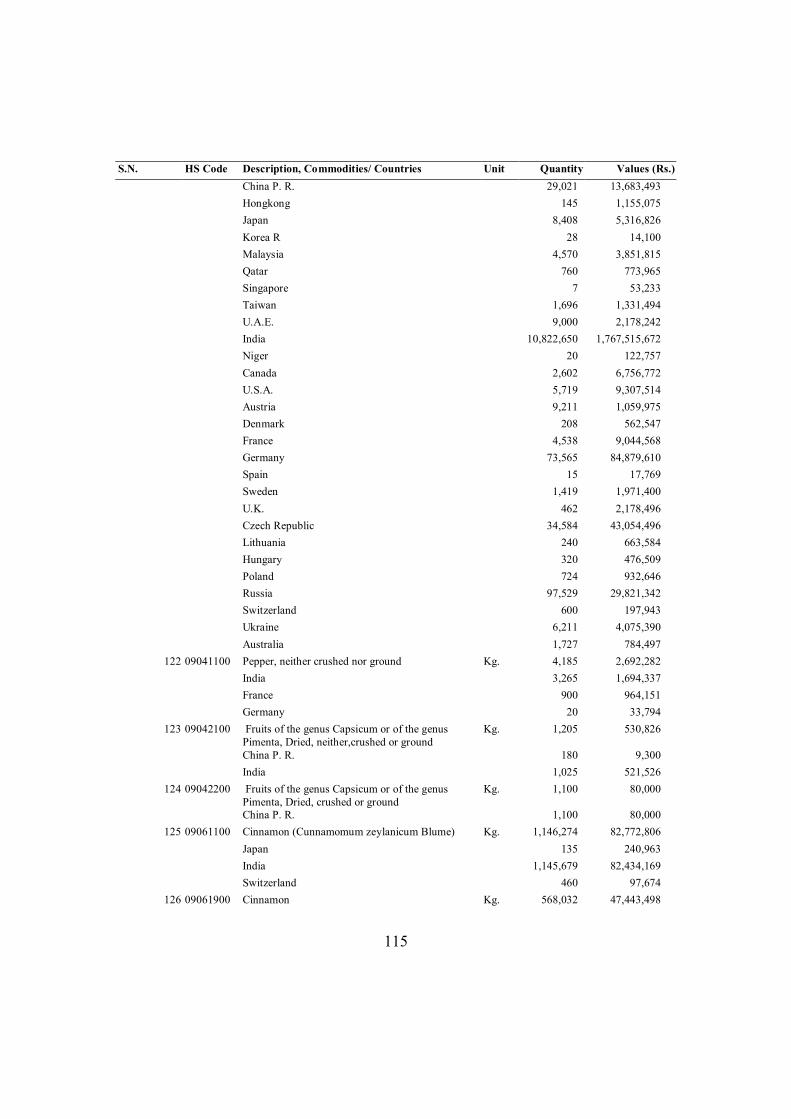
115
S.N. HS Code Description, Commodities/ Countries Unit Quantity Values (Rs.) China P. R. 29,021 13,683,493 Hongkong 145 1,155,075 Japan 8,408 5,316,826 Korea R 28 14,100 Malaysia 4,570 3,851,815 Qatar 760 773,965 Singapore 7 53,233 Taiwan 1,696 1,331,494 U.A.E. 9,000 2,178,242 India 10,822,650 1,767,515,672 Niger 20 122,757 Canada 2,602 6,756,772 U.S.A. 5,719 9,307,514 Austria 9,211 1,059,975 Denmark 208 562,547 France 4,538 9,044,568 Germany 73,565 84,879,610 Spain 15 17,769 Sweden 1,419 1,971,400 U.K. 462 2,178,496 Czech Republic 34,584 43,054,496 Lithuania 240 663,584 Hungary 320 476,509 Poland 724 932,646 Russia 97,529 29,821,342 Switzerland 600 197,943 Ukraine 6,211 4,075,390 Australia 1,727 784,497
122 09041100 Pepper, neither crushed nor ground Kg. 4,185 2,692,282 India 3,265 1,694,337 France 900 964,151 Germany 20 33,794
123 09042100 Fruits of the genus Capsicum or of the genus Pimenta, Dried, neither,crushed or ground
Kg. 1,205 530,826
China P. R. 180 9,300 India 1,025 521,526
124 09042200 Fruits of the genus Capsicum or of the genus Pimenta, Dried, crushed or ground
Kg. 1,100 80,000
China P. R. 1,100 80,000 125 09061100 Cinnamon (Cunnamomum zeylanicum Blume) Kg. 1,146,274 82,772,806
Japan 135 240,963 India 1,145,679 82,434,169 Switzerland 460 97,674
126 09061900 Cinnamon Kg. 568,032 47,443,498
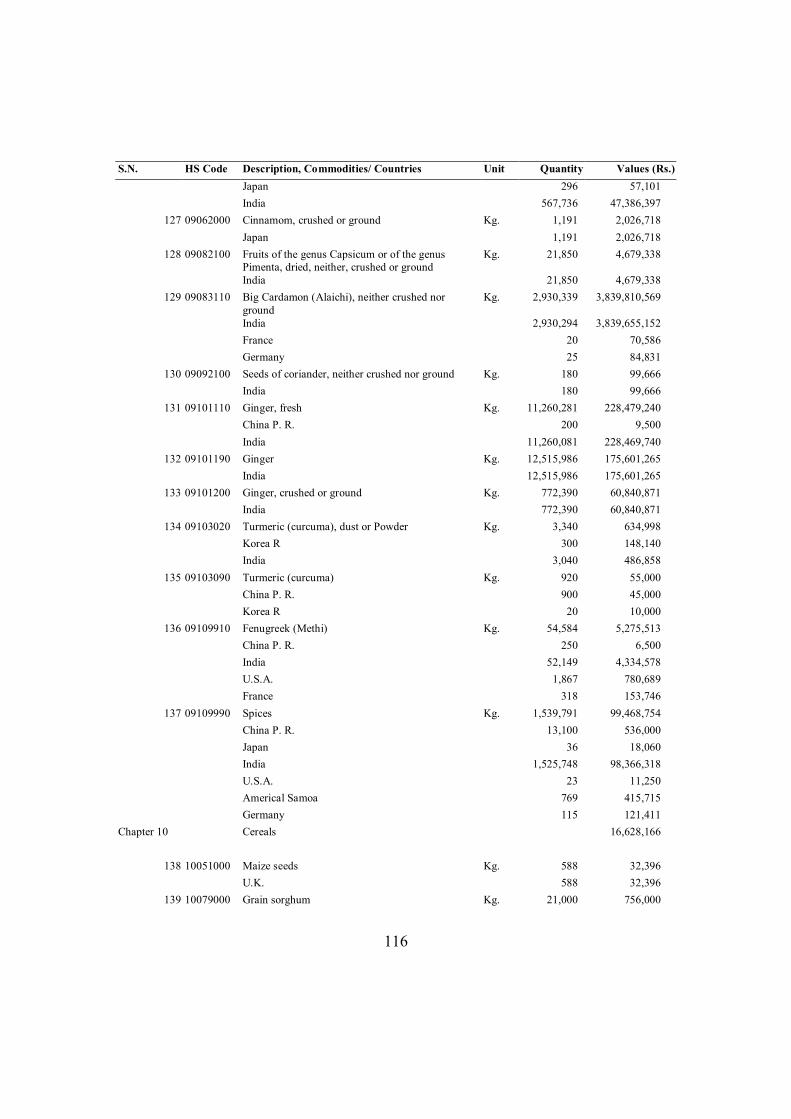
116
S.N. HS Code Description, Commodities/ Countries Unit Quantity Values (Rs.) Japan 296 57,101 India 567,736 47,386,397
127 09062000 Cinnamom, crushed or ground Kg. 1,191 2,026,718 Japan 1,191 2,026,718
128 09082100 Fruits of the genus Capsicum or of the genus Pimenta, dried, neither, crushed or ground
Kg. 21,850 4,679,338
India 21,850 4,679,338 129 09083110 Big Cardamon (Alaichi), neither crushed nor
ground Kg. 2,930,339 3,839,810,569
India 2,930,294 3,839,655,152 France 20 70,586 Germany 25 84,831
130 09092100 Seeds of coriander, neither crushed nor ground Kg. 180 99,666 India 180 99,666
131 09101110 Ginger, fresh Kg. 11,260,281 228,479,240 China P. R. 200 9,500 India 11,260,081 228,469,740
132 09101190 Ginger Kg. 12,515,986 175,601,265 India 12,515,986 175,601,265
133 09101200 Ginger, crushed or ground Kg. 772,390 60,840,871 India 772,390 60,840,871
134 09103020 Turmeric (curcuma), dust or Powder Kg. 3,340 634,998 Korea R 300 148,140 India 3,040 486,858
135 09103090 Turmeric (curcuma) Kg. 920 55,000 China P. R. 900 45,000 Korea R 20 10,000
136 09109910 Fenugreek (Methi) Kg. 54,584 5,275,513 China P. R. 250 6,500 India 52,149 4,334,578 U.S.A. 1,867 780,689 France 318 153,746
137 09109990 Spices Kg. 1,539,791 99,468,754 China P. R. 13,100 536,000 Japan 36 18,060 India 1,525,748 98,366,318 U.S.A. 23 11,250 Americal Samoa 769 415,715 Germany 115 121,411
Chapter 10 Cereals 16,628,166
138 10051000 Maize seeds Kg. 588 32,396 U.K. 588 32,396
139 10079000 Grain sorghum Kg. 21,000 756,000
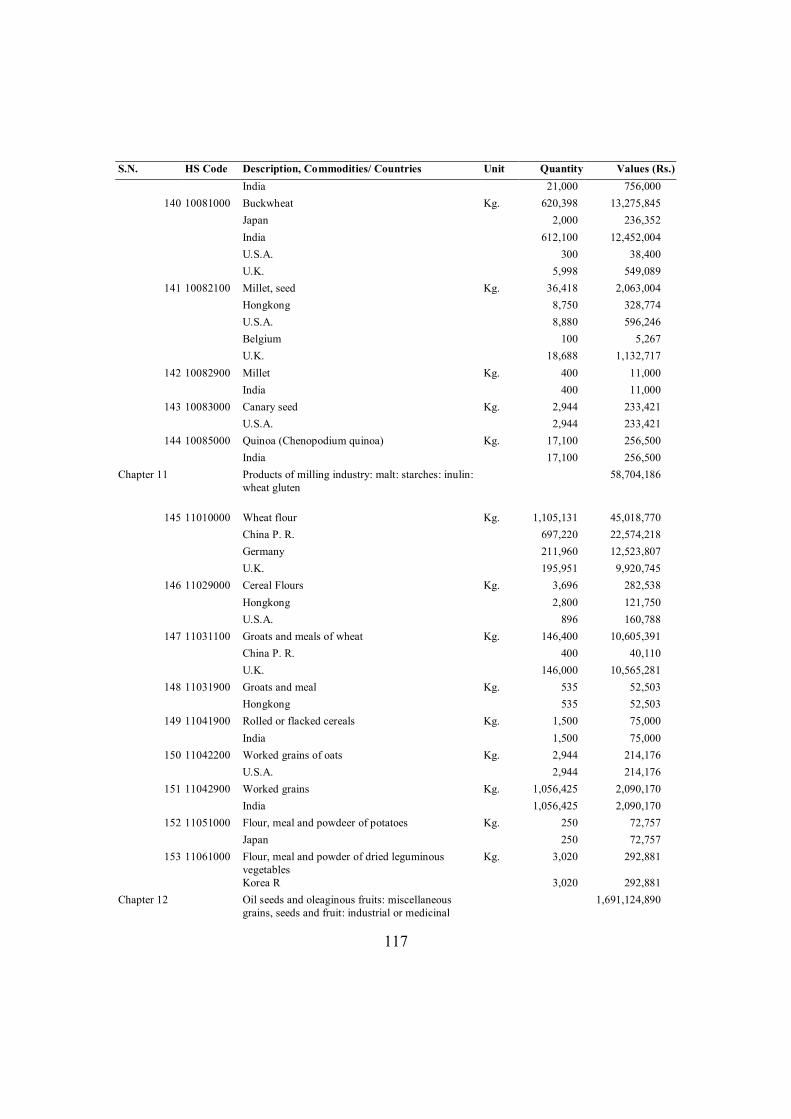
117
S.N. HS Code Description, Commodities/ Countries Unit Quantity Values (Rs.) India 21,000 756,000
140 10081000 Buckwheat Kg. 620,398 13,275,845 Japan 2,000 236,352 India 612,100 12,452,004 U.S.A. 300 38,400 U.K. 5,998 549,089
141 10082100 Millet, seed Kg. 36,418 2,063,004 Hongkong 8,750 328,774 U.S.A. 8,880 596,246 Belgium 100 5,267 U.K. 18,688 1,132,717
142 10082900 Millet Kg. 400 11,000 India 400 11,000
143 10083000 Canary seed Kg. 2,944 233,421 U.S.A. 2,944 233,421
144 10085000 Quinoa (Chenopodium quinoa) Kg. 17,100 256,500 India 17,100 256,500
Chapter 11 Products of milling industry: malt: starches: inulin: wheat gluten
58,704,186
145 11010000 Wheat flour Kg. 1,105,131 45,018,770 China P. R. 697,220 22,574,218 Germany 211,960 12,523,807 U.K. 195,951 9,920,745
146 11029000 Cereal Flours Kg. 3,696 282,538 Hongkong 2,800 121,750 U.S.A. 896 160,788
147 11031100 Groats and meals of wheat Kg. 146,400 10,605,391 China P. R. 400 40,110 U.K. 146,000 10,565,281
148 11031900 Groats and meal Kg. 535 52,503 Hongkong 535 52,503
149 11041900 Rolled or flacked cereals Kg. 1,500 75,000 India 1,500 75,000
150 11042200 Worked grains of oats Kg. 2,944 214,176 U.S.A. 2,944 214,176
151 11042900 Worked grains Kg. 1,056,425 2,090,170 India 1,056,425 2,090,170
152 11051000 Flour, meal and powdeer of potatoes Kg. 250 72,757 Japan 250 72,757
153 11061000 Flour, meal and powder of dried leguminous vegetables
Kg. 3,020 292,881
Korea R 3,020 292,881 Chapter 12 Oil seeds and oleaginous fruits: miscellaneous
grains, seeds and fruit: industrial or medicinal 1,691,124,890
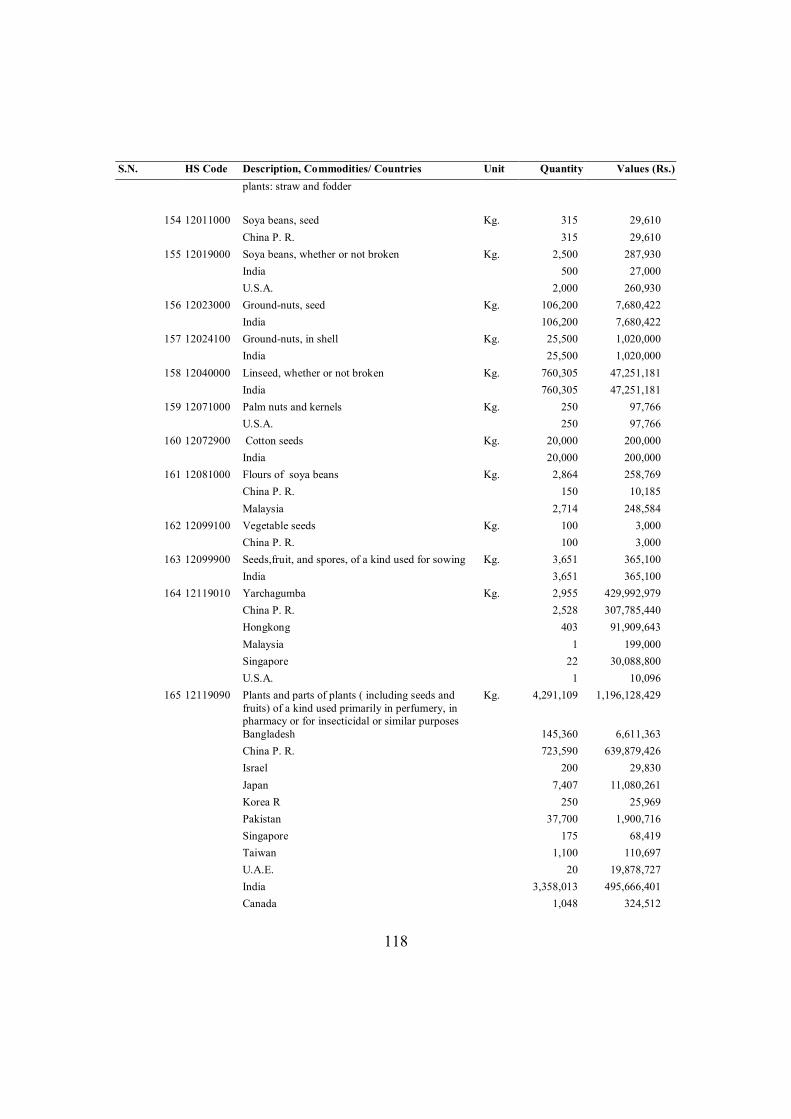
118
S.N. HS Code Description, Commodities/ Countries Unit Quantity Values (Rs.) plants: straw and fodder
154 12011000 Soya beans, seed Kg. 315 29,610 China P. R. 315 29,610
155 12019000 Soya beans, whether or not broken Kg. 2,500 287,930 India 500 27,000 U.S.A. 2,000 260,930
156 12023000 Ground-nuts, seed Kg. 106,200 7,680,422 India 106,200 7,680,422
157 12024100 Ground-nuts, in shell Kg. 25,500 1,020,000 India 25,500 1,020,000
158 12040000 Linseed, whether or not broken Kg. 760,305 47,251,181 India 760,305 47,251,181
159 12071000 Palm nuts and kernels Kg. 250 97,766 U.S.A. 250 97,766
160 12072900 Cotton seeds Kg. 20,000 200,000 India 20,000 200,000
161 12081000 Flours of soya beans Kg. 2,864 258,769 China P. R. 150 10,185 Malaysia 2,714 248,584
162 12099100 Vegetable seeds Kg. 100 3,000 China P. R. 100 3,000
163 12099900 Seeds,fruit, and spores, of a kind used for sowing Kg. 3,651 365,100 India 3,651 365,100
164 12119010 Yarchagumba Kg. 2,955 429,992,979 China P. R. 2,528 307,785,440 Hongkong 403 91,909,643 Malaysia 1 199,000 Singapore 22 30,088,800 U.S.A. 1 10,096
165 12119090 Plants and parts of plants ( including seeds and fruits) of a kind used primarily in perfumery, in pharmacy or for insecticidal or similar purposes
Kg. 4,291,109 1,196,128,429
Bangladesh 145,360 6,611,363 China P. R. 723,590 639,879,426 Israel 200 29,830 Japan 7,407 11,080,261 Korea R 250 25,969 Pakistan 37,700 1,900,716 Singapore 175 68,419 Taiwan 1,100 110,697 U.A.E. 20 19,878,727 India 3,358,013 495,666,401 Canada 1,048 324,512
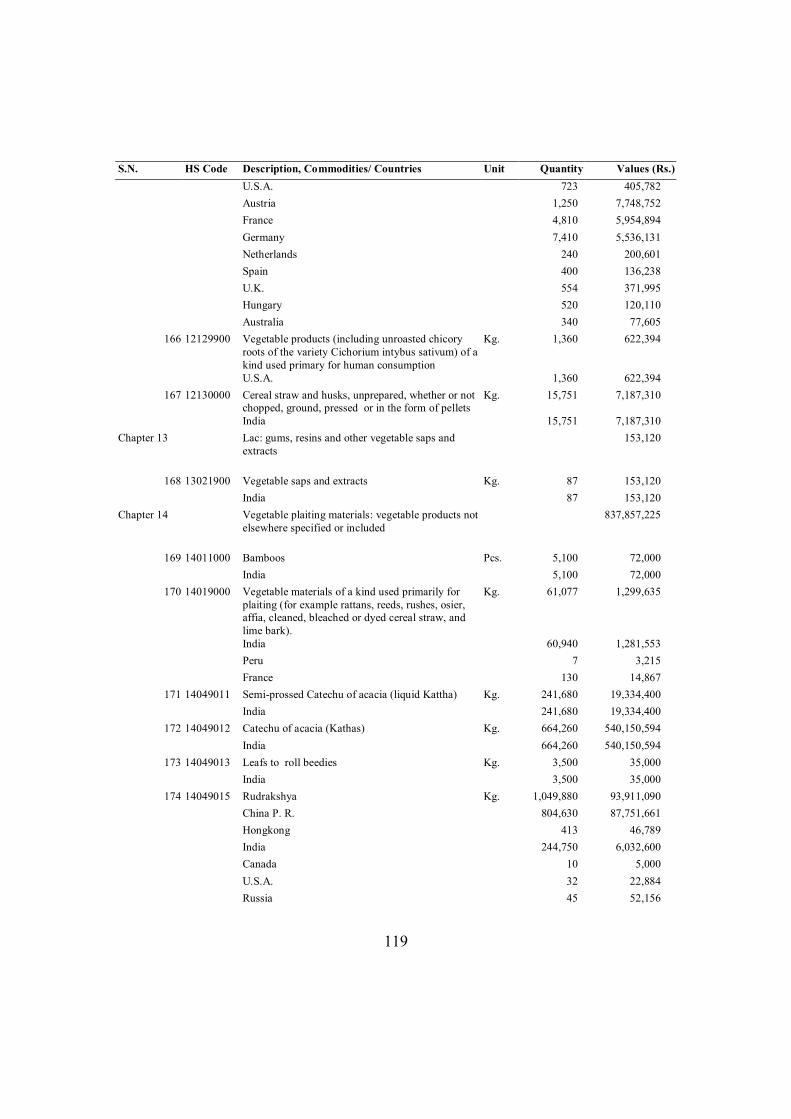
119
S.N. HS Code Description, Commodities/ Countries Unit Quantity Values (Rs.) U.S.A. 723 405,782 Austria 1,250 7,748,752 France 4,810 5,954,894 Germany 7,410 5,536,131 Netherlands 240 200,601 Spain 400 136,238 U.K. 554 371,995 Hungary 520 120,110 Australia 340 77,605
166 12129900 Vegetable products (including unroasted chicory roots of the variety Cichorium intybus sativum) of a kind used primary for human consumption
Kg. 1,360 622,394
U.S.A. 1,360 622,394 167 12130000 Cereal straw and husks, unprepared, whether or not
chopped, ground, pressed or in the form of pellets Kg. 15,751 7,187,310
India 15,751 7,187,310 Chapter 13 Lac: gums, resins and other vegetable saps and
extracts 153,120
168 13021900 Vegetable saps and extracts Kg. 87 153,120 India 87 153,120
Chapter 14 Vegetable plaiting materials: vegetable products not elsewhere specified or included
837,857,225
169 14011000 Bamboos Pcs. 5,100 72,000 India 5,100 72,000
170 14019000 Vegetable materials of a kind used primarily for plaiting (for example rattans, reeds, rushes, osier, affia, cleaned, bleached or dyed cereal straw, and lime bark).
Kg. 61,077 1,299,635
India 60,940 1,281,553 Peru 7 3,215 France 130 14,867
171 14049011 Semi-prossed Catechu of acacia (liquid Kattha) Kg. 241,680 19,334,400 India 241,680 19,334,400
172 14049012 Catechu of acacia (Kathas) Kg. 664,260 540,150,594 India 664,260 540,150,594
173 14049013 Leafs to roll beedies Kg. 3,500 35,000 India 3,500 35,000
174 14049015 Rudrakshya Kg. 1,049,880 93,911,090 China P. R. 804,630 87,751,661 Hongkong 413 46,789 India 244,750 6,032,600 Canada 10 5,000 U.S.A. 32 22,884 Russia 45 52,156
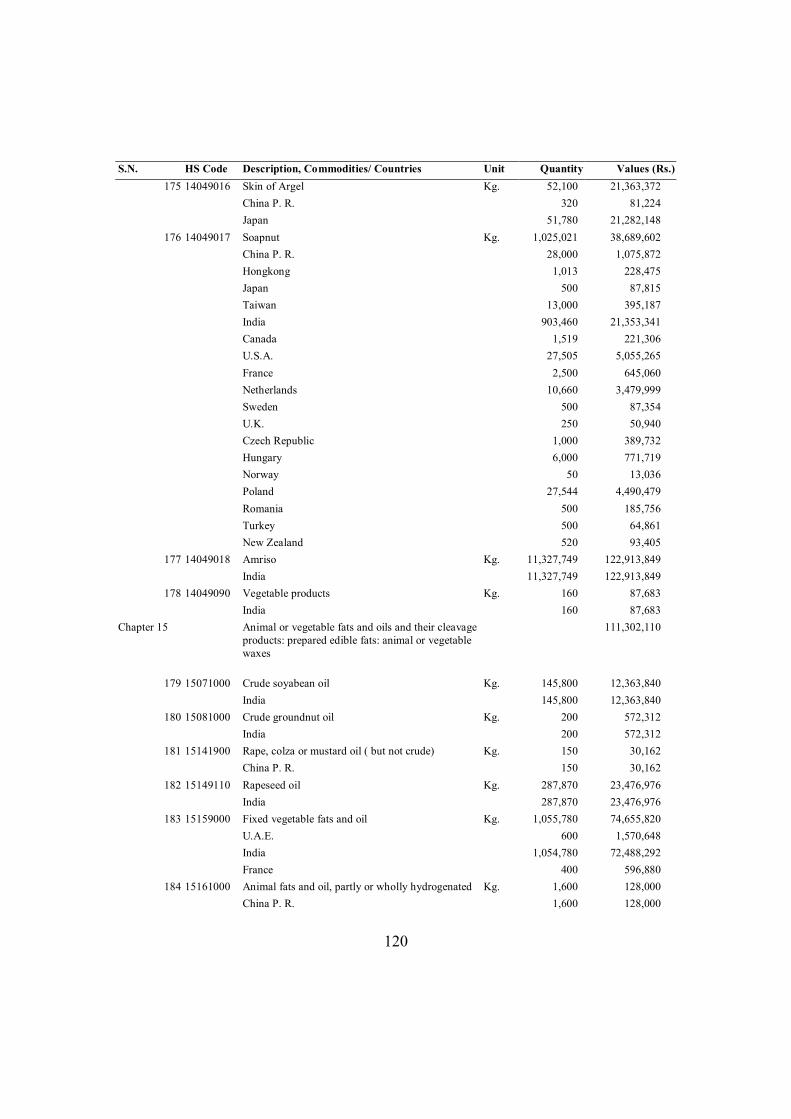
120
S.N. HS Code Description, Commodities/ Countries Unit Quantity Values (Rs.) 175 14049016 Skin of Argel Kg. 52,100 21,363,372
China P. R. 320 81,224 Japan 51,780 21,282,148
176 14049017 Soapnut Kg. 1,025,021 38,689,602 China P. R. 28,000 1,075,872 Hongkong 1,013 228,475 Japan 500 87,815 Taiwan 13,000 395,187 India 903,460 21,353,341 Canada 1,519 221,306 U.S.A. 27,505 5,055,265 France 2,500 645,060 Netherlands 10,660 3,479,999 Sweden 500 87,354 U.K. 250 50,940 Czech Republic 1,000 389,732 Hungary 6,000 771,719 Norway 50 13,036 Poland 27,544 4,490,479 Romania 500 185,756 Turkey 500 64,861 New Zealand 520 93,405
177 14049018 Amriso Kg. 11,327,749 122,913,849 India 11,327,749 122,913,849
178 14049090 Vegetable products Kg. 160 87,683 India 160 87,683
Chapter 15 Animal or vegetable fats and oils and their cleavage products: prepared edible fats: animal or vegetable waxes
111,302,110
179 15071000 Crude soyabean oil Kg. 145,800 12,363,840 India 145,800 12,363,840
180 15081000 Crude groundnut oil Kg. 200 572,312 India 200 572,312
181 15141900 Rape, colza or mustard oil ( but not crude) Kg. 150 30,162 China P. R. 150 30,162
182 15149110 Rapeseed oil Kg. 287,870 23,476,976 India 287,870 23,476,976
183 15159000 Fixed vegetable fats and oil Kg. 1,055,780 74,655,820 U.A.E. 600 1,570,648 India 1,054,780 72,488,292 France 400 596,880
184 15161000 Animal fats and oil, partly or wholly hydrogenated Kg. 1,600 128,000 China P. R. 1,600 128,000
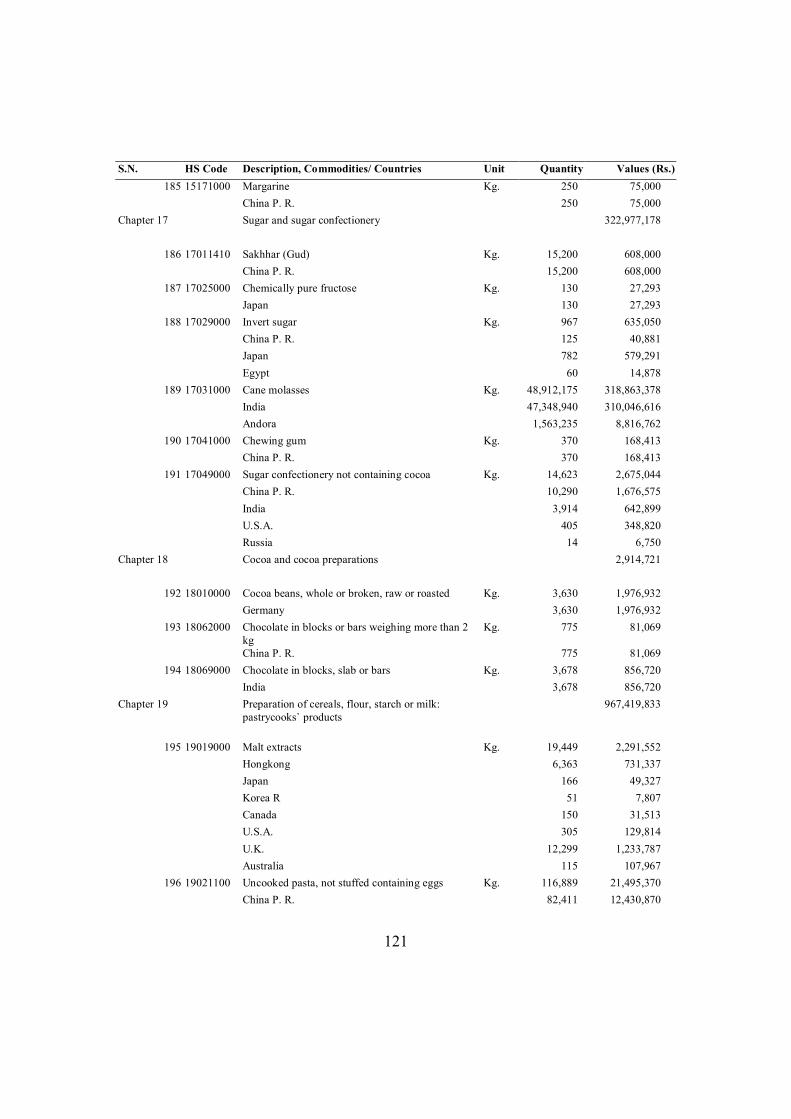
121
S.N. HS Code Description, Commodities/ Countries Unit Quantity Values (Rs.) 185 15171000 Margarine Kg. 250 75,000
China P. R. 250 75,000 Chapter 17 Sugar and sugar confectionery 322,977,178
186 17011410 Sakhhar (Gud) Kg. 15,200 608,000 China P. R. 15,200 608,000
187 17025000 Chemically pure fructose Kg. 130 27,293 Japan 130 27,293
188 17029000 Invert sugar Kg. 967 635,050 China P. R. 125 40,881 Japan 782 579,291 Egypt 60 14,878
189 17031000 Cane molasses Kg. 48,912,175 318,863,378 India 47,348,940 310,046,616 Andora 1,563,235 8,816,762
190 17041000 Chewing gum Kg. 370 168,413 China P. R. 370 168,413
191 17049000 Sugar confectionery not containing cocoa Kg. 14,623 2,675,044 China P. R. 10,290 1,676,575 India 3,914 642,899 U.S.A. 405 348,820 Russia 14 6,750
Chapter 18 Cocoa and cocoa preparations 2,914,721
192 18010000 Cocoa beans, whole or broken, raw or roasted Kg. 3,630 1,976,932 Germany 3,630 1,976,932
193 18062000 Chocolate in blocks or bars weighing more than 2 kg
Kg. 775 81,069
China P. R. 775 81,069 194 18069000 Chocolate in blocks, slab or bars Kg. 3,678 856,720
India 3,678 856,720 Chapter 19 Preparation of cereals, flour, starch or milk:
pastrycooks` products 967,419,833
195 19019000 Malt extracts Kg. 19,449 2,291,552 Hongkong 6,363 731,337 Japan 166 49,327 Korea R 51 7,807 Canada 150 31,513 U.S.A. 305 129,814 U.K. 12,299 1,233,787 Australia 115 107,967
196 19021100 Uncooked pasta, not stuffed containing eggs Kg. 116,889 21,495,370 China P. R. 82,411 12,430,870
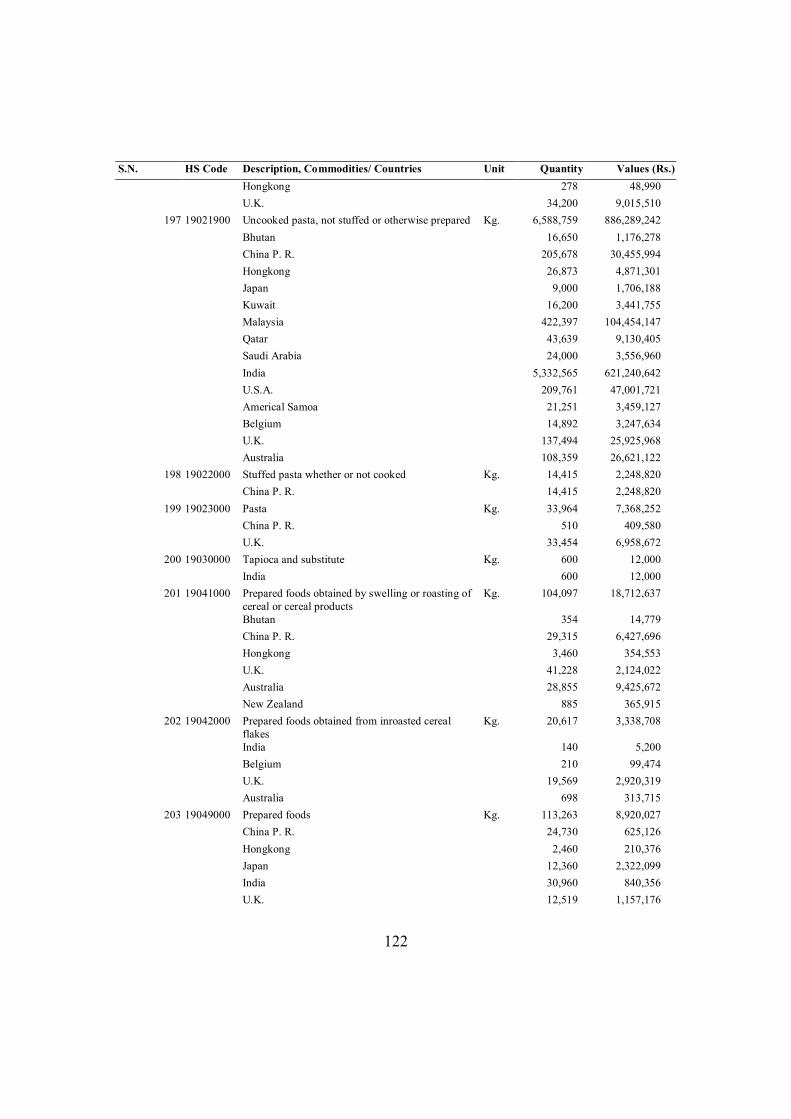
122
S.N. HS Code Description, Commodities/ Countries Unit Quantity Values (Rs.) Hongkong 278 48,990 U.K. 34,200 9,015,510
197 19021900 Uncooked pasta, not stuffed or otherwise prepared Kg. 6,588,759 886,289,242 Bhutan 16,650 1,176,278 China P. R. 205,678 30,455,994 Hongkong 26,873 4,871,301 Japan 9,000 1,706,188 Kuwait 16,200 3,441,755 Malaysia 422,397 104,454,147 Qatar 43,639 9,130,405 Saudi Arabia 24,000 3,556,960 India 5,332,565 621,240,642 U.S.A. 209,761 47,001,721 Americal Samoa 21,251 3,459,127 Belgium 14,892 3,247,634 U.K. 137,494 25,925,968 Australia 108,359 26,621,122
198 19022000 Stuffed pasta whether or not cooked Kg. 14,415 2,248,820 China P. R. 14,415 2,248,820
199 19023000 Pasta Kg. 33,964 7,368,252 China P. R. 510 409,580 U.K. 33,454 6,958,672
200 19030000 Tapioca and substitute Kg. 600 12,000 India 600 12,000
201 19041000 Prepared foods obtained by swelling or roasting of cereal or cereal products
Kg. 104,097 18,712,637
Bhutan 354 14,779 China P. R. 29,315 6,427,696 Hongkong 3,460 354,553 U.K. 41,228 2,124,022 Australia 28,855 9,425,672 New Zealand 885 365,915
202 19042000 Prepared foods obtained from inroasted cereal flakes
Kg. 20,617 3,338,708
India 140 5,200 Belgium 210 99,474 U.K. 19,569 2,920,319 Australia 698 313,715
203 19049000 Prepared foods Kg. 113,263 8,920,027 China P. R. 24,730 625,126 Hongkong 2,460 210,376 Japan 12,360 2,322,099 India 30,960 840,356 U.K. 12,519 1,157,176
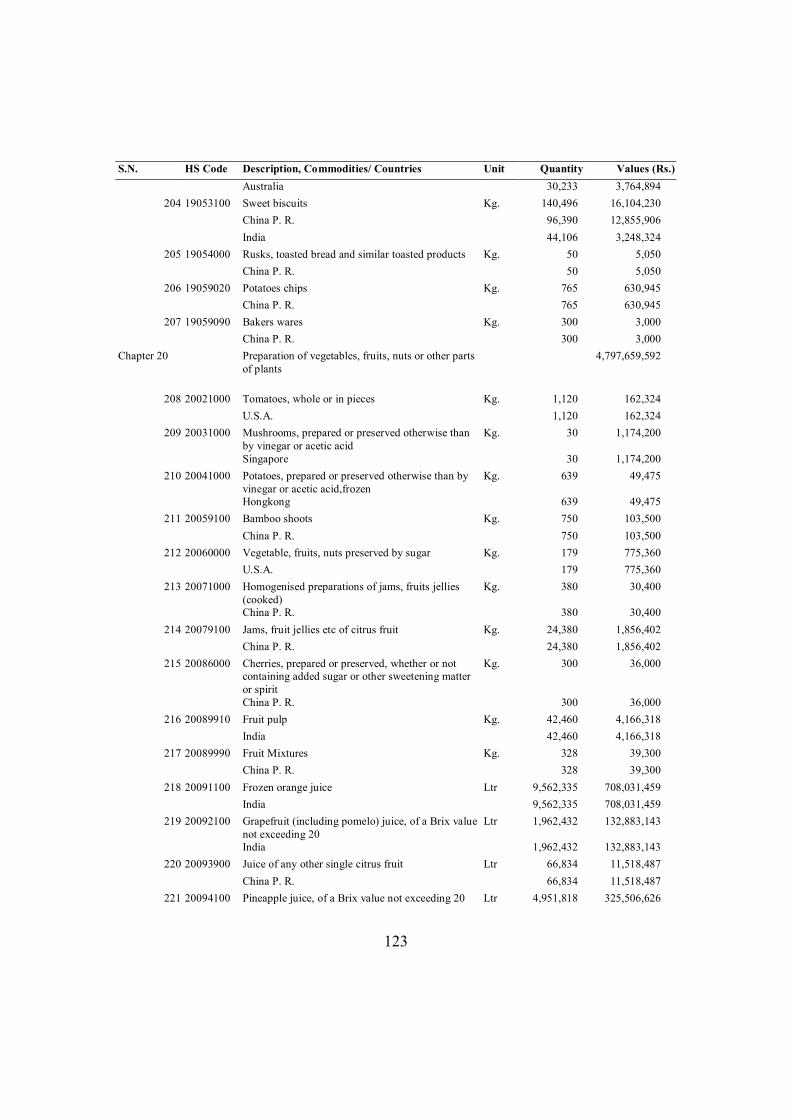
123
S.N. HS Code Description, Commodities/ Countries Unit Quantity Values (Rs.) Australia 30,233 3,764,894
204 19053100 Sweet biscuits Kg. 140,496 16,104,230 China P. R. 96,390 12,855,906 India 44,106 3,248,324
205 19054000 Rusks, toasted bread and similar toasted products Kg. 50 5,050 China P. R. 50 5,050
206 19059020 Potatoes chips Kg. 765 630,945 China P. R. 765 630,945
207 19059090 Bakers wares Kg. 300 3,000 China P. R. 300 3,000
Chapter 20 Preparation of vegetables, fruits, nuts or other parts of plants
4,797,659,592
208 20021000 Tomatoes, whole or in pieces Kg. 1,120 162,324 U.S.A. 1,120 162,324
209 20031000 Mushrooms, prepared or preserved otherwise than by vinegar or acetic acid
Kg. 30 1,174,200
Singapore 30 1,174,200 210 20041000 Potatoes, prepared or preserved otherwise than by
vinegar or acetic acid,frozen Kg. 639 49,475
Hongkong 639 49,475 211 20059100 Bamboo shoots Kg. 750 103,500
China P. R. 750 103,500 212 20060000 Vegetable, fruits, nuts preserved by sugar Kg. 179 775,360
U.S.A. 179 775,360 213 20071000 Homogenised preparations of jams, fruits jellies
(cooked) Kg. 380 30,400
China P. R. 380 30,400 214 20079100 Jams, fruit jellies etc of citrus fruit Kg. 24,380 1,856,402
China P. R. 24,380 1,856,402 215 20086000 Cherries, prepared or preserved, whether or not
containing added sugar or other sweetening matter or spirit
Kg. 300 36,000
China P. R. 300 36,000 216 20089910 Fruit pulp Kg. 42,460 4,166,318
India 42,460 4,166,318 217 20089990 Fruit Mixtures Kg. 328 39,300
China P. R. 328 39,300 218 20091100 Frozen orange juice Ltr 9,562,335 708,031,459
India 9,562,335 708,031,459 219 20092100 Grapefruit (including pomelo) juice, of a Brix value
not exceeding 20 Ltr 1,962,432 132,883,143
India 1,962,432 132,883,143 220 20093900 Juice of any other single citrus fruit Ltr 66,834 11,518,487
China P. R. 66,834 11,518,487 221 20094100 Pineapple juice, of a Brix value not exceeding 20 Ltr 4,951,818 325,506,626
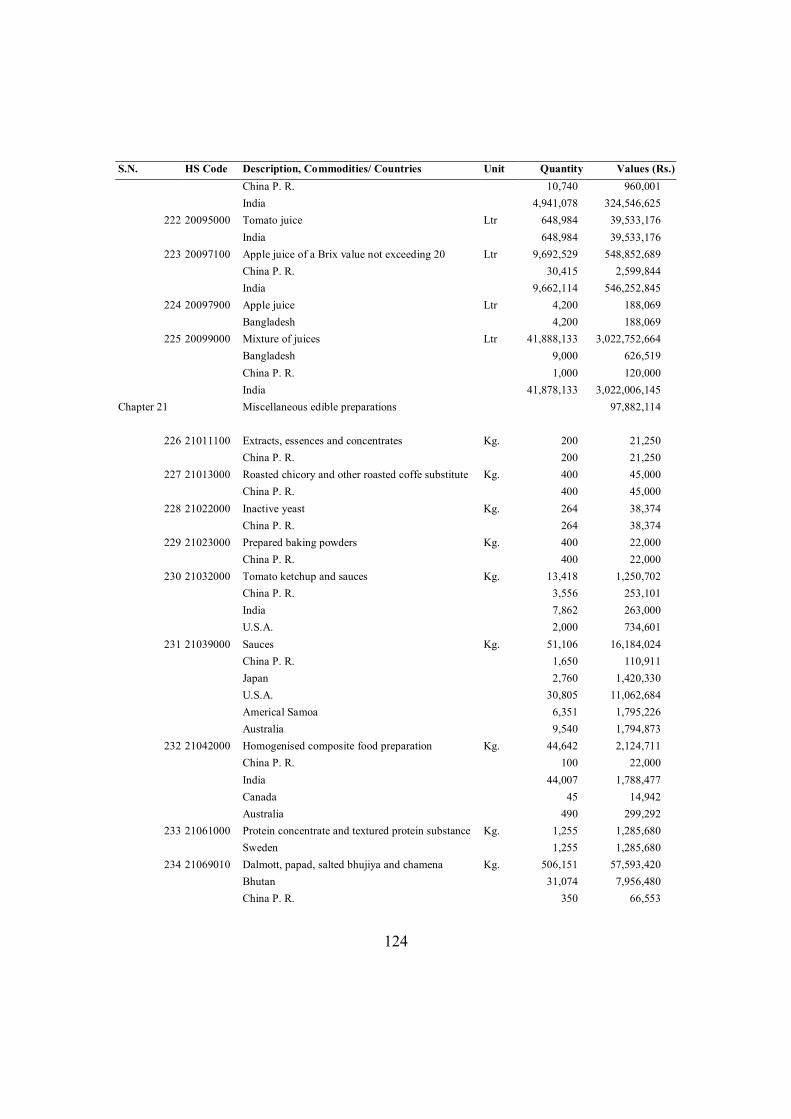
124
S.N. HS Code Description, Commodities/ Countries Unit Quantity Values (Rs.) China P. R. 10,740 960,001 India 4,941,078 324,546,625
222 20095000 Tomato juice Ltr 648,984 39,533,176 India 648,984 39,533,176
223 20097100 Apple juice of a Brix value not exceeding 20 Ltr 9,692,529 548,852,689 China P. R. 30,415 2,599,844 India 9,662,114 546,252,845
224 20097900 Apple juice Ltr 4,200 188,069 Bangladesh 4,200 188,069
225 20099000 Mixture of juices Ltr 41,888,133 3,022,752,664 Bangladesh 9,000 626,519 China P. R. 1,000 120,000 India 41,878,133 3,022,006,145
Chapter 21 Miscellaneous edible preparations 97,882,114
226 21011100 Extracts, essences and concentrates Kg. 200 21,250 China P. R. 200 21,250
227 21013000 Roasted chicory and other roasted coffe substitute Kg. 400 45,000 China P. R. 400 45,000
228 21022000 Inactive yeast Kg. 264 38,374 China P. R. 264 38,374
229 21023000 Prepared baking powders Kg. 400 22,000 China P. R. 400 22,000
230 21032000 Tomato ketchup and sauces Kg. 13,418 1,250,702 China P. R. 3,556 253,101 India 7,862 263,000 U.S.A. 2,000 734,601
231 21039000 Sauces Kg. 51,106 16,184,024 China P. R. 1,650 110,911 Japan 2,760 1,420,330 U.S.A. 30,805 11,062,684 Americal Samoa 6,351 1,795,226 Australia 9,540 1,794,873
232 21042000 Homogenised composite food preparation Kg. 44,642 2,124,711 China P. R. 100 22,000 India 44,007 1,788,477 Canada 45 14,942 Australia 490 299,292
233 21061000 Protein concentrate and textured protein substance Kg. 1,255 1,285,680 Sweden 1,255 1,285,680
234 21069010 Dalmott, papad, salted bhujiya and chamena Kg. 506,151 57,593,420 Bhutan 31,074 7,956,480 China P. R. 350 66,553
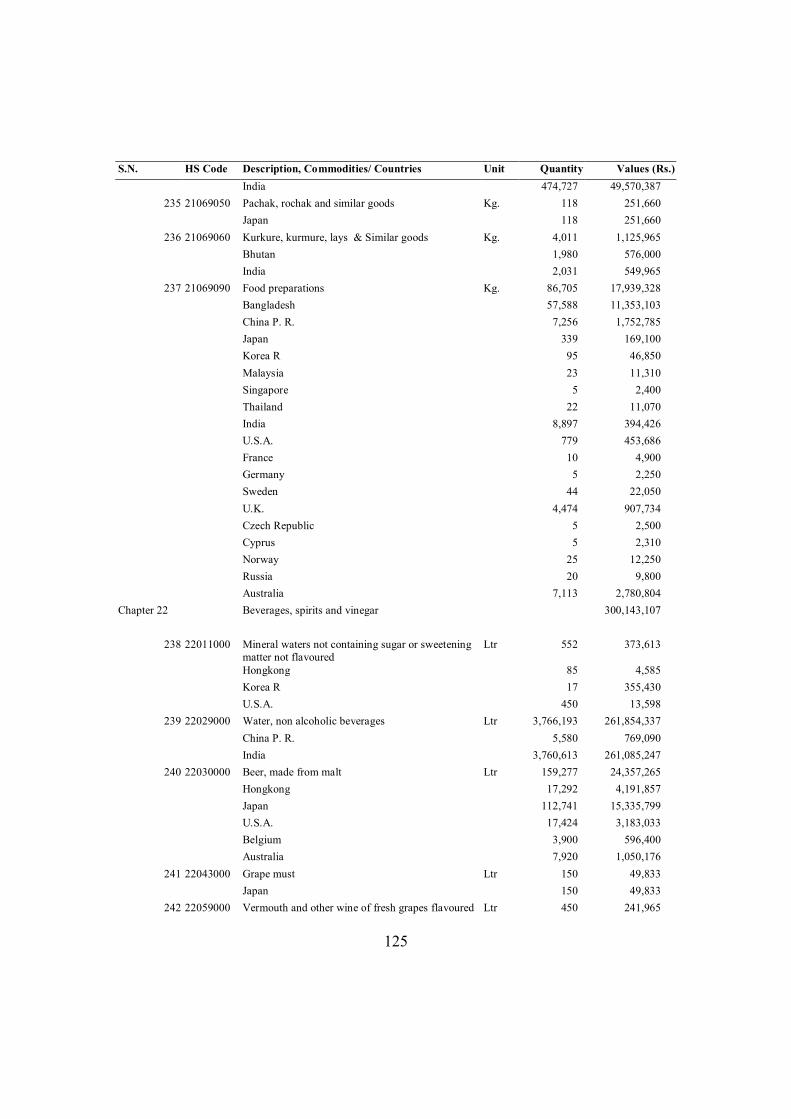
125
S.N. HS Code Description, Commodities/ Countries Unit Quantity Values (Rs.) India 474,727 49,570,387
235 21069050 Pachak, rochak and similar goods Kg. 118 251,660 Japan 118 251,660
236 21069060 Kurkure, kurmure, lays & Similar goods Kg. 4,011 1,125,965 Bhutan 1,980 576,000 India 2,031 549,965
237 21069090 Food preparations Kg. 86,705 17,939,328 Bangladesh 57,588 11,353,103 China P. R. 7,256 1,752,785 Japan 339 169,100 Korea R 95 46,850 Malaysia 23 11,310 Singapore 5 2,400 Thailand 22 11,070 India 8,897 394,426 U.S.A. 779 453,686 France 10 4,900 Germany 5 2,250 Sweden 44 22,050 U.K. 4,474 907,734 Czech Republic 5 2,500 Cyprus 5 2,310 Norway 25 12,250 Russia 20 9,800 Australia 7,113 2,780,804
Chapter 22 Beverages, spirits and vinegar 300,143,107
238 22011000 Mineral waters not containing sugar or sweetening matter not flavoured
Ltr 552 373,613
Hongkong 85 4,585 Korea R 17 355,430 U.S.A. 450 13,598
239 22029000 Water, non alcoholic beverages Ltr 3,766,193 261,854,337 China P. R. 5,580 769,090 India 3,760,613 261,085,247
240 22030000 Beer, made from malt Ltr 159,277 24,357,265 Hongkong 17,292 4,191,857 Japan 112,741 15,335,799 U.S.A. 17,424 3,183,033 Belgium 3,900 596,400 Australia 7,920 1,050,176
241 22043000 Grape must Ltr 150 49,833 Japan 150 49,833
242 22059000 Vermouth and other wine of fresh grapes flavoured Ltr 450 241,965
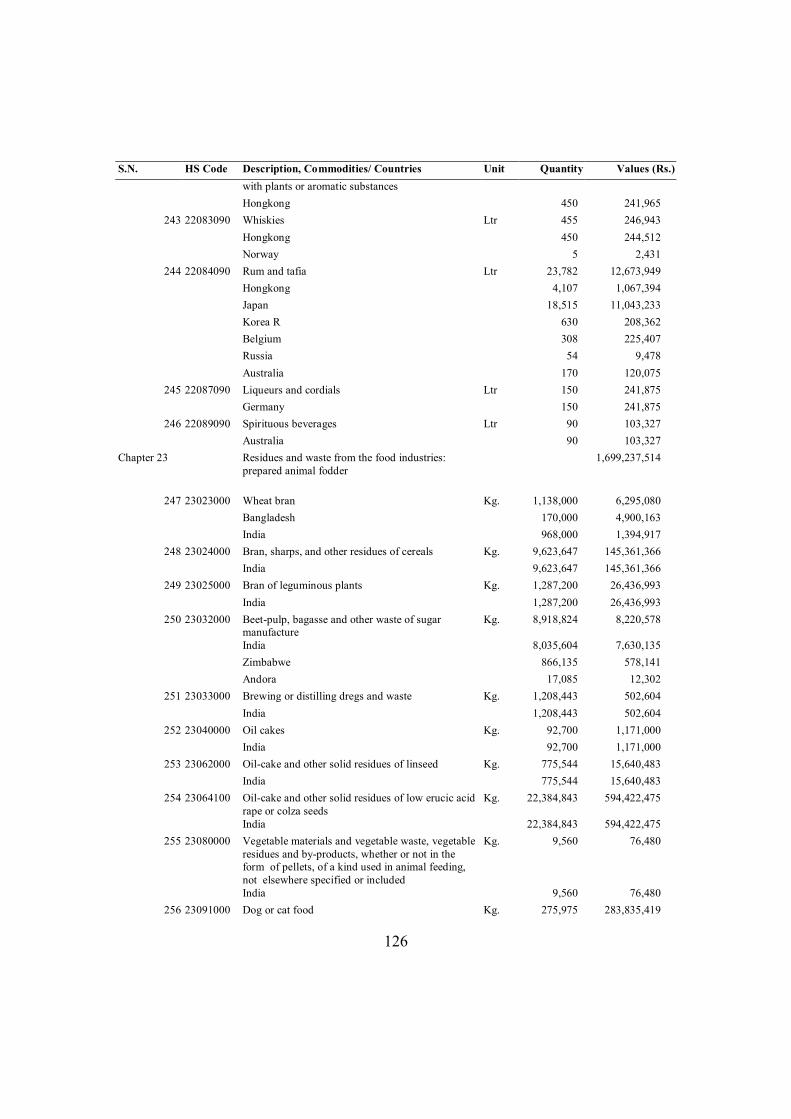
126
S.N. HS Code Description, Commodities/ Countries Unit Quantity Values (Rs.) with plants or aromatic substances Hongkong 450 241,965
243 22083090 Whiskies Ltr 455 246,943 Hongkong 450 244,512 Norway 5 2,431
244 22084090 Rum and tafia Ltr 23,782 12,673,949 Hongkong 4,107 1,067,394 Japan 18,515 11,043,233 Korea R 630 208,362 Belgium 308 225,407 Russia 54 9,478 Australia 170 120,075
245 22087090 Liqueurs and cordials Ltr 150 241,875 Germany 150 241,875
246 22089090 Spirituous beverages Ltr 90 103,327 Australia 90 103,327
Chapter 23 Residues and waste from the food industries: prepared animal fodder
1,699,237,514
247 23023000 Wheat bran Kg. 1,138,000 6,295,080 Bangladesh 170,000 4,900,163 India 968,000 1,394,917
248 23024000 Bran, sharps, and other residues of cereals Kg. 9,623,647 145,361,366 India 9,623,647 145,361,366
249 23025000 Bran of leguminous plants Kg. 1,287,200 26,436,993 India 1,287,200 26,436,993
250 23032000 Beet-pulp, bagasse and other waste of sugar manufacture
Kg. 8,918,824 8,220,578
India 8,035,604 7,630,135 Zimbabwe 866,135 578,141 Andora 17,085 12,302
251 23033000 Brewing or distilling dregs and waste Kg. 1,208,443 502,604 India 1,208,443 502,604
252 23040000 Oil cakes Kg. 92,700 1,171,000 India 92,700 1,171,000
253 23062000 Oil-cake and other solid residues of linseed Kg. 775,544 15,640,483 India 775,544 15,640,483
254 23064100 Oil-cake and other solid residues of low erucic acid rape or colza seeds
Kg. 22,384,843 594,422,475
India 22,384,843 594,422,475 255 23080000 Vegetable materials and vegetable waste, vegetable
residues and by-products, whether or not in the form of pellets, of a kind used in animal feeding, not elsewhere specified or included
Kg. 9,560 76,480
India 9,560 76,480 256 23091000 Dog or cat food Kg. 275,975 283,835,419
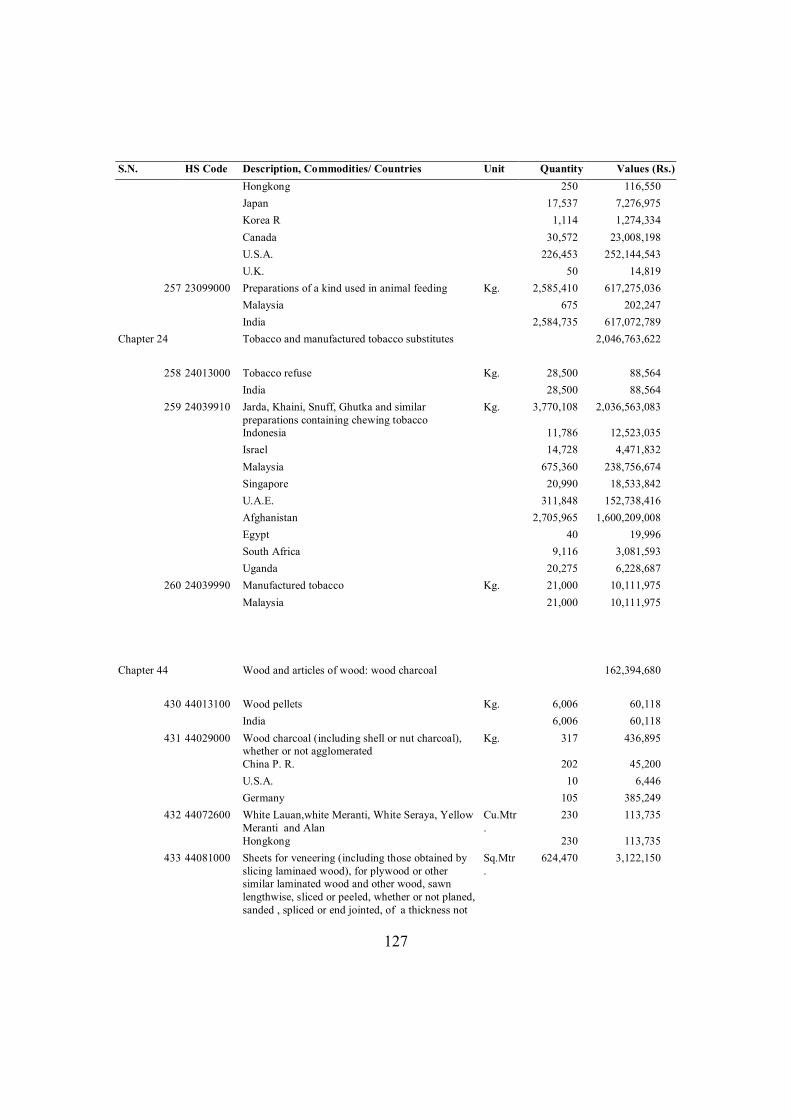
127
S.N. HS Code Description, Commodities/ Countries Unit Quantity Values (Rs.) Hongkong 250 116,550 Japan 17,537 7,276,975 Korea R 1,114 1,274,334 Canada 30,572 23,008,198 U.S.A. 226,453 252,144,543 U.K. 50 14,819
257 23099000 Preparations of a kind used in animal feeding Kg. 2,585,410 617,275,036 Malaysia 675 202,247 India 2,584,735 617,072,789
Chapter 24 Tobacco and manufactured tobacco substitutes 2,046,763,622
258 24013000 Tobacco refuse Kg. 28,500 88,564 India 28,500 88,564
259 24039910 Jarda, Khaini, Snuff, Ghutka and similar preparations containing chewing tobacco
Kg. 3,770,108 2,036,563,083
Indonesia 11,786 12,523,035 Israel 14,728 4,471,832 Malaysia 675,360 238,756,674 Singapore 20,990 18,533,842 U.A.E. 311,848 152,738,416 Afghanistan 2,705,965 1,600,209,008 Egypt 40 19,996 South Africa 9,116 3,081,593 Uganda 20,275 6,228,687
260 24039990 Manufactured tobacco Kg. 21,000 10,111,975 Malaysia 21,000 10,111,975
Chapter 44 Wood and articles of wood: wood charcoal 162,394,680
430 44013100 Wood pellets Kg. 6,006 60,118 India 6,006 60,118
431 44029000 Wood charcoal (including shell or nut charcoal), whether or not agglomerated
Kg. 317 436,895
China P. R. 202 45,200 U.S.A. 10 6,446 Germany 105 385,249
432 44072600 White Lauan,white Meranti, White Seraya, Yellow Meranti and Alan
Cu.Mtr.
230 113,735
Hongkong 230 113,735 433 44081000 Sheets for veneering (including those obtained by
slicing laminaed wood), for plywood or other similar laminated wood and other wood, sawn lengthwise, sliced or peeled, whether or not planed, sanded , spliced or end jointed, of a thickness not
Sq.Mtr.
624,470 3,122,150
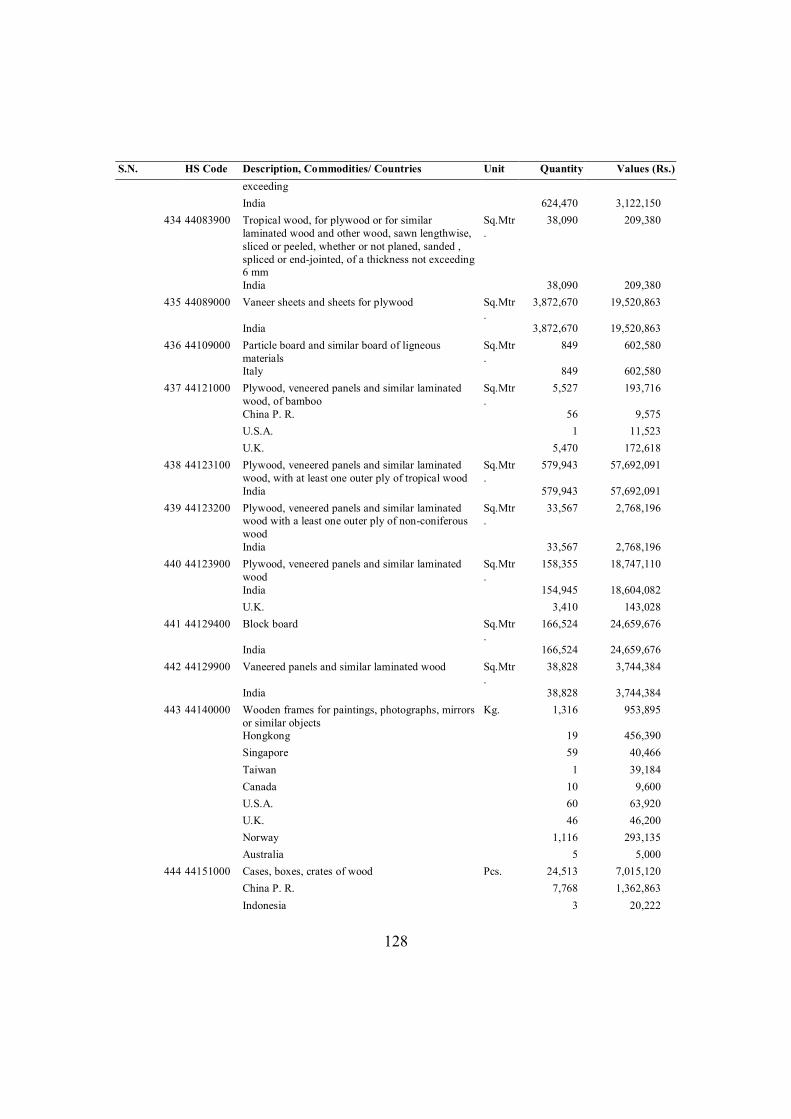
128
S.N. HS Code Description, Commodities/ Countries Unit Quantity Values (Rs.) exceeding
India 624,470 3,122,150 434 44083900 Tropical wood, for plywood or for similar
laminated wood and other wood, sawn lengthwise, sliced or peeled, whether or not planed, sanded , spliced or end-jointed, of a thickness not exceeding 6 mm
Sq.Mtr.
38,090 209,380
India 38,090 209,380 435 44089000 Vaneer sheets and sheets for plywood Sq.Mtr
. 3,872,670 19,520,863
India 3,872,670 19,520,863 436 44109000 Particle board and similar board of ligneous
materials Sq.Mtr.
849 602,580
Italy 849 602,580 437 44121000 Plywood, veneered panels and similar laminated
wood, of bamboo Sq.Mtr.
5,527 193,716
China P. R. 56 9,575 U.S.A. 1 11,523 U.K. 5,470 172,618
438 44123100 Plywood, veneered panels and similar laminated wood, with at least one outer ply of tropical wood
Sq.Mtr.
579,943 57,692,091
India 579,943 57,692,091 439 44123200 Plywood, veneered panels and similar laminated
wood with a least one outer ply of non-coniferous wood
Sq.Mtr.
33,567 2,768,196
India 33,567 2,768,196 440 44123900 Plywood, veneered panels and similar laminated
wood Sq.Mtr.
158,355 18,747,110
India 154,945 18,604,082 U.K. 3,410 143,028
441 44129400 Block board Sq.Mtr.
166,524 24,659,676
India 166,524 24,659,676 442 44129900 Vaneered panels and similar laminated wood Sq.Mtr
. 38,828 3,744,384
India 38,828 3,744,384 443 44140000 Wooden frames for paintings, photographs, mirrors
or similar objects Kg. 1,316 953,895
Hongkong 19 456,390 Singapore 59 40,466 Taiwan 1 39,184 Canada 10 9,600 U.S.A. 60 63,920 U.K. 46 46,200 Norway 1,116 293,135 Australia 5 5,000
444 44151000 Cases, boxes, crates of wood Pcs. 24,513 7,015,120 China P. R. 7,768 1,362,863 Indonesia 3 20,222
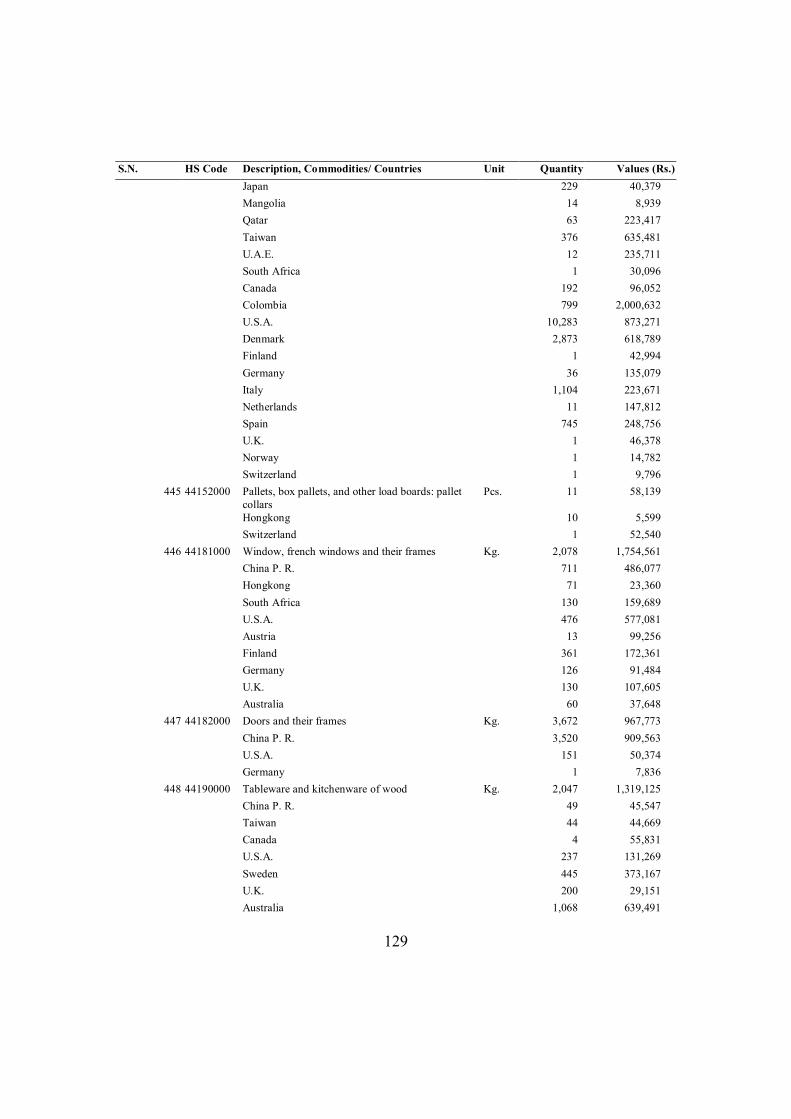
129
S.N. HS Code Description, Commodities/ Countries Unit Quantity Values (Rs.) Japan 229 40,379 Mangolia 14 8,939 Qatar 63 223,417 Taiwan 376 635,481 U.A.E. 12 235,711 South Africa 1 30,096 Canada 192 96,052 Colombia 799 2,000,632 U.S.A. 10,283 873,271 Denmark 2,873 618,789 Finland 1 42,994 Germany 36 135,079 Italy 1,104 223,671 Netherlands 11 147,812 Spain 745 248,756 U.K. 1 46,378 Norway 1 14,782 Switzerland 1 9,796
445 44152000 Pallets, box pallets, and other load boards: pallet collars
Pcs. 11 58,139
Hongkong 10 5,599 Switzerland 1 52,540
446 44181000 Window, french windows and their frames Kg. 2,078 1,754,561 China P. R. 711 486,077 Hongkong 71 23,360 South Africa 130 159,689 U.S.A. 476 577,081 Austria 13 99,256 Finland 361 172,361 Germany 126 91,484 U.K. 130 107,605 Australia 60 37,648
447 44182000 Doors and their frames Kg. 3,672 967,773 China P. R. 3,520 909,563 U.S.A. 151 50,374 Germany 1 7,836
448 44190000 Tableware and kitchenware of wood Kg. 2,047 1,319,125 China P. R. 49 45,547 Taiwan 44 44,669 Canada 4 55,831 U.S.A. 237 131,269 Sweden 445 373,167 U.K. 200 29,151 Australia 1,068 639,491
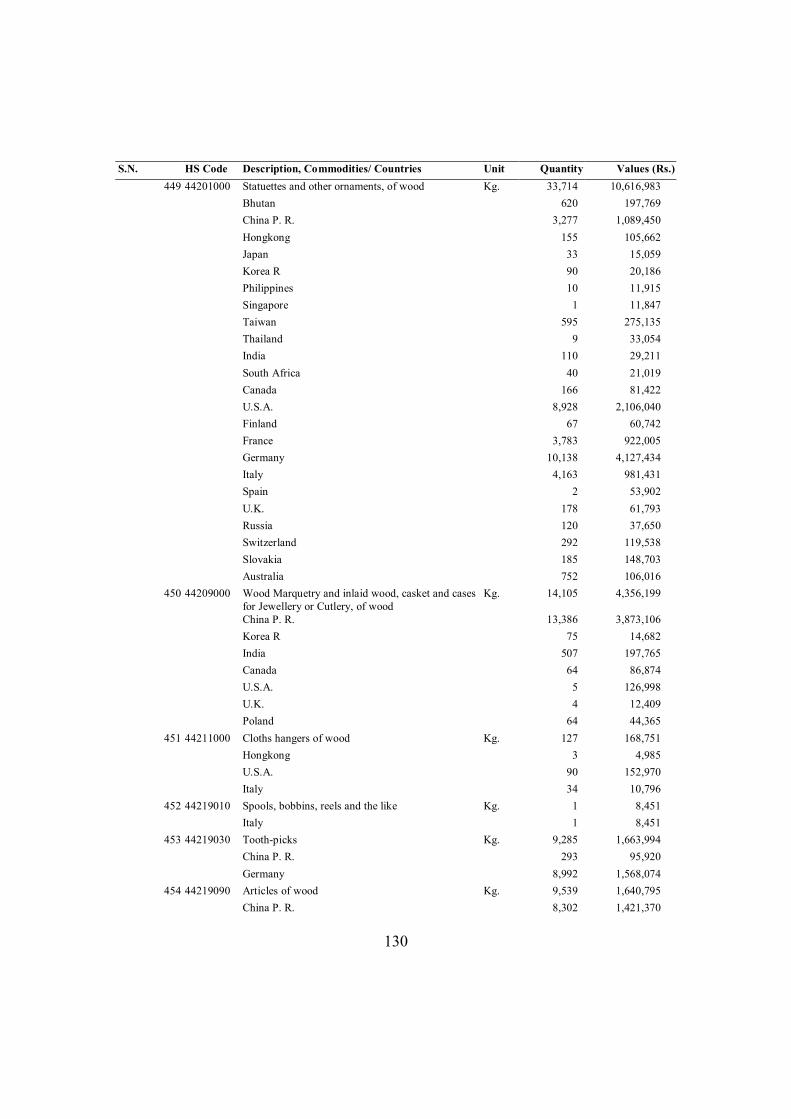
130
S.N. HS Code Description, Commodities/ Countries Unit Quantity Values (Rs.) 449 44201000 Statuettes and other ornaments, of wood Kg. 33,714 10,616,983
Bhutan 620 197,769 China P. R. 3,277 1,089,450 Hongkong 155 105,662 Japan 33 15,059 Korea R 90 20,186 Philippines 10 11,915 Singapore 1 11,847 Taiwan 595 275,135 Thailand 9 33,054 India 110 29,211 South Africa 40 21,019 Canada 166 81,422 U.S.A. 8,928 2,106,040 Finland 67 60,742 France 3,783 922,005 Germany 10,138 4,127,434 Italy 4,163 981,431 Spain 2 53,902 U.K. 178 61,793 Russia 120 37,650 Switzerland 292 119,538 Slovakia 185 148,703 Australia 752 106,016
450 44209000 Wood Marquetry and inlaid wood, casket and cases for Jewellery or Cutlery, of wood
Kg. 14,105 4,356,199
China P. R. 13,386 3,873,106 Korea R 75 14,682 India 507 197,765 Canada 64 86,874 U.S.A. 5 126,998 U.K. 4 12,409 Poland 64 44,365
451 44211000 Cloths hangers of wood Kg. 127 168,751 Hongkong 3 4,985 U.S.A. 90 152,970 Italy 34 10,796
452 44219010 Spools, bobbins, reels and the like Kg. 1 8,451 Italy 1 8,451
453 44219030 Tooth-picks Kg. 9,285 1,663,994 China P. R. 293 95,920 Germany 8,992 1,568,074
454 44219090 Articles of wood Kg. 9,539 1,640,795 China P. R. 8,302 1,421,370
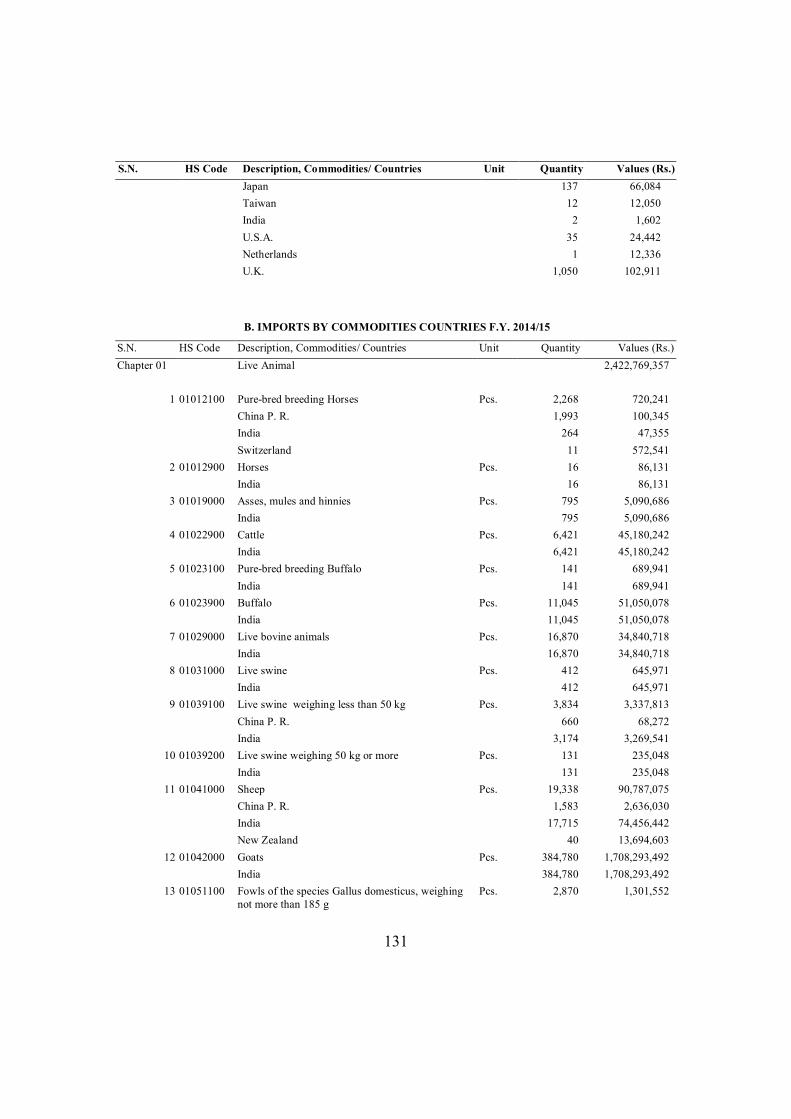
131
S.N. HS Code Description, Commodities/ Countries Unit Quantity Values (Rs.) Japan 137 66,084 Taiwan 12 12,050 India 2 1,602 U.S.A. 35 24,442 Netherlands 1 12,336 U.K. 1,050 102,911
B. IMPORTS BY COMMODITIES COUNTRIES F.Y. 2014/15
S.N. HS Code Description, Commodities/ Countries Unit Quantity Values (Rs.) Chapter 01 Live Animal 2,422,769,357
1 01012100 Pure-bred breeding Horses Pcs. 2,268 720,241 China P. R. 1,993 100,345 India 264 47,355 Switzerland 11 572,541
2 01012900 Horses Pcs. 16 86,131 India 16 86,131
3 01019000 Asses, mules and hinnies Pcs. 795 5,090,686 India 795 5,090,686
4 01022900 Cattle Pcs. 6,421 45,180,242 India 6,421 45,180,242
5 01023100 Pure-bred breeding Buffalo Pcs. 141 689,941 India 141 689,941
6 01023900 Buffalo Pcs. 11,045 51,050,078 India 11,045 51,050,078
7 01029000 Live bovine animals Pcs. 16,870 34,840,718 India 16,870 34,840,718
8 01031000 Live swine Pcs. 412 645,971 India 412 645,971
9 01039100 Live swine weighing less than 50 kg Pcs. 3,834 3,337,813 China P. R. 660 68,272 India 3,174 3,269,541
10 01039200 Live swine weighing 50 kg or more Pcs. 131 235,048 India 131 235,048
11 01041000 Sheep Pcs. 19,338 90,787,075 China P. R. 1,583 2,636,030 India 17,715 74,456,442 New Zealand 40 13,694,603
12 01042000 Goats Pcs. 384,780 1,708,293,492 India 384,780 1,708,293,492
13 01051100 Fowls of the species Gallus domesticus, weighing not more than 185 g
Pcs. 2,870 1,301,552
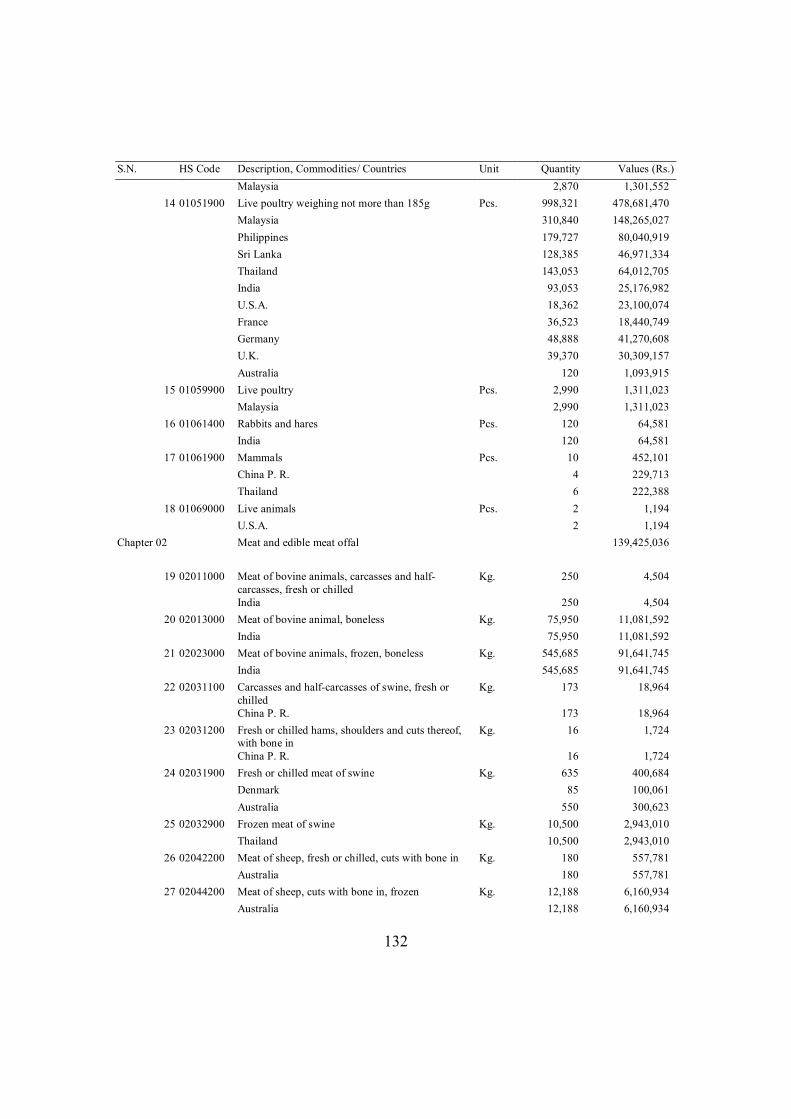
132
S.N. HS Code Description, Commodities/ Countries Unit Quantity Values (Rs.) Malaysia 2,870 1,301,552
14 01051900 Live poultry weighing not more than 185g Pcs. 998,321 478,681,470 Malaysia 310,840 148,265,027 Philippines 179,727 80,040,919 Sri Lanka 128,385 46,971,334 Thailand 143,053 64,012,705 India 93,053 25,176,982 U.S.A. 18,362 23,100,074 France 36,523 18,440,749 Germany 48,888 41,270,608 U.K. 39,370 30,309,157 Australia 120 1,093,915
15 01059900 Live poultry Pcs. 2,990 1,311,023 Malaysia 2,990 1,311,023
16 01061400 Rabbits and hares Pcs. 120 64,581 India 120 64,581
17 01061900 Mammals Pcs. 10 452,101 China P. R. 4 229,713 Thailand 6 222,388
18 01069000 Live animals Pcs. 2 1,194 U.S.A. 2 1,194
Chapter 02 Meat and edible meat offal 139,425,036
19 02011000 Meat of bovine animals, carcasses and half-carcasses, fresh or chilled
Kg. 250 4,504
India 250 4,504 20 02013000 Meat of bovine animal, boneless Kg. 75,950 11,081,592
India 75,950 11,081,592 21 02023000 Meat of bovine animals, frozen, boneless Kg. 545,685 91,641,745
India 545,685 91,641,745 22 02031100 Carcasses and half-carcasses of swine, fresh or
chilled Kg. 173 18,964
China P. R. 173 18,964 23 02031200 Fresh or chilled hams, shoulders and cuts thereof,
with bone in Kg. 16 1,724
China P. R. 16 1,724 24 02031900 Fresh or chilled meat of swine Kg. 635 400,684
Denmark 85 100,061 Australia 550 300,623
25 02032900 Frozen meat of swine Kg. 10,500 2,943,010 Thailand 10,500 2,943,010
26 02042200 Meat of sheep, fresh or chilled, cuts with bone in Kg. 180 557,781 Australia 180 557,781
27 02044200 Meat of sheep, cuts with bone in, frozen Kg. 12,188 6,160,934 Australia 12,188 6,160,934
133
S.N. HS Code Description, Commodities/ Countries Unit Quantity Values (Rs.) 28 02044300 Meat of sheep caracasses and half-caracasses,
boneless, frozen Kg. 1,009 419,416
Australia 1,009 419,416 29 02045000 Meat of goats Kg. 5,405 1,997,272
India 5,405 1,997,272 30 02050000 Meat of horses,asses, mules or hinnies, resh, chilled
or frozen Kg. 6 3,967
U.K. 6 3,967 31 02062900 Edible offal of bovine animals Kg. 200 138,805
China P. R. 200 138,805 32 02063000 Edible offal of swine, fresh or chilled Kg. 80 161,269
Spain 80 161,269 33 02071400 Cuts and offal, frozen, of fowls of the species
Gallus domesticus Kg. 41,800 19,333,639
Thailand 41,800 19,333,639 34 02072500 Meat of turkey Not cut in pieces, frozen Kg. 1,200 712,254
Thailand 1,200 712,254 35 02074400 Meat and Edible Offal of ducks, fresh or chilled Kg. 1,500 863,659
Thailand 1,500 863,659 36 02074500 Ducks, fresh or chilled Kg. 4,420 2,575,080
Singapore 100 138,036 Thailand 4,320 2,437,044
37 02101100 Hams, shoulders and cuts of swine with bone in Kg. 37 207,234 Italy 37 207,234
38 02101200 Bellies (streaky) and cuts thereof Kg. 18 14,388 Italy 18 14,388
39 02101900 Meat of swine Kg. 212 134,151 China P. R. 180 47,519 Italy 32 86,632
40 02102000 Meat Kg. 13 20,481 Italy 13 20,481
41 02109200 Meat and edible meat offal, salted, in brine, dried or smoked of whales, dolphins and porpoises (mammals of the order Cetacea); of manatees and dugongs (mammals of the order Sirenia); of seals, sea lions and walruses
Kg. 12 32,483
Italy 12 32,483 Chapter 03 Fish and crustaceans, molluscs and other acquatic
invertebrates 1,153,079,085
42 03011100 Ornamental fish, Freshwater Kg. 164,717 17,822,826 India 164,717 17,822,826
43 03011900 Ornamental fish Kg. 1,226,704 131,199,058 Thailand 10,311 92,716 India 1,216,393 131,106,342
44 03019200 Eels (Anguilla spp.) Kg. 16 1,723
134
S.N. HS Code Description, Commodities/ Countries Unit Quantity Values (Rs.) India 16 1,723
45 03019400 Atlantic and Pacific bluefin tunas (Thunnus thynnus, Thunnus orientalis)
Kg. 2 2,494
Korea R 2 2,494 46 03019900 Live fish Kg. 6,685,938 617,290,769
India 6,685,938 617,290,769 47 03021400 Atlantic salmon (Salmo salar) and Danube salmon
(Hucho hucho) Kg. 1,900 204,481
India 1,900 204,481 48 03021900 Salmonidae, excluding livers and roes Kg. 1,523,103 164,051,373
Thailand 73 35,828 India 1,523,030 164,015,545
49 03023300 Skipjack or stripe-bellied bonito Kg. 70 7,563 India 70 7,563
50 03023900 Tunas Kg. 1,250 134,528 India 1,250 134,528
51 03025900 Gadidae, Macrouridae,Melanonidae, Merlucciidae , Moridae and Muraenolepididae, excluding livers and roes
Kg. 46,000 6,491,786
India 46,000 6,491,786 52 03027900 Nile perch (Lates niloticus) and snakeheads
(Channa spp.), Kg. 25 6,401
China P. R. 25 6,401 53 03031900 Salmonidae, excluding livers and roes Kg. 327 61,552
Thailand 67 32,569 India 260 28,983
54 03032900 Frozen fish, salmonidae Kg. 5,500 3,493,919 Thailand 1,100 643,720 Norway 4,400 2,850,199
55 03033900 Flat fish (Pleuronectidae, Bothidae, Cynoglossidae, Soleidae, Scophthalmidae and Citharidae), excluding livers and roes
Kg. 23,850 5,143,446
Vietnam 23,850 5,143,446 56 03034900 Tunas (of the genus Thunnus) Kg. 807 533,706
Thailand 807 533,706 57 03043200 Catfish (Pangasius spp., Silurus spp., Clarias spp.,
Ictalurus spp.) Kg. 25,800 6,491,906
Thailand 800 199,700 Vietnam 25,000 6,292,206
58 03044900 Fresh or chilled fillets of other fish Kg. 90 312,852 Chile 90 312,852
59 03045900 Fish fillets and other fish meat, fresh or chilled Kg. 319,258 49,958,762 Hongkong 10 1,270 Vietnam 145,044 30,267,071 India 174,204 19,690,421
60 03046200 Catfish (Pangasius spp., Silurus spp., Clarias spp., Ictalurus spp.)
Kg. 182,000 37,779,034
135
S.N. HS Code Description, Commodities/ Countries Unit Quantity Values (Rs.) China P. R. 24,000 4,608,663 Vietnam 158,000 33,170,371
61 03049900 Fish fillets and other fish meat (whether or not minced), fresh, chilled or frozen
Kg. 45,130 7,182,602
Vietnam 24,500 4,971,348 India 20,630 2,211,254
62 03051000 Flours, meals and pellets of fish, fit for human consumption
Kg. 15,280 2,573,162
China P. R. 2,534 290,162 India 12,746 2,283,000
63 03054900 Smoked fish, including fillets Kg. 140 462,204 Chile 60 166,290 Norway 80 295,914
64 03055900 Dried fish, not smoked Kg. 948,413 97,118,690 Brunei 20 12,393 China P. R. 4 1,229 Japan 60 39,672 Korea R 4 6,235 Singapore 900 537,500 Thailand 2,500 957,407 India 944,215 95,314,071 Norway 710 250,183
65 03056300 Anchovies Kg. 9,100 2,302,822 Vietnam 9,100 2,302,822
66 03061100 Rocklobster and other sea craw fish (Palinurus spp.,Panulirus spp., Jasus spp.)
Kg. 267 105,520
Norway 267 105,520 67 03061400 Crabs Kg. 80 172,545
China P. R. 80 172,545 68 03062700 Shrimps and prawn, not frozen Kg. 7,895 1,553,912
India 7,895 1,553,912 69 03071900 Oysters Kg. 50 36,413
India 50 36,413 70 03072900 Scallops, including queen scallops, of the genera
pecten Chlamys or Placopecten Kg. 95 336,541
U.S.A. 95 336,541 71 03073900 Mussels (Mytilus spp., perna spp.) Kg. 110 91,147
China P. R. 110 91,147 72 03075900 Octopus Kg. 11 5,480
Thailand 11 5,480 73 03079900 Flours, meals and pellets of aquatic invertebrates
other than crustaceans, fit for human consumption Kg. 202 149,868
Thailand 2 1,542 India 200 148,326
Chapter 04 Dairy produce: birds` eggs: natural honey: edible products of animal origin, not elsewhere specified
2,159,520,287
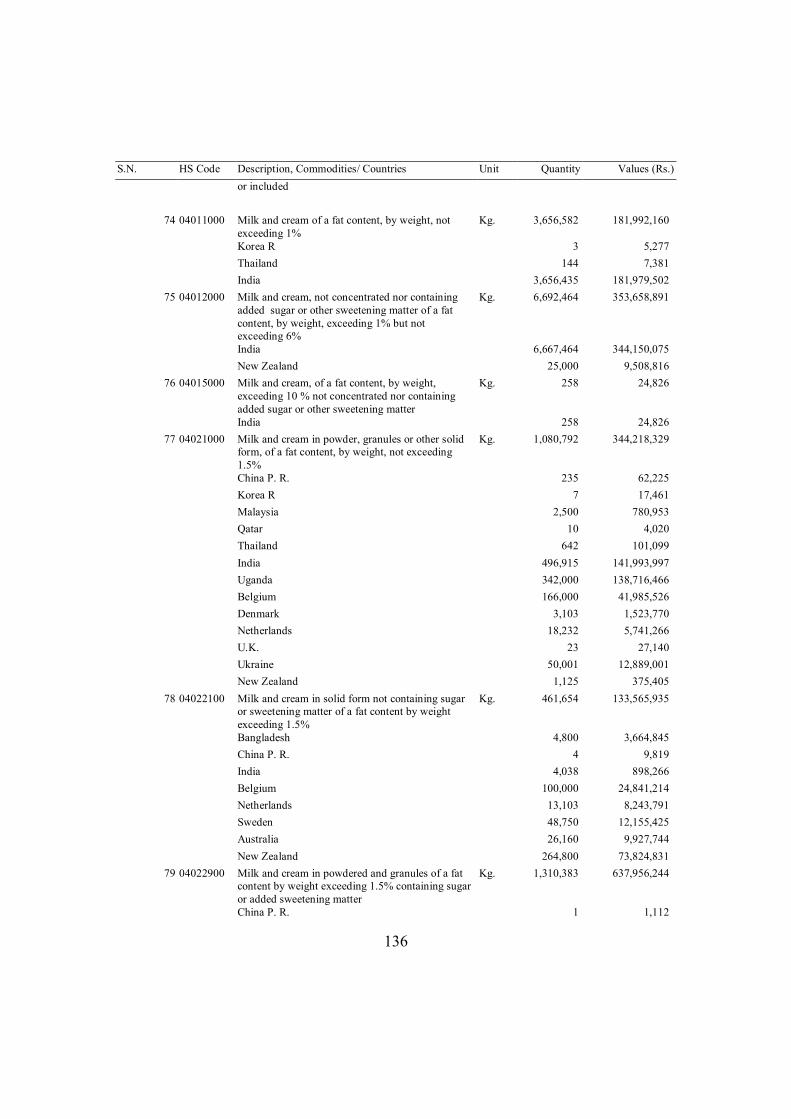
136
S.N. HS Code Description, Commodities/ Countries Unit Quantity Values (Rs.) or included
74 04011000 Milk and cream of a fat content, by weight, not exceeding 1%
Kg. 3,656,582 181,992,160
Korea R 3 5,277 Thailand 144 7,381 India 3,656,435 181,979,502
75 04012000 Milk and cream, not concentrated nor containing added sugar or other sweetening matter of a fat content, by weight, exceeding 1% but not exceeding 6%
Kg. 6,692,464 353,658,891
India 6,667,464 344,150,075 New Zealand 25,000 9,508,816
76 04015000 Milk and cream, of a fat content, by weight, exceeding 10 % not concentrated nor containing added sugar or other sweetening matter
Kg. 258 24,826
India 258 24,826 77 04021000 Milk and cream in powder, granules or other solid
form, of a fat content, by weight, not exceeding 1.5%
Kg. 1,080,792 344,218,329
China P. R. 235 62,225 Korea R 7 17,461 Malaysia 2,500 780,953 Qatar 10 4,020 Thailand 642 101,099 India 496,915 141,993,997 Uganda 342,000 138,716,466 Belgium 166,000 41,985,526 Denmark 3,103 1,523,770 Netherlands 18,232 5,741,266 U.K. 23 27,140 Ukraine 50,001 12,889,001 New Zealand 1,125 375,405
78 04022100 Milk and cream in solid form not containing sugar or sweetening matter of a fat content by weight exceeding 1.5%
Kg. 461,654 133,565,935
Bangladesh 4,800 3,664,845 China P. R. 4 9,819 India 4,038 898,266 Belgium 100,000 24,841,214 Netherlands 13,103 8,243,791 Sweden 48,750 12,155,425 Australia 26,160 9,927,744 New Zealand 264,800 73,824,831
79 04022900 Milk and cream in powdered and granules of a fat content by weight exceeding 1.5% containing sugar or added sweetening matter
Kg. 1,310,383 637,956,244
China P. R. 1 1,112
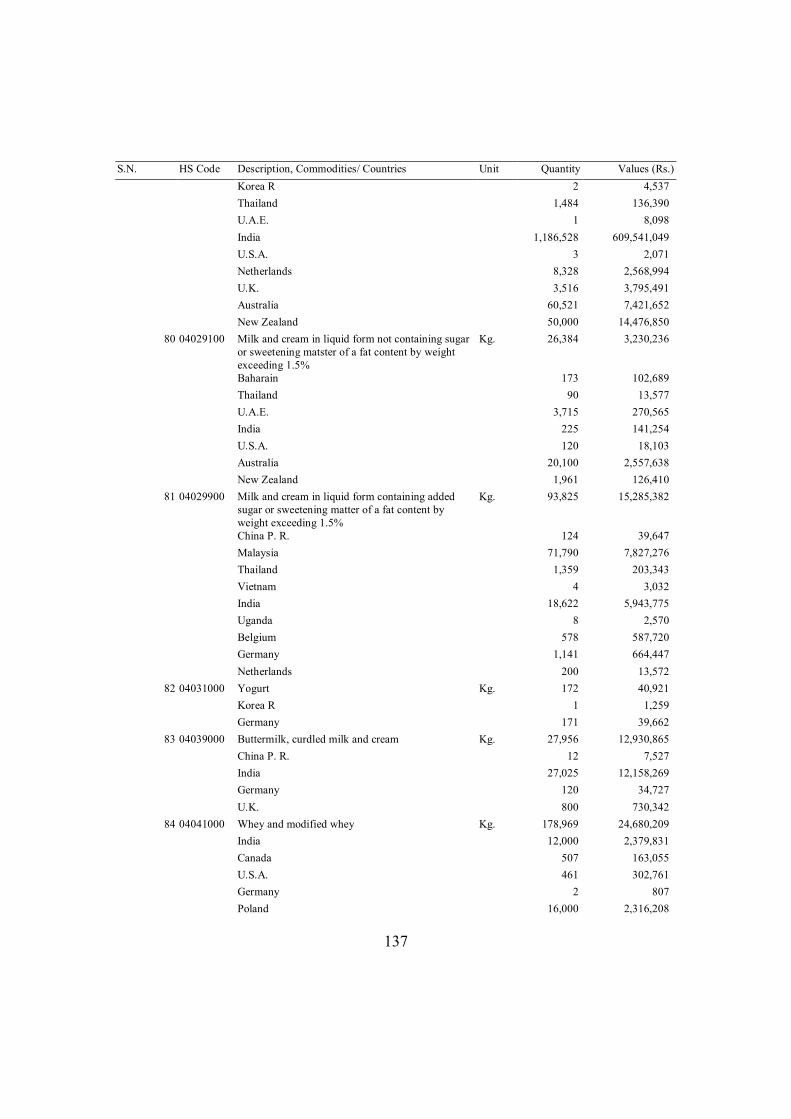
137
S.N. HS Code Description, Commodities/ Countries Unit Quantity Values (Rs.) Korea R 2 4,537 Thailand 1,484 136,390 U.A.E. 1 8,098 India 1,186,528 609,541,049 U.S.A. 3 2,071 Netherlands 8,328 2,568,994 U.K. 3,516 3,795,491 Australia 60,521 7,421,652 New Zealand 50,000 14,476,850
80 04029100 Milk and cream in liquid form not containing sugar or sweetening matster of a fat content by weight exceeding 1.5%
Kg. 26,384 3,230,236
Baharain 173 102,689 Thailand 90 13,577 U.A.E. 3,715 270,565 India 225 141,254 U.S.A. 120 18,103 Australia 20,100 2,557,638 New Zealand 1,961 126,410
81 04029900 Milk and cream in liquid form containing added sugar or sweetening matter of a fat content by weight exceeding 1.5%
Kg. 93,825 15,285,382
China P. R. 124 39,647 Malaysia 71,790 7,827,276 Thailand 1,359 203,343 Vietnam 4 3,032 India 18,622 5,943,775 Uganda 8 2,570 Belgium 578 587,720 Germany 1,141 664,447 Netherlands 200 13,572
82 04031000 Yogurt Kg. 172 40,921 Korea R 1 1,259 Germany 171 39,662
83 04039000 Buttermilk, curdled milk and cream Kg. 27,956 12,930,865 China P. R. 12 7,527 India 27,025 12,158,269 Germany 120 34,727 U.K. 800 730,342
84 04041000 Whey and modified whey Kg. 178,969 24,680,209 India 12,000 2,379,831 Canada 507 163,055 U.S.A. 461 302,761 Germany 2 807 Poland 16,000 2,316,208
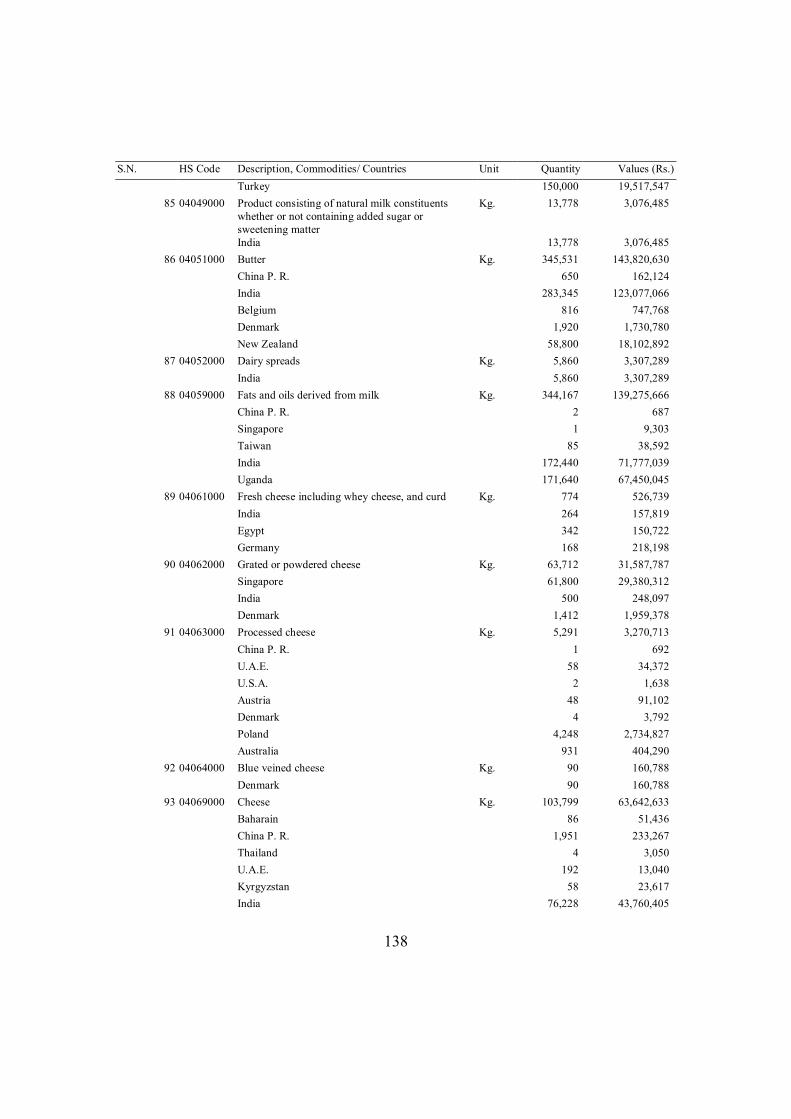
138
S.N. HS Code Description, Commodities/ Countries Unit Quantity Values (Rs.) Turkey 150,000 19,517,547
85 04049000 Product consisting of natural milk constituents whether or not containing added sugar or sweetening matter
Kg. 13,778 3,076,485
India 13,778 3,076,485 86 04051000 Butter Kg. 345,531 143,820,630
China P. R. 650 162,124 India 283,345 123,077,066 Belgium 816 747,768 Denmark 1,920 1,730,780 New Zealand 58,800 18,102,892
87 04052000 Dairy spreads Kg. 5,860 3,307,289 India 5,860 3,307,289
88 04059000 Fats and oils derived from milk Kg. 344,167 139,275,666 China P. R. 2 687 Singapore 1 9,303 Taiwan 85 38,592 India 172,440 71,777,039 Uganda 171,640 67,450,045
89 04061000 Fresh cheese including whey cheese, and curd Kg. 774 526,739 India 264 157,819 Egypt 342 150,722 Germany 168 218,198
90 04062000 Grated or powdered cheese Kg. 63,712 31,587,787 Singapore 61,800 29,380,312 India 500 248,097 Denmark 1,412 1,959,378
91 04063000 Processed cheese Kg. 5,291 3,270,713 China P. R. 1 692 U.A.E. 58 34,372 U.S.A. 2 1,638 Austria 48 91,102 Denmark 4 3,792 Poland 4,248 2,734,827 Australia 931 404,290
92 04064000 Blue veined cheese Kg. 90 160,788 Denmark 90 160,788
93 04069000 Cheese Kg. 103,799 63,642,633 Baharain 86 51,436 China P. R. 1,951 233,267 Thailand 4 3,050 U.A.E. 192 13,040 Kyrgyzstan 58 23,617 India 76,228 43,760,405
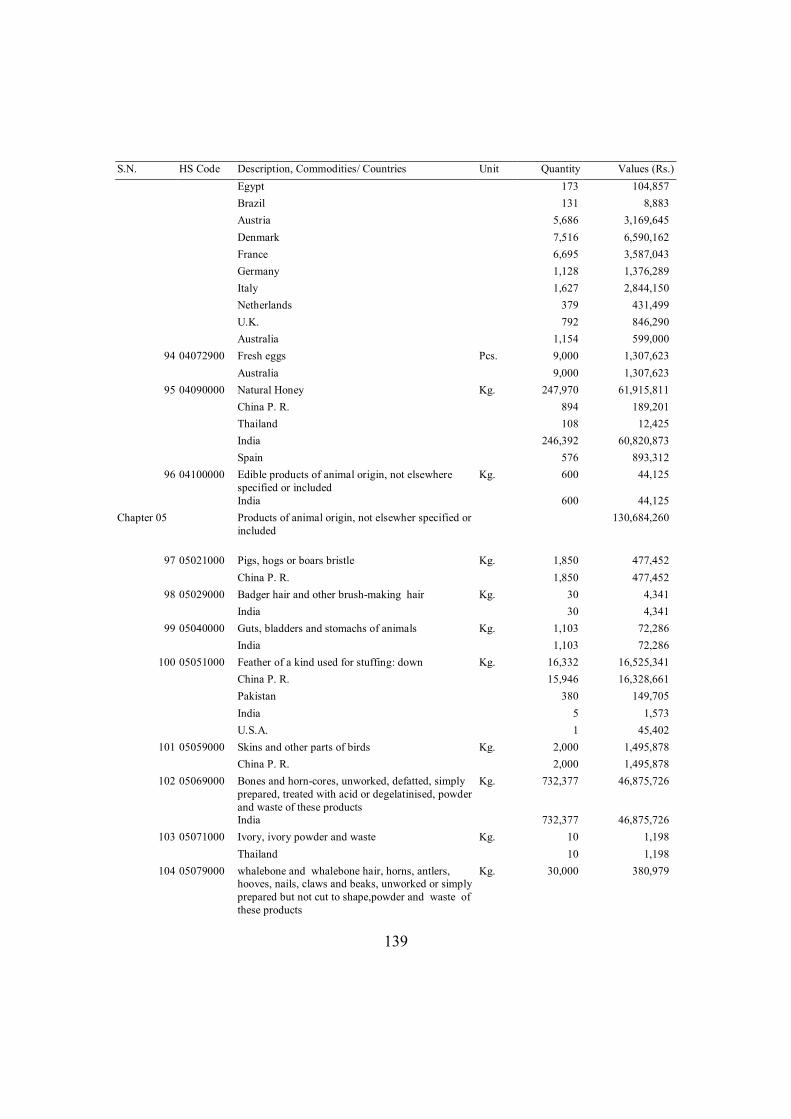
139
S.N. HS Code Description, Commodities/ Countries Unit Quantity Values (Rs.) Egypt 173 104,857 Brazil 131 8,883 Austria 5,686 3,169,645 Denmark 7,516 6,590,162 France 6,695 3,587,043 Germany 1,128 1,376,289 Italy 1,627 2,844,150 Netherlands 379 431,499 U.K. 792 846,290 Australia 1,154 599,000
94 04072900 Fresh eggs Pcs. 9,000 1,307,623 Australia 9,000 1,307,623
95 04090000 Natural Honey Kg. 247,970 61,915,811 China P. R. 894 189,201 Thailand 108 12,425 India 246,392 60,820,873 Spain 576 893,312
96 04100000 Edible products of animal origin, not elsewhere specified or included
Kg. 600 44,125
India 600 44,125 Chapter 05 Products of animal origin, not elsewher specified or
included 130,684,260
97 05021000 Pigs, hogs or boars bristle Kg. 1,850 477,452 China P. R. 1,850 477,452
98 05029000 Badger hair and other brush-making hair Kg. 30 4,341 India 30 4,341
99 05040000 Guts, bladders and stomachs of animals Kg. 1,103 72,286 India 1,103 72,286
100 05051000 Feather of a kind used for stuffing: down Kg. 16,332 16,525,341 China P. R. 15,946 16,328,661 Pakistan 380 149,705 India 5 1,573 U.S.A. 1 45,402
101 05059000 Skins and other parts of birds Kg. 2,000 1,495,878 China P. R. 2,000 1,495,878
102 05069000 Bones and horn-cores, unworked, defatted, simply prepared, treated with acid or degelatinised, powder and waste of these products
Kg. 732,377 46,875,726
India 732,377 46,875,726 103 05071000 Ivory, ivory powder and waste Kg. 10 1,198
Thailand 10 1,198 104 05079000 whalebone and whalebone hair, horns, antlers,
hooves, nails, claws and beaks, unworked or simply prepared but not cut to shape,powder and waste of these products
Kg. 30,000 380,979
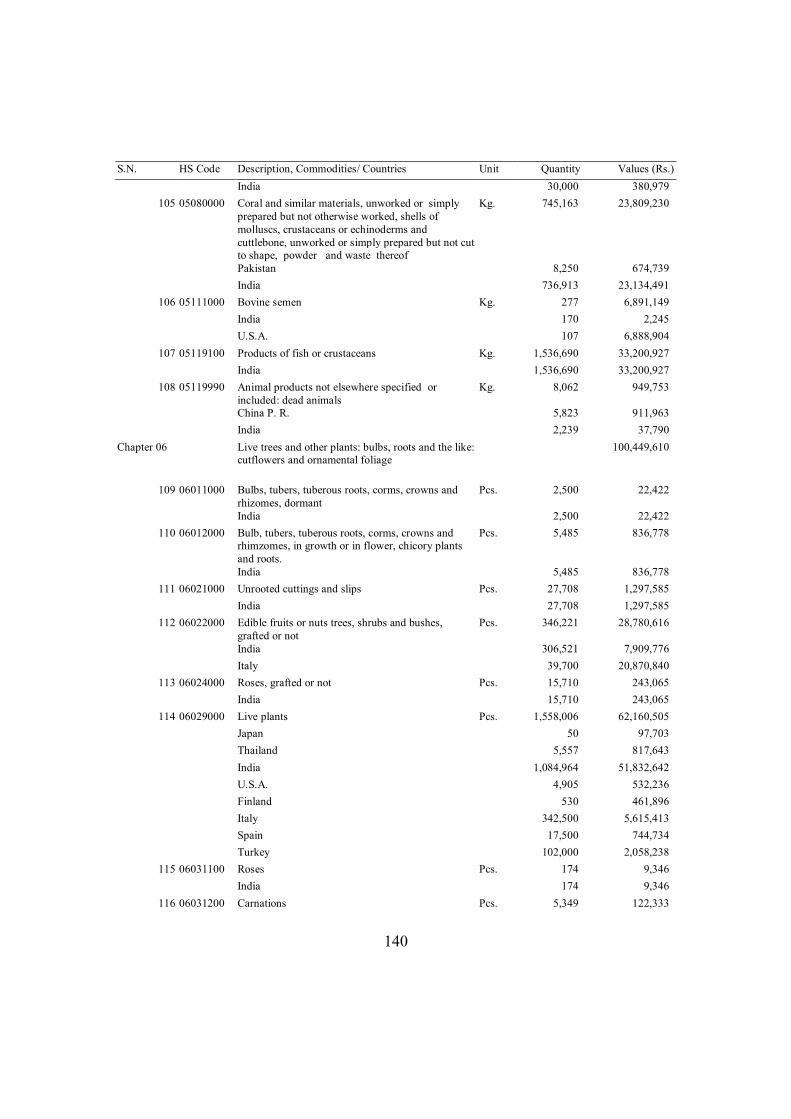
140
S.N. HS Code Description, Commodities/ Countries Unit Quantity Values (Rs.) India 30,000 380,979
105 05080000 Coral and similar materials, unworked or simply prepared but not otherwise worked, shells of molluscs, crustaceans or echinoderms and cuttlebone, unworked or simply prepared but not cut to shape, powder and waste thereof
Kg. 745,163 23,809,230
Pakistan 8,250 674,739 India 736,913 23,134,491
106 05111000 Bovine semen Kg. 277 6,891,149 India 170 2,245 U.S.A. 107 6,888,904
107 05119100 Products of fish or crustaceans Kg. 1,536,690 33,200,927 India 1,536,690 33,200,927
108 05119990 Animal products not elsewhere specified or included: dead animals
Kg. 8,062 949,753
China P. R. 5,823 911,963 India 2,239 37,790
Chapter 06 Live trees and other plants: bulbs, roots and the like: cutflowers and ornamental foliage
100,449,610
109 06011000 Bulbs, tubers, tuberous roots, corms, crowns and rhizomes, dormant
Pcs. 2,500 22,422
India 2,500 22,422 110 06012000 Bulb, tubers, tuberous roots, corms, crowns and
rhimzomes, in growth or in flower, chicory plants and roots.
Pcs. 5,485 836,778
India 5,485 836,778 111 06021000 Unrooted cuttings and slips Pcs. 27,708 1,297,585
India 27,708 1,297,585 112 06022000 Edible fruits or nuts trees, shrubs and bushes,
grafted or not Pcs. 346,221 28,780,616
India 306,521 7,909,776 Italy 39,700 20,870,840
113 06024000 Roses, grafted or not Pcs. 15,710 243,065 India 15,710 243,065
114 06029000 Live plants Pcs. 1,558,006 62,160,505 Japan 50 97,703 Thailand 5,557 817,643 India 1,084,964 51,832,642 U.S.A. 4,905 532,236 Finland 530 461,896 Italy 342,500 5,615,413 Spain 17,500 744,734 Turkey 102,000 2,058,238
115 06031100 Roses Pcs. 174 9,346 India 174 9,346
116 06031200 Carnations Pcs. 5,349 122,333
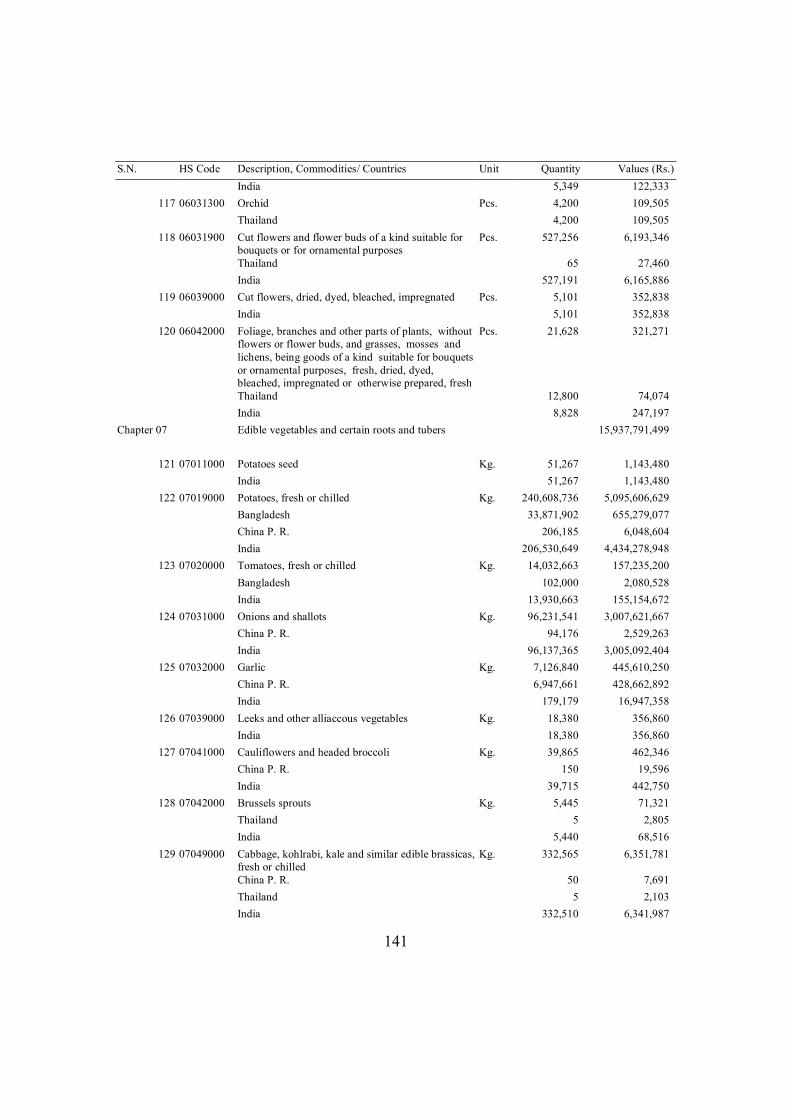
141
S.N. HS Code Description, Commodities/ Countries Unit Quantity Values (Rs.) India 5,349 122,333
117 06031300 Orchid Pcs. 4,200 109,505 Thailand 4,200 109,505
118 06031900 Cut flowers and flower buds of a kind suitable for bouquets or for ornamental purposes
Pcs. 527,256 6,193,346
Thailand 65 27,460 India 527,191 6,165,886
119 06039000 Cut flowers, dried, dyed, bleached, impregnated Pcs. 5,101 352,838 India 5,101 352,838
120 06042000 Foliage, branches and other parts of plants, without flowers or flower buds, and grasses, mosses and lichens, being goods of a kind suitable for bouquets or ornamental purposes, fresh, dried, dyed, bleached, impregnated or otherwise prepared, fresh
Pcs. 21,628 321,271
Thailand 12,800 74,074 India 8,828 247,197
Chapter 07 Edible vegetables and certain roots and tubers 15,937,791,499
121 07011000 Potatoes seed Kg. 51,267 1,143,480 India 51,267 1,143,480
122 07019000 Potatoes, fresh or chilled Kg. 240,608,736 5,095,606,629 Bangladesh 33,871,902 655,279,077 China P. R. 206,185 6,048,604 India 206,530,649 4,434,278,948
123 07020000 Tomatoes, fresh or chilled Kg. 14,032,663 157,235,200 Bangladesh 102,000 2,080,528 India 13,930,663 155,154,672
124 07031000 Onions and shallots Kg. 96,231,541 3,007,621,667 China P. R. 94,176 2,529,263 India 96,137,365 3,005,092,404
125 07032000 Garlic Kg. 7,126,840 445,610,250 China P. R. 6,947,661 428,662,892 India 179,179 16,947,358
126 07039000 Leeks and other alliaccous vegetables Kg. 18,380 356,860 India 18,380 356,860
127 07041000 Cauliflowers and headed broccoli Kg. 39,865 462,346 China P. R. 150 19,596 India 39,715 442,750
128 07042000 Brussels sprouts Kg. 5,445 71,321 Thailand 5 2,805 India 5,440 68,516
129 07049000 Cabbage, kohlrabi, kale and similar edible brassicas, fresh or chilled
Kg. 332,565 6,351,781
China P. R. 50 7,691 Thailand 5 2,103 India 332,510 6,341,987
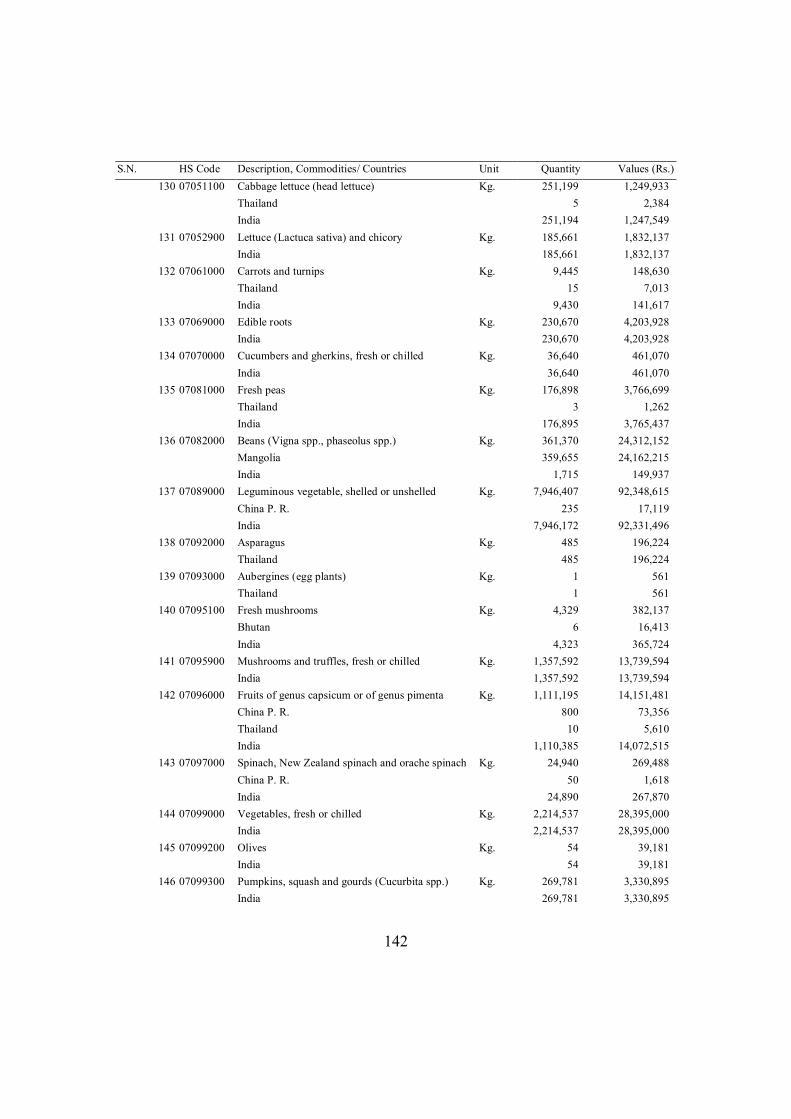
142
S.N. HS Code Description, Commodities/ Countries Unit Quantity Values (Rs.) 130 07051100 Cabbage lettuce (head lettuce) Kg. 251,199 1,249,933
Thailand 5 2,384 India 251,194 1,247,549
131 07052900 Lettuce (Lactuca sativa) and chicory Kg. 185,661 1,832,137 India 185,661 1,832,137
132 07061000 Carrots and turnips Kg. 9,445 148,630 Thailand 15 7,013 India 9,430 141,617
133 07069000 Edible roots Kg. 230,670 4,203,928 India 230,670 4,203,928
134 07070000 Cucumbers and gherkins, fresh or chilled Kg. 36,640 461,070 India 36,640 461,070
135 07081000 Fresh peas Kg. 176,898 3,766,699 Thailand 3 1,262 India 176,895 3,765,437
136 07082000 Beans (Vigna spp., phaseolus spp.) Kg. 361,370 24,312,152 Mangolia 359,655 24,162,215 India 1,715 149,937
137 07089000 Leguminous vegetable, shelled or unshelled Kg. 7,946,407 92,348,615 China P. R. 235 17,119 India 7,946,172 92,331,496
138 07092000 Asparagus Kg. 485 196,224 Thailand 485 196,224
139 07093000 Aubergines (egg plants) Kg. 1 561 Thailand 1 561
140 07095100 Fresh mushrooms Kg. 4,329 382,137 Bhutan 6 16,413 India 4,323 365,724
141 07095900 Mushrooms and truffles, fresh or chilled Kg. 1,357,592 13,739,594 India 1,357,592 13,739,594
142 07096000 Fruits of genus capsicum or of genus pimenta Kg. 1,111,195 14,151,481 China P. R. 800 73,356 Thailand 10 5,610 India 1,110,385 14,072,515
143 07097000 Spinach, New Zealand spinach and orache spinach Kg. 24,940 269,488 China P. R. 50 1,618 India 24,890 267,870
144 07099000 Vegetables, fresh or chilled Kg. 2,214,537 28,395,000 India 2,214,537 28,395,000
145 07099200 Olives Kg. 54 39,181 India 54 39,181
146 07099300 Pumpkins, squash and gourds (Cucurbita spp.) Kg. 269,781 3,330,895 India 269,781 3,330,895
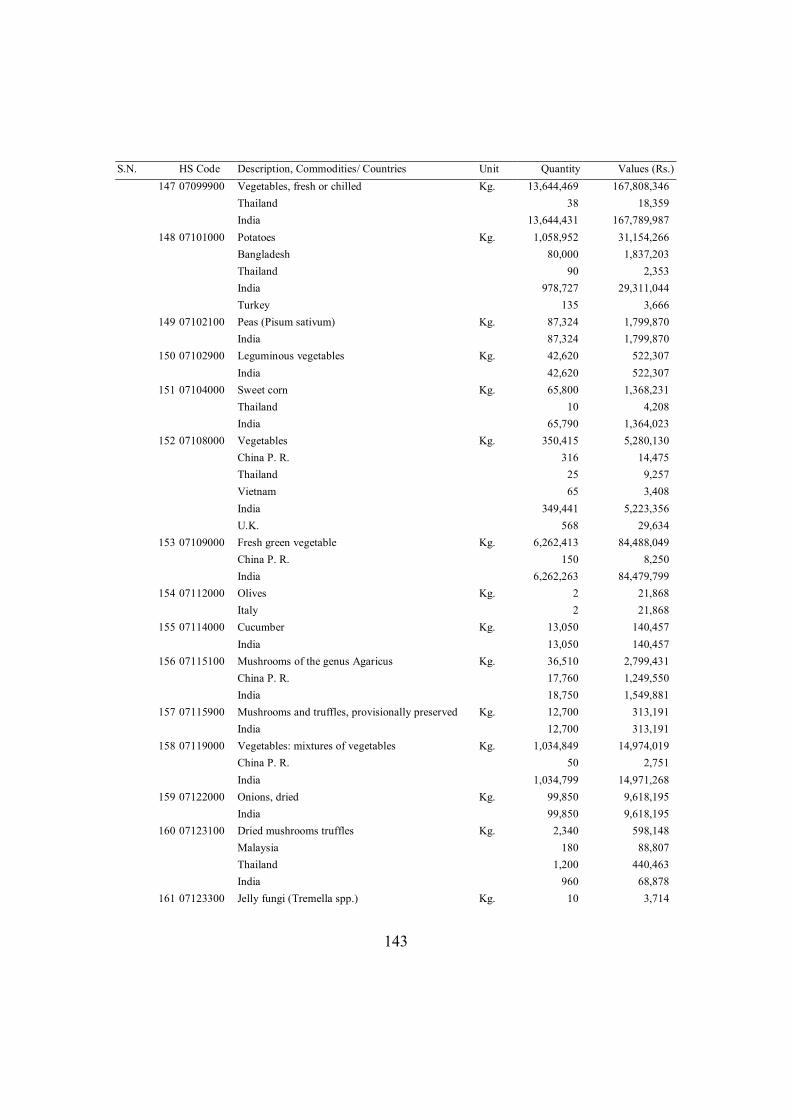
143
S.N. HS Code Description, Commodities/ Countries Unit Quantity Values (Rs.) 147 07099900 Vegetables, fresh or chilled Kg. 13,644,469 167,808,346
Thailand 38 18,359 India 13,644,431 167,789,987
148 07101000 Potatoes Kg. 1,058,952 31,154,266 Bangladesh 80,000 1,837,203 Thailand 90 2,353 India 978,727 29,311,044 Turkey 135 3,666
149 07102100 Peas (Pisum sativum) Kg. 87,324 1,799,870 India 87,324 1,799,870
150 07102900 Leguminous vegetables Kg. 42,620 522,307 India 42,620 522,307
151 07104000 Sweet corn Kg. 65,800 1,368,231 Thailand 10 4,208 India 65,790 1,364,023
152 07108000 Vegetables Kg. 350,415 5,280,130 China P. R. 316 14,475 Thailand 25 9,257 Vietnam 65 3,408 India 349,441 5,223,356 U.K. 568 29,634
153 07109000 Fresh green vegetable Kg. 6,262,413 84,488,049 China P. R. 150 8,250 India 6,262,263 84,479,799
154 07112000 Olives Kg. 2 21,868 Italy 2 21,868
155 07114000 Cucumber Kg. 13,050 140,457 India 13,050 140,457
156 07115100 Mushrooms of the genus Agaricus Kg. 36,510 2,799,431 China P. R. 17,760 1,249,550 India 18,750 1,549,881
157 07115900 Mushrooms and truffles, provisionally preserved Kg. 12,700 313,191 India 12,700 313,191
158 07119000 Vegetables: mixtures of vegetables Kg. 1,034,849 14,974,019 China P. R. 50 2,751 India 1,034,799 14,971,268
159 07122000 Onions, dried Kg. 99,850 9,618,195 India 99,850 9,618,195
160 07123100 Dried mushrooms truffles Kg. 2,340 598,148 Malaysia 180 88,807 Thailand 1,200 440,463 India 960 68,878
161 07123300 Jelly fungi (Tremella spp.) Kg. 10 3,714
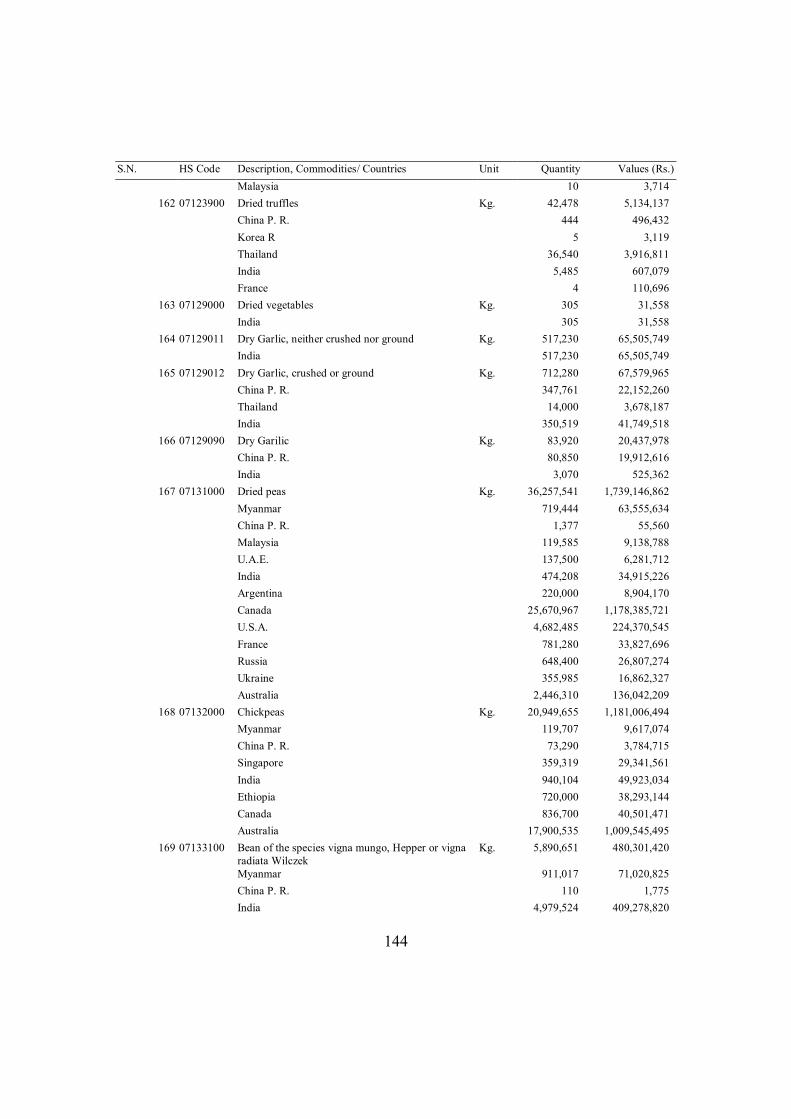
144
S.N. HS Code Description, Commodities/ Countries Unit Quantity Values (Rs.) Malaysia 10 3,714
162 07123900 Dried truffles Kg. 42,478 5,134,137 China P. R. 444 496,432 Korea R 5 3,119 Thailand 36,540 3,916,811 India 5,485 607,079 France 4 110,696
163 07129000 Dried vegetables Kg. 305 31,558 India 305 31,558
164 07129011 Dry Garlic, neither crushed nor ground Kg. 517,230 65,505,749 India 517,230 65,505,749
165 07129012 Dry Garlic, crushed or ground Kg. 712,280 67,579,965 China P. R. 347,761 22,152,260 Thailand 14,000 3,678,187 India 350,519 41,749,518
166 07129090 Dry Garilic Kg. 83,920 20,437,978 China P. R. 80,850 19,912,616 India 3,070 525,362
167 07131000 Dried peas Kg. 36,257,541 1,739,146,862 Myanmar 719,444 63,555,634 China P. R. 1,377 55,560 Malaysia 119,585 9,138,788 U.A.E. 137,500 6,281,712 India 474,208 34,915,226 Argentina 220,000 8,904,170 Canada 25,670,967 1,178,385,721 U.S.A. 4,682,485 224,370,545 France 781,280 33,827,696 Russia 648,400 26,807,274 Ukraine 355,985 16,862,327 Australia 2,446,310 136,042,209
168 07132000 Chickpeas Kg. 20,949,655 1,181,006,494 Myanmar 119,707 9,617,074 China P. R. 73,290 3,784,715 Singapore 359,319 29,341,561 India 940,104 49,923,034 Ethiopia 720,000 38,293,144 Canada 836,700 40,501,471 Australia 17,900,535 1,009,545,495
169 07133100 Bean of the species vigna mungo, Hepper or vigna radiata Wilczek
Kg. 5,890,651 480,301,420
Myanmar 911,017 71,020,825 China P. R. 110 1,775 India 4,979,524 409,278,820
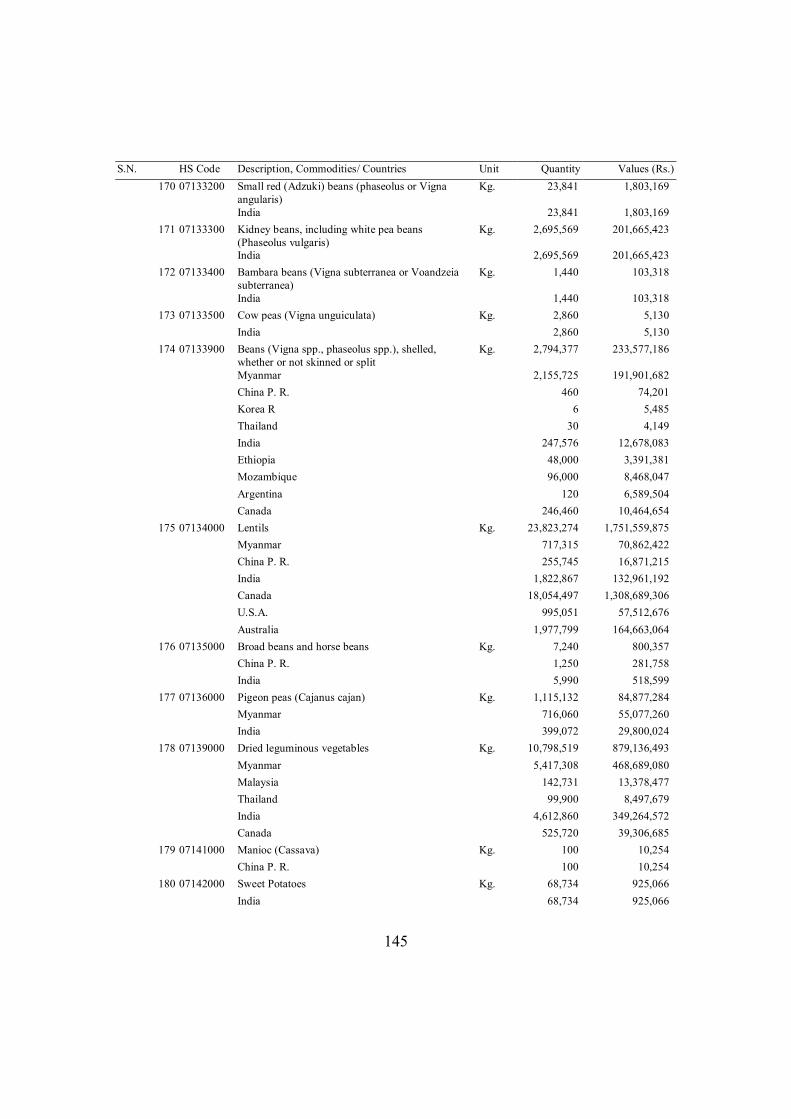
145
S.N. HS Code Description, Commodities/ Countries Unit Quantity Values (Rs.) 170 07133200 Small red (Adzuki) beans (phaseolus or Vigna
angularis) Kg. 23,841 1,803,169
India 23,841 1,803,169 171 07133300 Kidney beans, including white pea beans
(Phaseolus vulgaris) Kg. 2,695,569 201,665,423
India 2,695,569 201,665,423 172 07133400 Bambara beans (Vigna subterranea or Voandzeia
subterranea) Kg. 1,440 103,318
India 1,440 103,318 173 07133500 Cow peas (Vigna unguiculata) Kg. 2,860 5,130
India 2,860 5,130 174 07133900 Beans (Vigna spp., phaseolus spp.), shelled,
whether or not skinned or split Kg. 2,794,377 233,577,186
Myanmar 2,155,725 191,901,682 China P. R. 460 74,201 Korea R 6 5,485 Thailand 30 4,149 India 247,576 12,678,083 Ethiopia 48,000 3,391,381 Mozambique 96,000 8,468,047 Argentina 120 6,589,504 Canada 246,460 10,464,654
175 07134000 Lentils Kg. 23,823,274 1,751,559,875 Myanmar 717,315 70,862,422 China P. R. 255,745 16,871,215 India 1,822,867 132,961,192 Canada 18,054,497 1,308,689,306 U.S.A. 995,051 57,512,676 Australia 1,977,799 164,663,064
176 07135000 Broad beans and horse beans Kg. 7,240 800,357 China P. R. 1,250 281,758 India 5,990 518,599
177 07136000 Pigeon peas (Cajanus cajan) Kg. 1,115,132 84,877,284 Myanmar 716,060 55,077,260 India 399,072 29,800,024
178 07139000 Dried leguminous vegetables Kg. 10,798,519 879,136,493 Myanmar 5,417,308 468,689,080 Malaysia 142,731 13,378,477 Thailand 99,900 8,497,679 India 4,612,860 349,264,572 Canada 525,720 39,306,685
179 07141000 Manioc (Cassava) Kg. 100 10,254 China P. R. 100 10,254
180 07142000 Sweet Potatoes Kg. 68,734 925,066 India 68,734 925,066
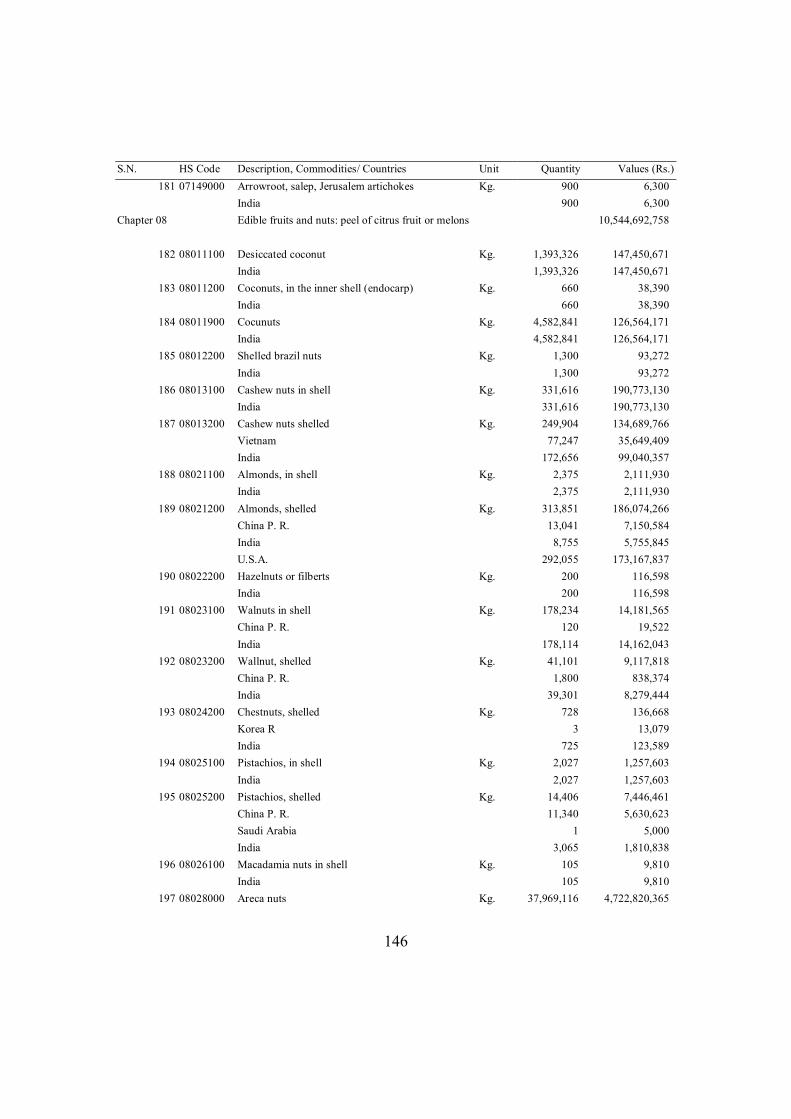
146
S.N. HS Code Description, Commodities/ Countries Unit Quantity Values (Rs.) 181 07149000 Arrowroot, salep, Jerusalem artichokes Kg. 900 6,300
India 900 6,300 Chapter 08 Edible fruits and nuts: peel of citrus fruit or melons 10,544,692,758
182 08011100 Desiccated coconut Kg. 1,393,326 147,450,671 India 1,393,326 147,450,671
183 08011200 Coconuts, in the inner shell (endocarp) Kg. 660 38,390 India 660 38,390
184 08011900 Cocunuts Kg. 4,582,841 126,564,171 India 4,582,841 126,564,171
185 08012200 Shelled brazil nuts Kg. 1,300 93,272 India 1,300 93,272
186 08013100 Cashew nuts in shell Kg. 331,616 190,773,130 India 331,616 190,773,130
187 08013200 Cashew nuts shelled Kg. 249,904 134,689,766 Vietnam 77,247 35,649,409 India 172,656 99,040,357
188 08021100 Almonds, in shell Kg. 2,375 2,111,930 India 2,375 2,111,930
189 08021200 Almonds, shelled Kg. 313,851 186,074,266 China P. R. 13,041 7,150,584 India 8,755 5,755,845 U.S.A. 292,055 173,167,837
190 08022200 Hazelnuts or filberts Kg. 200 116,598 India 200 116,598
191 08023100 Walnuts in shell Kg. 178,234 14,181,565 China P. R. 120 19,522 India 178,114 14,162,043
192 08023200 Wallnut, shelled Kg. 41,101 9,117,818 China P. R. 1,800 838,374 India 39,301 8,279,444
193 08024200 Chestnuts, shelled Kg. 728 136,668 Korea R 3 13,079 India 725 123,589
194 08025100 Pistachios, in shell Kg. 2,027 1,257,603 India 2,027 1,257,603
195 08025200 Pistachios, shelled Kg. 14,406 7,446,461 China P. R. 11,340 5,630,623 Saudi Arabia 1 5,000 India 3,065 1,810,838
196 08026100 Macadamia nuts in shell Kg. 105 9,810 India 105 9,810
197 08028000 Areca nuts Kg. 37,969,116 4,722,820,365
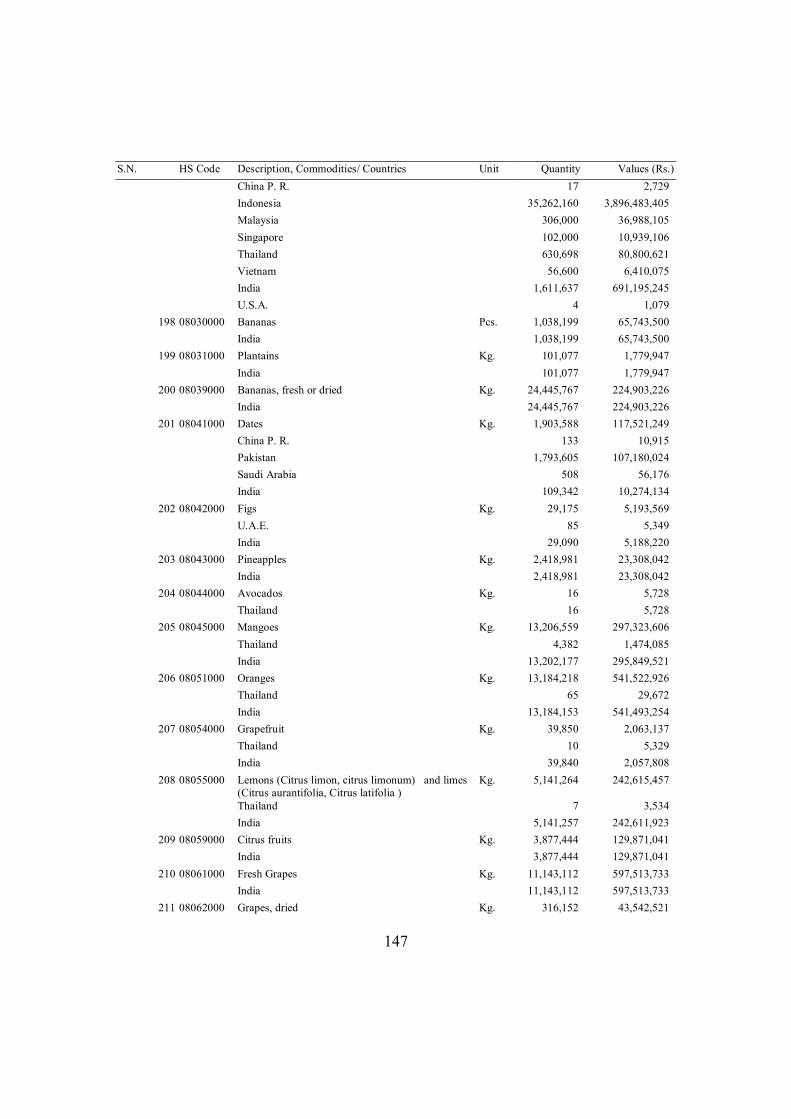
147
S.N. HS Code Description, Commodities/ Countries Unit Quantity Values (Rs.) China P. R. 17 2,729 Indonesia 35,262,160 3,896,483,405 Malaysia 306,000 36,988,105 Singapore 102,000 10,939,106 Thailand 630,698 80,800,621 Vietnam 56,600 6,410,075 India 1,611,637 691,195,245 U.S.A. 4 1,079
198 08030000 Bananas Pcs. 1,038,199 65,743,500 India 1,038,199 65,743,500
199 08031000 Plantains Kg. 101,077 1,779,947 India 101,077 1,779,947
200 08039000 Bananas, fresh or dried Kg. 24,445,767 224,903,226 India 24,445,767 224,903,226
201 08041000 Dates Kg. 1,903,588 117,521,249 China P. R. 133 10,915 Pakistan 1,793,605 107,180,024 Saudi Arabia 508 56,176 India 109,342 10,274,134
202 08042000 Figs Kg. 29,175 5,193,569 U.A.E. 85 5,349 India 29,090 5,188,220
203 08043000 Pineapples Kg. 2,418,981 23,308,042 India 2,418,981 23,308,042
204 08044000 Avocados Kg. 16 5,728 Thailand 16 5,728
205 08045000 Mangoes Kg. 13,206,559 297,323,606 Thailand 4,382 1,474,085 India 13,202,177 295,849,521
206 08051000 Oranges Kg. 13,184,218 541,522,926 Thailand 65 29,672 India 13,184,153 541,493,254
207 08054000 Grapefruit Kg. 39,850 2,063,137 Thailand 10 5,329 India 39,840 2,057,808
208 08055000 Lemons (Citrus limon, citrus limonum) and limes (Citrus aurantifolia, Citrus latifolia )
Kg. 5,141,264 242,615,457
Thailand 7 3,534 India 5,141,257 242,611,923
209 08059000 Citrus fruits Kg. 3,877,444 129,871,041 India 3,877,444 129,871,041
210 08061000 Fresh Grapes Kg. 11,143,112 597,513,733 India 11,143,112 597,513,733
211 08062000 Grapes, dried Kg. 316,152 43,542,521
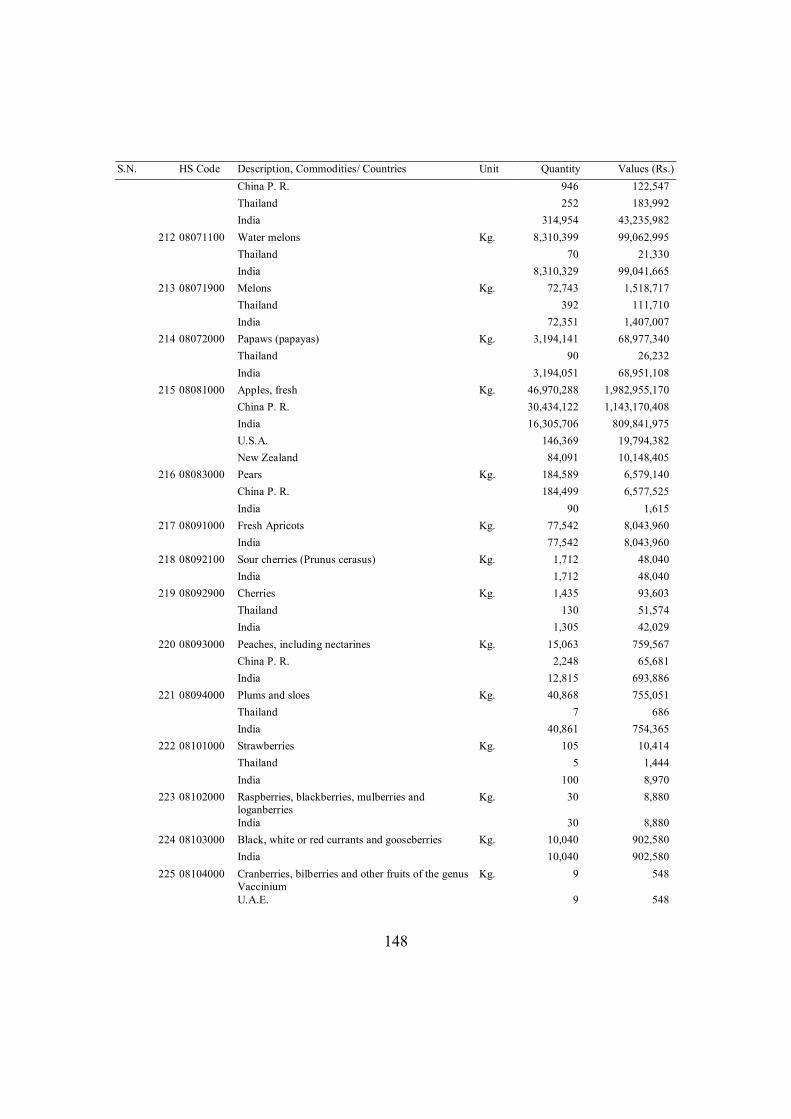
148
S.N. HS Code Description, Commodities/ Countries Unit Quantity Values (Rs.) China P. R. 946 122,547 Thailand 252 183,992 India 314,954 43,235,982
212 08071100 Water melons Kg. 8,310,399 99,062,995 Thailand 70 21,330 India 8,310,329 99,041,665
213 08071900 Melons Kg. 72,743 1,518,717 Thailand 392 111,710 India 72,351 1,407,007
214 08072000 Papaws (papayas) Kg. 3,194,141 68,977,340 Thailand 90 26,232 India 3,194,051 68,951,108
215 08081000 Apples, fresh Kg. 46,970,288 1,982,955,170 China P. R. 30,434,122 1,143,170,408 India 16,305,706 809,841,975 U.S.A. 146,369 19,794,382 New Zealand 84,091 10,148,405
216 08083000 Pears Kg. 184,589 6,579,140 China P. R. 184,499 6,577,525 India 90 1,615
217 08091000 Fresh Apricots Kg. 77,542 8,043,960 India 77,542 8,043,960
218 08092100 Sour cherries (Prunus cerasus) Kg. 1,712 48,040 India 1,712 48,040
219 08092900 Cherries Kg. 1,435 93,603 Thailand 130 51,574 India 1,305 42,029
220 08093000 Peaches, including nectarines Kg. 15,063 759,567 China P. R. 2,248 65,681 India 12,815 693,886
221 08094000 Plums and sloes Kg. 40,868 755,051 Thailand 7 686 India 40,861 754,365
222 08101000 Strawberries Kg. 105 10,414 Thailand 5 1,444 India 100 8,970
223 08102000 Raspberries, blackberries, mulberries and loganberries
Kg. 30 8,880
India 30 8,880 224 08103000 Black, white or red currants and gooseberries Kg. 10,040 902,580
India 10,040 902,580 225 08104000 Cranberries, bilberries and other fruits of the genus
Vaccinium Kg. 9 548
U.A.E. 9 548
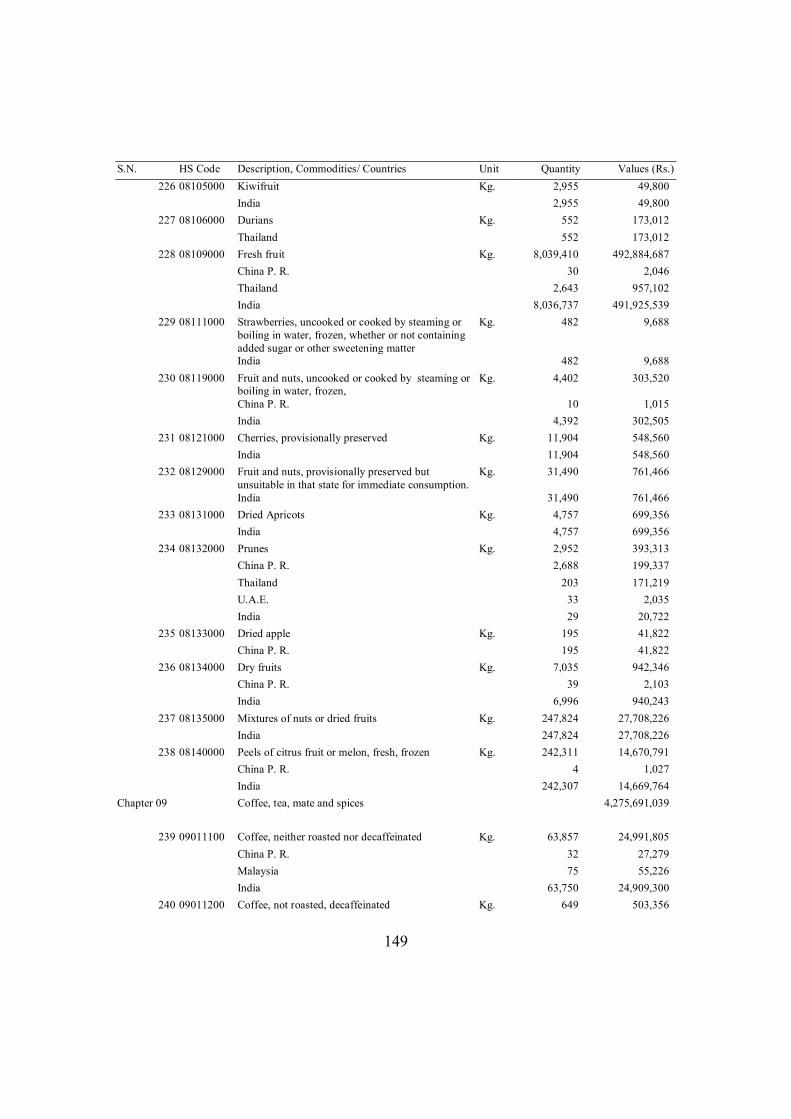
149
S.N. HS Code Description, Commodities/ Countries Unit Quantity Values (Rs.) 226 08105000 Kiwifruit Kg. 2,955 49,800
India 2,955 49,800 227 08106000 Durians Kg. 552 173,012
Thailand 552 173,012 228 08109000 Fresh fruit Kg. 8,039,410 492,884,687
China P. R. 30 2,046 Thailand 2,643 957,102 India 8,036,737 491,925,539
229 08111000 Strawberries, uncooked or cooked by steaming or boiling in water, frozen, whether or not containing added sugar or other sweetening matter
Kg. 482 9,688
India 482 9,688 230 08119000 Fruit and nuts, uncooked or cooked by steaming or
boiling in water, frozen, Kg. 4,402 303,520
China P. R. 10 1,015 India 4,392 302,505
231 08121000 Cherries, provisionally preserved Kg. 11,904 548,560 India 11,904 548,560
232 08129000 Fruit and nuts, provisionally preserved but unsuitable in that state for immediate consumption.
Kg. 31,490 761,466
India 31,490 761,466 233 08131000 Dried Apricots Kg. 4,757 699,356
India 4,757 699,356 234 08132000 Prunes Kg. 2,952 393,313
China P. R. 2,688 199,337 Thailand 203 171,219 U.A.E. 33 2,035 India 29 20,722
235 08133000 Dried apple Kg. 195 41,822 China P. R. 195 41,822
236 08134000 Dry fruits Kg. 7,035 942,346 China P. R. 39 2,103 India 6,996 940,243
237 08135000 Mixtures of nuts or dried fruits Kg. 247,824 27,708,226 India 247,824 27,708,226
238 08140000 Peels of citrus fruit or melon, fresh, frozen Kg. 242,311 14,670,791 China P. R. 4 1,027 India 242,307 14,669,764
Chapter 09 Coffee, tea, mate and spices 4,275,691,039
239 09011100 Coffee, neither roasted nor decaffeinated Kg. 63,857 24,991,805 China P. R. 32 27,279 Malaysia 75 55,226 India 63,750 24,909,300
240 09011200 Coffee, not roasted, decaffeinated Kg. 649 503,356
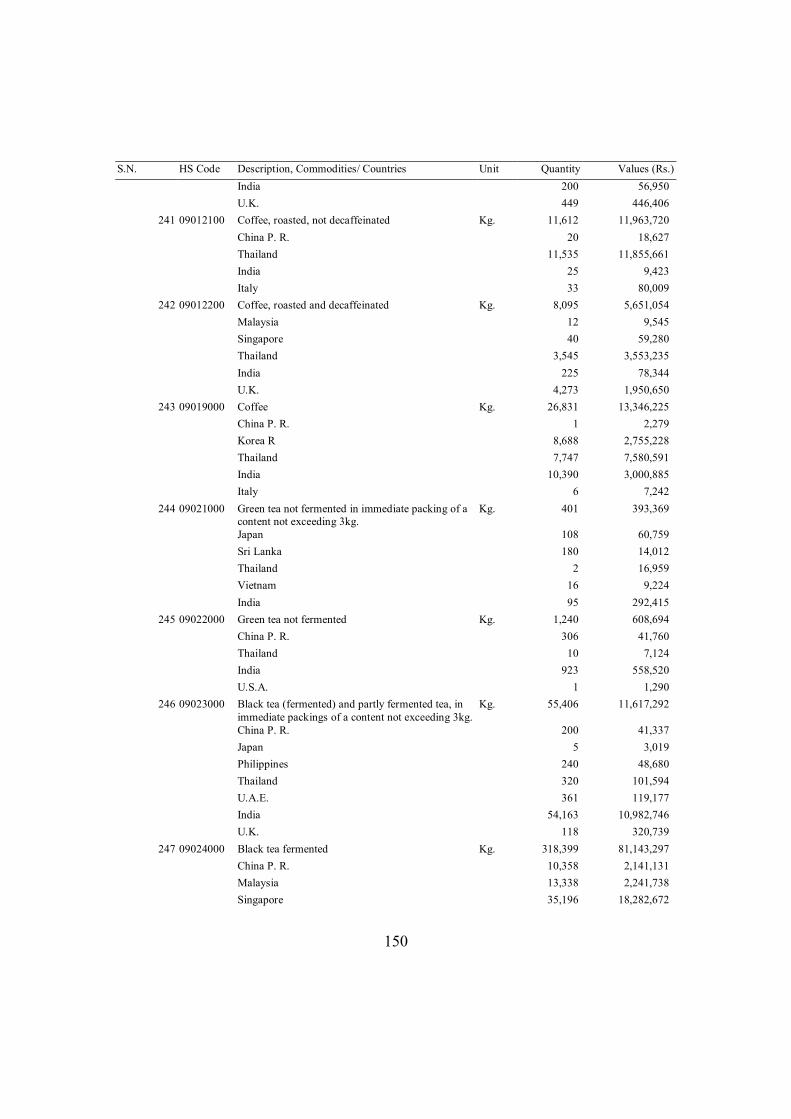
150
S.N. HS Code Description, Commodities/ Countries Unit Quantity Values (Rs.) India 200 56,950 U.K. 449 446,406
241 09012100 Coffee, roasted, not decaffeinated Kg. 11,612 11,963,720 China P. R. 20 18,627 Thailand 11,535 11,855,661 India 25 9,423 Italy 33 80,009
242 09012200 Coffee, roasted and decaffeinated Kg. 8,095 5,651,054 Malaysia 12 9,545 Singapore 40 59,280 Thailand 3,545 3,553,235 India 225 78,344 U.K. 4,273 1,950,650
243 09019000 Coffee Kg. 26,831 13,346,225 China P. R. 1 2,279 Korea R 8,688 2,755,228 Thailand 7,747 7,580,591 India 10,390 3,000,885 Italy 6 7,242
244 09021000 Green tea not fermented in immediate packing of a content not exceeding 3kg.
Kg. 401 393,369
Japan 108 60,759 Sri Lanka 180 14,012 Thailand 2 16,959 Vietnam 16 9,224 India 95 292,415
245 09022000 Green tea not fermented Kg. 1,240 608,694 China P. R. 306 41,760 Thailand 10 7,124 India 923 558,520 U.S.A. 1 1,290
246 09023000 Black tea (fermented) and partly fermented tea, in immediate packings of a content not exceeding 3kg.
Kg. 55,406 11,617,292
China P. R. 200 41,337 Japan 5 3,019 Philippines 240 48,680 Thailand 320 101,594 U.A.E. 361 119,177 India 54,163 10,982,746 U.K. 118 320,739
247 09024000 Black tea fermented Kg. 318,399 81,143,297 China P. R. 10,358 2,141,131 Malaysia 13,338 2,241,738 Singapore 35,196 18,282,672
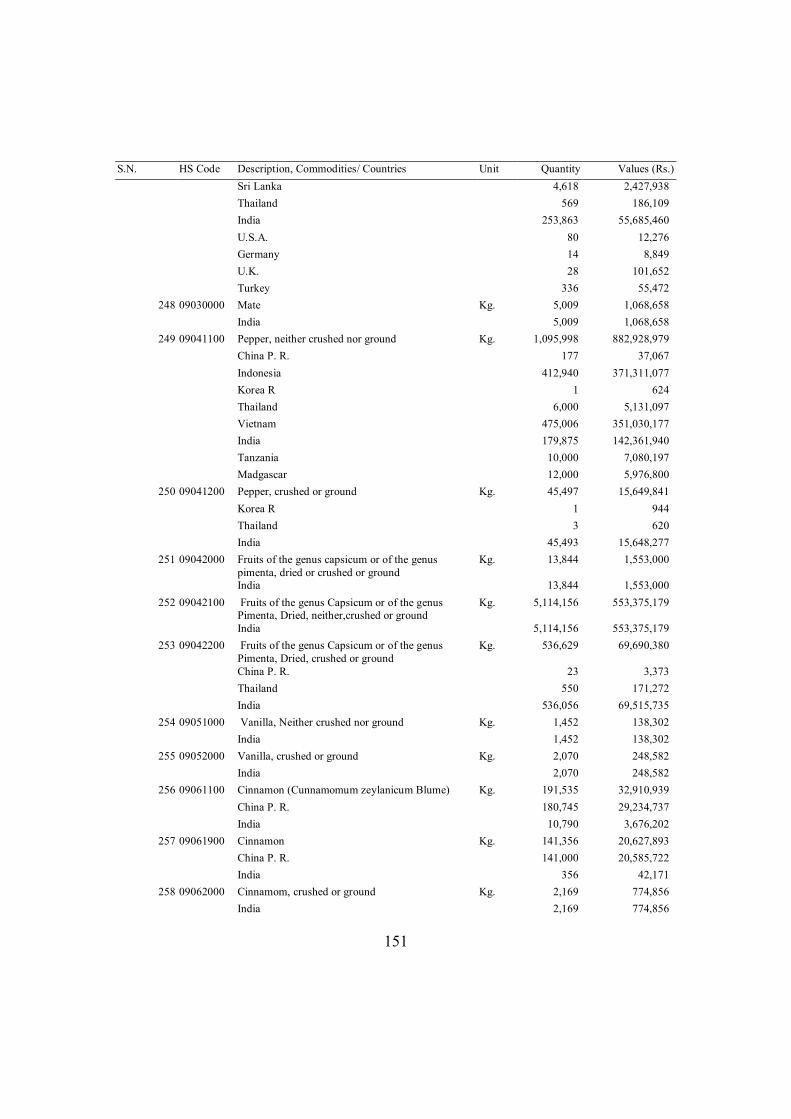
151
S.N. HS Code Description, Commodities/ Countries Unit Quantity Values (Rs.) Sri Lanka 4,618 2,427,938 Thailand 569 186,109 India 253,863 55,685,460 U.S.A. 80 12,276 Germany 14 8,849 U.K. 28 101,652 Turkey 336 55,472
248 09030000 Mate Kg. 5,009 1,068,658 India 5,009 1,068,658
249 09041100 Pepper, neither crushed nor ground Kg. 1,095,998 882,928,979 China P. R. 177 37,067 Indonesia 412,940 371,311,077 Korea R 1 624 Thailand 6,000 5,131,097 Vietnam 475,006 351,030,177 India 179,875 142,361,940 Tanzania 10,000 7,080,197 Madgascar 12,000 5,976,800
250 09041200 Pepper, crushed or ground Kg. 45,497 15,649,841 Korea R 1 944 Thailand 3 620 India 45,493 15,648,277
251 09042000 Fruits of the genus capsicum or of the genus pimenta, dried or crushed or ground
Kg. 13,844 1,553,000
India 13,844 1,553,000 252 09042100 Fruits of the genus Capsicum or of the genus
Pimenta, Dried, neither,crushed or ground Kg. 5,114,156 553,375,179
India 5,114,156 553,375,179 253 09042200 Fruits of the genus Capsicum or of the genus
Pimenta, Dried, crushed or ground Kg. 536,629 69,690,380
China P. R. 23 3,373 Thailand 550 171,272 India 536,056 69,515,735
254 09051000 Vanilla, Neither crushed nor ground Kg. 1,452 138,302 India 1,452 138,302
255 09052000 Vanilla, crushed or ground Kg. 2,070 248,582 India 2,070 248,582
256 09061100 Cinnamon (Cunnamomum zeylanicum Blume) Kg. 191,535 32,910,939 China P. R. 180,745 29,234,737 India 10,790 3,676,202
257 09061900 Cinnamon Kg. 141,356 20,627,893 China P. R. 141,000 20,585,722 India 356 42,171
258 09062000 Cinnamom, crushed or ground Kg. 2,169 774,856 India 2,169 774,856
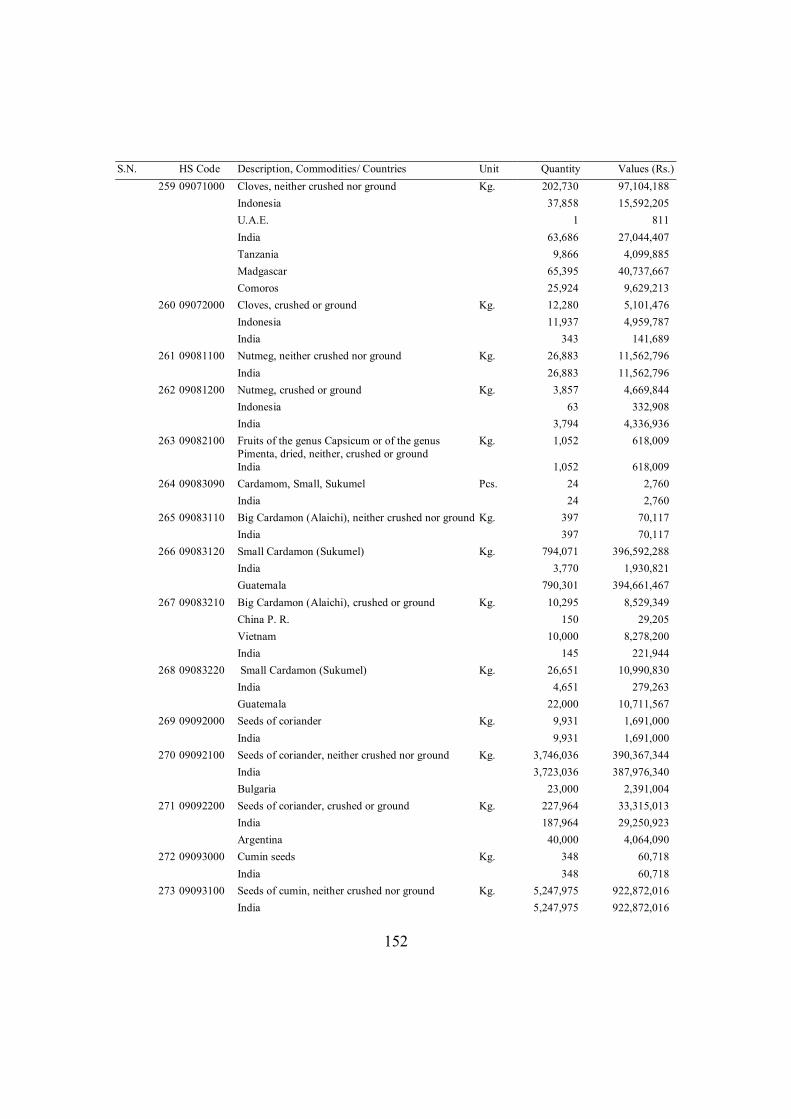
152
S.N. HS Code Description, Commodities/ Countries Unit Quantity Values (Rs.) 259 09071000 Cloves, neither crushed nor ground Kg. 202,730 97,104,188
Indonesia 37,858 15,592,205 U.A.E. 1 811 India 63,686 27,044,407 Tanzania 9,866 4,099,885 Madgascar 65,395 40,737,667 Comoros 25,924 9,629,213
260 09072000 Cloves, crushed or ground Kg. 12,280 5,101,476 Indonesia 11,937 4,959,787 India 343 141,689
261 09081100 Nutmeg, neither crushed nor ground Kg. 26,883 11,562,796 India 26,883 11,562,796
262 09081200 Nutmeg, crushed or ground Kg. 3,857 4,669,844 Indonesia 63 332,908 India 3,794 4,336,936
263 09082100 Fruits of the genus Capsicum or of the genus Pimenta, dried, neither, crushed or ground
Kg. 1,052 618,009
India 1,052 618,009 264 09083090 Cardamom, Small, Sukumel Pcs. 24 2,760
India 24 2,760 265 09083110 Big Cardamon (Alaichi), neither crushed nor ground Kg. 397 70,117
India 397 70,117 266 09083120 Small Cardamon (Sukumel) Kg. 794,071 396,592,288
India 3,770 1,930,821 Guatemala 790,301 394,661,467
267 09083210 Big Cardamon (Alaichi), crushed or ground Kg. 10,295 8,529,349 China P. R. 150 29,205 Vietnam 10,000 8,278,200 India 145 221,944
268 09083220 Small Cardamon (Sukumel) Kg. 26,651 10,990,830 India 4,651 279,263 Guatemala 22,000 10,711,567
269 09092000 Seeds of coriander Kg. 9,931 1,691,000 India 9,931 1,691,000
270 09092100 Seeds of coriander, neither crushed nor ground Kg. 3,746,036 390,367,344 India 3,723,036 387,976,340 Bulgaria 23,000 2,391,004
271 09092200 Seeds of coriander, crushed or ground Kg. 227,964 33,315,013 India 187,964 29,250,923 Argentina 40,000 4,064,090
272 09093000 Cumin seeds Kg. 348 60,718 India 348 60,718
273 09093100 Seeds of cumin, neither crushed nor ground Kg. 5,247,975 922,872,016 India 5,247,975 922,872,016
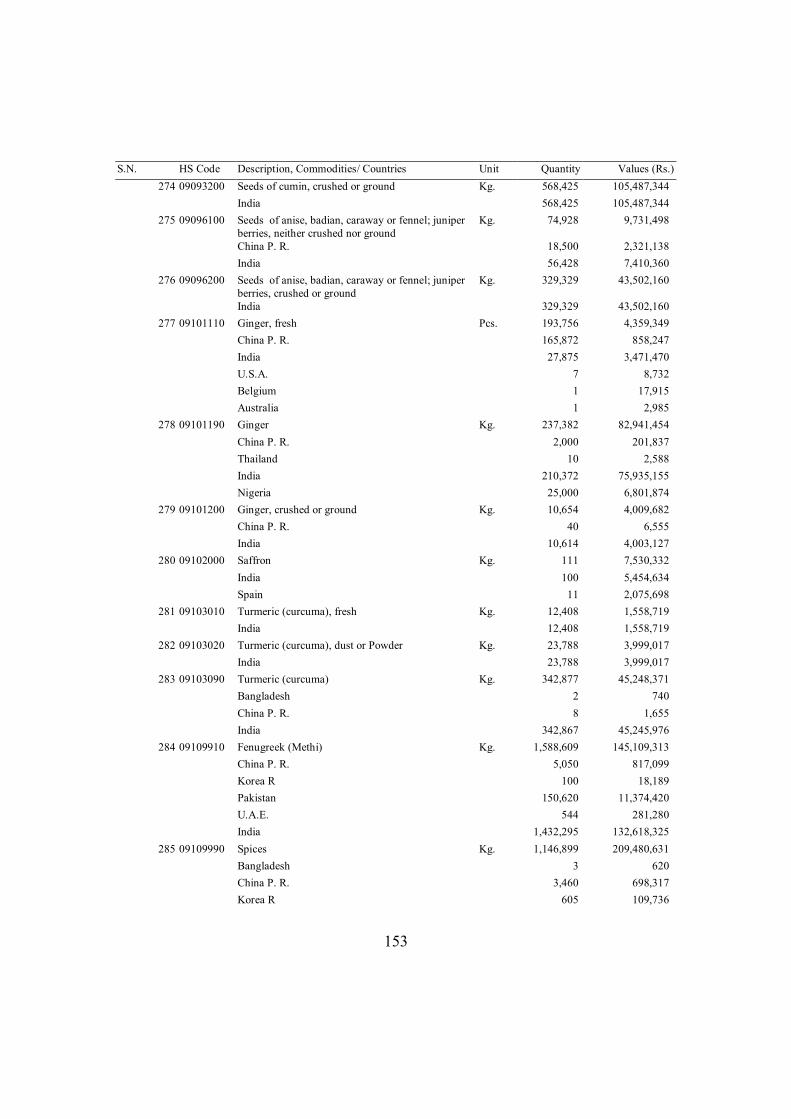
153
S.N. HS Code Description, Commodities/ Countries Unit Quantity Values (Rs.) 274 09093200 Seeds of cumin, crushed or ground Kg. 568,425 105,487,344
India 568,425 105,487,344 275 09096100 Seeds of anise, badian, caraway or fennel; juniper
berries, neither crushed nor ground Kg. 74,928 9,731,498
China P. R. 18,500 2,321,138 India 56,428 7,410,360
276 09096200 Seeds of anise, badian, caraway or fennel; juniper berries, crushed or ground
Kg. 329,329 43,502,160
India 329,329 43,502,160 277 09101110 Ginger, fresh Pcs. 193,756 4,359,349
China P. R. 165,872 858,247 India 27,875 3,471,470 U.S.A. 7 8,732 Belgium 1 17,915 Australia 1 2,985
278 09101190 Ginger Kg. 237,382 82,941,454 China P. R. 2,000 201,837 Thailand 10 2,588 India 210,372 75,935,155 Nigeria 25,000 6,801,874
279 09101200 Ginger, crushed or ground Kg. 10,654 4,009,682 China P. R. 40 6,555 India 10,614 4,003,127
280 09102000 Saffron Kg. 111 7,530,332 India 100 5,454,634 Spain 11 2,075,698
281 09103010 Turmeric (curcuma), fresh Kg. 12,408 1,558,719 India 12,408 1,558,719
282 09103020 Turmeric (curcuma), dust or Powder Kg. 23,788 3,999,017 India 23,788 3,999,017
283 09103090 Turmeric (curcuma) Kg. 342,877 45,248,371 Bangladesh 2 740 China P. R. 8 1,655 India 342,867 45,245,976
284 09109910 Fenugreek (Methi) Kg. 1,588,609 145,109,313 China P. R. 5,050 817,099 Korea R 100 18,189 Pakistan 150,620 11,374,420 U.A.E. 544 281,280 India 1,432,295 132,618,325
285 09109990 Spices Kg. 1,146,899 209,480,631 Bangladesh 3 620 China P. R. 3,460 698,317 Korea R 605 109,736
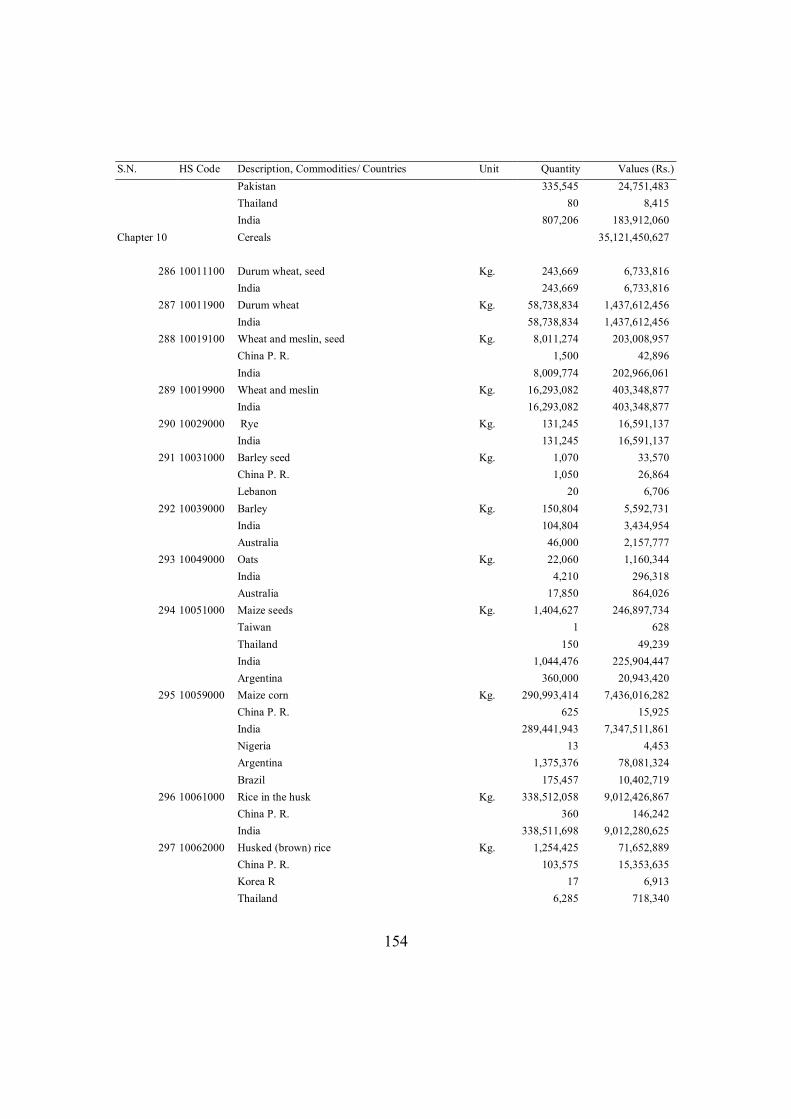
154
S.N. HS Code Description, Commodities/ Countries Unit Quantity Values (Rs.) Pakistan 335,545 24,751,483 Thailand 80 8,415 India 807,206 183,912,060
Chapter 10 Cereals 35,121,450,627
286 10011100 Durum wheat, seed Kg. 243,669 6,733,816 India 243,669 6,733,816
287 10011900 Durum wheat Kg. 58,738,834 1,437,612,456 India 58,738,834 1,437,612,456
288 10019100 Wheat and meslin, seed Kg. 8,011,274 203,008,957 China P. R. 1,500 42,896 India 8,009,774 202,966,061
289 10019900 Wheat and meslin Kg. 16,293,082 403,348,877 India 16,293,082 403,348,877
290 10029000 Rye Kg. 131,245 16,591,137 India 131,245 16,591,137
291 10031000 Barley seed Kg. 1,070 33,570 China P. R. 1,050 26,864 Lebanon 20 6,706
292 10039000 Barley Kg. 150,804 5,592,731 India 104,804 3,434,954 Australia 46,000 2,157,777
293 10049000 Oats Kg. 22,060 1,160,344 India 4,210 296,318 Australia 17,850 864,026
294 10051000 Maize seeds Kg. 1,404,627 246,897,734 Taiwan 1 628 Thailand 150 49,239 India 1,044,476 225,904,447 Argentina 360,000 20,943,420
295 10059000 Maize corn Kg. 290,993,414 7,436,016,282 China P. R. 625 15,925 India 289,441,943 7,347,511,861 Nigeria 13 4,453 Argentina 1,375,376 78,081,324 Brazil 175,457 10,402,719
296 10061000 Rice in the husk Kg. 338,512,058 9,012,426,867 China P. R. 360 146,242 India 338,511,698 9,012,280,625
297 10062000 Husked (brown) rice Kg. 1,254,425 71,652,889 China P. R. 103,575 15,353,635 Korea R 17 6,913 Thailand 6,285 718,340
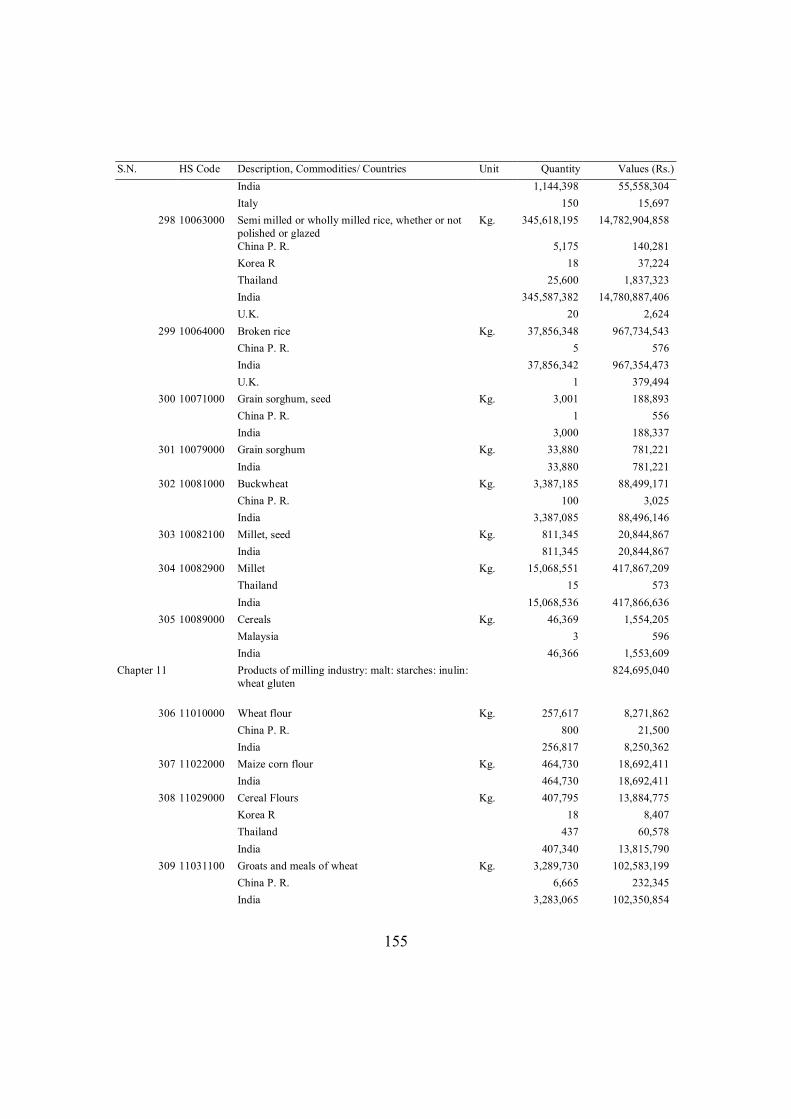
155
S.N. HS Code Description, Commodities/ Countries Unit Quantity Values (Rs.) India 1,144,398 55,558,304 Italy 150 15,697
298 10063000 Semi milled or wholly milled rice, whether or not polished or glazed
Kg. 345,618,195 14,782,904,858
China P. R. 5,175 140,281 Korea R 18 37,224 Thailand 25,600 1,837,323 India 345,587,382 14,780,887,406 U.K. 20 2,624
299 10064000 Broken rice Kg. 37,856,348 967,734,543 China P. R. 5 576 India 37,856,342 967,354,473 U.K. 1 379,494
300 10071000 Grain sorghum, seed Kg. 3,001 188,893 China P. R. 1 556 India 3,000 188,337
301 10079000 Grain sorghum Kg. 33,880 781,221 India 33,880 781,221
302 10081000 Buckwheat Kg. 3,387,185 88,499,171 China P. R. 100 3,025 India 3,387,085 88,496,146
303 10082100 Millet, seed Kg. 811,345 20,844,867 India 811,345 20,844,867
304 10082900 Millet Kg. 15,068,551 417,867,209 Thailand 15 573 India 15,068,536 417,866,636
305 10089000 Cereals Kg. 46,369 1,554,205 Malaysia 3 596 India 46,366 1,553,609
Chapter 11 Products of milling industry: malt: starches: inulin: wheat gluten
824,695,040
306 11010000 Wheat flour Kg. 257,617 8,271,862 China P. R. 800 21,500 India 256,817 8,250,362
307 11022000 Maize corn flour Kg. 464,730 18,692,411 India 464,730 18,692,411
308 11029000 Cereal Flours Kg. 407,795 13,884,775 Korea R 18 8,407 Thailand 437 60,578 India 407,340 13,815,790
309 11031100 Groats and meals of wheat Kg. 3,289,730 102,583,199 China P. R. 6,665 232,345 India 3,283,065 102,350,854
156
S.N. HS Code Description, Commodities/ Countries Unit Quantity Values (Rs.) 310 11031300 Groats and meals of maize Kg. 173,470 6,295,058
China P. R. 970 31,338 India 172,500 6,263,720
311 11031900 Groats and meal Kg. 42,225 1,837,700 China P. R. 2,388 183,228 Thailand 270 11,049 India 39,519 1,521,515 U.S.A. 48 121,908
312 11032000 Cereal pellets Kg. 4,460 177,936 India 4,460 177,936
313 11041200 Rolled or flaked grains of oats Kg. 126,178 4,067,856 India 3,169 469,932 Finland 96,000 941,660 U.K. 9 8,876 Australia 27,000 2,647,388
314 11041900 Rolled or flacked cereals Kg. 2,975 85,554 India 2,975 85,554
315 11042200 Worked grains of oats Kg. 2,923 256,112 China P. R. 448 61,619 Thailand 205 40,842 U.A.E. 240 25,080 India 2,030 128,571
316 11042300 Hulled, pearled, sliced or kibbled of maize corn Kg. 550,650 19,045,825 India 550,650 19,045,825
317 11042900 Worked grains Kg. 922 74,723 Lebanon 22 20,577 India 900 54,146
318 11043000 Germ of cereals, whole, rolled, flaked or ground Kg. 15,010 697,851 India 15,010 697,851
319 11051000 Flour, meal and powdeer of potatoes Kg. 9,870 1,068,216 India 9,664 662,594 U.K. 206 405,622
320 11052000 Flakes, granules and pellets of potatoes Kg. 310,700 24,833,018 India 310,700 24,833,018
321 11061000 Flour, meal and powder of dried leguminous vegetables
Kg. 94,579 6,761,639
India 94,579 6,761,639 322 11062000 Flour, meal and powder of the dried leguminous
vegetables Kg. 62,436 4,210,465
India 62,436 4,210,465 323 11063000 Flour, meal and powder of edible fruit and nut Kg. 340,961 57,155,718
China P. R. 14 18,964 Indonesia 50,075 11,032,448 Korea R 3 1,247
157
S.N. HS Code Description, Commodities/ Countries Unit Quantity Values (Rs.) Malaysia 57,750 6,534,484 Taiwan 9 8,411 Thailand 33,808 3,937,749 Vietnam 38,000 8,631,587 India 161,221 26,958,772 U.S.A. 81 32,056
324 11071000 Malt, not roasted Kg. 6,684,511 286,020,624 China P. R. 280,780 16,285,682 Korea R 1 624 India 6,021,205 247,370,586 Denmark 276,825 16,643,301 Germany 105,700 5,720,431
325 11072000 Malt, roasted Kg. 881,704 39,317,745 China P. R. 4,910 176,249 India 876,794 39,141,496
326 11081100 Wheat starch Kg. 4,620 207,172 India 4,620 207,172
327 11081200 Maize corn starch Kg. 1,379,170 49,757,196 India 1,379,170 49,757,196
328 11081400 Manioc(cassava) starch Kg. 4,250 290,683 India 4,250 290,683
329 11081900 Starch Kg. 224,297 10,544,129 India 224,297 10,544,129
330 11082000 Inulin Kg. 1,000 43,051 India 1,000 43,051
331 11090000 Wheat gluten Kg. 1,176,210 168,514,522 China P. R. 1,145,000 164,297,643 India 30,310 4,038,087 Turkey 900 178,792
Chapter 12 Oil seeds and oleaginous fruits: miscellaneous grains, seeds and fruit: industrial or medicinal plants: straw and fodder
9,113,603,867
332 12011000 Soya beans, seed Kg. 16,439,463 917,494,371 China P. R. 235 48,359 India 7,712,158 455,553,235 Argentina 4,496,390 244,141,603 Paraguay 4,230,680 217,751,174
333 12019000 Soya beans, whether or not broken Kg. 37,257,751 2,189,799,268 China P. R. 4,562 172,322 Korea R 2 1,247 Thailand 124 61,197 India 13,580,259 783,196,228 Ethiopia 2,261,000 147,869,788
158
S.N. HS Code Description, Commodities/ Countries Unit Quantity Values (Rs.) Malawi 550,000 33,803,633 Mozambique 3,262,419 196,775,050 Argentina 11,045,470 686,768,845 Paraguay 1,481,860 72,079,953 U.S.A. 3,177,690 169,659,006 Uruguay 1,045,855 50,888,201 Ukraine 848,510 48,523,798
334 12021000 Ground-nuts in shell Kg. 3,315 153,600 India 3,315 153,600
335 12023000 Ground-nuts, seed Kg. 149,167 17,104,507 China P. R. 657 22,092 India 148,510 17,082,415
336 12024100 Ground-nuts, in shell Kg. 4,020,646 194,250,617 China P. R. 50 2,223 India 4,020,596 194,248,394
337 12024200 Ground-nuts, shelled Kg. 2,780,408 322,047,443 India 2,780,408 322,047,443
338 12030000 Copra Kg. 24,500 2,510,824 Indonesia 24,000 2,505,442 India 500 5,382
339 12051000 Low erucic acid rape or colza seeds Kg. 53,274,197 2,752,629,807 China P. R. 30 1,926 Maldives 221,040 11,775,795 U.A.E. 864,570 45,688,963 Kazakstan 565,150 30,667,354 India 4,795,098 277,670,113 Canada 1,672,030 75,335,101 Austria 640,860 36,718,000 Russia 7,525,605 351,877,091 Ukraine 27,801,284 1,418,133,000 Moldova 458,880 26,402,653 Australia 8,729,650 478,359,811
340 12059000 Rape or colza seeds, whether or not broken Kg. 5 628 India 5 628
341 12060000 Sunflower seed Kg. 1,598 99,907 China P. R. 1,598 99,907
342 12071000 Palm nuts and kernels Kg. 120 5,263 China P. R. 110 4,007 India 10 1,256
343 12072900 Cotton seeds Kg. 1,040 29,069 China P. R. 1,040 29,069
344 12074000 Sesamum seeds Kg. 959,292 84,896,518 Bangladesh 15,000 1,212,414
159
S.N. HS Code Description, Commodities/ Countries Unit Quantity Values (Rs.) China P. R. 170 7,210 India 944,122 83,676,894
345 12075000 Mustard seeds Kg. 23,412,843 1,435,134,659 Korea R 1 624 India 23,302,842 1,428,889,766 Ukraine 110,000 6,244,269
346 12076000 Safflower seeds Kg. 6 3,768 India 6 3,768
347 12077000 Melon seeds Kg. 1,355 139,417 India 1,355 139,417
348 12079900 Oil seeds Kg. 1,529 93,727 China P. R. 25 1,659 India 1,504 92,068
349 12081000 Flours of soya beans Kg. 13,000 1,134,270 India 13,000 1,134,270
350 12089000 Flours and meals of oil seeds or oleaginous fruits Kg. 662 16,342 Korea R 2 2,494 India 660 13,848
351 12092200 Clover seeds Kg. 4,500 2,753,870 China P. R. 4,500 2,753,870
352 12092300 Fescue seeds Kg. 500 9,008 India 500 9,008
353 12092400 Kentucky blue grass seed Kg. 385 67,896 India 385 67,896
354 12092500 Rye grass (Lolium multiflorum Lam., Lolium perenne L.) seed
Kg. 15,025 725,915
India 15,025 725,915 355 12092900 Seeds of forage plants Kg. 147,815 33,100,776
China P. R. 31,770 22,099,642 Thailand 8 275,438 India 115,690 8,667,566 Canada 1 502 U.S.A. 5 63,028 Italy 342 1,994,600
356 12093000 Seeds of herbaceous plants cultivated principally for their flowers
Kg. 3,671 4,233,510
China P. R. 4 10,411 India 3,662 4,105,917 U.S.A. 5 117,182
357 12099100 Vegetable seeds Kg. 270,366 318,895,689 Bangladesh 78 36,406 China P. R. 12,319 21,830,244 Indonesia 135 72,590 Japan 4,917 48,054,459
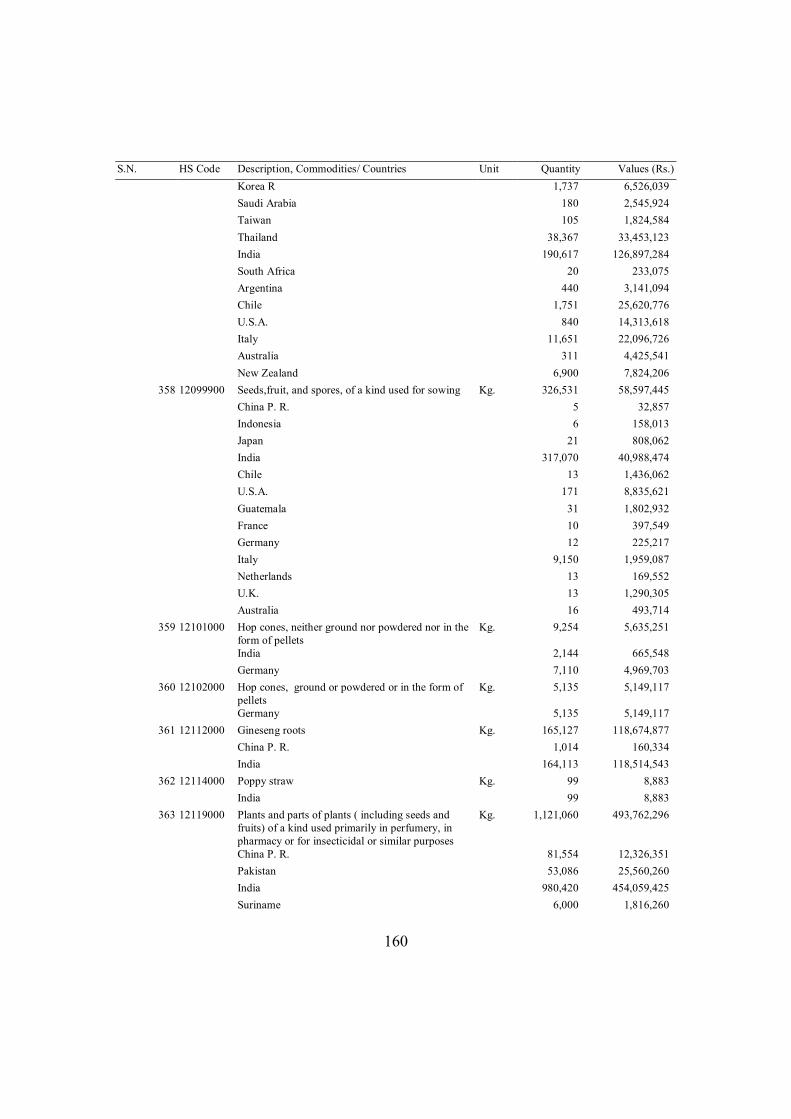
160
S.N. HS Code Description, Commodities/ Countries Unit Quantity Values (Rs.) Korea R 1,737 6,526,039 Saudi Arabia 180 2,545,924 Taiwan 105 1,824,584 Thailand 38,367 33,453,123 India 190,617 126,897,284 South Africa 20 233,075 Argentina 440 3,141,094 Chile 1,751 25,620,776 U.S.A. 840 14,313,618 Italy 11,651 22,096,726 Australia 311 4,425,541 New Zealand 6,900 7,824,206
358 12099900 Seeds,fruit, and spores, of a kind used for sowing Kg. 326,531 58,597,445 China P. R. 5 32,857 Indonesia 6 158,013 Japan 21 808,062 India 317,070 40,988,474 Chile 13 1,436,062 U.S.A. 171 8,835,621 Guatemala 31 1,802,932 France 10 397,549 Germany 12 225,217 Italy 9,150 1,959,087 Netherlands 13 169,552 U.K. 13 1,290,305 Australia 16 493,714
359 12101000 Hop cones, neither ground nor powdered nor in the form of pellets
Kg. 9,254 5,635,251
India 2,144 665,548 Germany 7,110 4,969,703
360 12102000 Hop cones, ground or powdered or in the form of pellets
Kg. 5,135 5,149,117
Germany 5,135 5,149,117 361 12112000 Gineseng roots Kg. 165,127 118,674,877
China P. R. 1,014 160,334 India 164,113 118,514,543
362 12114000 Poppy straw Kg. 99 8,883 India 99 8,883
363 12119000 Plants and parts of plants ( including seeds and fruits) of a kind used primarily in perfumery, in pharmacy or for insecticidal or similar purposes
Kg. 1,121,060 493,762,296
China P. R. 81,554 12,326,351 Pakistan 53,086 25,560,260 India 980,420 454,059,425 Suriname 6,000 1,816,260
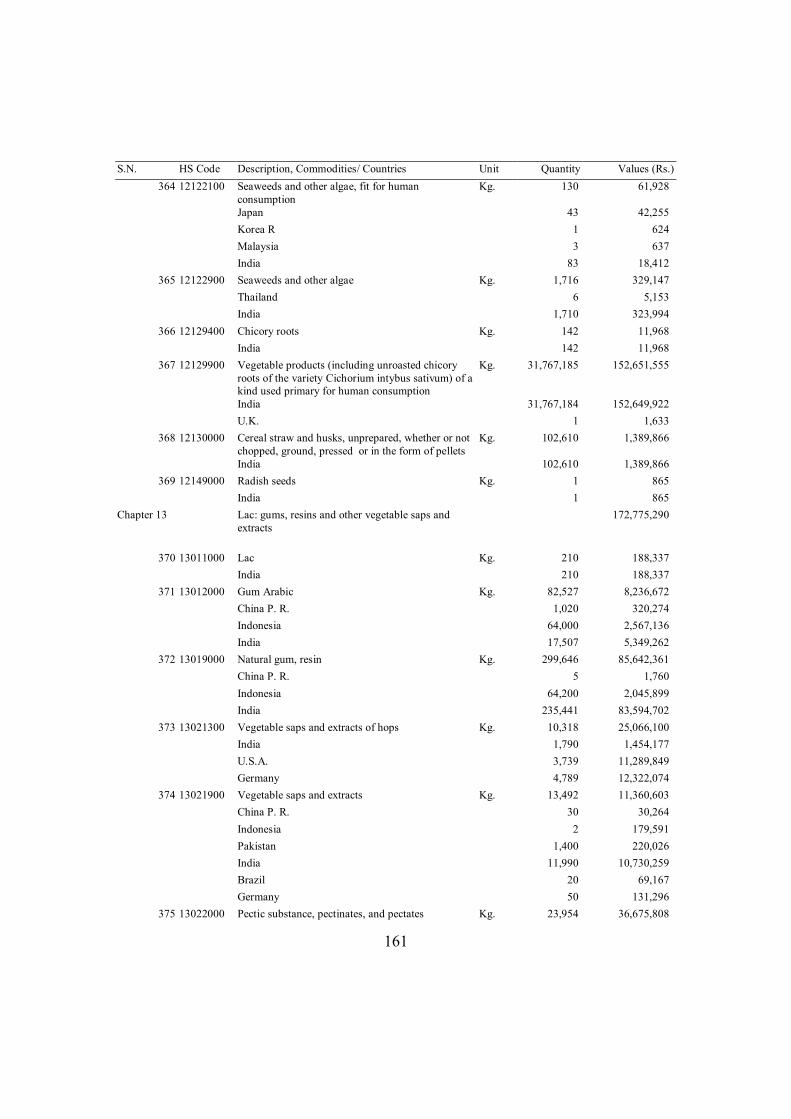
161
S.N. HS Code Description, Commodities/ Countries Unit Quantity Values (Rs.) 364 12122100 Seaweeds and other algae, fit for human
consumption Kg. 130 61,928
Japan 43 42,255 Korea R 1 624 Malaysia 3 637 India 83 18,412
365 12122900 Seaweeds and other algae Kg. 1,716 329,147 Thailand 6 5,153 India 1,710 323,994
366 12129400 Chicory roots Kg. 142 11,968 India 142 11,968
367 12129900 Vegetable products (including unroasted chicory roots of the variety Cichorium intybus sativum) of a kind used primary for human consumption
Kg. 31,767,185 152,651,555
India 31,767,184 152,649,922 U.K. 1 1,633
368 12130000 Cereal straw and husks, unprepared, whether or not chopped, ground, pressed or in the form of pellets
Kg. 102,610 1,389,866
India 102,610 1,389,866 369 12149000 Radish seeds Kg. 1 865
India 1 865 Chapter 13 Lac: gums, resins and other vegetable saps and
extracts 172,775,290
370 13011000 Lac Kg. 210 188,337 India 210 188,337
371 13012000 Gum Arabic Kg. 82,527 8,236,672 China P. R. 1,020 320,274 Indonesia 64,000 2,567,136 India 17,507 5,349,262
372 13019000 Natural gum, resin Kg. 299,646 85,642,361 China P. R. 5 1,760 Indonesia 64,200 2,045,899 India 235,441 83,594,702
373 13021300 Vegetable saps and extracts of hops Kg. 10,318 25,066,100 India 1,790 1,454,177 U.S.A. 3,739 11,289,849 Germany 4,789 12,322,074
374 13021900 Vegetable saps and extracts Kg. 13,492 11,360,603 China P. R. 30 30,264 Indonesia 2 179,591 Pakistan 1,400 220,026 India 11,990 10,730,259 Brazil 20 69,167 Germany 50 131,296
375 13022000 Pectic substance, pectinates, and pectates Kg. 23,954 36,675,808
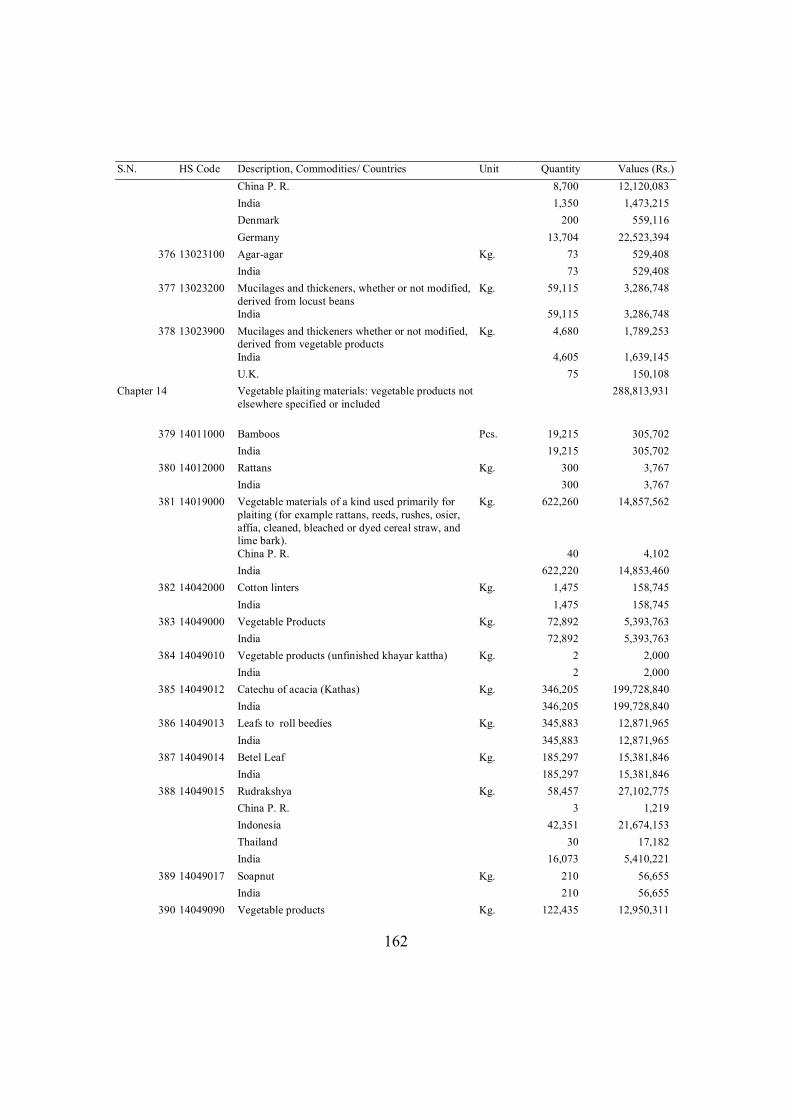
162
S.N. HS Code Description, Commodities/ Countries Unit Quantity Values (Rs.) China P. R. 8,700 12,120,083 India 1,350 1,473,215 Denmark 200 559,116 Germany 13,704 22,523,394
376 13023100 Agar-agar Kg. 73 529,408 India 73 529,408
377 13023200 Mucilages and thickeners, whether or not modified, derived from locust beans
Kg. 59,115 3,286,748
India 59,115 3,286,748 378 13023900 Mucilages and thickeners whether or not modified,
derived from vegetable products Kg. 4,680 1,789,253
India 4,605 1,639,145 U.K. 75 150,108
Chapter 14 Vegetable plaiting materials: vegetable products not elsewhere specified or included
288,813,931
379 14011000 Bamboos Pcs. 19,215 305,702 India 19,215 305,702
380 14012000 Rattans Kg. 300 3,767 India 300 3,767
381 14019000 Vegetable materials of a kind used primarily for plaiting (for example rattans, reeds, rushes, osier, affia, cleaned, bleached or dyed cereal straw, and lime bark).
Kg. 622,260 14,857,562
China P. R. 40 4,102 India 622,220 14,853,460
382 14042000 Cotton linters Kg. 1,475 158,745 India 1,475 158,745
383 14049000 Vegetable Products Kg. 72,892 5,393,763 India 72,892 5,393,763
384 14049010 Vegetable products (unfinished khayar kattha) Kg. 2 2,000 India 2 2,000
385 14049012 Catechu of acacia (Kathas) Kg. 346,205 199,728,840 India 346,205 199,728,840
386 14049013 Leafs to roll beedies Kg. 345,883 12,871,965 India 345,883 12,871,965
387 14049014 Betel Leaf Kg. 185,297 15,381,846 India 185,297 15,381,846
388 14049015 Rudrakshya Kg. 58,457 27,102,775 China P. R. 3 1,219 Indonesia 42,351 21,674,153 Thailand 30 17,182 India 16,073 5,410,221
389 14049017 Soapnut Kg. 210 56,655 India 210 56,655
390 14049090 Vegetable products Kg. 122,435 12,950,311
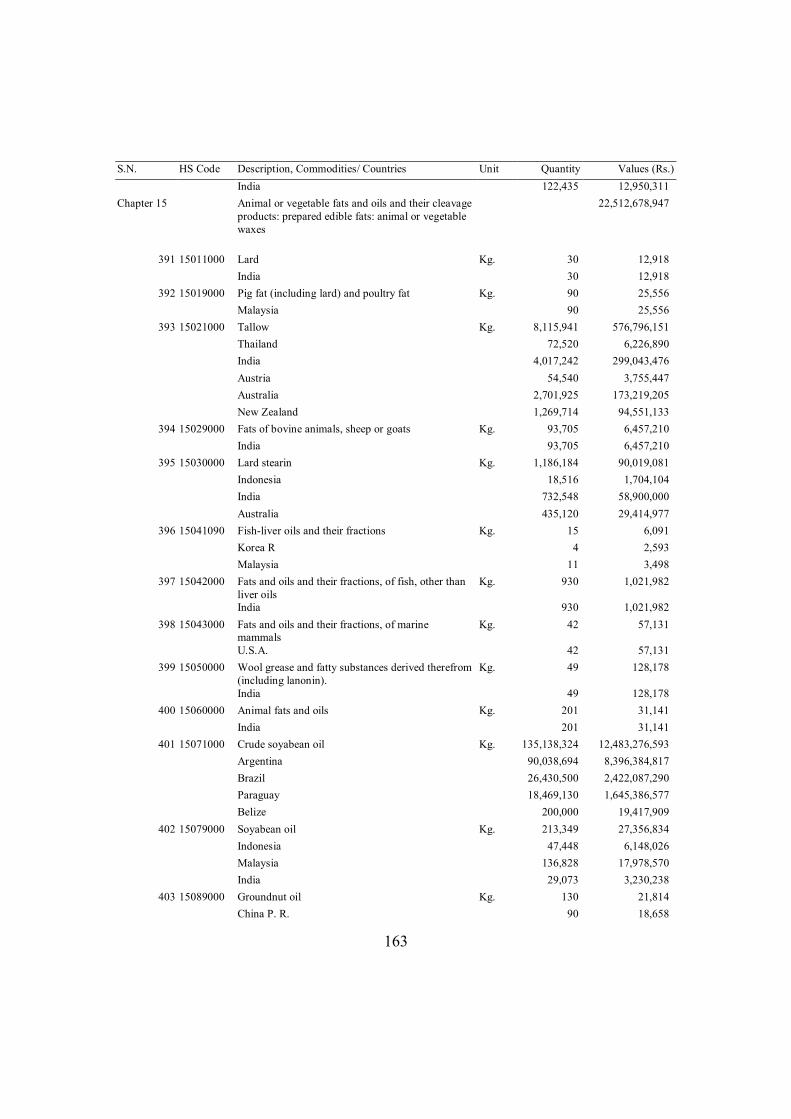
163
S.N. HS Code Description, Commodities/ Countries Unit Quantity Values (Rs.) India 122,435 12,950,311
Chapter 15 Animal or vegetable fats and oils and their cleavage products: prepared edible fats: animal or vegetable waxes
22,512,678,947
391 15011000 Lard Kg. 30 12,918 India 30 12,918
392 15019000 Pig fat (including lard) and poultry fat Kg. 90 25,556 Malaysia 90 25,556
393 15021000 Tallow Kg. 8,115,941 576,796,151 Thailand 72,520 6,226,890 India 4,017,242 299,043,476 Austria 54,540 3,755,447 Australia 2,701,925 173,219,205 New Zealand 1,269,714 94,551,133
394 15029000 Fats of bovine animals, sheep or goats Kg. 93,705 6,457,210 India 93,705 6,457,210
395 15030000 Lard stearin Kg. 1,186,184 90,019,081 Indonesia 18,516 1,704,104 India 732,548 58,900,000 Australia 435,120 29,414,977
396 15041090 Fish-liver oils and their fractions Kg. 15 6,091 Korea R 4 2,593 Malaysia 11 3,498
397 15042000 Fats and oils and their fractions, of fish, other than liver oils
Kg. 930 1,021,982
India 930 1,021,982 398 15043000 Fats and oils and their fractions, of marine
mammals Kg. 42 57,131
U.S.A. 42 57,131 399 15050000 Wool grease and fatty substances derived therefrom
(including lanonin). Kg. 49 128,178
India 49 128,178 400 15060000 Animal fats and oils Kg. 201 31,141
India 201 31,141 401 15071000 Crude soyabean oil Kg. 135,138,324 12,483,276,593
Argentina 90,038,694 8,396,384,817 Brazil 26,430,500 2,422,087,290 Paraguay 18,469,130 1,645,386,577 Belize 200,000 19,417,909
402 15079000 Soyabean oil Kg. 213,349 27,356,834 Indonesia 47,448 6,148,026 Malaysia 136,828 17,978,570 India 29,073 3,230,238
403 15089000 Groundnut oil Kg. 130 21,814 China P. R. 90 18,658
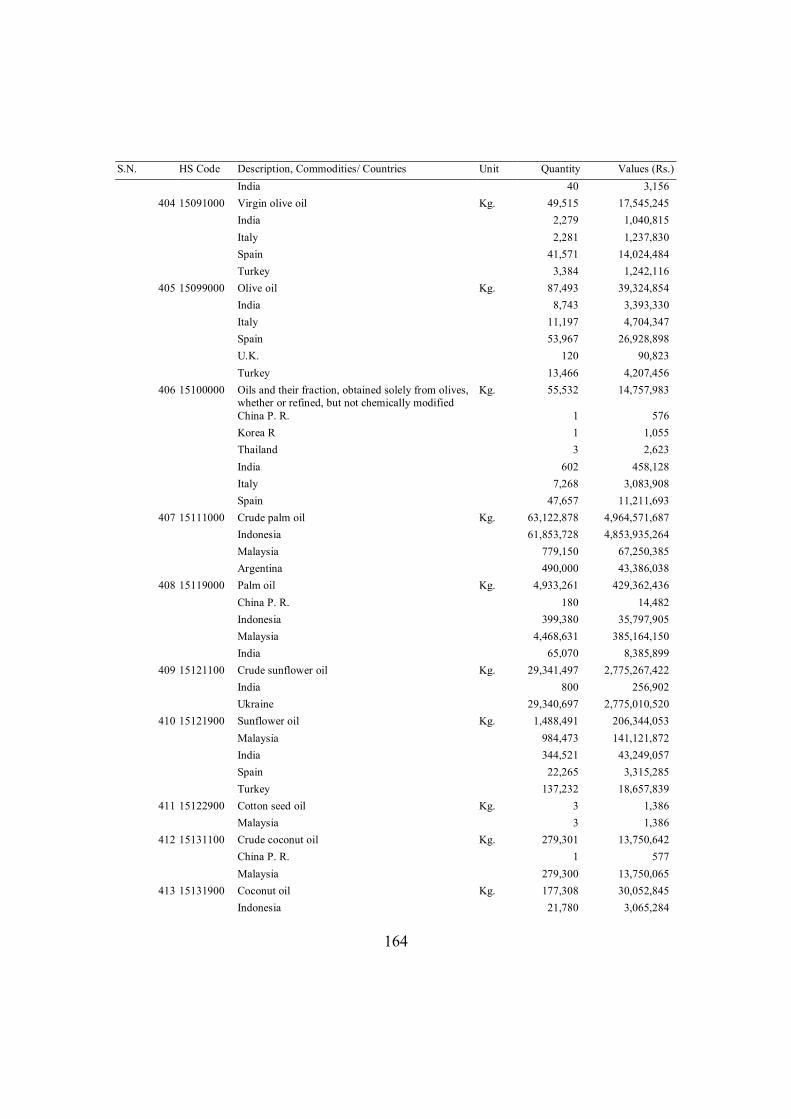
164
S.N. HS Code Description, Commodities/ Countries Unit Quantity Values (Rs.) India 40 3,156
404 15091000 Virgin olive oil Kg. 49,515 17,545,245 India 2,279 1,040,815 Italy 2,281 1,237,830 Spain 41,571 14,024,484 Turkey 3,384 1,242,116
405 15099000 Olive oil Kg. 87,493 39,324,854 India 8,743 3,393,330 Italy 11,197 4,704,347 Spain 53,967 26,928,898 U.K. 120 90,823 Turkey 13,466 4,207,456
406 15100000 Oils and their fraction, obtained solely from olives, whether or refined, but not chemically modified
Kg. 55,532 14,757,983
China P. R. 1 576 Korea R 1 1,055 Thailand 3 2,623 India 602 458,128 Italy 7,268 3,083,908 Spain 47,657 11,211,693
407 15111000 Crude palm oil Kg. 63,122,878 4,964,571,687 Indonesia 61,853,728 4,853,935,264 Malaysia 779,150 67,250,385 Argentina 490,000 43,386,038
408 15119000 Palm oil Kg. 4,933,261 429,362,436 China P. R. 180 14,482 Indonesia 399,380 35,797,905 Malaysia 4,468,631 385,164,150 India 65,070 8,385,899
409 15121100 Crude sunflower oil Kg. 29,341,497 2,775,267,422 India 800 256,902 Ukraine 29,340,697 2,775,010,520
410 15121900 Sunflower oil Kg. 1,488,491 206,344,053 Malaysia 984,473 141,121,872 India 344,521 43,249,057 Spain 22,265 3,315,285 Turkey 137,232 18,657,839
411 15122900 Cotton seed oil Kg. 3 1,386 Malaysia 3 1,386
412 15131100 Crude coconut oil Kg. 279,301 13,750,642 China P. R. 1 577 Malaysia 279,300 13,750,065
413 15131900 Coconut oil Kg. 177,308 30,052,845 Indonesia 21,780 3,065,284
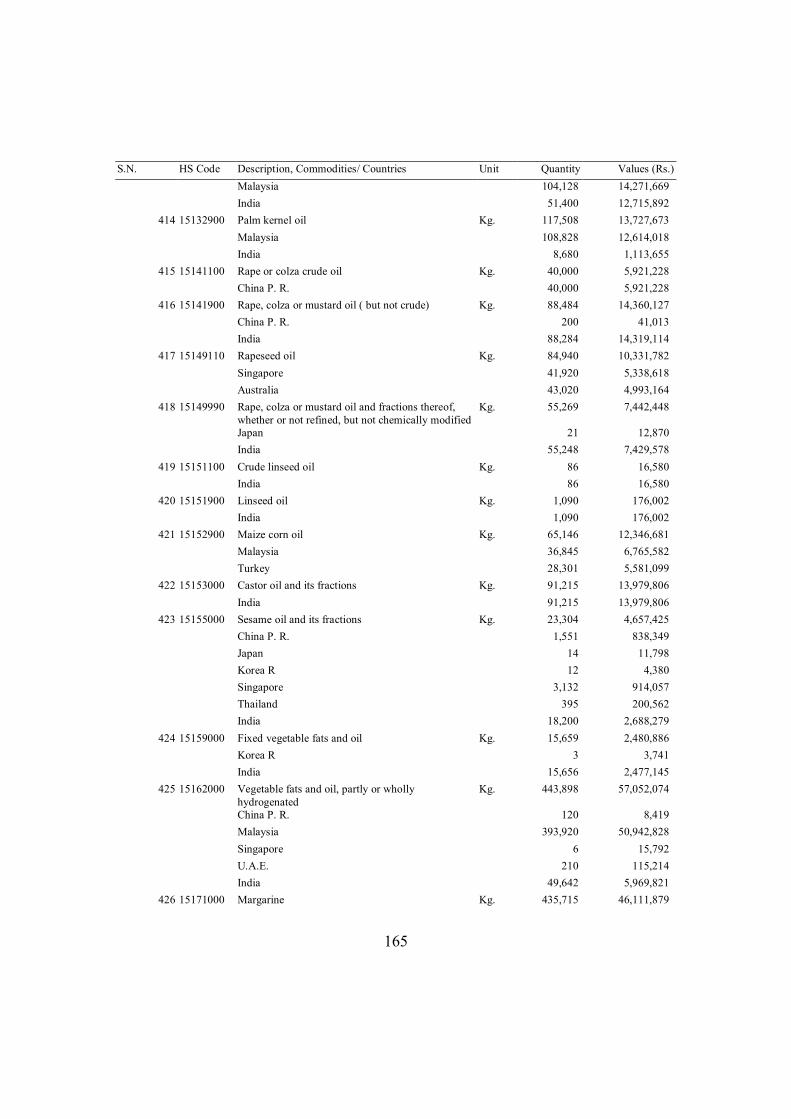
165
S.N. HS Code Description, Commodities/ Countries Unit Quantity Values (Rs.) Malaysia 104,128 14,271,669 India 51,400 12,715,892
414 15132900 Palm kernel oil Kg. 117,508 13,727,673 Malaysia 108,828 12,614,018 India 8,680 1,113,655
415 15141100 Rape or colza crude oil Kg. 40,000 5,921,228 China P. R. 40,000 5,921,228
416 15141900 Rape, colza or mustard oil ( but not crude) Kg. 88,484 14,360,127 China P. R. 200 41,013 India 88,284 14,319,114
417 15149110 Rapeseed oil Kg. 84,940 10,331,782 Singapore 41,920 5,338,618 Australia 43,020 4,993,164
418 15149990 Rape, colza or mustard oil and fractions thereof, whether or not refined, but not chemically modified
Kg. 55,269 7,442,448
Japan 21 12,870 India 55,248 7,429,578
419 15151100 Crude linseed oil Kg. 86 16,580 India 86 16,580
420 15151900 Linseed oil Kg. 1,090 176,002 India 1,090 176,002
421 15152900 Maize corn oil Kg. 65,146 12,346,681 Malaysia 36,845 6,765,582 Turkey 28,301 5,581,099
422 15153000 Castor oil and its fractions Kg. 91,215 13,979,806 India 91,215 13,979,806
423 15155000 Sesame oil and its fractions Kg. 23,304 4,657,425 China P. R. 1,551 838,349 Japan 14 11,798 Korea R 12 4,380 Singapore 3,132 914,057 Thailand 395 200,562 India 18,200 2,688,279
424 15159000 Fixed vegetable fats and oil Kg. 15,659 2,480,886 Korea R 3 3,741 India 15,656 2,477,145
425 15162000 Vegetable fats and oil, partly or wholly hydrogenated
Kg. 443,898 57,052,074
China P. R. 120 8,419 Malaysia 393,920 50,942,828 Singapore 6 15,792 U.A.E. 210 115,214 India 49,642 5,969,821
426 15171000 Margarine Kg. 435,715 46,111,879
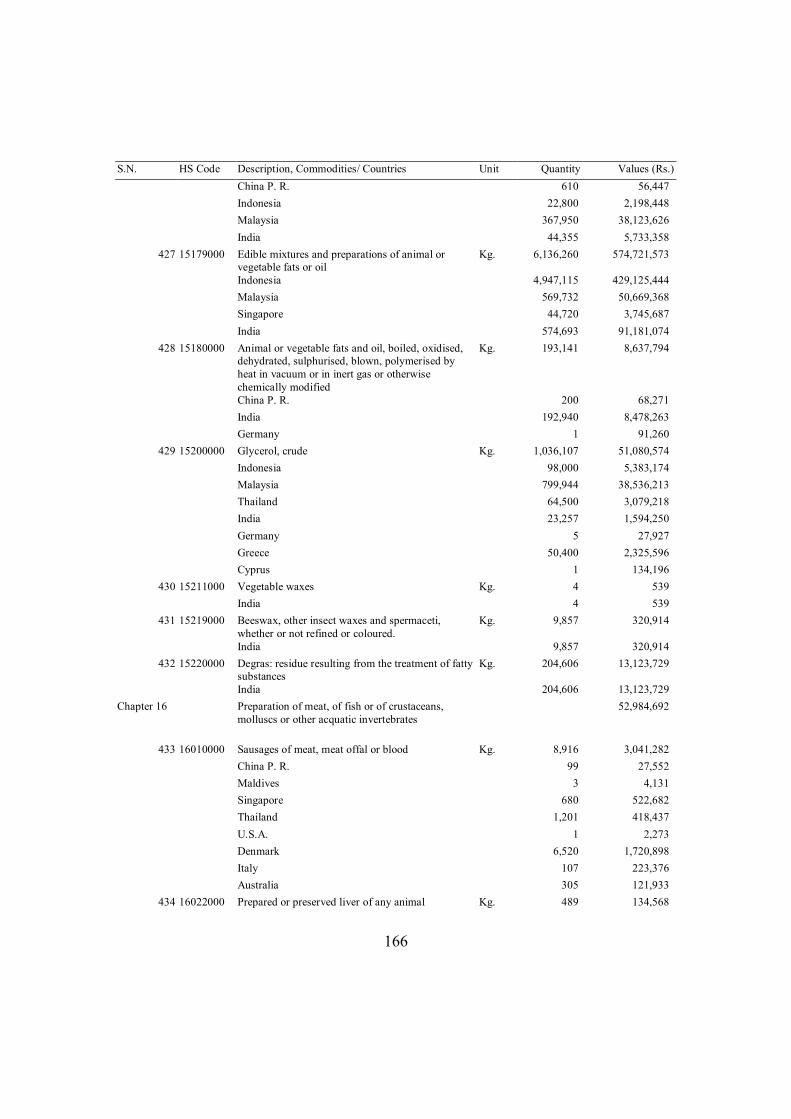
166
S.N. HS Code Description, Commodities/ Countries Unit Quantity Values (Rs.) China P. R. 610 56,447 Indonesia 22,800 2,198,448 Malaysia 367,950 38,123,626 India 44,355 5,733,358
427 15179000 Edible mixtures and preparations of animal or vegetable fats or oil
Kg. 6,136,260 574,721,573
Indonesia 4,947,115 429,125,444 Malaysia 569,732 50,669,368 Singapore 44,720 3,745,687 India 574,693 91,181,074
428 15180000 Animal or vegetable fats and oil, boiled, oxidised, dehydrated, sulphurised, blown, polymerised by heat in vacuum or in inert gas or otherwise chemically modified
Kg. 193,141 8,637,794
China P. R. 200 68,271 India 192,940 8,478,263 Germany 1 91,260
429 15200000 Glycerol, crude Kg. 1,036,107 51,080,574 Indonesia 98,000 5,383,174 Malaysia 799,944 38,536,213 Thailand 64,500 3,079,218 India 23,257 1,594,250 Germany 5 27,927 Greece 50,400 2,325,596 Cyprus 1 134,196
430 15211000 Vegetable waxes Kg. 4 539 India 4 539
431 15219000 Beeswax, other insect waxes and spermaceti, whether or not refined or coloured.
Kg. 9,857 320,914
India 9,857 320,914 432 15220000 Degras: residue resulting from the treatment of fatty
substances Kg. 204,606 13,123,729
India 204,606 13,123,729 Chapter 16 Preparation of meat, of fish or of crustaceans,
molluscs or other acquatic invertebrates 52,984,692
433 16010000 Sausages of meat, meat offal or blood Kg. 8,916 3,041,282 China P. R. 99 27,552 Maldives 3 4,131 Singapore 680 522,682 Thailand 1,201 418,437 U.S.A. 1 2,273 Denmark 6,520 1,720,898 Italy 107 223,376 Australia 305 121,933
434 16022000 Prepared or preserved liver of any animal Kg. 489 134,568
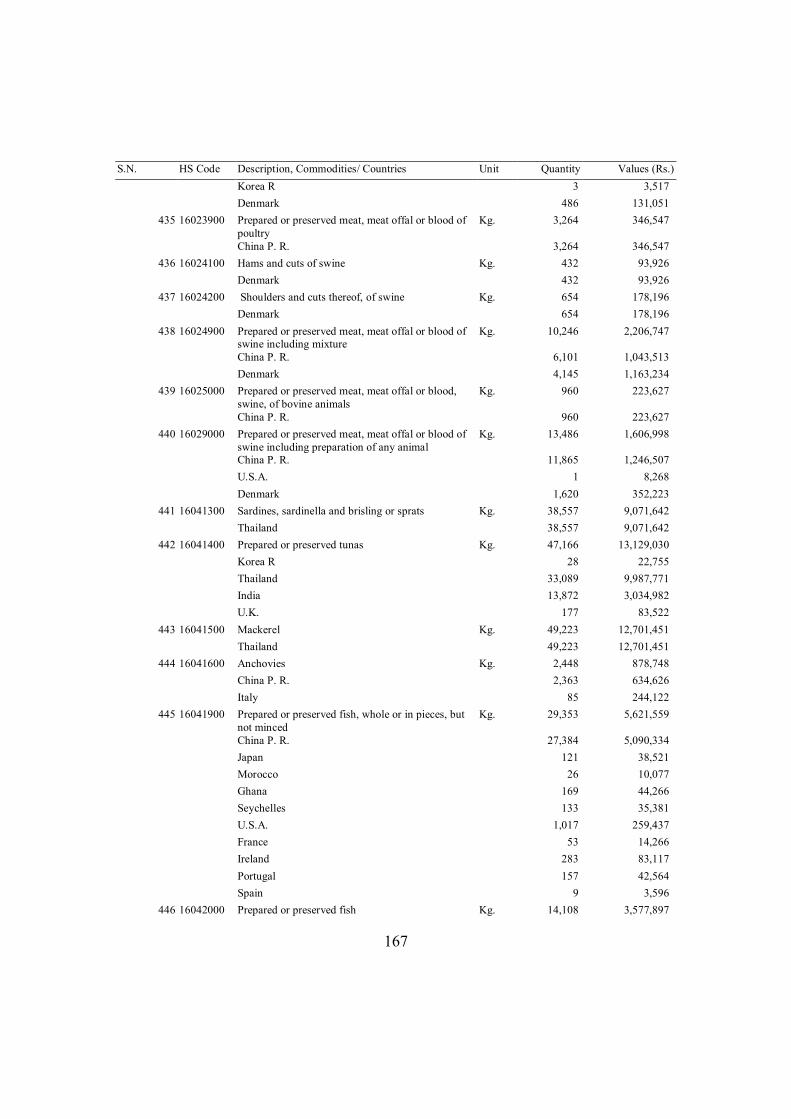
167
S.N. HS Code Description, Commodities/ Countries Unit Quantity Values (Rs.) Korea R 3 3,517 Denmark 486 131,051
435 16023900 Prepared or preserved meat, meat offal or blood of poultry
Kg. 3,264 346,547
China P. R. 3,264 346,547 436 16024100 Hams and cuts of swine Kg. 432 93,926
Denmark 432 93,926 437 16024200 Shoulders and cuts thereof, of swine Kg. 654 178,196
Denmark 654 178,196 438 16024900 Prepared or preserved meat, meat offal or blood of
swine including mixture Kg. 10,246 2,206,747
China P. R. 6,101 1,043,513 Denmark 4,145 1,163,234
439 16025000 Prepared or preserved meat, meat offal or blood, swine, of bovine animals
Kg. 960 223,627
China P. R. 960 223,627 440 16029000 Prepared or preserved meat, meat offal or blood of
swine including preparation of any animal Kg. 13,486 1,606,998
China P. R. 11,865 1,246,507 U.S.A. 1 8,268 Denmark 1,620 352,223
441 16041300 Sardines, sardinella and brisling or sprats Kg. 38,557 9,071,642 Thailand 38,557 9,071,642
442 16041400 Prepared or preserved tunas Kg. 47,166 13,129,030 Korea R 28 22,755 Thailand 33,089 9,987,771 India 13,872 3,034,982 U.K. 177 83,522
443 16041500 Mackerel Kg. 49,223 12,701,451 Thailand 49,223 12,701,451
444 16041600 Anchovies Kg. 2,448 878,748 China P. R. 2,363 634,626 Italy 85 244,122
445 16041900 Prepared or preserved fish, whole or in pieces, but not minced
Kg. 29,353 5,621,559
China P. R. 27,384 5,090,334 Japan 121 38,521 Morocco 26 10,077 Ghana 169 44,266 Seychelles 133 35,381 U.S.A. 1,017 259,437 France 53 14,266 Ireland 283 83,117 Portugal 157 42,564 Spain 9 3,596
446 16042000 Prepared or preserved fish Kg. 14,108 3,577,897
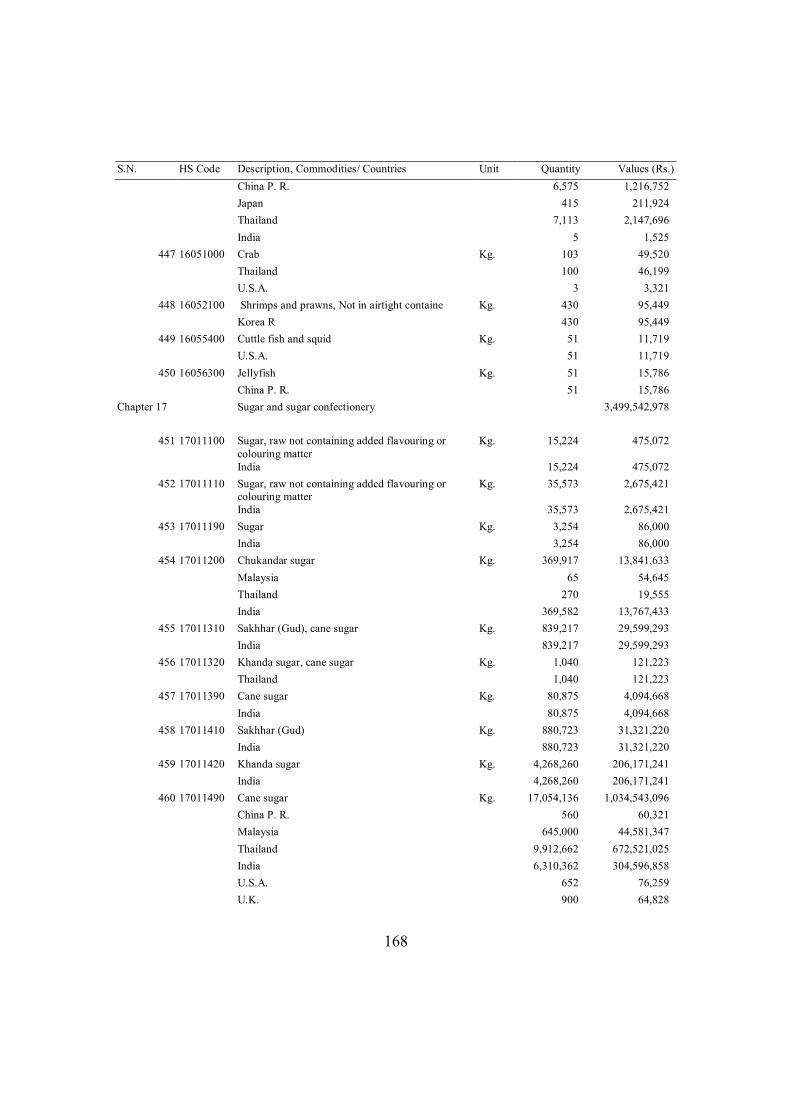
168
S.N. HS Code Description, Commodities/ Countries Unit Quantity Values (Rs.) China P. R. 6,575 1,216,752 Japan 415 211,924 Thailand 7,113 2,147,696 India 5 1,525
447 16051000 Crab Kg. 103 49,520 Thailand 100 46,199 U.S.A. 3 3,321
448 16052100 Shrimps and prawns, Not in airtight containe Kg. 430 95,449 Korea R 430 95,449
449 16055400 Cuttle fish and squid Kg. 51 11,719 U.S.A. 51 11,719
450 16056300 Jellyfish Kg. 51 15,786 China P. R. 51 15,786
Chapter 17 Sugar and sugar confectionery 3,499,542,978
451 17011100 Sugar, raw not containing added flavouring or colouring matter
Kg. 15,224 475,072
India 15,224 475,072 452 17011110 Sugar, raw not containing added flavouring or
colouring matter Kg. 35,573 2,675,421
India 35,573 2,675,421 453 17011190 Sugar Kg. 3,254 86,000
India 3,254 86,000 454 17011200 Chukandar sugar Kg. 369,917 13,841,633
Malaysia 65 54,645 Thailand 270 19,555 India 369,582 13,767,433
455 17011310 Sakhhar (Gud), cane sugar Kg. 839,217 29,599,293 India 839,217 29,599,293
456 17011320 Khanda sugar, cane sugar Kg. 1,040 121,223 Thailand 1,040 121,223
457 17011390 Cane sugar Kg. 80,875 4,094,668 India 80,875 4,094,668
458 17011410 Sakhhar (Gud) Kg. 880,723 31,321,220 India 880,723 31,321,220
459 17011420 Khanda sugar Kg. 4,268,260 206,171,241 India 4,268,260 206,171,241
460 17011490 Cane sugar Kg. 17,054,136 1,034,543,096 China P. R. 560 60,321 Malaysia 645,000 44,581,347 Thailand 9,912,662 672,521,025 India 6,310,362 304,596,858 U.S.A. 652 76,259 U.K. 900 64,828
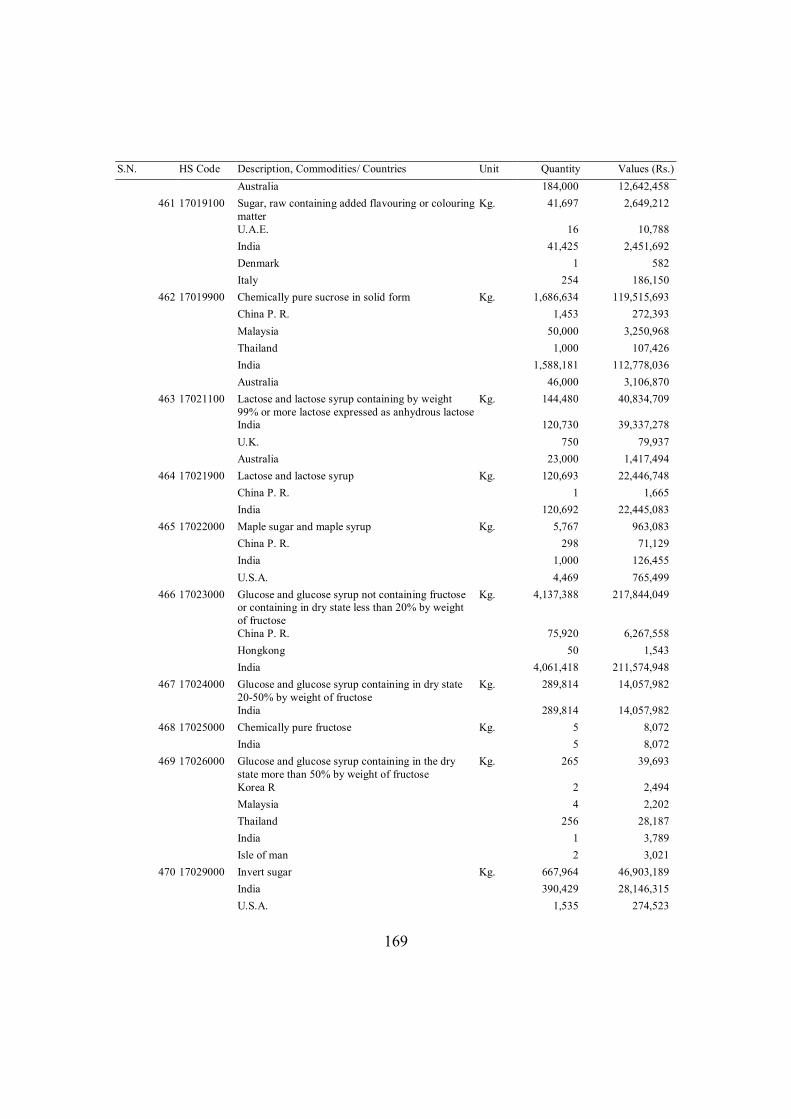
169
S.N. HS Code Description, Commodities/ Countries Unit Quantity Values (Rs.) Australia 184,000 12,642,458
461 17019100 Sugar, raw containing added flavouring or colouring matter
Kg. 41,697 2,649,212
U.A.E. 16 10,788 India 41,425 2,451,692 Denmark 1 582 Italy 254 186,150
462 17019900 Chemically pure sucrose in solid form Kg. 1,686,634 119,515,693 China P. R. 1,453 272,393 Malaysia 50,000 3,250,968 Thailand 1,000 107,426 India 1,588,181 112,778,036 Australia 46,000 3,106,870
463 17021100 Lactose and lactose syrup containing by weight 99% or more lactose expressed as anhydrous lactose
Kg. 144,480 40,834,709
India 120,730 39,337,278 U.K. 750 79,937 Australia 23,000 1,417,494
464 17021900 Lactose and lactose syrup Kg. 120,693 22,446,748 China P. R. 1 1,665 India 120,692 22,445,083
465 17022000 Maple sugar and maple syrup Kg. 5,767 963,083 China P. R. 298 71,129 India 1,000 126,455 U.S.A. 4,469 765,499
466 17023000 Glucose and glucose syrup not containing fructose or containing in dry state less than 20% by weight of fructose
Kg. 4,137,388 217,844,049
China P. R. 75,920 6,267,558 Hongkong 50 1,543 India 4,061,418 211,574,948
467 17024000 Glucose and glucose syrup containing in dry state 20-50% by weight of fructose
Kg. 289,814 14,057,982
India 289,814 14,057,982 468 17025000 Chemically pure fructose Kg. 5 8,072
India 5 8,072 469 17026000 Glucose and glucose syrup containing in the dry
state more than 50% by weight of fructose Kg. 265 39,693
Korea R 2 2,494 Malaysia 4 2,202 Thailand 256 28,187 India 1 3,789 Isle of man 2 3,021
470 17029000 Invert sugar Kg. 667,964 46,903,189 India 390,429 28,146,315 U.S.A. 1,535 274,523
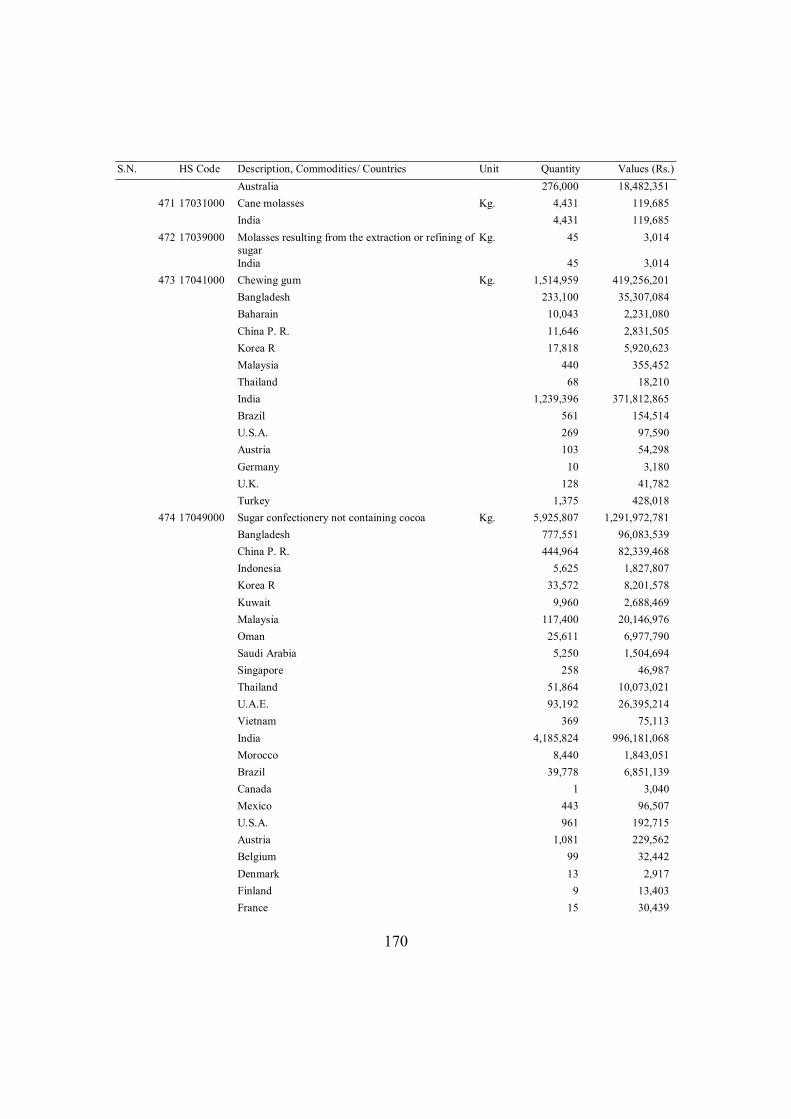
170
S.N. HS Code Description, Commodities/ Countries Unit Quantity Values (Rs.) Australia 276,000 18,482,351
471 17031000 Cane molasses Kg. 4,431 119,685 India 4,431 119,685
472 17039000 Molasses resulting from the extraction or refining of sugar
Kg. 45 3,014
India 45 3,014 473 17041000 Chewing gum Kg. 1,514,959 419,256,201
Bangladesh 233,100 35,307,084 Baharain 10,043 2,231,080 China P. R. 11,646 2,831,505 Korea R 17,818 5,920,623 Malaysia 440 355,452 Thailand 68 18,210 India 1,239,396 371,812,865 Brazil 561 154,514 U.S.A. 269 97,590 Austria 103 54,298 Germany 10 3,180 U.K. 128 41,782 Turkey 1,375 428,018
474 17049000 Sugar confectionery not containing cocoa Kg. 5,925,807 1,291,972,781 Bangladesh 777,551 96,083,539 China P. R. 444,964 82,339,468 Indonesia 5,625 1,827,807 Korea R 33,572 8,201,578 Kuwait 9,960 2,688,469 Malaysia 117,400 20,146,976 Oman 25,611 6,977,790 Saudi Arabia 5,250 1,504,694 Singapore 258 46,987 Thailand 51,864 10,073,021 U.A.E. 93,192 26,395,214 Vietnam 369 75,113 India 4,185,824 996,181,068 Morocco 8,440 1,843,051 Brazil 39,778 6,851,139 Canada 1 3,040 Mexico 443 96,507 U.S.A. 961 192,715 Austria 1,081 229,562 Belgium 99 32,442 Denmark 13 2,917 Finland 9 13,403 France 15 30,439
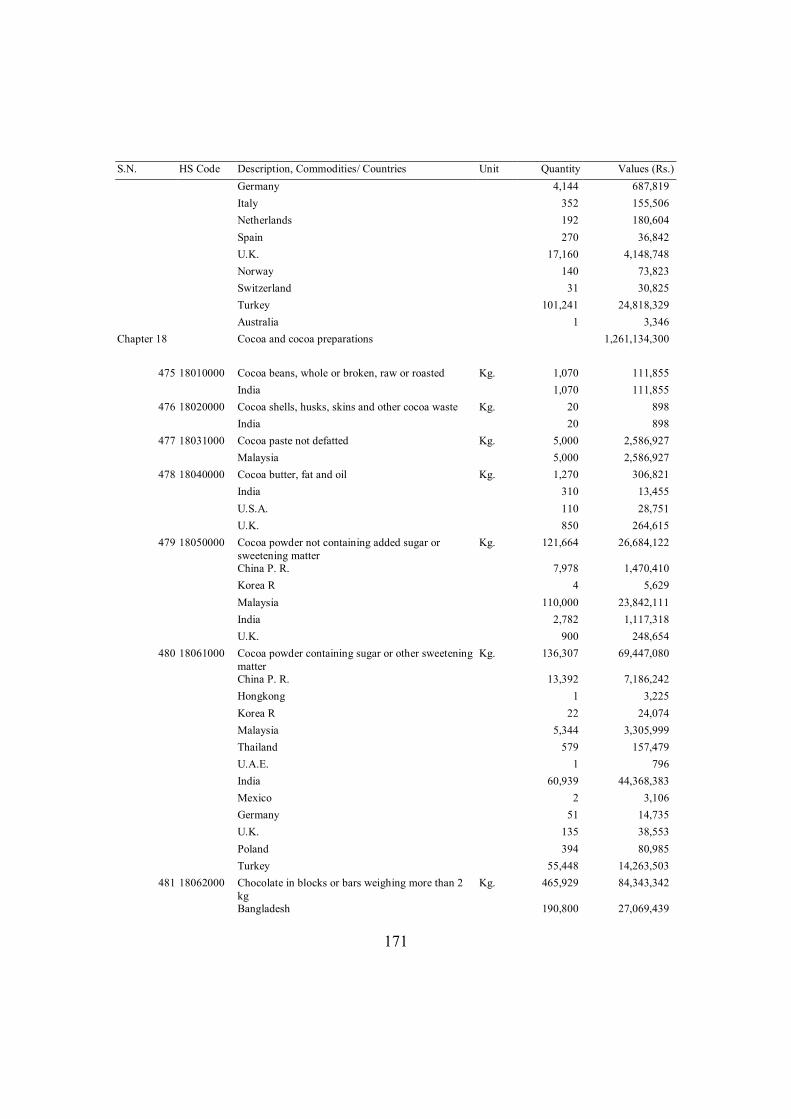
171
S.N. HS Code Description, Commodities/ Countries Unit Quantity Values (Rs.) Germany 4,144 687,819 Italy 352 155,506 Netherlands 192 180,604 Spain 270 36,842 U.K. 17,160 4,148,748 Norway 140 73,823 Switzerland 31 30,825 Turkey 101,241 24,818,329 Australia 1 3,346
Chapter 18 Cocoa and cocoa preparations 1,261,134,300
475 18010000 Cocoa beans, whole or broken, raw or roasted Kg. 1,070 111,855 India 1,070 111,855
476 18020000 Cocoa shells, husks, skins and other cocoa waste Kg. 20 898 India 20 898
477 18031000 Cocoa paste not defatted Kg. 5,000 2,586,927 Malaysia 5,000 2,586,927
478 18040000 Cocoa butter, fat and oil Kg. 1,270 306,821 India 310 13,455 U.S.A. 110 28,751 U.K. 850 264,615
479 18050000 Cocoa powder not containing added sugar or sweetening matter
Kg. 121,664 26,684,122
China P. R. 7,978 1,470,410 Korea R 4 5,629 Malaysia 110,000 23,842,111 India 2,782 1,117,318 U.K. 900 248,654
480 18061000 Cocoa powder containing sugar or other sweetening matter
Kg. 136,307 69,447,080
China P. R. 13,392 7,186,242 Hongkong 1 3,225 Korea R 22 24,074 Malaysia 5,344 3,305,999 Thailand 579 157,479 U.A.E. 1 796 India 60,939 44,368,383 Mexico 2 3,106 Germany 51 14,735 U.K. 135 38,553 Poland 394 80,985 Turkey 55,448 14,263,503
481 18062000 Chocolate in blocks or bars weighing more than 2 kg
Kg. 465,929 84,343,342
Bangladesh 190,800 27,069,439
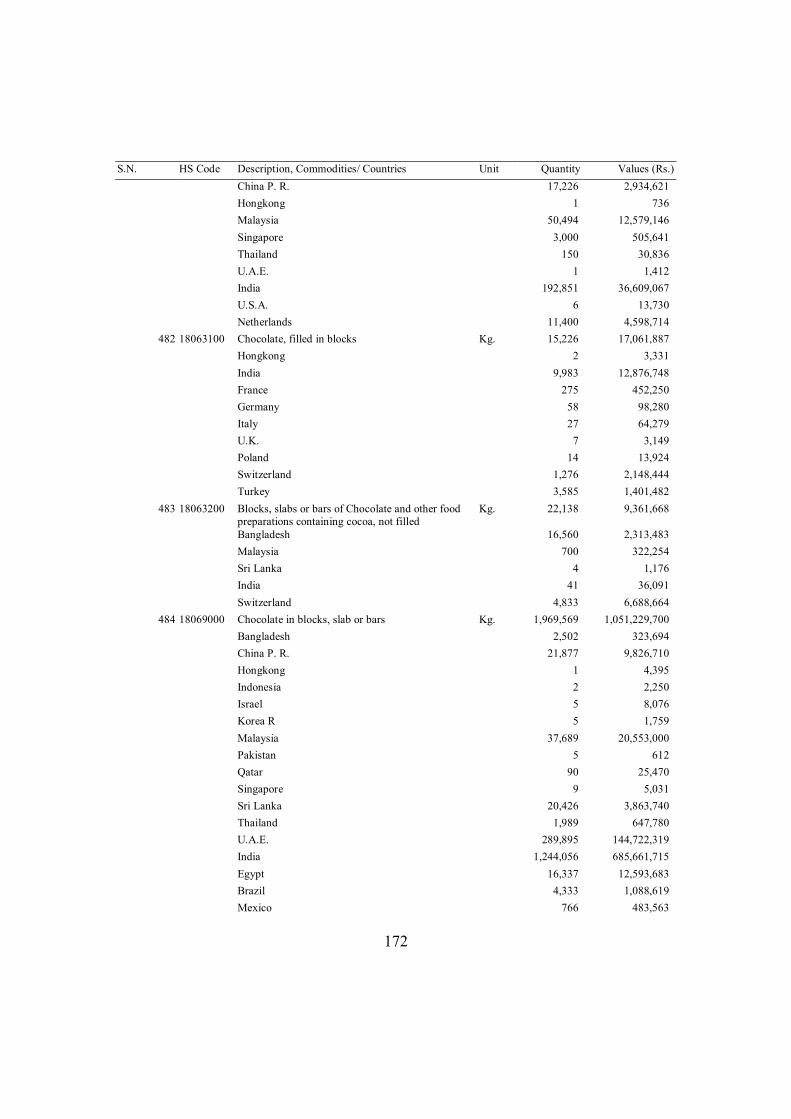
172
S.N. HS Code Description, Commodities/ Countries Unit Quantity Values (Rs.) China P. R. 17,226 2,934,621 Hongkong 1 736 Malaysia 50,494 12,579,146 Singapore 3,000 505,641 Thailand 150 30,836 U.A.E. 1 1,412 India 192,851 36,609,067 U.S.A. 6 13,730 Netherlands 11,400 4,598,714
482 18063100 Chocolate, filled in blocks Kg. 15,226 17,061,887 Hongkong 2 3,331 India 9,983 12,876,748 France 275 452,250 Germany 58 98,280 Italy 27 64,279 U.K. 7 3,149 Poland 14 13,924 Switzerland 1,276 2,148,444 Turkey 3,585 1,401,482
483 18063200 Blocks, slabs or bars of Chocolate and other food preparations containing cocoa, not filled
Kg. 22,138 9,361,668
Bangladesh 16,560 2,313,483 Malaysia 700 322,254 Sri Lanka 4 1,176 India 41 36,091 Switzerland 4,833 6,688,664
484 18069000 Chocolate in blocks, slab or bars Kg. 1,969,569 1,051,229,700 Bangladesh 2,502 323,694 China P. R. 21,877 9,826,710 Hongkong 1 4,395 Indonesia 2 2,250 Israel 5 8,076 Korea R 5 1,759 Malaysia 37,689 20,553,000 Pakistan 5 612 Qatar 90 25,470 Singapore 9 5,031 Sri Lanka 20,426 3,863,740 Thailand 1,989 647,780 U.A.E. 289,895 144,722,319 India 1,244,056 685,661,715 Egypt 16,337 12,593,683 Brazil 4,333 1,088,619 Mexico 766 483,563
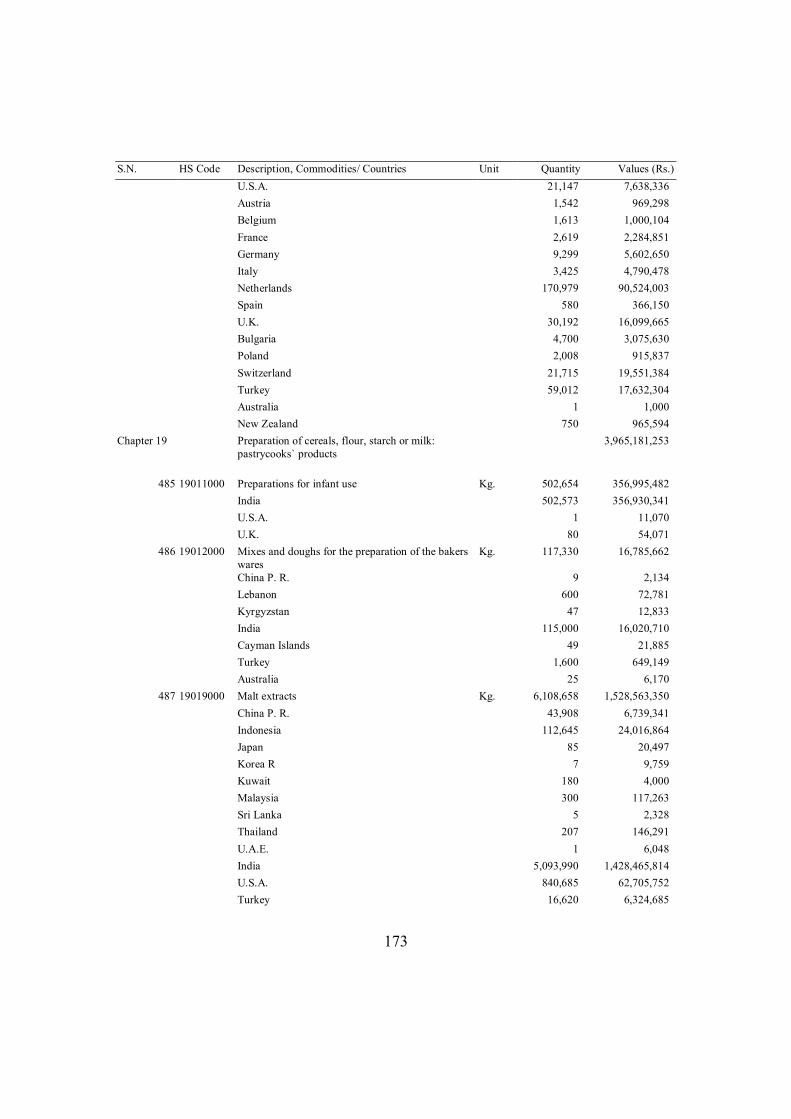
173
S.N. HS Code Description, Commodities/ Countries Unit Quantity Values (Rs.) U.S.A. 21,147 7,638,336 Austria 1,542 969,298 Belgium 1,613 1,000,104 France 2,619 2,284,851 Germany 9,299 5,602,650 Italy 3,425 4,790,478 Netherlands 170,979 90,524,003 Spain 580 366,150 U.K. 30,192 16,099,665 Bulgaria 4,700 3,075,630 Poland 2,008 915,837 Switzerland 21,715 19,551,384 Turkey 59,012 17,632,304 Australia 1 1,000 New Zealand 750 965,594
Chapter 19 Preparation of cereals, flour, starch or milk: pastrycooks` products
3,965,181,253
485 19011000 Preparations for infant use Kg. 502,654 356,995,482 India 502,573 356,930,341 U.S.A. 1 11,070 U.K. 80 54,071
486 19012000 Mixes and doughs for the preparation of the bakers wares
Kg. 117,330 16,785,662
China P. R. 9 2,134 Lebanon 600 72,781 Kyrgyzstan 47 12,833 India 115,000 16,020,710 Cayman Islands 49 21,885 Turkey 1,600 649,149 Australia 25 6,170
487 19019000 Malt extracts Kg. 6,108,658 1,528,563,350 China P. R. 43,908 6,739,341 Indonesia 112,645 24,016,864 Japan 85 20,497 Korea R 7 9,759 Kuwait 180 4,000 Malaysia 300 117,263 Sri Lanka 5 2,328 Thailand 207 146,291 U.A.E. 1 6,048 India 5,093,990 1,428,465,814 U.S.A. 840,685 62,705,752 Turkey 16,620 6,324,685
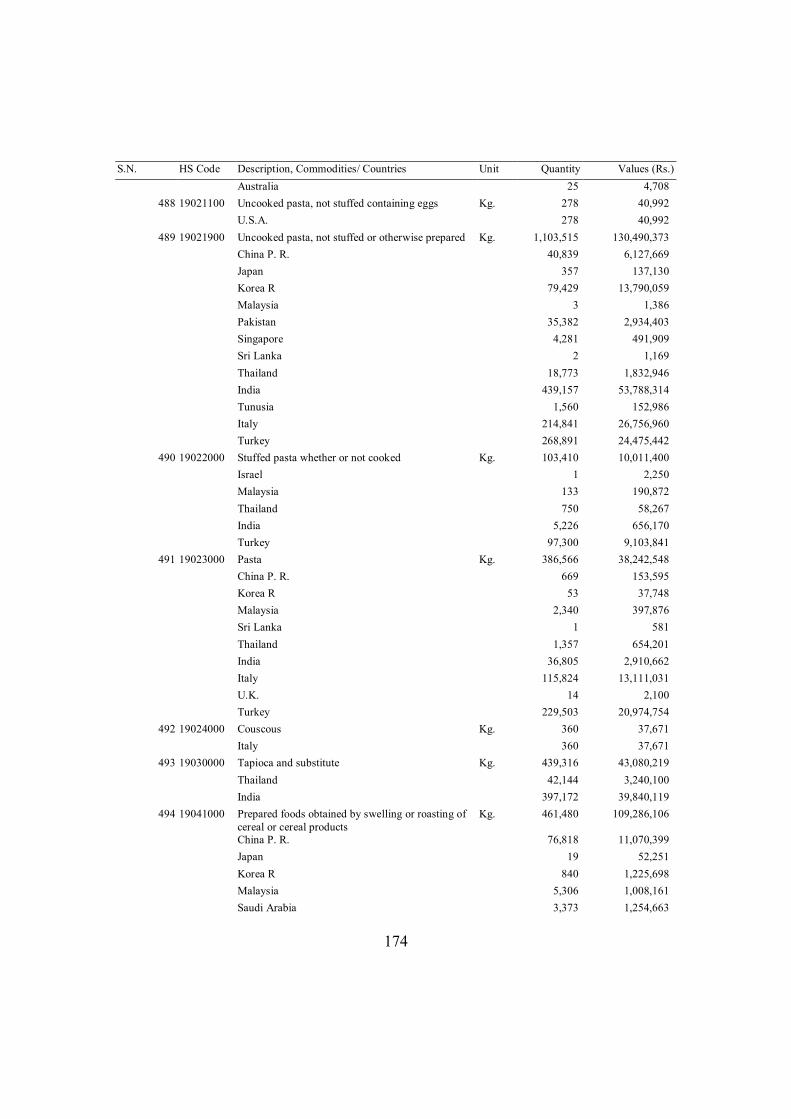
174
S.N. HS Code Description, Commodities/ Countries Unit Quantity Values (Rs.) Australia 25 4,708
488 19021100 Uncooked pasta, not stuffed containing eggs Kg. 278 40,992 U.S.A. 278 40,992
489 19021900 Uncooked pasta, not stuffed or otherwise prepared Kg. 1,103,515 130,490,373 China P. R. 40,839 6,127,669 Japan 357 137,130 Korea R 79,429 13,790,059 Malaysia 3 1,386 Pakistan 35,382 2,934,403 Singapore 4,281 491,909 Sri Lanka 2 1,169 Thailand 18,773 1,832,946 India 439,157 53,788,314 Tunusia 1,560 152,986 Italy 214,841 26,756,960 Turkey 268,891 24,475,442
490 19022000 Stuffed pasta whether or not cooked Kg. 103,410 10,011,400 Israel 1 2,250 Malaysia 133 190,872 Thailand 750 58,267 India 5,226 656,170 Turkey 97,300 9,103,841
491 19023000 Pasta Kg. 386,566 38,242,548 China P. R. 669 153,595 Korea R 53 37,748 Malaysia 2,340 397,876 Sri Lanka 1 581 Thailand 1,357 654,201 India 36,805 2,910,662 Italy 115,824 13,111,031 U.K. 14 2,100 Turkey 229,503 20,974,754
492 19024000 Couscous Kg. 360 37,671 Italy 360 37,671
493 19030000 Tapioca and substitute Kg. 439,316 43,080,219 Thailand 42,144 3,240,100 India 397,172 39,840,119
494 19041000 Prepared foods obtained by swelling or roasting of cereal or cereal products
Kg. 461,480 109,286,106
China P. R. 76,818 11,070,399 Japan 19 52,251 Korea R 840 1,225,698 Malaysia 5,306 1,008,161 Saudi Arabia 3,373 1,254,663
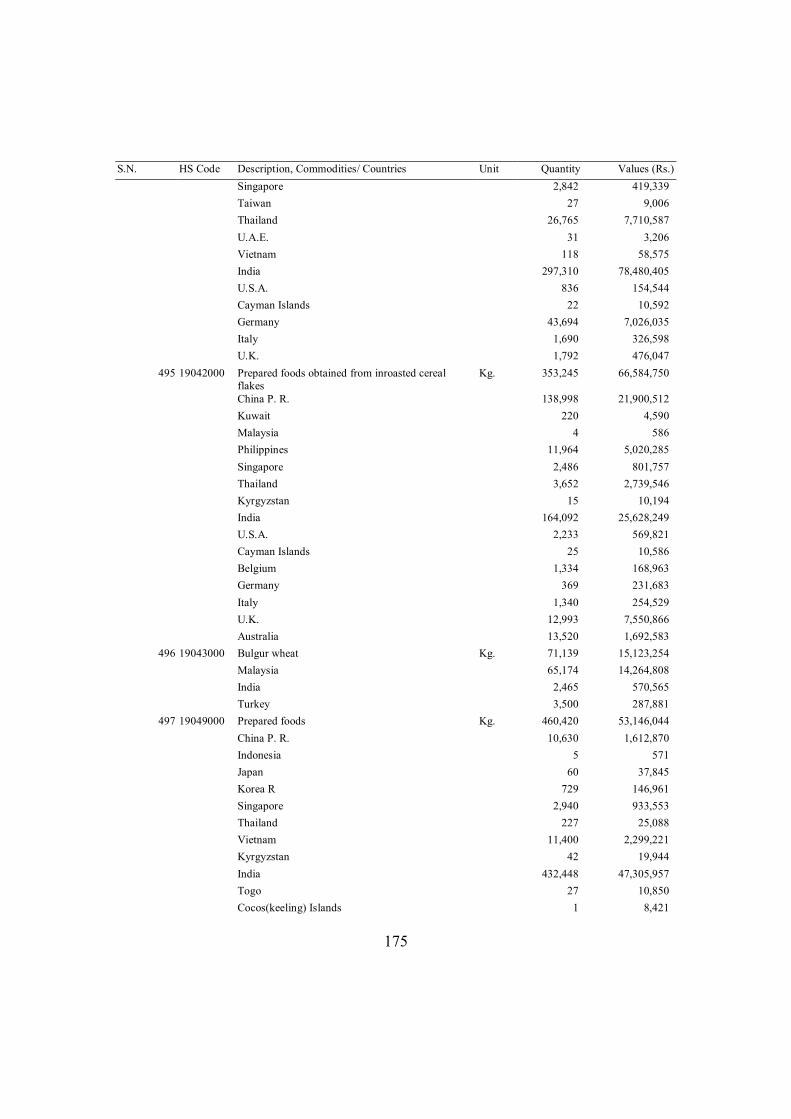
175
S.N. HS Code Description, Commodities/ Countries Unit Quantity Values (Rs.) Singapore 2,842 419,339 Taiwan 27 9,006 Thailand 26,765 7,710,587 U.A.E. 31 3,206 Vietnam 118 58,575 India 297,310 78,480,405 U.S.A. 836 154,544 Cayman Islands 22 10,592 Germany 43,694 7,026,035 Italy 1,690 326,598 U.K. 1,792 476,047
495 19042000 Prepared foods obtained from inroasted cereal flakes
Kg. 353,245 66,584,750
China P. R. 138,998 21,900,512 Kuwait 220 4,590 Malaysia 4 586 Philippines 11,964 5,020,285 Singapore 2,486 801,757 Thailand 3,652 2,739,546 Kyrgyzstan 15 10,194 India 164,092 25,628,249 U.S.A. 2,233 569,821 Cayman Islands 25 10,586 Belgium 1,334 168,963 Germany 369 231,683 Italy 1,340 254,529 U.K. 12,993 7,550,866 Australia 13,520 1,692,583
496 19043000 Bulgur wheat Kg. 71,139 15,123,254 Malaysia 65,174 14,264,808 India 2,465 570,565 Turkey 3,500 287,881
497 19049000 Prepared foods Kg. 460,420 53,146,044 China P. R. 10,630 1,612,870 Indonesia 5 571 Japan 60 37,845 Korea R 729 146,961 Singapore 2,940 933,553 Thailand 227 25,088 Vietnam 11,400 2,299,221 Kyrgyzstan 42 19,944 India 432,448 47,305,957 Togo 27 10,850 Cocos(keeling) Islands 1 8,421
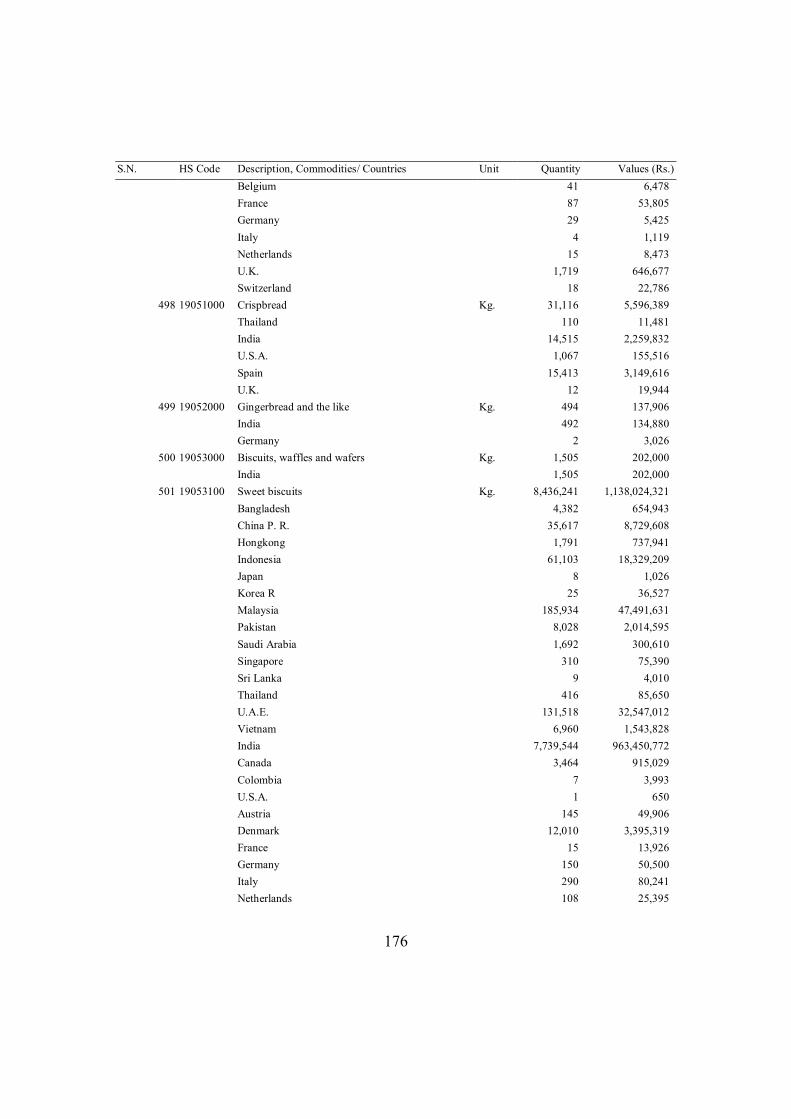
176
S.N. HS Code Description, Commodities/ Countries Unit Quantity Values (Rs.) Belgium 41 6,478 France 87 53,805 Germany 29 5,425 Italy 4 1,119 Netherlands 15 8,473 U.K. 1,719 646,677 Switzerland 18 22,786
498 19051000 Crispbread Kg. 31,116 5,596,389 Thailand 110 11,481 India 14,515 2,259,832 U.S.A. 1,067 155,516 Spain 15,413 3,149,616 U.K. 12 19,944
499 19052000 Gingerbread and the like Kg. 494 137,906 India 492 134,880 Germany 2 3,026
500 19053000 Biscuits, waffles and wafers Kg. 1,505 202,000 India 1,505 202,000
501 19053100 Sweet biscuits Kg. 8,436,241 1,138,024,321 Bangladesh 4,382 654,943 China P. R. 35,617 8,729,608 Hongkong 1,791 737,941 Indonesia 61,103 18,329,209 Japan 8 1,026 Korea R 25 36,527 Malaysia 185,934 47,491,631 Pakistan 8,028 2,014,595 Saudi Arabia 1,692 300,610 Singapore 310 75,390 Sri Lanka 9 4,010 Thailand 416 85,650 U.A.E. 131,518 32,547,012 Vietnam 6,960 1,543,828 India 7,739,544 963,450,772 Canada 3,464 915,029 Colombia 7 3,993 U.S.A. 1 650 Austria 145 49,906 Denmark 12,010 3,395,319 France 15 13,926 Germany 150 50,500 Italy 290 80,241 Netherlands 108 25,395
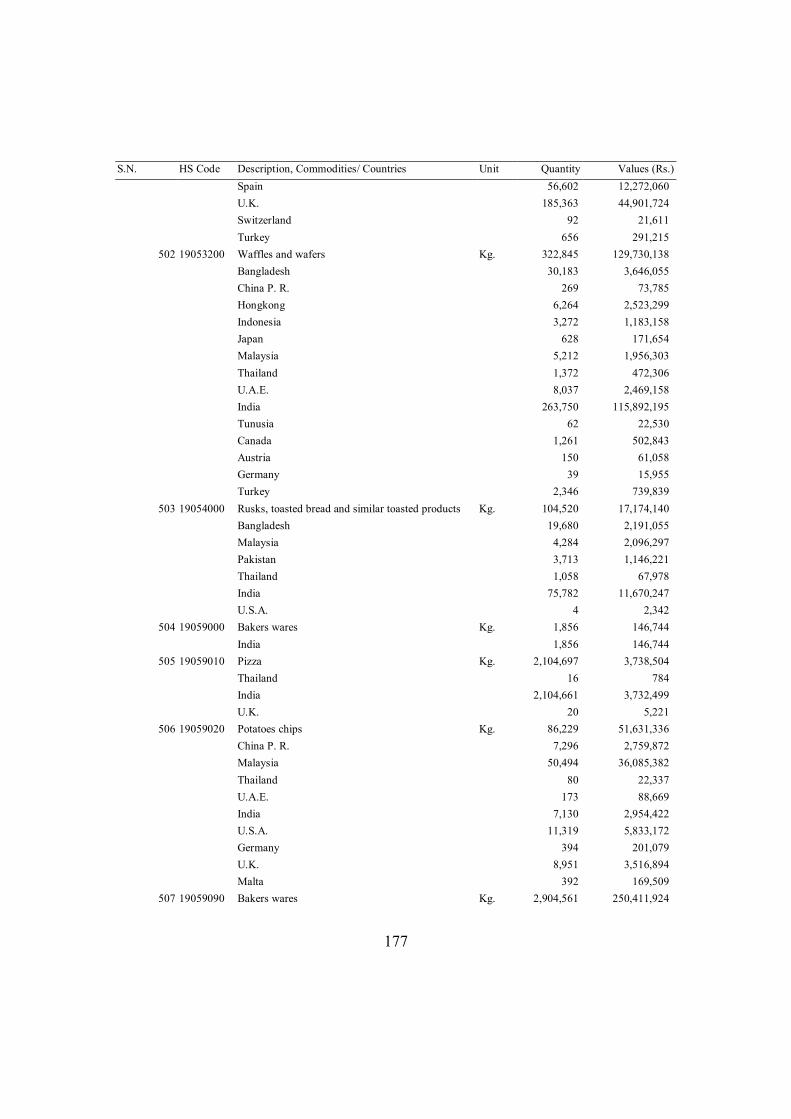
177
S.N. HS Code Description, Commodities/ Countries Unit Quantity Values (Rs.) Spain 56,602 12,272,060 U.K. 185,363 44,901,724 Switzerland 92 21,611 Turkey 656 291,215
502 19053200 Waffles and wafers Kg. 322,845 129,730,138 Bangladesh 30,183 3,646,055 China P. R. 269 73,785 Hongkong 6,264 2,523,299 Indonesia 3,272 1,183,158 Japan 628 171,654 Malaysia 5,212 1,956,303 Thailand 1,372 472,306 U.A.E. 8,037 2,469,158 India 263,750 115,892,195 Tunusia 62 22,530 Canada 1,261 502,843 Austria 150 61,058 Germany 39 15,955 Turkey 2,346 739,839
503 19054000 Rusks, toasted bread and similar toasted products Kg. 104,520 17,174,140 Bangladesh 19,680 2,191,055 Malaysia 4,284 2,096,297 Pakistan 3,713 1,146,221 Thailand 1,058 67,978 India 75,782 11,670,247 U.S.A. 4 2,342
504 19059000 Bakers wares Kg. 1,856 146,744 India 1,856 146,744
505 19059010 Pizza Kg. 2,104,697 3,738,504 Thailand 16 784 India 2,104,661 3,732,499 U.K. 20 5,221
506 19059020 Potatoes chips Kg. 86,229 51,631,336 China P. R. 7,296 2,759,872 Malaysia 50,494 36,085,382 Thailand 80 22,337 U.A.E. 173 88,669 India 7,130 2,954,422 U.S.A. 11,319 5,833,172 Germany 394 201,079 U.K. 8,951 3,516,894 Malta 392 169,509
507 19059090 Bakers wares Kg. 2,904,561 250,411,924
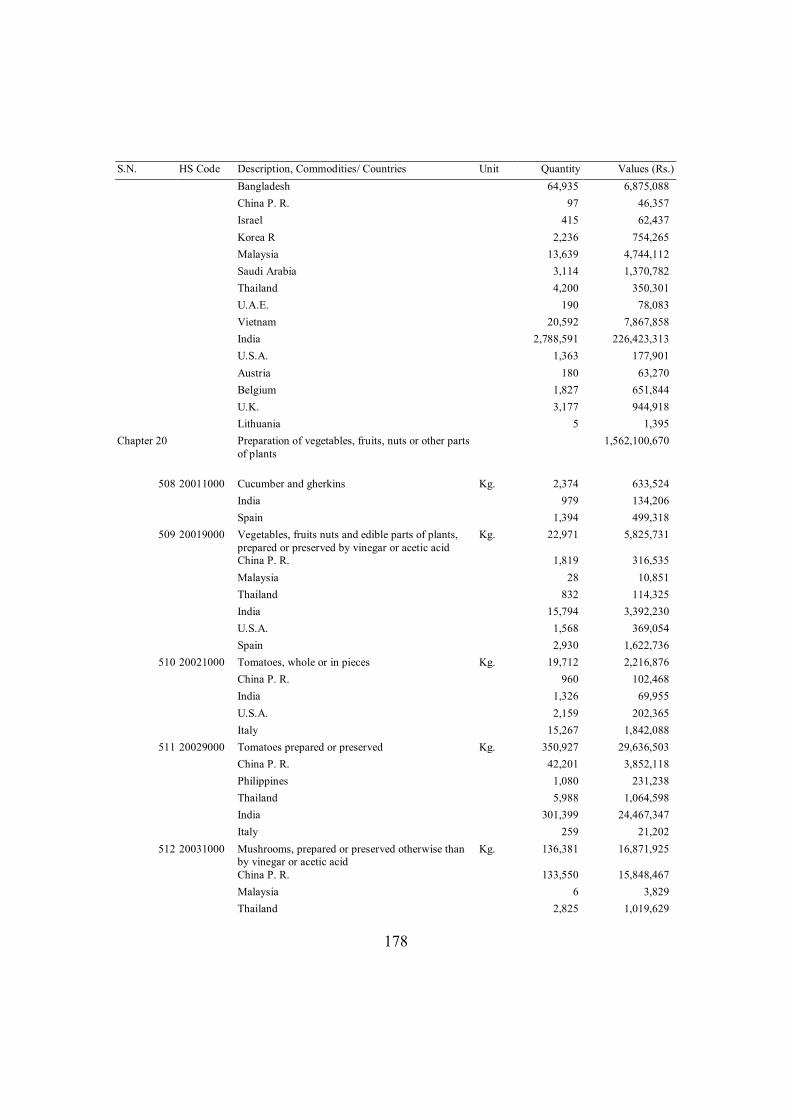
178
S.N. HS Code Description, Commodities/ Countries Unit Quantity Values (Rs.) Bangladesh 64,935 6,875,088 China P. R. 97 46,357 Israel 415 62,437 Korea R 2,236 754,265 Malaysia 13,639 4,744,112 Saudi Arabia 3,114 1,370,782 Thailand 4,200 350,301 U.A.E. 190 78,083 Vietnam 20,592 7,867,858 India 2,788,591 226,423,313 U.S.A. 1,363 177,901 Austria 180 63,270 Belgium 1,827 651,844 U.K. 3,177 944,918 Lithuania 5 1,395
Chapter 20 Preparation of vegetables, fruits, nuts or other parts of plants
1,562,100,670
508 20011000 Cucumber and gherkins Kg. 2,374 633,524 India 979 134,206 Spain 1,394 499,318
509 20019000 Vegetables, fruits nuts and edible parts of plants, prepared or preserved by vinegar or acetic acid
Kg. 22,971 5,825,731
China P. R. 1,819 316,535 Malaysia 28 10,851 Thailand 832 114,325 India 15,794 3,392,230 U.S.A. 1,568 369,054 Spain 2,930 1,622,736
510 20021000 Tomatoes, whole or in pieces Kg. 19,712 2,216,876 China P. R. 960 102,468 India 1,326 69,955 U.S.A. 2,159 202,365 Italy 15,267 1,842,088
511 20029000 Tomatoes prepared or preserved Kg. 350,927 29,636,503 China P. R. 42,201 3,852,118 Philippines 1,080 231,238 Thailand 5,988 1,064,598 India 301,399 24,467,347 Italy 259 21,202
512 20031000 Mushrooms, prepared or preserved otherwise than by vinegar or acetic acid
Kg. 136,381 16,871,925
China P. R. 133,550 15,848,467 Malaysia 6 3,829 Thailand 2,825 1,019,629
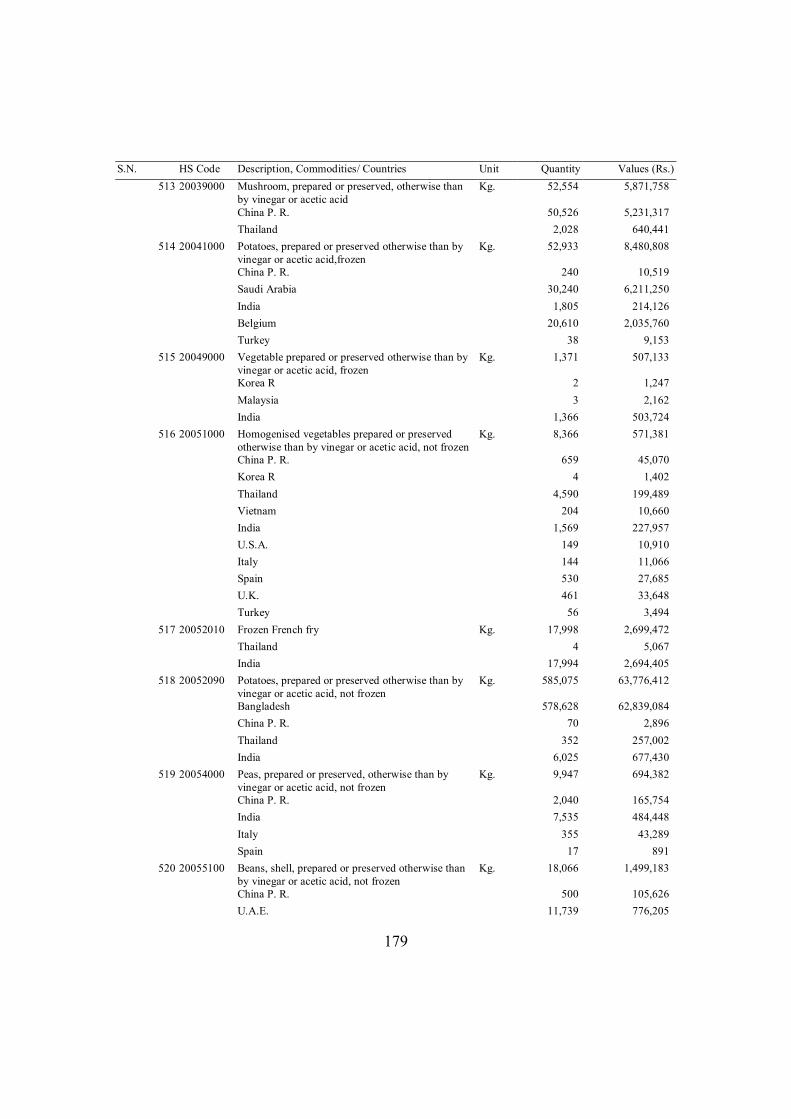
179
S.N. HS Code Description, Commodities/ Countries Unit Quantity Values (Rs.) 513 20039000 Mushroom, prepared or preserved, otherwise than
by vinegar or acetic acid Kg. 52,554 5,871,758
China P. R. 50,526 5,231,317 Thailand 2,028 640,441
514 20041000 Potatoes, prepared or preserved otherwise than by vinegar or acetic acid,frozen
Kg. 52,933 8,480,808
China P. R. 240 10,519 Saudi Arabia 30,240 6,211,250 India 1,805 214,126 Belgium 20,610 2,035,760 Turkey 38 9,153
515 20049000 Vegetable prepared or preserved otherwise than by vinegar or acetic acid, frozen
Kg. 1,371 507,133
Korea R 2 1,247 Malaysia 3 2,162 India 1,366 503,724
516 20051000 Homogenised vegetables prepared or preserved otherwise than by vinegar or acetic acid, not frozen
Kg. 8,366 571,381
China P. R. 659 45,070 Korea R 4 1,402 Thailand 4,590 199,489 Vietnam 204 10,660 India 1,569 227,957 U.S.A. 149 10,910 Italy 144 11,066 Spain 530 27,685 U.K. 461 33,648 Turkey 56 3,494
517 20052010 Frozen French fry Kg. 17,998 2,699,472 Thailand 4 5,067 India 17,994 2,694,405
518 20052090 Potatoes, prepared or preserved otherwise than by vinegar or acetic acid, not frozen
Kg. 585,075 63,776,412
Bangladesh 578,628 62,839,084 China P. R. 70 2,896 Thailand 352 257,002 India 6,025 677,430
519 20054000 Peas, prepared or preserved, otherwise than by vinegar or acetic acid, not frozen
Kg. 9,947 694,382
China P. R. 2,040 165,754 India 7,535 484,448 Italy 355 43,289 Spain 17 891
520 20055100 Beans, shell, prepared or preserved otherwise than by vinegar or acetic acid, not frozen
Kg. 18,066 1,499,183
China P. R. 500 105,626 U.A.E. 11,739 776,205
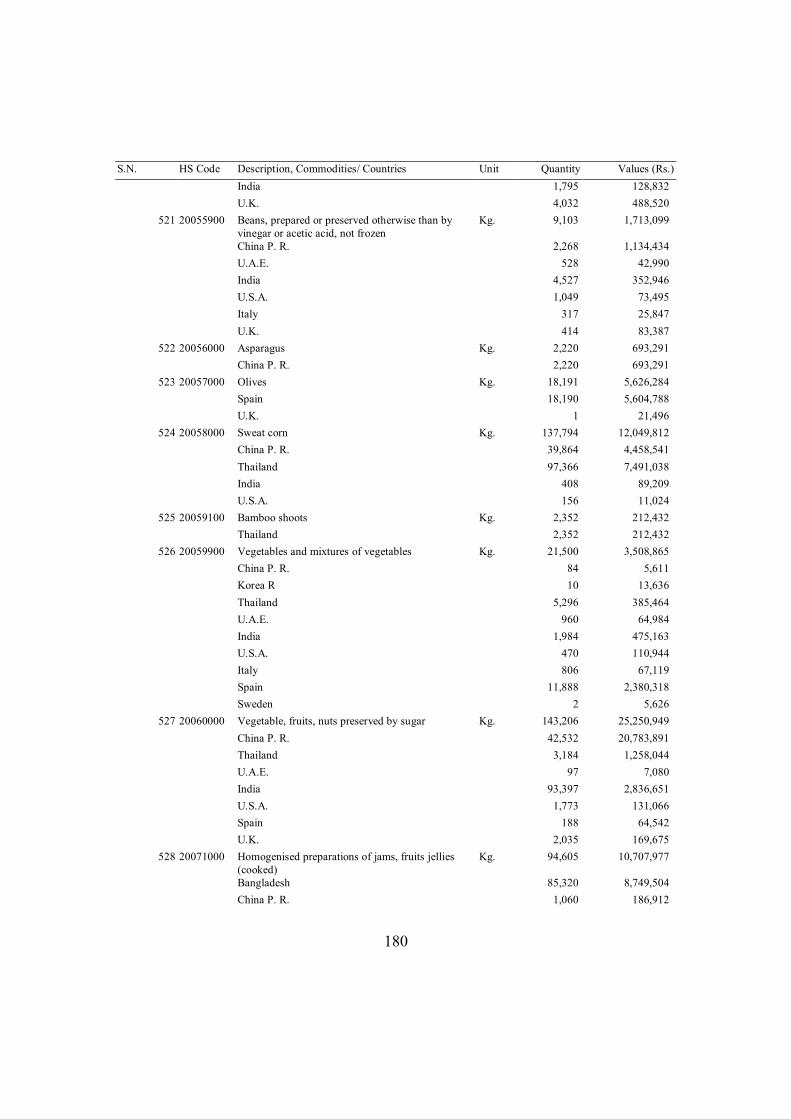
180
S.N. HS Code Description, Commodities/ Countries Unit Quantity Values (Rs.) India 1,795 128,832 U.K. 4,032 488,520
521 20055900 Beans, prepared or preserved otherwise than by vinegar or acetic acid, not frozen
Kg. 9,103 1,713,099
China P. R. 2,268 1,134,434 U.A.E. 528 42,990 India 4,527 352,946 U.S.A. 1,049 73,495 Italy 317 25,847 U.K. 414 83,387
522 20056000 Asparagus Kg. 2,220 693,291 China P. R. 2,220 693,291
523 20057000 Olives Kg. 18,191 5,626,284 Spain 18,190 5,604,788 U.K. 1 21,496
524 20058000 Sweat corn Kg. 137,794 12,049,812 China P. R. 39,864 4,458,541 Thailand 97,366 7,491,038 India 408 89,209 U.S.A. 156 11,024
525 20059100 Bamboo shoots Kg. 2,352 212,432 Thailand 2,352 212,432
526 20059900 Vegetables and mixtures of vegetables Kg. 21,500 3,508,865 China P. R. 84 5,611 Korea R 10 13,636 Thailand 5,296 385,464 U.A.E. 960 64,984 India 1,984 475,163 U.S.A. 470 110,944 Italy 806 67,119 Spain 11,888 2,380,318 Sweden 2 5,626
527 20060000 Vegetable, fruits, nuts preserved by sugar Kg. 143,206 25,250,949 China P. R. 42,532 20,783,891 Thailand 3,184 1,258,044 U.A.E. 97 7,080 India 93,397 2,836,651 U.S.A. 1,773 131,066 Spain 188 64,542 U.K. 2,035 169,675
528 20071000 Homogenised preparations of jams, fruits jellies (cooked)
Kg. 94,605 10,707,977
Bangladesh 85,320 8,749,504 China P. R. 1,060 186,912
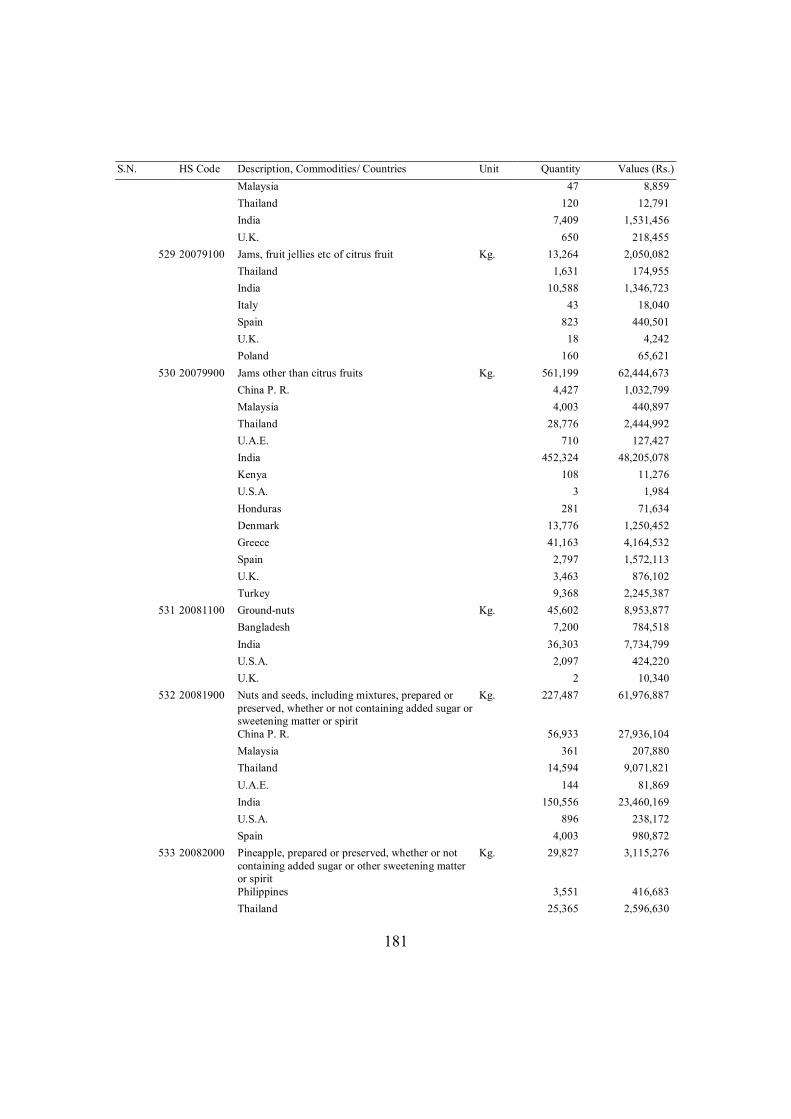
181
S.N. HS Code Description, Commodities/ Countries Unit Quantity Values (Rs.) Malaysia 47 8,859 Thailand 120 12,791 India 7,409 1,531,456 U.K. 650 218,455
529 20079100 Jams, fruit jellies etc of citrus fruit Kg. 13,264 2,050,082 Thailand 1,631 174,955 India 10,588 1,346,723 Italy 43 18,040 Spain 823 440,501 U.K. 18 4,242 Poland 160 65,621
530 20079900 Jams other than citrus fruits Kg. 561,199 62,444,673 China P. R. 4,427 1,032,799 Malaysia 4,003 440,897 Thailand 28,776 2,444,992 U.A.E. 710 127,427 India 452,324 48,205,078 Kenya 108 11,276 U.S.A. 3 1,984 Honduras 281 71,634 Denmark 13,776 1,250,452 Greece 41,163 4,164,532 Spain 2,797 1,572,113 U.K. 3,463 876,102 Turkey 9,368 2,245,387
531 20081100 Ground-nuts Kg. 45,602 8,953,877 Bangladesh 7,200 784,518 India 36,303 7,734,799 U.S.A. 2,097 424,220 U.K. 2 10,340
532 20081900 Nuts and seeds, including mixtures, prepared or preserved, whether or not containing added sugar or sweetening matter or spirit
Kg. 227,487 61,976,887
China P. R. 56,933 27,936,104 Malaysia 361 207,880 Thailand 14,594 9,071,821 U.A.E. 144 81,869 India 150,556 23,460,169 U.S.A. 896 238,172 Spain 4,003 980,872
533 20082000 Pineapple, prepared or preserved, whether or not containing added sugar or other sweetening matter or spirit
Kg. 29,827 3,115,276
Philippines 3,551 416,683 Thailand 25,365 2,596,630
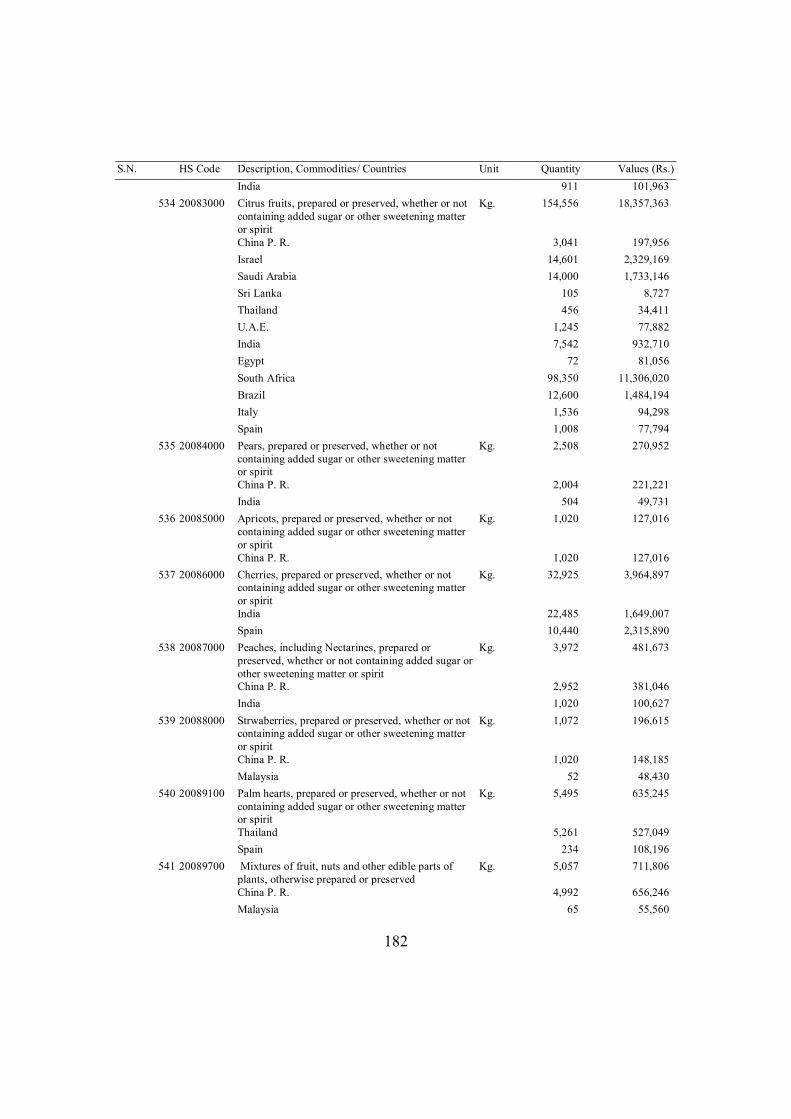
182
S.N. HS Code Description, Commodities/ Countries Unit Quantity Values (Rs.) India 911 101,963
534 20083000 Citrus fruits, prepared or preserved, whether or not containing added sugar or other sweetening matter or spirit
Kg. 154,556 18,357,363
China P. R. 3,041 197,956 Israel 14,601 2,329,169 Saudi Arabia 14,000 1,733,146 Sri Lanka 105 8,727 Thailand 456 34,411 U.A.E. 1,245 77,882 India 7,542 932,710 Egypt 72 81,056 South Africa 98,350 11,306,020 Brazil 12,600 1,484,194 Italy 1,536 94,298 Spain 1,008 77,794
535 20084000 Pears, prepared or preserved, whether or not containing added sugar or other sweetening matter or spirit
Kg. 2,508 270,952
China P. R. 2,004 221,221 India 504 49,731
536 20085000 Apricots, prepared or preserved, whether or not containing added sugar or other sweetening matter or spirit
Kg. 1,020 127,016
China P. R. 1,020 127,016 537 20086000 Cherries, prepared or preserved, whether or not
containing added sugar or other sweetening matter or spirit
Kg. 32,925 3,964,897
India 22,485 1,649,007 Spain 10,440 2,315,890
538 20087000 Peaches, including Nectarines, prepared or preserved, whether or not containing added sugar or other sweetening matter or spirit
Kg. 3,972 481,673
China P. R. 2,952 381,046 India 1,020 100,627
539 20088000 Strwaberries, prepared or preserved, whether or not containing added sugar or other sweetening matter or spirit
Kg. 1,072 196,615
China P. R. 1,020 148,185 Malaysia 52 48,430
540 20089100 Palm hearts, prepared or preserved, whether or not containing added sugar or other sweetening matter or spirit
Kg. 5,495 635,245
Thailand 5,261 527,049 Spain 234 108,196
541 20089700 Mixtures of fruit, nuts and other edible parts of plants, otherwise prepared or preserved
Kg. 5,057 711,806
China P. R. 4,992 656,246 Malaysia 65 55,560
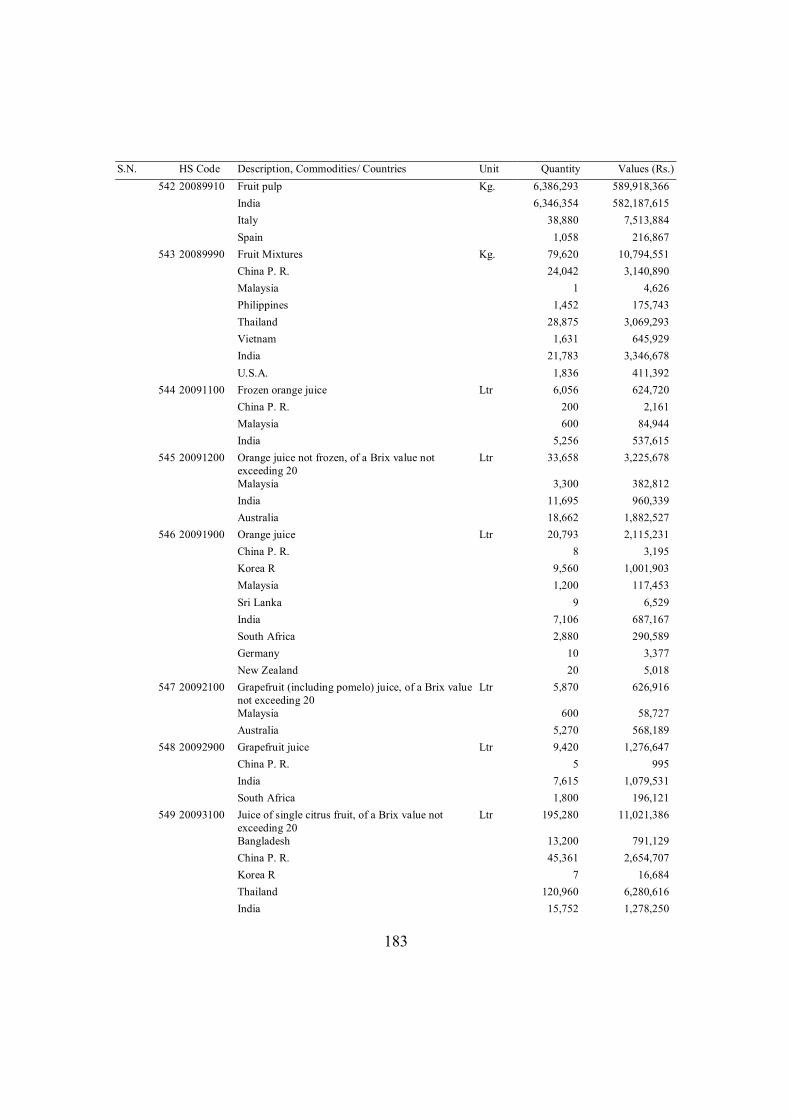
183
S.N. HS Code Description, Commodities/ Countries Unit Quantity Values (Rs.) 542 20089910 Fruit pulp Kg. 6,386,293 589,918,366
India 6,346,354 582,187,615 Italy 38,880 7,513,884 Spain 1,058 216,867
543 20089990 Fruit Mixtures Kg. 79,620 10,794,551 China P. R. 24,042 3,140,890 Malaysia 1 4,626 Philippines 1,452 175,743 Thailand 28,875 3,069,293 Vietnam 1,631 645,929 India 21,783 3,346,678 U.S.A. 1,836 411,392
544 20091100 Frozen orange juice Ltr 6,056 624,720 China P. R. 200 2,161 Malaysia 600 84,944 India 5,256 537,615
545 20091200 Orange juice not frozen, of a Brix value not exceeding 20
Ltr 33,658 3,225,678
Malaysia 3,300 382,812 India 11,695 960,339 Australia 18,662 1,882,527
546 20091900 Orange juice Ltr 20,793 2,115,231 China P. R. 8 3,195 Korea R 9,560 1,001,903 Malaysia 1,200 117,453 Sri Lanka 9 6,529 India 7,106 687,167 South Africa 2,880 290,589 Germany 10 3,377 New Zealand 20 5,018
547 20092100 Grapefruit (including pomelo) juice, of a Brix value not exceeding 20
Ltr 5,870 626,916
Malaysia 600 58,727 Australia 5,270 568,189
548 20092900 Grapefruit juice Ltr 9,420 1,276,647 China P. R. 5 995 India 7,615 1,079,531 South Africa 1,800 196,121
549 20093100 Juice of single citrus fruit, of a Brix value not exceeding 20
Ltr 195,280 11,021,386
Bangladesh 13,200 791,129 China P. R. 45,361 2,654,707 Korea R 7 16,684 Thailand 120,960 6,280,616 India 15,752 1,278,250
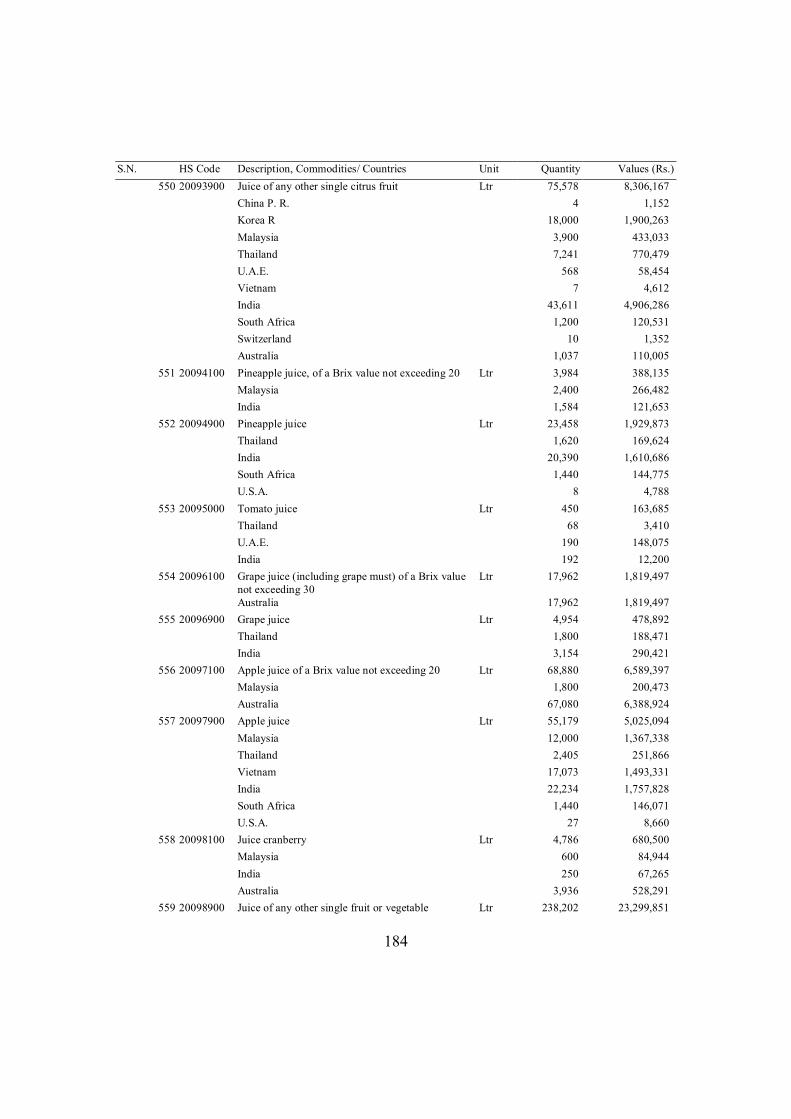
184
S.N. HS Code Description, Commodities/ Countries Unit Quantity Values (Rs.) 550 20093900 Juice of any other single citrus fruit Ltr 75,578 8,306,167
China P. R. 4 1,152 Korea R 18,000 1,900,263 Malaysia 3,900 433,033 Thailand 7,241 770,479 U.A.E. 568 58,454 Vietnam 7 4,612 India 43,611 4,906,286 South Africa 1,200 120,531 Switzerland 10 1,352 Australia 1,037 110,005
551 20094100 Pineapple juice, of a Brix value not exceeding 20 Ltr 3,984 388,135 Malaysia 2,400 266,482 India 1,584 121,653
552 20094900 Pineapple juice Ltr 23,458 1,929,873 Thailand 1,620 169,624 India 20,390 1,610,686 South Africa 1,440 144,775 U.S.A. 8 4,788
553 20095000 Tomato juice Ltr 450 163,685 Thailand 68 3,410 U.A.E. 190 148,075 India 192 12,200
554 20096100 Grape juice (including grape must) of a Brix value not exceeding 30
Ltr 17,962 1,819,497
Australia 17,962 1,819,497 555 20096900 Grape juice Ltr 4,954 478,892
Thailand 1,800 188,471 India 3,154 290,421
556 20097100 Apple juice of a Brix value not exceeding 20 Ltr 68,880 6,589,397 Malaysia 1,800 200,473 Australia 67,080 6,388,924
557 20097900 Apple juice Ltr 55,179 5,025,094 Malaysia 12,000 1,367,338 Thailand 2,405 251,866 Vietnam 17,073 1,493,331 India 22,234 1,757,828 South Africa 1,440 146,071 U.S.A. 27 8,660
558 20098100 Juice cranberry Ltr 4,786 680,500 Malaysia 600 84,944 India 250 67,265 Australia 3,936 528,291
559 20098900 Juice of any other single fruit or vegetable Ltr 238,202 23,299,851
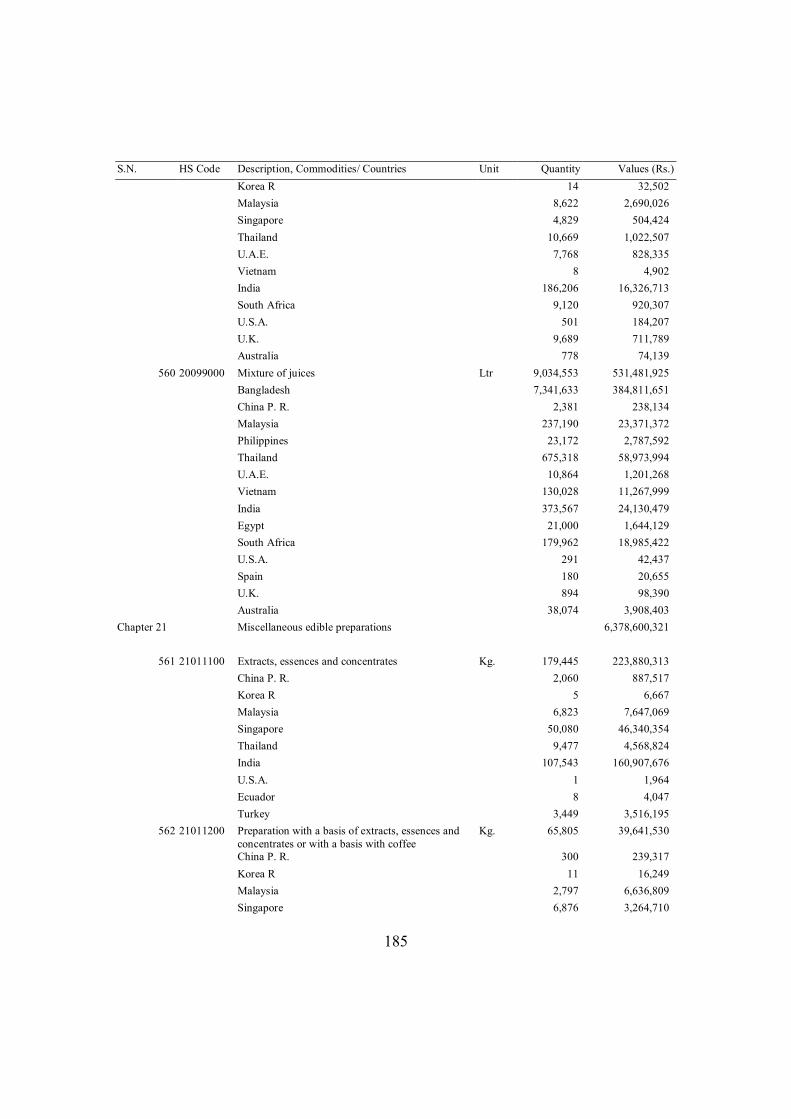
185
S.N. HS Code Description, Commodities/ Countries Unit Quantity Values (Rs.) Korea R 14 32,502 Malaysia 8,622 2,690,026 Singapore 4,829 504,424 Thailand 10,669 1,022,507 U.A.E. 7,768 828,335 Vietnam 8 4,902 India 186,206 16,326,713 South Africa 9,120 920,307 U.S.A. 501 184,207 U.K. 9,689 711,789 Australia 778 74,139
560 20099000 Mixture of juices Ltr 9,034,553 531,481,925 Bangladesh 7,341,633 384,811,651 China P. R. 2,381 238,134 Malaysia 237,190 23,371,372 Philippines 23,172 2,787,592 Thailand 675,318 58,973,994 U.A.E. 10,864 1,201,268 Vietnam 130,028 11,267,999 India 373,567 24,130,479 Egypt 21,000 1,644,129 South Africa 179,962 18,985,422 U.S.A. 291 42,437 Spain 180 20,655 U.K. 894 98,390 Australia 38,074 3,908,403
Chapter 21 Miscellaneous edible preparations 6,378,600,321
561 21011100 Extracts, essences and concentrates Kg. 179,445 223,880,313 China P. R. 2,060 887,517 Korea R 5 6,667 Malaysia 6,823 7,647,069 Singapore 50,080 46,340,354 Thailand 9,477 4,568,824 India 107,543 160,907,676 U.S.A. 1 1,964 Ecuador 8 4,047 Turkey 3,449 3,516,195
562 21011200 Preparation with a basis of extracts, essences and concentrates or with a basis with coffee
Kg. 65,805 39,641,530
China P. R. 300 239,317 Korea R 11 16,249 Malaysia 2,797 6,636,809 Singapore 6,876 3,264,710
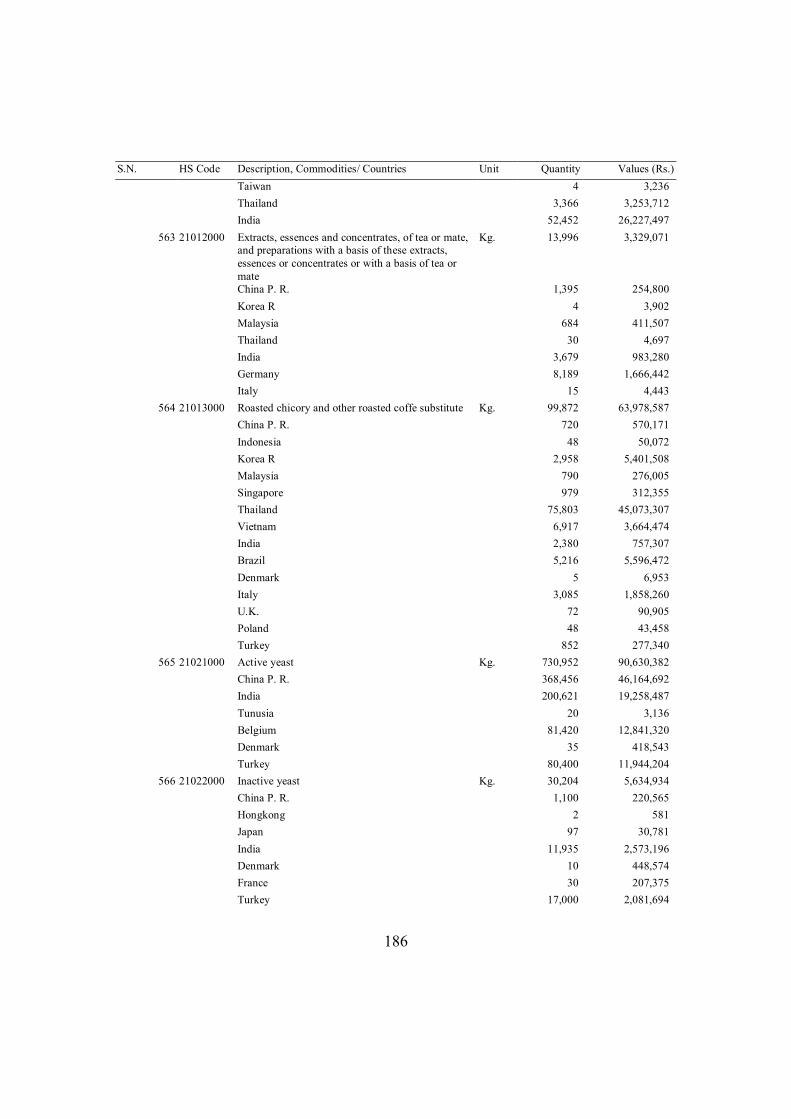
186
S.N. HS Code Description, Commodities/ Countries Unit Quantity Values (Rs.) Taiwan 4 3,236 Thailand 3,366 3,253,712 India 52,452 26,227,497
563 21012000 Extracts, essences and concentrates, of tea or mate, and preparations with a basis of these extracts, essences or concentrates or with a basis of tea or mate
Kg. 13,996 3,329,071
China P. R. 1,395 254,800 Korea R 4 3,902 Malaysia 684 411,507 Thailand 30 4,697 India 3,679 983,280 Germany 8,189 1,666,442 Italy 15 4,443
564 21013000 Roasted chicory and other roasted coffe substitute Kg. 99,872 63,978,587 China P. R. 720 570,171 Indonesia 48 50,072 Korea R 2,958 5,401,508 Malaysia 790 276,005 Singapore 979 312,355 Thailand 75,803 45,073,307 Vietnam 6,917 3,664,474 India 2,380 757,307 Brazil 5,216 5,596,472 Denmark 5 6,953 Italy 3,085 1,858,260 U.K. 72 90,905 Poland 48 43,458 Turkey 852 277,340
565 21021000 Active yeast Kg. 730,952 90,630,382 China P. R. 368,456 46,164,692 India 200,621 19,258,487 Tunusia 20 3,136 Belgium 81,420 12,841,320 Denmark 35 418,543 Turkey 80,400 11,944,204
566 21022000 Inactive yeast Kg. 30,204 5,634,934 China P. R. 1,100 220,565 Hongkong 2 581 Japan 97 30,781 India 11,935 2,573,196 Denmark 10 448,574 France 30 207,375 Turkey 17,000 2,081,694
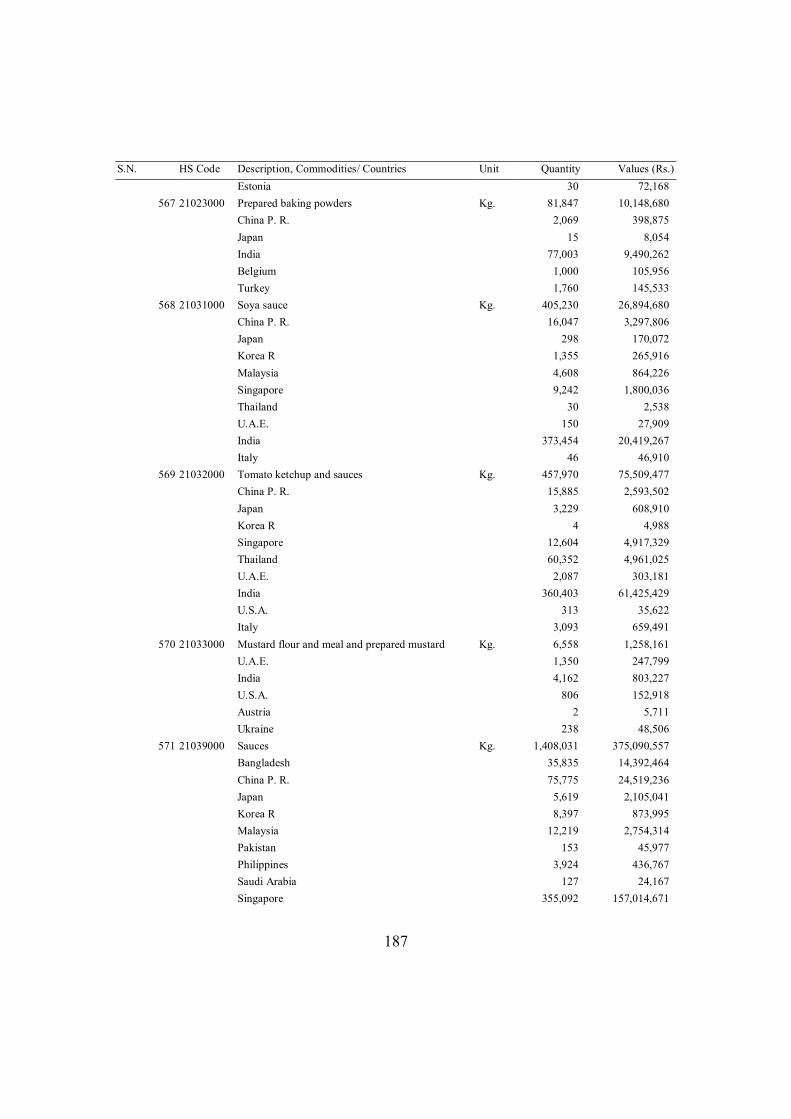
187
S.N. HS Code Description, Commodities/ Countries Unit Quantity Values (Rs.) Estonia 30 72,168
567 21023000 Prepared baking powders Kg. 81,847 10,148,680 China P. R. 2,069 398,875 Japan 15 8,054 India 77,003 9,490,262 Belgium 1,000 105,956 Turkey 1,760 145,533
568 21031000 Soya sauce Kg. 405,230 26,894,680 China P. R. 16,047 3,297,806 Japan 298 170,072 Korea R 1,355 265,916 Malaysia 4,608 864,226 Singapore 9,242 1,800,036 Thailand 30 2,538 U.A.E. 150 27,909 India 373,454 20,419,267 Italy 46 46,910
569 21032000 Tomato ketchup and sauces Kg. 457,970 75,509,477 China P. R. 15,885 2,593,502 Japan 3,229 608,910 Korea R 4 4,988 Singapore 12,604 4,917,329 Thailand 60,352 4,961,025 U.A.E. 2,087 303,181 India 360,403 61,425,429 U.S.A. 313 35,622 Italy 3,093 659,491
570 21033000 Mustard flour and meal and prepared mustard Kg. 6,558 1,258,161 U.A.E. 1,350 247,799 India 4,162 803,227 U.S.A. 806 152,918 Austria 2 5,711 Ukraine 238 48,506
571 21039000 Sauces Kg. 1,408,031 375,090,557 Bangladesh 35,835 14,392,464 China P. R. 75,775 24,519,236 Japan 5,619 2,105,041 Korea R 8,397 873,995 Malaysia 12,219 2,754,314 Pakistan 153 45,977 Philippines 3,924 436,767 Saudi Arabia 127 24,167 Singapore 355,092 157,014,671
188
S.N. HS Code Description, Commodities/ Countries Unit Quantity Values (Rs.) Sri Lanka 818 45,918 Thailand 168,269 45,281,738 U.A.E. 89,229 15,490,667 India 581,346 99,401,044 Egypt 288 65,064 South Africa 100 20,454 Tunusia 18 3,763 Sierra Leone 269 57,301 U.S.A. 64,091 10,468,728 Honduras 150 29,388 Austria 42 11,158 Belgium 1,450 308,740 Germany 20 41,354 Italy 3,715 1,384,829 Netherlands 103 21,290 U.K. 903 275,950 Poland 80 16,539
572 21041000 Soups and broths and preparations thereof Kg. 314,809 132,527,657 China P. R. 104 67,224 Japan 1,309 220,810 Korea R 38 26,137 Singapore 54,000 28,610,829 Thailand 5,349 2,461,744 India 204,553 80,829,683 Egypt 196 122,740 Ireland 88 92,693 Spain 6 4,680 U.K. 563 539,949 Turkey 48,602 19,551,168
573 21042000 Homogenised composite food preparation Kg. 137,796 48,597,957 Baharain 150 44,628 China P. R. 3,600 806,883 Hongkong 9 2,105 Japan 234 202,721 Thailand 559 56,691 U.A.E. 36 6,042 India 129,408 41,630,971 Egypt 288 22,147 U.S.A. 1,144 937,002 Australia 2,368 4,888,767
574 21050000 Icecream and other edible ice whether or not containing cocoa
Kg. 218,280 51,025,141
India 212,438 47,071,466 Mauritius 5,042 3,206,965
189
S.N. HS Code Description, Commodities/ Countries Unit Quantity Values (Rs.) France 8 7,230 Germany 40 36,786 Italy 608 671,744 Turkey 144 30,950
575 21061000 Protein concentrate and textured protein substance Kg. 234,908 214,375,867 China P. R. 15,906 10,649,296 Hongkong 1 718 Japan 25 16,612 Korea R 35 12,724 Malaysia 934 11,613,325 Taiwan 4 7,721 Thailand 8 2,551 U.A.E. 440 28,037 India 195,007 168,210,497 Canada 2 2,997 U.S.A. 20,288 20,297,880 Germany 254 216,217 Spain 9 164,140 U.K. 53 9,678 Hungary 98 893,264 Poland 10 5,107 Switzerland 1 4,691 Turkey 800 239,360 Australia 1,033 2,001,052
576 21069010 Dalmott, papad, salted bhujiya and chamena Kg. 3,226,877 439,594,392 Bangladesh 259 33,431 China P. R. 59,913 4,810,339 Hongkong 2 2,057 Indonesia 6 1,122 Japan 451 117,990 Malaysia 35 23,895 Singapore 308 487,778 Taiwan 54 18,541 Thailand 357 95,484 U.A.E. 480 29,893 India 3,164,480 433,958,864 U.S.A. 1 1,128 Netherlands 180 3,610 U.K. 350 10,260
577 21069020 Panmasala plain Kg. 6,916 1,886,294 India 6,916 1,886,294
578 21069030 Panmasala containing lime, kattha, or tobacco Kg. 64,344 1,446,146 China P. R. 25 1,544
190
S.N. HS Code Description, Commodities/ Countries Unit Quantity Values (Rs.) Japan 60,000 232,512 India 4,319 1,212,090
579 21069040 Concentrate of non-alcoholic soft drinks Kg. 8,950,540 3,467,763,860 China P. R. 785,301 123,930,696 Indonesia 183,690 38,919,273 Israel 2,658,490 486,405,355 Korea R 2 2,494 Malaysia 11,229 3,237,017 Taiwan 159,060 33,983,011 Thailand 621,258 118,463,234 India 325,023 585,997,822 Egypt 284,806 1,265,564,568 U.S.A. 20,000 12,691,486 Denmark 55,829 31,341,197 Germany 5,000 1,583,579 Netherlands 3,483,740 698,204,923 Spain 246,500 48,313,893 Turkey 110,612 19,125,312
580 21069050 Pachak, rochak and similar goods Kg. 131,111 23,015,344 Thailand 12,356 1,294,719 India 118,745 21,719,996 Andora 10 629
581 21069060 Kurkure, kurmure, lays & Similar goods Kg. 1,412,002 498,268,167 Bangladesh 18,497 3,982,161 Japan 2 2,014 Korea R 20,468 7,672,972 Malaysia 1,136 455,281 Thailand 612 538,831 India 1,371,287 485,616,908
582 21069090 Food preparations Kg. 2,472,135 584,103,124 Myanmar 29 29,400 Baharain 25,088 7,521,611 China P. R. 270,750 50,870,233 Hongkong 15 14,385 Indonesia 5,651 2,129,145 Iran 30 11,586 Israel 670 623,394 Japan 369 365,073 Korea R 1,854 414,956 Malaysia 40,543 13,592,423 Philippines 33,064 7,288,024 Saudi Arabia 60 66,643 Singapore 21,650 6,988,525
191
S.N. HS Code Description, Commodities/ Countries Unit Quantity Values (Rs.) Taiwan 60 9,526 Thailand 713,181 221,174,831 U.A.E. 627 216,071 Vietnam 30,008 5,402,151 India 1,062,352 188,246,388 Tunusia 300 73,829 Canada 60 33,516 Mexico 2 7,123 U.S.A. 6,260 4,152,436 Austria 189 68,525 Denmark 4 3,600 France 140 207,119 Germany 183 78,643 Netherlands 280 5,104 U.K. 2,205 316,846 Czech Republic 14 12,964 Poland 1,201 1,070,697 Russia 33 33,285 Switzerland 428 62,372 Turkey 90,063 23,019,551 Malta 162,573 45,694,019 Australia 2,200 4,299,130
Chapter 22 Beverages, spirits and vinegar 2,925,862,961
583 22011000 Mineral waters not containing sugar or sweetening matter not flavoured
Ltr 356,306 13,441,210
China P. R. 110,548 6,285,490 Malaysia 7,020 201,298 Philippines 2 1,523 U.A.E. 5,933 158,901 India 161,921 3,300,974 France 52,918 2,840,772 U.K. 17,964 652,252
584 22019000 Mineral waters Ltr 49,546 1,004,113 China P. R. 26 5,064 Philippines 2 2,356 Thailand 142 56,084 India 35,489 381,334 France 5,403 217,255 U.K. 8,485 342,020
585 22021000 Waters, including mineral waters and aerated waters containing added sugar or other sweetening matter or flavoured
Ltr 56,434 5,393,857
China P. R. 2,163 1,000,051 Philippines 2 2,559
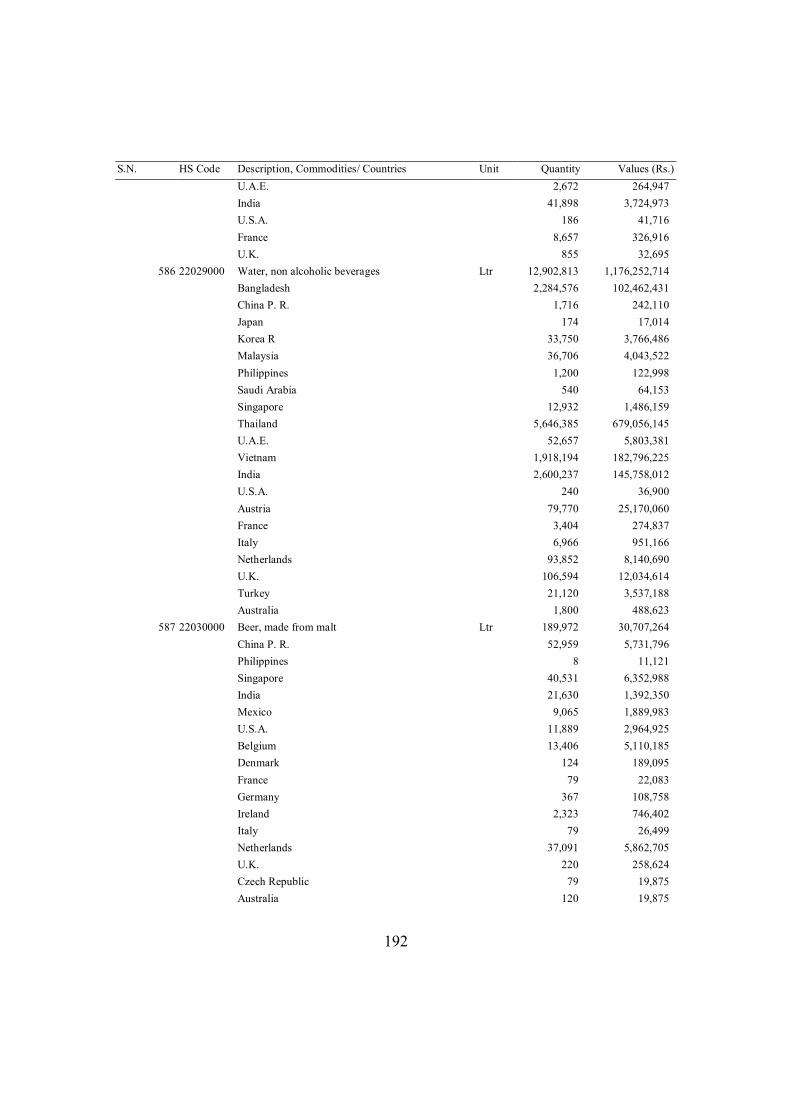
192
S.N. HS Code Description, Commodities/ Countries Unit Quantity Values (Rs.) U.A.E. 2,672 264,947 India 41,898 3,724,973 U.S.A. 186 41,716 France 8,657 326,916 U.K. 855 32,695
586 22029000 Water, non alcoholic beverages Ltr 12,902,813 1,176,252,714 Bangladesh 2,284,576 102,462,431 China P. R. 1,716 242,110 Japan 174 17,014 Korea R 33,750 3,766,486 Malaysia 36,706 4,043,522 Philippines 1,200 122,998 Saudi Arabia 540 64,153 Singapore 12,932 1,486,159 Thailand 5,646,385 679,056,145 U.A.E. 52,657 5,803,381 Vietnam 1,918,194 182,796,225 India 2,600,237 145,758,012 U.S.A. 240 36,900 Austria 79,770 25,170,060 France 3,404 274,837 Italy 6,966 951,166 Netherlands 93,852 8,140,690 U.K. 106,594 12,034,614 Turkey 21,120 3,537,188 Australia 1,800 488,623
587 22030000 Beer, made from malt Ltr 189,972 30,707,264 China P. R. 52,959 5,731,796 Philippines 8 11,121 Singapore 40,531 6,352,988 India 21,630 1,392,350 Mexico 9,065 1,889,983 U.S.A. 11,889 2,964,925 Belgium 13,406 5,110,185 Denmark 124 189,095 France 79 22,083 Germany 367 108,758 Ireland 2,323 746,402 Italy 79 26,499 Netherlands 37,091 5,862,705 U.K. 220 258,624 Czech Republic 79 19,875 Australia 120 19,875
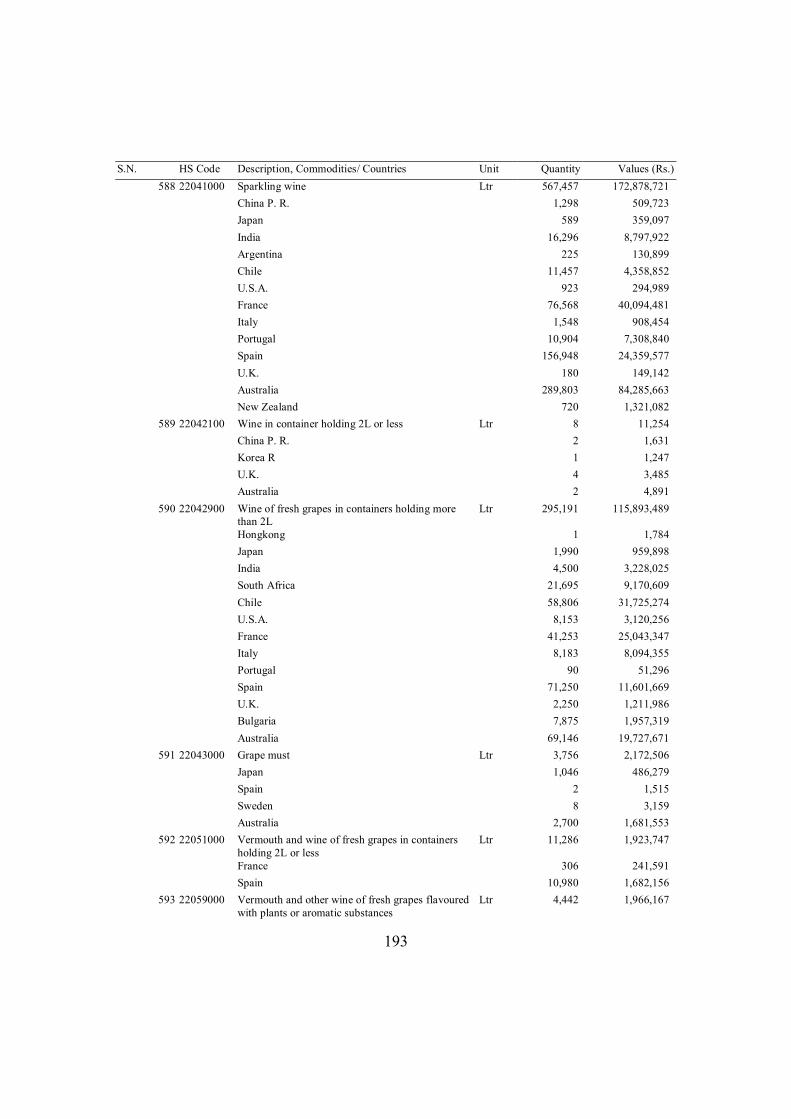
193
S.N. HS Code Description, Commodities/ Countries Unit Quantity Values (Rs.) 588 22041000 Sparkling wine Ltr 567,457 172,878,721
China P. R. 1,298 509,723 Japan 589 359,097 India 16,296 8,797,922 Argentina 225 130,899 Chile 11,457 4,358,852 U.S.A. 923 294,989 France 76,568 40,094,481 Italy 1,548 908,454 Portugal 10,904 7,308,840 Spain 156,948 24,359,577 U.K. 180 149,142 Australia 289,803 84,285,663 New Zealand 720 1,321,082
589 22042100 Wine in container holding 2L or less Ltr 8 11,254 China P. R. 2 1,631 Korea R 1 1,247 U.K. 4 3,485 Australia 2 4,891
590 22042900 Wine of fresh grapes in containers holding more than 2L
Ltr 295,191 115,893,489
Hongkong 1 1,784 Japan 1,990 959,898 India 4,500 3,228,025 South Africa 21,695 9,170,609 Chile 58,806 31,725,274 U.S.A. 8,153 3,120,256 France 41,253 25,043,347 Italy 8,183 8,094,355 Portugal 90 51,296 Spain 71,250 11,601,669 U.K. 2,250 1,211,986 Bulgaria 7,875 1,957,319 Australia 69,146 19,727,671
591 22043000 Grape must Ltr 3,756 2,172,506 Japan 1,046 486,279 Spain 2 1,515 Sweden 8 3,159 Australia 2,700 1,681,553
592 22051000 Vermouth and wine of fresh grapes in containers holding 2L or less
Ltr 11,286 1,923,747
France 306 241,591 Spain 10,980 1,682,156
593 22059000 Vermouth and other wine of fresh grapes flavoured with plants or aromatic substances
Ltr 4,442 1,966,167
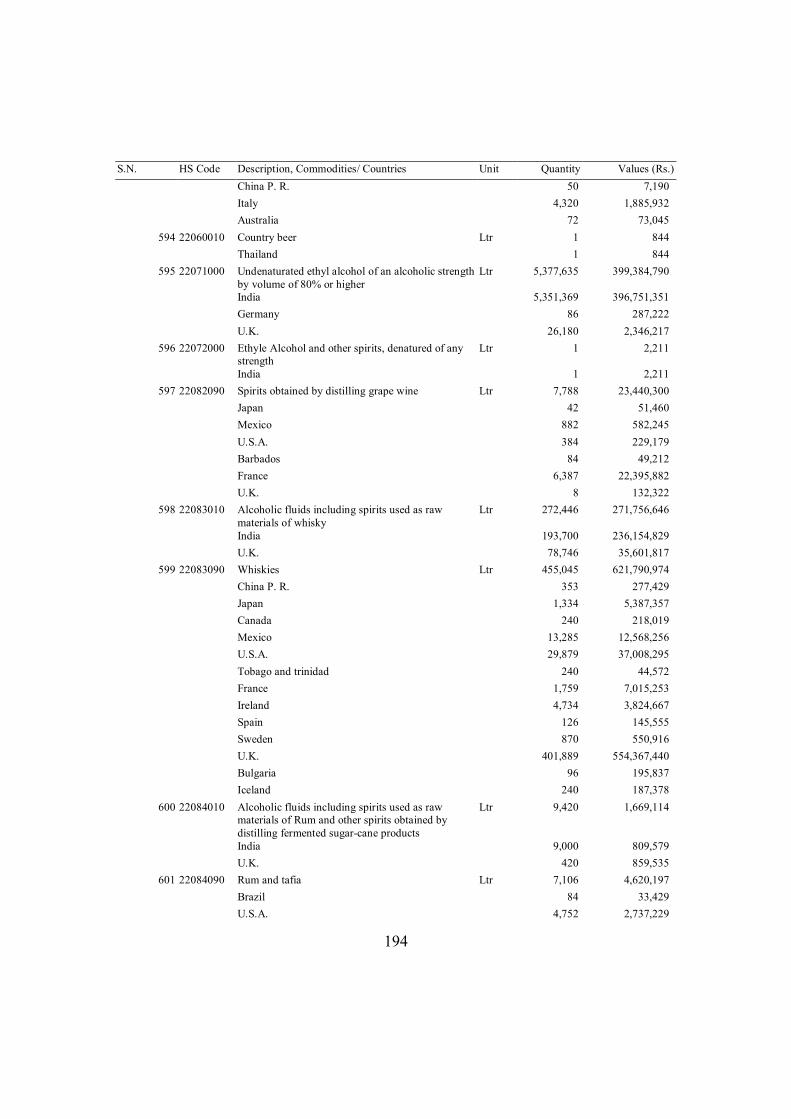
194
S.N. HS Code Description, Commodities/ Countries Unit Quantity Values (Rs.) China P. R. 50 7,190 Italy 4,320 1,885,932 Australia 72 73,045
594 22060010 Country beer Ltr 1 844 Thailand 1 844
595 22071000 Undenaturated ethyl alcohol of an alcoholic strength by volume of 80% or higher
Ltr 5,377,635 399,384,790
India 5,351,369 396,751,351 Germany 86 287,222 U.K. 26,180 2,346,217
596 22072000 Ethyle Alcohol and other spirits, denatured of any strength
Ltr 1 2,211
India 1 2,211 597 22082090 Spirits obtained by distilling grape wine Ltr 7,788 23,440,300
Japan 42 51,460 Mexico 882 582,245 U.S.A. 384 229,179 Barbados 84 49,212 France 6,387 22,395,882 U.K. 8 132,322
598 22083010 Alcoholic fluids including spirits used as raw materials of whisky
Ltr 272,446 271,756,646
India 193,700 236,154,829 U.K. 78,746 35,601,817
599 22083090 Whiskies Ltr 455,045 621,790,974 China P. R. 353 277,429 Japan 1,334 5,387,357 Canada 240 218,019 Mexico 13,285 12,568,256 U.S.A. 29,879 37,008,295 Tobago and trinidad 240 44,572 France 1,759 7,015,253 Ireland 4,734 3,824,667 Spain 126 145,555 Sweden 870 550,916 U.K. 401,889 554,367,440 Bulgaria 96 195,837 Iceland 240 187,378
600 22084010 Alcoholic fluids including spirits used as raw materials of Rum and other spirits obtained by distilling fermented sugar-cane products
Ltr 9,420 1,669,114
India 9,000 809,579 U.K. 420 859,535
601 22084090 Rum and tafia Ltr 7,106 4,620,197 Brazil 84 33,429 U.S.A. 4,752 2,737,229
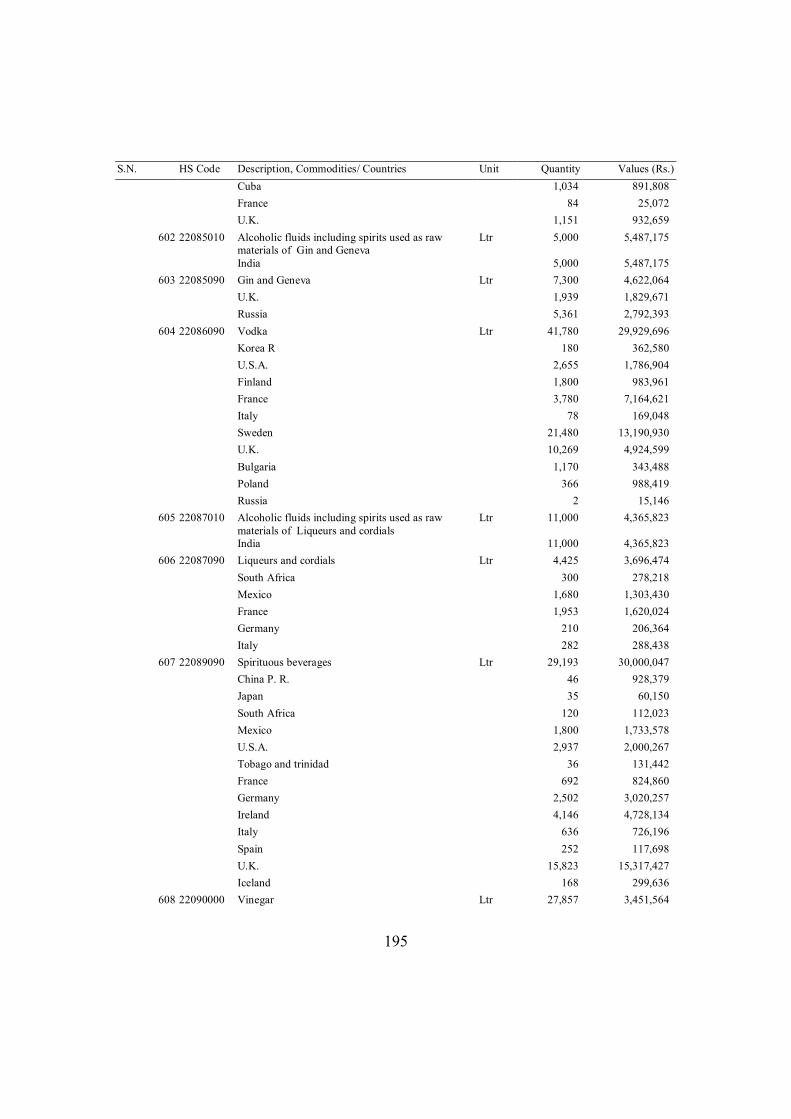
195
S.N. HS Code Description, Commodities/ Countries Unit Quantity Values (Rs.) Cuba 1,034 891,808 France 84 25,072 U.K. 1,151 932,659
602 22085010 Alcoholic fluids including spirits used as raw materials of Gin and Geneva
Ltr 5,000 5,487,175
India 5,000 5,487,175 603 22085090 Gin and Geneva Ltr 7,300 4,622,064
U.K. 1,939 1,829,671 Russia 5,361 2,792,393
604 22086090 Vodka Ltr 41,780 29,929,696 Korea R 180 362,580 U.S.A. 2,655 1,786,904 Finland 1,800 983,961 France 3,780 7,164,621 Italy 78 169,048 Sweden 21,480 13,190,930 U.K. 10,269 4,924,599 Bulgaria 1,170 343,488 Poland 366 988,419 Russia 2 15,146
605 22087010 Alcoholic fluids including spirits used as raw materials of Liqueurs and cordials
Ltr 11,000 4,365,823
India 11,000 4,365,823 606 22087090 Liqueurs and cordials Ltr 4,425 3,696,474
South Africa 300 278,218 Mexico 1,680 1,303,430 France 1,953 1,620,024 Germany 210 206,364 Italy 282 288,438
607 22089090 Spirituous beverages Ltr 29,193 30,000,047 China P. R. 46 928,379 Japan 35 60,150 South Africa 120 112,023 Mexico 1,800 1,733,578 U.S.A. 2,937 2,000,267 Tobago and trinidad 36 131,442 France 692 824,860 Germany 2,502 3,020,257 Ireland 4,146 4,728,134 Italy 636 726,196 Spain 252 117,698 U.K. 15,823 15,317,427 Iceland 168 299,636
608 22090000 Vinegar Ltr 27,857 3,451,564
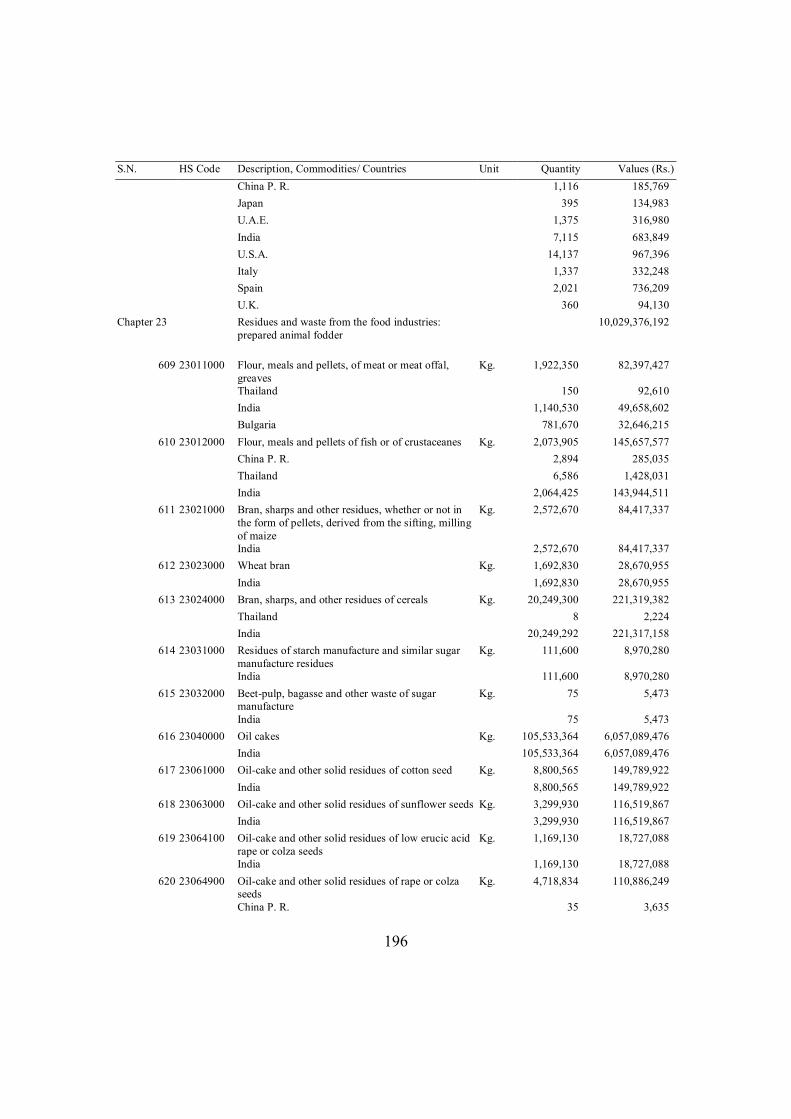
196
S.N. HS Code Description, Commodities/ Countries Unit Quantity Values (Rs.) China P. R. 1,116 185,769 Japan 395 134,983 U.A.E. 1,375 316,980 India 7,115 683,849 U.S.A. 14,137 967,396 Italy 1,337 332,248 Spain 2,021 736,209 U.K. 360 94,130
Chapter 23 Residues and waste from the food industries: prepared animal fodder
10,029,376,192
609 23011000 Flour, meals and pellets, of meat or meat offal, greaves
Kg. 1,922,350 82,397,427
Thailand 150 92,610 India 1,140,530 49,658,602 Bulgaria 781,670 32,646,215
610 23012000 Flour, meals and pellets of fish or of crustaceanes Kg. 2,073,905 145,657,577 China P. R. 2,894 285,035 Thailand 6,586 1,428,031 India 2,064,425 143,944,511
611 23021000 Bran, sharps and other residues, whether or not in the form of pellets, derived from the sifting, milling of maize
Kg. 2,572,670 84,417,337
India 2,572,670 84,417,337 612 23023000 Wheat bran Kg. 1,692,830 28,670,955
India 1,692,830 28,670,955 613 23024000 Bran, sharps, and other residues of cereals Kg. 20,249,300 221,319,382
Thailand 8 2,224 India 20,249,292 221,317,158
614 23031000 Residues of starch manufacture and similar sugar manufacture residues
Kg. 111,600 8,970,280
India 111,600 8,970,280 615 23032000 Beet-pulp, bagasse and other waste of sugar
manufacture Kg. 75 5,473
India 75 5,473 616 23040000 Oil cakes Kg. 105,533,364 6,057,089,476
India 105,533,364 6,057,089,476 617 23061000 Oil-cake and other solid residues of cotton seed Kg. 8,800,565 149,789,922
India 8,800,565 149,789,922 618 23063000 Oil-cake and other solid residues of sunflower seeds Kg. 3,299,930 116,519,867
India 3,299,930 116,519,867 619 23064100 Oil-cake and other solid residues of low erucic acid
rape or colza seeds Kg. 1,169,130 18,727,088
India 1,169,130 18,727,088 620 23064900 Oil-cake and other solid residues of rape or colza
seeds Kg. 4,718,834 110,886,249
China P. R. 35 3,635
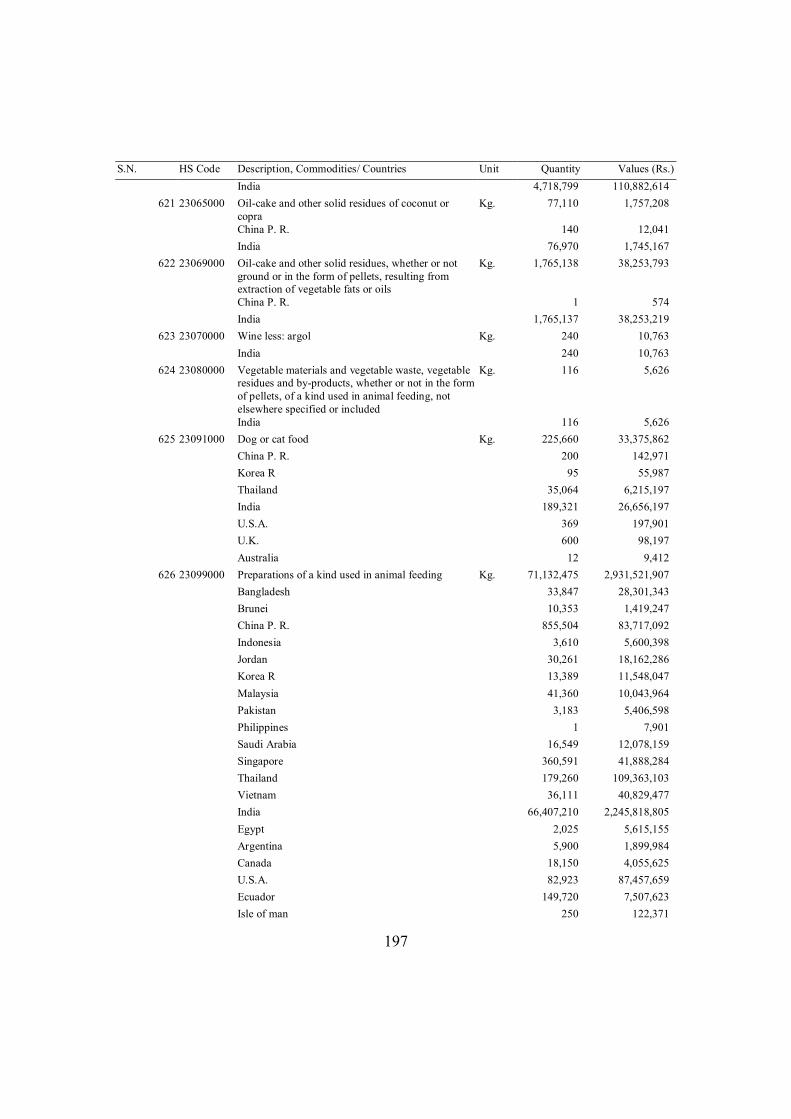
197
S.N. HS Code Description, Commodities/ Countries Unit Quantity Values (Rs.) India 4,718,799 110,882,614
621 23065000 Oil-cake and other solid residues of coconut or copra
Kg. 77,110 1,757,208
China P. R. 140 12,041 India 76,970 1,745,167
622 23069000 Oil-cake and other solid residues, whether or not ground or in the form of pellets, resulting from extraction of vegetable fats or oils
Kg. 1,765,138 38,253,793
China P. R. 1 574 India 1,765,137 38,253,219
623 23070000 Wine less: argol Kg. 240 10,763 India 240 10,763
624 23080000 Vegetable materials and vegetable waste, vegetable residues and by-products, whether or not in the form of pellets, of a kind used in animal feeding, not elsewhere specified or included
Kg. 116 5,626
India 116 5,626 625 23091000 Dog or cat food Kg. 225,660 33,375,862
China P. R. 200 142,971 Korea R 95 55,987 Thailand 35,064 6,215,197 India 189,321 26,656,197 U.S.A. 369 197,901 U.K. 600 98,197 Australia 12 9,412
626 23099000 Preparations of a kind used in animal feeding Kg. 71,132,475 2,931,521,907 Bangladesh 33,847 28,301,343 Brunei 10,353 1,419,247 China P. R. 855,504 83,717,092 Indonesia 3,610 5,600,398 Jordan 30,261 18,162,286 Korea R 13,389 11,548,047 Malaysia 41,360 10,043,964 Pakistan 3,183 5,406,598 Philippines 1 7,901 Saudi Arabia 16,549 12,078,159 Singapore 360,591 41,888,284 Thailand 179,260 109,363,103 Vietnam 36,111 40,829,477 India 66,407,210 2,245,818,805 Egypt 2,025 5,615,155 Argentina 5,900 1,899,984 Canada 18,150 4,055,625 U.S.A. 82,923 87,457,659 Ecuador 149,720 7,507,623 Isle of man 250 122,371
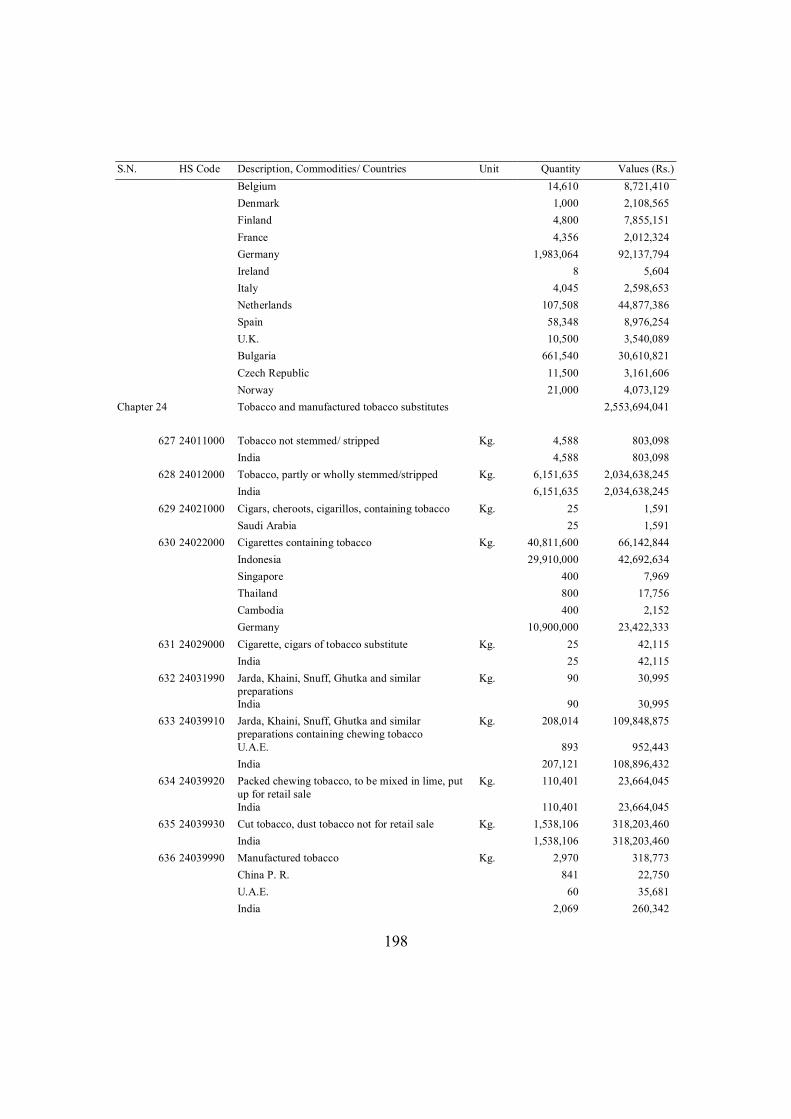
198
S.N. HS Code Description, Commodities/ Countries Unit Quantity Values (Rs.) Belgium 14,610 8,721,410 Denmark 1,000 2,108,565 Finland 4,800 7,855,151 France 4,356 2,012,324 Germany 1,983,064 92,137,794 Ireland 8 5,604 Italy 4,045 2,598,653 Netherlands 107,508 44,877,386 Spain 58,348 8,976,254 U.K. 10,500 3,540,089 Bulgaria 661,540 30,610,821 Czech Republic 11,500 3,161,606 Norway 21,000 4,073,129
Chapter 24 Tobacco and manufactured tobacco substitutes 2,553,694,041
627 24011000 Tobacco not stemmed/ stripped Kg. 4,588 803,098 India 4,588 803,098
628 24012000 Tobacco, partly or wholly stemmed/stripped Kg. 6,151,635 2,034,638,245 India 6,151,635 2,034,638,245
629 24021000 Cigars, cheroots, cigarillos, containing tobacco Kg. 25 1,591 Saudi Arabia 25 1,591
630 24022000 Cigarettes containing tobacco Kg. 40,811,600 66,142,844 Indonesia 29,910,000 42,692,634 Singapore 400 7,969 Thailand 800 17,756 Cambodia 400 2,152 Germany 10,900,000 23,422,333
631 24029000 Cigarette, cigars of tobacco substitute Kg. 25 42,115 India 25 42,115
632 24031990 Jarda, Khaini, Snuff, Ghutka and similar preparations
Kg. 90 30,995
India 90 30,995 633 24039910 Jarda, Khaini, Snuff, Ghutka and similar
preparations containing chewing tobacco Kg. 208,014 109,848,875
U.A.E. 893 952,443 India 207,121 108,896,432
634 24039920 Packed chewing tobacco, to be mixed in lime, put up for retail sale
Kg. 110,401 23,664,045
India 110,401 23,664,045 635 24039930 Cut tobacco, dust tobacco not for retail sale Kg. 1,538,106 318,203,460
India 1,538,106 318,203,460 636 24039990 Manufactured tobacco Kg. 2,970 318,773
China P. R. 841 22,750 U.A.E. 60 35,681 India 2,069 260,342
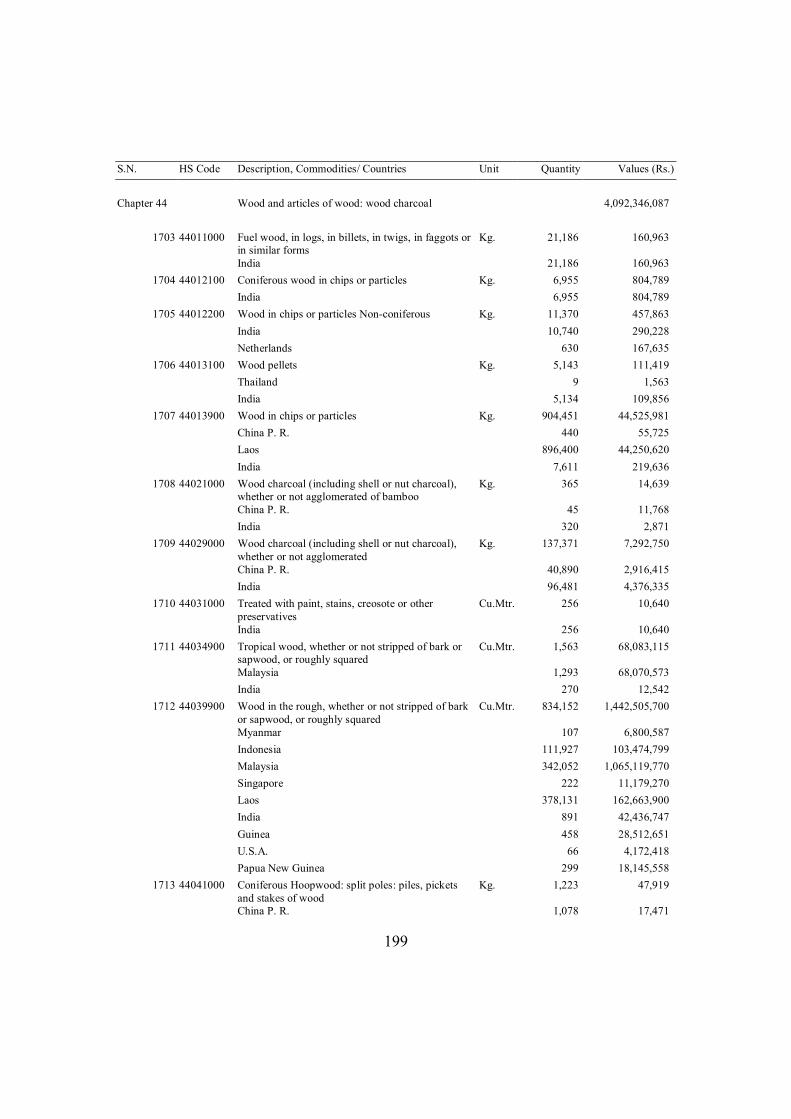
199
S.N. HS Code Description, Commodities/ Countries Unit Quantity Values (Rs.)
Chapter 44 Wood and articles of wood: wood charcoal 4,092,346,087
1703 44011000 Fuel wood, in logs, in billets, in twigs, in faggots or in similar forms
Kg. 21,186 160,963
India 21,186 160,963 1704 44012100 Coniferous wood in chips or particles Kg. 6,955 804,789
India 6,955 804,789 1705 44012200 Wood in chips or particles Non-coniferous Kg. 11,370 457,863
India 10,740 290,228 Netherlands 630 167,635
1706 44013100 Wood pellets Kg. 5,143 111,419 Thailand 9 1,563 India 5,134 109,856
1707 44013900 Wood in chips or particles Kg. 904,451 44,525,981 China P. R. 440 55,725 Laos 896,400 44,250,620 India 7,611 219,636
1708 44021000 Wood charcoal (including shell or nut charcoal), whether or not agglomerated of bamboo
Kg. 365 14,639
China P. R. 45 11,768 India 320 2,871
1709 44029000 Wood charcoal (including shell or nut charcoal), whether or not agglomerated
Kg. 137,371 7,292,750
China P. R. 40,890 2,916,415 India 96,481 4,376,335
1710 44031000 Treated with paint, stains, creosote or other preservatives
Cu.Mtr. 256 10,640
India 256 10,640 1711 44034900 Tropical wood, whether or not stripped of bark or
sapwood, or roughly squared Cu.Mtr. 1,563 68,083,115
Malaysia 1,293 68,070,573 India 270 12,542
1712 44039900 Wood in the rough, whether or not stripped of bark or sapwood, or roughly squared
Cu.Mtr. 834,152 1,442,505,700
Myanmar 107 6,800,587 Indonesia 111,927 103,474,799 Malaysia 342,052 1,065,119,770 Singapore 222 11,179,270 Laos 378,131 162,663,900 India 891 42,436,747 Guinea 458 28,512,651 U.S.A. 66 4,172,418 Papua New Guinea 299 18,145,558
1713 44041000 Coniferous Hoopwood: split poles: piles, pickets and stakes of wood
Kg. 1,223 47,919
China P. R. 1,078 17,471
200
S.N. HS Code Description, Commodities/ Countries Unit Quantity Values (Rs.) India 145 30,448
1714 44042000 Non-coniferous hoopwood, split poles, piles, pickets and stakes of wood
Kg. 16,790 487,929
China P. R. 4,025 208,722 India 12,764 277,168 Czech Republic 1 2,039
1715 44050000 Wood wool: wood flour Kg. 41,070 911,292 Vietnam 3,000 82,434 India 38,070 828,858
1716 44071000 Coniferous wood sawn or chipped lengthwise, sliced or peeled, whether or not planed, sanded or finger-jointed, of a thickness exceeding 6 mm
Cu.Mtr. 2,044 6,981,048
India 200 20,725 Canada 1,677 2,415,855 U.S.A. 166 4,544,468
1717 44072500 Dark red meranti, light red meranti and merati bakau
Cu.Mtr. 3 30,213,608
India 3 30,213,608 1718 44072900 Wood sawn or chipped lengthwise, sliced or peeled,
whether or not planed, sanded or end-jointed, of a thickness exceeding 6 mm
Cu.Mtr. 80,070 198,439,594
Myanmar 1,471 73,369,534 Indonesia 643 40,555,304 Malaysia 76,582 62,784,756 Laos 317 19,643,266 India 1,020 249,055 Benin 36 1,837,679
1719 44079900 Wood sawn or chipped lengthwise Cu.Mtr. 133,133 607,796,772 Myanmar 121,246 63,045,532 China P. R. 25 2,066,077 Indonesia 5,330 344,005,853 Malaysia 3,034 180,408,996 Cambodia 39 1,854,635 Laos 190 11,394,201 India 2,745 754,611 U.S.A. 84 2,198,034 Poland 439 2,068,833
1720 44081000 Sheets for veneering (including those obtained by slicing laminaed wood), for plywood or other similar laminated wood and other wood, sawn lengthwise, sliced or peeled, whether or not planed, sanded , spliced or end jointed, of a thickness not exceeding
Sq.Mtr. 3,362,828 53,964,486
Myanmar 25,368 1,727,833 China P. R. 232,190 1,833,804 India 3,105,269 50,402,849
1721 44083100 Dark Red Meranti, Light Red Meranti and Meranti Bakau
Sq.Mtr. 2,922 1,319,619
201
S.N. HS Code Description, Commodities/ Countries Unit Quantity Values (Rs.) India 2,922 1,319,619
1722 44083900 Tropical wood, for plywood or for similar laminated wood and other wood, sawn lengthwise, sliced or peeled, whether or not planed, sanded , spliced or end-jointed, of a thickness not exceeding 6 mm
Sq.Mtr. 28,645,819 361,946,406
Myanmar 6,572,978 49,885,253 China P. R. 6,100,203 82,253,462 Vietnam 33 1,761,589 India 15,972,604 228,046,102
1723 44089000 Vaneer sheets and sheets for plywood Sq.Mtr. 19,582,285 227,572,750 Myanmar 1,958,483 38,901,225 China P. R. 1,531,981 28,593,518 Thailand 2 2,026 Vietnam 120,002 2,083,662 India 15,971,816 157,992,319
1724 44091000 Coniferous Wood (including strips and friezes for parquet flooring, not assembled)
Sq.Mtr. 6,706 275,248
India 6,706 275,248 1725 44092900 Wood (including strips and friezes for parquet
flooring, not assembled) Sq.Mtr. 78,206 8,324,722
China P. R. 2,800 7,513,403 India 75,406 811,319
1726 44101100 Particle board Sq.Mtr. 221,821 71,060,680 China P. R. 67,762 25,990,203 U.A.E. 55 1,344 India 151,808 44,122,710 Germany 2,196 946,423
1727 44101900 Particle board or similar board of woods Sq.Mtr. 1,441 403,536 China P. R. 1,170 371,635 India 269 23,182 Germany 2 8,719
1728 44109000 Particle board and similar board of ligneous materials
Sq.Mtr. 21,542 8,203,843
Bangladesh 1,923 840,623 China P. R. 7,793 3,589,338 Japan 3 172,038 India 11,818 3,599,744 Zambia 5 2,100
1729 44111200 Fireboard of wood or ligneous materials, of a density exceeding 0.8g/cn3, mechanically worked or surface covered
Sq.Mtr. 771,851 106,246,431
China P. R. 648,295 78,902,530 Sri Lanka 3,536 352,211 Thailand 12,281 2,983,457 India 101,927 21,986,020 Brazil 5,794 885,049
202
S.N. HS Code Description, Commodities/ Countries Unit Quantity Values (Rs.) Romania 18 1,137,164
1730 44111300 Fibreboard of wood or other ligneous materials of a thickness exceeding 5 mm but not exceeding 9 mm
Sq.Mtr. 167,794 70,340,248
China P. R. 106,051 42,409,529 Sri Lanka 1,741 363,129 India 40,442 15,880,035 Brazil 3,987 1,301,631 Austria 2,539 2,095,598 Germany 7,774 4,720,122 Switzerland 5,259 3,570,204
1731 44111400 Fibreboard of wood or other ligneous materials of a thickness exceeding 9 mm
Sq.Mtr. 281,068 54,438,179
China P. R. 239,082 43,729,706 Malaysia 9,049 1,498,855 Sri Lanka 1,518 714,276 Thailand 12,776 2,190,837 India 15,361 4,772,853 Brazil 1,933 1,206,214 Belgium 1,348 325,438
1732 44119200 Medium density fibreboard (MDF) of a density exceeding 0.8 g/cm3
Sq.Mtr. 117,152 43,826,584
China P. R. 60,278 10,355,704 Malaysia 10,506 2,541,322 India 583 484,318 Belgium 8,280 7,927,510 Germany 37,505 22,517,730
1733 44119300 "Fibreboard of wood or other ligneous materials, whether or not bonded with resins or other organic substances of a density exceeding 0.5 g/cm3 but not exceeding 0.8 g/cm3"
Sq.Mtr. 5,579 2,231,384
India 5,579 2,231,384 1734 44119400 Medium density fibreboard (MDF) of a density not
exceeding 0.5 g/cm3 Sq.Mtr. 50,309 8,233,209
China P. R. 38,102 5,595,888 India 12,207 2,637,321
1735 44121000 Plywood, veneered panels and similar laminated wood, of bamboo
Sq.Mtr. 315,462 29,056,621
China P. R. 296,496 22,404,344 India 18,966 6,652,277
1736 44121900 Plywood consisting solely of sheets of woods, each ply not exceeding 6mm thickness
Pcs. 262 65,136
India 262 65,136 1737 44123100 Plywood, veneered panels and similar laminated
wood, with at least one outer ply of tropical wood Sq.Mtr. 65,357 16,365,096
China P. R. 38,698 4,537,298 India 26,659 11,827,798
1738 44123200 Plywood, veneered panels and similar laminated wood with a least one outer ply of non-coniferous
Sq.Mtr. 72,843 19,296,454
203
S.N. HS Code Description, Commodities/ Countries Unit Quantity Values (Rs.) wood
China P. R. 59,510 16,764,261 India 13,334 2,532,193
1739 44123900 Plywood, veneered panels and similar laminated wood
Sq.Mtr. 1,134,834 134,494,533
China P. R. 868,693 83,549,875 India 266,142 50,944,658
1740 44129400 Block board Sq.Mtr. 8,009 2,971,839 China P. R. 215 49,820 India 7,794 2,922,019
1741 44129900 Vaneered panels and similar laminated wood Sq.Mtr. 293,299 45,544,117 China P. R. 225,948 20,636,811 India 67,345 24,890,602 Austria 6 16,704
1742 44130000 Densified wood in blocks, plates Kg. 142,317 10,550,205 India 142,317 10,550,205
1743 44140000 Wooden frames for paintings, photographs, mirrors or similar objects
Kg. 274,843 14,423,411
Bangladesh 6 2,195 China P. R. 16,158 1,273,966 Thailand 281 222,147 India 258,398 12,925,103
1744 44151000 Cases, boxes, crates of wood Pcs. 100,682 10,231,916 China P. R. 8,479 2,393,557 Japan 11 349,748 Thailand 254 5,868 India 91,924 7,082,976 Austria 1 78,836 Belgium 10 17,782 France 3 303,149
1745 44152000 Pallets, box pallets, and other load boards: pallet collars
Pcs. 2,078 2,700,044
China P. R. 313 18,514 India 1,752 2,664,330 U.S.A. 1 1,134 Spain 11 15,049 U.K. 1 1,017
1746 44160000 Casks, barrels, vats, tubs and other coopers products Kg. 3,593 140,235 Bhutan 50 11,390 China P. R. 3 21,489 India 3,540 107,356
1747 44170000 Tools, tool bodies, tool handeles broom or brush bodies and handles of wood: boot or shoe lasta and trees, of wood
Kg. 107,227 5,219,527
China P. R. 3,924 553,995 Korea R 40 3,845
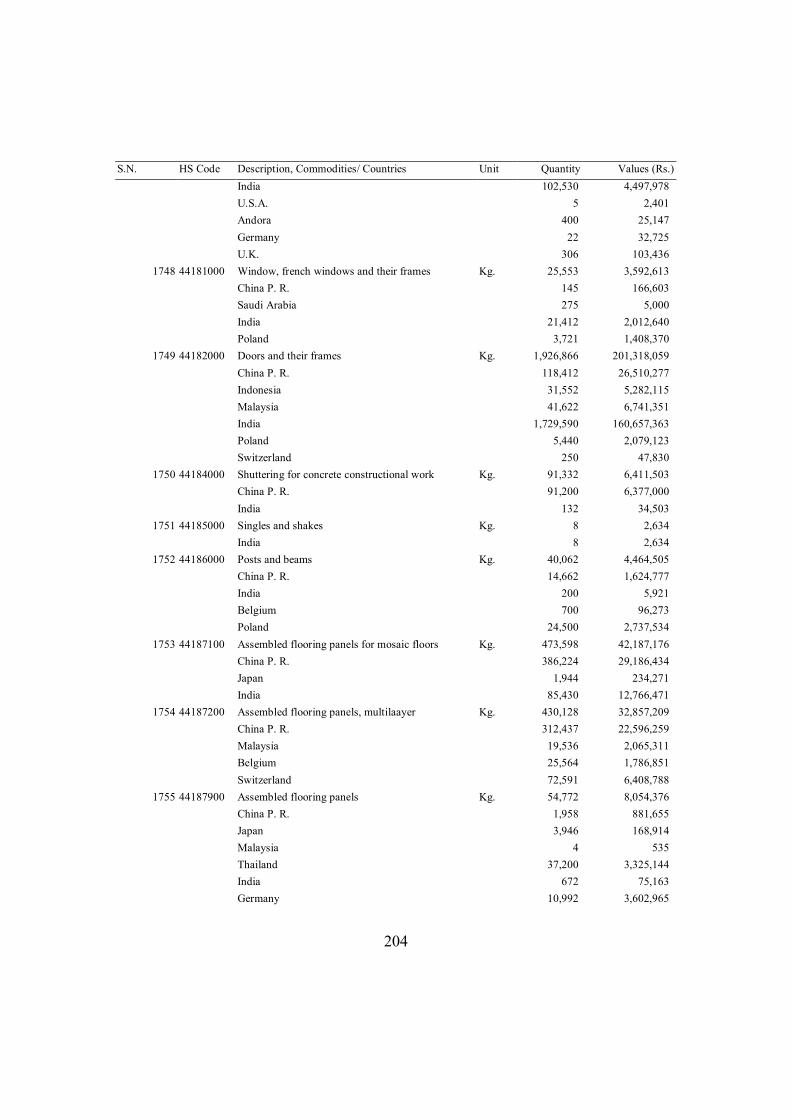
204
S.N. HS Code Description, Commodities/ Countries Unit Quantity Values (Rs.) India 102,530 4,497,978 U.S.A. 5 2,401 Andora 400 25,147 Germany 22 32,725 U.K. 306 103,436
1748 44181000 Window, french windows and their frames Kg. 25,553 3,592,613 China P. R. 145 166,603 Saudi Arabia 275 5,000 India 21,412 2,012,640 Poland 3,721 1,408,370
1749 44182000 Doors and their frames Kg. 1,926,866 201,318,059 China P. R. 118,412 26,510,277 Indonesia 31,552 5,282,115 Malaysia 41,622 6,741,351 India 1,729,590 160,657,363 Poland 5,440 2,079,123 Switzerland 250 47,830
1750 44184000 Shuttering for concrete constructional work Kg. 91,332 6,411,503 China P. R. 91,200 6,377,000 India 132 34,503
1751 44185000 Singles and shakes Kg. 8 2,634 India 8 2,634
1752 44186000 Posts and beams Kg. 40,062 4,464,505 China P. R. 14,662 1,624,777 India 200 5,921 Belgium 700 96,273 Poland 24,500 2,737,534
1753 44187100 Assembled flooring panels for mosaic floors Kg. 473,598 42,187,176 China P. R. 386,224 29,186,434 Japan 1,944 234,271 India 85,430 12,766,471
1754 44187200 Assembled flooring panels, multilaayer Kg. 430,128 32,857,209 China P. R. 312,437 22,596,259 Malaysia 19,536 2,065,311 Belgium 25,564 1,786,851 Switzerland 72,591 6,408,788
1755 44187900 Assembled flooring panels Kg. 54,772 8,054,376 China P. R. 1,958 881,655 Japan 3,946 168,914 Malaysia 4 535 Thailand 37,200 3,325,144 India 672 75,163 Germany 10,992 3,602,965
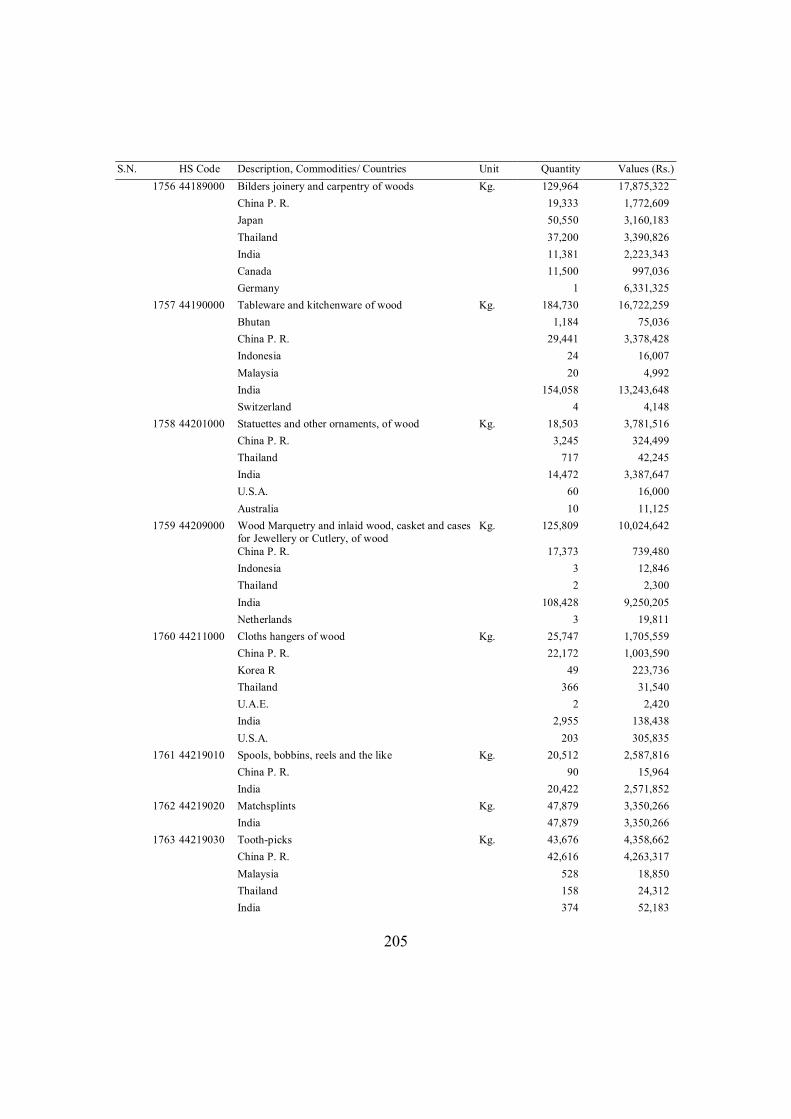
205
S.N. HS Code Description, Commodities/ Countries Unit Quantity Values (Rs.) 1756 44189000 Bilders joinery and carpentry of woods Kg. 129,964 17,875,322
China P. R. 19,333 1,772,609 Japan 50,550 3,160,183 Thailand 37,200 3,390,826 India 11,381 2,223,343 Canada 11,500 997,036 Germany 1 6,331,325
1757 44190000 Tableware and kitchenware of wood Kg. 184,730 16,722,259 Bhutan 1,184 75,036 China P. R. 29,441 3,378,428 Indonesia 24 16,007 Malaysia 20 4,992 India 154,058 13,243,648 Switzerland 4 4,148
1758 44201000 Statuettes and other ornaments, of wood Kg. 18,503 3,781,516 China P. R. 3,245 324,499 Thailand 717 42,245 India 14,472 3,387,647 U.S.A. 60 16,000 Australia 10 11,125
1759 44209000 Wood Marquetry and inlaid wood, casket and cases for Jewellery or Cutlery, of wood
Kg. 125,809 10,024,642
China P. R. 17,373 739,480 Indonesia 3 12,846 Thailand 2 2,300 India 108,428 9,250,205 Netherlands 3 19,811
1760 44211000 Cloths hangers of wood Kg. 25,747 1,705,559 China P. R. 22,172 1,003,590 Korea R 49 223,736 Thailand 366 31,540 U.A.E. 2 2,420 India 2,955 138,438 U.S.A. 203 305,835
1761 44219010 Spools, bobbins, reels and the like Kg. 20,512 2,587,816 China P. R. 90 15,964 India 20,422 2,571,852
1762 44219020 Matchsplints Kg. 47,879 3,350,266 India 47,879 3,350,266
1763 44219030 Tooth-picks Kg. 43,676 4,358,662 China P. R. 42,616 4,263,317 Malaysia 528 18,850 Thailand 158 24,312 India 374 52,183
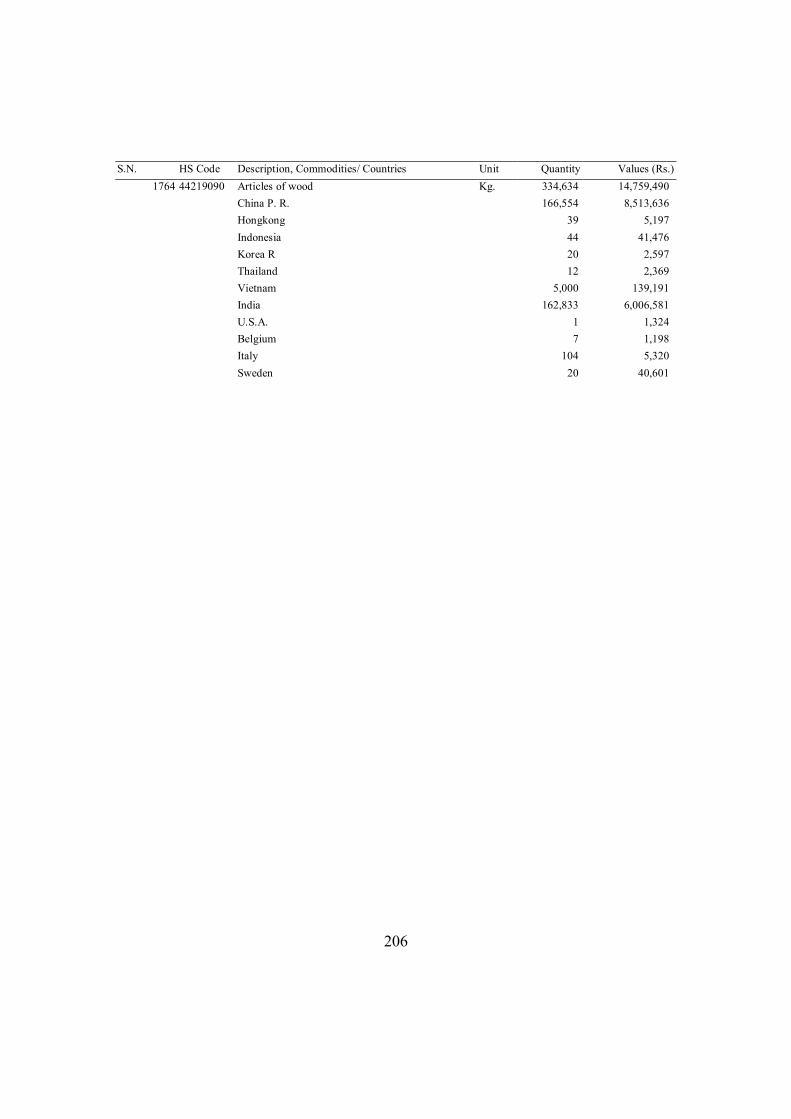
206
S.N. HS Code Description, Commodities/ Countries Unit Quantity Values (Rs.) 1764 44219090 Articles of wood Kg. 334,634 14,759,490
China P. R. 166,554 8,513,636 Hongkong 39 5,197 Indonesia 44 41,476 Korea R 20 2,597 Thailand 12 2,369 Vietnam 5,000 139,191 India 162,833 6,006,581 U.S.A. 1 1,324 Belgium 7 1,198 Italy 104 5,320 Sweden 20 40,601
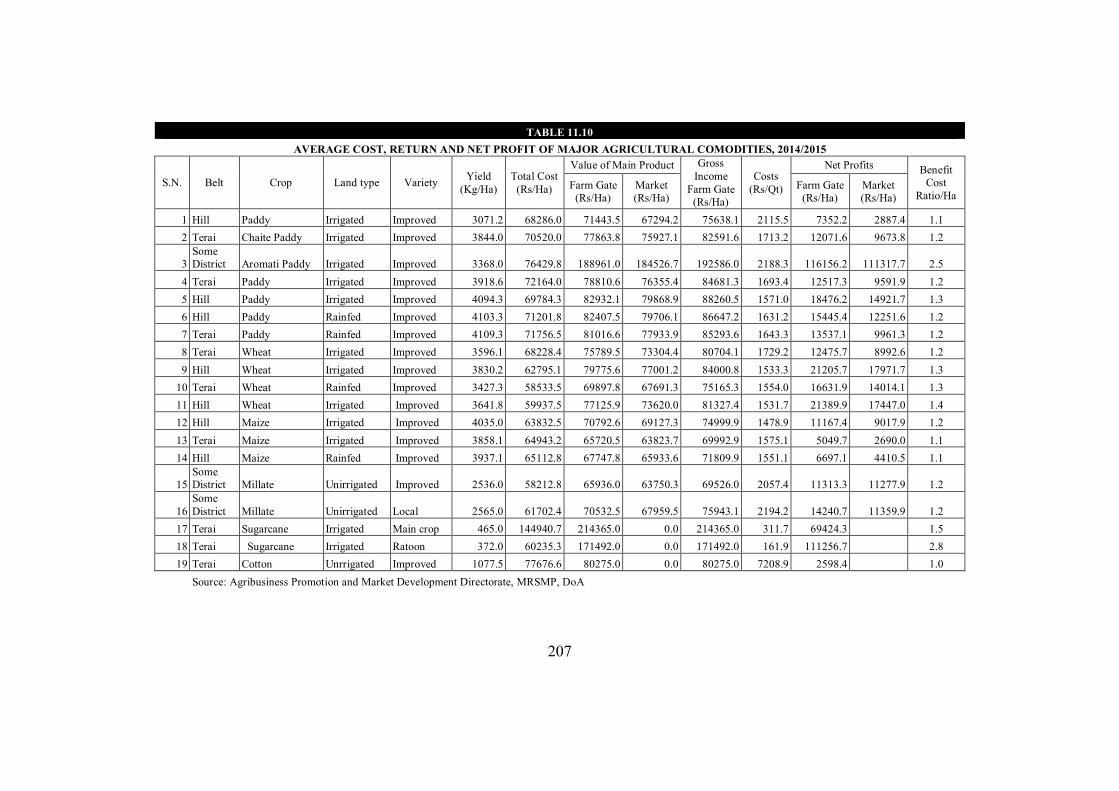
207
TABLE 11.10 AVERAGE COST, RETURN AND NET PROFIT OF MAJOR AGRICULTURAL COMODITIES, 2014/2015
S.N. Belt Crop Land type Variety Yield (Kg/Ha)
Total Cost (Rs/Ha)
Value of Main Product Gross Income
Farm Gate (Rs/Ha)
Costs (Rs/Qt)
Net Profits Benefit Cost
Ratio/Ha Farm Gate
(Rs/Ha) Market (Rs/Ha)
Farm Gate (Rs/Ha)
Market (Rs/Ha)
1 Hill Paddy Irrigated Improved 3071.2 68286.0 71443.5 67294.2 75638.1 2115.5 7352.2 2887.4 1.1 2 Terai Chaite Paddy Irrigated Improved 3844.0 70520.0 77863.8 75927.1 82591.6 1713.2 12071.6 9673.8 1.2
3 Some District Aromati Paddy Irrigated Improved 3368.0 76429.8 188961.0 184526.7 192586.0 2188.3 116156.2 111317.7 2.5
4 Terai Paddy Irrigated Improved 3918.6 72164.0 78810.6 76355.4 84681.3 1693.4 12517.3 9591.9 1.2 5 Hill Paddy Irrigated Improved 4094.3 69784.3 82932.1 79868.9 88260.5 1571.0 18476.2 14921.7 1.3 6 Hill Paddy Rainfed Improved 4103.3 71201.8 82407.5 79706.1 86647.2 1631.2 15445.4 12251.6 1.2 7 Terai Paddy Rainfed Improved 4109.3 71756.5 81016.6 77933.9 85293.6 1643.3 13537.1 9961.3 1.2 8 Terai Wheat Irrigated Improved 3596.1 68228.4 75789.5 73304.4 80704.1 1729.2 12475.7 8992.6 1.2 9 Hill Wheat Irrigated Improved 3830.2 62795.1 79775.6 77001.2 84000.8 1533.3 21205.7 17971.7 1.3
10 Terai Wheat Rainfed Improved 3427.3 58533.5 69897.8 67691.3 75165.3 1554.0 16631.9 14014.1 1.3 11 Hill Wheat Irrigated Improved 3641.8 59937.5 77125.9 73620.0 81327.4 1531.7 21389.9 17447.0 1.4 12 Hill Maize Irrigated Improved 4035.0 63832.5 70792.6 69127.3 74999.9 1478.9 11167.4 9017.9 1.2 13 Terai Maize Irrigated Improved 3858.1 64943.2 65720.5 63823.7 69992.9 1575.1 5049.7 2690.0 1.1 14 Hill Maize Rainfed Improved 3937.1 65112.8 67747.8 65933.6 71809.9 1551.1 6697.1 4410.5 1.1
15 Some District Millate Unirrigated Improved 2536.0 58212.8 65936.0 63750.3 69526.0 2057.4 11313.3 11277.9 1.2
16 Some District Millate Unirrigated Local 2565.0 61702.4 70532.5 67959.5 75943.1 2194.2 14240.7 11359.9 1.2
17 Terai Sugarcane Irrigated Main crop 465.0 144940.7 214365.0 0.0 214365.0 311.7 69424.3 1.5 18 Terai Sugarcane Irrigated Ratoon 372.0 60235.3 171492.0 0.0 171492.0 161.9 111256.7 2.8 19 Terai Cotton Unrrigated Improved 1077.5 77676.6 80275.0 0.0 80275.0 7208.9 2598.4 1.0
Source: Agribusiness Promotion and Market Development Directorate, MRSMP, DoA
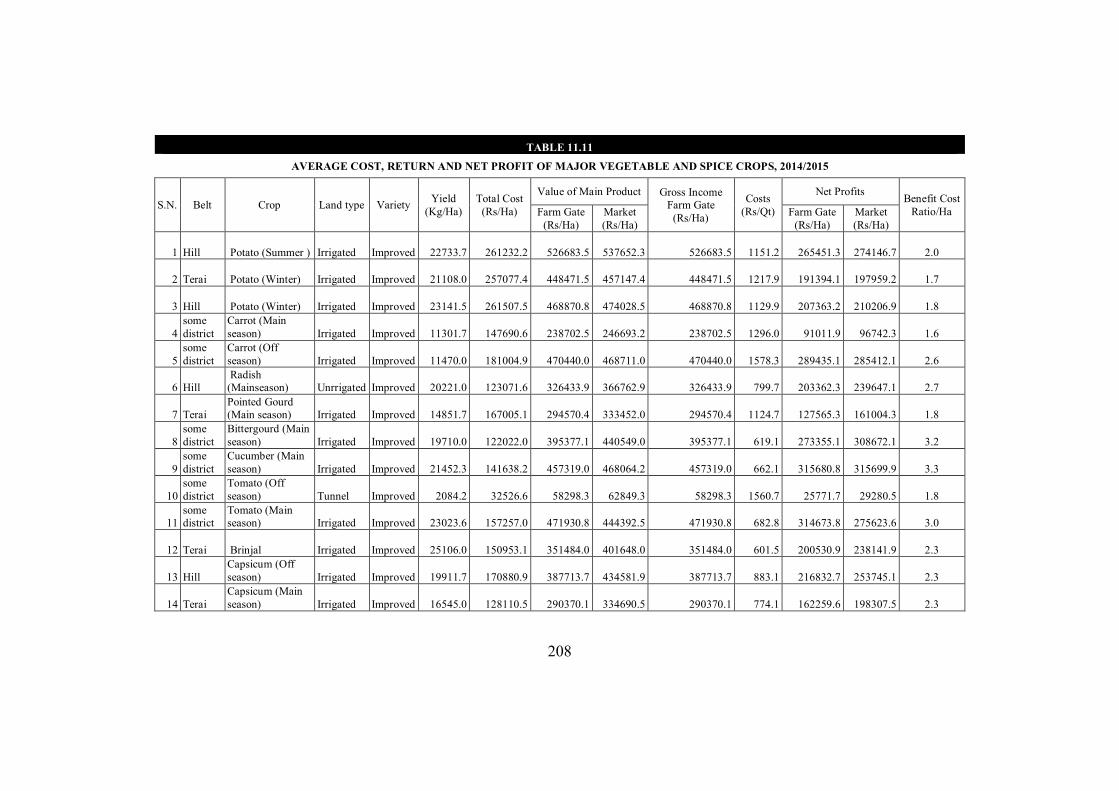
208
TABLE 11.11
AVERAGE COST, RETURN AND NET PROFIT OF MAJOR VEGETABLE AND SPICE CROPS, 2014/2015
S.N. Belt Crop Land type Variety Yield (Kg/Ha)
Total Cost (Rs/Ha)
Value of Main Product Gross Income Farm Gate
(Rs/Ha)
Costs (Rs/Qt)
Net Profits Benefit Cost Ratio/Ha Farm Gate
(Rs/Ha) Market (Rs/Ha)
Farm Gate (Rs/Ha)
Market (Rs/Ha)
1 Hill Potato (Summer ) Irrigated Improved 22733.7 261232.2 526683.5 537652.3 526683.5 1151.2 265451.3 274146.7 2.0
2 Terai Potato (Winter) Irrigated Improved 21108.0 257077.4 448471.5 457147.4 448471.5 1217.9 191394.1 197959.2 1.7
3 Hill Potato (Winter) Irrigated Improved 23141.5 261507.5 468870.8 474028.5 468870.8 1129.9 207363.2 210206.9 1.8
4 some district
Carrot (Main season) Irrigated
Improved 11301.7 147690.6 238702.5 246693.2 238702.5 1296.0 91011.9 96742.3 1.6
5 some district
Carrot (Off season) Irrigated
Improved 11470.0 181004.9 470440.0 468711.0 470440.0 1578.3 289435.1 285412.1 2.6
6 Hill Radish (Mainseason) Unrrigated
Improved 20221.0 123071.6 326433.9 366762.9 326433.9 799.7 203362.3 239647.1 2.7
7 Terai Pointed Gourd (Main season) Irrigated
Improved 14851.7 167005.1 294570.4 333452.0 294570.4 1124.7 127565.3 161004.3 1.8
8 some district
Bittergourd (Main season) Irrigated
Improved 19710.0 122022.0 395377.1 440549.0 395377.1 619.1 273355.1 308672.1 3.2
9 some district
Cucumber (Main season) Irrigated
Improved 21452.3 141638.2 457319.0 468064.2 457319.0 662.1 315680.8 315699.9 3.3
10 some district
Tomato (Off season) Tunnel
Improved 2084.2 32526.6 58298.3 62849.3 58298.3 1560.7 25771.7 29280.5 1.8
11 some district
Tomato (Main season) Irrigated
Improved 23023.6 157257.0 471930.8 444392.5 471930.8 682.8 314673.8 275623.6 3.0
12 Terai Brinjal Irrigated Improved 25106.0 150953.1 351484.0 401648.0 351484.0 601.5 200530.9 238141.9 2.3
13 Hill Capsicum (Off season) Irrigated
Improved 19911.7 170880.9 387713.7 434581.9 387713.7 883.1 216832.7 253745.1 2.3
14 Terai Capsicum (Main season) Irrigated
Improved 16545.0 128110.5 290370.1 334690.5 290370.1 774.1 162259.6 198307.5 2.3
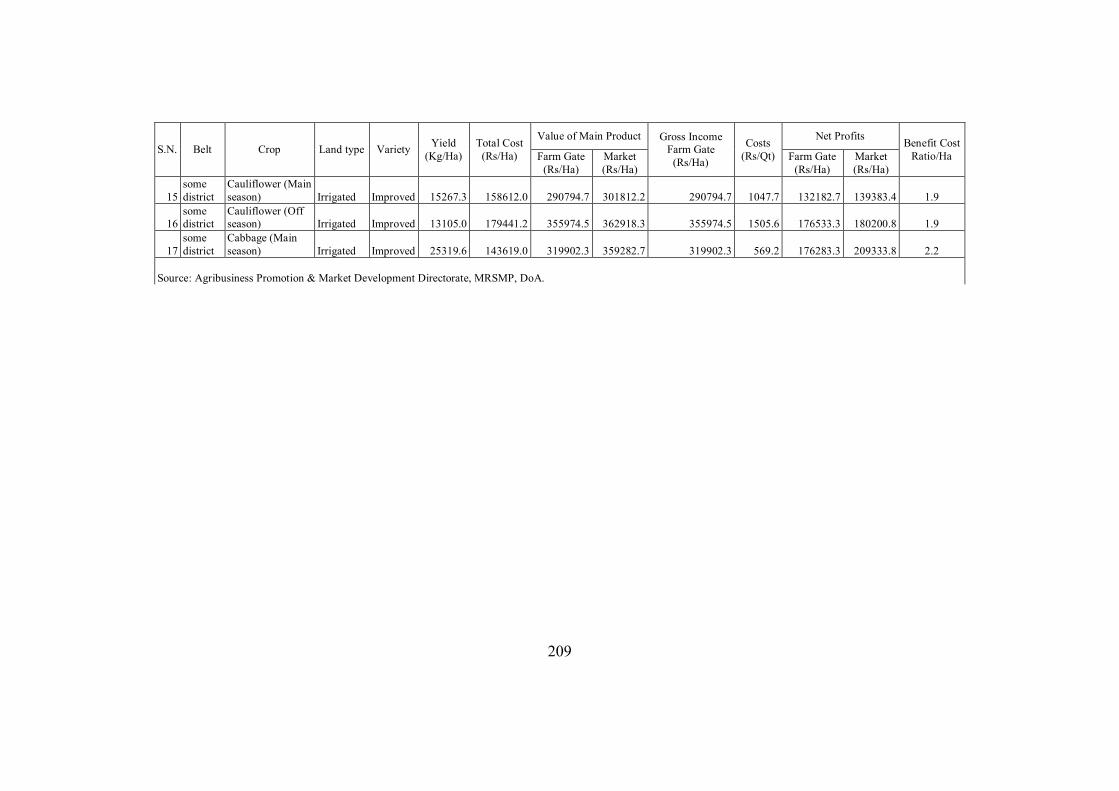
209
S.N. Belt Crop Land type Variety Yield (Kg/Ha)
Total Cost (Rs/Ha)
Value of Main Product Gross Income Farm Gate
(Rs/Ha)
Costs (Rs/Qt)
Net Profits Benefit Cost Ratio/Ha Farm Gate
(Rs/Ha) Market (Rs/Ha)
Farm Gate (Rs/Ha)
Market (Rs/Ha)
15 some district
Cauliflower (Main season) Irrigated
Improved 15267.3 158612.0 290794.7 301812.2 290794.7 1047.7 132182.7 139383.4 1.9
16 some district
Cauliflower (Off season) Irrigated
Improved 13105.0 179441.2 355974.5 362918.3 355974.5 1505.6 176533.3 180200.8 1.9
17 some district
Cabbage (Main season) Irrigated
Improved 25319.6 143619.0 319902.3 359282.7 319902.3 569.2 176283.3 209333.8 2.2
Source: Agribusiness Promotion & Market Development Directorate, MRSMP, DoA.
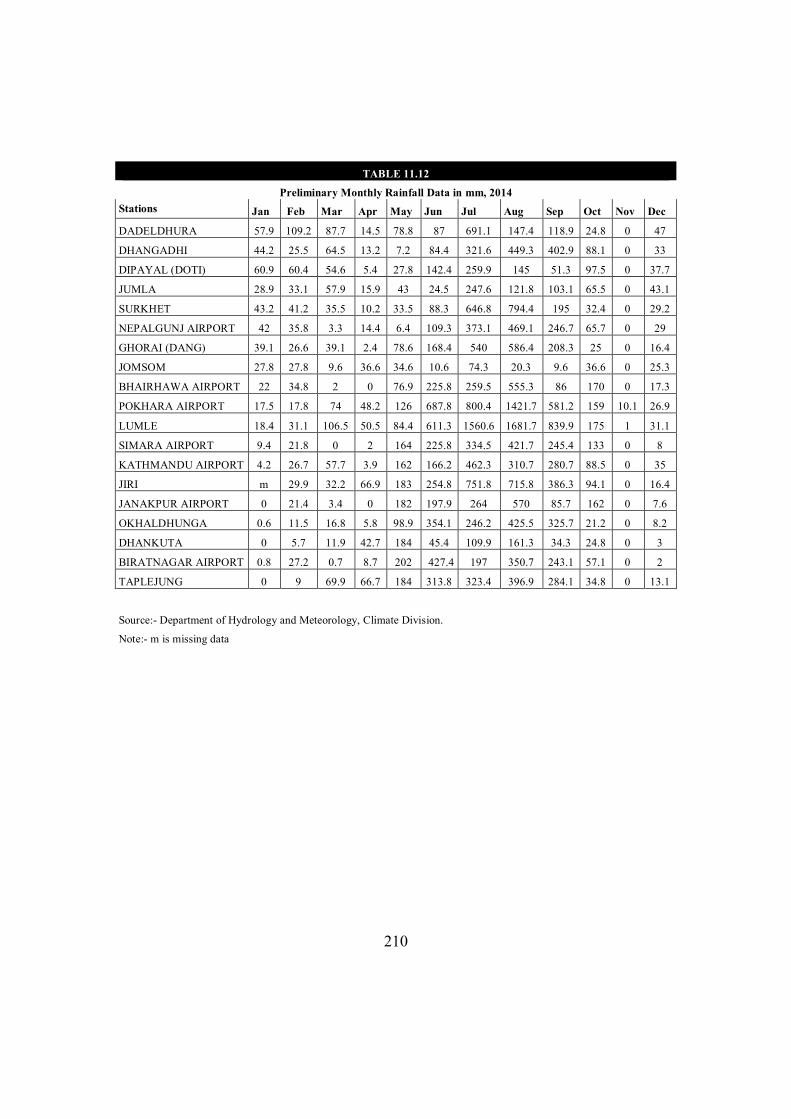
210
TABLE 11.12
Preliminary Monthly Rainfall Data in mm, 2014 Stations Jan Feb Mar Apr May Jun Jul Aug Sep Oct Nov Dec
DADELDHURA 57.9 109.2 87.7 14.5 78.8 87 691.1 147.4 118.9 24.8 0 47
DHANGADHI 44.2 25.5 64.5 13.2 7.2 84.4 321.6 449.3 402.9 88.1 0 33
DIPAYAL (DOTI) 60.9 60.4 54.6 5.4 27.8 142.4 259.9 145 51.3 97.5 0 37.7
JUMLA 28.9 33.1 57.9 15.9 43 24.5 247.6 121.8 103.1 65.5 0 43.1
SURKHET 43.2 41.2 35.5 10.2 33.5 88.3 646.8 794.4 195 32.4 0 29.2
NEPALGUNJ AIRPORT 42 35.8 3.3 14.4 6.4 109.3 373.1 469.1 246.7 65.7 0 29
GHORAI (DANG) 39.1 26.6 39.1 2.4 78.6 168.4 540 586.4 208.3 25 0 16.4
JOMSOM 27.8 27.8 9.6 36.6 34.6 10.6 74.3 20.3 9.6 36.6 0 25.3
BHAIRHAWA AIRPORT 22 34.8 2 0 76.9 225.8 259.5 555.3 86 170 0 17.3
POKHARA AIRPORT 17.5 17.8 74 48.2 126 687.8 800.4 1421.7 581.2 159 10.1 26.9
LUMLE 18.4 31.1 106.5 50.5 84.4 611.3 1560.6 1681.7 839.9 175 1 31.1
SIMARA AIRPORT 9.4 21.8 0 2 164 225.8 334.5 421.7 245.4 133 0 8
KATHMANDU AIRPORT 4.2 26.7 57.7 3.9 162 166.2 462.3 310.7 280.7 88.5 0 35
JIRI m 29.9 32.2 66.9 183 254.8 751.8 715.8 386.3 94.1 0 16.4
JANAKPUR AIRPORT 0 21.4 3.4 0 182 197.9 264 570 85.7 162 0 7.6
OKHALDHUNGA 0.6 11.5 16.8 5.8 98.9 354.1 246.2 425.5 325.7 21.2 0 8.2
DHANKUTA 0 5.7 11.9 42.7 184 45.4 109.9 161.3 34.3 24.8 0 3
BIRATNAGAR AIRPORT 0.8 27.2 0.7 8.7 202 427.4 197 350.7 243.1 57.1 0 2
TAPLEJUNG 0 9 69.9 66.7 184 313.8 323.4 396.9 284.1 34.8 0 13.1
Source:- Department of Hydrology and Meteorology, Climate Division.
Note:- m is missing data
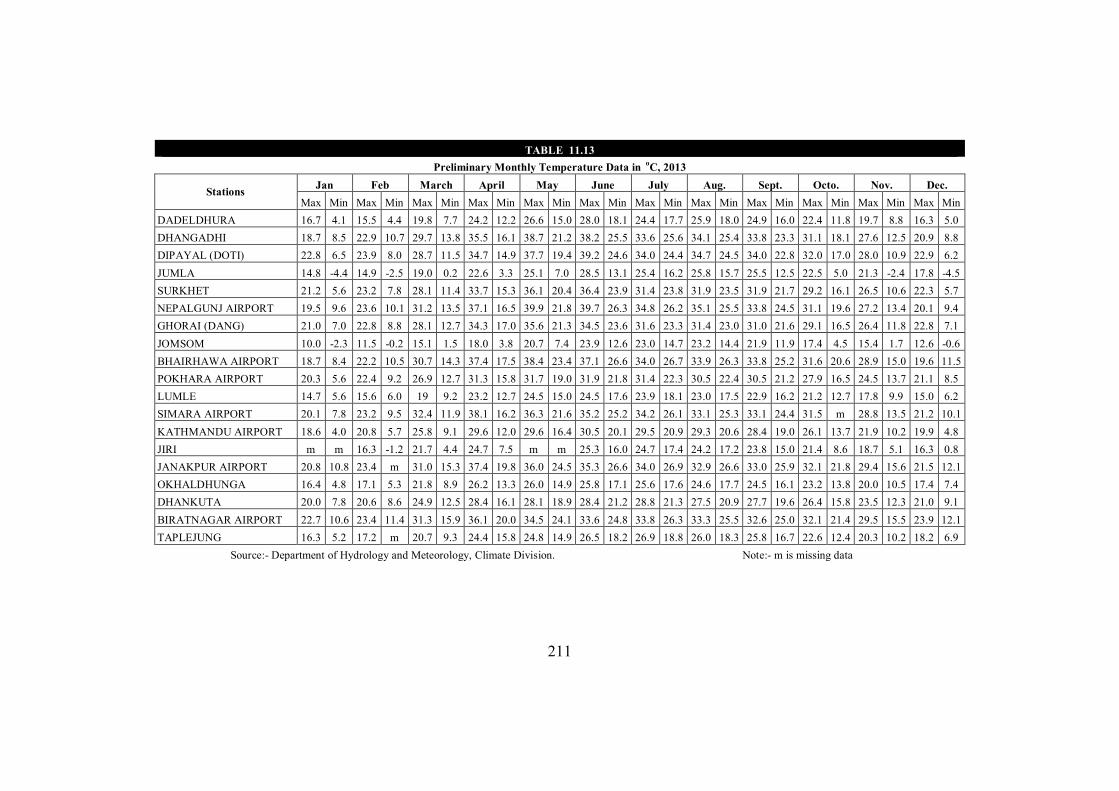
211
TABLE 11.13
Preliminary Monthly Temperature Data in oC, 2013
Stations Jan Feb March April May June July Aug. Sept. Octo. Nov. Dec. Max Min Max Min Max Min Max Min Max Min Max Min Max Min Max Min Max Min Max Min Max Min Max Min
DADELDHURA 16.7 4.1 15.5 4.4 19.8 7.7 24.2 12.2 26.6 15.0 28.0 18.1 24.4 17.7 25.9 18.0 24.9 16.0 22.4 11.8 19.7 8.8 16.3 5.0 DHANGADHI 18.7 8.5 22.9 10.7 29.7 13.8 35.5 16.1 38.7 21.2 38.2 25.5 33.6 25.6 34.1 25.4 33.8 23.3 31.1 18.1 27.6 12.5 20.9 8.8 DIPAYAL (DOTI) 22.8 6.5 23.9 8.0 28.7 11.5 34.7 14.9 37.7 19.4 39.2 24.6 34.0 24.4 34.7 24.5 34.0 22.8 32.0 17.0 28.0 10.9 22.9 6.2 JUMLA 14.8 -4.4 14.9 -2.5 19.0 0.2 22.6 3.3 25.1 7.0 28.5 13.1 25.4 16.2 25.8 15.7 25.5 12.5 22.5 5.0 21.3 -2.4 17.8 -4.5 SURKHET 21.2 5.6 23.2 7.8 28.1 11.4 33.7 15.3 36.1 20.4 36.4 23.9 31.4 23.8 31.9 23.5 31.9 21.7 29.2 16.1 26.5 10.6 22.3 5.7 NEPALGUNJ AIRPORT 19.5 9.6 23.6 10.1 31.2 13.5 37.1 16.5 39.9 21.8 39.7 26.3 34.8 26.2 35.1 25.5 33.8 24.5 31.1 19.6 27.2 13.4 20.1 9.4 GHORAI (DANG) 21.0 7.0 22.8 8.8 28.1 12.7 34.3 17.0 35.6 21.3 34.5 23.6 31.6 23.3 31.4 23.0 31.0 21.6 29.1 16.5 26.4 11.8 22.8 7.1 JOMSOM 10.0 -2.3 11.5 -0.2 15.1 1.5 18.0 3.8 20.7 7.4 23.9 12.6 23.0 14.7 23.2 14.4 21.9 11.9 17.4 4.5 15.4 1.7 12.6 -0.6 BHAIRHAWA AIRPORT 18.7 8.4 22.2 10.5 30.7 14.3 37.4 17.5 38.4 23.4 37.1 26.6 34.0 26.7 33.9 26.3 33.8 25.2 31.6 20.6 28.9 15.0 19.6 11.5 POKHARA AIRPORT 20.3 5.6 22.4 9.2 26.9 12.7 31.3 15.8 31.7 19.0 31.9 21.8 31.4 22.3 30.5 22.4 30.5 21.2 27.9 16.5 24.5 13.7 21.1 8.5 LUMLE 14.7 5.6 15.6 6.0 19 9.2 23.2 12.7 24.5 15.0 24.5 17.6 23.9 18.1 23.0 17.5 22.9 16.2 21.2 12.7 17.8 9.9 15.0 6.2 SIMARA AIRPORT 20.1 7.8 23.2 9.5 32.4 11.9 38.1 16.2 36.3 21.6 35.2 25.2 34.2 26.1 33.1 25.3 33.1 24.4 31.5 m 28.8 13.5 21.2 10.1 KATHMANDU AIRPORT 18.6 4.0 20.8 5.7 25.8 9.1 29.6 12.0 29.6 16.4 30.5 20.1 29.5 20.9 29.3 20.6 28.4 19.0 26.1 13.7 21.9 10.2 19.9 4.8 JIRI m m 16.3 -1.2 21.7 4.4 24.7 7.5 m m 25.3 16.0 24.7 17.4 24.2 17.2 23.8 15.0 21.4 8.6 18.7 5.1 16.3 0.8 JANAKPUR AIRPORT 20.8 10.8 23.4 m 31.0 15.3 37.4 19.8 36.0 24.5 35.3 26.6 34.0 26.9 32.9 26.6 33.0 25.9 32.1 21.8 29.4 15.6 21.5 12.1 OKHALDHUNGA 16.4 4.8 17.1 5.3 21.8 8.9 26.2 13.3 26.0 14.9 25.8 17.1 25.6 17.6 24.6 17.7 24.5 16.1 23.2 13.8 20.0 10.5 17.4 7.4 DHANKUTA 20.0 7.8 20.6 8.6 24.9 12.5 28.4 16.1 28.1 18.9 28.4 21.2 28.8 21.3 27.5 20.9 27.7 19.6 26.4 15.8 23.5 12.3 21.0 9.1 BIRATNAGAR AIRPORT 22.7 10.6 23.4 11.4 31.3 15.9 36.1 20.0 34.5 24.1 33.6 24.8 33.8 26.3 33.3 25.5 32.6 25.0 32.1 21.4 29.5 15.5 23.9 12.1 TAPLEJUNG 16.3 5.2 17.2 m 20.7 9.3 24.4 15.8 24.8 14.9 26.5 18.2 26.9 18.8 26.0 18.3 25.8 16.7 22.6 12.4 20.3 10.2 18.2 6.9
Source:- Department of Hydrology and Meteorology, Climate Division. Note:- m is missing data
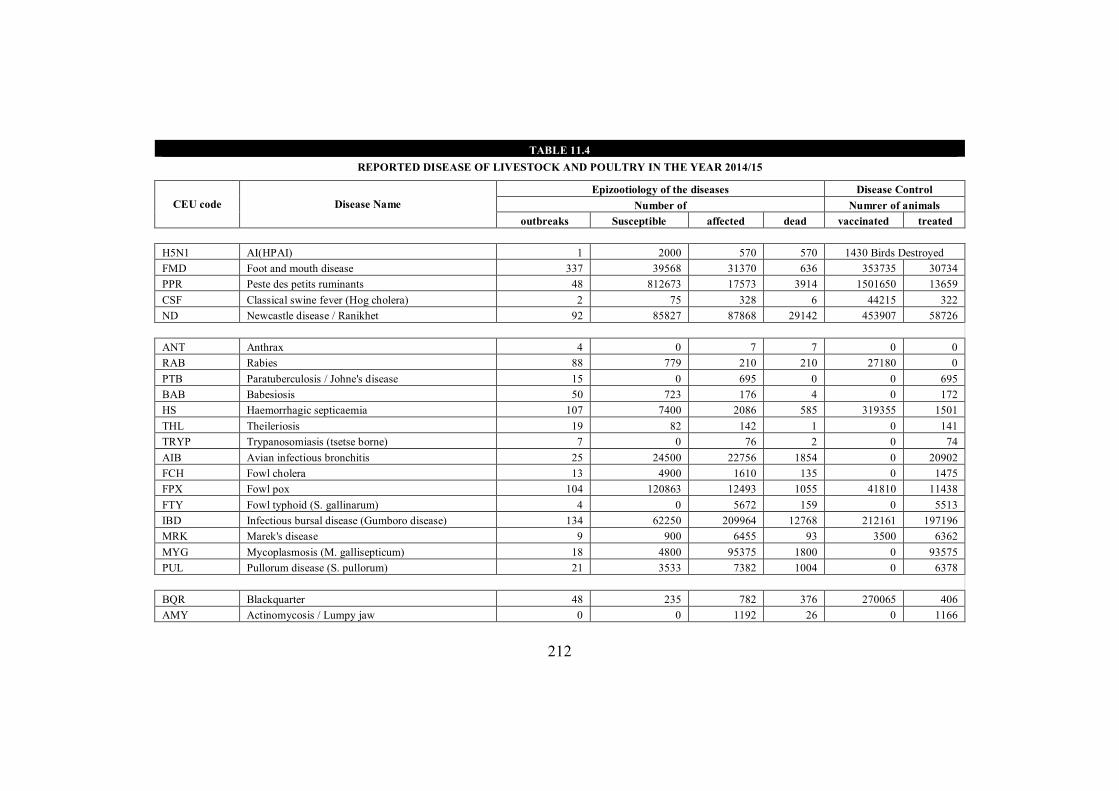
212
TABLE 11.4
REPORTED DISEASE OF LIVESTOCK AND POULTRY IN THE YEAR 2014/15
CEU code Disease Name Epizootiology of the diseases Disease Control
Number of Numrer of animals outbreaks Susceptible affected dead vaccinated treated
H5N1 AI(HPAI) 1 2000 570 570 1430 Birds Destroyed FMD Foot and mouth disease 337 39568 31370 636 353735 30734 PPR Peste des petits ruminants 48 812673 17573 3914 1501650 13659 CSF Classical swine fever (Hog cholera) 2 75 328 6 44215 322 ND Newcastle disease / Ranikhet 92 85827 87868 29142 453907 58726
ANT Anthrax 4 0 7 7 0 0 RAB Rabies 88 779 210 210 27180 0 PTB Paratuberculosis / Johne's disease 15 0 695 0 0 695 BAB Babesiosis 50 723 176 4 0 172 HS Haemorrhagic septicaemia 107 7400 2086 585 319355 1501 THL Theileriosis 19 82 142 1 0 141 TRYP Trypanosomiasis (tsetse borne) 7 0 76 2 0 74 AIB Avian infectious bronchitis 25 24500 22756 1854 0 20902 FCH Fowl cholera 13 4900 1610 135 0 1475 FPX Fowl pox 104 120863 12493 1055 41810 11438 FTY Fowl typhoid (S. gallinarum) 4 0 5672 159 0 5513 IBD Infectious bursal disease (Gumboro disease) 134 62250 209964 12768 212161 197196 MRK Marek's disease 9 900 6455 93 3500 6362 MYG Mycoplasmosis (M. gallisepticum) 18 4800 95375 1800 0 93575 PUL Pullorum disease (S. pullorum) 21 3533 7382 1004 0 6378
BQR Blackquarter 48 235 782 376 270065 406 AMY Actinomycosis / Lumpy jaw 0 0 1192 26 0 1166
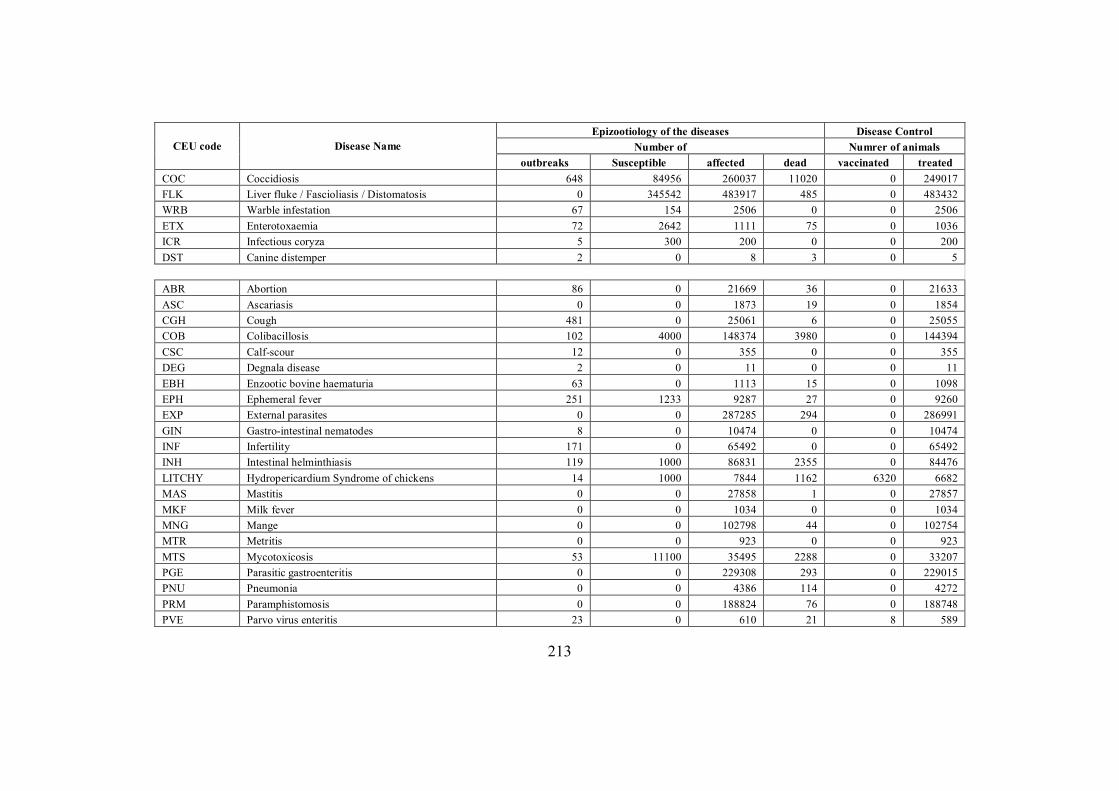
213
CEU code Disease Name Epizootiology of the diseases Disease Control
Number of Numrer of animals outbreaks Susceptible affected dead vaccinated treated
COC Coccidiosis 648 84956 260037 11020 0 249017 FLK Liver fluke / Fascioliasis / Distomatosis 0 345542 483917 485 0 483432 WRB Warble infestation 67 154 2506 0 0 2506 ETX Enterotoxaemia 72 2642 1111 75 0 1036 ICR Infectious coryza 5 300 200 0 0 200 DST Canine distemper 2 0 8 3 0 5
ABR Abortion 86 0 21669 36 0 21633 ASC Ascariasis 0 0 1873 19 0 1854 CGH Cough 481 0 25061 6 0 25055 COB Colibacillosis 102 4000 148374 3980 0 144394 CSC Calf-scour 12 0 355 0 0 355 DEG Degnala disease 2 0 11 0 0 11 EBH Enzootic bovine haematuria 63 0 1113 15 0 1098 EPH Ephemeral fever 251 1233 9287 27 0 9260 EXP External parasites 0 0 287285 294 0 286991 GIN Gastro-intestinal nematodes 8 0 10474 0 0 10474 INF Infertility 171 0 65492 0 0 65492 INH Intestinal helminthiasis 119 1000 86831 2355 0 84476 LITCHY Hydropericardium Syndrome of chickens 14 1000 7844 1162 6320 6682 MAS Mastitis 0 0 27858 1 0 27857 MKF Milk fever 0 0 1034 0 0 1034 MNG Mange 0 0 102798 44 0 102754 MTR Metritis 0 0 923 0 0 923 MTS Mycotoxicosis 53 11100 35495 2288 0 33207 PGE Parasitic gastroenteritis 0 0 229308 293 0 229015 PNU Pneumonia 0 0 4386 114 0 4272 PRM Paramphistomosis 0 0 188824 76 0 188748 PVE Parvo virus enteritis 23 0 610 21 8 589
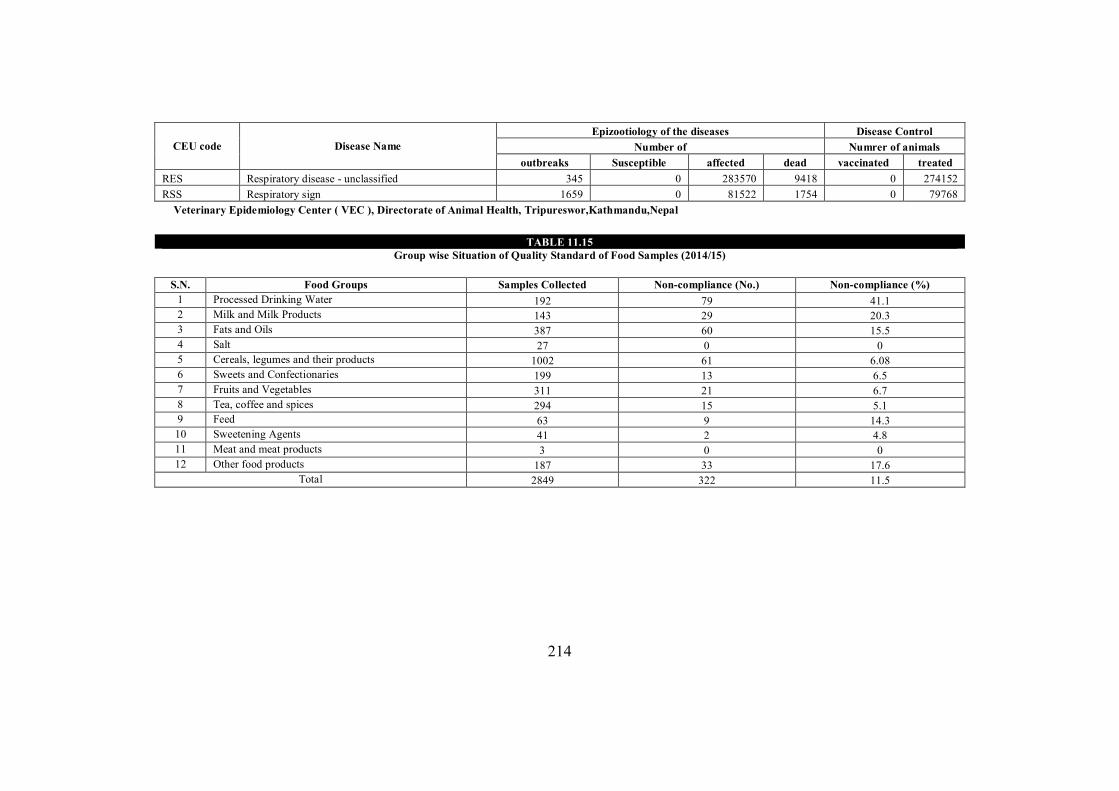
214
CEU code Disease Name Epizootiology of the diseases Disease Control
Number of Numrer of animals outbreaks Susceptible affected dead vaccinated treated
RES Respiratory disease - unclassified 345 0 283570 9418 0 274152 RSS Respiratory sign 1659 0 81522 1754 0 79768 Veterinary Epidemiology Center ( VEC ), Directorate of Animal Health, Tripureswor,Kathmandu,Nepal
TABLE 11.15 Group wise Situation of Quality Standard of Food Samples (2014/15)
S.N. Food Groups Samples Collected Non-compliance (No.) Non-compliance (%) 1 Processed Drinking Water 192 79 41.1 2 Milk and Milk Products 143 29 20.3 3 Fats and Oils 387 60 15.5 4 Salt 27 0 0 5 Cereals, legumes and their products 1002 61 6.08 6 Sweets and Confectionaries 199 13 6.5 7 Fruits and Vegetables 311 21 6.7 8 Tea, coffee and spices 294 15 5.1 9 Feed 63 9 14.3 10 Sweetening Agents 41 2 4.8 11 Meat and meat products 3 0 0 12 Other food products 187 33 17.6
Total 2849 322 11.5
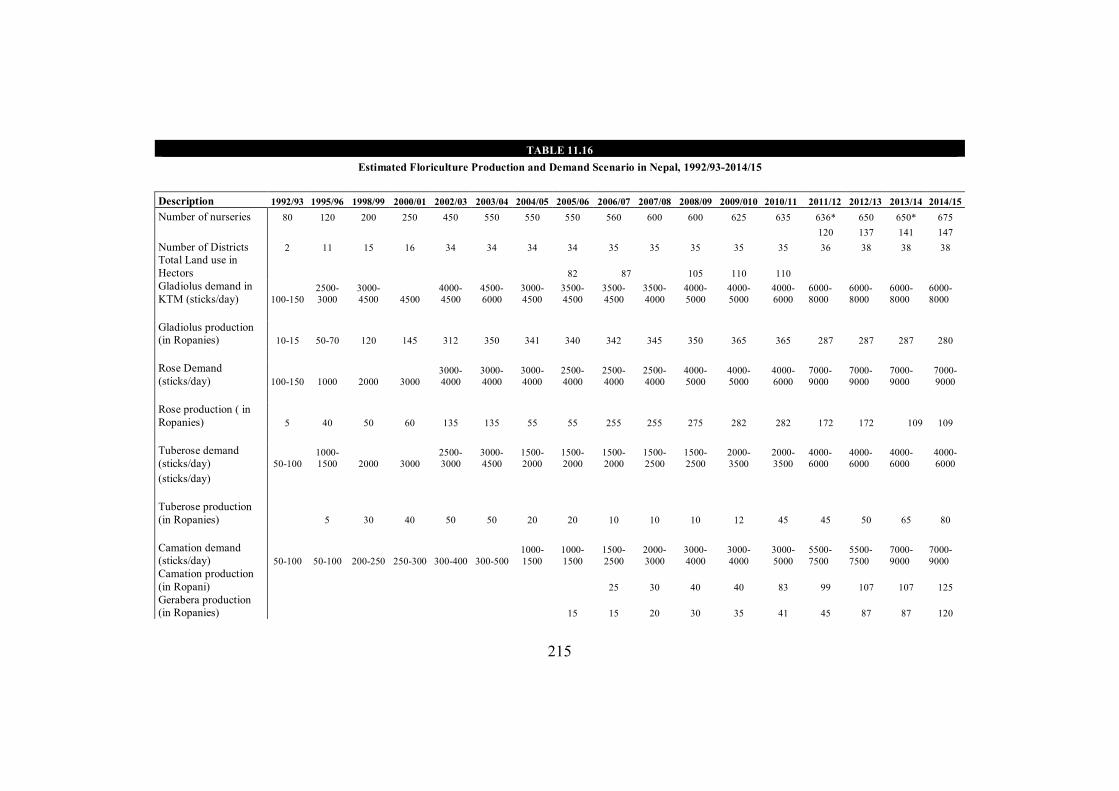
215
TABLE 11.16
Estimated Floriculture Production and Demand Scenario in Nepal, 1992/93-2014/15
Description 1992/93 1995/96 1998/99 2000/01 2002/03 2003/04 2004/05 2005/06 2006/07 2007/08 2008/09 2009/010 2010/11 2011/12 2012/13 2013/14 2014/15 Number of nurseries 80 120 200 250 450 550 550 550 560 600 600 625 635 636* 650 650* 675 120 137 141 147 Number of Districts 2 11 15 16 34 34 34 34 35 35 35 35 35 36 38 38 38 Total Land use in Hectors 82 87 105 110 110 Gladiolus demand in KTM (sticks/day) 100-150
2500-3000
3000-4500 4500
4000-4500
4500-6000
3000-4500
3500-4500
3500-4500
3500-4000
4000-5000
4000-5000
4000-6000
6000-8000
6000-8000
6000-8000
6000-8000
Gladiolus production (in Ropanies) 10-15 50-70 120 145 312 350 341 340 342 345 350 365 365 287 287 287 280 Rose Demand (sticks/day) 100-150 1000 2000 3000
3000-4000
3000-4000
3000-4000
2500-4000
2500-4000
2500-4000
4000-5000
4000-5000
4000-6000
7000-9000
7000-9000
7000-9000
7000-9000
Rose production ( in Ropanies) 5 40 50 60 135 135 55 55 255 255 275 282 282 172 172 109 109 Tuberose demand (sticks/day) 50-100
1000-1500 2000 3000
2500-3000
3000-4500
1500-2000
1500-2000
1500-2000
1500-2500
1500-2500
2000-3500
2000-3500
4000-6000
4000-6000
4000-6000
4000-6000
(sticks/day) Tuberose production (in Ropanies) 5 30 40 50 50 20 20 10 10 10 12 45 45 50 65 80 Camation demand (sticks/day) 50-100 50-100 200-250 250-300 300-400 300-500
1000-1500
1000-1500
1500-2500
2000-3000
3000-4000
3000-4000
3000-5000
5500-7500
5500-7500
7000-9000
7000-9000
Camation production (in Ropani) 25 30 40 40 83 99 107 107 125 Gerabera production (in Ropanies) 15 15 20 30 35 41 45 87 87 120
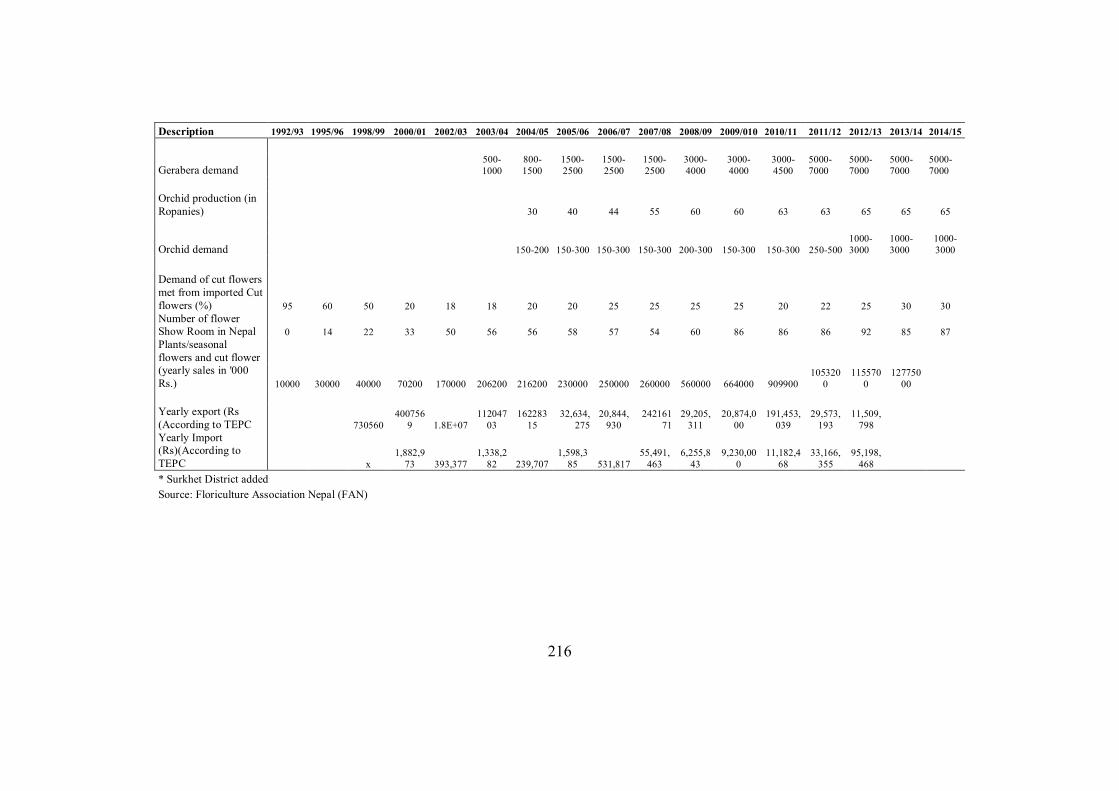
216
Description 1992/93 1995/96 1998/99 2000/01 2002/03 2003/04 2004/05 2005/06 2006/07 2007/08 2008/09 2009/010 2010/11 2011/12 2012/13 2013/14 2014/15
Gerabera demand 500-1000
800-1500
1500-2500
1500-2500
1500-2500
3000-4000
3000-4000
3000-4500
5000-7000
5000-7000
5000-7000
5000-7000
Orchid production (in Ropanies) 30 40 44 55 60 60 63 63 65 65 65
Orchid demand 150-200 150-300 150-300 150-300 200-300 150-300 150-300 250-500 1000-3000
1000-3000
1000-3000
Demand of cut flowers met from imported Cut flowers (%) 95 60 50 20 18 18 20 20 25 25 25 25 20 22 25 30 30 Number of flower Show Room in Nepal 0 14 22 33 50 56 56 58 57 54 60 86 86 86 92 85 87 Plants/seasonal flowers and cut flower (yearly sales in '000 Rs.) 10000 30000 40000 70200 170000 206200 216200 230000 250000 260000 560000 664000 909900
1053200
1155700
12775000
Yearly export (Rs (According to TEPC 730560
4007569 1.8E+07
11204703
16228315
32,634,275
20,844,930
24216171
29,205,311
20,874,000
191,453,039
29,573,193
11,509,798
Yearly Import (Rs)(According to TEPC x
1,882,973 393,377
1,338,282 239,707
1,598,385 531,817
55,491,463
6,255,843
9,230,000
11,182,468
33,166,355
95,198,468
* Surkhet District added Source: Floriculture Association Nepal (FAN)
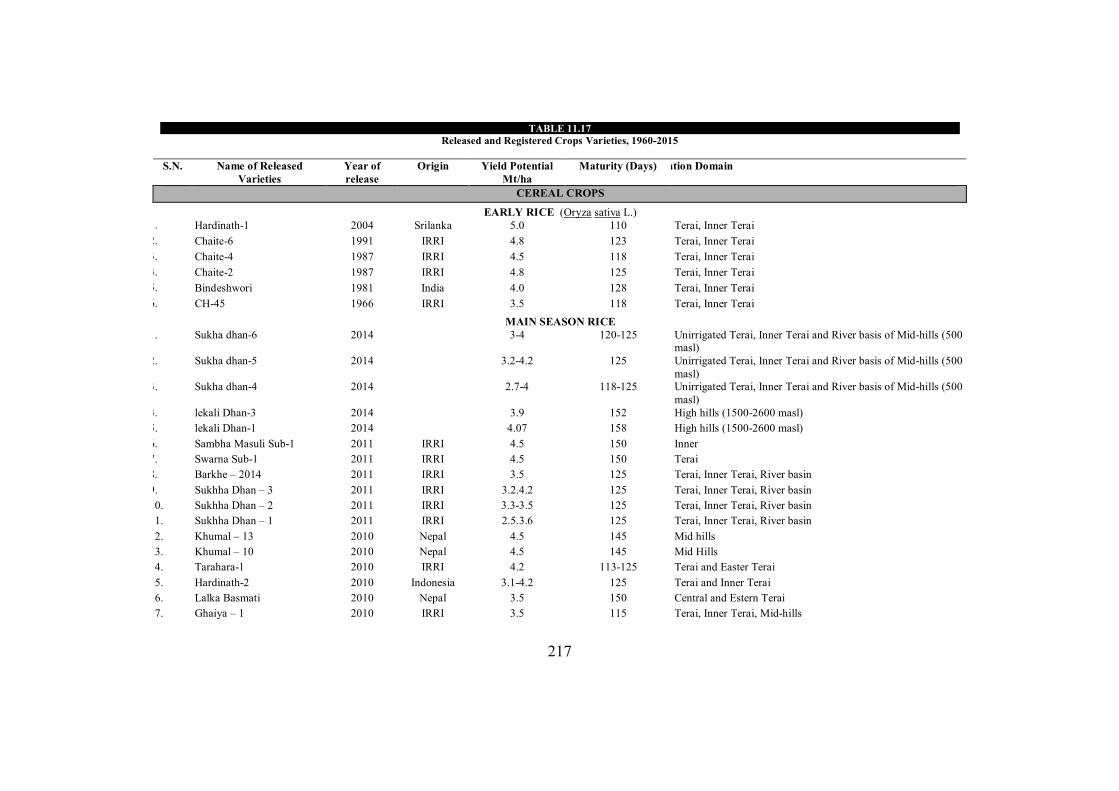
217
TABLE 11.17 Released and Registered Crops Varieties, 1960-2015
S.N. Name of Released
Varieties Year of release
Origin Yield Potential Mt/ha
Maturity (Days) Recommendation Domain
CEREAL CROPS
EARLY RICE (Oryza sativa L.) 1. Hardinath-1 2004 Srilanka 5.0 110 Terai, Inner Terai 2. Chaite-6 1991 IRRI 4.8 123 Terai, Inner Terai 3. Chaite-4 1987 IRRI 4.5 118 Terai, Inner Terai 4. Chaite-2 1987 IRRI 4.8 125 Terai, Inner Terai 5. Bindeshwori 1981 India 4.0 128 Terai, Inner Terai 6. CH-45 1966 IRRI 3.5 118 Terai, Inner Terai
MAIN SEASON RICE 1. Sukha dhan-6 2014 3-4 120-125 Unirrigated Terai, Inner Terai and River basis of Mid-hills (500
masl) 2. Sukha dhan-5 2014 3.2-4.2 125 Unirrigated Terai, Inner Terai and River basis of Mid-hills (500
masl) 3. Sukha dhan-4 2014 2.7-4 118-125 Unirrigated Terai, Inner Terai and River basis of Mid-hills (500
masl) 4. lekali Dhan-3 2014 3.9 152 High hills (1500-2600 masl) 5. lekali Dhan-1 2014 4.07 158 High hills (1500-2600 masl) 6. Sambha Masuli Sub-1 2011 IRRI 4.5 150 Inner 7. Swarna Sub-1 2011 IRRI 4.5 150 Terai 8. Barkhe – 2014 2011 IRRI 3.5 125 Terai, Inner Terai, River basin 9. Sukhha Dhan – 3 2011 IRRI 3.2.4.2 125 Terai, Inner Terai, River basin 10. Sukhha Dhan – 2 2011 IRRI 3.3-3.5 125 Terai, Inner Terai, River basin 11. Sukhha Dhan – 1 2011 IRRI 2.5.3.6 125 Terai, Inner Terai, River basin 12. Khumal – 13 2010 Nepal 4.5 145 Mid hills 13. Khumal – 10 2010 Nepal 4.5 145 Mid Hills 14. Tarahara-1 2010 IRRI 4.2 113-125 Terai and Easter Terai 15. Hardinath-2 2010 Indonesia 3.1-4.2 125 Terai and Inner Terai 16. Lalka Basmati 2010 Nepal 3.5 150 Central and Estern Terai 17. Ghaiya – 1 2010 IRRI 3.5 115 Terai, Inner Terai, Mid-hills
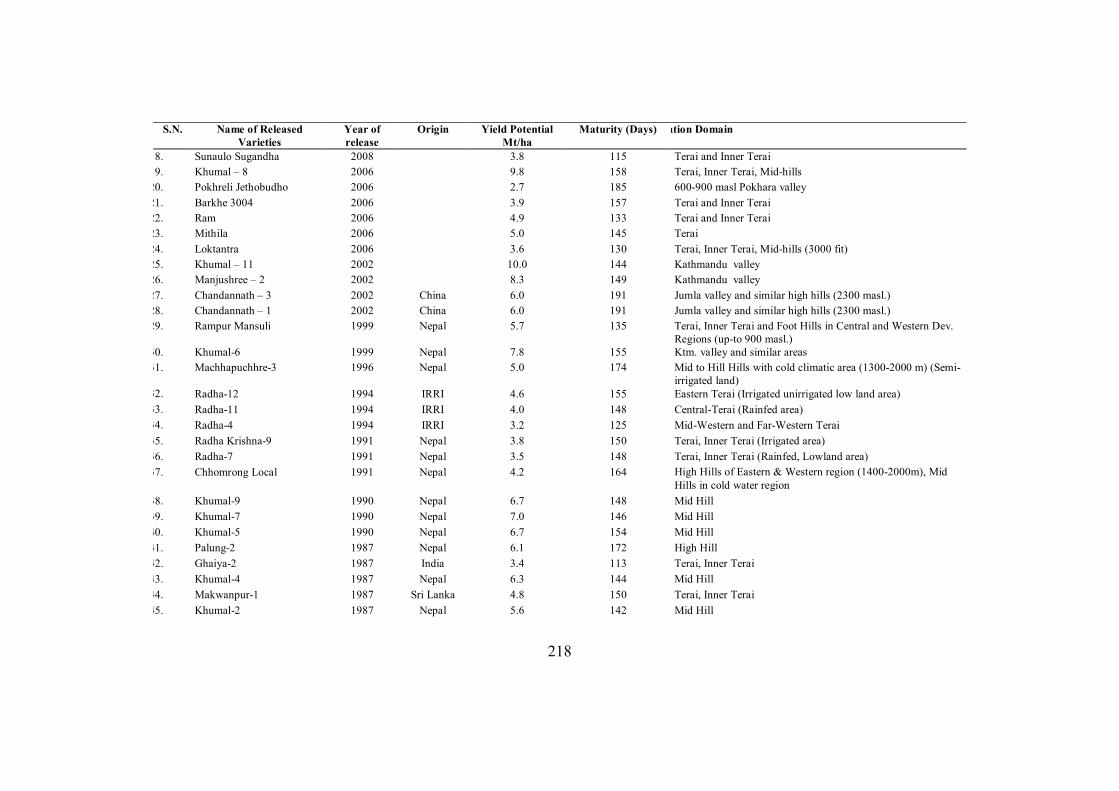
218
S.N. Name of Released Varieties
Year of release
Origin Yield Potential Mt/ha
Maturity (Days) Recommendation Domain
18. Sunaulo Sugandha 2008 3.8 115 Terai and Inner Terai 19. Khumal – 8 2006 9.8 158 Terai, Inner Terai, Mid-hills 20. Pokhreli Jethobudho 2006 2.7 185 600-900 masl Pokhara valley 21. Barkhe 3004 2006 3.9 157 Terai and Inner Terai 22. Ram 2006 4.9 133 Terai and Inner Terai 23. Mithila 2006 5.0 145 Terai 24. Loktantra 2006 3.6 130 Terai, Inner Terai, Mid-hills (3000 fit) 25. Khumal – 11 2002 10.0 144 Kathmandu valley 26. Manjushree – 2 2002 8.3 149 Kathmandu valley 27. Chandannath – 3 2002 China 6.0 191 Jumla valley and similar high hills (2300 masl.) 28. Chandannath – 1 2002 China 6.0 191 Jumla valley and similar high hills (2300 masl.) 29. Rampur Mansuli 1999 Nepal 5.7 135 Terai, Inner Terai and Foot Hills in Central and Western Dev.
Regions (up-to 900 masl.) 30. Khumal-6 1999 Nepal 7.8 155 Ktm. valley and similar areas 31. Machhapuchhre-3 1996 Nepal 5.0 174 Mid to Hill Hills with cold climatic area (1300-2000 m) (Semi-
irrigated land) 32. Radha-12 1994 IRRI 4.6 155 Eastern Terai (Irrigated unirrigated low land area) 33. Radha-11 1994 IRRI 4.0 148 Central-Terai (Rainfed area) 34. Radha-4 1994 IRRI 3.2 125 Mid-Western and Far-Western Terai 35. Radha Krishna-9 1991 Nepal 3.8 150 Terai, Inner Terai (Irrigated area) 36. Radha-7 1991 Nepal 3.5 148 Terai, Inner Terai (Rainfed, Lowland area) 37. Chhomrong Local 1991 Nepal 4.2 164 High Hills of Eastern & Western region (1400-2000m), Mid
Hills in cold water region 38. Khumal-9 1990 Nepal 6.7 148 Mid Hill 39. Khumal-7 1990 Nepal 7.0 146 Mid Hill 40. Khumal-5 1990 Nepal 6.7 154 Mid Hill 41. Palung-2 1987 Nepal 6.1 172 High Hill 42. Ghaiya-2 1987 India 3.4 113 Terai, Inner Terai 43. Khumal-4 1987 Nepal 6.3 144 Mid Hill 44. Makwanpur-1 1987 Sri Lanka 4.8 150 Terai, Inner Terai 45. Khumal-2 1987 Nepal 5.6 142 Mid Hill
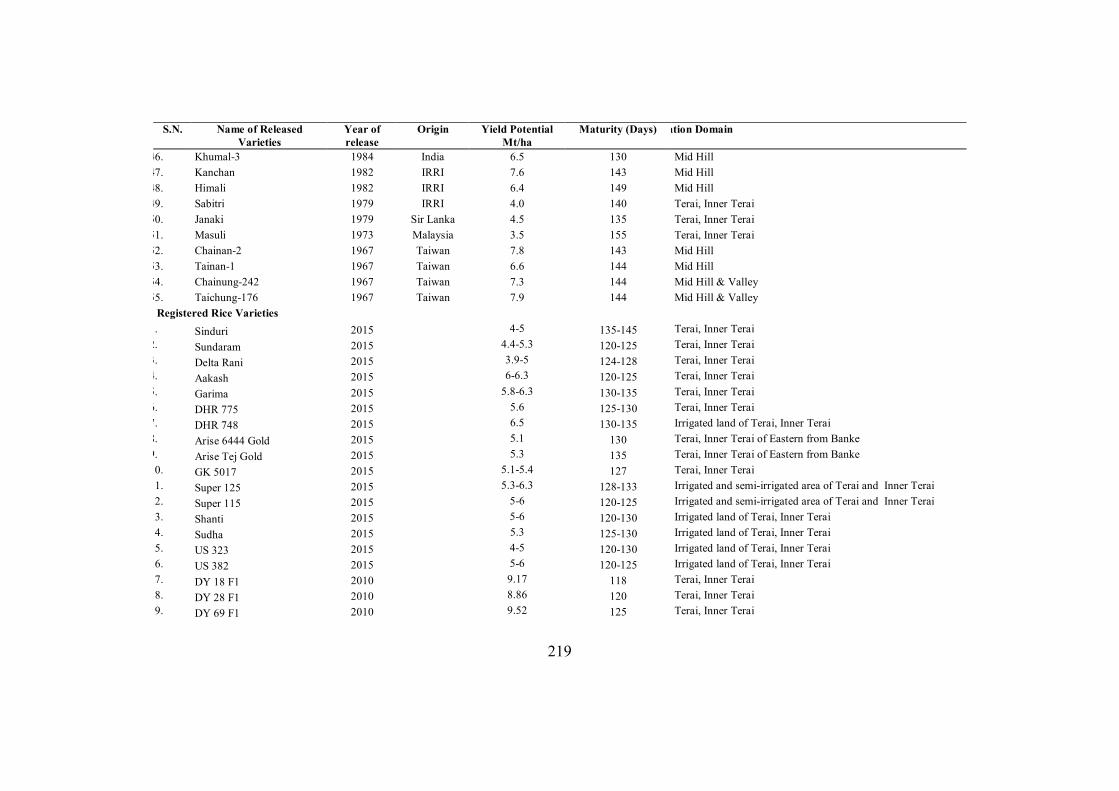
219
S.N. Name of Released Varieties
Year of release
Origin Yield Potential Mt/ha
Maturity (Days) Recommendation Domain
46. Khumal-3 1984 India 6.5 130 Mid Hill 47. Kanchan 1982 IRRI 7.6 143 Mid Hill 48. Himali 1982 IRRI 6.4 149 Mid Hill 49. Sabitri 1979 IRRI 4.0 140 Terai, Inner Terai 50. Janaki 1979 Sir Lanka 4.5 135 Terai, Inner Terai 51. Masuli 1973 Malaysia 3.5 155 Terai, Inner Terai 52. Chainan-2 1967 Taiwan 7.8 143 Mid Hill 53. Tainan-1 1967 Taiwan 6.6 144 Mid Hill 54. Chainung-242 1967 Taiwan 7.3 144 Mid Hill & Valley 55. Taichung-176 1967 Taiwan 7.9 144 Mid Hill & Valley
Registered Rice Varieties 1. Sinduri 2015 4-5 135-145 Terai, Inner Terai 2. Sundaram 2015 4.4-5.3 120-125 Terai, Inner Terai 3. Delta Rani 2015 3.9-5 124-128 Terai, Inner Terai 4. Aakash 2015 6-6.3 120-125 Terai, Inner Terai 5. Garima 2015 5.8-6.3 130-135 Terai, Inner Terai 6. DHR 775 2015 5.6 125-130 Terai, Inner Terai 7. DHR 748 2015 6.5 130-135 Irrigated land of Terai, Inner Terai 8. Arise 6444 Gold 2015 5.1 130 Terai, Inner Terai of Eastern from Banke 9. Arise Tej Gold 2015 5.3 135 Terai, Inner Terai of Eastern from Banke 10. GK 5017 2015 5.1-5.4 127 Terai, Inner Terai 11. Super 125 2015 5.3-6.3 128-133 Irrigated and semi-irrigated area of Terai and Inner Terai 12. Super 115 2015 5-6 120-125 Irrigated and semi-irrigated area of Terai and Inner Terai 13. Shanti 2015 5-6 120-130 Irrigated land of Terai, Inner Terai 14. Sudha 2015 5.3 125-130 Irrigated land of Terai, Inner Terai 15. US 323 2015 4-5 120-130 Irrigated land of Terai, Inner Terai 16. US 382 2015 5-6 120-125 Irrigated land of Terai, Inner Terai 17. DY 18 F1 2010 9.17 118 Terai, Inner Terai 18. DY 28 F1 2010 8.86 120 Terai, Inner Terai 19. DY 69 F1 2010 9.52 125 Terai, Inner Terai
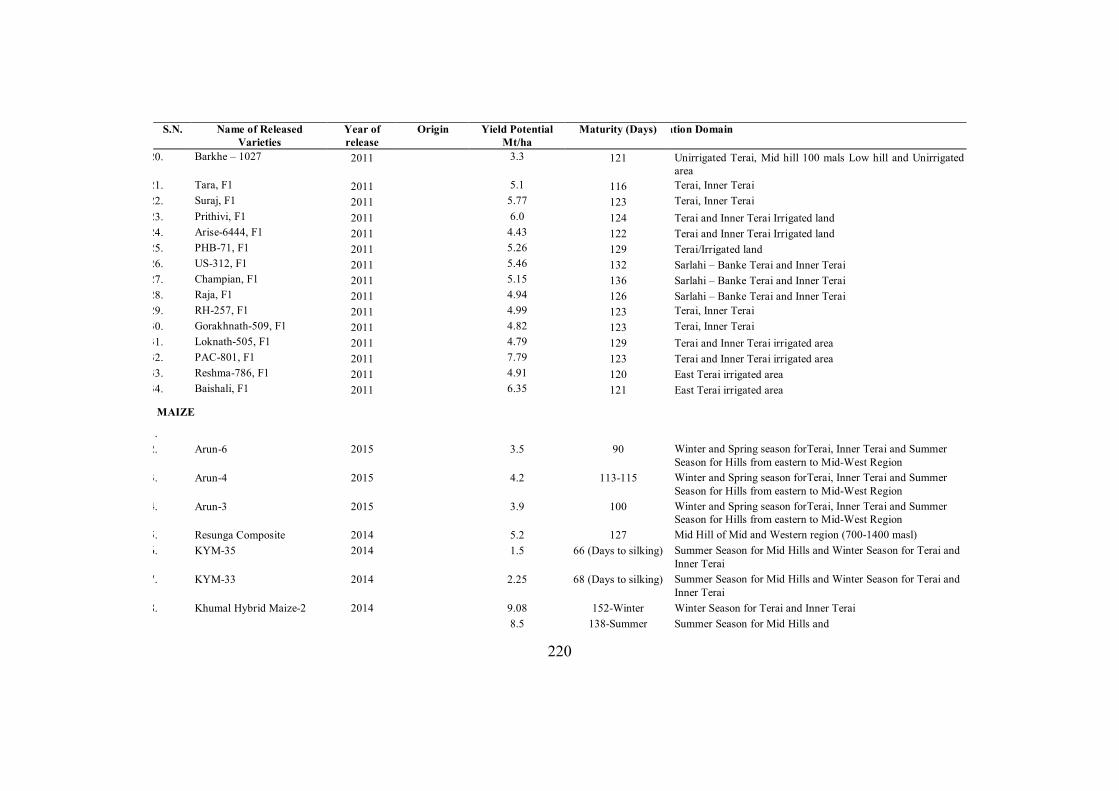
220
S.N. Name of Released Varieties
Year of release
Origin Yield Potential Mt/ha
Maturity (Days) Recommendation Domain
20. Barkhe – 1027 2011 3.3 121 Unirrigated Terai, Mid hill 100 mals Low hill and Unirrigated area
21. Tara, F1 2011 5.1 116 Terai, Inner Terai 22. Suraj, F1 2011 5.77 123 Terai, Inner Terai 23. Prithivi, F1 2011 6.0 124 Terai and Inner Terai Irrigated land 24. Arise-6444, F1 2011 4.43 122 Terai and Inner Terai Irrigated land 25. PHB-71, F1 2011 5.26 129 Terai/Irrigated land 26. US-312, F1 2011 5.46 132 Sarlahi – Banke Terai and Inner Terai 27. Champian, F1 2011 5.15 136 Sarlahi – Banke Terai and Inner Terai 28. Raja, F1 2011 4.94 126 Sarlahi – Banke Terai and Inner Terai 29. RH-257, F1 2011 4.99 123 Terai, Inner Terai 30. Gorakhnath-509, F1 2011 4.82 123 Terai, Inner Terai 31. Loknath-505, F1 2011 4.79 129 Terai and Inner Terai irrigated area 32. PAC-801, F1 2011 7.79 123 Terai and Inner Terai irrigated area 33. Reshma-786, F1 2011 4.91 120 East Terai irrigated area 34. Baishali, F1 2011 6.35 121 East Terai irrigated area
MAIZE
1. 2. Arun-6 2015 3.5 90 Winter and Spring season forTerai, Inner Terai and Summer
Season for Hills from eastern to Mid-West Region 3. Arun-4 2015 4.2 113-115 Winter and Spring season forTerai, Inner Terai and Summer
Season for Hills from eastern to Mid-West Region 4. Arun-3 2015 3.9 100 Winter and Spring season forTerai, Inner Terai and Summer
Season for Hills from eastern to Mid-West Region 5. Resunga Composite 2014 5.2 127 Mid Hill of Mid and Western region (700-1400 masl) 6. KYM-35 2014 1.5 66 (Days to silking) Summer Season for Mid Hills and Winter Season for Terai and
Inner Terai 7. KYM-33 2014 2.25 68 (Days to silking) Summer Season for Mid Hills and Winter Season for Terai and
Inner Terai 8. Khumal Hybrid Maize-2 2014 9.08
8.5 152-Winter
138-Summer Winter Season for Terai and Inner Terai Summer Season for Mid Hills and
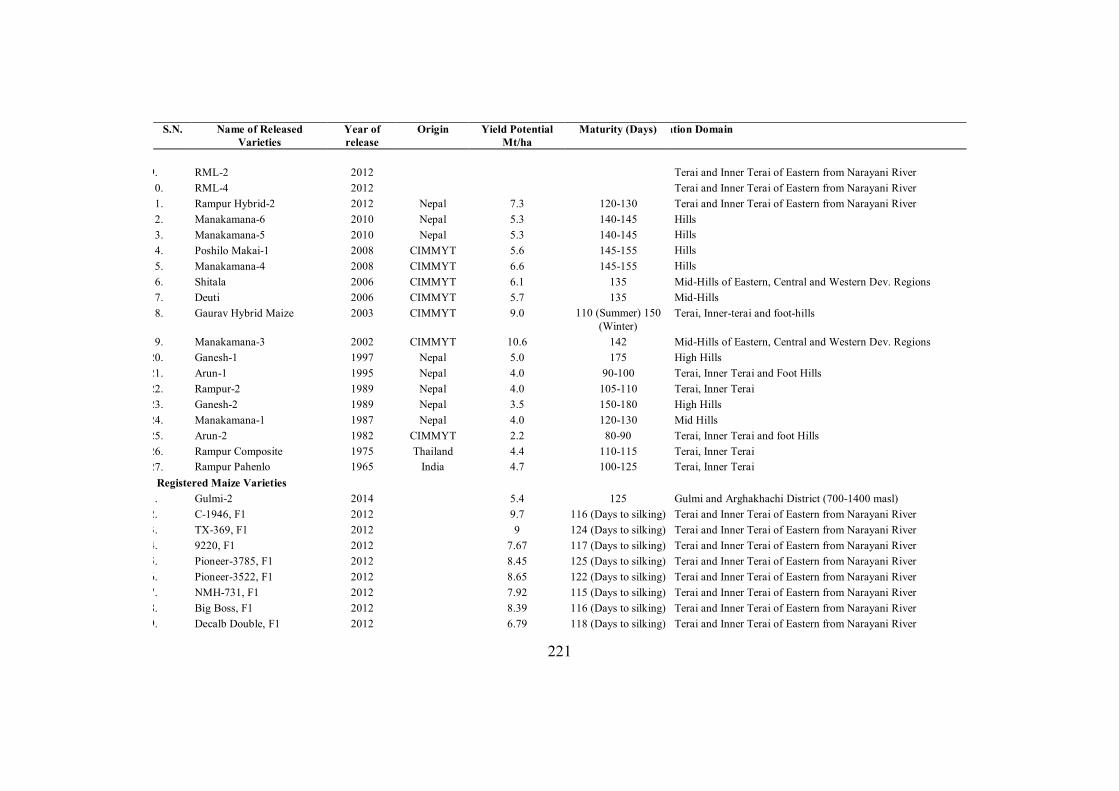
221
S.N. Name of Released Varieties
Year of release
Origin Yield Potential Mt/ha
Maturity (Days) Recommendation Domain
9. RML-2 2012 Terai and Inner Terai of Eastern from Narayani River 10. RML-4 2012 Terai and Inner Terai of Eastern from Narayani River 11. Rampur Hybrid-2 2012 Nepal 7.3 120-130 Terai and Inner Terai of Eastern from Narayani River 12. Manakamana-6 2010 Nepal 5.3 140-145 Hills 13. Manakamana-5 2010 Nepal 5.3 140-145 Hills 14. Poshilo Makai-1 2008 CIMMYT 5.6 145-155 Hills 15. Manakamana-4 2008 CIMMYT 6.6 145-155 Hills 16. Shitala 2006 CIMMYT 6.1 135 Mid-Hills of Eastern, Central and Western Dev. Regions 17. Deuti 2006 CIMMYT 5.7 135 Mid-Hills 18. Gaurav Hybrid Maize 2003 CIMMYT 9.0 110 (Summer) 150
(Winter) Terai, Inner-terai and foot-hills
19. Manakamana-3 2002 CIMMYT 10.6 142 Mid-Hills of Eastern, Central and Western Dev. Regions 20. Ganesh-1 1997 Nepal 5.0 175 High Hills 21. Arun-1 1995 Nepal 4.0 90-100 Terai, Inner Terai and Foot Hills 22. Rampur-2 1989 Nepal 4.0 105-110 Terai, Inner Terai 23. Ganesh-2 1989 Nepal 3.5 150-180 High Hills 24. Manakamana-1 1987 Nepal 4.0 120-130 Mid Hills 25. Arun-2 1982 CIMMYT 2.2 80-90 Terai, Inner Terai and foot Hills 26. Rampur Composite 1975 Thailand 4.4 110-115 Terai, Inner Terai 27. Rampur Pahenlo 1965 India 4.7 100-125 Terai, Inner Terai
Registered Maize Varieties 1. Gulmi-2 2014 5.4 125 Gulmi and Arghakhachi District (700-1400 masl) 2. C-1946, F1 2012 9.7 116 (Days to silking) Terai and Inner Terai of Eastern from Narayani River 3. TX-369, F1 2012 9 124 (Days to silking) Terai and Inner Terai of Eastern from Narayani River 4. 9220, F1 2012 7.67 117 (Days to silking) Terai and Inner Terai of Eastern from Narayani River 5. Pioneer-3785, F1 2012 8.45 125 (Days to silking) Terai and Inner Terai of Eastern from Narayani River 6. Pioneer-3522, F1 2012 8.65 122 (Days to silking) Terai and Inner Terai of Eastern from Narayani River 7. NMH-731, F1 2012 7.92 115 (Days to silking) Terai and Inner Terai of Eastern from Narayani River 8. Big Boss, F1 2012 8.39 116 (Days to silking) Terai and Inner Terai of Eastern from Narayani River 9. Decalb Double, F1 2012 6.79 118 (Days to silking) Terai and Inner Terai of Eastern from Narayani River
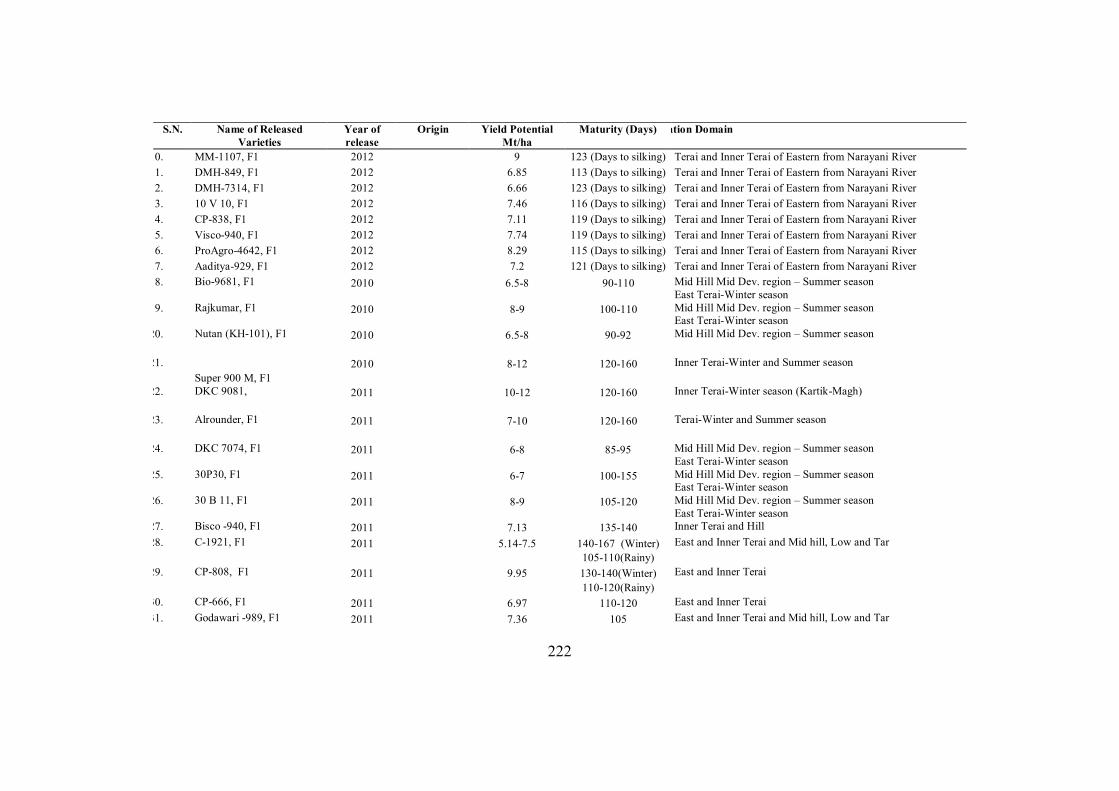
222
S.N. Name of Released Varieties
Year of release
Origin Yield Potential Mt/ha
Maturity (Days) Recommendation Domain
10. MM-1107, F1 2012 9 123 (Days to silking) Terai and Inner Terai of Eastern from Narayani River 11. DMH-849, F1 2012 6.85 113 (Days to silking) Terai and Inner Terai of Eastern from Narayani River 12. DMH-7314, F1 2012 6.66 123 (Days to silking) Terai and Inner Terai of Eastern from Narayani River 13. 10 V 10, F1 2012 7.46 116 (Days to silking) Terai and Inner Terai of Eastern from Narayani River 14. CP-838, F1 2012 7.11 119 (Days to silking) Terai and Inner Terai of Eastern from Narayani River 15. Visco-940, F1 2012 7.74 119 (Days to silking) Terai and Inner Terai of Eastern from Narayani River 16. ProAgro-4642, F1 2012 8.29 115 (Days to silking) Terai and Inner Terai of Eastern from Narayani River 17. Aaditya-929, F1 2012 7.2 121 (Days to silking) Terai and Inner Terai of Eastern from Narayani River 18. Bio-9681, F1 2010 6.5-8 90-110 Mid Hill Mid Dev. region – Summer season
East Terai-Winter season 19. Rajkumar, F1 2010 8-9 100-110 Mid Hill Mid Dev. region – Summer season
East Terai-Winter season 20. Nutan (KH-101), F1 2010 6.5-8 90-92 Mid Hill Mid Dev. region – Summer season
21.
Super 900 M, F1 2010 8-12 120-160 Inner Terai-Winter and Summer season
22. DKC 9081, 2011 10-12 120-160 Inner Terai-Winter season (Kartik-Magh)
23. Alrounder, F1 2011 7-10 120-160 Terai-Winter and Summer season
24. DKC 7074, F1 2011 6-8 85-95 Mid Hill Mid Dev. region – Summer season
East Terai-Winter season 25. 30P30, F1 2011 6-7 100-155 Mid Hill Mid Dev. region – Summer season
East Terai-Winter season 26. 30 B 11, F1
2011 8-9 105-120 Mid Hill Mid Dev. region – Summer season
East Terai-Winter season 27. Bisco -940, F1 2011 7.13 135-140 Inner Terai and Hill 28. C-1921, F1 2011 5.14-7.5 140-167 (Winter)
105-110(Rainy) East and Inner Terai and Mid hill, Low and Tar
29. CP-808, F1 2011 9.95 130-140(Winter) 110-120(Rainy)
East and Inner Terai
30. CP-666, F1 2011 6.97 110-120 East and Inner Terai 31. Godawari -989, F1 2011 7.36 105 East and Inner Terai and Mid hill, Low and Tar
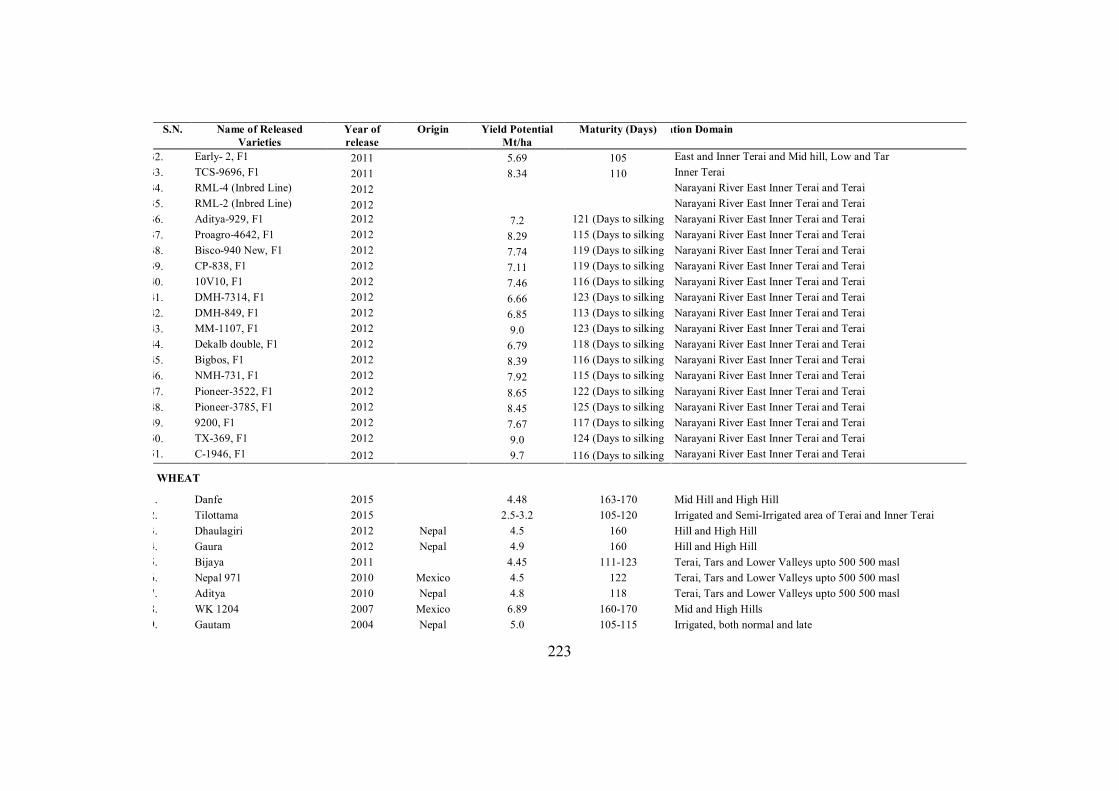
223
S.N. Name of Released Varieties
Year of release
Origin Yield Potential Mt/ha
Maturity (Days) Recommendation Domain
32. Early- 2, F1 2011 5.69 105 East and Inner Terai and Mid hill, Low and Tar 33. TCS-9696, F1 2011 8.34 110 Inner Terai 34. RML-4 (Inbred Line) 2012 Narayani River East Inner Terai and Terai 35. RML-2 (Inbred Line) 2012 Narayani River East Inner Terai and Terai 36. Aditya-929, F1 2012 7.2 121 (Days to silking Narayani River East Inner Terai and Terai 37. Proagro-4642, F1 2012 8.29 115 (Days to silking Narayani River East Inner Terai and Terai 38. Bisco-940 New, F1 2012 7.74 119 (Days to silking Narayani River East Inner Terai and Terai 39. CP-838, F1 2012 7.11 119 (Days to silking Narayani River East Inner Terai and Terai 40. 10V10, F1 2012 7.46 116 (Days to silking Narayani River East Inner Terai and Terai 41. DMH-7314, F1 2012 6.66 123 (Days to silking Narayani River East Inner Terai and Terai 42. DMH-849, F1 2012 6.85 113 (Days to silking Narayani River East Inner Terai and Terai 43. MM-1107, F1 2012 9.0 123 (Days to silking Narayani River East Inner Terai and Terai 44. Dekalb double, F1 2012 6.79 118 (Days to silking Narayani River East Inner Terai and Terai 45. Bigbos, F1 2012 8.39 116 (Days to silking Narayani River East Inner Terai and Terai 46. NMH-731, F1 2012 7.92 115 (Days to silking Narayani River East Inner Terai and Terai 47. Pioneer-3522, F1 2012 8.65 122 (Days to silking Narayani River East Inner Terai and Terai 48. Pioneer-3785, F1 2012 8.45 125 (Days to silking Narayani River East Inner Terai and Terai 49. 9200, F1 2012 7.67 117 (Days to silking Narayani River East Inner Terai and Terai 50. TX-369, F1 2012 9.0 124 (Days to silking Narayani River East Inner Terai and Terai 51. C-1946, F1 2012 9.7 116 (Days to silking Narayani River East Inner Terai and Terai
WHEAT
1. Danfe 2015 4.48 163-170 Mid Hill and High Hill 2. Tilottama 2015 2.5-3.2 105-120 Irrigated and Semi-Irrigated area of Terai and Inner Terai 3. Dhaulagiri 2012 Nepal 4.5 160 Hill and High Hill 4. Gaura 2012 Nepal 4.9 160 Hill and High Hill 5. Bijaya 2011 4.45 111-123 Terai, Tars and Lower Valleys upto 500 500 masl 6. Nepal 971 2010 Mexico 4.5 122 Terai, Tars and Lower Valleys upto 500 500 masl 7. Aditya 2010 Nepal 4.8 118 Terai, Tars and Lower Valleys upto 500 500 masl 8. WK 1204 2007 Mexico 6.89 160-170 Mid and High Hills 9. Gautam 2004 Nepal 5.0 105-115 Irrigated, both normal and late
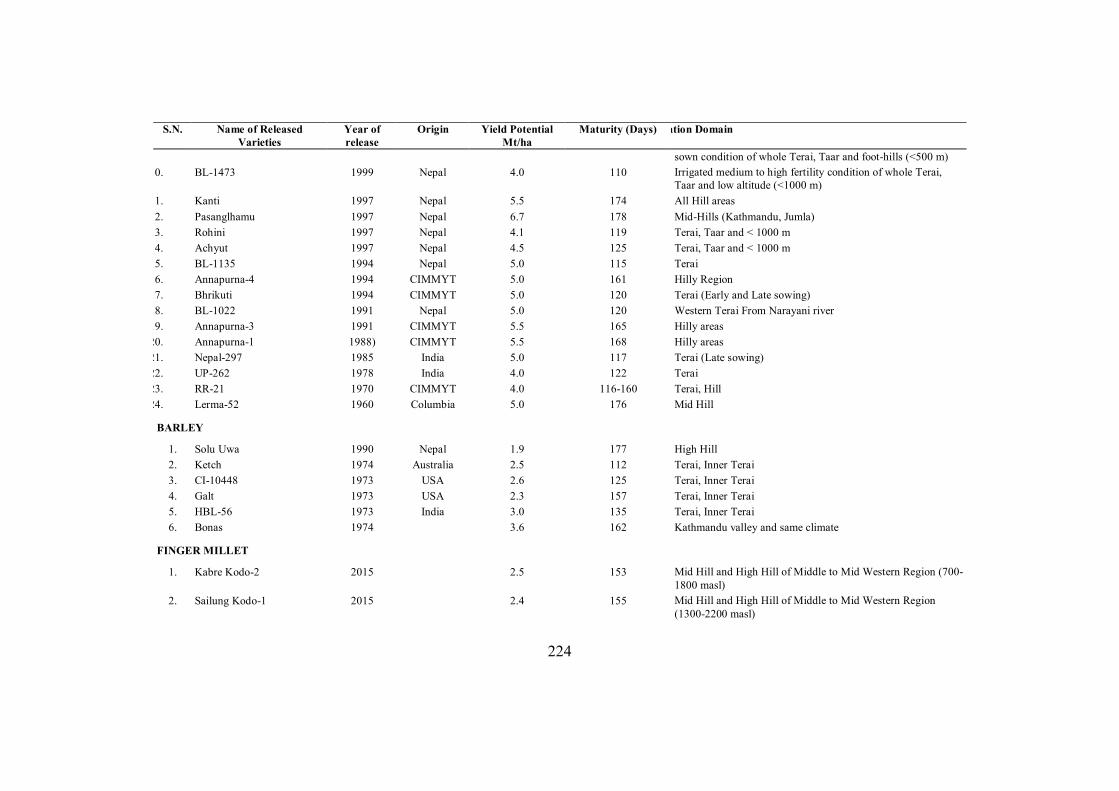
224
S.N. Name of Released Varieties
Year of release
Origin Yield Potential Mt/ha
Maturity (Days) Recommendation Domain
sown condition of whole Terai, Taar and foot-hills (<500 m) 10. BL-1473 1999 Nepal 4.0 110 Irrigated medium to high fertility condition of whole Terai,
Taar and low altitude (<1000 m) 11. Kanti 1997 Nepal 5.5 174 All Hill areas 12. Pasanglhamu 1997 Nepal 6.7 178 Mid-Hills (Kathmandu, Jumla) 13. Rohini 1997 Nepal 4.1 119 Terai, Taar and < 1000 m 14. Achyut 1997 Nepal 4.5 125 Terai, Taar and < 1000 m 15. BL-1135 1994 Nepal 5.0 115 Terai 16. Annapurna-4 1994 CIMMYT 5.0 161 Hilly Region 17. Bhrikuti 1994 CIMMYT 5.0 120 Terai (Early and Late sowing) 18. BL-1022 1991 Nepal 5.0 120 Western Terai From Narayani river 19. Annapurna-3 1991 CIMMYT 5.5 165 Hilly areas 20. Annapurna-1 1988) CIMMYT 5.5 168 Hilly areas 21. Nepal-297 1985 India 5.0 117 Terai (Late sowing) 22. UP-262 1978 India 4.0 122 Terai 23. RR-21 1970 CIMMYT 4.0 116-160 Terai, Hill 24. Lerma-52 1960 Columbia 5.0 176 Mid Hill
BARLEY
1. Solu Uwa 1990 Nepal 1.9 177 High Hill 2. Ketch 1974 Australia 2.5 112 Terai, Inner Terai 3. CI-10448 1973 USA 2.6 125 Terai, Inner Terai 4. Galt 1973 USA 2.3 157 Terai, Inner Terai 5. HBL-56 1973 India 3.0 135 Terai, Inner Terai 6. Bonas 1974 3.6 162 Kathmandu valley and same climate
FINGER MILLET
1. Kabre Kodo-2 2015 2.5 153 Mid Hill and High Hill of Middle to Mid Western Region (700-1800 masl)
2. Sailung Kodo-1 2015 2.4 155 Mid Hill and High Hill of Middle to Mid Western Region (1300-2200 masl)
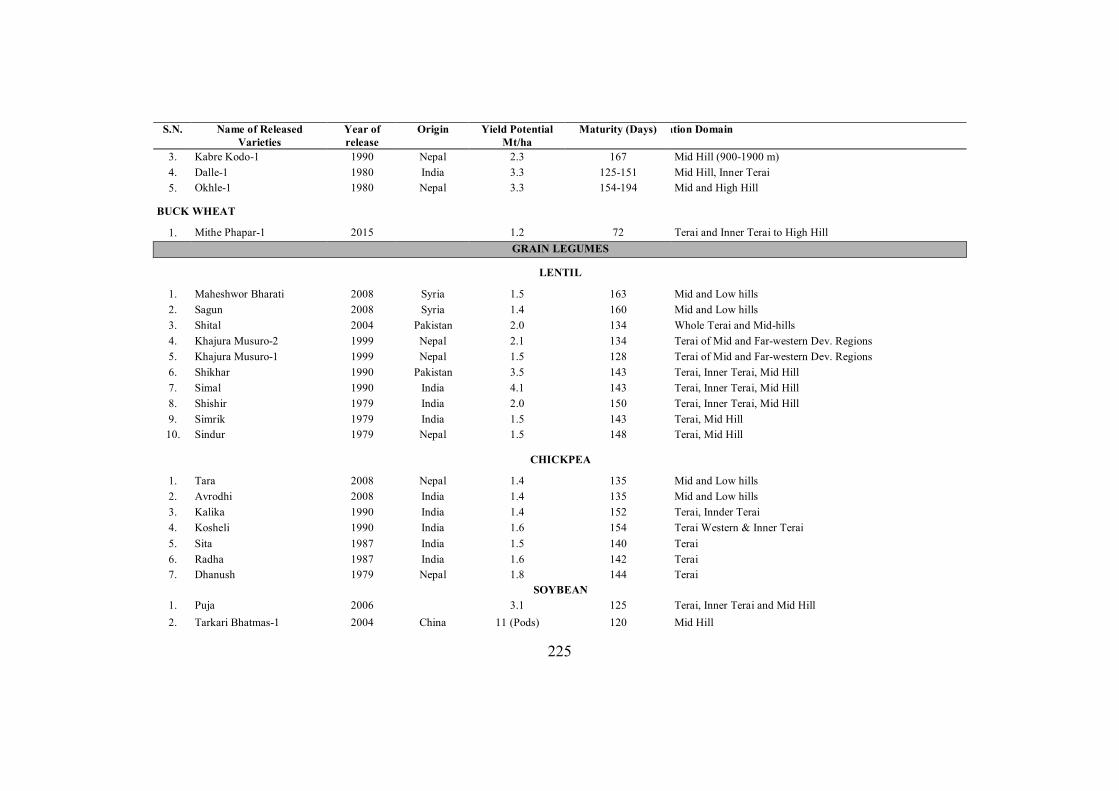
225
S.N. Name of Released Varieties
Year of release
Origin Yield Potential Mt/ha
Maturity (Days) Recommendation Domain
3. Kabre Kodo-1 1990 Nepal 2.3 167 Mid Hill (900-1900 m) 4. Dalle-1 1980 India 3.3 125-151 Mid Hill, Inner Terai 5. Okhle-1 1980 Nepal 3.3 154-194 Mid and High Hill
BUCK WHEAT
1. Mithe Phapar-1 2015 1.2 72 Terai and Inner Terai to High Hill GRAIN LEGUMES
LENTIL
1. Maheshwor Bharati 2008 Syria 1.5 163 Mid and Low hills 2. Sagun 2008 Syria 1.4 160 Mid and Low hills 3. Shital 2004 Pakistan 2.0 134 Whole Terai and Mid-hills 4. Khajura Musuro-2 1999 Nepal 2.1 134 Terai of Mid and Far-western Dev. Regions 5. Khajura Musuro-1 1999 Nepal 1.5 128 Terai of Mid and Far-western Dev. Regions 6. Shikhar 1990 Pakistan 3.5 143 Terai, Inner Terai, Mid Hill 7. Simal 1990 India 4.1 143 Terai, Inner Terai, Mid Hill 8. Shishir 1979 India 2.0 150 Terai, Inner Terai, Mid Hill 9. Simrik 1979 India 1.5 143 Terai, Mid Hill 10. Sindur 1979 Nepal 1.5 148 Terai, Mid Hill
CHICKPEA
1. Tara 2008 Nepal 1.4 135 Mid and Low hills 2. Avrodhi 2008 India 1.4 135 Mid and Low hills 3. Kalika 1990 India 1.4 152 Terai, Innder Terai 4. Kosheli 1990 India 1.6 154 Terai Western & Inner Terai 5. Sita 1987 India 1.5 140 Terai 6. Radha 1987 India 1.6 142 Terai 7. Dhanush 1979 Nepal 1.8 144 Terai
SOYBEAN 1. Puja 2006 3.1 125 Terai, Inner Terai and Mid Hill 2. Tarkari Bhatmas-1 2004 China 11 (Pods) 120 Mid Hill
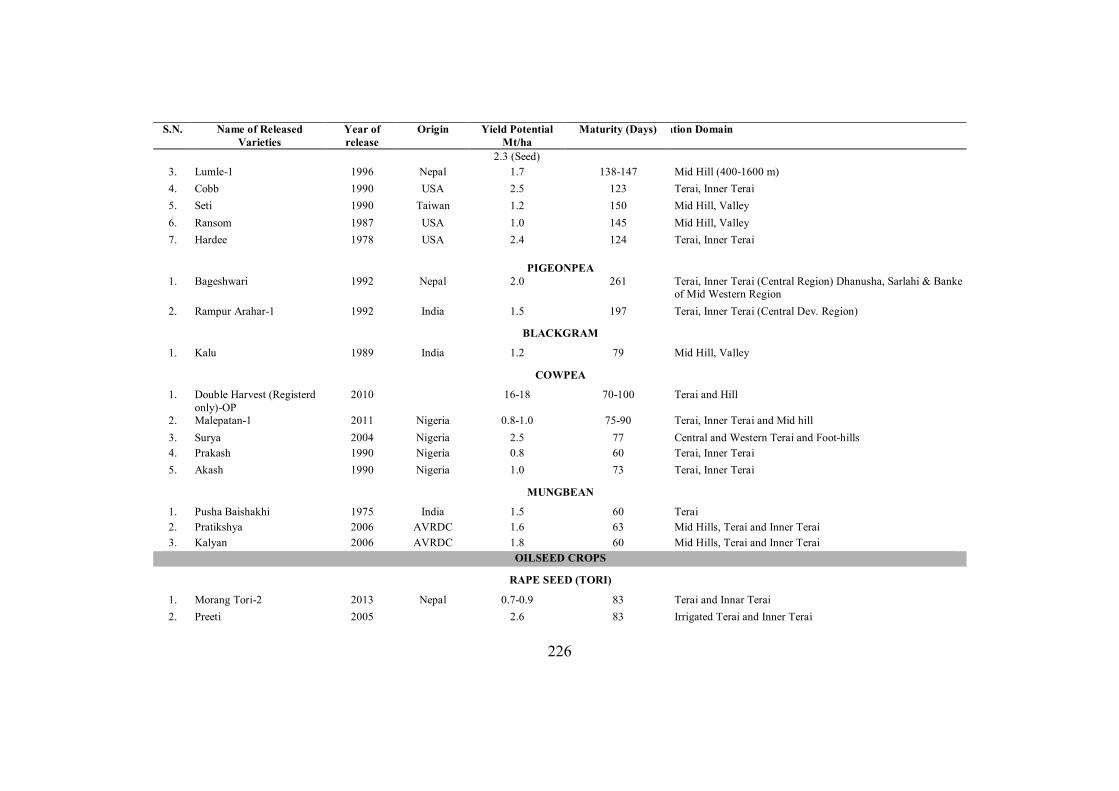
226
S.N. Name of Released Varieties
Year of release
Origin Yield Potential Mt/ha
Maturity (Days) Recommendation Domain
2.3 (Seed) 3. Lumle-1 1996 Nepal 1.7 138-147 Mid Hill (400-1600 m) 4. Cobb 1990 USA 2.5 123 Terai, Inner Terai 5. Seti 1990 Taiwan 1.2 150 Mid Hill, Valley 6. Ransom 1987 USA 1.0 145 Mid Hill, Valley 7. Hardee 1978 USA 2.4 124 Terai, Inner Terai
PIGEONPEA
1. Bageshwari 1992 Nepal 2.0 261 Terai, Inner Terai (Central Region) Dhanusha, Sarlahi & Banke of Mid Western Region
2. Rampur Arahar-1 1992 India 1.5 197 Terai, Inner Terai (Central Dev. Region)
BLACKGRAM
1. Kalu 1989 India 1.2 79 Mid Hill, Valley
COWPEA
1. Double Harvest (Registerd only)-OP
2010 16-18 70-100 Terai and Hill
2. Malepatan-1 2011 Nigeria 0.8-1.0 75-90 Terai, Inner Terai and Mid hill 3. Surya 2004 Nigeria 2.5 77 Central and Western Terai and Foot-hills 4. Prakash 1990 Nigeria 0.8 60 Terai, Inner Terai 5. Akash 1990 Nigeria 1.0 73 Terai, Inner Terai
MUNGBEAN
1. Pusha Baishakhi 1975 India 1.5 60 Terai 2. Pratikshya 2006 AVRDC 1.6 63 Mid Hills, Terai and Inner Terai 3. Kalyan 2006 AVRDC 1.8 60 Mid Hills, Terai and Inner Terai
OILSEED CROPS
RAPE SEED (TORI)
1. Morang Tori-2 2013 Nepal 0.7-0.9 83 Terai and Innar Terai 2. Preeti 2005 2.6 83 Irrigated Terai and Inner Terai
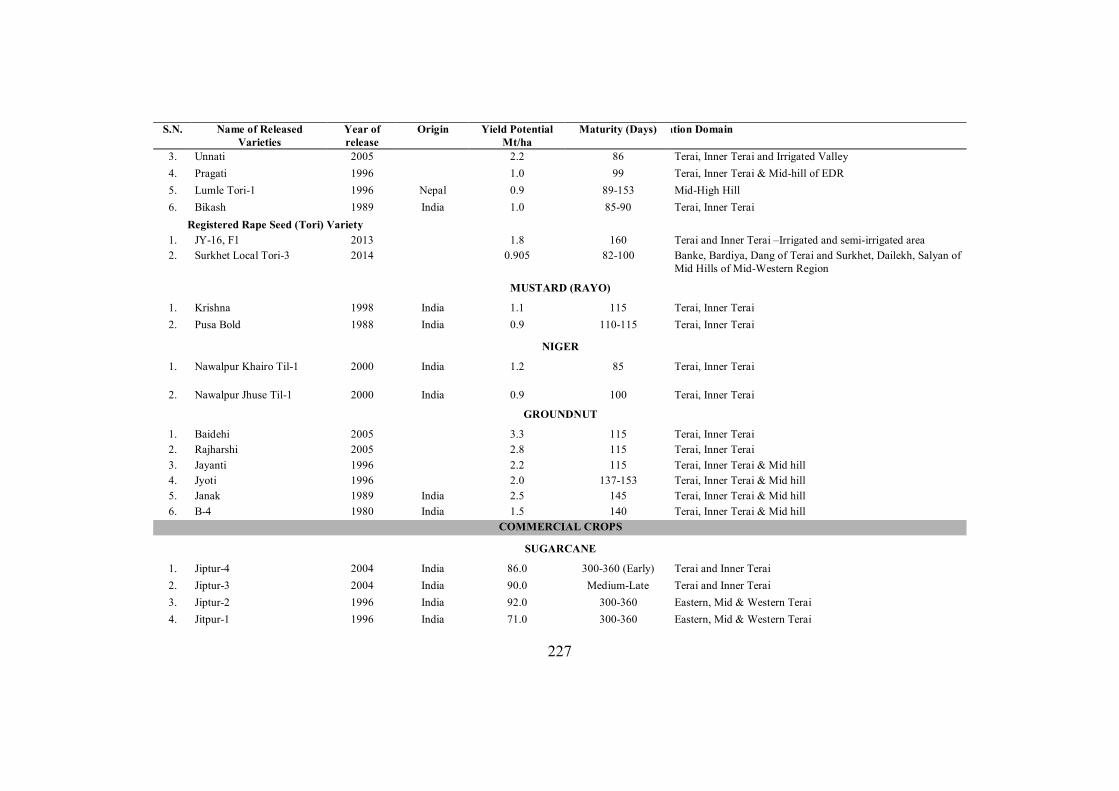
227
S.N. Name of Released Varieties
Year of release
Origin Yield Potential Mt/ha
Maturity (Days) Recommendation Domain
3. Unnati 2005 2.2 86 Terai, Inner Terai and Irrigated Valley 4. Pragati 1996 1.0 99 Terai, Inner Terai & Mid-hill of EDR 5. Lumle Tori-1 1996 Nepal 0.9 89-153 Mid-High Hill 6. Bikash 1989 India 1.0 85-90 Terai, Inner Terai
Registered Rape Seed (Tori) Variety 1. JY-16, F1 2013 1.8 160 Terai and Inner Terai –Irrigated and semi-irrigated area 2. Surkhet Local Tori-3 2014 0.905 82-100 Banke, Bardiya, Dang of Terai and Surkhet, Dailekh, Salyan of
Mid Hills of Mid-Western Region
MUSTARD (RAYO)
1. Krishna 1998 India 1.1 115 Terai, Inner Terai 2. Pusa Bold 1988 India 0.9 110-115 Terai, Inner Terai
NIGER
1. Nawalpur Khairo Til-1 2000 India 1.2 85 Terai, Inner Terai
2. Nawalpur Jhuse Til-1
2000
India
0.9
100
Terai, Inner Terai
GROUNDNUT
1. Baidehi 2005 3.3 115 Terai, Inner Terai 2. Rajharshi 2005 2.8 115 Terai, Inner Terai 3. Jayanti 1996 2.2 115 Terai, Inner Terai & Mid hill 4. Jyoti 1996 2.0 137-153 Terai, Inner Terai & Mid hill 5. Janak 1989 India 2.5 145 Terai, Inner Terai & Mid hill 6. B-4 1980 India 1.5 140 Terai, Inner Terai & Mid hill
COMMERCIAL CROPS
SUGARCANE
1. Jiptur-4 2004 India 86.0 300-360 (Early) Terai and Inner Terai 2. Jiptur-3 2004 India 90.0 Medium-Late Terai and Inner Terai 3. Jiptur-2 1996 India 92.0 300-360 Eastern, Mid & Western Terai 4. Jitpur-1 1996 India 71.0 300-360 Eastern, Mid & Western Terai
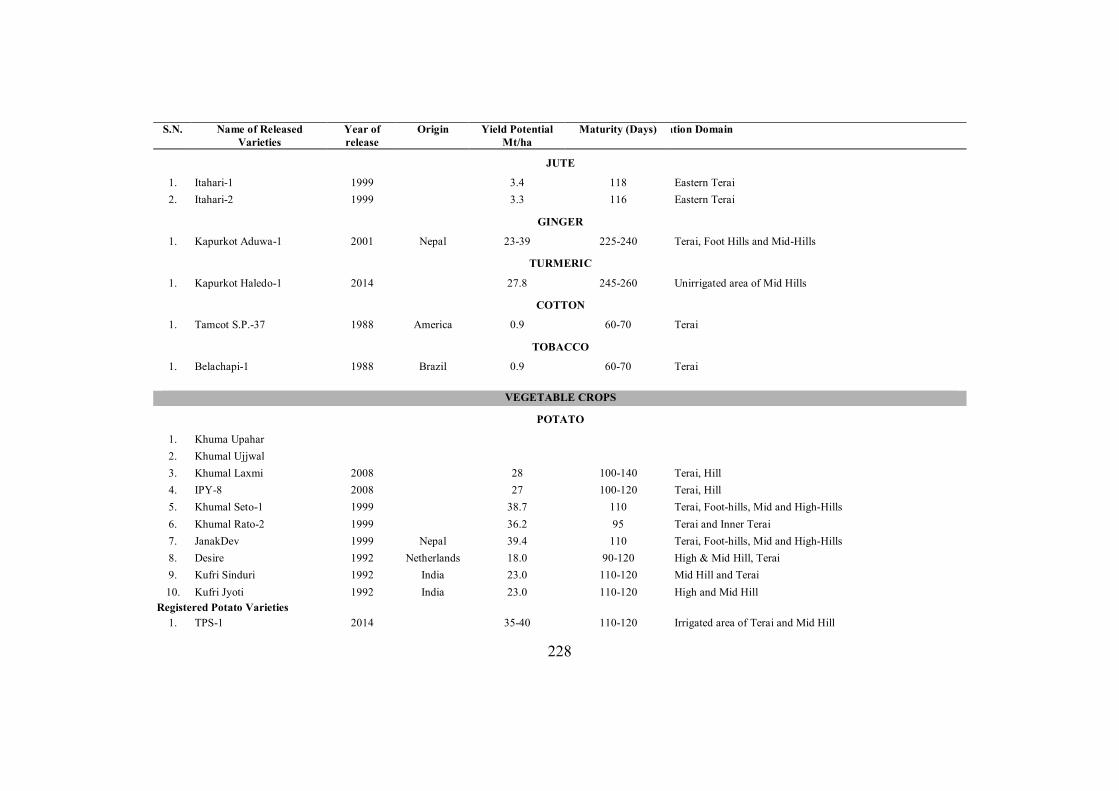
228
S.N. Name of Released Varieties
Year of release
Origin Yield Potential Mt/ha
Maturity (Days) Recommendation Domain
JUTE
1. Itahari-1 1999 3.4 118 Eastern Terai 2. Itahari-2 1999 3.3 116 Eastern Terai
GINGER
1. Kapurkot Aduwa-1 2001 Nepal 23-39 225-240 Terai, Foot Hills and Mid-Hills
TURMERIC
1. Kapurkot Haledo-1 2014 27.8 245-260 Unirrigated area of Mid Hills
COTTON
1. Tamcot S.P.-37 1988 America 0.9 60-70 Terai
TOBACCO
1. Belachapi-1 1988 Brazil 0.9 60-70 Terai
VEGETABLE CROPS
POTATO
1. Khuma Upahar 2. Khumal Ujjwal 3. Khumal Laxmi 2008 28 100-140 Terai, Hill 4. IPY-8 2008 27 100-120 Terai, Hill 5. Khumal Seto-1 1999 38.7 110 Terai, Foot-hills, Mid and High-Hills 6. Khumal Rato-2 1999 36.2 95 Terai and Inner Terai 7. JanakDev 1999 Nepal 39.4 110 Terai, Foot-hills, Mid and High-Hills 8. Desire 1992 Netherlands 18.0 90-120 High & Mid Hill, Terai 9. Kufri Sinduri 1992 India 23.0 110-120 Mid Hill and Terai 10. Kufri Jyoti 1992 India 23.0 110-120 High and Mid Hill
Registered Potato Varieties 1. TPS-1 2014 35-40 110-120 Irrigated area of Terai and Mid Hill
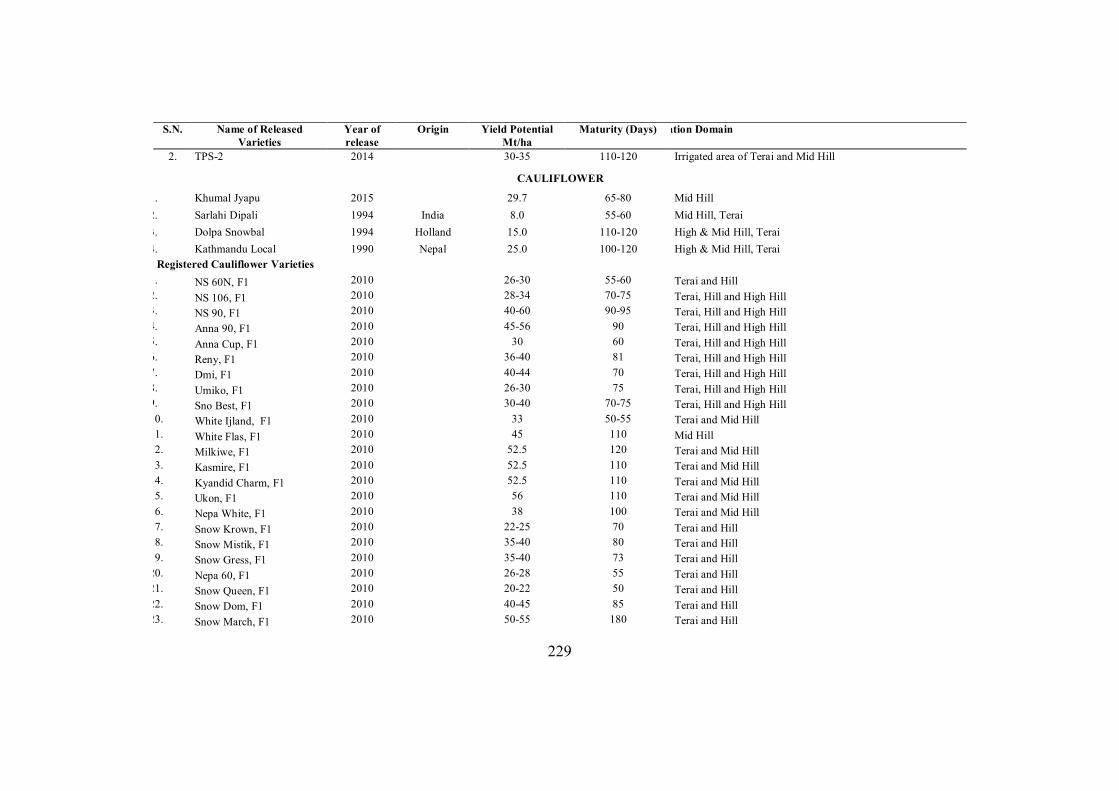
229
S.N. Name of Released Varieties
Year of release
Origin Yield Potential Mt/ha
Maturity (Days) Recommendation Domain
2. TPS-2 2014 30-35 110-120 Irrigated area of Terai and Mid Hill
CAULIFLOWER
1. Khumal Jyapu 2015 29.7 65-80 Mid Hill 2. Sarlahi Dipali 1994 India 8.0 55-60 Mid Hill, Terai 3. Dolpa Snowbal 1994 Holland 15.0 110-120 High & Mid Hill, Terai 4. Kathmandu Local 1990 Nepal 25.0 100-120 High & Mid Hill, Terai
Registered Cauliflower Varieties 1. NS 60N, F1 2010 26-30 55-60 Terai and Hill 2. NS 106, F1 2010 28-34 70-75 Terai, Hill and High Hill 3. NS 90, F1 2010 40-60 90-95 Terai, Hill and High Hill 4. Anna 90, F1 2010 45-56 90 Terai, Hill and High Hill 5. Anna Cup, F1 2010 30 60 Terai, Hill and High Hill 6. Reny, F1 2010 36-40 81 Terai, Hill and High Hill 7. Dmi, F1 2010 40-44 70 Terai, Hill and High Hill 8. Umiko, F1 2010 26-30 75 Terai, Hill and High Hill 9. Sno Best, F1 2010 30-40 70-75 Terai, Hill and High Hill 10. White Ijland, F1 2010 33 50-55 Terai and Mid Hill 11. White Flas, F1 2010 45 110 Mid Hill 12. Milkiwe, F1 2010 52.5 120 Terai and Mid Hill 13. Kasmire, F1 2010 52.5 110 Terai and Mid Hill 14. Kyandid Charm, F1 2010 52.5 110 Terai and Mid Hill 15. Ukon, F1 2010 56 110 Terai and Mid Hill 16. Nepa White, F1 2010 38 100 Terai and Mid Hill 17. Snow Krown, F1 2010 22-25 70 Terai and Hill 18. Snow Mistik, F1 2010 35-40 80 Terai and Hill 19. Snow Gress, F1 2010 35-40 73 Terai and Hill 20. Nepa 60, F1 2010 26-28 55 Terai and Hill 21. Snow Queen, F1 2010 20-22 50 Terai and Hill 22. Snow Dom, F1 2010 40-45 85 Terai and Hill 23. Snow March, F1 2010 50-55 180 Terai and Hill
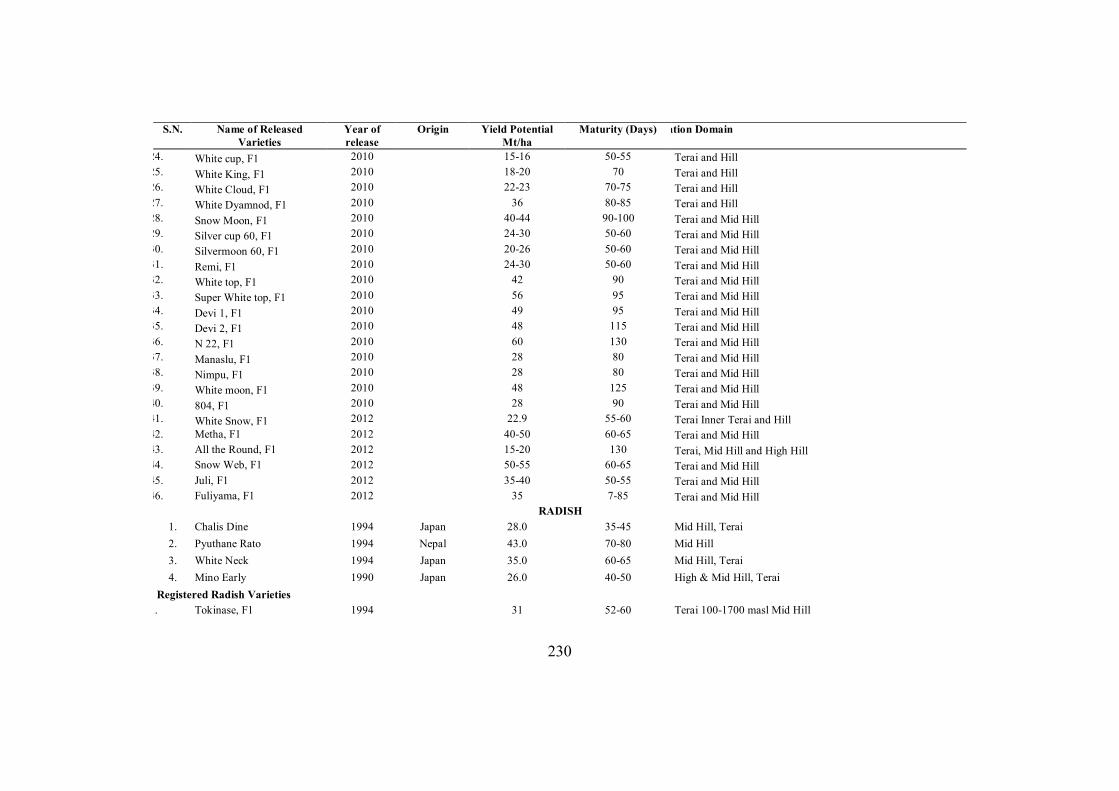
230
S.N. Name of Released Varieties
Year of release
Origin Yield Potential Mt/ha
Maturity (Days) Recommendation Domain
24. White cup, F1 2010 15-16 50-55 Terai and Hill 25. White King, F1 2010 18-20 70 Terai and Hill 26. White Cloud, F1 2010 22-23 70-75 Terai and Hill 27. White Dyamnod, F1 2010 36 80-85 Terai and Hill 28. Snow Moon, F1 2010 40-44 90-100 Terai and Mid Hill 29. Silver cup 60, F1 2010 24-30 50-60 Terai and Mid Hill 30. Silvermoon 60, F1 2010 20-26 50-60 Terai and Mid Hill 31. Remi, F1 2010 24-30 50-60 Terai and Mid Hill 32. White top, F1 2010 42 90 Terai and Mid Hill 33. Super White top, F1 2010 56 95 Terai and Mid Hill 34. Devi 1, F1 2010 49 95 Terai and Mid Hill 35. Devi 2, F1 2010 48 115 Terai and Mid Hill 36. N 22, F1 2010 60 130 Terai and Mid Hill 37. Manaslu, F1 2010 28 80 Terai and Mid Hill 38. Nimpu, F1 2010 28 80 Terai and Mid Hill 39. White moon, F1 2010 48 125 Terai and Mid Hill 40. 804, F1 2010 28 90 Terai and Mid Hill 41. White Snow, F1 2012 22.9 55-60 Terai Inner Terai and Hill 42. Metha, F1 2012 40-50 60-65 Terai and Mid Hill 43. All the Round, F1 2012 15-20 130 Terai, Mid Hill and High Hill 44. Snow Web, F1 2012 50-55 60-65 Terai and Mid Hill 45. Juli, F1 2012 35-40 50-55 Terai and Mid Hill 46. Fuliyama, F1 2012 35 7-85 Terai and Mid Hill
RADISH 1. Chalis Dine 1994 Japan 28.0 35-45 Mid Hill, Terai 2. Pyuthane Rato 1994 Nepal 43.0 70-80 Mid Hill 3. White Neck 1994 Japan 35.0 60-65 Mid Hill, Terai 4. Mino Early 1990 Japan 26.0 40-50 High & Mid Hill, Terai
Registered Radish Varieties 1. Tokinase, F1 1994 31 52-60 Terai 100-1700 masl Mid Hill
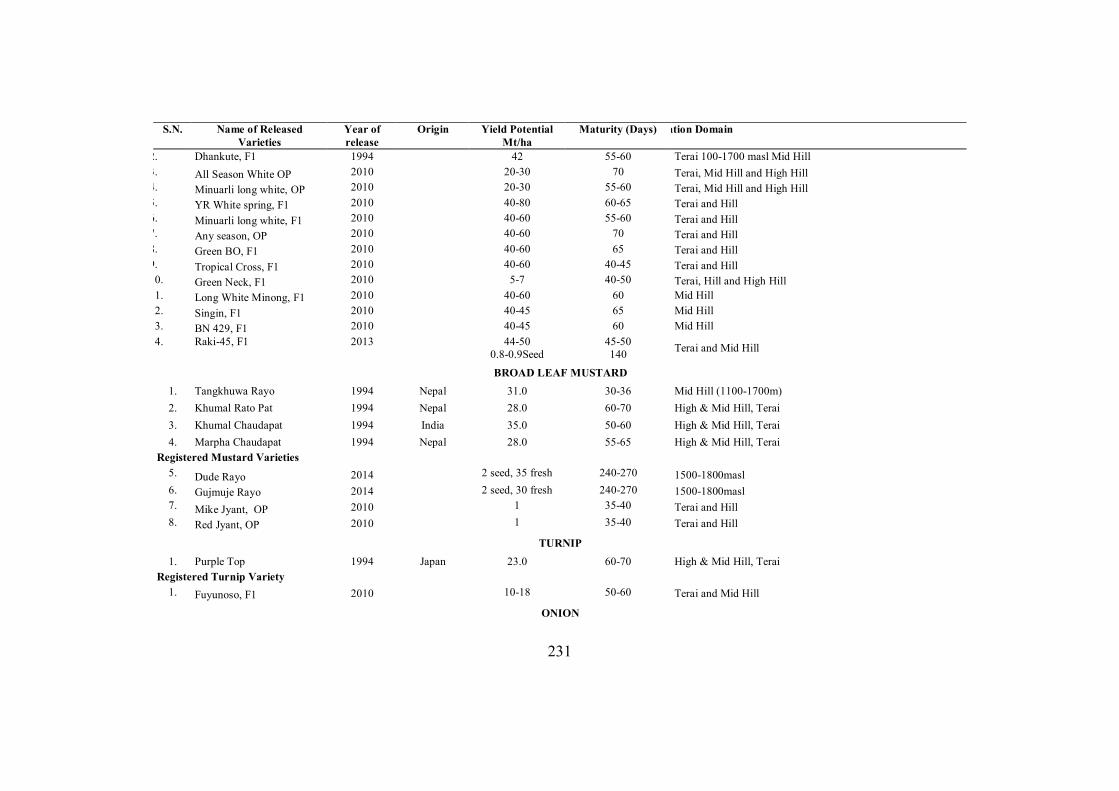
231
S.N. Name of Released Varieties
Year of release
Origin Yield Potential Mt/ha
Maturity (Days) Recommendation Domain
2. Dhankute, F1 1994 42 55-60 Terai 100-1700 masl Mid Hill 3. All Season White OP 2010 20-30 70 Terai, Mid Hill and High Hill 4. Minuarli long white, OP 2010 20-30 55-60 Terai, Mid Hill and High Hill 5. YR White spring, F1 2010 40-80 60-65 Terai and Hill 6. Minuarli long white, F1 2010 40-60 55-60 Terai and Hill 7. Any season, OP 2010 40-60 70 Terai and Hill 8. Green BO, F1 2010 40-60 65 Terai and Hill 9. Tropical Cross, F1 2010 40-60 40-45 Terai and Hill 10. Green Neck, F1 2010 5-7 40-50 Terai, Hill and High Hill 11. Long White Minong, F1 2010 40-60 60 Mid Hill 12. Singin, F1 2010 40-45 65 Mid Hill 13. BN 429, F1 2010 40-45 60 Mid Hill 14. Raki-45, F1 2013 44-50
0.8-0.9Seed 45-50 140 Terai and Mid Hill
BROAD LEAF MUSTARD 1. Tangkhuwa Rayo 1994 Nepal 31.0 30-36 Mid Hill (1100-1700m) 2. Khumal Rato Pat 1994 Nepal 28.0 60-70 High & Mid Hill, Terai 3. Khumal Chaudapat 1994 India 35.0 50-60 High & Mid Hill, Terai 4. Marpha Chaudapat 1994 Nepal 28.0 55-65 High & Mid Hill, Terai
Registered Mustard Varieties 5. Dude Rayo 2014 2 seed, 35 fresh 240-270 1500-1800masl 6. Gujmuje Rayo 2014 2 seed, 30 fresh 240-270 1500-1800masl 7. Mike Jyant, OP 2010 1 35-40 Terai and Hill 8. Red Jyant, OP 2010 1 35-40 Terai and Hill
TURNIP 1. Purple Top 1994 Japan 23.0 60-70 High & Mid Hill, Terai
Registered Turnip Variety 1. Fuyunoso, F1 2010 10-18 50-60 Terai and Mid Hill
ONION
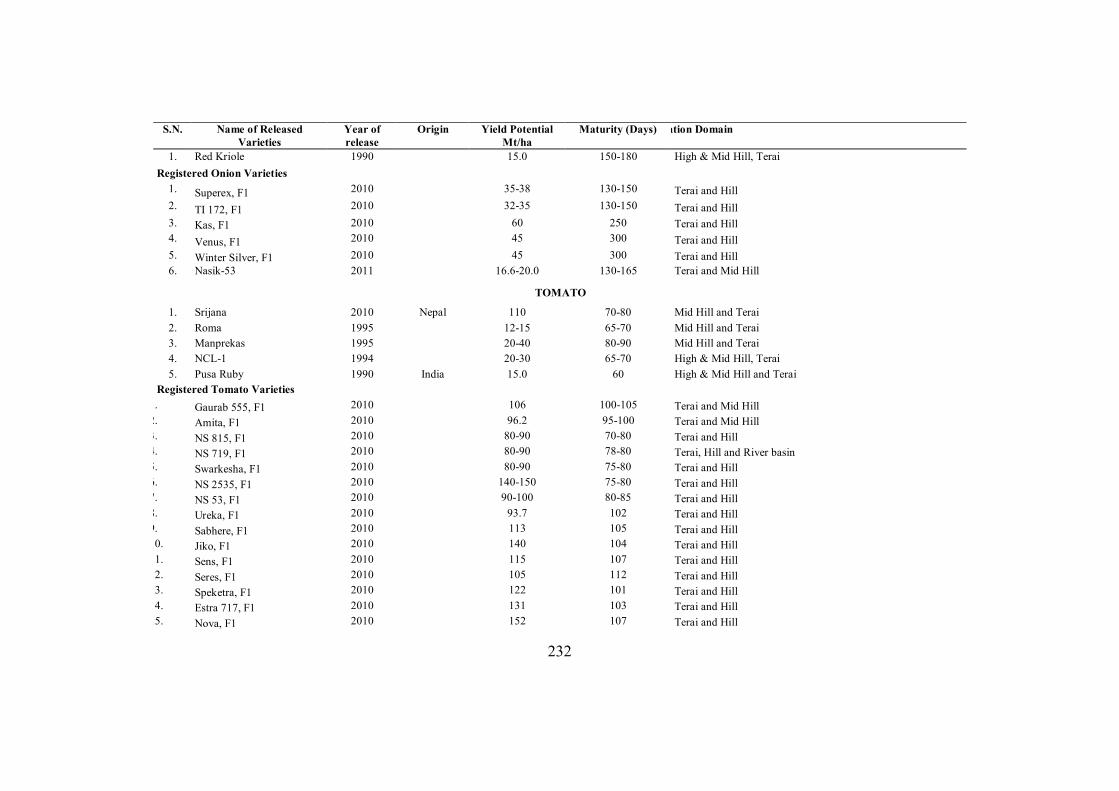
232
S.N. Name of Released Varieties
Year of release
Origin Yield Potential Mt/ha
Maturity (Days) Recommendation Domain
1. Red Kriole 1990 15.0 150-180 High & Mid Hill, Terai Registered Onion Varieties
1. Superex, F1 2010 35-38 130-150 Terai and Hill 2. TI 172, F1 2010 32-35 130-150 Terai and Hill 3. Kas, F1 2010 60 250 Terai and Hill 4. Venus, F1 2010 45 300 Terai and Hill 5. Winter Silver, F1 2010 45 300 Terai and Hill 6. Nasik-53 2011 16.6-20.0 130-165 Terai and Mid Hill
TOMATO
1. Srijana 2010 Nepal 110 70-80 Mid Hill and Terai 2. Roma 1995 12-15 65-70 Mid Hill and Terai 3. Manprekas 1995 20-40 80-90 Mid Hill and Terai 4. NCL-1 1994 20-30 65-70 High & Mid Hill, Terai 5. Pusa Ruby 1990 India 15.0 60 High & Mid Hill and Terai
Registered Tomato Varieties 1. Gaurab 555, F1 2010 106 100-105 Terai and Mid Hill 2. Amita, F1 2010 96.2 95-100 Terai and Mid Hill 3. NS 815, F1 2010 80-90 70-80 Terai and Hill 4. NS 719, F1 2010 80-90 78-80 Terai, Hill and River basin 5. Swarkesha, F1 2010 80-90 75-80 Terai and Hill 6. NS 2535, F1 2010 140-150 75-80 Terai and Hill 7. NS 53, F1 2010 90-100 80-85 Terai and Hill 8. Ureka, F1 2010 93.7 102 Terai and Hill 9. Sabhere, F1 2010 113 105 Terai and Hill 10. Jiko, F1 2010 140 104 Terai and Hill 11. Sens, F1 2010 115 107 Terai and Hill 12. Seres, F1 2010 105 112 Terai and Hill 13. Speketra, F1 2010 122 101 Terai and Hill 14. Estra 717, F1 2010 131 103 Terai and Hill 15. Nova, F1 2010 152 107 Terai and Hill
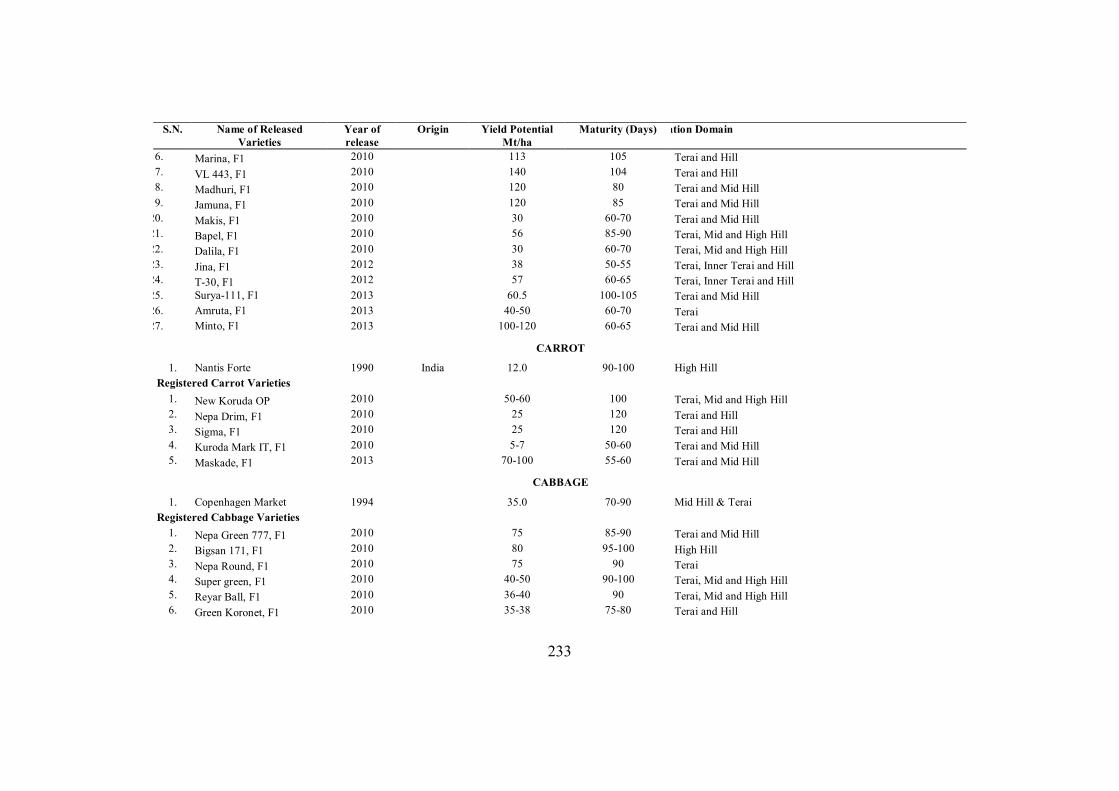
233
S.N. Name of Released Varieties
Year of release
Origin Yield Potential Mt/ha
Maturity (Days) Recommendation Domain
16. Marina, F1 2010 113 105 Terai and Hill 17. VL 443, F1 2010 140 104 Terai and Hill 18. Madhuri, F1 2010 120 80 Terai and Mid Hill 19. Jamuna, F1 2010 120 85 Terai and Mid Hill 20. Makis, F1 2010 30 60-70 Terai and Mid Hill 21. Bapel, F1 2010 56 85-90 Terai, Mid and High Hill 22. Dalila, F1 2010 30 60-70 Terai, Mid and High Hill 23. Jina, F1 2012 38 50-55 Terai, Inner Terai and Hill 24. T-30, F1 2012 57 60-65 Terai, Inner Terai and Hill 25. Surya-111, F1 2013 60.5 100-105 Terai and Mid Hill 26. Amruta, F1 2013 40-50 60-70 Terai 27. Minto, F1 2013 100-120 60-65 Terai and Mid Hill
CARROT
1. Nantis Forte 1990 India 12.0 90-100 High Hill Registered Carrot Varieties
1. New Koruda OP 2010 50-60 100 Terai, Mid and High Hill 2. Nepa Drim, F1 2010 25 120 Terai and Hill 3. Sigma, F1 2010 25 120 Terai and Hill 4. Kuroda Mark IT, F1 2010 5-7 50-60 Terai and Mid Hill 5. Maskade, F1 2013 70-100 55-60 Terai and Mid Hill
CABBAGE
1. Copenhagen Market 1994 35.0 70-90 Mid Hill & Terai Registered Cabbage Varieties
1. Nepa Green 777, F1 2010 75 85-90 Terai and Mid Hill 2. Bigsan 171, F1 2010 80 95-100 High Hill 3. Nepa Round, F1 2010 75 90 Terai 4. Super green, F1 2010 40-50 90-100 Terai, Mid and High Hill 5. Reyar Ball, F1 2010 36-40 90 Terai, Mid and High Hill 6. Green Koronet, F1 2010 35-38 75-80 Terai and Hill
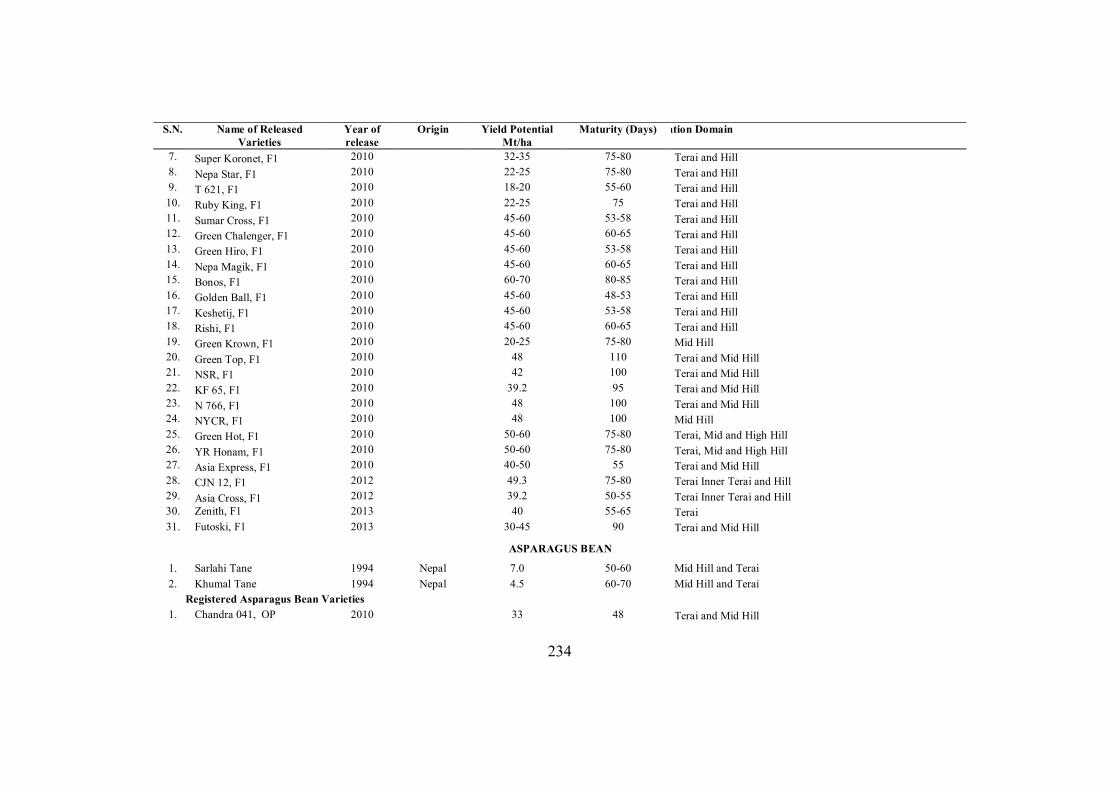
234
S.N. Name of Released Varieties
Year of release
Origin Yield Potential Mt/ha
Maturity (Days) Recommendation Domain
7. Super Koronet, F1 2010 32-35 75-80 Terai and Hill 8. Nepa Star, F1 2010 22-25 75-80 Terai and Hill 9. T 621, F1 2010 18-20 55-60 Terai and Hill 10. Ruby King, F1 2010 22-25 75 Terai and Hill 11. Sumar Cross, F1 2010 45-60 53-58 Terai and Hill 12. Green Chalenger, F1 2010 45-60 60-65 Terai and Hill 13. Green Hiro, F1 2010 45-60 53-58 Terai and Hill 14. Nepa Magik, F1 2010 45-60 60-65 Terai and Hill 15. Bonos, F1 2010 60-70 80-85 Terai and Hill 16. Golden Ball, F1 2010 45-60 48-53 Terai and Hill 17. Keshetij, F1 2010 45-60 53-58 Terai and Hill 18. Rishi, F1 2010 45-60 60-65 Terai and Hill 19. Green Krown, F1 2010 20-25 75-80 Mid Hill 20. Green Top, F1 2010 48 110 Terai and Mid Hill 21. NSR, F1 2010 42 100 Terai and Mid Hill 22. KF 65, F1 2010 39.2 95 Terai and Mid Hill 23. N 766, F1 2010 48 100 Terai and Mid Hill 24. NYCR, F1 2010 48 100 Mid Hill 25. Green Hot, F1 2010 50-60 75-80 Terai, Mid and High Hill 26. YR Honam, F1 2010 50-60 75-80 Terai, Mid and High Hill 27. Asia Express, F1 2010 40-50 55 Terai and Mid Hill 28. CJN 12, F1 2012 49.3 75-80 Terai Inner Terai and Hill 29. Asia Cross, F1 2012 39.2 50-55 Terai Inner Terai and Hill 30. Zenith, F1 2013 40 55-65 Terai 31. Futoski, F1 2013 30-45 90 Terai and Mid Hill
ASPARAGUS BEAN
1. Sarlahi Tane 1994 Nepal 7.0 50-60 Mid Hill and Terai 2. Khumal Tane 1994 Nepal 4.5 60-70 Mid Hill and Terai
Registered Asparagus Bean Varieties 1. Chandra 041, OP 2010 33 48 Terai and Mid Hill
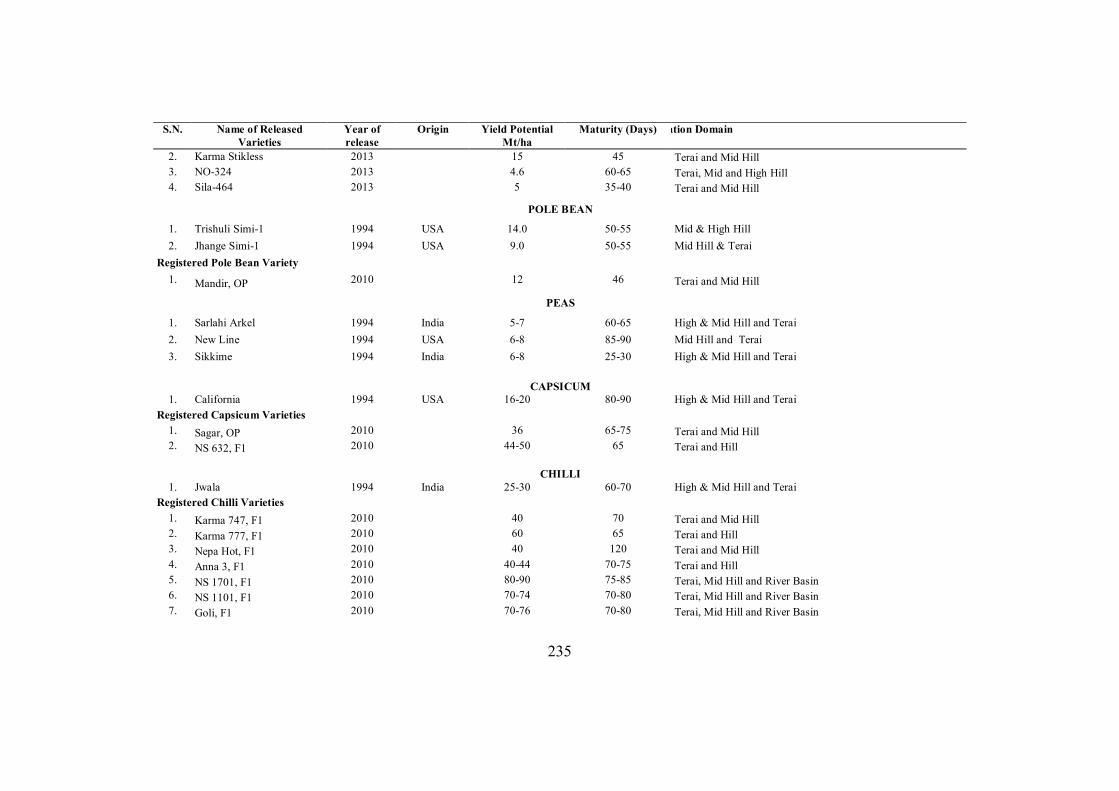
235
S.N. Name of Released Varieties
Year of release
Origin Yield Potential Mt/ha
Maturity (Days) Recommendation Domain
2. Karma Stikless 2013 15 45 Terai and Mid Hill 3. NO-324 2013 4.6 60-65 Terai, Mid and High Hill 4. Sila-464 2013 5 35-40 Terai and Mid Hill
POLE BEAN
1. Trishuli Simi-1 1994 USA 14.0 50-55 Mid & High Hill 2. Jhange Simi-1 1994 USA 9.0 50-55 Mid Hill & Terai
Registered Pole Bean Variety 1. Mandir, OP 2010 12 46 Terai and Mid Hill
PEAS
1. Sarlahi Arkel 1994 India 5-7 60-65 High & Mid Hill and Terai 2. New Line 1994 USA 6-8 85-90 Mid Hill and Terai 3. Sikkime 1994 India 6-8 25-30 High & Mid Hill and Terai
CAPSICUM
1. California 1994 USA 16-20 80-90 High & Mid Hill and Terai Registered Capsicum Varieties
1. Sagar, OP 2010 36 65-75 Terai and Mid Hill 2. NS 632, F1 2010 44-50 65 Terai and Hill
CHILLI
1. Jwala 1994 India 25-30 60-70 High & Mid Hill and Terai Registered Chilli Varieties
1. Karma 747, F1 2010 40 70 Terai and Mid Hill 2. Karma 777, F1 2010 60 65 Terai and Hill 3. Nepa Hot, F1 2010 40 120 Terai and Mid Hill 4. Anna 3, F1 2010 40-44 70-75 Terai and Hill 5. NS 1701, F1 2010 80-90 75-85 Terai, Mid Hill and River Basin 6. NS 1101, F1 2010 70-74 70-80 Terai, Mid Hill and River Basin 7. Goli, F1 2010 70-76 70-80 Terai, Mid Hill and River Basin
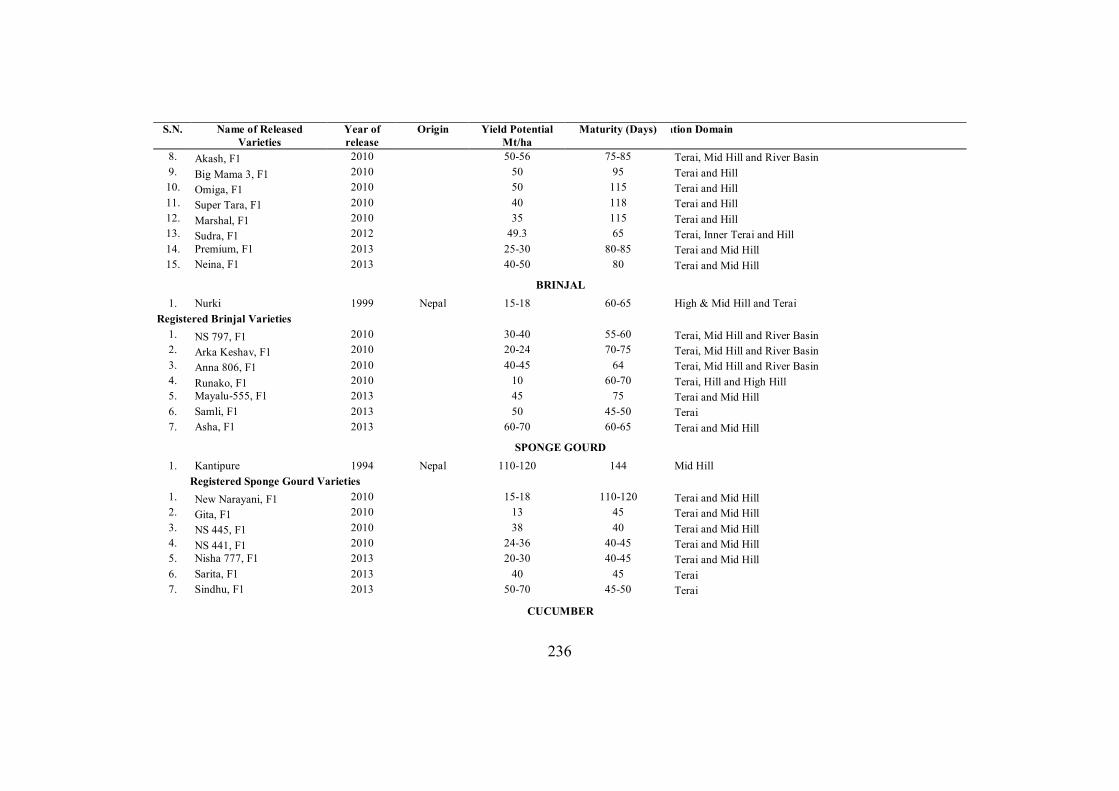
236
S.N. Name of Released Varieties
Year of release
Origin Yield Potential Mt/ha
Maturity (Days) Recommendation Domain
8. Akash, F1 2010 50-56 75-85 Terai, Mid Hill and River Basin 9. Big Mama 3, F1 2010 50 95 Terai and Hill 10. Omiga, F1 2010 50 115 Terai and Hill 11. Super Tara, F1 2010 40 118 Terai and Hill 12. Marshal, F1 2010 35 115 Terai and Hill 13. Sudra, F1 2012 49.3 65 Terai, Inner Terai and Hill 14. Premium, F1 2013 25-30 80-85 Terai and Mid Hill 15. Neina, F1 2013 40-50 80 Terai and Mid Hill
BRINJAL 1. Nurki 1999 Nepal 15-18 60-65 High & Mid Hill and Terai
Registered Brinjal Varieties 1. NS 797, F1 2010 30-40 55-60 Terai, Mid Hill and River Basin 2. Arka Keshav, F1 2010 20-24 70-75 Terai, Mid Hill and River Basin 3. Anna 806, F1 2010 40-45 64 Terai, Mid Hill and River Basin 4. Runako, F1 2010 10 60-70 Terai, Hill and High Hill 5. Mayalu-555, F1 2013 45 75 Terai and Mid Hill 6. Samli, F1 2013 50 45-50 Terai 7. Asha, F1 2013 60-70 60-65 Terai and Mid Hill
SPONGE GOURD 1. Kantipure 1994 Nepal 110-120 144 Mid Hill
Registered Sponge Gourd Varieties 1. New Narayani, F1 2010 15-18 110-120 Terai and Mid Hill 2. Gita, F1 2010 13 45 Terai and Mid Hill 3. NS 445, F1 2010 38 40 Terai and Mid Hill 4. NS 441, F1 2010 24-36 40-45 Terai and Mid Hill 5. Nisha 777, F1 2013 20-30 40-45 Terai and Mid Hill 6. Sarita, F1 2013 40 45 Terai 7. Sindhu, F1 2013 50-70 45-50 Terai
CUCUMBER
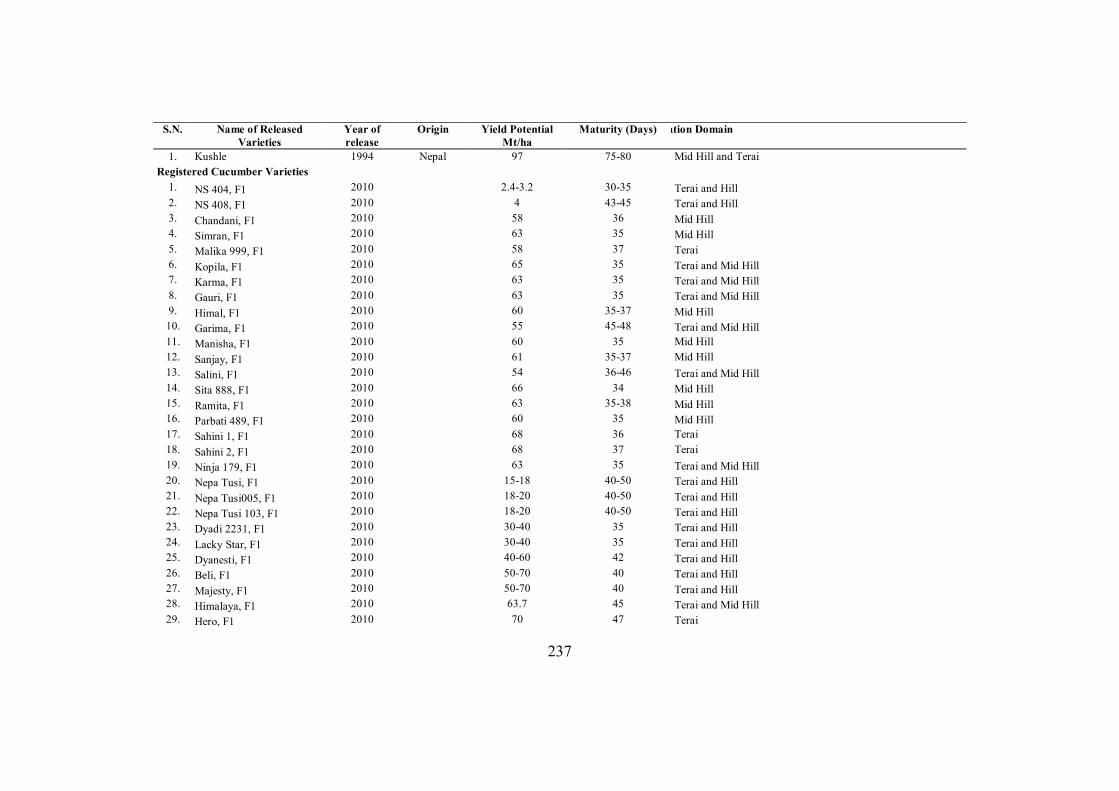
237
S.N. Name of Released Varieties
Year of release
Origin Yield Potential Mt/ha
Maturity (Days) Recommendation Domain
1. Kushle 1994 Nepal 97 75-80 Mid Hill and Terai Registered Cucumber Varieties
1. NS 404, F1 2010 2.4-3.2 30-35 Terai and Hill 2. NS 408, F1 2010 4 43-45 Terai and Hill 3. Chandani, F1 2010 58 36 Mid Hill 4. Simran, F1 2010 63 35 Mid Hill 5. Malika 999, F1 2010 58 37 Terai 6. Kopila, F1 2010 65 35 Terai and Mid Hill 7. Karma, F1 2010 63 35 Terai and Mid Hill 8. Gauri, F1 2010 63 35 Terai and Mid Hill 9. Himal, F1 2010 60 35-37 Mid Hill 10. Garima, F1 2010 55 45-48 Terai and Mid Hill 11. Manisha, F1 2010 60 35 Mid Hill 12. Sanjay, F1 2010 61 35-37 Mid Hill 13. Salini, F1 2010 54 36-46 Terai and Mid Hill 14. Sita 888, F1 2010 66 34 Mid Hill 15. Ramita, F1 2010 63 35-38 Mid Hill 16. Parbati 489, F1 2010 60 35 Mid Hill 17. Sahini 1, F1 2010 68 36 Terai 18. Sahini 2, F1 2010 68 37 Terai 19. Ninja 179, F1 2010 63 35 Terai and Mid Hill 20. Nepa Tusi, F1 2010 15-18 40-50 Terai and Hill 21. Nepa Tusi005, F1 2010 18-20 40-50 Terai and Hill 22. Nepa Tusi 103, F1 2010 18-20 40-50 Terai and Hill 23. Dyadi 2231, F1 2010 30-40 35 Terai and Hill 24. Lacky Star, F1 2010 30-40 35 Terai and Hill 25. Dyanesti, F1 2010 40-60 42 Terai and Hill 26. Beli, F1 2010 50-70 40 Terai and Hill 27. Majesty, F1 2010 50-70 40 Terai and Hill 28. Himalaya, F1 2010 63.7 45 Terai and Mid Hill 29. Hero, F1 2010 70 47 Terai
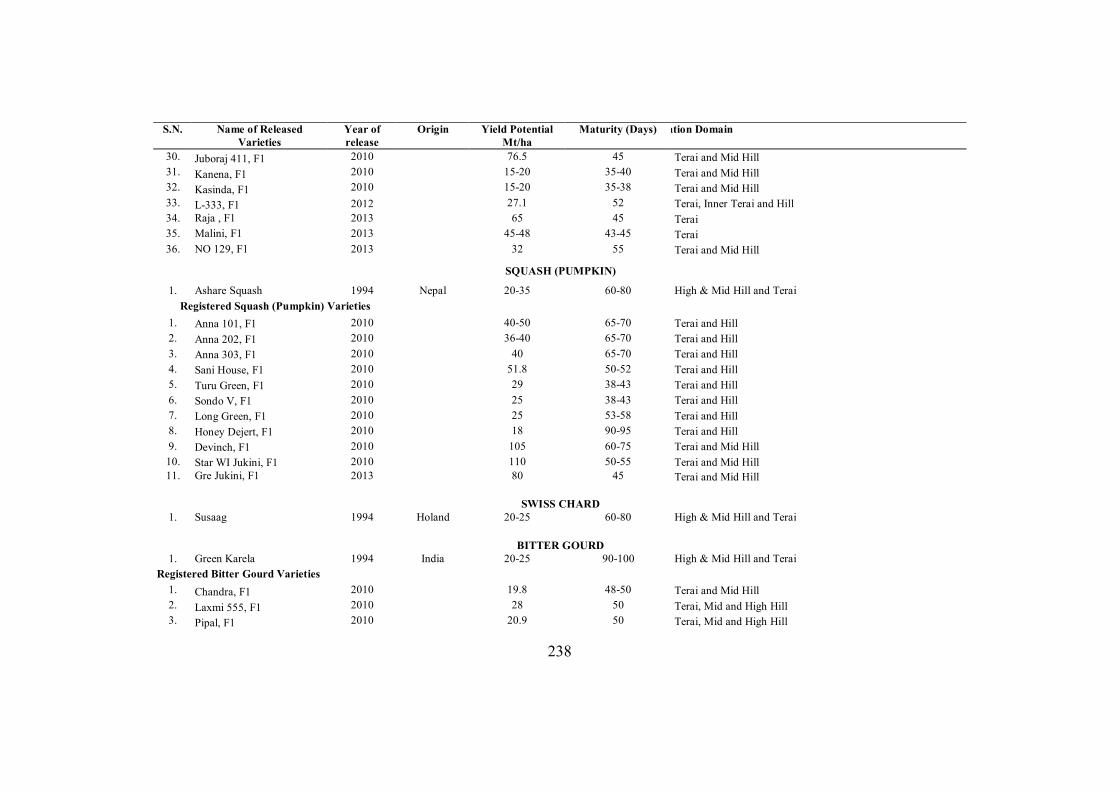
238
S.N. Name of Released Varieties
Year of release
Origin Yield Potential Mt/ha
Maturity (Days) Recommendation Domain
30. Juboraj 411, F1 2010 76.5 45 Terai and Mid Hill 31. Kanena, F1 2010 15-20 35-40 Terai and Mid Hill 32. Kasinda, F1 2010 15-20 35-38 Terai and Mid Hill 33. L-333, F1 2012 27.1 52 Terai, Inner Terai and Hill 34. Raja , F1 2013 65 45 Terai 35. Malini, F1 2013 45-48 43-45 Terai 36. NO 129, F1 2013 32 55 Terai and Mid Hill
SQUASH (PUMPKIN)
1. Ashare Squash 1994 Nepal 20-35 60-80 High & Mid Hill and Terai Registered Squash (Pumpkin) Varieties
1. Anna 101, F1 2010 40-50 65-70 Terai and Hill 2. Anna 202, F1 2010 36-40 65-70 Terai and Hill 3. Anna 303, F1 2010 40 65-70 Terai and Hill 4. Sani House, F1 2010 51.8 50-52 Terai and Hill 5. Turu Green, F1 2010 29 38-43 Terai and Hill 6. Sondo V, F1 2010 25 38-43 Terai and Hill 7. Long Green, F1 2010 25 53-58 Terai and Hill 8. Honey Dejert, F1 2010 18 90-95 Terai and Hill 9. Devinch, F1 2010 105 60-75 Terai and Mid Hill 10. Star WI Jukini, F1 2010 110 50-55 Terai and Mid Hill 11. Gre Jukini, F1 2013 80 45 Terai and Mid Hill
SWISS CHARD
1. Susaag 1994 Holand 20-25 60-80 High & Mid Hill and Terai
BITTER GOURD 1. Green Karela 1994 India 20-25 90-100 High & Mid Hill and Terai
Registered Bitter Gourd Varieties 1. Chandra, F1 2010 19.8 48-50 Terai and Mid Hill 2. Laxmi 555, F1 2010 28 50 Terai, Mid and High Hill 3. Pipal, F1 2010 20.9 50 Terai, Mid and High Hill
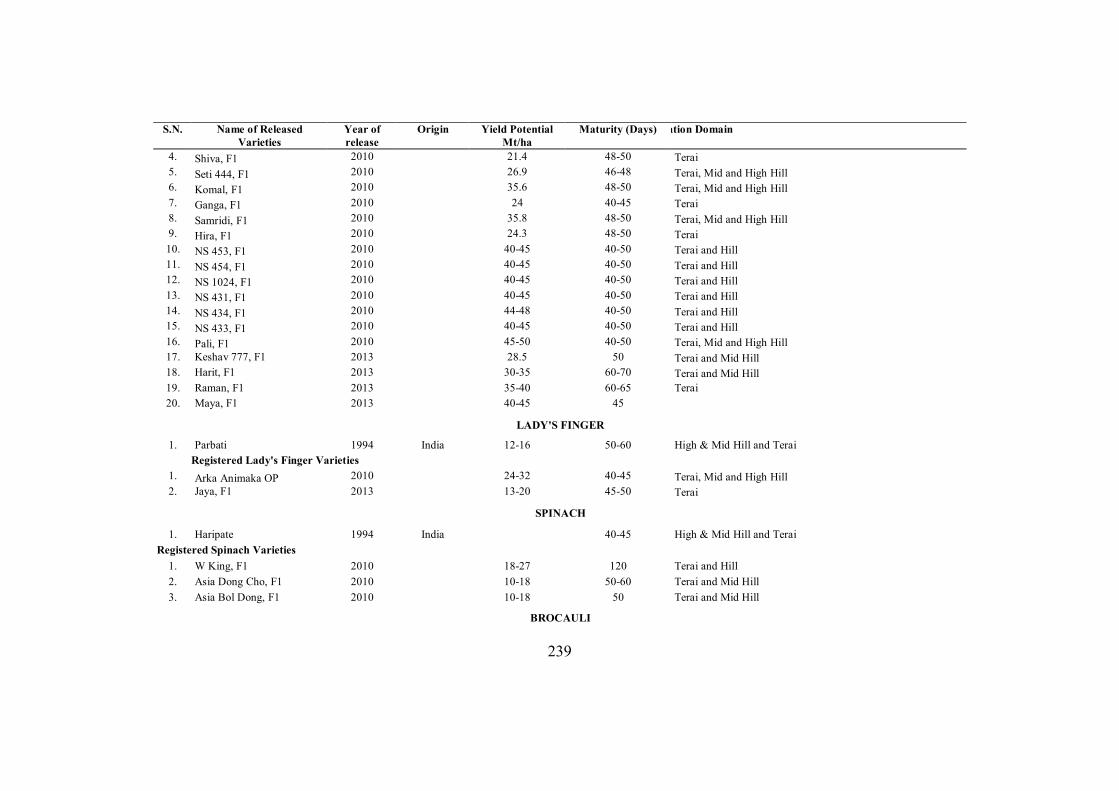
239
S.N. Name of Released Varieties
Year of release
Origin Yield Potential Mt/ha
Maturity (Days) Recommendation Domain
4. Shiva, F1 2010 21.4 48-50 Terai 5. Seti 444, F1 2010 26.9 46-48 Terai, Mid and High Hill 6. Komal, F1 2010 35.6 48-50 Terai, Mid and High Hill 7. Ganga, F1 2010 24 40-45 Terai 8. Samridi, F1 2010 35.8 48-50 Terai, Mid and High Hill 9. Hira, F1 2010 24.3 48-50 Terai 10. NS 453, F1 2010 40-45 40-50 Terai and Hill 11. NS 454, F1 2010 40-45 40-50 Terai and Hill 12. NS 1024, F1 2010 40-45 40-50 Terai and Hill 13. NS 431, F1 2010 40-45 40-50 Terai and Hill 14. NS 434, F1 2010 44-48 40-50 Terai and Hill 15. NS 433, F1 2010 40-45 40-50 Terai and Hill 16. Pali, F1 2010 45-50 40-50 Terai, Mid and High Hill 17. Keshav 777, F1 2013 28.5 50 Terai and Mid Hill 18. Harit, F1 2013 30-35 60-70 Terai and Mid Hill 19. Raman, F1 2013 35-40 60-65 Terai 20. Maya, F1 2013 40-45 45
LADY'S FINGER
1. Parbati 1994 India 12-16 50-60 High & Mid Hill and Terai Registered Lady's Finger Varieties
1. Arka Animaka OP 2010 24-32 40-45 Terai, Mid and High Hill 2. Jaya, F1 2013 13-20 45-50 Terai
SPINACH
1. Haripate 1994 India 40-45 High & Mid Hill and Terai Registered Spinach Varieties
1. W King, F1 2010 18-27 120 Terai and Hill 2. Asia Dong Cho, F1 2010 10-18 50-60 Terai and Mid Hill 3. Asia Bol Dong, F1 2010 10-18 50 Terai and Mid Hill
BROCAULI
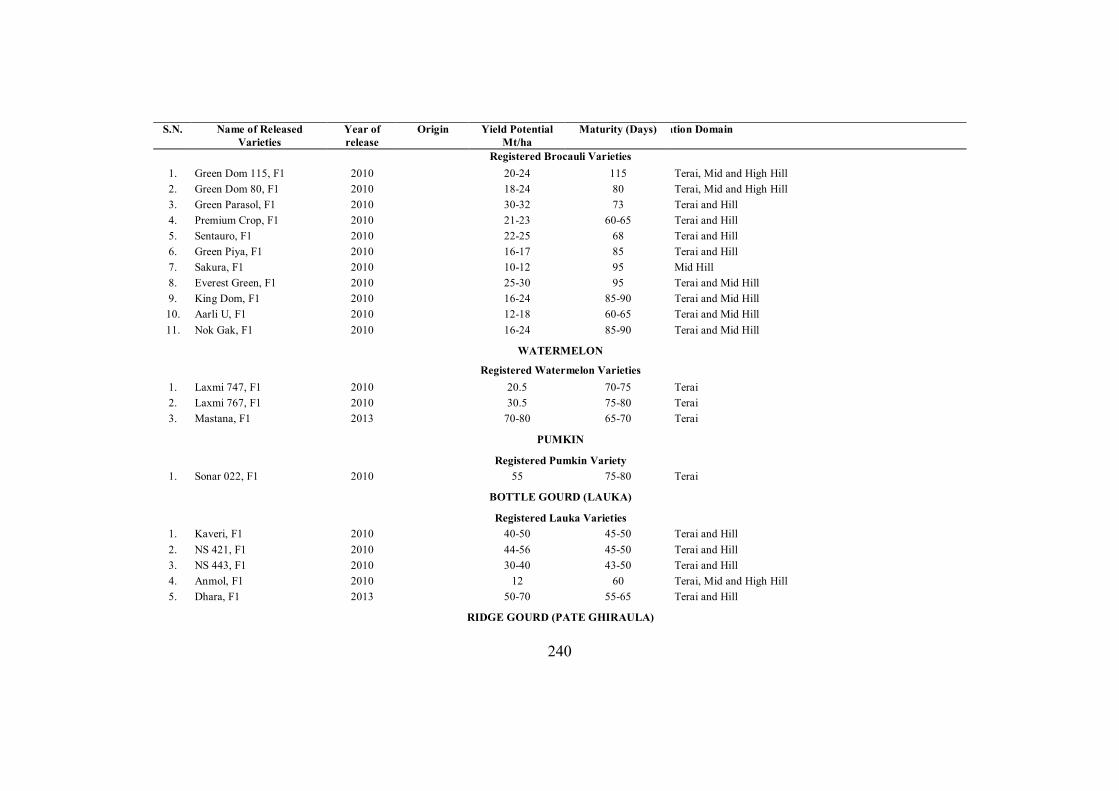
240
S.N. Name of Released Varieties
Year of release
Origin Yield Potential Mt/ha
Maturity (Days) Recommendation Domain
Registered Brocauli Varieties 1. Green Dom 115, F1 2010 20-24 115 Terai, Mid and High Hill 2. Green Dom 80, F1 2010 18-24 80 Terai, Mid and High Hill 3. Green Parasol, F1 2010 30-32 73 Terai and Hill 4. Premium Crop, F1 2010 21-23 60-65 Terai and Hill 5. Sentauro, F1 2010 22-25 68 Terai and Hill 6. Green Piya, F1 2010 16-17 85 Terai and Hill 7. Sakura, F1 2010 10-12 95 Mid Hill 8. Everest Green, F1 2010 25-30 95 Terai and Mid Hill 9. King Dom, F1 2010 16-24 85-90 Terai and Mid Hill 10. Aarli U, F1 2010 12-18 60-65 Terai and Mid Hill 11. Nok Gak, F1 2010 16-24 85-90 Terai and Mid Hill
WATERMELON
Registered Watermelon Varieties 1. Laxmi 747, F1 2010 20.5 70-75 Terai 2. Laxmi 767, F1 2010 30.5 75-80 Terai 3. Mastana, F1 2013 70-80 65-70 Terai
PUMKIN
Registered Pumkin Variety 1. Sonar 022, F1 2010 55 75-80 Terai
BOTTLE GOURD (LAUKA)
Registered Lauka Varieties 1. Kaveri, F1 2010 40-50 45-50 Terai and Hill 2. NS 421, F1 2010 44-56 45-50 Terai and Hill 3. NS 443, F1 2010 30-40 43-50 Terai and Hill 4. Anmol, F1 2010 12 60 Terai, Mid and High Hill 5. Dhara, F1 2013 50-70 55-65 Terai and Hill
RIDGE GOURD (PATE GHIRAULA)
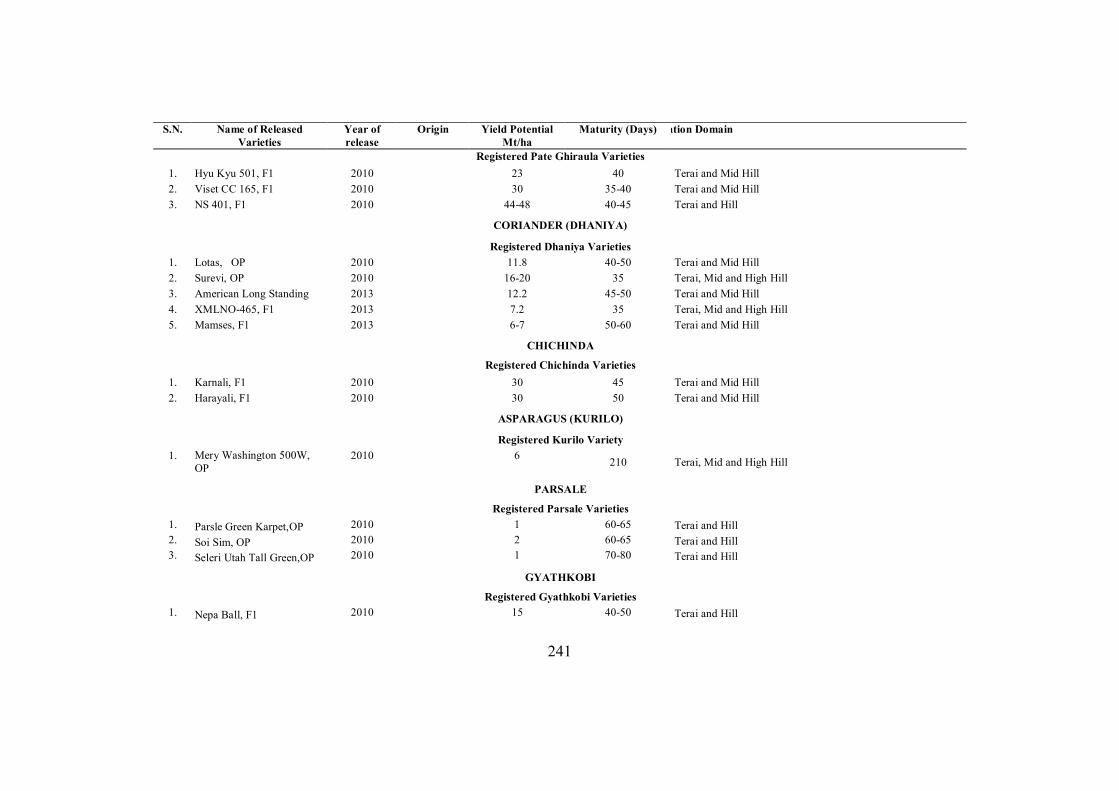
241
S.N. Name of Released Varieties
Year of release
Origin Yield Potential Mt/ha
Maturity (Days) Recommendation Domain
Registered Pate Ghiraula Varieties 1. Hyu Kyu 501, F1 2010 23 40 Terai and Mid Hill 2. Viset CC 165, F1 2010 30 35-40 Terai and Mid Hill 3. NS 401, F1 2010 44-48 40-45 Terai and Hill
CORIANDER (DHANIYA)
Registered Dhaniya Varieties 1. Lotas, OP 2010 11.8 40-50 Terai and Mid Hill 2. Surevi, OP 2010 16-20 35 Terai, Mid and High Hill 3. American Long Standing 2013 12.2 45-50 Terai and Mid Hill 4. XMLNO-465, F1 2013 7.2 35 Terai, Mid and High Hill 5. Mamses, F1 2013 6-7 50-60 Terai and Mid Hill
CHICHINDA
Registered Chichinda Varieties 1. Karnali, F1 2010 30 45 Terai and Mid Hill 2. Harayali, F1 2010 30 50 Terai and Mid Hill
ASPARAGUS (KURILO)
Registered Kurilo Variety 1. Mery Washington 500W,
OP 2010 6 210 Terai, Mid and High Hill
PARSALE
Registered Parsale Varieties 1. Parsle Green Karpet,OP 2010 1 60-65 Terai and Hill 2. Soi Sim, OP 2010 2 60-65 Terai and Hill 3. Seleri Utah Tall Green,OP 2010 1 70-80 Terai and Hill
GYATHKOBI
Registered Gyathkobi Varieties 1. Nepa Ball, F1 2010 15 40-50 Terai and Hill
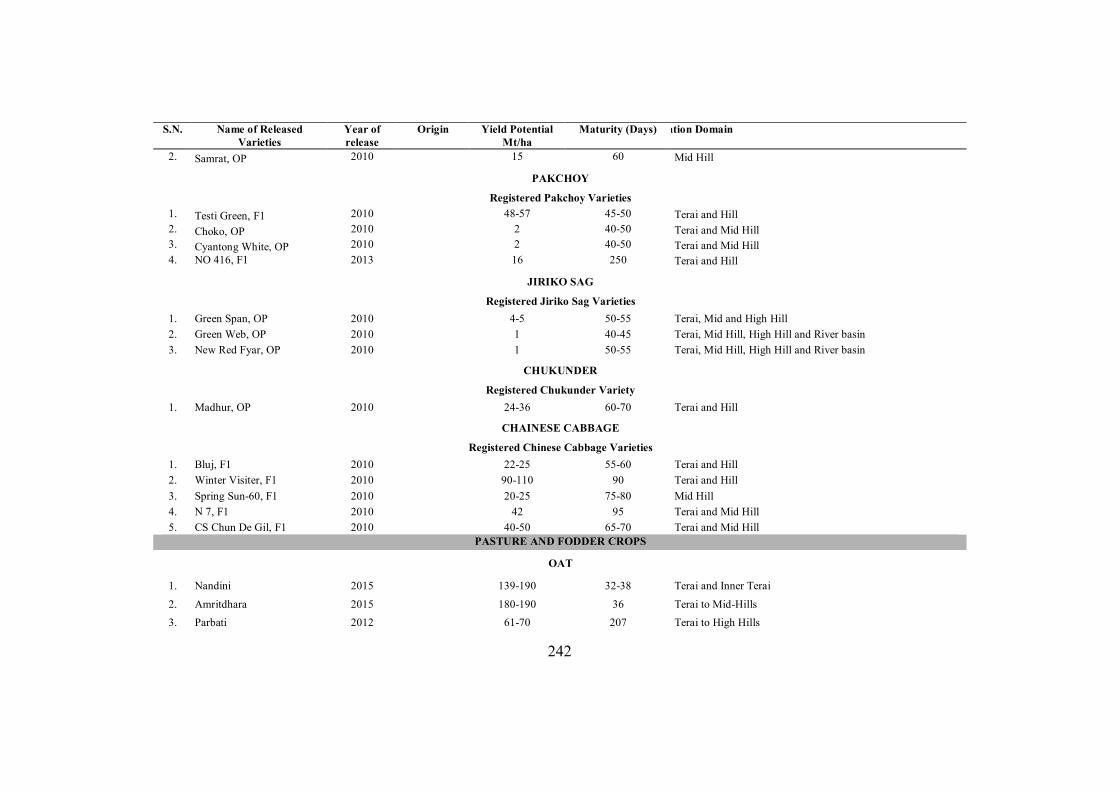
242
S.N. Name of Released Varieties
Year of release
Origin Yield Potential Mt/ha
Maturity (Days) Recommendation Domain
2. Samrat, OP 2010 15 60 Mid Hill
PAKCHOY
Registered Pakchoy Varieties 1. Testi Green, F1 2010 48-57 45-50 Terai and Hill 2. Choko, OP 2010 2 40-50 Terai and Mid Hill 3. Cyantong White, OP 2010 2 40-50 Terai and Mid Hill 4. NO 416, F1 2013 16 250 Terai and Hill
JIRIKO SAG
Registered Jiriko Sag Varieties 1. Green Span, OP 2010 4-5 50-55 Terai, Mid and High Hill 2. Green Web, OP 2010 1 40-45 Terai, Mid Hill, High Hill and River basin 3. New Red Fyar, OP 2010 1 50-55 Terai, Mid Hill, High Hill and River basin
CHUKUNDER
Registered Chukunder Variety 1. Madhur, OP 2010 24-36 60-70 Terai and Hill
CHAINESE CABBAGE
Registered Chinese Cabbage Varieties 1. Bluj, F1 2010 22-25 55-60 Terai and Hill 2. Winter Visiter, F1 2010 90-110 90 Terai and Hill 3. Spring Sun-60, F1 2010 20-25 75-80 Mid Hill 4. N 7, F1 2010 42 95 Terai and Mid Hill 5. CS Chun De Gil, F1 2010 40-50 65-70 Terai and Mid Hill
PASTURE AND FODDER CROPS
OAT
1. Nandini 2015 139-190 32-38 Terai and Inner Terai
2. Amritdhara 2015 180-190 36 Terai to Mid-Hills 3. Parbati 2012 61-70 207 Terai to High Hills
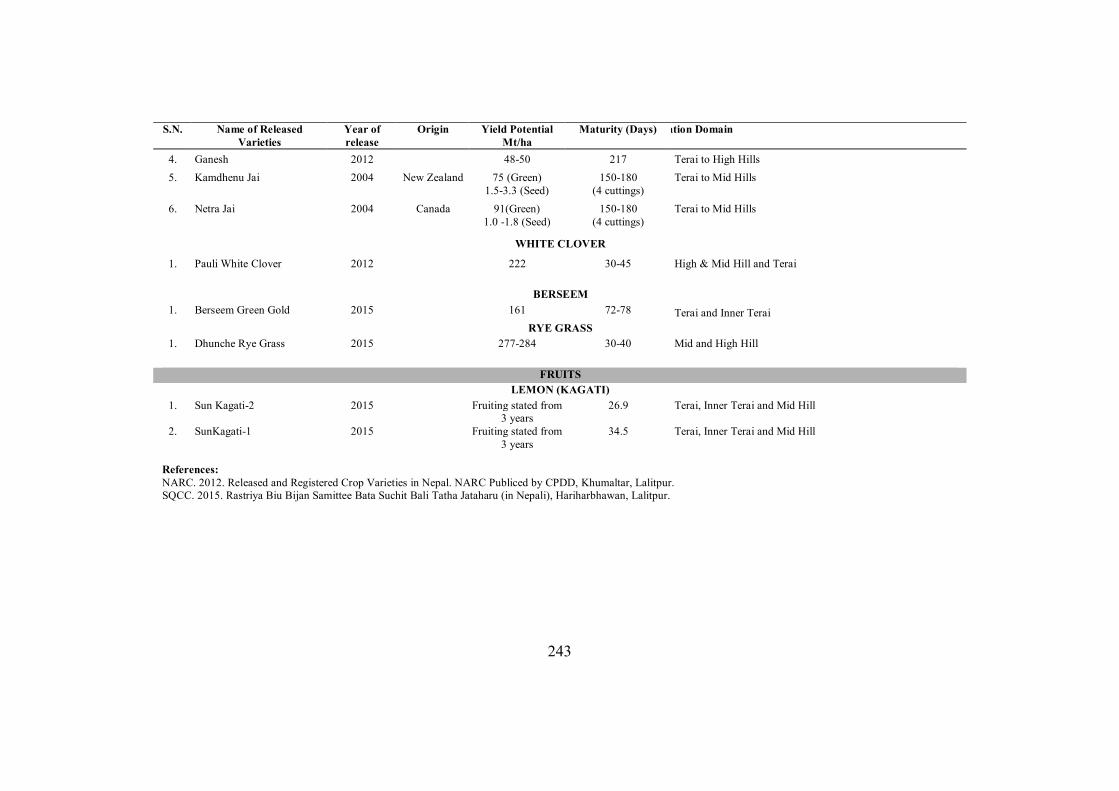
243
S.N. Name of Released Varieties
Year of release
Origin Yield Potential Mt/ha
Maturity (Days) Recommendation Domain
4. Ganesh 2012 48-50 217 Terai to High Hills 5. Kamdhenu Jai 2004 New Zealand 75 (Green)
1.5-3.3 (Seed) 150-180
(4 cuttings) Terai to Mid Hills
6. Netra Jai 2004 Canada 91(Green) 1.0 -1.8 (Seed)
150-180 (4 cuttings)
Terai to Mid Hills
WHITE CLOVER
1. Pauli White Clover 2012 222 30-45 High & Mid Hill and Terai
BERSEEM 1. Berseem Green Gold 2015 161 72-78 Terai and Inner Terai
RYE GRASS 1. Dhunche Rye Grass 2015 277-284 30-40 Mid and High Hill
FRUITS LEMON (KAGATI)
1. Sun Kagati-2 2015 Fruiting stated from 3 years
26.9 Terai, Inner Terai and Mid Hill
2. SunKagati-1 2015 Fruiting stated from 3 years
34.5 Terai, Inner Terai and Mid Hill
References: NARC. 2012. Released and Registered Crop Varieties in Nepal. NARC Publiced by CPDD, Khumaltar, Lalitpur. SQCC. 2015. Rastriya Biu Bijan Samittee Bata Suchit Bali Tatha Jataharu (in Nepali), Hariharbhawan, Lalitpur.
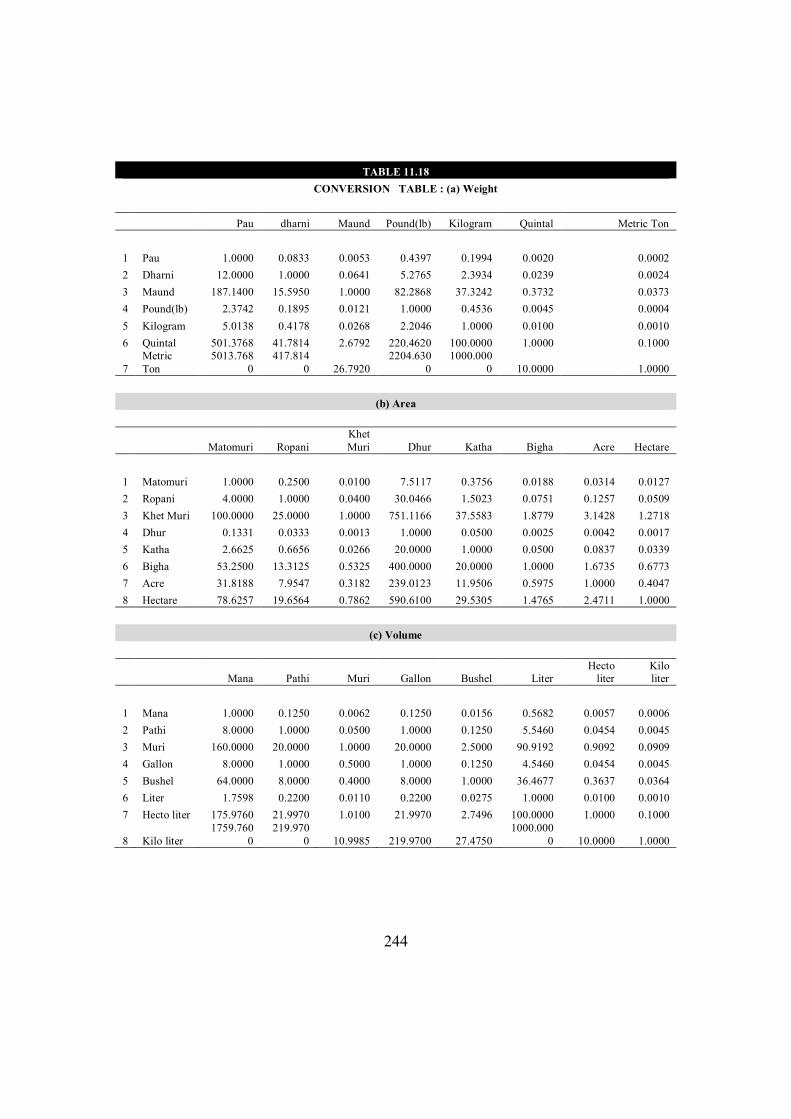
244
TABLE 11.18 CONVERSION TABLE : (a) Weight
Pau dharni Maund Pound(lb) Kilogram Quintal Metric Ton
1 Pau 1.0000 0.0833 0.0053 0.4397 0.1994 0.0020 0.0002 2 Dharni 12.0000 1.0000 0.0641 5.2765 2.3934 0.0239 0.0024 3 Maund 187.1400 15.5950 1.0000 82.2868 37.3242 0.3732 0.0373 4 Pound(lb) 2.3742 0.1895 0.0121 1.0000 0.4536 0.0045 0.0004 5 Kilogram 5.0138 0.4178 0.0268 2.2046 1.0000 0.0100 0.0010 6 Quintal 501.3768 41.7814 2.6792 220.4620 100.0000 1.0000 0.1000
7 Metric Ton
5013.7680
417.8140 26.7920
2204.6300
1000.0000 10.0000 1.0000
(b) Area
Matomuri Ropani Khet Muri Dhur Katha Bigha Acre Hectare
1 Matomuri 1.0000 0.2500 0.0100 7.5117 0.3756 0.0188 0.0314 0.0127 2 Ropani 4.0000 1.0000 0.0400 30.0466 1.5023 0.0751 0.1257 0.0509 3 Khet Muri 100.0000 25.0000 1.0000 751.1166 37.5583 1.8779 3.1428 1.2718 4 Dhur 0.1331 0.0333 0.0013 1.0000 0.0500 0.0025 0.0042 0.0017 5 Katha 2.6625 0.6656 0.0266 20.0000 1.0000 0.0500 0.0837 0.0339 6 Bigha 53.2500 13.3125 0.5325 400.0000 20.0000 1.0000 1.6735 0.6773 7 Acre 31.8188 7.9547 0.3182 239.0123 11.9506 0.5975 1.0000 0.4047 8 Hectare 78.6257 19.6564 0.7862 590.6100 29.5305 1.4765 2.4711 1.0000
(c) Volume
Mana Pathi Muri Gallon Bushel Liter Hecto
liter Kilo liter
1 Mana 1.0000 0.1250 0.0062 0.1250 0.0156 0.5682 0.0057 0.0006 2 Pathi 8.0000 1.0000 0.0500 1.0000 0.1250 5.5460 0.0454 0.0045 3 Muri 160.0000 20.0000 1.0000 20.0000 2.5000 90.9192 0.9092 0.0909 4 Gallon 8.0000 1.0000 0.5000 1.0000 0.1250 4.5460 0.0454 0.0045 5 Bushel 64.0000 8.0000 0.4000 8.0000 1.0000 36.4677 0.3637 0.0364 6 Liter 1.7598 0.2200 0.0110 0.2200 0.0275 1.0000 0.0100 0.0010 7 Hecto liter 175.9760 21.9970 1.0100 21.9970 2.7496 100.0000 1.0000 0.1000
8 Kilo liter 1759.760
0 219.970
0 10.9985 219.9700 27.4750 1000.000
0 10.0000 1.0000
Related Documents