© Datamonitor the home of Business Intelligence intuitive delivery expert analysis quality data © Datamonitor

© Datamonitor the home of Business Intelligence intuitive deliveryexpert analysisquality data © Datamonitor.
Dec 16, 2015
Welcome message from author
This document is posted to help you gain knowledge. Please leave a comment to let me know what you think about it! Share it to your friends and learn new things together.
Transcript

© Datamonitor
the home of Business Intelligence
intuitive deliveryexpert analysisquality data
© Datamonitor
PharmaVitae: Daiichi Sankyo Pharmaceutical Co., Ltd HC00068-029
Slidepack
01/12
quality data expert analysis intuitive deliverythe home of Business Intelligence
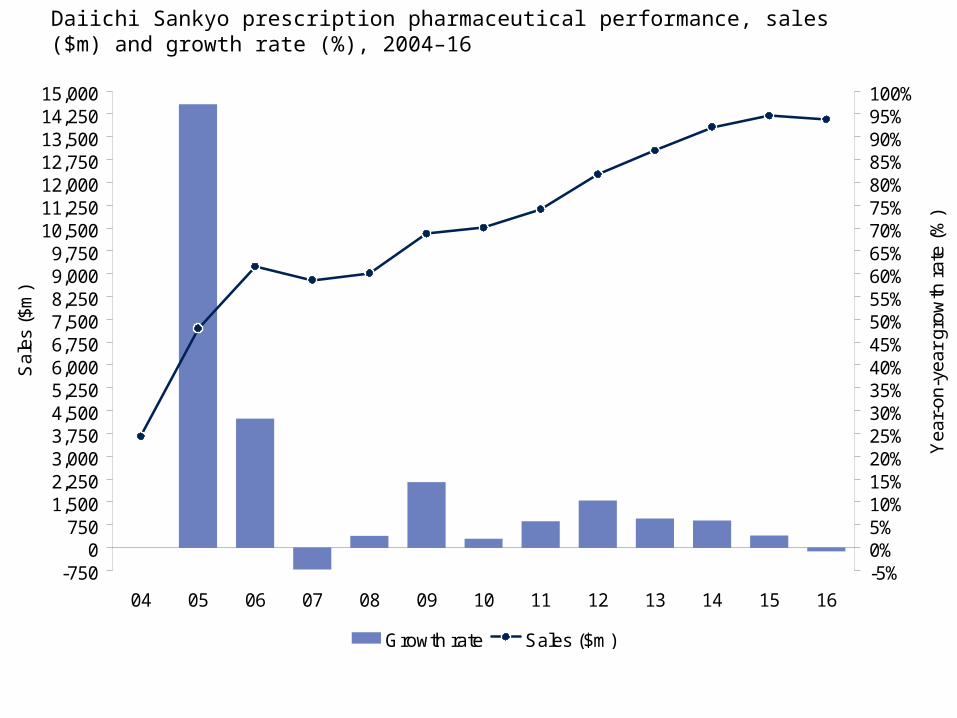
Daiichi Sankyo prescription pharmaceutical performance, sales ($m) and growth rate (%), 2004–16
-7500
7501,5002,2503,0003,7504,5005,2506,0006,7507,5008,2509,0009,750
10,50011,25012,00012,75013,50014,25015,000
04 05 06 07 08 09 10 11 12 13 14 15 16
Sa
les
($m
)
-5%0%5%10%15%20%25%30%35%40%45%50%55%60%65%70%75%80%85%90%95%100%
Ye
ar-o
n-y
ear
gro
wth
rat
e (
%)
Growth rate Sales ($m)
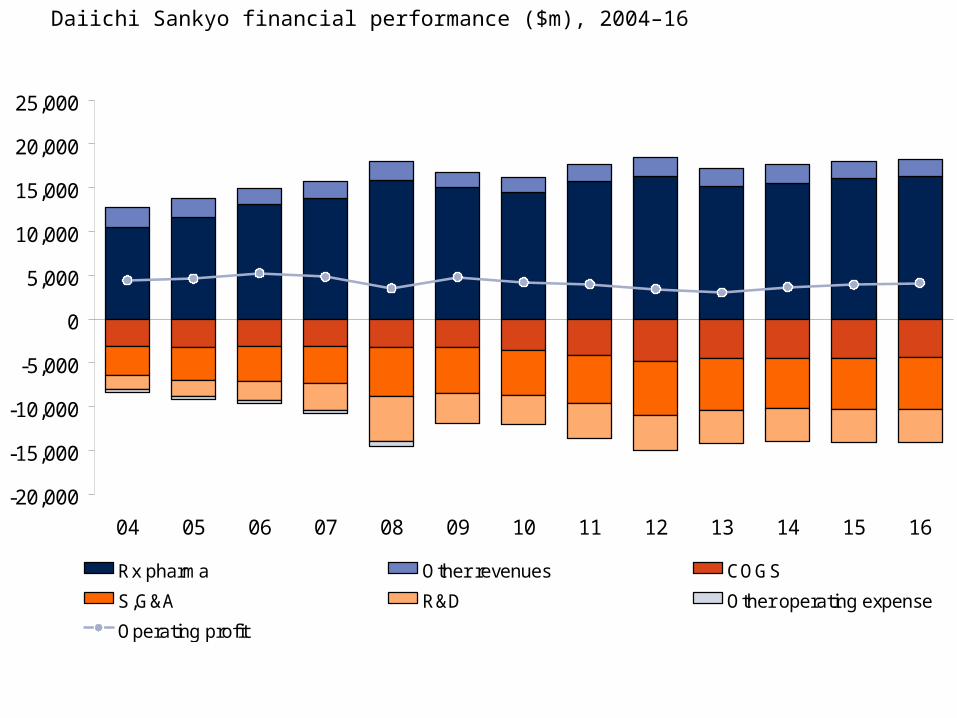
Daiichi Sankyo financial performance ($m), 2004–16
-20,000
-15,000
-10,000
-5,000
0
5,000
10,000
15,000
20,000
25,000
04 05 06 07 08 09 10 11 12 13 14 15 16
Rx pharma Other revenues COGS
S,G&A R&D Other operating expense
Operating profit
-6,000
-4,000
-2,000
+0
+2,000
+4,000
+6,000
DA
I
AS
T
SH
I
MIT
S
DN
S
TA
K
OT
S
EIS
Ave
rag
e
Pre
scri
pti
on
ph
arm
a s
ale
s ($
m)
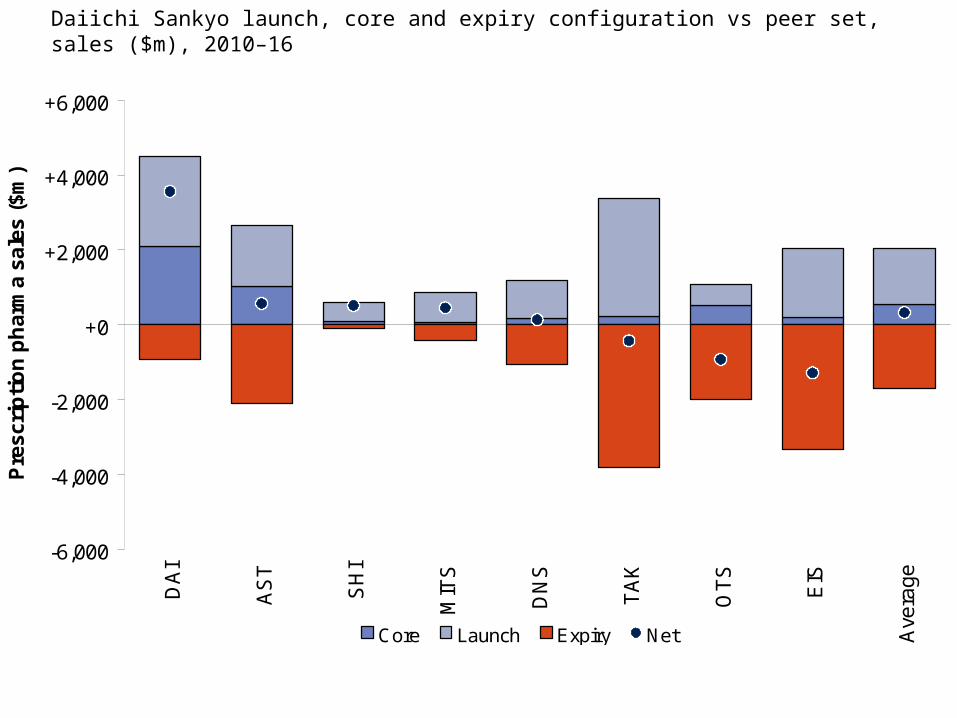
Core Launch Expiry Net
Daiichi Sankyo launch, core and expiry configuration vs peer set, sales ($m), 2010–16
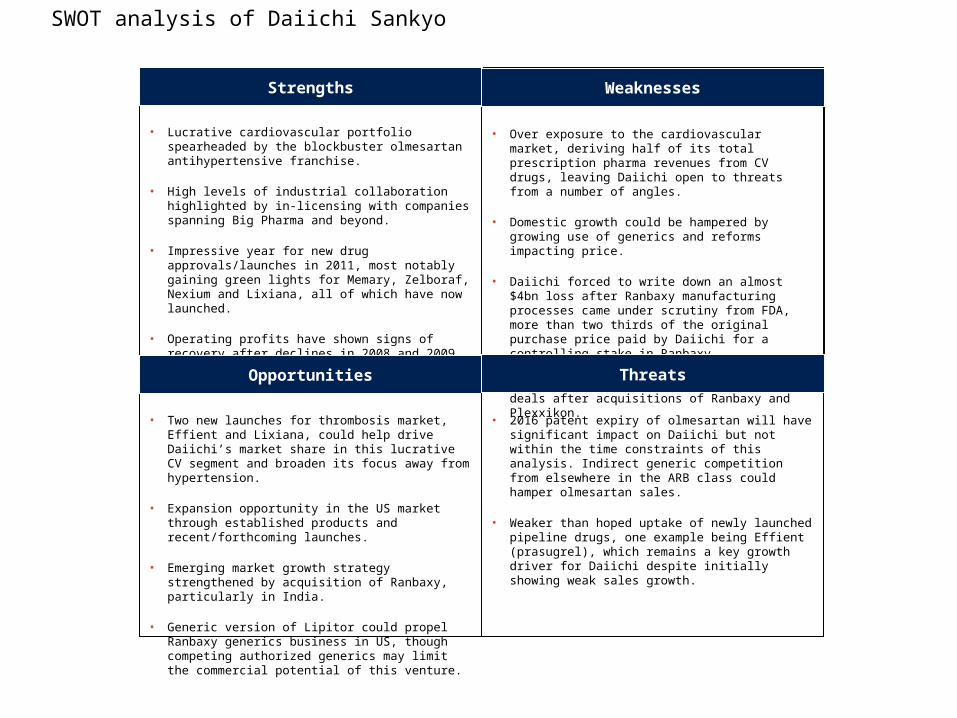
• Lucrative cardiovascular portfolio spearheaded by the blockbuster olmesartan antihypertensive franchise.
• High levels of industrial collaboration highlighted by in-licensing with companies spanning Big Pharma and beyond.
• Impressive year for new drug approvals/launches in 2011, most notably gaining green lights for Memary, Zelboraf, Nexium and Lixiana, all of which have now launched.
• Operating profits have shown signs of recovery after declines in 2008 and 2009.
Strengths
• Over exposure to the cardiovascular market, deriving half of its total prescription pharma revenues from CV drugs, leaving Daiichi open to threats from a number of angles.
• Domestic growth could be hampered by growing use of generics and reforms impacting price.
• Daiichi forced to write down an almost $4bn loss after Ranbaxy manufacturing processes came under scrutiny from FDA, more than two thirds of the original purchase price paid by Daiichi for a controlling stake in Ranbaxy.
• Limited capital available for further deals after acquisitions of Ranbaxy and Plexxikon.
Weaknesses
• Two new launches for thrombosis market, Effient and Lixiana, could help drive Daiichi’s market share in this lucrative CV segment and broaden its focus away from hypertension.
• Expansion opportunity in the US market through established products and recent/forthcoming launches.
• Emerging market growth strategy strengthened by acquisition of Ranbaxy, particularly in India.
• Generic version of Lipitor could propel Ranbaxy generics business in US, though competing authorized generics may limit the commercial potential of this venture.
Opportunities
• 2016 patent expiry of olmesartan will have significant impact on Daiichi but not within the time constraints of this analysis. Indirect generic competition from elsewhere in the ARB class could hamper olmesartan sales.
• Weaker than hoped uptake of newly launched pipeline drugs, one example being Effient (prasugrel), which remains a key growth driver for Daiichi despite initially showing weak sales growth.
Threats
SWOT analysis of Daiichi Sankyo
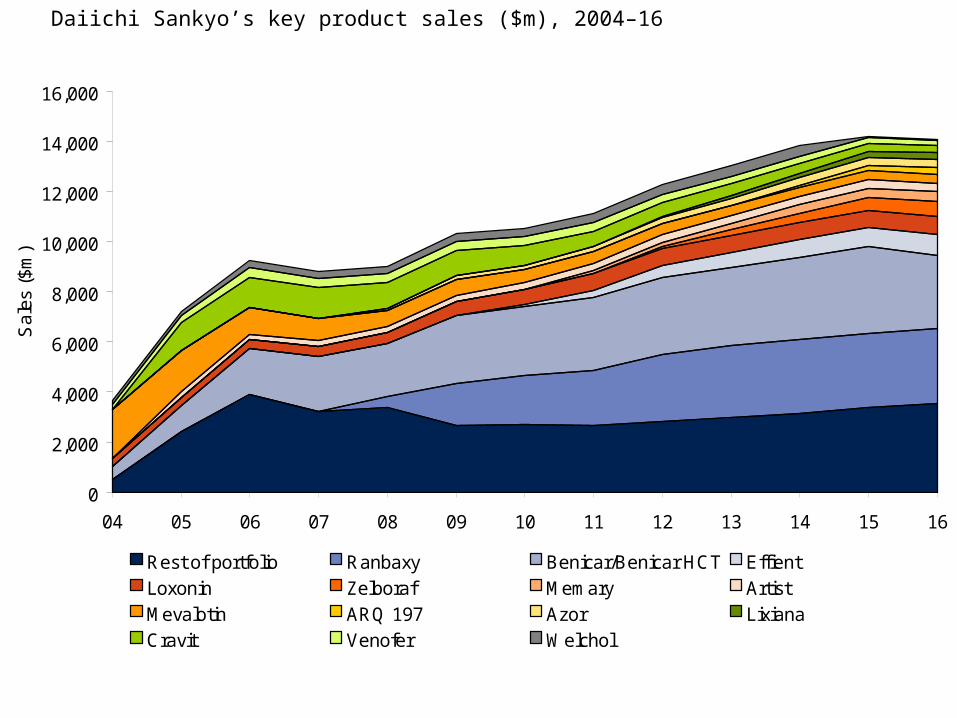
Daiichi Sankyo’s key product sales ($m), 2004–16
0
2,000
4,000
6,000
8,000
10,000
12,000
14,000
16,000
04 05 06 07 08 09 10 11 12 13 14 15 16
Sa
les
($m
)
Rest of portfolio Ranbaxy Benicar/Benicar HCT Effient
Loxonin Zelboraf Memary Artist
Mevalotin ARQ 197 Azor Lixiana
Cravit Venofer Welchol
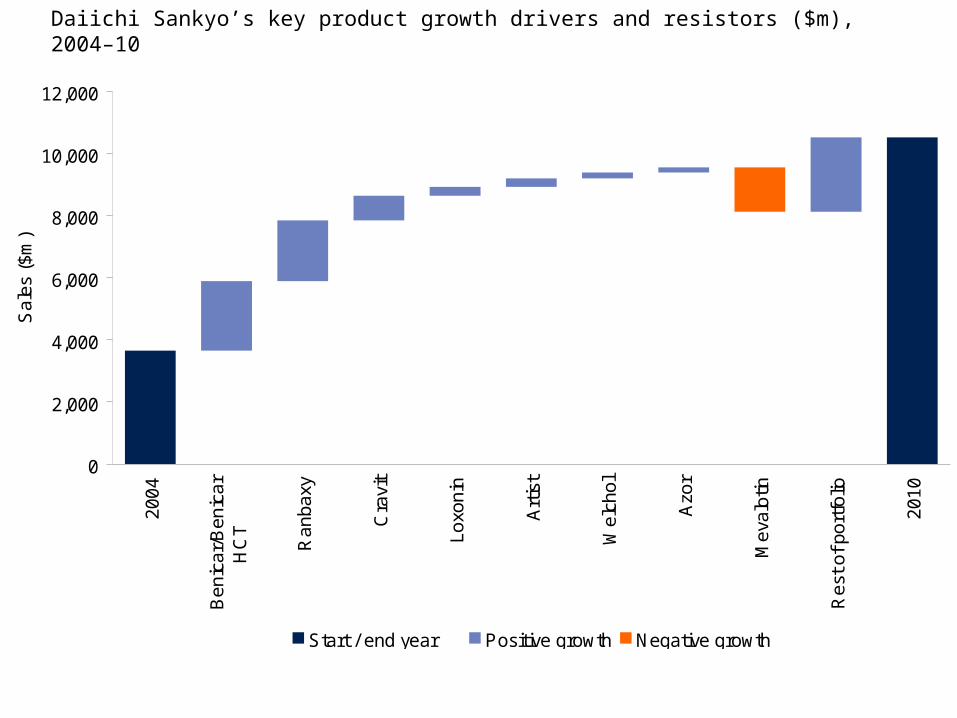
Daiichi Sankyo’s key product growth drivers and resistors ($m), 2004–10
0
2,000
4,000
6,000
8,000
10,000
12,000
200
4
Be
nica
r/B
enic
ar
HC
T
Ra
nba
xy
Cra
vit
Loxo
nin
Art
ist
We
lcho
l
Azo
r
Me
valo
tin
Re
st o
f po
rtfo
lio
201
0
Sa
les
($m
)
Start / end year Positive growth Negative growth
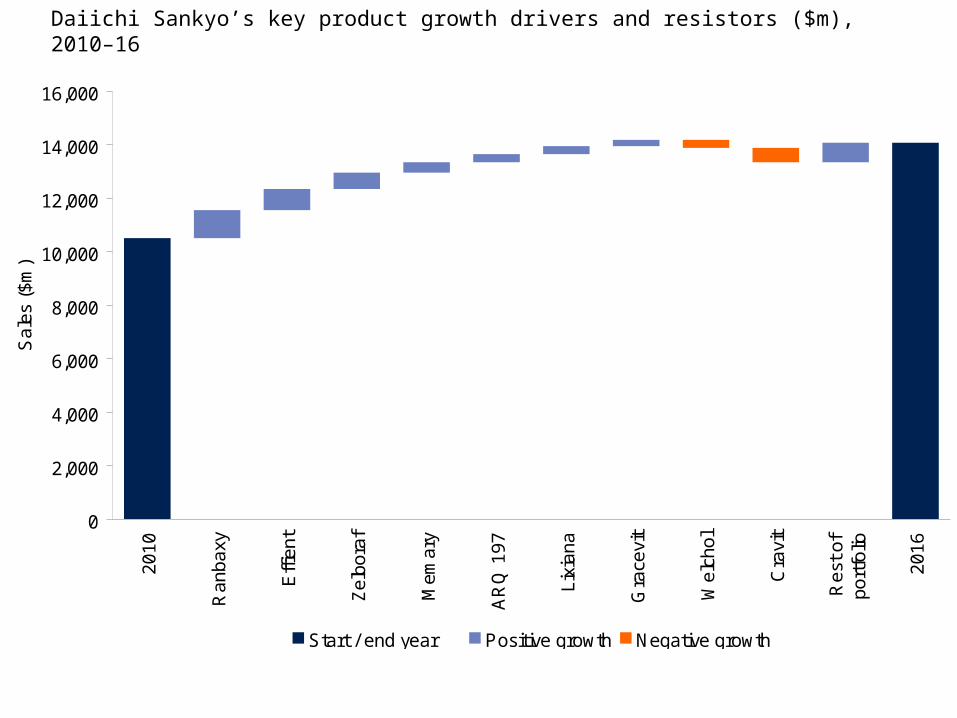
Daiichi Sankyo’s key product growth drivers and resistors ($m), 2010–16
0
2,000
4,000
6,000
8,000
10,000
12,000
14,000
16,000
201
0
Ra
nba
xy
Eff
ient
Zel
bor
af
Me
mar
y
AR
Q 1
97
Lixi
ana
Gra
cevi
t
We
lcho
l
Cra
vit
Re
st o
fpo
rtfo
lio
201
6
Sa
les
($m
)
Start / end year Positive growth Negative growth
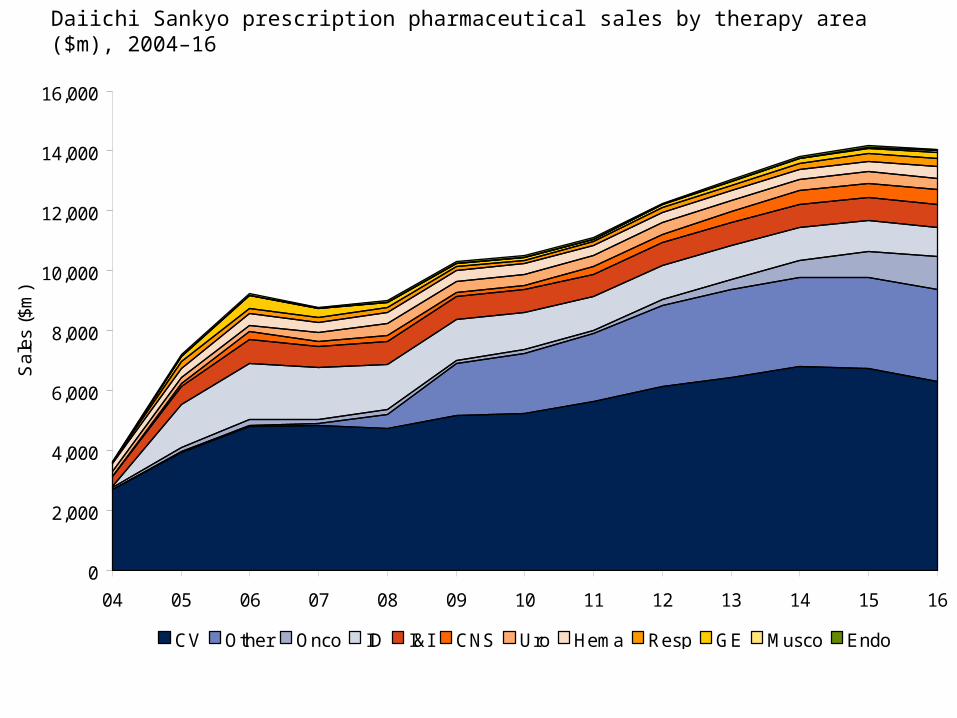
Daiichi Sankyo prescription pharmaceutical sales by therapy area ($m), 2004–16
0
2,000
4,000
6,000
8,000
10,000
12,000
14,000
16,000
04 05 06 07 08 09 10 11 12 13 14 15 16
Sa
les
($m
)
CV Other Onco ID I&I CNS Uro Hema Resp GE Musco Endo
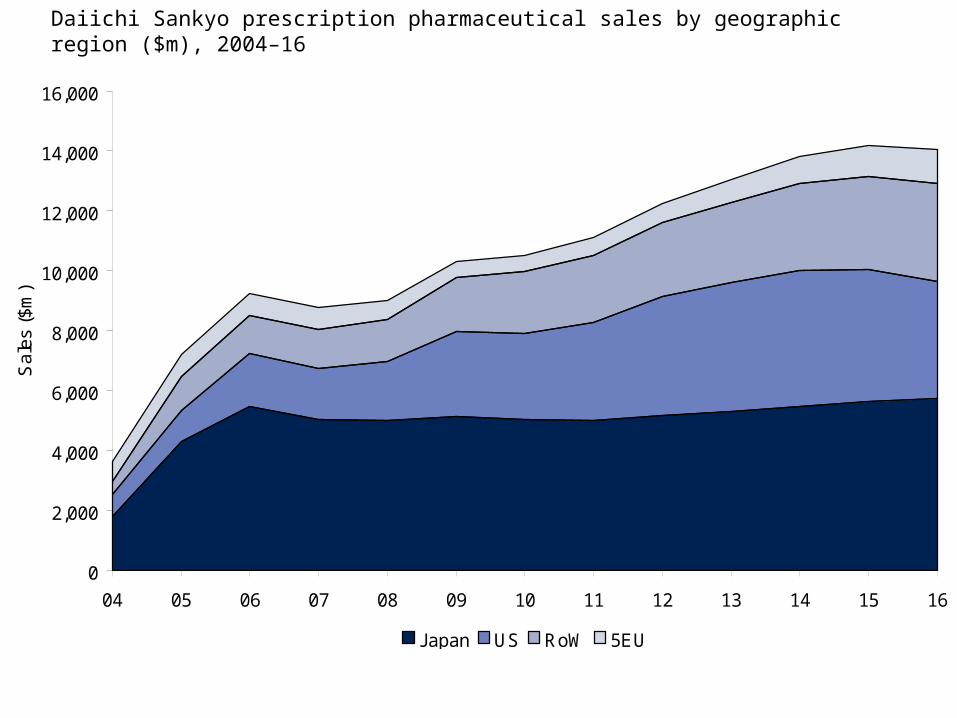
Daiichi Sankyo prescription pharmaceutical sales by geographic region ($m), 2004–16
0
2,000
4,000
6,000
8,000
10,000
12,000
14,000
16,000
04 05 06 07 08 09 10 11 12 13 14 15 16
Sa
les
($m
)
Japan US RoW 5EU
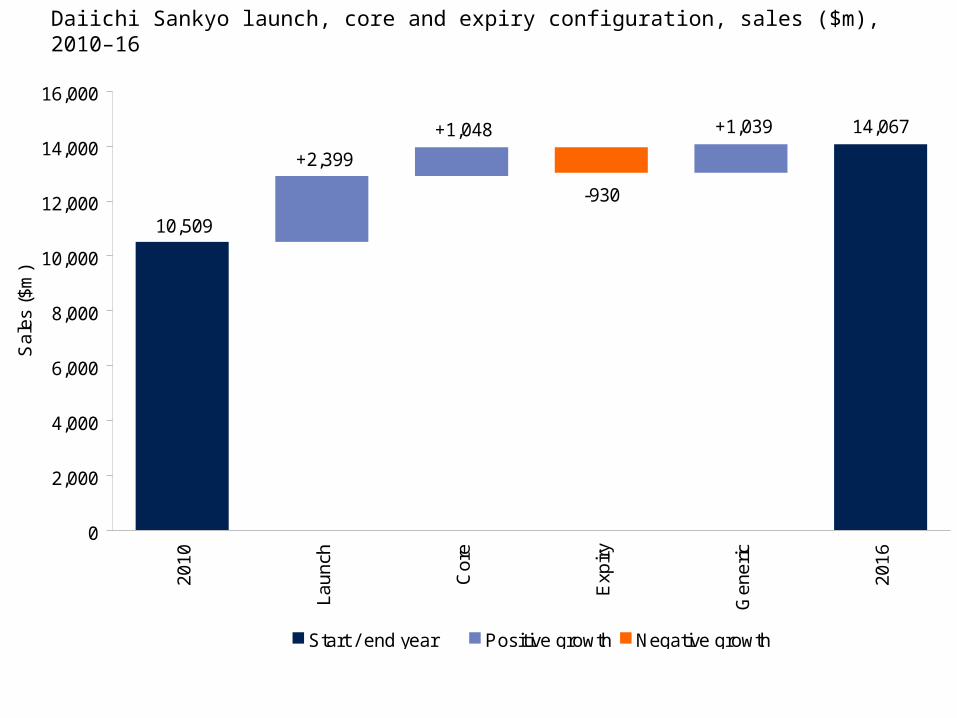
Daiichi Sankyo launch, core and expiry configuration, sales ($m), 2010–16
10,509
14,067+1,039+1,048
+2,399
-930
0
2,000
4,000
6,000
8,000
10,000
12,000
14,000
16,000
201
0
Lau
nch
Co
re
Exp
iry
Gen
eric
201
6
Sa
les
($m
)
Start / end year Positive growth Negative growth
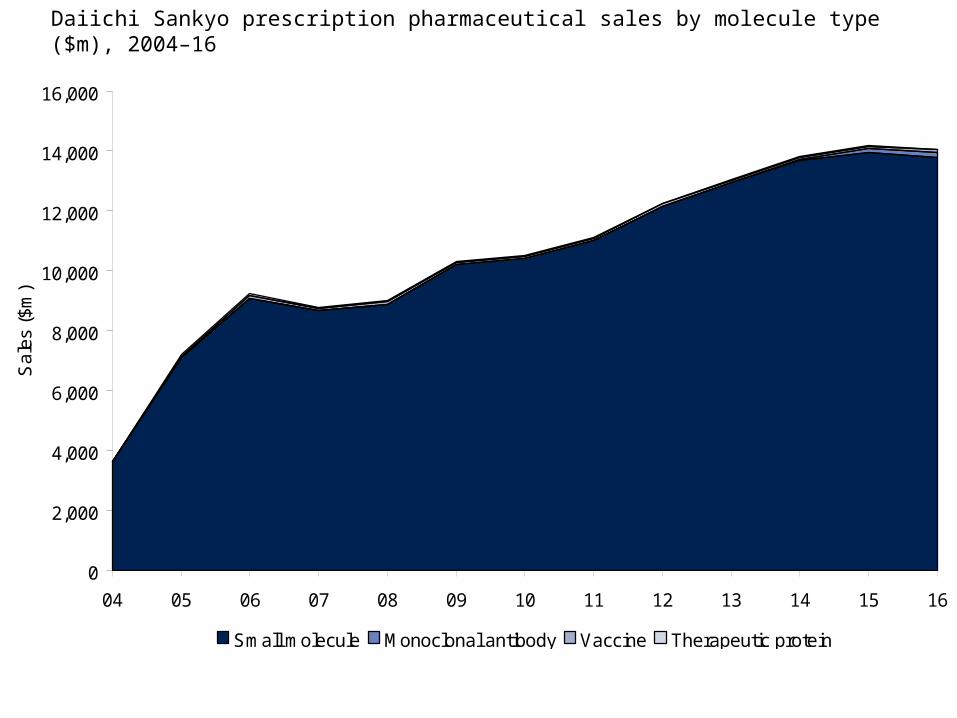
Daiichi Sankyo prescription pharmaceutical sales by molecule type ($m), 2004–16
0
2,000
4,000
6,000
8,000
10,000
12,000
14,000
16,000
04 05 06 07 08 09 10 11 12 13 14 15 16
Sa
les
($m
)
Small molecule Monoclonal antibody Vaccine Therapeutic protein
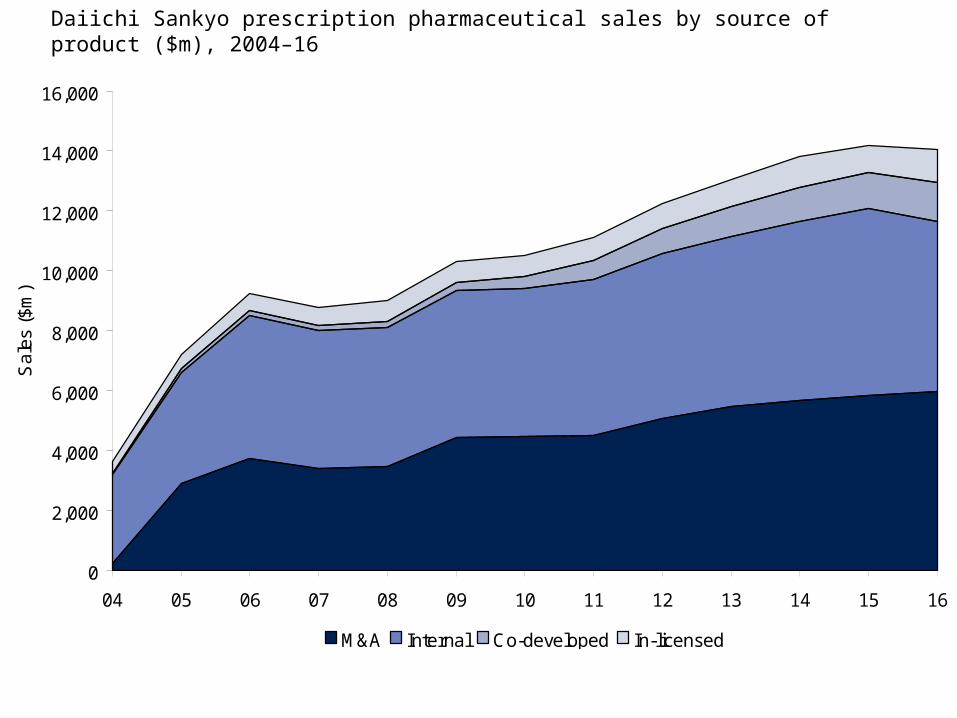
Daiichi Sankyo prescription pharmaceutical sales by source of product ($m), 2004–16
0
2,000
4,000
6,000
8,000
10,000
12,000
14,000
16,000
04 05 06 07 08 09 10 11 12 13 14 15 16
Sa
les
($m
)
M&A Internal Co-developed In-licensed

Daiichi Sankyo operating revenue/cost analysis ($m), 2004–16
-15,000
-10,000
-5,000
0
5,000
10,000
15,000
20,000
04 05 06 07 08 09 10 11 12 13 14 15 16
Rx pharma Other revenues COGS
S,G&A R&D Other operating expense
Operating profit
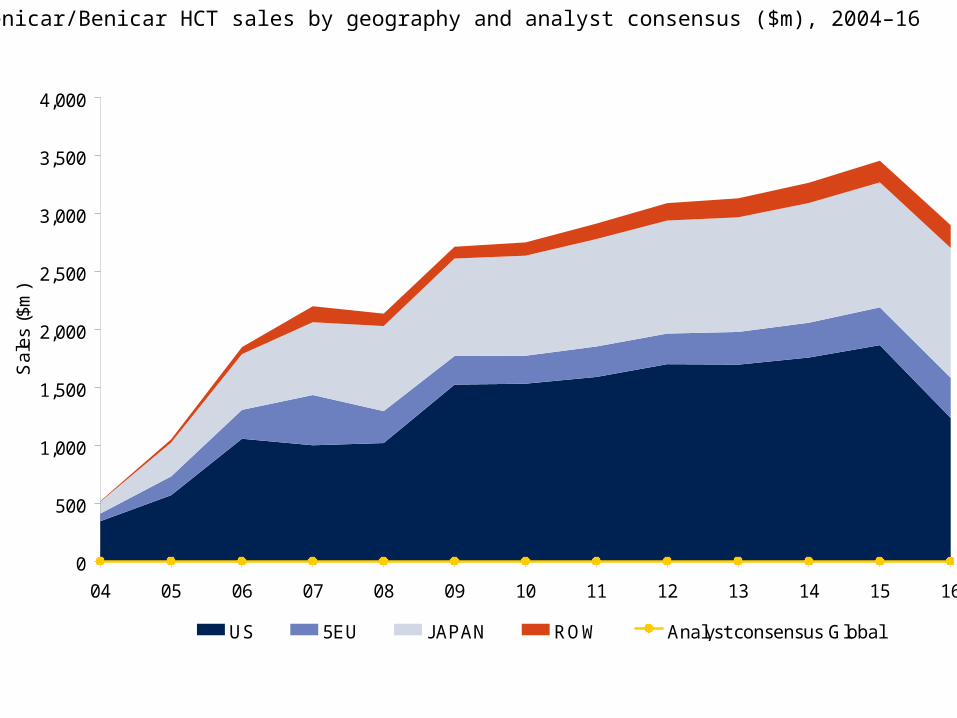
Benicar/Benicar HCT sales by geography and analyst consensus ($m), 2004–16
0
500
1,000
1,500
2,000
2,500
3,000
3,500
4,000
04 05 06 07 08 09 10 11 12 13 14 15 16
Sal
es (
$m)
US 5EU JAPAN ROW Analyst consensus Global
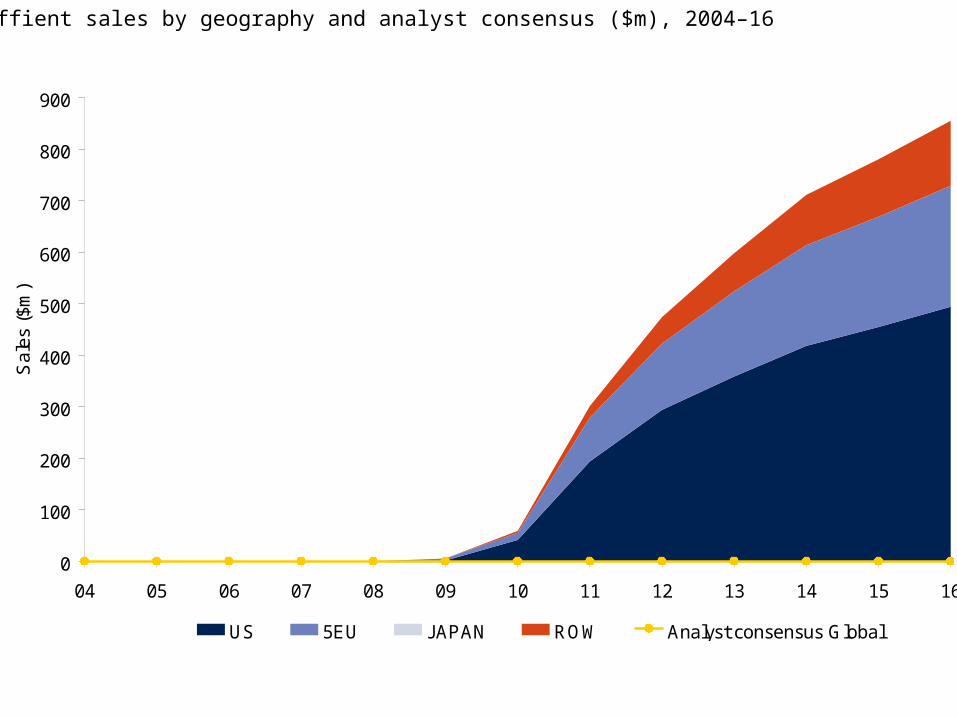
Effient sales by geography and analyst consensus ($m), 2004–16
0
100
200
300
400
500
600
700
800
900
04 05 06 07 08 09 10 11 12 13 14 15 16
Sal
es (
$m)
US 5EU JAPAN ROW Analyst consensus Global
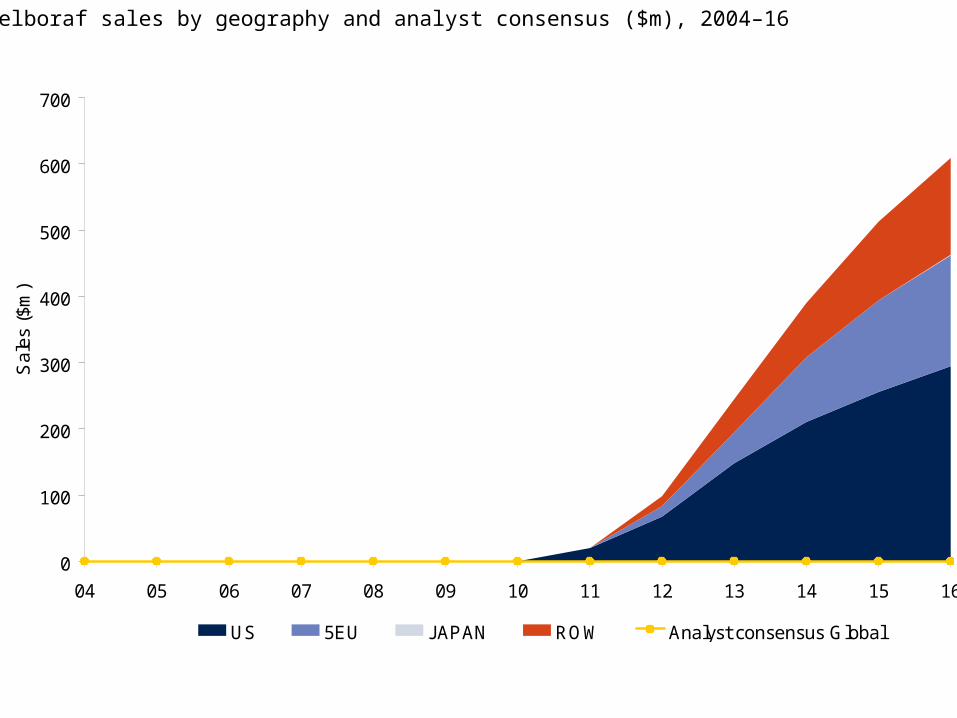
Zelboraf sales by geography and analyst consensus ($m), 2004–16
0
100
200
300
400
500
600
700
04 05 06 07 08 09 10 11 12 13 14 15 16
Sal
es (
$m)
US 5EU JAPAN ROW Analyst consensus Global
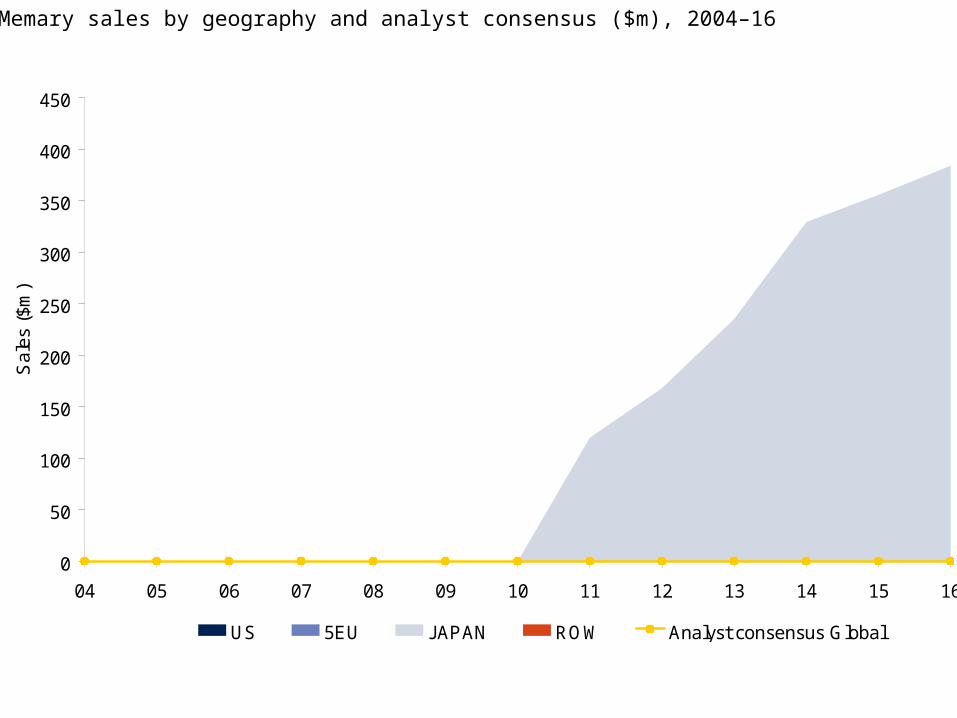
Memary sales by geography and analyst consensus ($m), 2004–16
0
50
100
150
200
250
300
350
400
450
04 05 06 07 08 09 10 11 12 13 14 15 16
Sal
es (
$m)
US 5EU JAPAN ROW Analyst consensus Global

© Datamonitor
the home of Business Intelligence
intuitive deliveryexpert analysisquality data
© Datamonitor
Related Documents