The State of the States in Intellectual & Developmental Disabilities: Illinois

Current AIDD Grant Period (2012-2017) Two data collection cycles: FYs 2012 and 2013—Completed FYs 2014 and 2015 (Start fall of 2015) Review.
Dec 16, 2015
Welcome message from author
This document is posted to help you gain knowledge. Please leave a comment to let me know what you think about it! Share it to your friends and learn new things together.
Transcript

The State of the States in Intellectual & Developmental Disabilities: Illinois

Key Partnerships
University of Colorado
Sibling Leadership
Network
National Conference of
State Legislatures
National Youth Leadership
Network
Advisory Committee

Data Collection
Current AIDD Grant Period (2012-2017)
Two data collection cycles: FYs 2012 and 2013—Completed
FYs 2014 and 2015 (Start fall of 2015) Review state budget and program document review;
Develop and implement 51 tailored state spreadsheets; collection with territories began in 2013
Obtain, interpret, and verify financial and programmatic data with
state officials; and
Disseminate and provide technical assistance.

Budget Categories
States report State Plan Medicaid (Personal Care, Rehab, Clinic, TCM); managed care (e.g. VT, WI); 1915(b/c) Waivers (e.g. MI) and Section 1115 Research and Demonstration Waivers (e.g. AZ)
State Local Federal
General Funds Local Funds Public ICF/IDMedicaid Match Local Medicaid Private ICF/ID
Other State Funds Match HCBS Waiver Rehab Services
Clinic ServicesTargeted Case Mgt.
Personal CareAdmin. Other
Other FederalTitle XX/SSGB
General Funds Local Funds Federal ICF/IDMedicaid Match Local Medicaid Other Federal
Other State Funds Match
General Funds Local Funds Federal ICF/IDMedicaid Match Local Medicaid Other Federal
Other State Funds Match
BUDGET CATERORIES/VARIABLES FORFOR STATE SPENDING/DATA COLLECTION
STATE INSTITUTIONAL SERVICES FUNDS (16 OR MORE PERSONS)
COMMUNITY SERVICES FUNDS (15 or Fewer Persons)
PRIVATE INSTITUTIONAL SERVICES FUNDS (16 OR MORE PERSONS)
SSI/ADC for HCBS Waiver

New Monograph
Overview of IDD Financial and Programmatic Trends through FY 2013
Just published by AAIDD
The Big Picture: Total I/DD Long Term Services and Supports Spending since 1977
The Impact of the Great Recession

Total I/DD Spending 1977-2013
7778
7980
8182
8384
8586
8788
8990
9192
9394
9596
9798
9900
0102
0304
0506
0708
0910
1112
13
Fiscal Year
$0
$10
$20
$30
$40
$50
$60
$70
Bill
ion
s o
f 20
13 D
olla
rs
$15.2
$31.3
$45.8
$54.4$57.8
$61.6
2011: $57.6
Source: Braddock, Hemp, Rizzolo, Tanis, & Haffer. State of the States in Developmental Disabilities, 2015

UNITED STATES
I/DD Spending Rebounds AfterThe Great Recession
7879
8081
8283
8485
8687
8889
9091
9293
9495
9697
9899
0001
0203
0405
0607
0809
1011
1213
Fiscal Year
-2.0%
0.0%
2.0%
4.0%
6.0%
8.0%
10.0%
12.0%
Pe
rce
nt
Re
al
Ch
an
ge 7.0%
3.3%
10.3%
7.1%
2.4%
6.0%
1.6%2.0%
1.5%
-0.6%
4.2%
2.4%
Source: Braddock, Hemp, Rizzolo, Tanis, & Haffer. State of the States in Developmental Disabilities, 2015

43 States Increased I/DD Spending From 2011-2013; 7 Reduced Spending
StateKentucky 40.3%Mississippi 38.8%Louisiana 35.3%Virginia 35.1%Missouri 34.8%Alaska 30.1%Pennsylvania 25.7%West Virginia 23.4%Montana 20.6%Georgia 19.9%Delaware 15.7%Connecticut 14.4%Maryland 13.2%South Carolina 13.0%Maine 12.7%North Dakota 12.5%Massachusetts 12.4%
% Change
Iowa 12.2%New Jersey 11.8%District of Columbia 11.4%Nebraska 10.8%Texas 10.8%Indiana 9.2%Utah 8.7%Tennessee 8.1%New Hampshire 8.0%North Carolina 8.0%Michigan 6.3%Alabama 5.8%Wisconsin 5.2%New York 4.6%Ohio 4.2%California 4.2%Oregon 4.0%
% Change
Illinois 3.9%Oklahoma 3.5%Wyoming 2.3%Nevada 1.6%South Dakota 1.4%Washington 1.3%Minnesota 0.7%Kansas 0.3%New Mexico -0.2%Idaho -0.7%Arizona -1.4%Colorado -1.6%Arkansas -2.7%Rhode Island -5.2%Vermont -7.2%Florida -9.4%Hawaii -11.4%United States 8.5%
% ChangeState
Source: Braddock, Hemp, Rizzolo, Tanis, & Haffer. State of the States in Developmental Disabilities, 2015

States With Inflation Adjusted I/DDSpending Cuts Year-year: 1978-2013
1978 - 7 1990 - 3 2002 - 4
1979 - 6 1991 - 6 2003 - 16
1980 - 16 1992 - 11 2004 - 17
1981 - 14 1993 - 18 2005 - 24
1982 - 14 1994 - 8 2006 - 15
1983 - 16 1995 - 11 2007 - 15
1984 - 8 1996 - 11 2008 - 17
1985 - 5 1997 - 10 2009 - 23
1986 - 5 1998 - 4 2010 - 22
1987 - 7 1999 - 10 2011 - 31
1988 - 7 2000 - 6 2012 - 13
1989 - 6 2001 - 10 2013 - 14

Funding for LTSS for People with I/DD

Institutional vs Community SpendingFY 2013: United States
3%
10%
5%3%
58%
13%
7%
$61.46 Billion
Public Institutions (16+)6 Person or Fewer
Residential & Related Community
Services
Family Support
Private Institutions (16+)
7-15 Person Settings
Supported Living/Personal Assistance
Supported Employment (1.4%)
ICF/ID (6 or fewer)
Source: Braddock, Hemp, Rizzolo, Tanis, & Haffer. State of the States in Developmental Disabilities, 2015

Compare Fiscal Effort Across Programs And States
IL Total Fiscal Effort: $2.70 Ranks 43rd US $4.40
IL Community Fiscal Effort: $2.01 Ranks 47th
US $3.81
Fiscal Effort is a measure of how much a state spends on I/DD LTSS per $1,000 of statewide personal income.
…in other words, how
much does your state spend after you control for state wealth – this allows you to compare your state to any other state regardless of state wealth.
Source: Braddock, Hemp, Rizzolo, Tanis, & Haffer. State of the States in Developmental Disabilities, 2015

Why is Medicaid Important?
Home and Community Based Services (HCBS) Waiver:
• Authorized in 1981 as a way of keeping people out of institutions while lowering costs
• Supported almost 686,000 people with DD in FY 2013
• Reimburses states for a variety of community-based services and supports
• Allows states to determine how many people they will serve and what services they will offerTotal I/DD Spending: $61.48 Billion
OtherState Funds (12%)
Other Federal Funds(10%)
OtherMedicaid (5%)
Home and Community
Based Services (HCBS) Waiver
(51%)
Intermediate Care Facilities
for Persons with I/DD
(21%)
…It made up 78% of total I/DD spending in 2013

HCBS Waiver Spending Per Capita
1 New York $277 18 Maryland $128 35 Virginia $782 Maine $241 19 South Dakota $125 36 Oklahoma $763 Vermont $240 20 Nebraska $124 37 Hawaii $744 District of Columbia $232 21 Oregon $122 38 Georgia $665 Minnesota $231 22 Massachusetts $118 39 Colorado $636 Connecticut $212 23 Indiana $117 40 Alabama $627 Alaska $211 24 Ohio $117 41 North Carolina $618 Rhode Island $198 25 Kansas $113 42 Arkansas $619 North Dakota $193 26 Kentucky $107 43 California $6010 Wyoming $182 27 Delaware $106 44 South Carolina $5911 West Virginia $181 28 Missouri $104 45 Utah $5712 New Hampshire $161 29 Arizona $98 46 Illinois $4913 Louisiana $157 30 Michigan $97 47 Florida $4414 Wisconsin $152 31 Tennessee $96 48 Texas $4215 Pennsylvania $140 32 Montana $91 49 Idaho $4016 New Mexico $137 33 New Jersey $88 50 Mississippi $3017 Iowa $130 34 Washington $87 51 Nevada $27
UNITED STATES $100
Source: Braddock, Hemp, Rizzolo, Tanis, & Haffer. State of the States in Developmental Disabilities, 2015

Federal-state Waiver Spending Per Capita: Fy 2013, By Region: FY 2013
$218
$167
$124
$115
$112
$98
$83
$65
$64
$58
$100
$0 $50 $100 $150 $200 $250
Federal-State Waiver Spending per Capita (General Population)
Northeast
New England
Mid-Atlantic
Great Plains
Great Lakes
Northwest
Rocky Mountain
Southwest
Pacific
Southeast
U.S.
Reg
ion
2. Northeast (NJ, NY, PR, VI) 10. Northwest (AK, ID, OR, WA)
1. New England (CT, ME, MA, NH, RI, VT) 8. Rocky Mountain (CO, MT, ND, SD, UT & WY)
3. Mid-Atlantic (DE, DC, MD, PA, VA, WV) 6. Southwest (AR, LA, NM, OK, TX)
7. Great Plains (IA, KS, MO, NE) 9. Pacific (AS, AZ, CA, CNMI, GUAM, HI, NV)
5. Great Lakes (IL, IN, MI, MN, OH, & WI) 4. Southeast (AL, FL, GA, KY, MS, NC, SC, TN)

HCBS Waiver study: What did we look at?
88 HCBS Waiver Applications for 2010:
types of services▪ definitions of services (n=1,329)
# of “users”
average units per user
average cost per unit
93 HCBS Waiver Amendments reasons for filing amendments
Rizzolo, M. C., Friedman, C., Lulinski-Norris, A., & Braddock, D. (in press – Feb/2013). Home and Community Based Services (HCBS) Waivers: A nationwide study of the states. Intellectual and Developmental Disabilities.

What services do states offer?
Over 1,300
definitions
Gobbledygook
Jargon
Community Transition Supports
Care Coordination
Companion/ Homemaker/ Chore/PA/SL
Assistive and Medical
Technologies
Residential Habilitation
Supported Employment
Adult Day Health
EducationIndividual
Goods and Services
Prevocational Services
Family Training and Counseling
Day Habilitation
Self-Advocacy Training
Health and Professional
Services
Financial Support Services
Recreation and Leisure
RespiteTransportation

Where did states propose to spend their money?
Residential Habilitation
53%
Homemaker/Chore/PA/SL11%
Day Habilitation19%
Supported Employ-
ment3% Remainder
15%
- Prevocational Services (3%)
- Family Training and Counseling (2%)- Transportation (2%)- Care Coordination (2%)- Health and Professional Services (2%)
- Respite (1%)- Assistive and Medical Technologies (1%)
o AT and Environmental Mods (0.5%)o Med Equip and PERS (0.7%)
- Community Transition Supports (<1%)- Financial Support Services (<1%)- Adult Day Health (<1%)- Individual Goods and Services (<1%)- Self Advocacy Training (<1%)- Education (<1%)- Recreation and Leisure (<1%)

Where do People with I/DD Live?

Source: Braddock, D., et al., State of the States in Developmental Disabilities, 2015, based on Fujiura (1998, 2013) and Larson et al. (2001).
Most People With I/DD Live WithFamily Caregivers
United States 2013
634,509
786,156
3,557,246
TOTAL: 4,977,911 PERSONS
13%
16%71%
Supervised Residential Setting
Alone or with RoommateWith Family Caregiver

Persons With I/DD Served By SettingIn The U.S., 2013
6%3% 33%
46%
4%
4%
4%
7-15 Group Homes35,908
Nursing Facilities 16+26,678
Private Institutions 16+22,256
Public Institutions 16+24,675
7-15 ICFs/ID20,095
6/fewer Total:504,897 (79.6%)
6/FewerSupported Living
293,956
6/Fewer Group, Foster & Host Homes, ICFs/ID,
Apartments210,941
634,509 Individuals Served
Source: Braddock, Hemp, Rizzolo, Tanis, & Haffer. State of the States in Developmental Disabilities, 2015

Roughly One Quarter Lived At Home With Aging Caregivers
United States 2013Caregivers Aged 60+
863,314
Caregivers Aged 41-59 1,247,882
Caregivers Aged <411,446,051
TOTAL: 3,557,246PERSONS
35%
40%
25%
Source: Braddock, D., et al., State of the States in Developmental Disabilities, 2015, based on Fujiura (1998, 2013) and Larson et al. (2001).

While Most People With I/DD Live with Family Caregivers, Only a Fraction of Families Receive Formal Supports
88 89 90 91 92 93 94 95 96 97 98 99 00 01 02 03 04 05 06 07 08 09 10 11 12 13
FISCAL YEAR
0.0
0.5
1.0
1.5
2.0
2.5
3.0
3.5
4.0
4.5
MIL
LIO
NS
OF
FA
MIL
IES
0.10 0.16 0.29 0.38 0.41 0.48 0.46 0.46
2.89 2.993.14
3.32 3.38 3.48 3.51 3.56
Total I/DD Caregiving FamiliesFamilies Supported by State I/DD Agencies
Source: Braddock, Hemp, Rizzolo, Tanis, & Haffer. State of the States in Developmental Disabilities, 2015
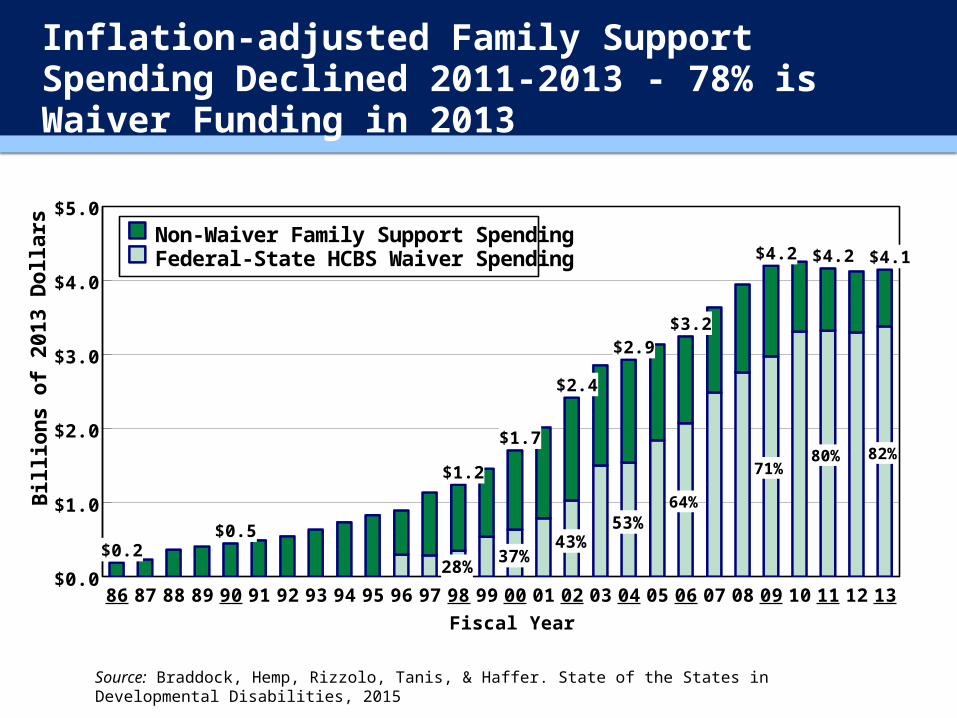
Inflation-adjusted Family Support Spending Declined 2011-2013 - 78% is Waiver Funding in 2013
86 87 88 89 90 91 92 93 94 95 96 97 98 99 00 01 02 03 04 05 06 07 08 09 10 11 12 13
Fiscal Year
$0.0
$1.0
$2.0
$3.0
$4.0
$5.0
Bil
lio
ns
of
2013
Do
llar
s
28%37%
43%53%
64%
71%80% 82%
$0.2$0.5
$1.2
$1.7
$2.4
$2.9$3.2
$4.2 $4.2 $4.1Non-Waiver Family Support SpendingFederal-State HCBS Waiver Spending
Source: Braddock, Hemp, Rizzolo, Tanis, & Haffer. State of the States in Developmental Disabilities, 2015

Trends in Utilization of State Institutions

States Continue To Close State Institutions
1969 1970 1975 1980 1985 1990 1995 2000 2005 2010 2015 2020
Year
0
25
50
75
100
125
150
175
200
Nu
mb
er o
f C
losu
res
1 2 7 10
27
46
77
113
133147
171 176
Source: Braddock, Hemp, Rizzolo, Tanis, & Haffer. State of the States in Developmental Disabilities, 2015
Source: Braddock, D., et al. Coleman Institute and Department of Psychiatry, University of Colorado, 2015.
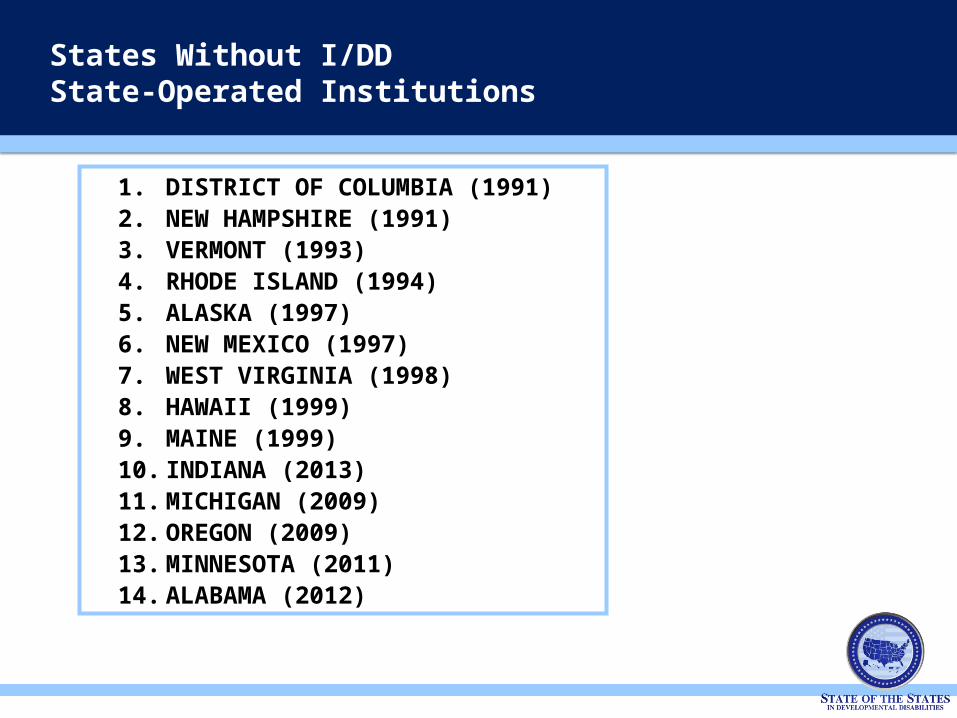
1. DISTRICT OF COLUMBIA (1991)2. NEW HAMPSHIRE (1991)3. VERMONT (1993)4. RHODE ISLAND (1994)5. ALASKA (1997)6. NEW MEXICO (1997)7. WEST VIRGINIA (1998)8. HAWAII (1999)9. MAINE (1999)10. INDIANA (2013)11. MICHIGAN (2009)12. OREGON (2009)13. MINNESOTA (2011)14. ALABAMA (2012)
States Without I/DDState-Operated Institutions

Source: Braddock, D., et al. Coleman Institute and Department of Psychiatry, University of Colorado, 2015.
Who’s Next?Smallest Institutional Census, FY 2013
1 Idaho 36
2 Nevada 47
3 Montana 55
4 Delaware 61
5 Wyoming 78
6 North Dakota 92
7 Arizona 106
8 Nebraska 126
9 Maryland 129
10 South Dakota 140
11 Colorado 149
12 Tennessee 182

Who’s Not?
Largest Institutional Census, FY 2013
1 Texas 3,932
2 New Jersey 2,341
3 Illinois 1,790
4 California 1,348
5 North Carolina 1,300
6 Mississippi 1,157
7 Pennsylvania 1,069
8 Ohio 1,066
9 New York 1,015
Source: Braddock, D., et al. Coleman Institute and Department of Psychiatry, University of Colorado, 2015.

37 States Finance The Remaining 153 Institutions
0 5 10 15 20 25Number of Remaining Institutions
New YorkTexas
OhioIllinois
New JerseyConnecticut
ArkansasCalifornia
MississippiNorth Carolina
PennsylvaniaSouth Carolina
VirginiaFlorida
KentuckyMassachusetts
MissouriWashington
GeorgiaOklahomaWisconsinColorado
IowaKansas
LouisianaMaryland
TennesseeArizona
DelawareIdaho
MontanaNebraska
NevadaNorth DakotaSouth Dakota
UtahWyoming
37 S
tate
s w
ith
Rem
ain
ing
Inst
itu
tio
ns
2413
1077
6
5
4
3
2
1
•10 States have one state institution remaining
• New York’s 24 “units” had an average size of 42 daily residents.
• 13 states and DC have closed all state-operated institutions.
Source: Braddock, Hemp, Rizzolo, Tanis, & Haffer. State of the States in Developmental Disabilities, 2015

State Institution Average Daily Costs Continue To Rise
7980
8182
8384
8586
8788
8990
9192
9394
9596
9798
9900
0102
0304
0506
0708
0910
1112
13
Fiscal Year
$0
$100
$200
$300
$400
$500
$600
$700
$800
Ad
just
ed C
ost
s P
er D
ay
$236
$245 $267$317
$397$433
$488$522
$562
$551
$612
$701
Source: Braddock, Hemp, Rizzolo, Tanis, & Haffer. State of the States in Developmental Disabilities, 2015

Projected Trend In Public Institutional Census: 1977-2029
77 82 87 92 97 02 07 12 17 22 27 30Year
0
20
40
60
80
100
120
140
160
Th
ou
san
ds
of
Res
iden
ts
2002-13 Projection1992-2013 Projection
150,207
24,727 (2013)
0 (2029)0 (2024)
Source: Braddock, Hemp, Rizzolo, Tanis, & Haffer. State of the States in Developmental Disabilities, 2015

http://www.stateofthestates.org/

You Can Make Your Own Graphs
http://www.stateofthestates.org/index.php/intellectualdevelopmental-disabilities/interactive-charts

Personalize A Chart For YourState Or Region
www.StateoftheStates.org
1. Total Fiscal Effort for I/DD Services 2. Community Fiscal Effort for I/DD Services 3. Institutional (16+) Fiscal Effort for I/DD Services 4. Community Spending as a Percent of Total I/DD Services 5. Percent of Total Out-of-Home Placements in Settings for 6 or Fewer Persons 6. Percent of Total Statewide I/DD Care-giving Families Supported by State I/DD Agencies 7. Aging I/DD Caregivers as Percent of Total Persons with I/DD 8. Individual and Family Support Spending per Capita 9. Home and Community Based Services (HCBS) Waiver Federal-State Spending per Capita 10. Average Annual Cost of Care in State-Operated 16+ Person I/DD Institutions 11. Average Daily Cost of Care in State-Operated 16+ Person I/DD Institutions 12. Nursing Facility Residents with I/DD, Per 100,000 of the State Population 13. Six-or-fewer Person Community Spending as a Percent of Total I/DD Spending 14. Unmatched State Funds Potentially Available to Match Additional Federal Medicaid Funding 15. Medicaid Percent of Total I/DD Spending 16. Public Spending for Family Support and Supported Living as a % of Total I/DD Spending

You Can Download A State Profile

Illinois Facts And Rankings Fy 2013
Out-of-Home Placements 50th in the % of people with I/DD in supervised residential settings for 1-6 people
- p. 21
Aging Caregivers Approximately 33,000 people with IDD living with caregivers over age 60
(estimated) – p. 65
Individual and Family Support use of supported living/personal assistance $9.70 per capita (US average
$24.92) – p. 48 supported employment per capita $0.68 per capita (vs. $2.76 US average) - p.
54 24th in spending per family (in family support programs) - p. 58 44th in # of families supported (in family support programs) per capita – p. 58
Source: Braddock, Hemp, Rizzolo, Tanis, & Haffer. State of the States in Developmental Disabilities, 2015

Financial Commitment
43rd in total fiscal effort (down from 42nd in 2011) – p.18
this is a measure of state commitment to funding services with DD
47th in community fiscal effort (down from 45th in 2011) – p.18 this measures how much the state spends in the community including
residential settings for 15 or fewer people and other support services (family supports, supported employment, personal care)
45th in spending "per capita" on HCBS Waiver - p.39
Illinois Facts And Rankings (Cont’d)
Source: Braddock, Hemp, Rizzolo, Tanis, & Haffer. State of the States in Developmental Disabilities, 2015
Related Documents


