Estudios Económicos ISSN: 0188-6916 [email protected] El Colegio de México, A.C. México Kim, Namsuk; Serra-Garcia, Marta ECONOMIC CRISES, HEALTH AND EDUCATION IN JAMAICA Estudios Económicos, vol. 25, núm. 1, enero-junio, 2010, pp. 105-134 El Colegio de México, A.C. Distrito Federal, México Available in: http://www.redalyc.org/articulo.oa?id=59715794004 How to cite Complete issue More information about this article Journal's homepage in redalyc.org Scientific Information System Network of Scientific Journals from Latin America, the Caribbean, Spain and Portugal Non-profit academic project, developed under the open access initiative

Welcome message from author
This document is posted to help you gain knowledge. Please leave a comment to let me know what you think about it! Share it to your friends and learn new things together.
Transcript

Estudios Económicos
ISSN: 0188-6916
El Colegio de México, A.C.
México
Kim, Namsuk; Serra-Garcia, Marta
ECONOMIC CRISES, HEALTH AND EDUCATION IN JAMAICA
Estudios Económicos, vol. 25, núm. 1, enero-junio, 2010, pp. 105-134
El Colegio de México, A.C.
Distrito Federal, México
Available in: http://www.redalyc.org/articulo.oa?id=59715794004
How to cite
Complete issue
More information about this article
Journal's homepage in redalyc.org
Scientific Information System
Network of Scientific Journals from Latin America, the Caribbean, Spain and Portugal
Non-profit academic project, developed under the open access initiative

E C O N O M IC C R IS E S , H E A L T H A N D¤E D U C A T IO N IN J A M A IC A
N a m su k K im
U n ited N a tio n s D evelo p m en t P rogra m m e
M a rta S e r r a -G a r c ia
T ilbu rg U n iversity
R esu m en : E stu d ia m o s el im p a cto d e ° u ctu a cio n es d e crecim ien to eco n ¶o m ico so -
b re in d ica d o res d e ed u ca ci¶o n y sa lu d en J a m a ica . In stru m en ta m o s
la s ° u ctu a cio n es d e crecim ien to co n va ria cio n es en la s p rin cip a les ex -
p o rta cio n es d el p a¶³s, en reg resio n es cu a si-p a n el b a sa d a s en en cu esta s d e
h o g a r en tre 1 9 8 9 y 2 0 0 7 . E l p rin cip a l resu lta d o es q u e la s ° u ctu a cio n es
en el P IB tien en d iferen tes efecto s en la ed u ca ci¶o n y la sa lu d .
A bstra ct: W e stu d y th e im p a ct o f g row th ° u ctu a tio n o n ed u ca tio n a n d h ea lth in -
d ica to rs in J a m a ica . U sin g h o u seh o ld su rv ey s b etw een 1 9 8 9 a n d 2 0 0 7 ,
w e stu d y th e im p a ct b y u sin g p seu d o -p a n el reg ressio n s a t th e p a rish
lev el, in stru m en tin g g row th ° u ctu a tio n s w ith va ria tio n s in m a jo r J a -
m a ica n ex p o rt co m m o d ities, to a cco u n t fo r th e en d o g en eity o f g row th
in its rela tio n sh ip w ith ed u ca tio n a n d h ea lth in d ica to rs. T h e m a in
¯ n d in g o f th e in stru m en ta l va ria b le reg ressio n is th a t G D P ° u ctu a tio n
h a s m ix ed im p a cts o n ed u ca tio n a n d h ea lth .
C la si ca ci¶o n J E L / J E L C la ssi ca tio n : I3 2 , O 1 5 , O 5 4
P a la bra s cla ve/ keyw o rd s: J a m a ica , crisis eco n ¶o m ica , d esa rro llo h u m a n o , ed u -
ca ci¶o n , sa lu d , eco n o m ic crisis, h u m a n d evelo p m en t, ed u ca tio n , h ea lth .
F ech a d e recepci¶o n : 2 5 II 2 0 1 0 F ech a d e a cep ta ci¶o n : 8 V 2 0 1 0
¤ T h is p a p er w a s p rep a red fo r U N D P 's R eg io n a l B u rea u fo r L a tin A m ericaa n d th e C a rib b ea n p ro ject o n T h e E ® ects o f th e E co n o m ic C risis o n th e W ell-bein g o f H o u seh o ld s in L a tin A m erica a n d th e C a ribbea n . T h e a u th o rs th a n kA m p a ro B a lliv ia n , fo r sh a rin g d a ta , a n d co llea g u es a t th e U N D P a n d a t a n u m b ero f co n feren ces fo r th eir h elp fu l co m m en ts. T h e v iew s ex p ressed in th is p a p er a reth o se o f th e a u th o rs a n d d o n o t n ecessa rily re° ect th o se o f th e o rg a n iza tio n s w ithw h ich th ey a re a ± lia ted . P lea se sen d co m m en ts a n d su g g estio n s to N a m su k K im
(n a m su k .k im @ u n d p .o rg ).
E stu d io s E co n ¶o m ico s, vo l. 2 5 , n ¶u m . 1 , en ero -ju n io 2 0 1 0 , p ¶a gin a s 1 0 5 -1 3 4

106 ESTUDIOS ECONOMICOS
1. Overview
The world economy observed a severe deterioration in 2008 and 2009.Although the speed of the deterioration decreased in late 2009, theimpact and the legacy of this deterioration are still to be determined.Since less developed economies are often the last ones to recover froma crisis, low and middle-income countries might suffer from this cri-sis for a longer time. In this regard, the economic crisis that origi-nated with the advanced economies draws deep concerns about low-and middle-income countries’ achievement of the Millennium Devel-opment Goals (MDGs) set by United Nations member states (UN,2009), especially in health and education of the poor.1
The literature on the relationship between health and educa-tion indicators and economic development is diverse. Many studies,such as Cutler, Deaton and Lleras (2006), Preston (2007), Jamison,Jamison and Hanushek (2007), show that economic development hasa close positive link with human development indicators, includinghealth and education attainment. On the other hand, Granados andIonides (2008) and Ranis and Stewart (2005) suggest that the rela-tion reverses in developed countries. Deaton (2006, 2007) concludesthat the exact relationship is difficult to determine because of theinteraction effect of institutions and human development stages.
Still, there are some projections on education indicators. De-veloping countries have made significant improvement in educationoutcomes, but the current global economic downturn threatens thisprogress by reducing the ability of both households and governmentsto invest in education (World Bank, 2009b: 1). Although empiricalresults are mixed, several studies indicate that the negative impact ofa crisis is likely to be concentrated in poor countries and households(World Bank, 2009b: 9). The progress toward MDG 2, to achieve uni-versal primary education, has happened too slowly and too unevenly(UN, 2009: 15).
Health outcomes and health financing are affected by economiccrises in more complicated ways. In many countries health conditionsdeteriorate during crises, although the result is sensitive to policymeasures applied to mitigate the effect of crises (World Bank, 2009b:19). Responses from governments and international bodies will beimportant to protect the vulnerable from the economic downturn.
This paper aims to study the impact of past economic crises onthe wellbeing of people in Jamaica. We study the Jamaican economy
1 See MDG website for details. [http://www.undp.org/mdg/].

ECONOMIC CRISES, HEALTH AND EDUCATION IN JAMAICA 107
and its correlation with human development, to shed light on the fea-sibility and policy implications for the MDGs. We measure the impactof aggregate income fluctuations on human development indicators,in particular, child health and education indicators.
Previous studies on the impact of aggregate shocks on educationand health reveal that the impact of an aggregate shock often dependson the level of development of an economy (see Ferreira and Schady2008, for an overview). For high-income economies, income shocksoften have positive effects on health, while they have negative onesfor low-income economies (e.g. Arbache and Page, 2007). The impacton middle-income economies is ambiguous. The effects of aggregateshocks on education are less clear-cut.
Since Jamaica is an upper middle-income economy, previous stu-dies provide little guidance as to what effect the current economiccrisis will have on education and health outcomes. We provide someevidence on the relationship between aggregate income and educationand health in Jamaica. These first estimates indicate that primary ed-ucation enrollment suffers during a crisis, while attendance increases.The effects on health are ambiguous. Nevertheless, since the currentcrisis is different from those of the past, it is difficult to ascertainwhether its impact will be similar to that of past crises.
This paper is organized as follows: Section 2 describes the Ja-maican economy and section 3 illustrates the statistics of educationand health in Jamaica. Section 4 describes our econometric modeland section 5 shows the results of the econometric analysis. Section6 concludes the paper.
2. The Jamaican Economy
Jamaica has had a poor growth experience during the 1990s and thebeginning of the 21st century. In figure 1, we plot the growth rates ofGDP per capita in Jamaica (IMF, 2009).2 The growth rate has beenlow and unstable throughout the period. Sustainable growth has been
2 Calculations of GDP in Jamaica vary, due among other things to its largeinformal sector and services-oriented economy (World Bank, 2004). This leads toimportant discrepancies between the GDP data reported by the Central Bank ofJamaica, in its statistical digest; the IMF, in its World Economic Outlook; andthe World Bank’s World Development Indicators (WDI). We use IMF indicatorsthroughout due to the availability of forecasts from this source. Major discrepan-cies with the WDI growth data arise for years 1991 and 1992, as well as 2007. In
other years, values are similar.

108 ESTUDIOS ECONOMICOS
the major topic in the research and policy dialogue in Jamaica (WorldBank, 2004; Thomas, 2004).
Figure 1GDP Per Capita Annual Growth in Jamaica
1989-2007
Source: IMF (2009).
Two crises can be identified in the recent history of Jamaica. Thefirst one is 1991-1992, an inflation crisis. In those years, inflation wasabove 50% (see table 1). The Jamaican economy has experiencedsmall but positive growth since 1985, through restructuring of theeconomy combined with substantial trade liberalization and deregu-lation. Sudden export increases and capital inflows led to a peak ininflation, which in turn increased poverty substantially.
The second crisis took place in the period of 1995-1997, a fi-nancial crisis. Jamaica was hit by one of the largest financial crises

ECONOMIC CRISES, HEALTH AND EDUCATION IN JAMAICA 109
(World Bank, 2004). The financial liberalization during the 1980shad been unaccompanied by adequate regulation, which turned intoa spiral of debt caused by uncreditworthy parties. In response to thecrisis, the Jamaican government bailed-out these credits at the cost ofhigh government debt (150% of GDP by 2002/2003). It also improvedits financial supervisory institutions substantially, creating bank andfinancial supervisory agencies (Kirkpatrick and Tennant, 2002).
Poverty (displayed in table 1 and defined as the percentage ofindividuals below the nationally defined poverty line) has decreasedsince 1992. It experienced a substantial increase in 1991 and 1992during the inflation crisis. Thereafter, it has consistently declined,despite the financial crisis during the mid-1990s.
To support the poor Jamaica has a wide social safety net (Handa,2004), with a variety of programs ranging from income support pro-grams, such as food stamps, to employment programs, such as “LiftUp Jamaica”. During the years from 1994 to 1998, 18% to 24% ofgovernment spending has been dedicated to social services, althoughthe increasing costs of debt management are a potential danger forsocial spending.
Table 1Overview of Indicators 1988-2007
Year GDP per Inflation Headcount Unemployment
capita growth (year average) Poverty Index rate
(% of population)
1988 -0.05 8.20 18.91989 0.04 16.12 30.4 16.81990 0.03 24.78 28.4 15.711991 0.01 68.60 44.6 15.371992 0.02 57.50 33.9 15.731993 0.02 24.31 24.4 16.311994 -0.02 35.10 22.8 15.341995 0.00 19.91 27.5 16.241996 -0.02 26.41 26.1 16.011997 -0.02 9.66 19.9 16.481998 -0.02 8.63 15.9 15.51999 0.01 5.98 16.9 15.662000 0.00 8.14 18.7 15.54

110 ESTUDIOS ECONOMICOS
Table 1(continued)
Year GDP per Inflation Headcount Unemployment
capita growth (year average) Poverty Index rate
(% of population)
2001 0.01 6.88 16.9 14.962002 0.01 6.99 19.7 15.122003 0.03 10.14 19.1 11.732004 0.01 13.52 16.9 11.442005 0.01 15.10 14.8 10.92006 0.02 8.52 9.62007 0.01 9.31 9.44Sources: GDP per capita and inflation rate data are from the IMF (2009).
Poverty rate data is from the World Bank (2004), PIOJ (2005). Unemployment
data is from World Bank (2009a).
Unemployment rates have been persistently high during most ofthe 1990s. However, in the last few years there has been a declineto levels below 10%. One of the groups most vulnerable to unem-ployment is the out-of-school youth, aged between 14-19, and youngadults, aged 20-24 (Handa, 2004). Their unemployment rate is sub-stantially higher than the average unemployment rate. For example,in 2001, while the average unemployment rate was 17%, youth unem-ployment was 33% (World Bank, 2009a). The most recent estimateof youth unemployment, from 2004, stands at 28.1%.
The World Bank (2004) identified several key constraints on Ja-maican growth and development:
• The large government debt, which reached 150% of GDP in2002/2003. This debt is crowding out investment, as well as theproductive expenses of the government;
• Pervasive and high crime, which deters business and tourism,and poses huge costs on society (at least of 4% of GDP);
• Education is still poor, due to the low quality of many schoolsand to the large drop out rate of poorer students during secondaryeducation;
• Lack of access to credit for the private sector, in particular ofaffordable sources of capital for small businesses and entrepreneurs;

ECONOMIC CRISES, HEALTH AND EDUCATION IN JAMAICA 111
• The decrease in competitiveness, due to the appreciation of theexchange rate which decreases exports.
3. Trends in Education and Health in Jamaica
Jamaica has achieved full enrollment to primary education, reachinglevels of 100% enrollment in 2007, calculated from Jamaican Survey ofLiving Condition, SLC, (2007). Enrollment in secondary education isalmost as high for its first three years, grades seven to nine, reaching alevel of 98% in 2007. Enrollment in grades 10 and 11 has traditionallybeen much lower, below 90% before 2007, when it reached a level of93.5%.
Over time, we find that overall enrollment in primary and gradesseven to nine is above 99% and 98%, respectively, for years 1998-2007, as shown in table 2. On the other hand, enrollment in grades10 to 11 is substantially lower, at 86%. At this level of secondaryschooling, the differences in enrollment between the highest and thelowest quintiles of the population become also larger. The enrollmentrate for those in the lowest quintile is 81%, while that of those inthe highest quintile is 92%. As noted in Davis (2004), the low levelof enrollment in the second half of secondary education is one of themain weaknesses of the education system in Jamaica.
Several characteristics of the education system are worth not-ing. Public schools have no fees during primary education and lowfees during secondary education. However, families face other coststo schooling, in particular food (which represent 40% of non-tuitioncosts) and transportation (Handa, 2004). The Jamaican governmentfinances the School Feeding Program, which partly and, sometimesfully, subsidizes the cost of warm meals and snacks. One of the prob-lems of this program is that there is a social stigma attached to par-ticipating in it.
The main problem of the Jamaican education system is the qual-ity. World Bank (2004) reports important deficiencies in the achieve-ments of students during primary and secondary education. Theirperformance in national tests is low and it is also lower than thoseof other Caribbean countries in the Caribbean Secondary EducationCertification Examination (World Bank 2004, figure 5.7).
A simple observation in table 2 suggests mixed impacts of thecrises on enrollment. We see that enrollment in primary school, whilealways above 98%, often decreases during an economic crisis. On theother hand, enrollment in secondary school, both for grades seven

112 ESTUDIOS ECONOMICOS
to nine and 10 to 11, often increases during crisis periods. If wecompare the reactions of the lowest and highest quintile to the twocrisis periods, we find no substantial differences.
Impacts of the crises on attendance look similar. Attendance ismeasured as the ratio of days that a child was sent to school within aschool week (5 days). In table 2 we see that attendance has graduallyincreased over time, often more so during crisis periods. Interestingly,the impact of crises on attendance is similar across the different levelsof schooling considered and is significant for the 1991-1992 crisis, whileit is not for the 1995-1997 one.
On our attendance variable, we note that questions on atten-dance are different in different years in the household survey, theJamaican Survey of Living Condition.3 At the beginning of the pe-riod, it asked how many days the child was sent to school in the lastfive days/week. Later on the question is rephrased to how many daysthe child was sent to school in the past four weeks. In order to makethese values comparable, in those years in which the question wasasked for the past four weeks, the answer is divided by four. Then aratio has been calculated dividing all answers by five, assigning anywith a value higher than one (in some cases the child went to schoolsix days a week or 21 days out of the last four weeks), a value ofone. Given the different formulations of the question and the natureof the question, based on the recollection of a parent or relative, thevariable might be subject to substantial measurement error.
We conduct a simple test to check if the changes in enrollmentand attendance are statistically meaningful. We use a t-test whichtests the difference in averages of two samples, assuming that thesamples have unequal variances. It is also known as Welch’s t-testand is used in McKenzie (2003). One main assumption is that sam-ples are independent. This is of course not the case, but given theimpossibility of matching individuals across long periods of time, itis a straightforward first test, which gives us an indication of howthe overall statistics change in crisis periods, without controlling forother characteristics of households.
The t-test result confirms that each crisis has a different effecton subgroups of students. Overall enrollment in primary school wasnegatively affected by the crises of 1991-1992 and 1995-1997. Enroll-ment in secondary school was positively affected by the crises. Crisesseem to increase the attendance to primary or secondary schools.
3 We provide a more detailed description of this survey in the next section.

ECONOMIC CRISES, HEALTH AND EDUCATION IN JAMAICA 113
Table 2Selected Education Indicators in Jamaica, 1989-2007
Year T-testa
1989 1991 1993 1995 1998 1991 1995
1990 1992 1994 1997 2007b 1992 1997
Enrollment
Primary
all .99 .98 .99 .99 .99 -2.67*** -1.89*
lowest quintile .98 .98 .98 .99 .99 .12 -1.07
highest quintile .98 .99 .99 .99 .99 .33 -1.10
Grades 7-9
all .97 .96 .96 .97 .98 -.99 2.12**
lowest quintile .95 .96 .96 .97 .98 .71 .72
highest quintile .96 .98 .96 .97 .98 .96 .53
Grades 10-11
all .75 .80 .80 .82 .86 2.445* 1.18
lowest quintile .75 .74 .78 .77 .81 -.45 -.22
highest quintile .87 .86 .82 .89 .91 -.15 1.66*
Attendancec
Primary
all .82 .86 .91 .92 .92 3.74*** 1.11
lowest quintile .83 .87 .90 .92 .91 1.41 1.07
highest quintile .81 .89 .93 .92 .93 2.60*** -0.72
Grades 7-9
all .82 .88 .92 .92 .92 3.67*** .40
lowest quintile .83 .87 .90 .92 .91 1.33 .96
highest quintile .85 .92 .94 .92 .94 1.72* .87
Grades 10-11
all .88 .91 .94 .94 .94 1.67* .27
lowest quintile .88 .94 .94 .96 .95 1.68* .99
highest quintile .86 .90 .95 .95 .95 .74 -.14
Notes: aWelch unpaired t-test; bData 1998 to 2004 for quintiles; cAtten-
dance information not available for 1990, 1992, 2003 and 2005.
Regarding health, Jamaica has been successful in dealing withmost child diseases (Handa, 2000). Immunization rates of children

114 ESTUDIOS ECONOMICOS
aged 0-5, for measles and Bacillus Calmette-Guerin (BCG) are high,above 80% in 2007 (calculated from SLC, 2007). The Pan Ameri-can Health Organization (2007) reports that between 2001 and 2005there were no cases of measles, polio, diphtheria, rubella or neonataltetanus. The main health problems of Jamaica are closer to thoseof developed countries, like hypertension, heart disease, etc. ButHIV/AIDS has been spreading throughout the country in recent years.
In our study of the impact of the crisis, we focus on two immu-nization variables, measles and BCG, the rate of child diarrhea andillness frequency for all age groups. The illness rate excludes injuriesand accidents, focusing only on health problems. These questionswere asked in the same way all years, except 2004 and 2007, wherethe question on measles was on how many doses were administeredinstead of whether the child had been immunized or not. The WorldBank also calculated Body Mass Index values for 10 years out ofthe 20 year period and included them in the datasets. We have alsoexamined these in our study.
In table 3, we see different impacts of the two crises on immuniza-tion. While measles immunization increased during the inflation crisisin 1991-1992, it decreased during the 1995-1997 crisis, especially forthose in the lowest quintile. On the other hand, BCG immunizationincreased during both crises. Regarding child diarrhea, we observean increase in both the lowest and highest quintiles, but not overall,during the inflation crisis in 1991-1992. This does not appear to bethe case for the financial crisis in 1995-1997.
The impact of crises on illness seems to be larger and have op-posite signs. We find a significant decrease in the illness rates ofthe overall population during both crises. Since health indicatorsare likely to be affected immediately by the households’ and govern-ment’s responses to the economic conditions, the simple comparisonof averages might not be able to reveal the underlying correlations.
Table 3Selected Health Indicators in Jamaica, 1989-2007
Year T-testa
1989 1991 1993 1995 1998 1991 1995
1990 1992 1994 1997 2007b 1992 1997
Child health
Measles
all .79 .86 .81 .79 .79 5.88*** -1.84*

ECONOMIC CRISES, HEALTH AND EDUCATION IN JAMAICA 115
Table 3(continued)
Year T-testa
1989 1991 1993 1995 1998 1991 1995
1990 1992 1994 1997 2007 1992 1997
lowest quint. .81 .86 .84 .78 .82 2.25** - 2.31**
highest quint. .79 .90 .81 .79 .78 3.82*** -.78
BCG
all .94 .97 .93 .95 .97 4.26*** 1.79*
lowest quint. .95 .96 .93 .96 .96 .46 2.18**
highest quint. .95 1.00 .93 .93 .97 2.53** .15
Child diarrhea
all .06 .07 .06 .06 .05 1.47 .87
lowest quint. 0.06 0.10 0.05 0.05 0.04 2.20** 0.20
highest quint. 0.04 0.08 0.04 0.06 0.05 2.42** 1.52
Adult health
Illness
all 0.15 0.11 0.12 0.09 0.11 -13.10*** - 7.52***
lowest quint. 0.11 0.10 0.11 0.09 0.11 -2.25** -3.69**
highest quint. 0.15 0.11 0.11 0.09 0.09 - 6.78*** -2.05*
Notes: aWelch unpaired t-test; bData 1998 to 2004 for quintiles.
In sum, a simple comparison of the averages of the indicatorssuggests that economic crises do have impacts on health and educa-tion. In the next section, we present a simple model which examinesthe impact of the aggregate income changes on health and educationand conduct more rigorous statistical analyses by using econometrictechniques to investigate the fluctuation of growth rates and theirimpact on education and health.
4. Econometric Model and Data
Ferreira and Schady (2008) present a simple model regarding the ef-fect of aggregate shocks on education and child health decisions. Inthe case of education, a negative income shock has two effects: anincome and a substitution effect. Through the income effect, demand

116 ESTUDIOS ECONOMICOS
for education within the household decreases as there is a higher needfor income from labor. However, the relatively worse situation in thelabor market makes education less costly and therefore can increaseits demand. Which of these two effects dominates depends on sev-eral factors, the initial level of income, the degree of development ofcredit markets, the magnitude and expected duration of the shock,and public spending.
Regarding the demand for health, the effect of an aggregate in-come shock can have three channels: first, through expenditures onhealth, second, through the time dedicated to health-promoting activ-ities and, third, through changes in public expenditures. A negativeincome shock might reduce expenditures on health and thus worsenhealth outcomes, but the lower opportunity cost of time and potentialincreases in government expenditures might compensate this.
For both cases, we can write a reduced form equation for healthand education outcomes, which is a function of aggregate income, aswell as other household characteristics.
Ejt = F (yjt, zjt)
Hjt = F (yjt, zjt)
Ejt and Hjt correspond to education and health indicators, yjt isincome and zjt is a vector of other characteristics for household j.The reduced form represents behavioral decisions at the householdlevel. However, because we do not have reliable household level paneldata, the equation can be aggregated up to the level of analysis (seeappendix A). In this paper, we use the parish level data to get pseudo-panel data, thus, j represents parish j.
Previous empirical studies have found different effects of aggre-gate shocks in middle income countries. While aggregate shocks hadnegative effects on education outcomes in Costa Rica, they had pos-itive impacts in Mexico, Brazil, Peru and Nicaragua (Ferreira andSchady, 2008). Similarly, for health, other studies find positive im-pacts of a crisis in Colombia, but negative ones in Mexico and Russia.Thus, there is no clear prediction as to what the effect of an aggregateshock will be on health and education in Jamaica.
The indicators we will focus on are slightly different than those inprevious studies. First, we study both enrollment and attendance ofprimary and secondary school children aged between six and 17, andnot the adult population. The advantage of using these two indicators

ECONOMIC CRISES, HEALTH AND EDUCATION IN JAMAICA 117
is that we can assess immediate and more ‘long-term’ reactions toaggregate impact. While attendance can be varied at an ongoingbasis, enrollment is decided once a year and, thus, might show a laterreaction to shocks compared to attendance. We study enrollment inprimary school, enrollment in secondary school, grades seven to nine,and enrollment in secondary school, grades 10 to 11. Similarly, forattendance, we focus on attendance to primary school, attendance tosecondary school, grades seven to nine and attendance to secondaryschool, grades 10 to 11.
Also, regarding our health indicators we focus on immunizationrates (for measles and tuberculosis), child diarrhea and Body MassIndex, as well as the overall rate of illness in the population.
Our main data sources are the Jamaican Survey of Living Con-ditions (SLC) for education and health indicators as well as householdcharacteristics. We have data from many rounds of the SLC from theyears 1988 to 2007. Regarding aggregate income, we use mainly IMF
data from the World Economic Outlook, using the growth in real GDP
per capita.The SLC is conducted yearly by the Statistical Institute of Ja-
maica (STATIN) and comprises data on households’ health, education,expenditures, etc. This survey has a representative sample of the Ja-maican population. The households in the survey are interviewedduring three to four years, after which another representative sampleis drawn. From the available SLC data, however, one cannot trackhouseholds for three to four years, due to the mismatch in identi-fication numbers throughout different years. Thus, while we have apseudo-panel, we do not use household level data but aggregate to theparish level, such that the same unit/region can be followed over time.For all our analyses, we use weights when aggregating to take into ac-count any possible bias due to non-responding households. For moredetailed information on this survey, see World Bank (2002), whichincludes a detailed report on the data collection process.
Among the several potential household characteristics, we focuson the household size (HHSIZE), the education of the household head(HHEDUCATION), his or her marital status (HHMARRIED) and age(HHAGE). We use these variables to control for the demographic fac-tors of households and potentially control for differences in preferencesreflected in these characteristics. On the one hand, the education ofthe household head is often highly correlated with that of the childrenand is thus an important determinant of education decisions. On theother hand, the situation of the household head, whether he/she ismarried or not and his or her age, also potentially influence the edu-

118 ESTUDIOS ECONOMICOS
cation and health outcome of the children, who might be more or lessneeded at home (Schultz, 2004: 208).
In the education equation, we also include the rate of children at-tending public schools, as compared to private, in the parish (PUBLIC-
SCHOOL). This can be of importance since the costs of both schoolsare substantially different, especially in terms of tuition fees. We willnot include government spending as this has experienced a more orless constant increase over the 1990s (Handa, 2004). However, onecould potentially investigate further the potential effects of differentgovernment programs.
Since most human development variables could be non-stationaryand we aim to focus on the impact of changes in aggregate income, wespecify our model in terms of first differences.4 We use the aggregateincome variable, which is the growth rate of GDP per capita (equiva-lent to the difference in log GDP), because there is no reliable parishlevel aggregate income data available. Therefore, our specification forprimary school enrollment can be specified as follows,
∆ENROLLMENTPRIMARY jt = β0+β1∆yt+β2HHSIZEjt (1)
+β3∆HHAGEjt + β4∆HHMARRIEDjt
+β5∆HHEDUCATIONjt + β6∆PUBLICSHOOLjt + ∆εjt
The same equation can be specified for all other education andhealth indicators. We will consider these variables at the parish level,j, for periods 1988-2007, subindexed by t.
Note that we use the growth rate of GDP, although we couldalternatively use dummy variables for the two crises periods, discussedin section 2. However, using the growth rate allows us to examine theimpact of GDP movements, both positive and negative, and evaluatehow the magnitude of these movements affects education and health.
One important problem is the potential endogeneity of aggregateincome against child education and health. Although we are focusingon children and not adults, and thus the risk of endogeneity is lower, itis still relevant in this context. Thus, we will use an instrumental vari-able estimation, replacing GDP growth with exogenous instruments assuggested in Wooldridge (2002). We use as an instrument the inter-national price variation of four main export commodities of Jamaica
4 We ran unit root tests on the original variables and first difference of those,
and found no evidence that the first order difference series are non-stationary.

ECONOMIC CRISES, HEALTH AND EDUCATION IN JAMAICA 119
(sugar, banana, bauxite and alumina), in real terms and in terms ofJamaican Dollar (J$) per metric ton (see appendix B for detailed datasource).5
The validity of the instrumental variable (IV) estimation hingeson two main assumptions: i) exogeneity of instruments with respectto dependant variable; and ii) relevance of the instruments (corre-lation with the instrumented variable). We conduct the Hansen J-test, which tests the exogeneity of the instrument, and the Stockand Yogo (2002) weak instruments test, which tests the relevance ofinstruments.
Potentially, changes in income affect different population groupsdifferently. For example, one can hypothesize that poorer householdssuffer more from income shocks due to their limited access to credit.6Thus, equation (1) could be limited to the lowest and highest con-sumption quintiles, or we could add interaction terms of the growthrates and area dummy variables, the results of which can be comparedfor rural and urban ones.7
5. Results of the Econometric Analysis
We display two tables, table 4 and table 5 for the education indica-tors, and two tables, table 6 and table 7, for the health indicators.Note that some years drop out of the regression if there is data miss-ing for one or more variables. For the education indicators, severalyears are missing for the variable indicating the proportion of childrenattending public schools (PUBLICSCHOOL). This implies that the firstyears 1989, 1990 and 1991 drop out of the regression. We do not in-clude 1988 as the questions regarding education were asked only forindividuals aged three to 14.
In each table there are two different regressions. The first re-gression is a simple panel regression with fixed region effect. Thismethod does not take into account the endogeneity of growth. The
5 We used tourism travel receipts as another instrument, but the instrument
failed to pass the validity tests. The results can be obtained from the authors.6 Ferreira and Schady (2008) point out that limited access to credit is a rele-
vant determinant of the extent of the impact of economic shocks on educationalchoices. They argue that access to credit is less extensive in developing countriescompared to developed ones and, therefore, the former might suffer more strongly
from aggregate economic shocks.7 Regression results by income quintiles are not reported in this paper, but
can be obtained from the authors.

120 ESTUDIOS ECONOMICOS
second regression is a fixed-effect panel estimation with an instrumen-tal variable (IV), using commodity prices as the instrumental variablefor growth. We instrument growth with the growth rates of banana,sugar, bauxite and alumina prices in the world markets in J$ permetric ton and in real terms (see appendix B for details). All our IV
regressions take into account the potential existence of heteroskedas-ticity in the error term.
There are several tests which are conducted to determine thevalidity and adequacy of the instruments we used. We report threetests.
First, the Hansen J-test, which is equivalent to the Sargan testfor overidentifying restrictions, but is adjusted for our estimation withrobust standard errors. The null hypothesis of these tests is thatinstruments are valid (the moment conditions of Generalized Methodof Moments (GMM) are close to 0). A rejection of the null hypothesisindicates some problems with the instruments, although it is not clearwhich ones.
Second, the weak instrument test, which tests whether the in-struments are correlated with the instrumented variables. This Fstatistic is to be compared to a set of critical values provided byStock and Yogo (2002). The null hypothesis is that the instrumentsare weak, and this null is rejected if the critical value is larger than theF-statistic. Thus, the lower the F-statistic, the higher the probabilitythat the test is rejected. There are two kinds of weak instrument testsperformed and thus two critical values one can use. One test, calledthe relative bias test, has a critical value of 11.04 at a 5% maximalbias of the IV estimator relative to the OLS one. The other test, the IV
size test, has a critical value of 16.87, at a 10% maximal size of a 5%Wald test of the estimated coefficient for the instrumented variable.
Third, the underidentification test indicates whether the instru-ments are correlated with the instrumented variables. The null hy-pothesis in this test is that the equation is not identified. In table4, the results suggest that primary enrollment rates decrease aftereconomic downturns. We find a small but significant effect of laggedgrowth (lgrowthpc) on current primary school enrollment. In the sim-ple panel fixed-effect regression, the coefficient estimate for the laggedgrowth rate (.17) is positive and significant at 10% confidence level.In the IV estimation, the coefficient estimate (.26) is positive and sig-nificant when we use commodity prices as the instrument for growth.As we found earlier in the simple comparison of averages of enrollmentrates, this is an indication that some households might postpone chil-dren’s entry to primary school if affected by a macroeconomic shock.

ECONOMIC CRISES, HEALTH AND EDUCATION IN JAMAICA 121
Secondary school enrollment is negatively affected by the laggedgrowth rates, that is, when the growth rate in the previous period islow, then the enrollment in secondary school increases. The coefficientestimate for the lagged growth rate is -.42 and is significant in thesimple panel regression. But it is not affected by growth rates once thegrowth rate is instrumented. The coefficient estimates for the laggedgrowth rate are not statistically significant in the IV estimation (.07).The effect is not significant for higher grades (10-11) in secondaryschools.
Control variables do not seem to play a great role in determin-ing enrollment rates. The coefficient estimates are not statisticallysignificant in general. It is partly because, as we have seen in table2, the enrollment is fairly high in Jamaica, and we are analyzing thechanges of the variables in the regressions. Since the annual changesin the variables are small, the limited number of observations con-tributes to the low precision of the estimates. However, we find thatthe marital status of the household head (dhhmarried) and the rateof children attending public school (dwpublicschool) marginally affectenrollment during the 2nd phase of secondary school, grades 10-11.When the average share of two parent households increases, the en-rollment in higher grades in secondary school decreases (coefficientestimates are -.35 in simple panel regression, and -.37 in IV regres-sion). More students are enrolled in higher grades in secondary schoolwhen the percentage of public schools in the parish increases (.47 insimple panel, and .50 in IV).
Regarding the validity of our instrument, we find that the HansenJ-test overall cannot be rejected, which means that instruments arevalid. For primary school enrollment, the test statistic (7.32) is re-jected at a 5% confidence level, but is accepted at 1%. This seemsto be caused by the price of alumina: if this price is excluded fromthe regression the Hansen J-test is not rejected at 1%. For the weakidentification test, we use the IV size test that has a Stock and Yogo’scritical value of 16.87. The instrument test statistics are lower thanthe critical value which means we have strong instruments. The un-deridentification test gives a similar result with a very low p value.
A lower growth rate is strongly associated with higher atten-dance. Table 5 suggests that attendance in primary school increaseswhen the growth rate is low and the growth rate in the previous periodis high. The coefficient estimate is -1.45 for current period growth and1.40 for the lagged growth rate in the simple panel regression withfixed effect. They are both statistically significant at a 1% confidencelevel. The result is quite robust for different grades. The magnitude

122 ESTUDIOS ECONOMICOS
of the effect of growth rates does not change much for grades sevento nine or grades 10 to 11.
Table 4Panel Data Fixed Effects Regression Resultsfor Enrollment Rates in Jamaica, 1992-2007
Primary Secondary Secondary
(7-9) (10-11)
Simple IV Simple IV Simple IV
panel panel panel
regression regression regression
growthpc -.12 -.058 .45 -1.26 -.31 .48
(.112) (.317) (.281) (.780) (.910) (2.596)
lgrowthpc .17* .26* -.42* .07 .47 1.89
(.102) (.159) (.256) (.438) (.830) (1.540)
dhhage -.00 -.00 .00 -.00 -.00 -.00
(.001) (.001) (.002) (.002) (.007) (.008)
dwhhsize -.00 -.00 -.00 .00 -.02 -.02
(.003) (.003) (.007) (.008) (.022) (.025)
dhhsex .00 .00 -.00 -.02 .32 .31
(.028) (.031) (.070) (.091) (.226) (.285)
dhhmarried -.00 -.00 -.09 -.06 -.35* -.37**
(.025) (.023) (.063) (.081) (.202) (.190)
dhhyearsedu- -.00 -.00 .00 .00 .02 .02
cation (.002) (.002) (.006) (.006) (.020) (.020)
dwpublic -.01 -.01 .08 .11 .47* .50*
school (.031) (.025) (.079) (.103) (.254) (.284)
Constant .00 .00 .00
(.001) (.004) (.012)
Observations 168 168 168 168 168 168
R-squared .038 .027 .052 .19 .10 .066
Number of 14 14 14 14 14 14
parish
Hansen 7.32 1.26 1.30
J-statistic

ECONOMIC CRISES, HEALTH AND EDUCATION IN JAMAICA 123
Table 4(continued)
Primary Secondary Secondary
(7-9) (10-11)
Simple IV Simple IV Simple IV
panel panel panel
regress. regress. regress.
Hansen .02 .53 .52
p-value
Weak iden- 8.04 8.04 8.04
tification
F-statistic
p-value 6.65e-06 6.65e-06 6.65e-06
underiden-
tification test
Note: Robust standard errors in parentheses; *** p<0.01, ** p<0.05,
* p<0.1; 1992 to 2007 excluding years 2003 and 2005.
However, the negative impact of the current growth rate dis-appears when the growth rate is instrumented by commodity prices.For primary school attendance, the coefficient estimate for the growthrate is 1.59 but it is not statistically different from zero. The same re-sult applies for other grades. On the other hand, the positive impactof the lagged growth rate is still significant in IV estimations.
Note that the coefficient estimates for the share of public schoolsis negatively correlated with attendance rates in many cases. That is,the share of public schools has a different impact on the enrollmentand attendance rates.
In short, the regression analysis reveals heterogeneous impactsof growth fluctuation on education indicators. Slow growth seems tolower the enrollment rate with a time lag in primary school, and thisimpact stays significant even when the endogeneity of the growth rateis controlled for by instrumental variables. On the other hand, thesecondary school enrollment rate increases with low growth in theprevious period, but this impact becomes not significant when thegrowth rate is instrumented. The attendance rate is strongly affectedby the growth rate. In particular, current recession increases theattendance rate. But this correlation becomes insignificant when thegrowth rate is instrumented. The positive impact of a lagged growth

124 ESTUDIOS ECONOMICOS
rate is significant, whether the endogeneity of growth is controlled foror not.
Table 5Panel Data Fixed Effects Regression Resultsfor Attendance Rates in Jamaica, 1992-2007
Primary Secondary Secondary
(7-9) (10-11)
Simple IV Simple IV Simple IV
panel panel panel
regression regression regression
growthpc -1.45*** 1.59 -1.48*** -.21 -1.93*** .55
(.506) (1.933) (.514) (1.914) (.574) (2.071)
lgrowthpc 1.40*** 1.66*** 1.44*** 1.83*** 1.77*** 2.32***
(.412) (.553) (.419) (.566) (.467) (.592)
dhhage .00** .01*** .01** .01** .01* .01**
(.004) (.004) (.004) (.004) (.004) (.004)
dwhhsize -.01 -.02* -.01 -.02* -.01 -.02
(.013) (.015) (.013) (.013) (.014) (.016)
dhhsex .33*** .34* .18 .18 .18 .18
(.120) (.199) (.122) (.124) (.136) (.197)
dhhmar- -.09 -.12 -.03 -.04 .08 .05
ried (.106) (.090) (.108) (.113) (.121) (.109)
dhhyears .00 .01 .01 .02* .00 .01
education (.011) (.014) (.011) (.011) (.012) (.015)
dwpublic -.25* -.25* -.31** -.30** -.32** -.32**
school (.137) (.147) (.140) (.128) (.156) (.151)
Constant -.00 -.00 -.00
(.007) (.007) (.008)
Obser. 140 140 140 140 140 140
R-squar. .023 .03 .22 .16 .23 .07
Num. of 14 14 14 14 14 14
parish
Hansen 13.45 13.61 9.92
J-statis.
Hansen .00120 .00111 .00701
p-value

ECONOMIC CRISES, HEALTH AND EDUCATION IN JAMAICA 125
Table 5(continued)
Primary Secondary Secondary
(7-9) (10-11)
Simple IV Simple IV Simple IV
panel panel panel
regress. regress. regress.
Weak iden- 4.05 4.05 4.05
tification
F-statistic
p-value .0144 .0144 .0144
underiden-
tification test
Note: Robust standard errors in parentheses; *** p<0.01, **
p<0.05, * p<0.1; 1992 to 2007 excluding years 2003 and 2005.
The evidence on the impact of the growth fluctuation on im-munization is also mixed. We use all the health and disease relatedindicators available in our data sets at the individual level.8 Table6 suggests that measles immunization is not affected by the growthrate. On BCG immunization, the growth rate in the current periodhas a negative impact on the share of children with immunization,while the lagged growth rate has a positive impact on the immuniza-tion. However, these impacts become statistically equal to zero whenthe growth rates are instrumented by commodity prices.
Among health indicators, the illness rate is weakly affected bythe growth rates, as shown in table 7. In the simple panel regressionwith fixed effect, the coefficient estimate for growth rate (growthpc)is negative and the one for lagged growth (lgrowthpc) is positive. Theresult is almost the same for the IV estimation with the coefficientestimate for the current growth rate being -1.51 and statistically sig-nificant.
Child diarrhea is affected only by the lagged growth rate. The co-efficient estimate for the growth rate is significant only for the lagged
8 Since our data sets are derived from the Living Standard Measurement Sur-veys, the information on disease and illness is more limited than the information
available in the Demographic and Health Surveys.

126 ESTUDIOS ECONOMICOS
growth in the IV estimation (1.24). There is no evidence that BMI isaffected by growth rates.
Table 6Panel Data Fixed Effects Regression Resultsfor Immunization in Jamaica, 1992-2007
Measles immunization BCG immunizationSimple IV Simple IVpanel panel
regression regressiongrowthpc -.39 3.47 -.98*** -.03
(.691) (2.159) (.331) (1.018)lgrowthpc .12 -.22 .55** .76
(.559) (1.086) (.268) (.539)dhhage .00 .00 -.00 -.00
(.005) (.005) (.002) (.002)dwhhsize -.01 -.01 .00 .00
(.017) (.017) (.008) (.007)dhhsex .19 .18 -.03 -.04
(.170) (.185) (.081) (.088)dhhmarried -.22 -.13 .05 .09
(.142) (.162) (.068) (.065)dhhyears -.01 -.01 -.01 -.00education (.015) (.018) (.007) (.008)Constant -.00 .00
(.009) (.004)Observations 196 196 196 196R-squared .034 .211 .065 .035
Number of parish 14 14 14 14Hansen J-statist. 1.613 4.24Hansen p-value .446 .120Weak Identifica. 11.74 11.74
F-statistic
p-value under 8.04e-05 8.04e-05
identifica. test
Note: Robust standard errors in parentheses; *** p<0.01, **
p<0.05, * p<0.1.
ECONOMIC CRISES, HEALTH AND EDUCATION IN JAMAICA 127
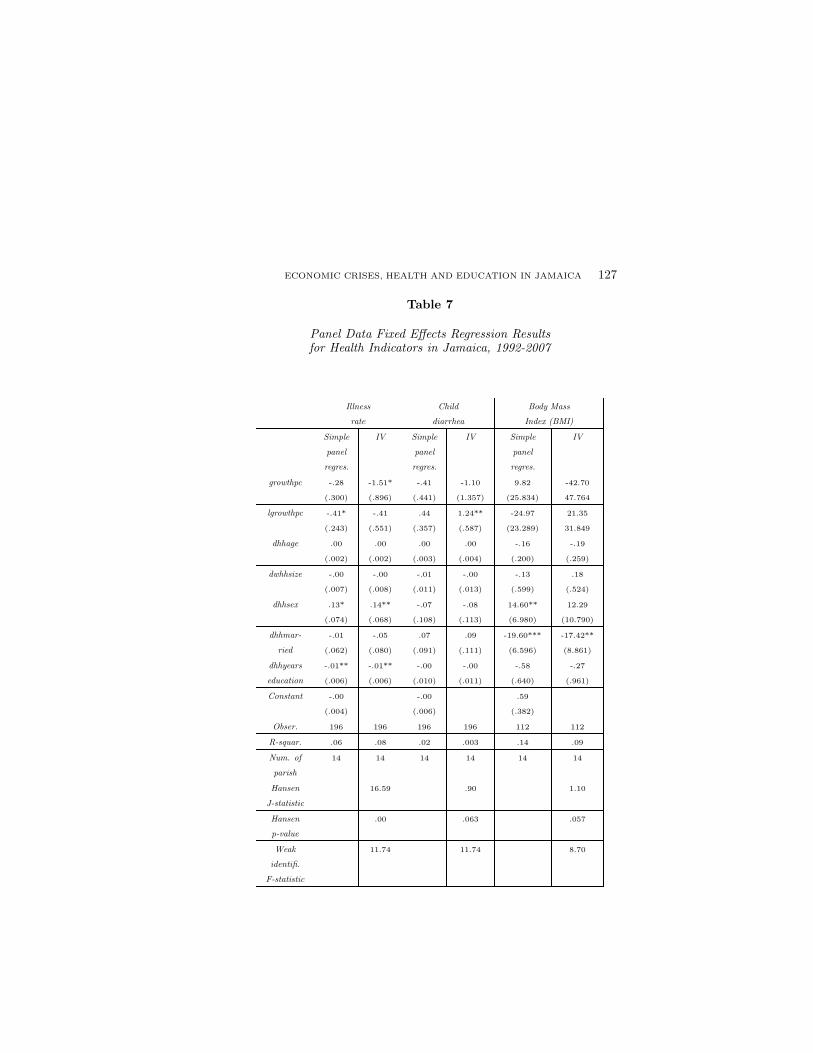
Table 7
Panel Data Fixed Effects Regression Resultsfor Health Indicators in Jamaica, 1992-2007
Illness Child Body Mass
rate diarrhea Index (BMI)
Simple IV Simple IV Simple IV
panel panel panel
regres. regres. regres.
growthpc -.28 -1.51* -.41 -1.10 9.82 -42.70
(.300) (.896) (.441) (1.357) (25.834) 47.764
lgrowthpc -.41* -.41 .44 1.24** -24.97 21.35
(.243) (.551) (.357) (.587) (23.289) 31.849
dhhage .00 .00 .00 .00 -.16 -.19
(.002) (.002) (.003) (.004) (.200) (.259)
dwhhsize -.00 -.00 -.01 -.00 -.13 .18
(.007) (.008) (.011) (.013) (.599) (.524)
dhhsex .13* .14** -.07 -.08 14.60** 12.29
(.074) (.068) (.108) (.113) (6.980) (10.790)
dhhmar- -.01 -.05 .07 .09 -19.60*** -17.42**
ried (.062) (.080) (.091) (.111) (6.596) (8.861)
dhhyears -.01** -.01** -.00 -.00 -.58 -.27
education (.006) (.006) (.010) (.011) (.640) (.961)
Constant -.00 -.00 .59
(.004) (.006) (.382)
Obser. 196 196 196 196 112 112
R-squar. .06 .08 .02 .003 .14 .09
Num. of 14 14 14 14 14 14
parish
Hansen 16.59 .90 1.10
J-statistic
Hansen .00 .063 .057
p-value
Weak 11.74 11.74 8.70
identifi.
F-statistic

128 ESTUDIOS ECONOMICOS
Table 7(continued)
Illness Child Body Mass
rate diarrhea Index (BMI)
Simple IV Simple IV Simple IV
panel panel panel
regres. regres. regres.
p-value 8.04e-05 8.04e-05 .000369
under
identifi. test
Note: Robust standard errors in parentheses; *** p<0.01, **
p<0.05, * p<0.1; years 1992 to 2007, except BMI which runs from
1990 to 2000, excluding 1998 and 1999.
The results on health indicators suggest that it is very challeng-ing to find the immediate link between economic growth and thehealth condition in statistical analyses. It is likely to be driven bythe institutional factors in the health service industry, and the policyresponses to reduce growth fluctuation. With this limitation, childdiarrhea and illness rates, two of the health indicators which are lesslikely to be policy-sensitive, are weakly affected by growth rates.
6. Conclusion
The main finding of the statistical analysis is that GDP fluctu-ation has mixed impacts on education and health in Jamaica. Eco-nomic slowdowns tend to decrease enrollment in primary schools, butincrease attendance for all grades, when the endogeneity of the growthrate is controlled for. Impacts on health indicators are also mixed, es-pecially for the indicators that are affected by government responses,such as vaccination. However, we found that illness rates and childdiarrhea rates increase during economic downturns.
Since the impact is not in one direction or of the same mag-nitude, policy responses to economic downturns should be carefullydesigned and packaged. For example, education policies should sus-tain both enrollment and attendance. In order to achieve this, notonly must the incentive to keep children in school increase by pro-viding government transfers, such as conditional cash transfer, but

ECONOMIC CRISES, HEALTH AND EDUCATION IN JAMAICA 129
the counter-incentive to send children to labor market must also de-crease by, for instance, regulation on child labor and minimum wagefor adults. Government policies on health service and programs willbe effective in the aggregate when the policies are targeted to specifichealth condition and packaged together.
References
Arbache, Jorge S. and John Page. 2007. More Growth or Fewer Collapses? ANew Look at Long Run Growth in Sub-Saharan Africa, World Bank PolicyResearch Working Paper, no. 4384, World Bank, Washington, DC.
Cutler, David, A. Deaton and A. Lleras-Muney. 2006. The Determinants ofMortality, Journal of Economic Perspectives, 20(3): 97-120.
Davis, Rae. 2004. Jamaica: A Transformed Education, unpublished draft by theTask Force on Educational Reform, Government of Jamaica.
Deaton, Angus. 2007. Height, Health, and Development, Proceedings of theNational Academy of Sciences, 104(33): 13232-13237.
——. 2006. Global Patterns of Income and Health: Facts, Interpretations, andPolicies, NBER Working Paper, no. 12735, National Bureau of EconomicResearch, Cambridge, MA.
Ferreira, Francisco and N. Schady. 2008. Aggregate Economic Shocks, ChildSchooling and Child Health, World Bank Policy Research Working Paper,no. 4701, World Bank, Washington, DC.
Granados, Jose, A. Tapia and E. L. Ionides. 2008. The Reversal of the RelationBetween Economic Growth and Health Progress: Sweden in the 19th and20th Centuries, Journal of Health Economics, 27(3): 544-563.
Gerdtham, Ulf-G. and Ch. J. Ruhm. 2006. Deaths Rise in Good EconomicTimes: Evidence from the OECD, Economics & Human Biology, 4(3): 298-316.
Handa, Sudhanshu. 2004. Poverty and Social Development in Jamaica, inThomas Desmond (ed.), Revitalizing the Jamaican Economy: Policies forSustained Growth, Inter-American Development Bank, Washington, DC.
——. 2000. Mortality, Fertility, and Recent Fertility in Jamaica, World Devel-opment, 28(1): 173-186.
International Monetary Fund (IMF). 2009. World Economic Outlook, April Up-date, Washington, DC.

130 ESTUDIOS ECONOMICOS
——. 2010. IMF commodity prices online data, http://www.imf.org/external/np/res/commod/index.asp
Jamison, Eliot A., D. T. Jamison and E. A. Hanushek. 2007. The Effects ofEducation Quality on Income Growth and Mortality Decline, Economics ofEducation Review, 26(6): 771-788.
Kirkpatrick, Colin and D. Tennant. 2002. Crisis in Jamaica: Has the Cost BeenExcessive? ID21, Institute of Development Studies, University of Sussex,Insights Issue, no. 40.
McKenzie, David, 2003. How do Households Cope with Aggregate Shocks? Evi-dence from the Mexican Peso Crisis, World Development, 31(7): 1179-1199.
Pan American Health Organization (PAHO). 2007. Health in the Americas, vol.II, Washington, DC.
Preston, Samuel, H. 2007. The Changing Relation between Mortality and Levelof Economic Development, International Journal of Epidemiology, 36(3):484-490.
Ranis, Gustav and F. Stewart. 2005. Dynamic Links between the Economy andHuman Development, DESA Working Paper, no. 8, United Nations, NewYork.
Planning Institute of Jamaica (PIOJ). 2010. Jamaican Survey of Living Condi-tions, various years, Kingston, Jamaica.
Schultz, T. Paul. 2004. School Subsidies for the Poor: Evaluating the MexicanProgresa Poverty Program, Journal of Development Economics, 74(1): 199-
250.Stock, James H. and M. Yogo. 2002. Testing for Weak Instruments in Linear IV
Regression, NBER Technical Working Papers, no. 0284, Cambridge.STATIN. 2009. Statistical surveys, online information available at: http:// stat-
inja.gov.jm/Thomas, Desmond (ed.). 2004. Revitalizing the Jamaican Economy: Policies
for Sustained Growth, Inter-American Development Bank, Washington, DC.United Nations. 2009. The Millennium Development Goals Report, New York.——. 2010. Millennium Development Goals, http://www.undp.org/mdg/Wooldridge, Jeffrey. 2002. Econometric Analysis of Cross Section and Panel
Data, Cambridge, MIT Press.World Bank. 2009a. World Development Indicators, Washington, DC.——. 2009b. Averting a Human Crisis during the Global Downturn: Policy
Options from the World Bank’s Human Development Network, Washington,DC.
——. 2004. The Road to Sustained Growth in Jamaica, Washington, DC.——. 2002. Jamaica Survey of Living Conditions 1988-2000, Washington, DC.

ECONOMIC CRISES, HEALTH AND EDUCATION IN JAMAICA 131
Appendix A. Derivation of the Reduced Estimation Form
In this appendix, we describe the model and econometric approachaimed at estimating the effect of income and income shocks on hu-man development indicators, in particular, health and education in-dicators. These indicators will be denoted throughout as hjt and ejt,where j is the subindex for a group (region or parish) and t is thesubindex for time.
We start with a simplified model of decision-making at the house-hold level, which relates health and education decisions to income.We then aggregate it to the group level and specify a reduced-formequation, which can be estimated.
In every moment t, the population is divided into J groups, in-dexed by j. Each of these groups contains N households, indexedby i. Each household maximizes utility, Uit, subject to its budgetconstraint. This implies,
Max(xit)Uit subject to yit ≤ cit
where xit are the decision variables of the household, yit the currentincome of the household and cit the household’s current expenditure.Among its several decision variables (xit), we study education andhealth choices for the children in the household. Thus, we can writeeit and hit as follows
eit = f(yit, zit)
hit = g(yit, zit)
where zit is a vector of individual characteristics (for example, house-hold size, age of the household head, etc.). We construct mean edu-cation indicators at the group level, that is:
ejt = F (yit, zit)
The aggregate function F can depend in many ways on incomeand other individual characteristics. In order to estimate such a re-lationship, we need to make strong simplifying assumptions. In thisstudy, we will assume that mean income and the mean of other indi-vidual characteristics characterize the relationship with mean educa-tion (or health) indicators fully.9 Thus, we can write mean educationas
9 One could also add their standard deviations. This is left for future analyses.

132 ESTUDIOS ECONOMICOS
ejt = F (yjt, zjt)
Using a first order Taylor expansion we obtain,
ejt − ejt−1∼= β1(yjt − yjt−1) + β2(zjt − zjt−1)
where β1 corresponds to the partial derivative of F with respect to y,and all other β2 are defined analogously.
The equation to be estimated can therefore be written as follows,
ejt − ejt−1 = β0 + β1(yjt − yjt−1) + β2(zjt − zjt−1) + εjt − εjt−1
Or equivalently,
∆ejt = β0 + β1∆yjt + β2∆zjt + ∆εjt (1)
This specification allows us to estimate the impact of incomechanges on education changes.
Since we have the same group j over a period of T years, wecan exploit this feature of the data and use panel data methods. Inour study, groups will refer to regions of Jamaica. In particular, wewill consider two levels of aggregation: First, the sampling region,which is a group measure created by Statistical Institute of Jamaica(STATIN) to create groups of the sample which have approximatelyequal numbers of dwellings and are composed of homogeneous units(World Bank, 2002); Second, the parish level (there are 14 parishes).10
The group of individual characteristics contains both observablecharacteristics, collected in the SLC, and unobservable characteristics(such as child’s ability). Due to the fact that we are taking firstdifferences, if the unobservable characteristics are time-invariant, theomitted variable bias would not be of much concern.
Further, since the groups were not randomly sampled, but cor-respond to different areas of Jamaica, the most appropriate approachis potentially to use fixed effects estimators, taking individual charac-teristics of each region as fixed (Wooldridge, 2002). To estimate fixedeffects consistently we need to assume that the idiosyncratic errorterms, ∆εjt are uncorrelated to the regressors.
10 A third level of aggregation could be the three main areas of Jamaica:Kingston Metropolitan Area (KMA), other urban areas and rural areas. However,this makes N small, and the asymptotic properties of the panel data estimators
cannot hold (Wooldridge, 2002: 250).

ECONOMIC CRISES, HEALTH AND EDUCATION IN JAMAICA 133
This implies,
E(∆εjt|∆yjt) = 0 for t = 1, ..., T
E(∆εjt|∆zjt) = 0 for t = 1, ..., T
Another important assumption is that there is no measurementerror in the variables used for the econometric analysis. This assump-tion is very difficult to satisfy given the quality of the data available.
Appendix B. Data Source of Export Commodity Prices
Bananas
– Definition: Bananas, average of Chiquita, Del Monte, Dole, andUS Gulf delivery,
– Unit: US dollars per metric ton,– Deflated: No,– Nature: Data in monthly prices. Simple average is constructed for
each year,– Source: IMF commodity prices online data, http://www.imf.org
/external/np/res/commod/index.asp.
Sugar
– Definition: Sugar, US, import price contract number 14 cif,– Unit: US cents per pound,– Deflated: No,– Nature: Data in monthly prices. Simple average is constructed for
each year,– Source: IMF commodity prices online data, http://www.imf.org
/external/np/res/commod/index.asp.

134 ESTUDIOS ECONOMICOS
Bauxite
– Definition: Bauxite unit value data in dollars per metric ton (t)are the average US import price of bauxite, port of shipment, freealongside ship (FAS),
– Unit: US dollars per metric ton,– Deflated: Yes, 98US$,– Nature: data are in yearly prices,– Source: US Geological Survey. In particular, data are from the Min-
erals Yearbook and the Mineral Resources of the United States.
Alumina
– Definition: Alumina unit value data are the average US importprice of calcined alumina, port of shipment, FAS,
– Unit: US dollars per metric ton,– Deflated: Yes, 98US$,– Nature: data are in yearly prices,– Source: US Geological Survey, in particular, data are from the Min-
erals Yearbook and the Mineral Resources of the United States.
For our analysis, two transformations are done:
– All US$ are deflated, with the same base year, 2000 (base year forJamaica CPI as well) and the same units US$ per metric ton.
– All US$ are converted to J$.
Related Documents