Top Banner
A Fine-Scale Study of the 16 June 2009 Thunderstorm Event at Deseret Ranch Max Goldfarb and Shannon Ogle Florida Institute of Technology Department of Marine and Environmental Sciences
21

Compare model radar reflectivity patterns to observed radar images for Melbourne as well as model surface temperature Analyze fine scale Temperature.

Dec 17, 2015

Download

Documents

Welcome message from author
This document is posted to help you gain knowledge. Please leave a comment to let me know what you think about it! Share it to your friends and learn new things together.
Transcript
Page 1: Compare model radar reflectivity patterns to observed radar images for Melbourne as well as model surface temperature  Analyze fine scale Temperature.

A Fine-Scale Study of the 16 June 2009

Thunderstorm Event at Deseret

Ranch Max Goldfarb and Shannon

Ogle Florida Institute of Technology

Department of Marine and Environmental Sciences

Page 2: Compare model radar reflectivity patterns to observed radar images for Melbourne as well as model surface temperature  Analyze fine scale Temperature.

Compare model radar reflectivity patterns to observed radar images for Melbourne as well as model surface temperature

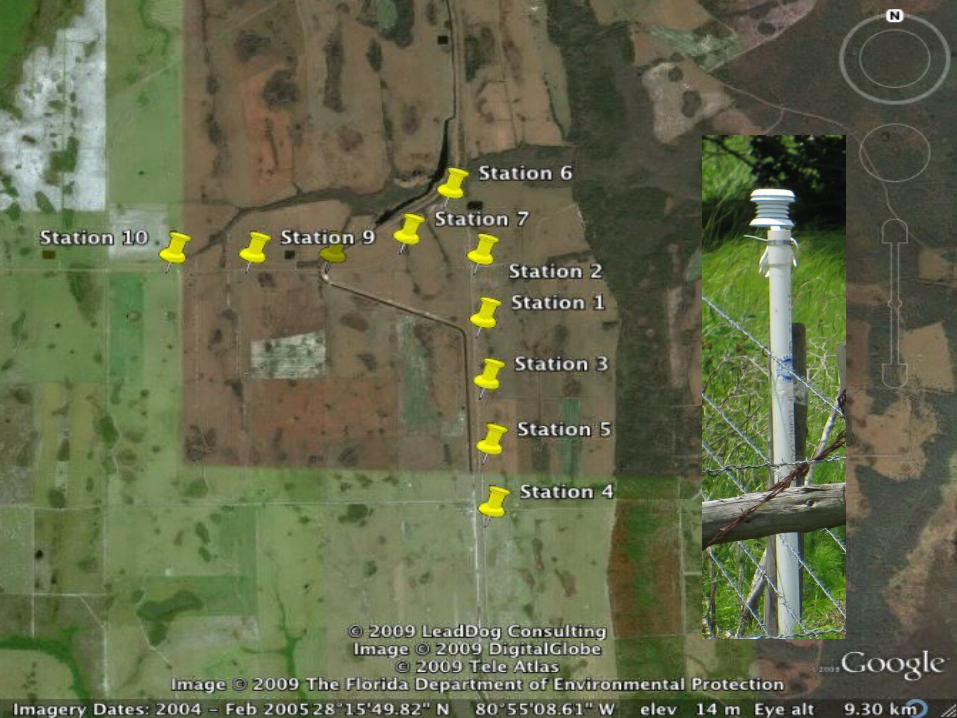
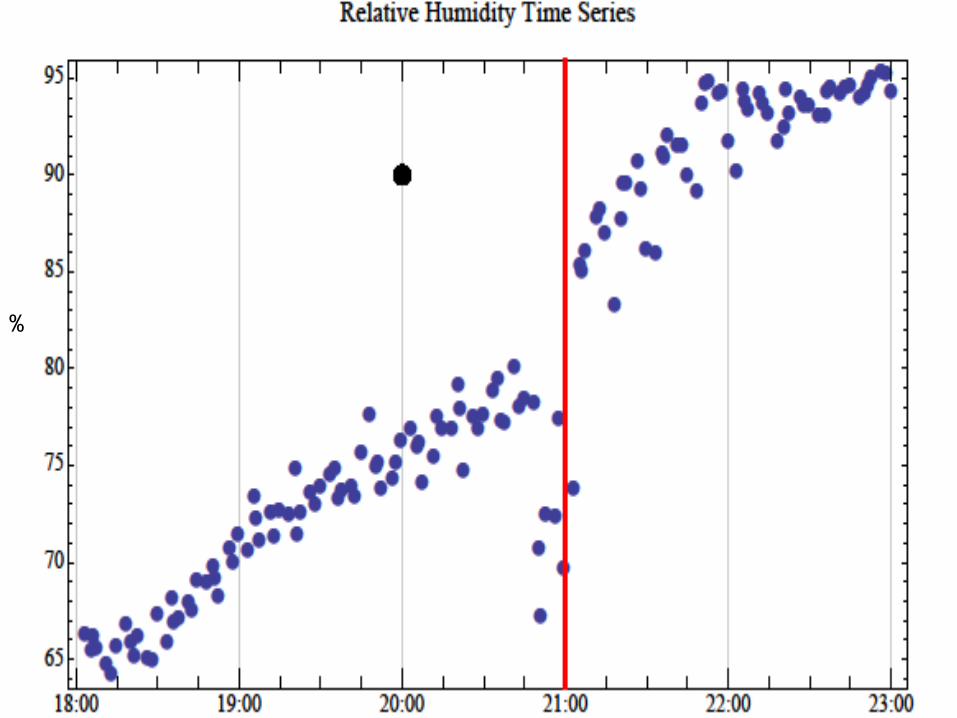
Analyze fine scale Temperature and Relative Humidity Data for June 16, 2009 at Deseret Ranch

Evaluate model forecasts and radar reflectivity to sensor data

Investigate possible heat burst activity and compare with past studies

Objectives:

Page 3: Compare model radar reflectivity patterns to observed radar images for Melbourne as well as model surface temperature  Analyze fine scale Temperature.

Atmospheric phenomena occur on many different spatial scales: from 1000 kilometers to 100 meters.

Page 4: Compare model radar reflectivity patterns to observed radar images for Melbourne as well as model surface temperature  Analyze fine scale Temperature.

Introduction

Page 5: Compare model radar reflectivity patterns to observed radar images for Melbourne as well as model surface temperature  Analyze fine scale Temperature.

Water Vapor Satellite Image

Page 6: Compare model radar reflectivity patterns to observed radar images for Melbourne as well as model surface temperature  Analyze fine scale Temperature.

CAPE

Page 7: Compare model radar reflectivity patterns to observed radar images for Melbourne as well as model surface temperature  Analyze fine scale Temperature.
Page 8: Compare model radar reflectivity patterns to observed radar images for Melbourne as well as model surface temperature  Analyze fine scale Temperature.

North American Mesoscale Surface Temperature Model

Page 9: Compare model radar reflectivity patterns to observed radar images for Melbourne as well as model surface temperature  Analyze fine scale Temperature.
Page 10: Compare model radar reflectivity patterns to observed radar images for Melbourne as well as model surface temperature  Analyze fine scale Temperature.
Page 11: Compare model radar reflectivity patterns to observed radar images for Melbourne as well as model surface temperature  Analyze fine scale Temperature.

%oF

Page 12: Compare model radar reflectivity patterns to observed radar images for Melbourne as well as model surface temperature  Analyze fine scale Temperature.

ᵒF%

Page 13: Compare model radar reflectivity patterns to observed radar images for Melbourne as well as model surface temperature  Analyze fine scale Temperature.

Within the downdraft of a storm, circulations on different scales occur as well.

Page 14: Compare model radar reflectivity patterns to observed radar images for Melbourne as well as model surface temperature  Analyze fine scale Temperature.

Heat Burst Formation:

Page 15: Compare model radar reflectivity patterns to observed radar images for Melbourne as well as model surface temperature  Analyze fine scale Temperature.

• Past Studies (Johnson, 1976):

* Temperature increase of 2.6oC*Soundings indicated warming and drying below 3 km (~700mb) *Occurred during dissipating stage of thunderstorm and in the evening

• Effects of Heat Bursts:

*Sudden increase of temperature with a thunderstorm*Associated with strong damaging winds*Sometimes falsely attributed to tornado damage*Possible danger to crops

Page 16: Compare model radar reflectivity patterns to observed radar images for Melbourne as well as model surface temperature  Analyze fine scale Temperature.
Page 17: Compare model radar reflectivity patterns to observed radar images for Melbourne as well as model surface temperature  Analyze fine scale Temperature.

2D Model of a Downdraft

Page 18: Compare model radar reflectivity patterns to observed radar images for Melbourne as well as model surface temperature  Analyze fine scale Temperature.

Fine scale temperature network captured activity not resolvable by a mesoscale model

Because of the sparse distribution of data, heat bursts may occur more often in central Florida.

HOBO sensors can fill in the gaps in observing networks and capture important phenomena

Conclusion:

Page 19: Compare model radar reflectivity patterns to observed radar images for Melbourne as well as model surface temperature  Analyze fine scale Temperature.

AcknowledgementsSpecial Thanks to:

Dr. Chiao Dr. Johnson Dr. Lazarus Mr. SplittFlorida Tech DMES Students

Page 20: Compare model radar reflectivity patterns to observed radar images for Melbourne as well as model surface temperature  Analyze fine scale Temperature.

Johnson, B. “The Heat Burst of 29 May 1979”. Journal of Atmospheric Sciences. May 20, 1983

Michaelsen, Joel. Geology 110: Imtroductory Meteoorlogy lecture notes, Winter 2008. http://www.geog.ucsb.edu/~joel/g110_w08/lecture_notes/ Checked 7/20/2009.

References:

Page 21: Compare model radar reflectivity patterns to observed radar images for Melbourne as well as model surface temperature  Analyze fine scale Temperature.

Questions?

Next:Erin Binder and Clemens Grohs