© Center for Tax and Budget Accountability 200 1 CENTER FOR TAX AND BUDGET ACCOUNTABILITY 70 E. Lake Street Suite 1700 Chicago, Illinois 60601 direct: 312.332.1049 Email: [email protected] 2008 Legal Aid Conference For: Thursday, November 13, 2008; 1:30 pm Renaissance Chicago Hotel 1 West Wacker Drive Chicago, IL Presented by: Ralph Martire Executive Director

Welcome message from author
This document is posted to help you gain knowledge. Please leave a comment to let me know what you think about it! Share it to your friends and learn new things together.
Transcript

© Center for Tax and Budget Accountability 2008
1
CENTER FOR TAX AND BUDGET ACCOUNTABILITY70 E. Lake Street Suite 1700 Chicago, Illinois 60601 direct: 312.332.1049 Email: [email protected]
2008 Legal Aid Conference
For: Thursday, November 13, 2008; 1:30 pm
Renaissance Chicago Hotel1 West Wacker Drive
Chicago, IL
Presented by:Ralph MartireExecutive Director
© Center for Tax and Budget Accountability 2008
2
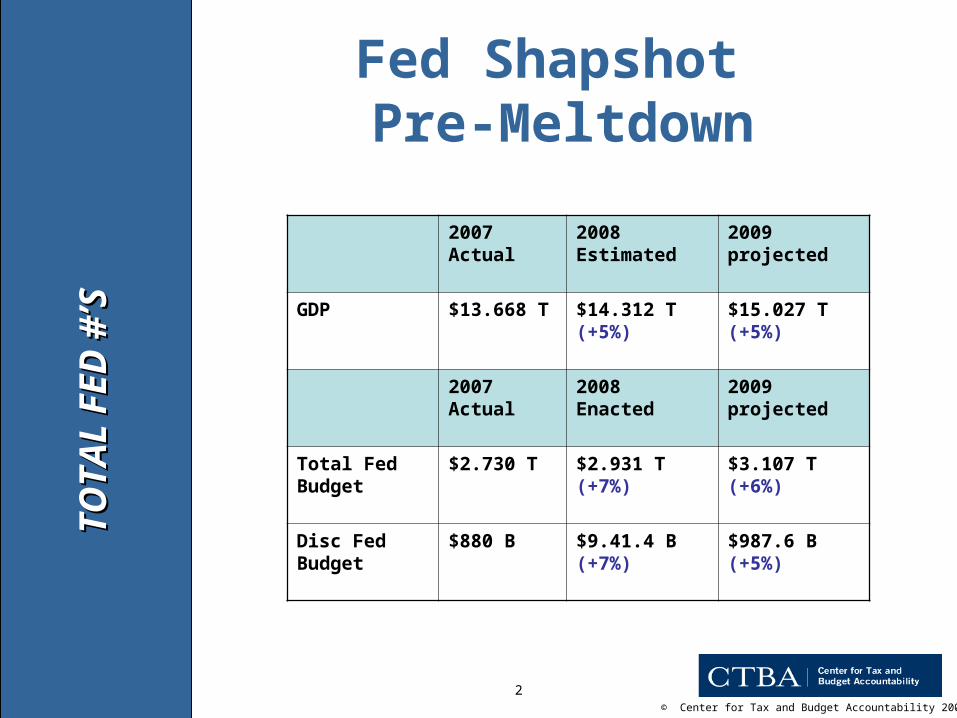
Fed Shapshot Pre-Meltdown
TO
TA
L F
ED
#’S
TO
TA
L F
ED
#’S
2007 Actual
2008 Estimated
2009 projected
GDP $13.668 T $14.312 T(+5%)
$15.027 T (+5%)
2007 Actual
2008 Enacted
2009 projected
Total Fed Budget
$2.730 T $2.931 T (+7%)
$3.107 T (+6%)
Disc Fed Budget
$880 B $9.41.4 B (+7%)
$987.6 B (+5%)
© Center for Tax and Budget Accountability 2008
3
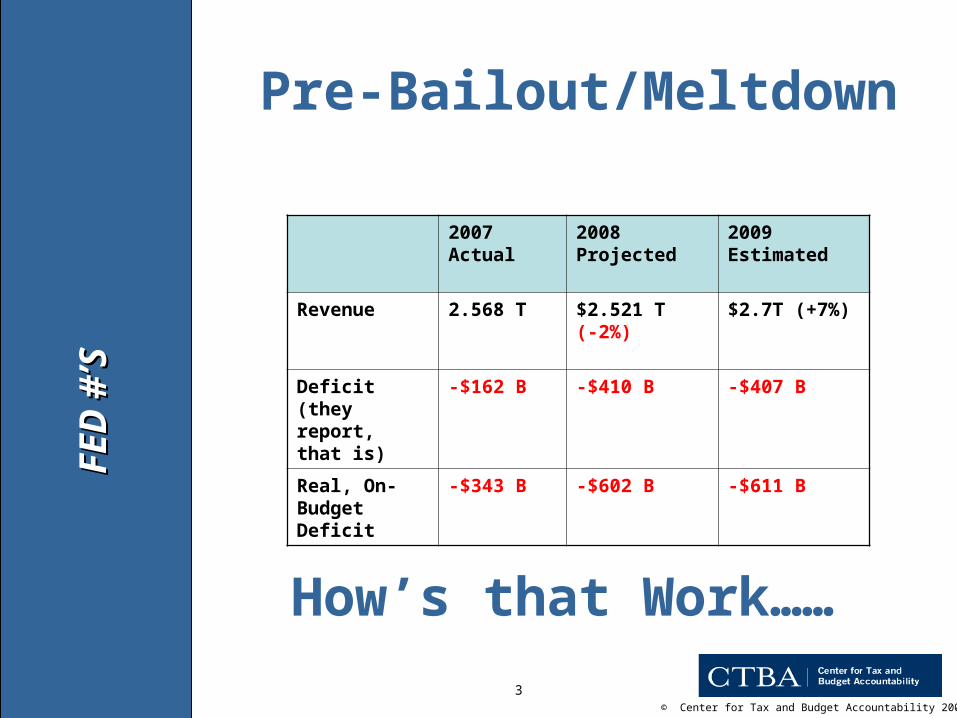
Pre-Bailout/Meltdown
2007 Actual
2008 Projected
2009 Estimated
Revenue 2.568 T $2.521 T(-2%)
$2.7T (+7%)
Deficit (they report, that is)
-$162 B -$410 B -$407 B
Real, On-Budget Deficit
-$343 B -$602 B -$611 BFE
D #
’SF
ED
#’S
How’s that Work……
© Center for Tax and Budget Accountability 2008
4
2007 Actual
2008 Enacted
2009 Requested/projected
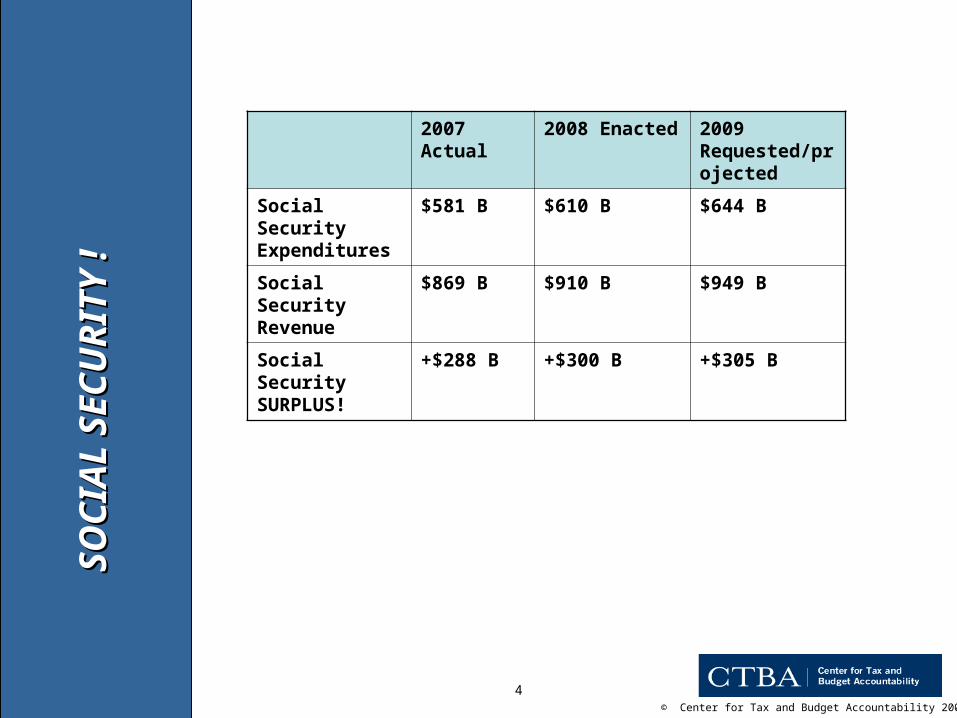
Social Security Expenditures
$581 B $610 B $644 B
Social Security Revenue
$869 B $910 B $949 B
Social Security SURPLUS!
+$288 B +$300 B +$305 B
SO
CIA
L S
EC
UR
ITY
!S
OC
IAL
SE
CU
RIT
Y !

© Center for Tax and Budget Accountability 2008
5
2007 Actual
2008 Enacted
2009 Requested
Medicare $371 B $391 B $408 B
Medicaid + SCHIP
$197 B $211 B $224 B
Interest on Fed Debt
$237 B $244 B $260 B
TOTAL FED DEBT
$8.966 T $9.629 T $10.388 T
OT
HE
R M
AN
DA
TO
RY
O
TH
ER
MA
ND
AT
OR
Y
BU
DG
ET
IT
EM
S O
F N
OT
EB
UD
GE
T I
TE
MS
OF
NO
TE

© Center for Tax and Budget Accountability 2008
6
2007 Actual
2008 Enacted 2009 Requested
TOTAL $880 B $941.4 B (+7%)
$987.6 (+5%)
Defense + HLS
$441.4 B (50.2%)
$514.4 B (+17%) (55%)
$553 B (+8%) (56%)
Education $54.4 B $57.2 B $59.2 B
HHS $69.1 B $71.9 B $70.4 B
HUD $33.6 B $37.4 B $38.5 B
EPA $7.3 B $7.5 B $7.1 B
Priorities? $164.4 B (18.6%)
$174 B (+5%) (18.4%)
$175.2 B (.6%) (17.7%)
DIS
C. B
RE
AK
DO
WN
DIS
C. B
RE
AK
DO
WN
© Center for Tax and Budget Accountability 2008
7
2007 Actual
2008 Enacted
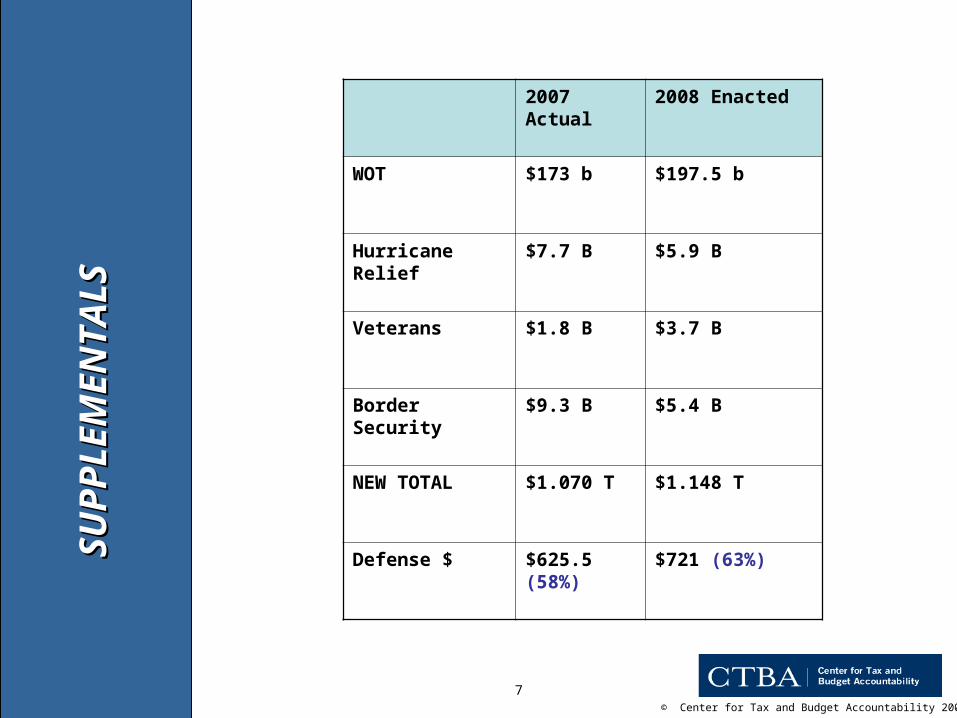
WOT $173 b $197.5 b
Hurricane Relief
$7.7 B $5.9 B
Veterans $1.8 B $3.7 B
Border Security
$9.3 B $5.4 B
NEW TOTAL $1.070 T $1.148 T
Defense $ $625.5 (58%)
$721 (63%)SU
PP
LE
ME
NT
AL
SS
UP
PL
EM
EN
TA
LS

© Center for Tax and Budget Accountability 2008
8
BIG ‘N RICH
• In 2007, Illinois ranked fifth nationally with a Gross State Product in excess of $609 billion.
• That would be the 27th largest economy of any nation in the world-greater than Egypt, Saudi Arabia, Colombia, Belgium, Sweden, Greece, Ireland, Portugal, Norway and Nigeria, to name a few.
ILL
INO
IS’
EC
ON
OM
Y
ILL
INO
IS’
EC
ON
OM
Y
IS L
AR
GE
IS L
AR
GE

© Center for Tax and Budget Accountability 2008
9
Illinois GDP Growth Lags
TH
E I
LL
INO
IS E
CO
NO
MY
TH
E I
LL
INO
IS E
CO
NO
MY
71.7%
49.4% 48.1%
0.0%
10.0%
20.0%
30.0%
40.0%
50.0%
60.0%
70.0%
80.0%
US Midwest States Illinois
But, IL Gross State Product Grew Less than U.S. or Midwest States, 1990-2007
Source: Bureau of Economic Analysis, US Dept. of Commerce
© Center for Tax and Budget Accountability 2008
10
• Between 1990 and 2008, Illinois lost 27% - 249,000 - of its manufacturing industry jobs.
• This loss was worse than both the Midwest (-23.2%) and the Nation (-23.9%).
MA
NU
FA
CT
UR
ING
M
AN
UF
AC
TU
RIN
G
DE
CL
INE
DE
CL
INE
© Center for Tax and Budget Accountability 2008
11
All job growth in Illinois came in the service sector.
For the most part, service sector jobs that pay less than manufacturing
On average, most of these service jobs pay 29% less than the manufacturing jobs they replace
LO
W-E
ND
SE
RV
ICE
LO
W-E
ND
SE
RV
ICE
JOB
S G
RO
WJO
BS
GR
OW
In Fact…

© Center for Tax and Budget Accountability 2008
12
This Transition has been Dramatic
CH
AN
GIN
G
CH
AN
GIN
G
EM
PL
OY
ME
NT
E
MP
LO
YM
EN
T
PA
TT
ER
NS
PA
TT
ER
NS
In 1990, Manufacturing in Illinois employed more workers than any other sector, 20.4%.
By 2007, only 13.1% of the state’s workers were employed in Manufacturing―while low wage service sectors accounted for over 31% of all jobs.
© Center for Tax and Budget Accountability 2008
13
EM
PL
OY
ER
-PR
OV
IDE
D
EM
PL
OY
ER
-PR
OV
IDE
D
BE
NE
FIT
SB
EN
EF
ITS
Employer-provided health insurance benefits have been steadily declining in Illinois since 1980.
By 2006, over 40% of the workforce didn’t have employer provided insurance
Hispanics especially hard hit–over 57% do not have employer-provided insurance
TODAY, 27% of the Illinois population is either on Medicaid or uninsured

© Center for Tax and Budget Accountability 2008
14
• In 1981, 55.6% of the state’s workers were covered by private sector employer-provided pension plans.
• By 2007, only 43.8% of the workforce had private retirement benefits.
PE
NS
ION
ER
OS
ION
PE
NS
ION
ER
OS
ION

© Center for Tax and Budget Accountability 2008
15
• Why the Economic Problems?– NOT TAX BURDEN OR WASTEFUL
SPENDING
• Illinois’ total state AND local tax burden, as a percentage of personal income ranks only 45th in the nation.
• The second lowest tax burden in the Midwest to Missouri (Missouri is all of one-tenth of one percent lower).
• Illinois also ranks only 42nd in spending among the statesIL
LIN
OIS
IS
LO
W T
AX
IL
LIN
OIS
IS
LO
W T
AX
O
VE
RA
LL
OV
ER
AL
L

© Center for Tax and Budget Accountability 2008
16
Education now matters more than ever to economic prosperity:
unemployment rates are highest
for those with the least education. Wages are also tied to education levels.
EX
HIB
IT “
A”
IS E
DU
CA
TIO
NE
XH
IBIT
“A
” IS
ED
UC
AT
ION

© Center for Tax and Budget Accountability 2008
17
Impact of Education on Wages
In real (2006) dollars, between 1980 and 2006, only those with at least a college degree experienced any gain in hourly income, with growth of 14.3%
Real median hourly wages for all other education categories declinedLess than a high school diploma fell by 28.7%Only a high school education declined 8.7%Some college but no degree declined 4.3%You gotta learn to earn!
WA
GE
DIF
FE
RE
NC
ES
WA
GE
DIF
FE
RE
NC
ES
© Center for Tax and Budget Accountability 2008
18
Wages for Minorities lag Whites
Real wages for Whites increased modestly between 1980 and 2007, but :
The White-Hispanic wage gap is larger in amount, but increased by a smaller percentage, growing from $3.82 in 1980 to $5.34 in 2007, an increase of 39.7% over 1980
Real wages for African-Americans declined. The hourly wage gap between Whites and African-Americans grew from $1.52 in 1980 to $3.44 in 2007, an increase of 126.3% over 1980
WA
GE
DIF
FE
RE
NC
ES
WA
GE
DIF
FE
RE
NC
ES

© Center for Tax and Budget Accountability 2008
19
Still Separate. . . . Illinois is the third most
segregated state in K-12 education for blacks
82% of black children attend majority/minority schools
90% of white children attend virtually all white schools
(*Source: 2006 Education Trust study on segregation)
SE
GR
EG
AT
ION
SE
GR
EG
AT
ION
© Center for Tax and Budget Accountability 2008
20
. . . . Still UnequalMinority school districts
start out with $1,154 less per child to spend on education
That’s the second worst gap in the nation
(*Source: 2006 Education Trust study on segregation)
SE
GR
EG
AT
ION
SE
GR
EG
AT
ION
© Center for Tax and Budget Accountability 2008
21
Current Basis for Foundation Level
• The Illinois state “Foundation Level” is the minimum per child guaranteed expenditure for K-12
• Does NOT include: poverty, special ed, transportation, etc.
• Currently $5,734 – but not tied to any measurable standard
K-1
2 F
UN
DIN
GK
-12
FU
ND
ING
© Center for Tax and Budget Accountability 2008
22
Education Funding Advisory Board
(“EFAB”)
• Change basis to a measurable outcome standard, predicated on costs and test results
• Foundation Level should be at least $7,191 (after adjusting for inflation)
• Total cost: $1.8 billion
EF
AB
EF
AB

© Center for Tax and Budget Accountability 2008
23
• Based upon the ability to pay Foundation Level with property tax revenue, school districts are divided into three groups.
• Flat Grant: districts whose property tax revenue exceeds 175% of the Foundation level of funding. Just over four percent of all Illinois districts, educating about 4.5% of all students, fall into this funding category.
• Alternative: districts whose property tax revenue funds between 93 and 175% of the Foundation level of funding. Fifteen percent of all districts, or 18% of all students, fall into this funding system.
• Foundation: Districts whose property tax revenue is able to fund 93% or less of the Foundation Level. Eighty-one percent of all districts, or 77% of all students, fall into this funding category.
FU
ND
ING
SY
ST
EM
DE
FIN
ITIO
NS
FU
ND
ING
SY
ST
EM
DE
FIN
ITIO
NS

© Center for Tax and Budget Accountability 2008
24
42.12%
2.84%
17.41%
0.83%
0.00%
5.00%
10.00%
15.00%
20.00%
25.00%
30.00%
35.00%
40.00%
45.00%
1990-2005 2000-2005
Illinois Total Property Tax Revenue Growth Vs. State Median Income Growth
Total Property TaxRevenue Growth
State Median IncomeGrowth
TH
E B
UR
DE
N I
S T
OU
GH
TH
E B
UR
DE
N I
S T
OU
GH
All data inflation adjusted to 2008
Income Data: US Department of Census
Property Tax Data: IL Department of Revenue

© Center for Tax and Budget Accountability 2008
25
83.25%75.58%
45.66%
0%
10%
20%
30%
40%
50%
60%
70%
80%
90%
Property Taxes as a Percentage of District
Revenue
Flat Grant
Alternative Formula
Foundation Formula
Foundation formula districts receive significantly less than the amount received by flat grant and alternative formula districts in property tax revenue, meaning they rely far more heavily on state support. http://www.isbe.net – “2007 IL Report Card”
PR
OP
ER
TY
TA
XE
SP
RO
PE
RT
Y T
AX
ES
© Center for Tax and Budget Accountability 2008
26
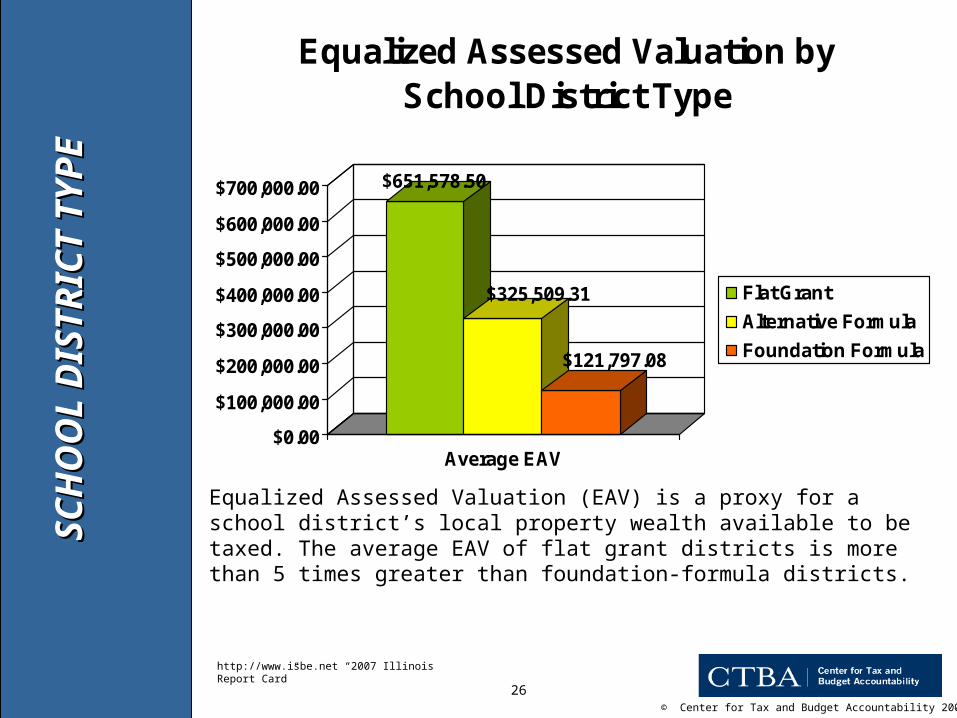
$651,578.50
$325,509.31
$121,797.08
$0.00
$100,000.00
$200,000.00
$300,000.00
$400,000.00
$500,000.00
$600,000.00
$700,000.00
Average EAV
Equalized Assessed Valuation by School District Type
Flat Grant
Alternative Formula
Foundation Formula
Equalized Assessed Valuation (EAV) is a proxy for a school district’s local property wealth available to be taxed. The average EAV of flat grant districts is more than 5 times greater than foundation-formula districts.S
CH
OO
L D
IST
RIC
T T
YP
ES
CH
OO
L D
IST
RIC
T T
YP
E
http://www.isbe.net “2007 Illinois Report Card”
© Center for Tax and Budget Accountability 2008
27
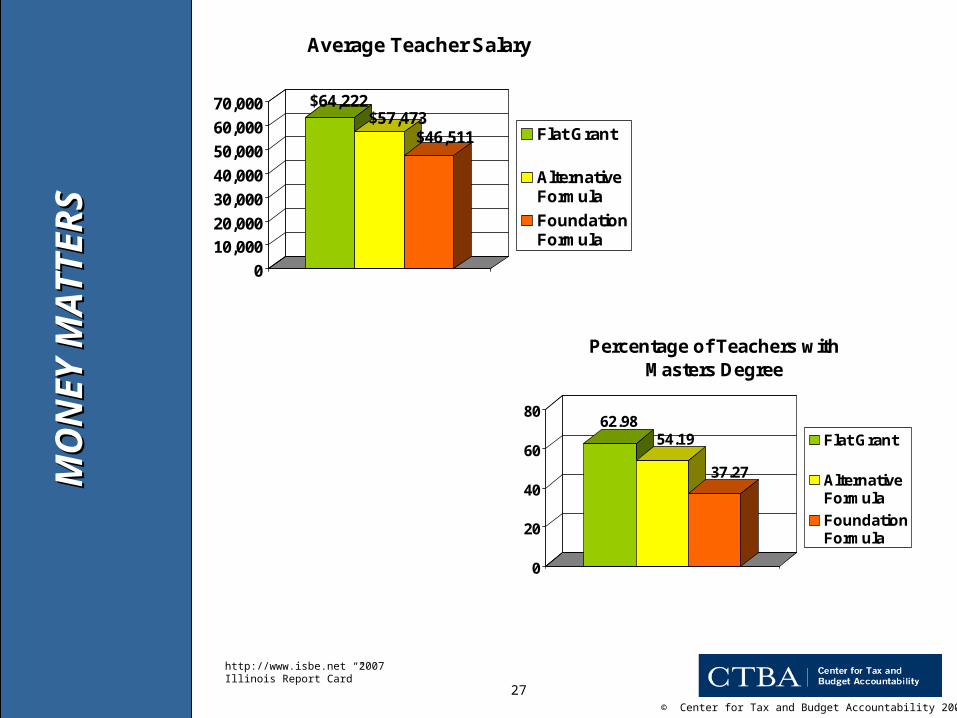
$64,222$57,473
$46,511
0
10,000
20,000
30,000
40,000
50,000
60,000
70,000
Average Teacher Salary
Flat Grant
AlternativeFormula
FoundationFormula
62.9854.19
37.27
0
20
40
60
80
Percentage of Teachers with Masters Degree
Flat Grant
AlternativeFormula
FoundationFormula
MO
NE
Y M
AT
TE
RS
MO
NE
Y M
AT
TE
RS
http://www.isbe.net “2007 Illinois Report Card”

© Center for Tax and Budget Accountability 2008
28
MO
NE
Y M
AT
TE
RS
MO
NE
Y M
AT
TE
RS
http://www.isbe.net “2006 Illinois Report Card”
90%86%
80%90% 87%
80%
0%10%20%30%40%50%60%70%80%90%
100%
Reading Math
Percentage of students meeting or exceeding ISAT Standards (Grade 8, 2006)
Flat Grant
Alternative Formula
Foundation Formula
© Center for Tax and Budget Accountability 2008
29
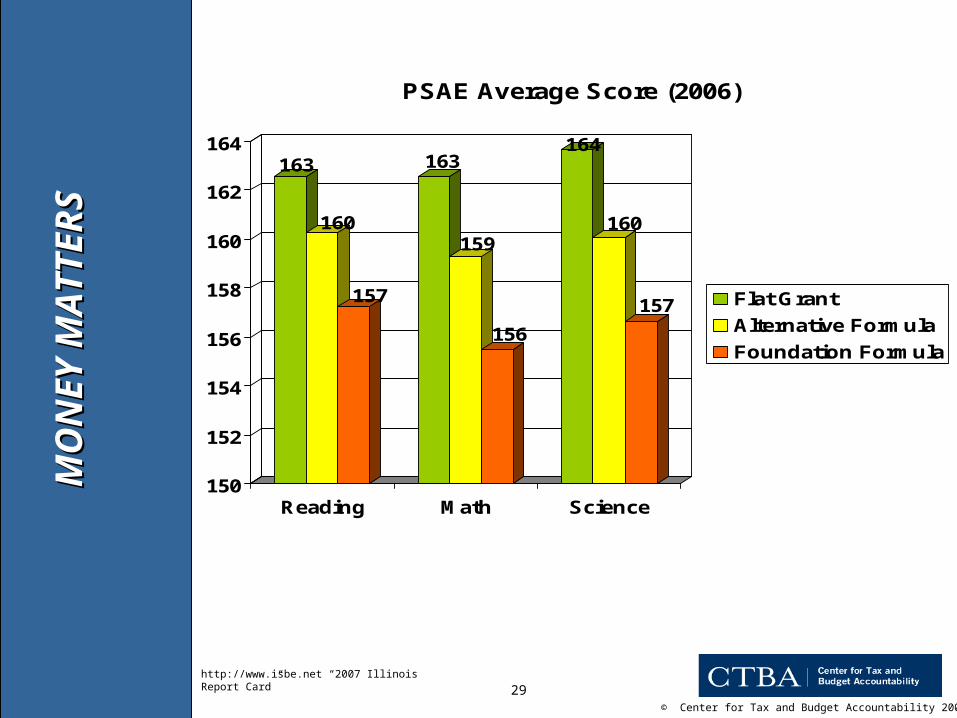
163
160
157
163
159
156
164
160
157
150
152
154
156
158
160
162
164
Reading Math Science
PSAE Average Score (2006)
Flat Grant
Alternative Formula
Foundation Formula
MO
NE
Y M
AT
TE
RS
MO
NE
Y M
AT
TE
RS
http://www.isbe.net “2007 Illinois Report Card”

© Center for Tax and Budget Accountability 2008
30
Total and Instructional Spending Differentials
On average, Flat Grant districts spend $4186 more in total per pupil spending than Foundation Formula school districts.
When it comes to instructional expenses, Flat Grant districts spend $2324 more per student on average than do Foundation Formula districts.
MO
NE
Y M
AT
TE
RS
MO
NE
Y M
AT
TE
RS
http://www.isbe.net “2007 Illinois Report Card”
© Center for Tax and Budget Accountability 2008
31
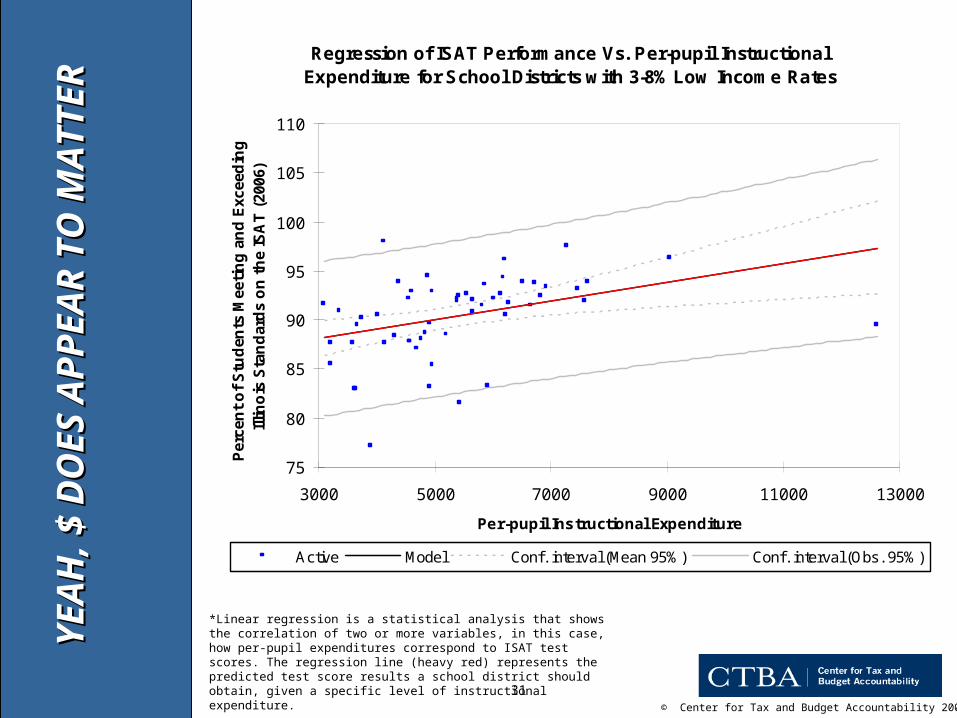
Regression of ISAT Performance Vs. Per-pupil Instructional Expenditure for School Districts with 3-8% Low Income Rates
75
80
85
90
95
100
105
110
3000 5000 7000 9000 11000 13000
Per-pupil Instructional Expenditure
Per
cen
t o
f S
tud
ents
Mee
tin
g a
nd
Exc
eed
ing
Ill
ino
is S
tan
dar
ds
on
th
e IS
AT
(20
06)
Active Model Conf. interval (Mean 95%) Conf. interval (Obs. 95%)
YE
AH
, $ D
OE
S A
PP
EA
R T
O M
AT
TE
RY
EA
H, $
DO
ES
AP
PE
AR
TO
MA
TT
ER
*Linear regression is a statistical analysis that shows the correlation of two or more variables, in this case, how per-pupil expenditures correspond to ISAT test scores. The regression line (heavy red) represents the predicted test score results a school district should obtain, given a specific level of instructional expenditure.

© Center for Tax and Budget Accountability 2008
32
$445,930
$81,422
$0
$100,000
$200,000
$300,000
$400,000
$500,000
Average EAV
Low Income FocusEqualized Assessed Valuation
Lowest Poverty (0-4% LIR)
Highest Poverty (68-100% LIR)
The EAV of school districts with the greatest amount of low income is 5 times less than that of the percentage of the districts with the smallest low income population.
*LIR – means Low Income Rate
http://www.isbe.net “2007 Illinois Report Card”
PO
VE
RT
Y A
ND
SC
HO
OL
SP
OV
ER
TY
AN
D S
CH
OO
LS
© Center for Tax and Budget Accountability 2008
33
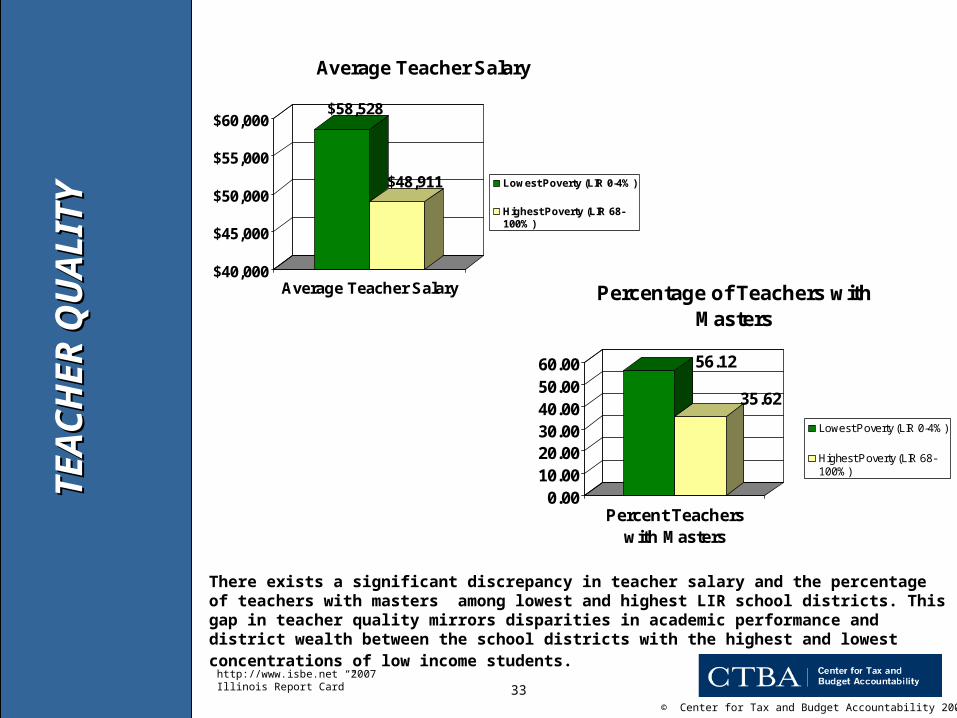
56.12
35.62
0.0010.0020.0030.0040.0050.0060.00
Percent Teacherswith Masters
Percentage of Teachers with Masters
Lowest Poverty (LIR 0-4%)
Highest Poverty (LIR 68-100%)
$58,528
$48,911
$40,000
$45,000
$50,000
$55,000
$60,000
Average Teacher Salary
Average Teacher Salary
Lowest Poverty (LIR 0-4%)
Highest Poverty (LIR 68-100%)
There exists a significant discrepancy in teacher salary and the percentage of teachers with masters among lowest and highest LIR school districts. This gap in teacher quality mirrors disparities in academic performance and district wealth between the school districts with the highest and lowest concentrations of low income students.
TE
AC
HE
R Q
UA
LIT
YT
EA
CH
ER
QU
AL
ITY
http://www.isbe.net “2007 Illinois Report Card”
© Center for Tax and Budget Accountability 2008
34
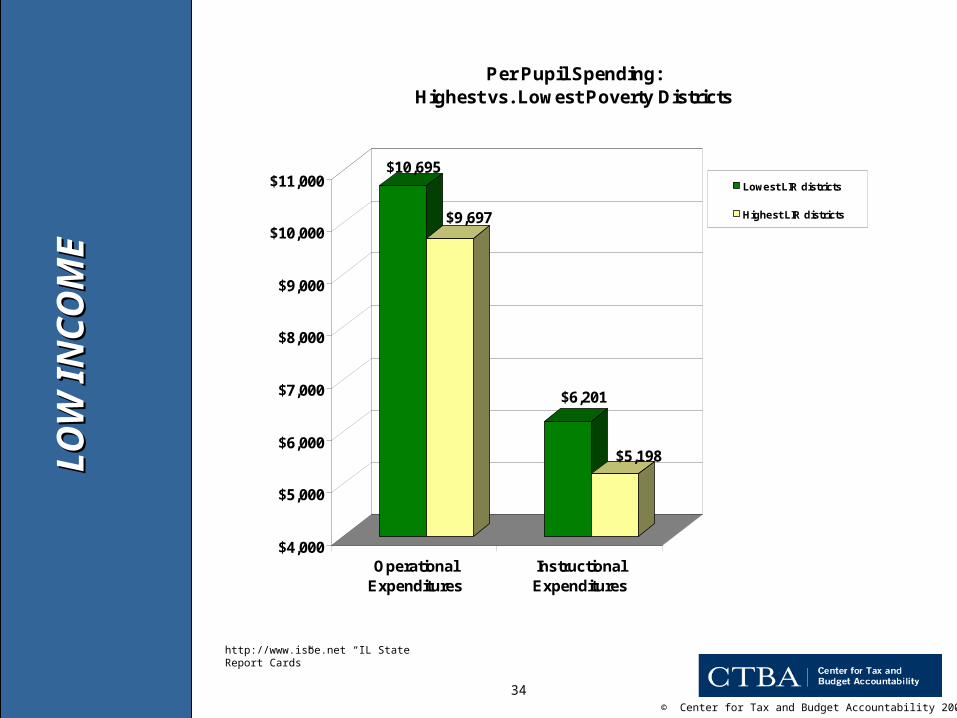
$10,695
$9,697
$6,201
$5,198
$4,000
$5,000
$6,000
$7,000
$8,000
$9,000
$10,000
$11,000
OperationalExpenditures
InstructionalExpenditures
Per Pupil Spending: Highest vs. Lowest Poverty Districts
Lowest LIR districts
Highest LIR districts
http://www.isbe.net “IL State Report Cards”
LO
W I
NC
OM
EL
OW
IN
CO
ME
© Center for Tax and Budget Accountability 2008
35
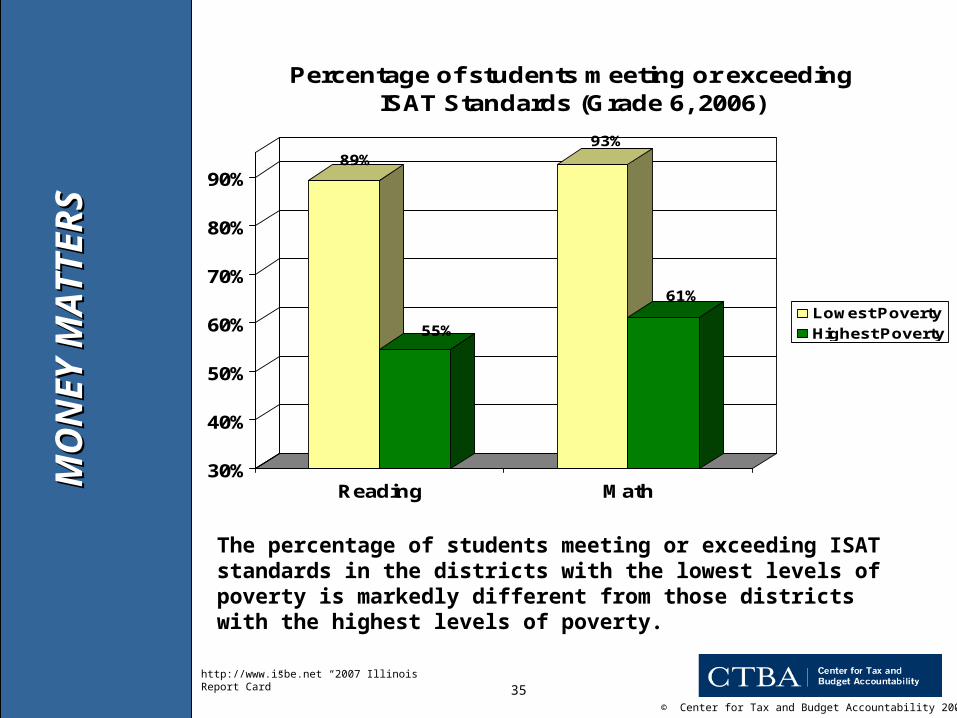
The percentage of students meeting or exceeding ISAT standards in the districts with the lowest levels of poverty is markedly different from those districts with the highest levels of poverty.
89%
55%
93%
61%
30%
40%
50%
60%
70%
80%
90%
Reading Math
Percentage of students meeting or exceeding ISAT Standards (Grade 6, 2006)
Lowest Poverty
Highest Poverty
MO
NE
Y M
AT
TE
RS
MO
NE
Y M
AT
TE
RS
http://www.isbe.net “2007 Illinois Report Card”

© Center for Tax and Budget Accountability 2008
36
63.7
26.1
0.0
20.0
40.0
60.0
80.0
% Meet plus exceed
Percentage Meeting plus exceeding PSAE (2006)
Lowest Poverty
Highest Poverty
PO
VE
RT
Y M
AT
TE
RS
PO
VE
RT
Y M
AT
TE
RS
http://www.isbe.net “2007 Illinois Report Card”
© Center for Tax and Budget Accountability 2008
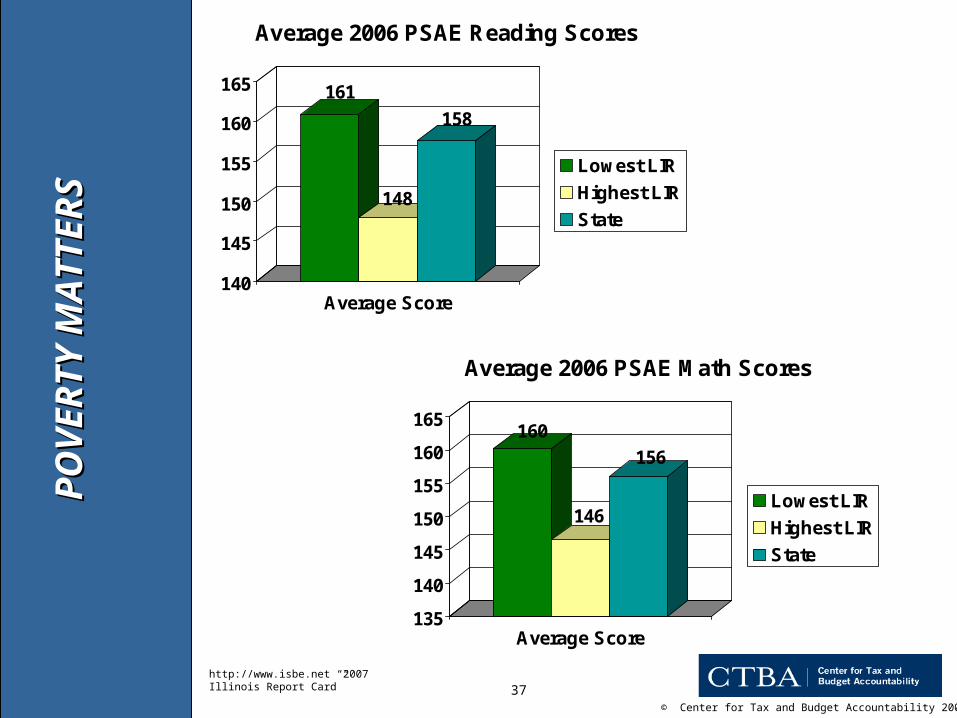
37
161
148
158
140
145
150
155
160
165
Average Score
Average 2006 PSAE Reading Scores
Lowest LIR
Highest LIR
State
160
146
156
135
140
145
150
155
160
165
Average Score
Average 2006 PSAE Math Scores
Lowest LIR
Highest LIR
State
PO
VE
RT
Y M
AT
TE
RS
PO
VE
RT
Y M
AT
TE
RS
http://www.isbe.net “2007 Illinois Report Card”

© Center for Tax and Budget Accountability 2008
38
Lowest LIR Districts Making AYP
4%
96%
No
Yes
Highest LIR Districts Making AYP
71%
29%
No
Yes
The disparity between those districts meeting AYP corresponds directly to a school district’s LIR.
LO
W I
NC
OM
E M
AT
TE
RS
LO
W I
NC
OM
E M
AT
TE
RS
http://www.isbe.net “2007 Illinois Report Card”
© Center for Tax and Budget Accountability 2008
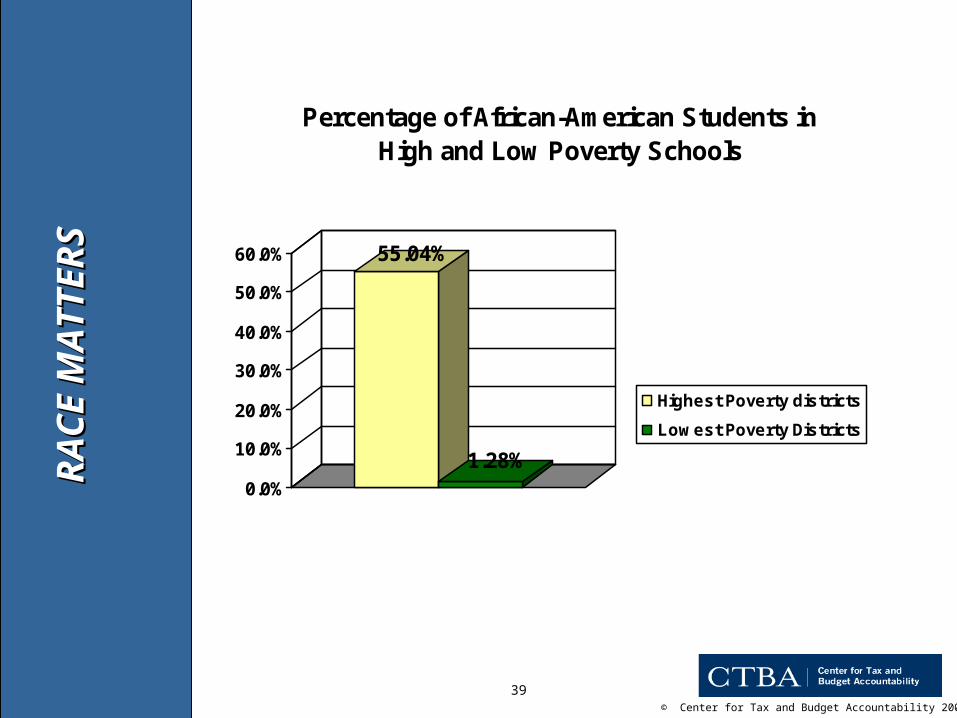
39
55.04%
1.28%0.0%
10.0%
20.0%
30.0%
40.0%
50.0%
60.0%
Percentage of African-American Students in High and Low Poverty Schools
Highest Poverty districts
Lowest Poverty Districts
RA
CE
MA
TT
ER
SR
AC
E M
AT
TE
RS

© Center for Tax and Budget Accountability 2008
40
21.60%
92.83%
66.45%
0.00%
10.00%
20.00%
30.00%
40.00%
50.00%
60.00%
70.00%
80.00%
90.00%
100.00%
%White of Total White Pop %Black of Total Black Pop %Hispanic of Total Hispanic Pop
Percentage of Students in Districts with Poverty Rate of 30% or Greater
RA
CE
MA
TT
ER
SR
AC
E M
AT
TE
RS

© Center for Tax and Budget Accountability 2008
41
Racial Breakdown of Flat Grant Districts
Hispanic8%
African American5%
Caucasian76%
Other2%
Asian/Pacific Islander
9%
Native American0%
RA
CE
MA
TT
ER
SR
AC
E M
AT
TE
RS
© Center for Tax and Budget Accountability 2008
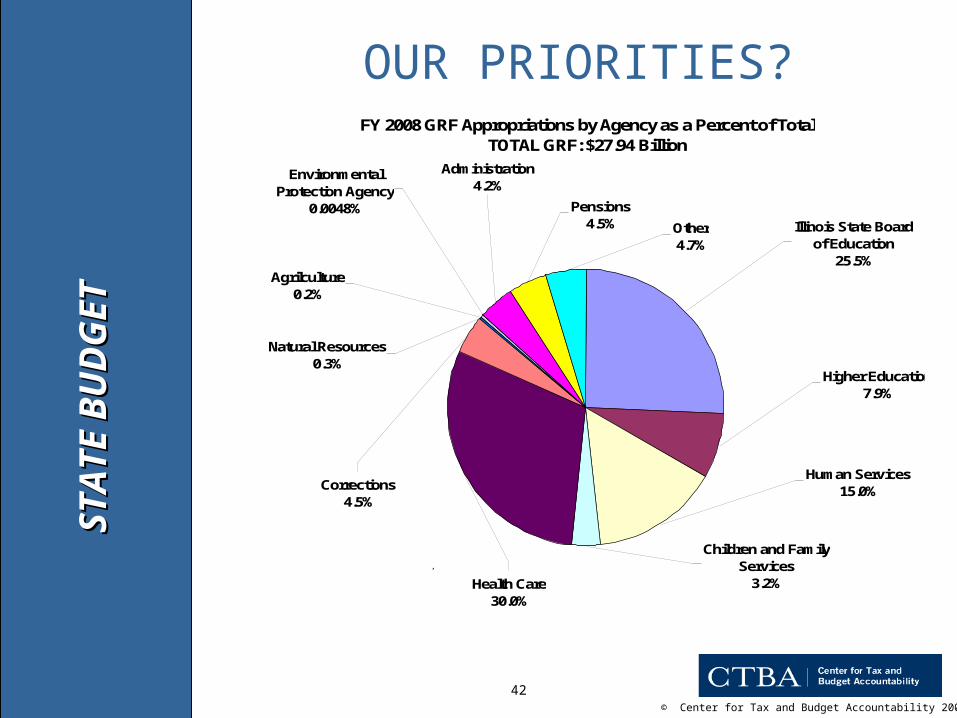
42
FY 2008 GRF Appropriations by Agency as a Percent of Total TOTAL GRF: $27.94 Billion
Agrilculture0.2%
Administration4.2%
Natural Resources0.3%
Corrections4.5%
Environmental Protection Agency
0.0048%
Health Care30.0%
Children and Family Services
3.2%
Human Services15.0%
Higher Education7.9%
Pensions4.5% Other
4.7%Illinois State Board
of Education25.5%
Source: Illinois Commission on Government Forecasting and Accountability, FY 2008 Budget Summary
-ISBE and Higher Ed does not include pension contributions-Pension contributions include FY 2008 GRF appropriated-Health Care includes Public Health and Health Care and Family Services-Administration includes all boards, commissions, agencies, authorities, districts, councils, OMB, Revenue, CMS, Inspector General and all legislative, constitutional and judicial offices
ST
AT
E B
UD
GE
TS
TA
TE
BU
DG
ET
OUR PRIORITIES?

© Center for Tax and Budget Accountability 2008
43
WHAT ABOUT REVENUE GROWTH
$$
$$
NE
W $
$$ ?
NE
W $
$$ ?

© Center for Tax and Budget Accountability 2008
44
N
OT
SO
MU
CH
NO
T S
O M
UC
HIllinois State Major Tax Revenues Have Not Kept Up With
Inflation by Over $7 Billion Since 2000
-$179.30
-$1,274.10
-$1,873.03-$1,953.03
-$1,369.20
-$576.40
$17
-$2,500
-$2,000
-$1,500
-$1,000
-$500
$0
$500
2001 2002 2003 2004 2005 2006 2007$
in M
illio
ns
Includes: Personal and Corporate Income, State Sales, and Public Utility Taxes. Source, Illinois Commission on Government Forecasting and Accountability. Inflation based on Bureau of Labor Statistics, CPI.
THERE ISN’T ANY
© Center for Tax and Budget Accountability 2008
45
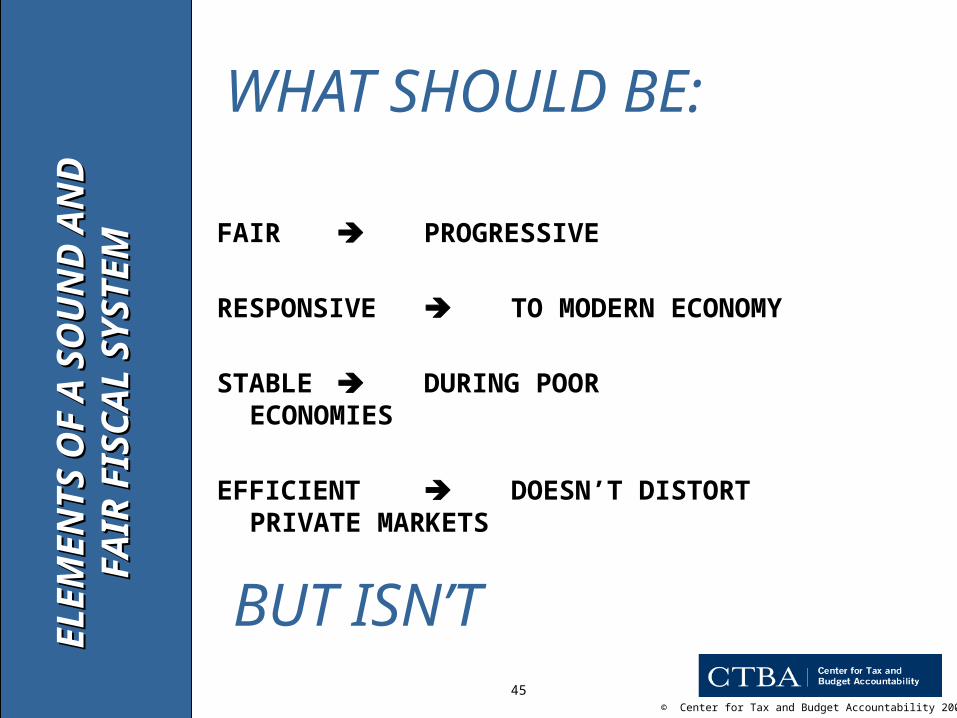
FAIR PROGRESSIVE
RESPONSIVE TO MODERN ECONOMY
STABLE DURING POORECONOMIES
EFFICIENT DOESN’T DISTORTPRIVATE MARKETS
EL
EM
EN
TS
OF
A S
OU
ND
AN
D
EL
EM
EN
TS
OF
A S
OU
ND
AN
D
FA
IR F
ISC
AL
SY
ST
EM
FA
IR F
ISC
AL
SY
ST
EM
WHAT SHOULD BE:
BUT ISN’T

© Center for Tax and Budget Accountability 2008
46
*Adjusts solely for historic rates of inflation and population growth, and assumes normal economic growth.
ST
RU
CT
UR
AL
DE
FIC
ITS
TR
UC
TU
RA
L D
EF
ICIT
The Illinois Structural Deficit (How Revenue Growth Will Not Keep Pace With The Cost of Current Services)
20062007
20082009
20102011
20122013
20142015
20162017
20182019
20202021
20222023
20242025
2026
Revenue
Expenditures
$24 Billion
$49 Billion
$44 Billion
$39 Billion
$34 Billion
$29 Billion
© Center for Tax and Budget Accountability 2008
47
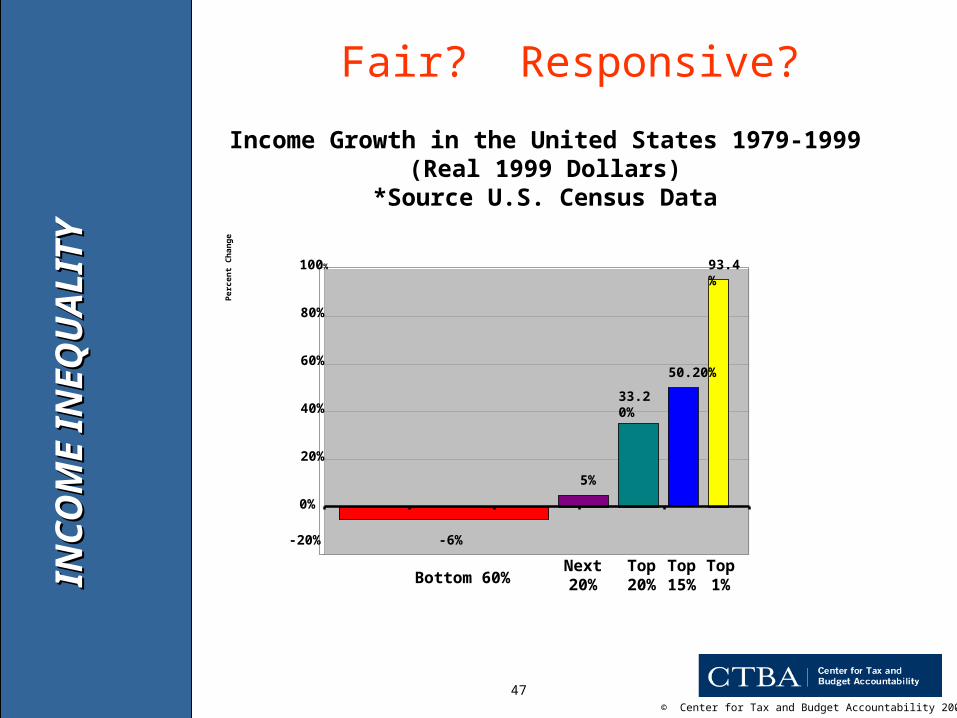
-6%
5%
33.20%
50.20%
93.4%
-20%
0%
20%
40%
60%
80%
100%
Bottom 60% Next20%
Top20%
Top15%
Top1%
Income Growth in the United States 1979-1999(Real 1999 Dollars)
*Source U.S. Census DataP
erce
nt
Ch
ang
e
INC
OM
E I
NE
QU
AL
ITY
INC
OM
E I
NE
QU
AL
ITY
Fair? Responsive?
© Center for Tax and Budget Accountability 2008
48
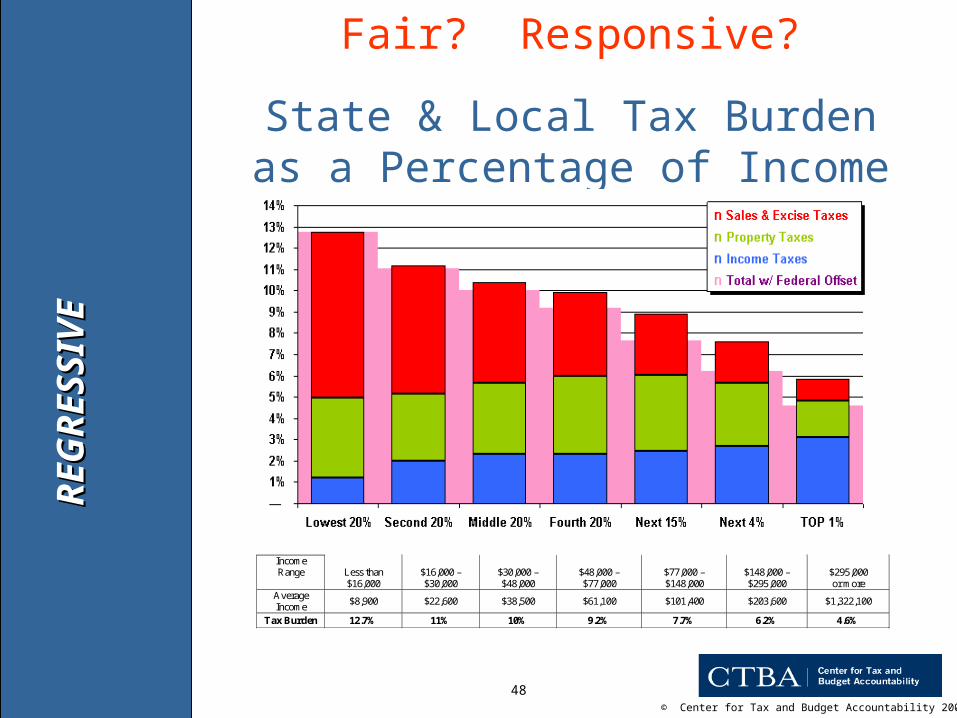
State & Local Tax Burden as a Percentage of Income
Income Range
Less than $16,000
$16,000 – $30,000
$30,000 – $48,000
$48,000 – $77,000
$77,000 – $148,000
$148,000 – $295,000
$295,000 or more
Average Income
$8,900 $22,600 $38,500 $61,100 $101,400 $203,600 $1,322,100
Tax Burden 12.7% 11% 10% 9.2% 7.7% 6.2% 4.6%
RE
GR
ES
SIV
ER
EG
RE
SS
IVE
Fair? Responsive?

© Center for Tax and Budget Accountability 2008
49
INCOME TAX INCREASE
3% 5%
3% 2% =5%
2/3 = 67%
*Note, corporate rate goes up from 4.8% to 8%, but―overall corporate tax burden goes down!
SB
750
SB
750
© Center for Tax and Budget Accountability 2008
50
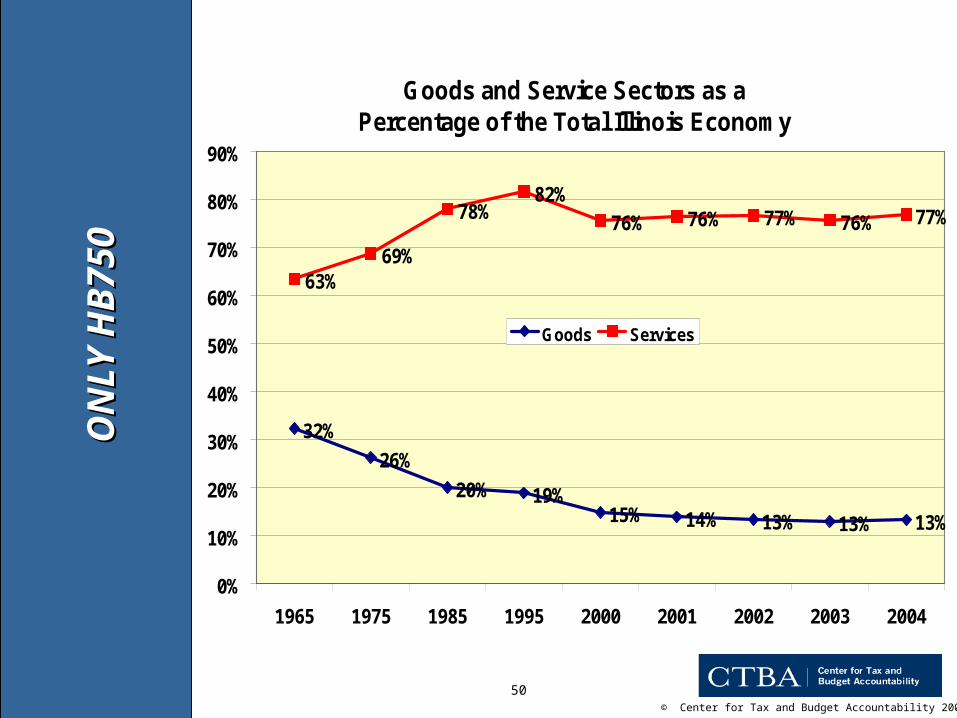
Goods and Service Sectors as a Percentage of the Total Illinois Economy
32%
26%
20% 19%15% 14% 13% 13% 13%
63%69%
78%82%
76% 76% 77% 76% 77%
0%
10%
20%
30%
40%
50%
60%
70%
80%
90%
1965 1975 1985 1995 2000 2001 2002 2003 2004
Goods Services
ON
LY
HB
750
ON
LY
HB
750
© Center for Tax and Budget Accountability 2008
51
For More Information:
Center for Tax and Budget Accountabilitywww.ctbaonline.org
Ralph M. MartireExecutive Director(312) [email protected]
Chrissy A. ManciniDirector of Budget and Policy Analysis(312) [email protected]
Yerik KaslowResearch Associate(312) [email protected]
Fu
rth
er I
nfo
rmat
ion
Fu
rth
er I
nfo
rmat
ion
Related Documents