© Boardworks 2012 1 of 13 Graphing inequalities Graphing inequalities in two variables in two variables

© Boardworks 2012 1 of 13 Graphing inequalities in two variables.
Mar 26, 2015
Welcome message from author
This document is posted to help you gain knowledge. Please leave a comment to let me know what you think about it! Share it to your friends and learn new things together.
Transcript

© Boardworks 20121 of 13
Graphing inequalities Graphing inequalities in two variablesin two variables

© Boardworks 20122 of 13
Inequalities in two variables
Linear inequalities can be given in two variables x and y.
x + y > 3
Can you name a pair of values that satisfy the inequality?
x = 1 and y = 4
x = 4 and y = 5
x = –1 and y = 5
These solutions are usually written as coordinate pairs as(1, 4), (–1, 5), (4, 5), (12, –6).
The whole solution set can be represented using a graph.
For example,
Some example solution pairs are:
x = 12 and y = –6

© Boardworks 20123 of 13
Graphing the inequality
We can represent all the points where the x-coordinate and the y-coordinate add up to 3 with the line x + y = 3.
0 1 2 3 4 5 6–1–2–3–4–5–6
1
2
3
4
5
–2
–4
–3
–5
–1
y
x
The region where x + y > 3 does not include points where x + y = 3 and so we draw this as a dotted line.
We need to decide which part of the graph is the solution set.How can we check?
© Boardworks 20124 of 13
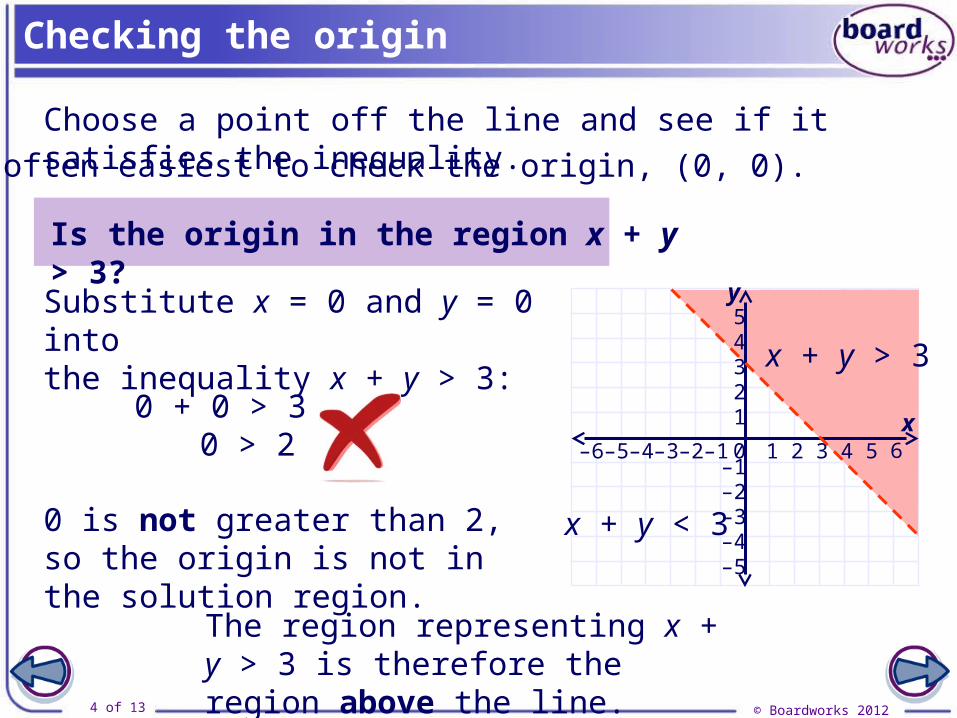
Checking the origin
Is the origin in the region x + y > 3?
Substitute x = 0 and y = 0 intothe inequality x + y > 3:
0 + 0 > 30 > 2
0 is not greater than 2, so the origin is not in the solution region.
The region representing x + y > 3 is therefore the region above the line.
Choose a point off the line and see if it satisfies the inequality.
It is often easiest to check the origin, (0, 0).
0 1 2 3 4 5 6–1–2–3–4–5–6
12345
–2
–4–3
–5
–1
y
x
x + y > 3
x + y < 3

© Boardworks 20125 of 13
Inequalities in two variables
0 1 2 3 4 5 6–1–2–3–4–5–6
1
2
3
4
5
–2
–4
–3
–5
–1
y
x
Draw the line 2y – x = 4.
2(0) – 0 = 0 < 4 This is true, so we know that (0, 0) is in the solution set.
The solution set is therefore the region below the line.
Represent the solutions to the inequality 2y – x < 4 on a graph.
Check if the origin is in the region by substituting x = 0 and y = 0 intothe inequality 2y – x < 4:
2y – x < 4
© Boardworks 20126 of 13
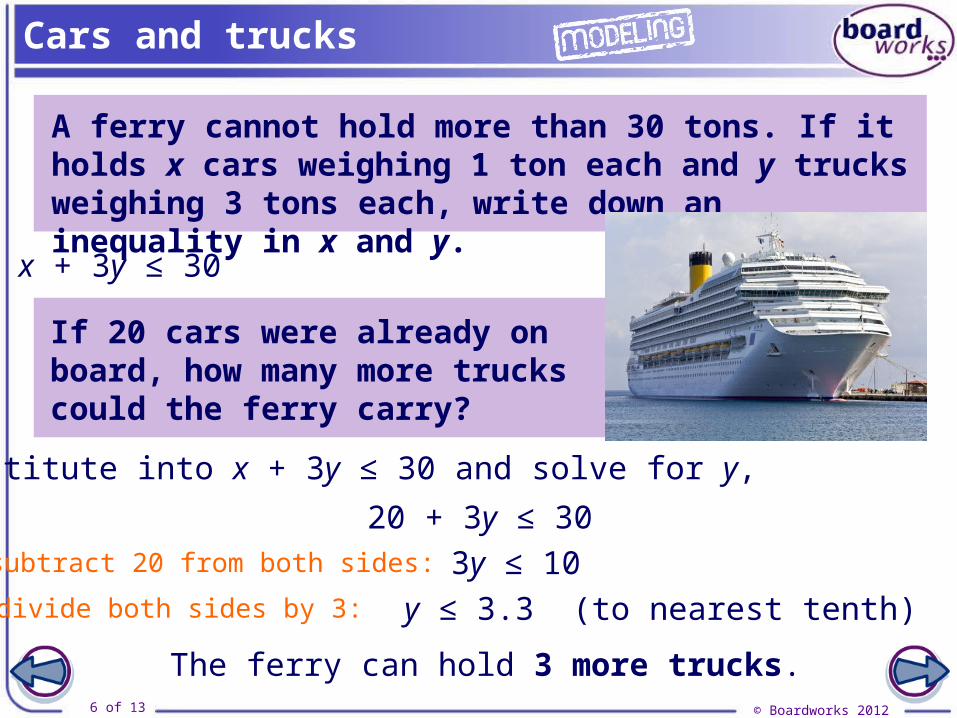
If 20 cars were already on board, how many more trucks could the ferry carry?
A ferry cannot hold more than 30 tons. If it holds x cars weighing 1 ton each and y trucks weighing 3 tons each, write down an inequality in x and y.
Cars and trucks
x + 3y ≤ 30
Substitute into x + 3y ≤ 30 and solve for y,
20 + 3y ≤ 30subtract 20 from both sides: 3y ≤ 10divide both sides by 3: y ≤ 3.3 (to nearest tenth)
The ferry can hold 3 more trucks.
© Boardworks 20127 of 13
Cars and trucks
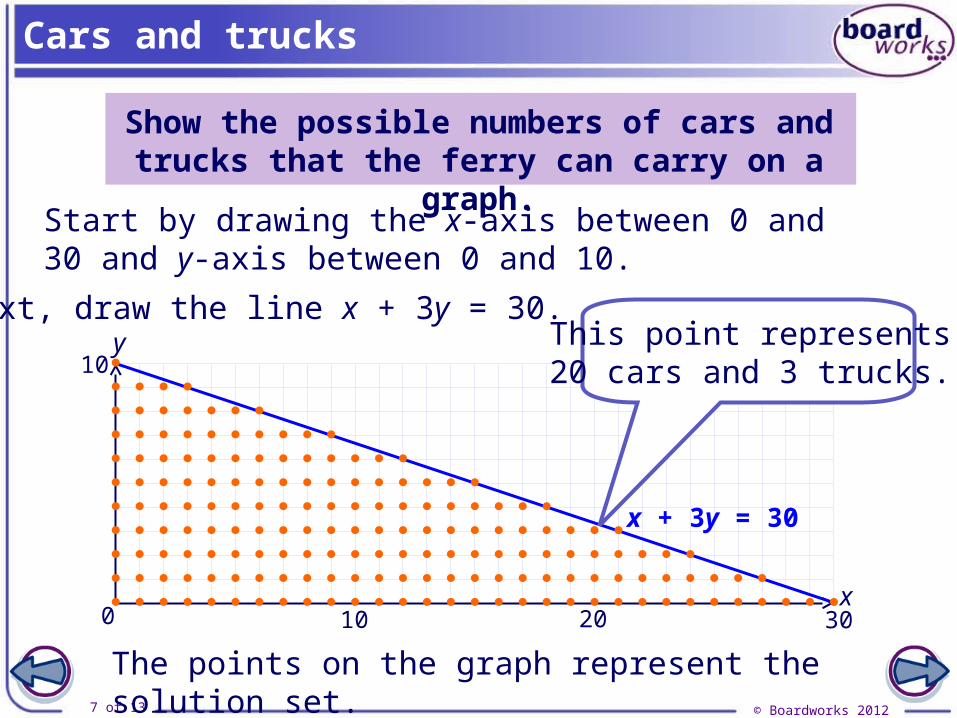
Show the possible numbers of cars and trucks that the ferry can carry on a graph.
Start by drawing the x-axis between 0 and 30 and y-axis between 0 and 10.
Next, draw the line x + 3y = 30.
x
y
0
10
30
x + 3y = 30
10 20
This point represents20 cars and 3 trucks.
The points on the graph represent the solution set.

© Boardworks 20128 of 13
Uncles and aunts
“I have more uncles than aunts.”
“Two of my aunts live together.”
“Even if all my uncles and aunts brought a friend each, they still wouldn’t have enough people for a soccer team.”
How many uncles and aunts does the girl have?
Use the inequality graphing tool on the next slide to confirm your answer.
Related Documents