• HOLE LABORATORY REFERENCE DOCUMENT NO. 84-15 Summary and Interpretation of Catch Statistics for Sea-Run Atlantic Salmon, 1983 by John Boreman and Frank P. Almeida . B1'PPROVED FOR DISTRIBUT10N National Marine Fisheries Northeast Fisheries Center Woods Hole Laboratory Woods Hole, Massachusetts 02543

Welcome message from author
This document is posted to help you gain knowledge. Please leave a comment to let me know what you think about it! Share it to your friends and learn new things together.
Transcript

• ~OOOS HOLE LABORATORY REFERENCE DOCUMENT NO. 84-15
Summary and Interpretation of Catch Statistics for Sea-Run Atlantic Salmon, 1983
by
John Boreman and Frank P. Almeida
. B1'PPROVED FOR DISTRIBUT10N
National Marine Fisheries Servic~ Northeast Fisheries Center
Woods Hole Laboratory Woods Hole, Massachusetts 02543

INTRODUCTION
Nominal catches of sea-run Atlant!c salmon (Salmo salar)
were assembled from several sources, including ICES Working Group
and Anacat Committee documents, and CAFSAC papers. The data
presented herein should not be accepted as completely accurate,
since it is acknowledged by contributing countries that their
e.g", angler catch in data are underestimates of actual catch,
small coastal. rivers is often unreported. In 0 the r ins tan c e Sl ,
reported catch statistics for certain fisheries are conflicting,
dependent upon the data sources used. These apparent
inconsistencies are noted as
country are discussed.
the catch statistics for each
In ad4ition to catch statistics, the commercial fishery for
Atlantic salmon in each country is described, based on the 1984
report of the ICES Working Group on North Atlantic Salmon (Anon.
1984). The term "grilse" is used in this ~eport to denote 1-sea-
winter Atlantic salmon, the term "salmon" is used to denote 2+-
sea-winter fish, and the term "Atlintic salmon" is used to
describe all ages combined. Data sources for the catch statistics
are noted in the tables .•
NORTH AMERICA
North American fisheries for Atlantic salmon include
commercial and recreational fisheries in Canada and recreational
fisheries in the u.S.
1

Canada
Thr~~ types of gear are
fishery for Atlantic salmon:
used ~n the Canadian commercial
fixed gill-nets, fixed trap-nets,
and drift nets. A total of 5,689 licensed operators used a total
of 20,832 nets" most of which (>90%) are fixed gill-nets. The
minimum mesh size (all mesh sizes in this report are stretched
mesh measurements) is usually 127 mm, although in some areas of
Newfoundland it is 114 mm and in New Brunswick and Prince Edward
Island there is no minimum mesh size. Approximately 67% of the
~ish landed in the commercial fishery is multi-sea winter in age.
Catches by commercial operations are ,controlled by quota on three
rivers, the Miramichi, Restigouche, and Saint John. All salmon
caught outside the province of Newfoundland must be tagged. By-
catches of salmon are banned in all provinces, but are known to
occur.
Commercial catch statistics for Canada are available for
1910-1983;'
1) • The
when it
landings
recreational data are available for 1952-1983 (Table
peak in reported commercial landings occurred in ' 1930,
was slightly over 6,000 metric tons (MT). Commercial
then declined to about one-fifth the 1930 level by the
mid-1950s, and have fluctuated around 1700 MT ever since.
Recreational catch of Atlantic salmon in Canadian waters was
obtained from a report by May and Lear (1971) for 1952-1970, and
from the difference bet~een reported homewater catch (assumed to
be recreational and commercial landings combined) and catch
reported in the NAFd statistical bulletins (assumed to be
commercial only) since 1970. Prior to 1971, the difference
2
between the reported homewater catch and catch reported to NAFO
was too low (1-5 MT) to be considered as a valid representation
of the recreational landings. However, the magnitude of annual
differences since 1970 are consistent with the recreational catch
estimates reported by May and Lear for 1952-19709
The proportion of the total Canadian catch of salmon
attributable to the recreational fishery has fluctuated between 7
and 16 percent since 1952 (Figure 2). The proportion is generally
higher. for the most recent years due to a suspected increase in
the coverage of the recreational fisheryo Total reported
recreational catch has been between 100 and 500 MT, with no
discernable trends, since 1952.
Total Canadian homewater landings have been' divided in
grilse (one sea winter) and salmon (2+ sea winters) since 1970.
The annual catch of salmon has been about 2X (in weight) the
annual catch of grilse (Table 2). Considering the difference in
size of fish in the two categories,
have been about equal.
United States
the annual catches in number
The fishery for Atlantic salmon in U.S. waters is entirely
recreational. The catch has ranged between 0.9 and 6.4 MT since
1973 (Table 3), showing an increase dur±ng this period due to the
stocking program. The 1983 catch (1.3 MT) was substantially lower
than 1982 (6.4 MT). By far, the majority of fish caught in the
U.S. are multi-sea winter; for example, in 1978, 98% of the catch
was fish in this category. The U.S. program for restoring the
3

Atlantic salmon is a major effort. State and Federal hatcheries
are planning to produce about 1~4 million smolts and 3.6 million
fry and parr annually for stocking. The projected total U.S.
stock that will develop as a result of the restoration effort is
in the range of 28,000-43,000 salmon with no change in the
interception rate from the ~evel that existed in the 1970s (C • P •
Good~ear, personal communication). At an exploitation rate of 25%
and an average weight of 7 lb (3.2 kg) per fish caught would
translate to a catch of 22-34 MT.
EUROPE
Countries included in this category include S~otland,
England and Wales, Ireland, Northern Ireland, France, Norway,
Swed.en, USSR, Finland, and Iceland. Reported catches extend back
to 1960 for all cou~tries except Scotland, where reported catches
extend back· to 1952. Although much of the nominal catch is
homewater,
countries
some fisheries take Atlantic salmon headed for other
or
(interception
fisheries in
other homewaters within the
fisheries). For the most part,
Europe are drift-net fisheri~s
same country
the interception
along the coast
(Anon. 1984). The most notable interception fisheries occur off
Ireland, Northern Ireland, England and Wales, and Norway.
Interception fisheries in areas other than Europe are described
in the subsequent section.
4

Scotland
Bag-nets and stake-nets are the two main types of gear used
in the Scottish commercial fishery for Atlantic salmon. Within
the limits of estuaries, only net and coble fisheries are
allowed. The minimum permissible mesh size of any net used to
catch salmon in Scotland is 89 mmQ Anglers in Scotland do not
require a-license to fish, but must own or lease fishing rights.
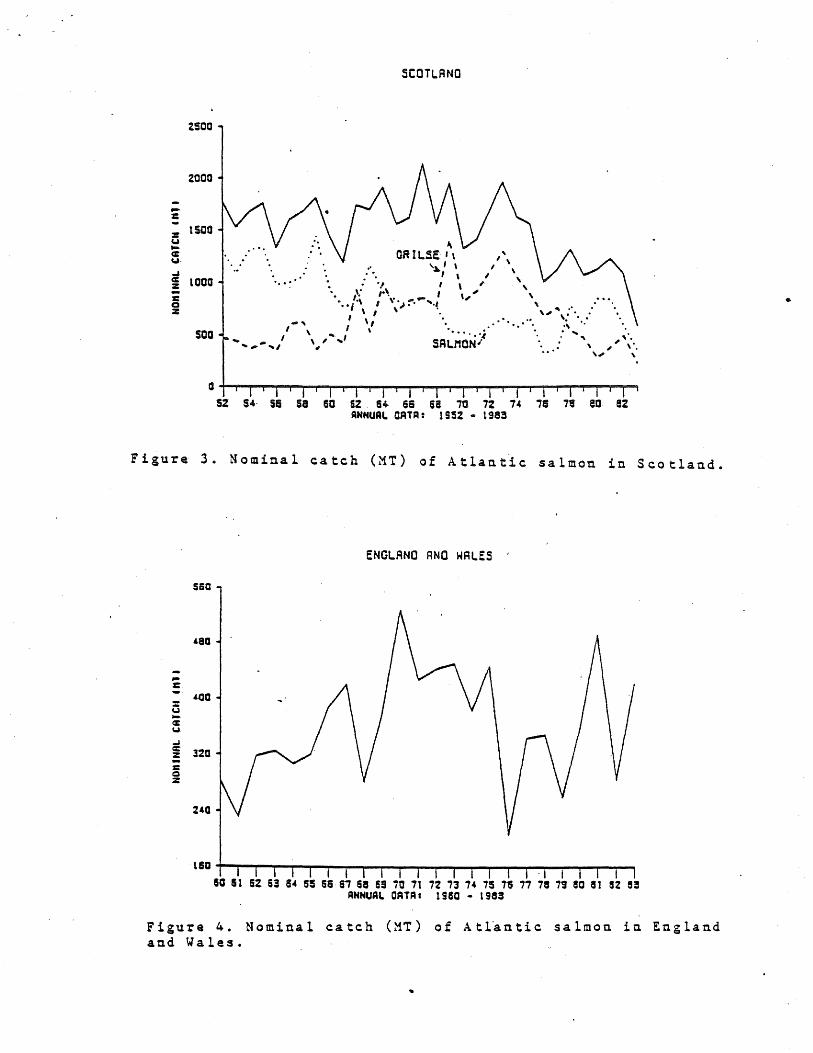
Total landings of Atlantic salmon in Scotland ranged between
1,200 MT and 2,100 MT.from 1952-1973 with no discernible trend
(Table 4). During this period, however, the catch of salmon
declined and the catch of grilse increased (Figure 3). The
decline in total catch since 1973 can be attributed to a decline
in the landings of grilse. During the same time period, the catch
of salmon has increased slightly.
England and Wales
About ·75% of the annual nominal commercial catch of AtLantic
salmon in England and Wales has been taken by drift-nets. in
recent years. Most of the drift-nets have m~sh sizes between 125
and 130 mm and the moat selected length of ~ish taken by 127 mm
mesh nets is 64 cm (25 inches). A large part of the remaining
catch is taken by seine and trap-nets. About 850 commercial
licenses are issued annually; each license supports a crew of 1-5
people. In all fisheri~s the amount of gear used is restricted
and weekly closed periods exist.
Catch of Atlantic salmon in England and Wales ranged between
208 and 527 MT during 1960-1983 (Table 4, Figure 4)0 The decline
5

in catch during the mid- to late-1970s i$ attributed to the
adverse
because
effects of drought on several year classes and
of poor sea survival of the 1977 smolt year
possibly
class. In
1982, approximately 60% of the nominal catch was taken by drift
nets (Anon. 1984) •
. Although the actual catch statistics have not been reported,
representatives from England and Wales claim that the ratio of
salmon to grilse in their northeast coast drift-net fisheries has
declined in recent years, mainly as a result of declining catches
of salmon rather than increasing catch~s of grilse. Tagging
experiments indicate these fish are on their homeward migration
to Scottish rivers (Anon. 19·80). There is some evidenceto
indicate that the ratio of salmon to grilse in the remainder of
the fisheries in these countries has also declined in recent
years.
Ireland
Salmon fishing in Ireland is banned beyond 12 miles offshore
by a directive of the EEC (Anon. 1984). Four types of nets are
used in the commercial fishery (drift,
The minimum mesh size is 89 mm.
draf~, snap, and loop).
Total homewater catch in Ireland rose from around 700 MT in
the early 1960s to a peak of 2,216 MT in 1975 (Table 4, Figure
5). The increase in catch is associated with an increase in the
efficiency of the drift-net fis~ery, which accounted for 75-80%
of the total homewater catch in 1973 and 83% in 1983. Total catch
steadily declined between 1975 and 1982, then increased sharply
6

in 1983. The decline was due to a decline in the catch of grilse,
which account for approximately 90% of the total catch.
Inshore drift-net and fixed-net catches have declined since
1971 and 1974, respectively. Reductions in the most recent years
may be as much a function of additional restrictions (early
closures) on the commercial fishery as much as a function of
decline in stock abundance ~Anono 1980). In 1982, approximately
76% of the nominal catch was taken by drift-nets (Anon. 1984).
Northern Ireland
Drift-nets, draft-nets, bag-nets, and traps are used in the
commercial fishery for Atlantic salmon in Northern Ireland. The
minimum mesh size is 89 mm for drift-nets and 64 mm for dr~ft
nets. A closed seas~n extends from 16 September to 17 March.
Catch of Atlantic salmon in Northern- Ireland has declined
dramatically in recent years, from a peak of close to 450 MT in
1967 to recent levels of slightly over 100 MT (Table 4, Figure
6). This decline reflects a decline in abundance of Northern
Ireland stocks, rather than a change in fishing characteristics
(Anon. 1980). Although actual catch statistics by age category
are not available, the grilse component amounts to 80-90% of the
total catch, implying that absence of fish in this age category
may be responsible for the decline in catch. Appr~ximately 40% of
the nominal catch in 1982 was taken .by drift-nets (Anon. 1984).
7

France --
France does not have a commercial fishery for Atlantic
salmon. The annual recreational catch of Atlantic salmon in
France was assumed to be between 50 and 100 MT between 1960 and
1971 (Table 5, Figure 7). The catch fluctuated between 9 and 34
MT from 1972-1983, making the earlier figures suspect. The trend
in catch has been slightly upwards since 1972.
Representatives from France claim that the reduction in
catch between 1960-1971 and later was real and was due to a
decline in stock abundance (Anon.
decline to pollution of home rivers,
1980). They attribute the
construction of dams, UDN
infection, increased exploitation in homewaters, and an increased
rate of exploitation of French salmon off West Greenland.
Norway
The majorlty of commercial Atlantic salmon fishing in Norway
occurs at sea within 12 miles of the coast. Four types of gear
are used: drift-nets, bag-nets or pound-nets, bend-nets, and
stationed lift-nets. About 75% of the nets in use are drift nets.
The minimum allowable ~esh size is 116 mm, but more than 70% of
the drift nets have mesh sizes of 130-140 mm. Approximately 55%
of the nominal Norwegian commercial catch in 1982 was by drift
nets (44% of the total catch; Anon. 1984).
The Norwegian catch of Atlantic salmon has remained fairly
constant sinc~ 1960, ranging between slightly over 1,000 MT to
slightly over 2,000 MT (Table 5). Grilse comprise slightly less
than one-half of the total Norwegian catch (Figure 8). The large
8

drop in catch in 1978 is attributed to a -reduction in drift-net
fishing effort and also with a marked reduction in catch-per
unit-effort in the inshore fisheries. The increase in catch in
1979 is due as much to an increase in reporting efficiency as it
is an increase in stock abundance.
Sweden (West Coast)
The Sweden catch of Atlantic salmon along its west coast has
ranged from 10 to 45 MT between 1960 and 1982 (Table 5, Figure
9). Grilse comprise 80-95% of the Swedish catch. The peak in 1974
is attributed to hatchery releases; natural production has
declined considerably during the 19705 due to acidification of
the rivers (Anon. 1982). Measures have been taken to.reduce the
acidity, and, from 1978, smolt production has started to recover
(Anon. 1984).
Finland
Two rivers are fished in Finland. Gill-nets, seines, and
drift-nets are used on the River Tana, but on the River Neiden
only gill-nets are permissible. In the ma~n channel of both
rivers the minimum mesh size is 116 mm, but if used in the
tributaries the mesh size may be reduced to 80-90 mm. Commercial
rod and line fisheries also operate in the two rivers and the
minimum size is 25 cm (10 inches) in both rivers.
Finland reported a rather steady level of catch since 1972
(Table 5), fluctuating around 50 MT. The catch in 1983 was
9

reported to be 57 MT.
USSR
Although data are missing for 1976-1978 and 1983, the catch
of Atlantic salmon in the USSR has apparently been undergoing a
general decline since 1960 (Table 5, Figure 10). The 1982
reported catch (311 MT) is less than one-third of the 1960
reported catch (1,100 MT).
Iceland
Commercial netting in Iceland is confined to three rivers.
Gill-nets are used with a minimum mesh size of 90 mm. The fishing
season varies from river to river, but is limited to three months
within the period 20 May to 20 September. The commercial fishery
accounts for about 30% of the nominal landings.
Catch of Atlantic salmon in Iceland rose from 100 MT in 1960
to near 300 MT in the late 1970s, then generally declined (Table
6, Figure 11). Poor catches in 1980 and 1981 are linked to the
fast-growing fisheries off the Faroe Islands, although direct
evidence is not available (Anon. 1982 )". Other possible factors
for the low catches are poor smolt production and poor fishing
conditions.
10

INTERCEPTION FISHERIES
Other than the ~uropean interception fisheries (already
discussed), theie fisheries are off West Greenland, off the
Farose Islands, in the Norwegian Sea, and off Canada. The total
catch by high-seas (West Greenland, Norwegian Sea, and Faroes
areA) interception fisheries has increased significantly sinc~
1960, from a level of approximately 60 MT to close to 3,200 MT in
the late 1960s and early 1970s (Table 7, Figure 12). The total
interception catch then declined to about 1,200 MT in 1978, rose
to over 2,600 MT in 1981,
1983$
West Greenland
and then again declined to 1,433 MT in
The fishery for Atlantic salmon off West Greenland began in
the 1950s, although significant catches did not occur until the
mid-1960s (Table 7). Until 1975, the West Greenland fishery was
prosecuted by Norwegian, Faroese, Swedish, Danish, and Greenland
vessels; since that year only Greenland has fished the area.
The decline in catch since 1973 may be due to phasing-ou~ of
foreign vessels and establishment of quotas. Stock abundance may
be a factor, however, since the fishery has not been able to meet
the quota in several recent years. Assuming no change in effort
for the years in which data on effort are unavailable, the catch
data suggest a rather steady situation from 1974 to 1976 and
an extremely goo~ fishery in 1977 and 1979. The 1978 and 1983
11

catche~ were below the established quotas and reflect either poor
production, poor sea survival, or reduced catchability for those
years (Anon. 1980; Anon. 1984).
The geographic distribution of landings off West Greenland
in 1982 and 1983 was similar to those in 1976-81, ieee the main
part was from NAFO divisions 1B and 1C. Most of the catch in 1982
and 1983 was taken by drift-nets, although some inshore set gill
nets were still in use. Th~ mesh size in force is 140 mm,
however, this is a target mesh size, not a minimum. The types of
boats participating in the fishery vary f~om small. open boats to
small cutters up to 60 GRT (Anon. 1984).
Norwegian Sea
Reported catches for the fishery for Atlantic salmon in the
Norwegian Sea began in 1967, peaked at an estimated 946 MT ·in
1970, and has . fluctuated between 100 and slightly over 300 MT
since then. It is a long-line fishery and is ~rosecuted by
Denmark, the Faroese, the Federal Republic of Germany, Norway,
and Sweden. Since 1975, only Denmark and the Faroese have
participated (Anon. 1984).
The decrease in catch since 1970 followed the introduction
of closed areas and closed season recommendations. A Norwegian
ban on long-line fishing by Norwegian vessels in 1976 led to a
further decrease in catch. This was followed in 1977 by the
·extension of the Norwegian fishery limits to 200 miles, which may
have re-introduced some Norwegian fishing (Anon. 1980). This
fishery was closed to Atlantic all salmon fishing in the
12

beginning of 1984 (Anon. 1984)0
Faroe Islands
The fishery for Atlantic salmon in the area of the Faroes
has increased dramatically in recent years (Table 7). The first
reported catch was 5 MT in 1968 and the reported catch was an
estimated 1,125 MT in 1981. The fishery is prosecuted with long
line gear by Denmark and the Faroese.
Canada
Catch data for the Newfoundland Atlantic salmon fishery are
available for 1954-1983. Based on tagging evidence, 6-51% of the
commercial catch on the east and south coasts of Newfoundland
(25% overall average) consists of intercepted fish from the
Canada mainland and u.s. ,origin (Pippy 1982). Commercial catches
increased from 'a low of 291 MT in 1956 to 1,257 MT in 1967,
decreased through 1972, then rose to an average of about 1,300 MT
during 1973-1977 before dropping sharply in 1978-1979 (Table 8,
Figure 13). Catches increased sharply in 1980, but have decreased
steadily to 595 MT in 1983, the lowest level since 1961.
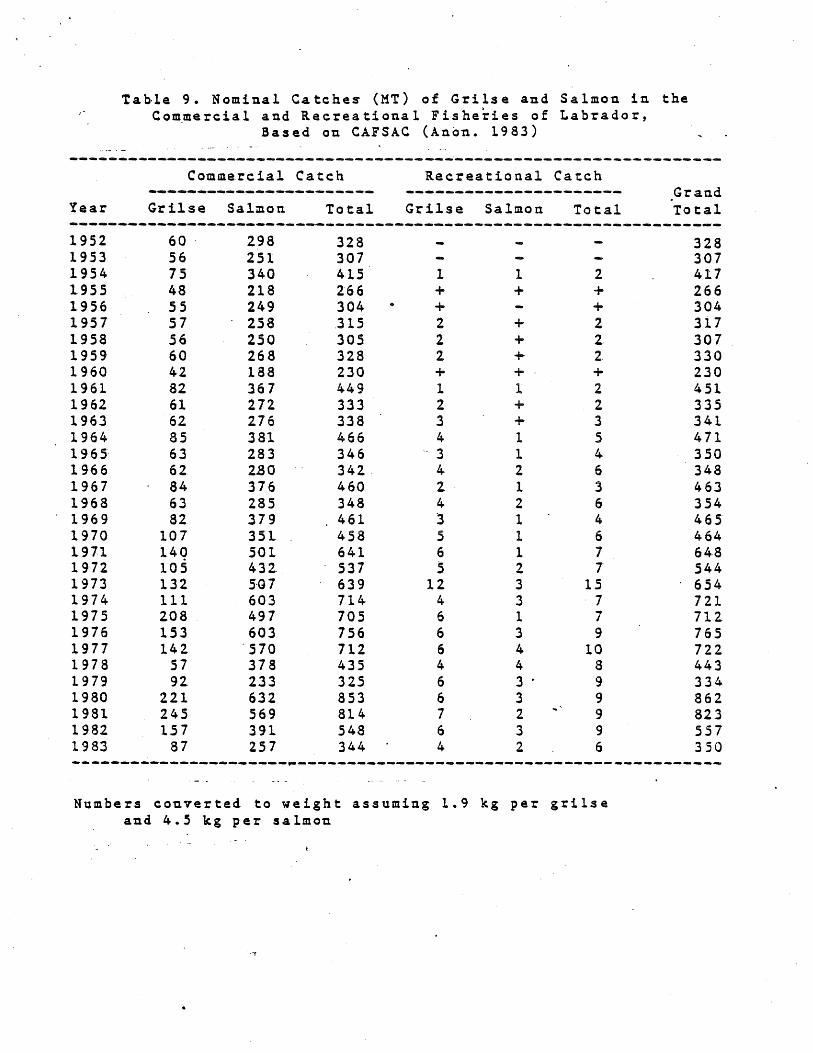
Labrador commercial fisheries also intercept Canadian
mainland and u.s. origin salmon (6%. of catch; Pippy 1982).
Com m e-r cia 1 cat c h e s a v era g e dab 0 u t 3 5 0 M T d uri n g 1 9 5 2 -1 9 68 , the n
increased steadily (except 1978-1979) to 853 MT in 1980 before
declining in 1981-1983 (Table 9, Figure 14).
13
REFERENCES CITED
Anon. 1980. Report of the Working Group on North Atlantic Salmon.
ICES C.M. 1980/M:I0.
Anon. 1982. Anadromous and Catadromous Fish Committee.
Administrative Report. ICES C.M. 1982/M:1.
Anon. 1983. Atlantic salmon. Canadian Atlantic Fisheries
Scientific Advisory Committee. CAFSAC Advisory Document
83/23.
Anon. 1984(draft). Report of the Working Group on Atlantic . Salmon. ICES C.M~ 1984/M: •
May, A .. W., and WeH. Lear. 1971. Digest of Canadian Atlantic
salmon catch statistics. Fisheries Research Board of Canada.
Technical Report No. 270.
Pippy, J. (Chairman). 1982. Report of the Working Group on the
Interception of Mainland Salmon in Newfoundland. Canadian
Manuscript Report of Fisheries and Aquatic Sciences No.
1654.
14
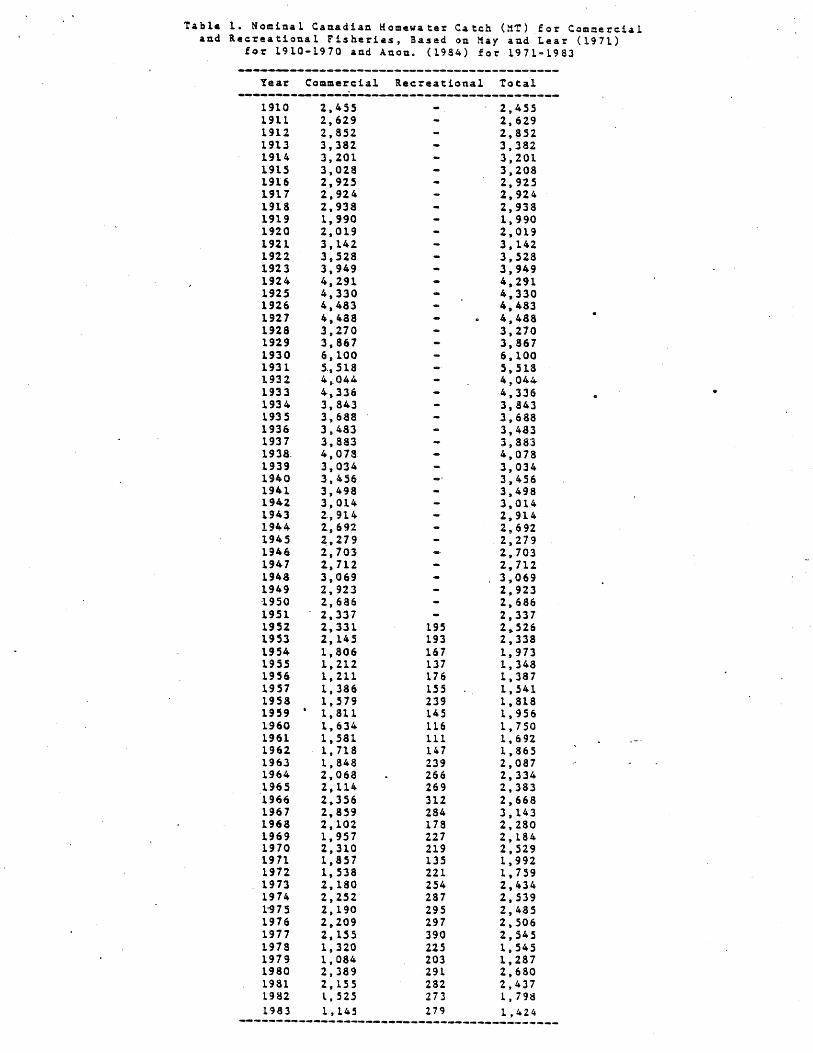
Tab1. 1. Nominal Canadian Komewater Catch (MT) for Commercial and a.creationa1 Fisheries, Based on May and Lear (1971)
for 1910-1970 and Anon. (1984) for 1971 .. 1983
Year Commercial a.ereational Total
1910 1911 1912 1913 1914 1915 1916 1917 1918 1919 1920 1921 1922 1923 1924 1925 1926 1927 1928 1929 1930 1931 1932 1933 1934 1935 1936 1931 1938-1939 1940 1941 1942 1.943 1944 1945 1946 1941 1948 1949 1950 1951 1952 1953 1954 1955 1956 1957 1958 1959 • 1960 1961 1962 1963 1964 1965 1966 1967 1968 1969 1970 1971 1912 1913 1974 1"975 1916 1911 1918 1919 1980 1981 1982 1983
2,455 2,629 2,852 3,382 3,201 3~028 2,925 2,924 2,938 1,990 2,019 3,142 3,528 3,949 4,291 4,330 4,483 4,488 3,210 3,867 6,100 5-,518 4,.044 4~336 3,843 3,688 3,483 3,883 4,018 3,034 3,1+56 3,498 3,014 2.,914 2.,692 2,279 2,703 2,712 3,069 2,923 2,686 2,337 2,331 2,145 1,806 1,212 1,211 1,386 1,579 1,811 1,634 1,581 1,718 1,848 2,068 2,114 2,356 2,859 2,102 1,957 2,310 1,851 1,538 2,180 2,252 2,190 2,209 2,155 1,320 1,084 2,389 2,155 l,S25 1,145
195 193 167 137 116 155 239 145 116 111 147 239 266 269 312 284 118 227 219 135 221 254 287 295 297 390 225 203 291 282 273 279
2,455 2,629 2,852 3,382 3,201 3,208 2,925 2,924 2,938 1,990 2,019 3,142 3,528 3,949 4,291 4,330 4,483 4,488 3,210 3,867 6,100 5,518 4,044-4,336 3,843 3,688 3,483 3,883 4,018 3,034 3,456 3,498 3,014 2,914 2,692 2,219 2,703 2,712 3~069 2,923 2,686 2,337 2.526 2,338 1,913 1,348 1,387 1,541 1,818 1,956 1,750 1 t 692 1,865 2,087 2,334 2,383 2,668 3,143 2,280 2,184 2,529 1,992 1,759 2,434 2,539 2,485 2,506 2,545 1,545 1,281 2,680 2,437 1,798 1,424

Table 2. Nominal Canadian Ho~ewater Catch (MT) of Grilse and Salmon, Based on the 1984 ICES Working
Grou.p Report (Anon. 1984)
Year Grilse Salmon Total
1970 761 1,562 2,323 1971 510 1,482 1,992 1972 558 1,201 1,,759 1973 783 1,651 2,4.34 1914 950 1,589 2,539 1915 912 1,573 2»485 1976 785 1,721 2,506 1917 662 1,883 2,545 1978 320 1,225 1.,545 1979 .. 582 705 1,287 1980 917 1,763 2,680 1981 818 1,619 2,437 1982 716 1,082 1,798 1.983 513 911 1,424-
, .
Table 1. Nominal Homewater Catch (MT) from the U.S. Recreational Fishery, 1960-1983 , Based on the
1984 rCES Working Group Repo~t (Anon. 1984) (+ ~ ~.tch les~ than 2 MT)
~~~~~~-~~~~~~~~~-~~~
Year' Total
--------------------1960 + 1961 + 1962 + 1963 + 1964 + 1965 + 1966 + 1967 + 1968 + 1969 + 1970 + 1971 + 1972 + 1973 2.7 1974 • 9 1975 1.7 1976 .8 1977 2.4 1978 4.1 1979 2.5 1980 5.5 1981 6.0 1982 6. '4 1983 1.3

Year
1952 1953 1954 1955 19·56 1957 1958 1959 1960 1961 1962 1963 1964 1965 1966 1967 1968 1969 1970 1971 1912 1973 1974 1975 1976 1977 1918 1979 1980 1981 1982 1983 Note:
Tabl. 4. Nominal Catches (MT) in a~itish Isles Homewaters, a.sed on the 1984 ICES Working Group Report (Anon. 1984)
Scotlaa.d
Grilse Salmon Total
472 1,302 1,774 440 1,087 1.527 367 1,315 1,682 429 1,331 1,760 355 979 1,334 608 998 1,606 626 1,055 1,681 36& 1,442 1,808
England and
Wales Grilse Salmon l'ota.l
Northerna,b
Irelaa.d
509 927 1,436 283 743 139 424 772 1,196 232 707 132 932 808 1,740 318 1,459 356 530 1,168 1,698 325 1,458 306
1,001 913 1,91lt 307 1,617 377 728 835 1,563 320 1,457 281 836 788 1,624 387 1,238 287 857 1,276 2,133 420 1,463 449 780 183 1,563 282 1,413 312
1,408 539 1,941 377 ° 1 ,730 267 826 530 1 , 329 521 1 • 7 87 29 7 923 496 1,419 426 1,639 234
1,105 588 1,693 442 1,604 200 1,804 210 1,303 661 1,964 450 1,686 244 1,930 182 1.053 578 1,631 383 1,958 170 2,128 t84
892 669 1,661 441 1,942 274 2,216 16~ 682 328 1,010 208 1,452 109 1,561 113 762 369 1,131 345 1,227 145 1,372 110 '42 781 1,323 349 1,082 147 1~230 148 478 ~98 1,075 261 922 105 1,097 ~9 283 SSl 1;134. 360 745 202 947 122 389 843 1;233 493 521 164 685 101 496 596 1,092 286 930 63 993 132 231 361 59·2 424 1,}06 1.50 1,6S6 187·
1952-1959 catches for Scotland estimated by applying mean weight fa.ctors of 3.25kg (grilse) aud 6.48kg (salmon) to c.tehes in number (from 1979 ~ork1ug Group report). Mean weight factors were average values calcul~ted for 1960-1976. ou aive~ yoyl. allocatad SO% !re1and and SO%N. Ire~and
bNot including anglin~ catch (mainly gri15e)

Table S. Nominal Catches (MT) in Continental European Homewater., Based on the 1984 tCES Working Group
Keport (Anon. 1984)
------------------------:..---N;;;;;f:..----------;~:~::----------------------
----------------------- (West Year France Gri~se Salmon Total coast) Finland crssa o
1960 196-1 1962 1963 1964: 1965 1966 1967 1968 1969 1970 1971 1972 1973 1974 1975 1976 1977 1978 1979 1980 1981 198-2 1983
50-100 50-1.00 SO-lOa 50-100 50-100 50-100 50-100 50-100 50-100 50-100 50-100 50-100
34 12 13 25
9 19 20 10 30 20 20 16
582 356-436 514 506-484 4-99 467 470 382 68l 478 467 363 sas
801 815 771
1,054 1,220 1,149 1-, 038 1,063 1,018
668 1,150 1.352 1,189 --98i
945
19 659 1~533 1.,936 1,786 2. p 147 2»000 1,191 1,.960 1~S14 1,383 1,171 1,207 1,568 1,726 1,633 1,537 1,530 1,488 1,050 1.831 1,..830 ·1,656 1 g.3 48 1,.530
40 21" 45 23 36 40 36 25 20 22 20 18 18 23 32 26 20 10 10 12 17 26 25 11a
a3efore L966 se~ trout and sea char included (5% total)
b~ssa catch mainly salmon (2+ sea ~iuter)
32-50 76 16 66 59 37
. 26
-'
34 44
;54 57
1,1.00 790 710 480 590 590 570 883 827 360 448 417 462 772 709 811 a. lla na_
430 631 450 311
lla

Table 6. Nominal Catch (MT) in Iceland Homewaters, Based on the 1984 ~CES Working Group Report (Anori. 1984)
Year To t.al
1960 100 1961 127 1962 125 1963 145 1964 135 1965 133 1966 106 1967 146 1968 162 1969 133 1970 195 1971 204 19-72 250 .. 1973 256 1974 225 1975 266 19.76 225 1.977 230 1978 291 1979 225 1980 249 1981 163 1982 147 1983 198
Table 7. Nominal Catches (MT) for High Seas Interception Fisheries, Based on the 1984 ICES Working Group
.tteport (Anon. 1984)
'.Jest Norwegian Faroese Year Greenland Sea Area
____________________ ... .._ ______ .-_ ...... _ .... ____ ...... .....-4IIt ... ___ ....... __ ...... .-. ____ ,.... ___ \..
1960 60 1961 127 1962 24~ 1963 466 1964 1,539 1965 861 1966 1,370 1967 1,601 77 1968 1,127 403 5 1969 2,210 911 7 1970 2,146 946 12 1971 2,689 488 1972 2,113 506 9 1973 ·2,341 533 28 1974 1,917 373 20 1975 2,030 475 28 1975 1,175 289 40
- 1977 1,426 192 40 1978 992 124 51 1979 1,395 118 194 1980 1,192 155 718 1981 1,264 213 1,125 1982 1 077 593 680 1983 310 383' 740

Year'
1954 1955 195& 1957 1958" 1959 1960 1961 1962-1963 1964-1965 1.966 1967 1:968 1'969 1:970 1.971 1972 1973 1974 1973 1976 1977 1978 1979 1.980 1981 1982 1983
Table 8. Nominal Catches (MT) of Grilse and Salmon in the Commercial and Recreational Fisheries of Newfoundland,
Based on-May and Le~r (1971) for 1954-1968 and CAFSA~ (Anon. 1983) f6r 1969-1983 .
.. Commercial Catch
Grilse Salmon Total
581 456 291 512 547 622 611 403 617 759 705 715 938
1,.257 1,04-7
403 577 980 541 596 1,131' 292 643 935 367 490 857 640 729 1,369 731 566 1,.2.97 590 749 1,339 484 772 1, 256· 396 830 1,226 1~4 491 675 3'91 270 661 580 66·9 1,249 440 654 1,094 421 350 771 292 303 5~5
Recreational Catch
Grilse Salmon 1'0 t.al
32 2 34 31 1 32 26 1 27 2.5 1 26 38 1 39 31 1 32 32 1 33 33 2 35 43 7 50 39 4 43 35 2 37 47 4 51 61 3 64 52 3 55 43 4 47
Grand Total
581 456 291 512 547 622 611 408 617 759 705 715 938
1,257 1,047 1,014 1,169
962 883
1,408 1.,329 1,372 1,291 1,276
718 698
1,300 1 , 158
~26
599 ~~~-~~~~~~~~~~~~~~~~~~~-~-~~~-~~~~~-~-~-~~~~~~~~~~~----~~-~-~~~~~-
Year
~able 9. Nominal Catche$ (MT) of Grilse and Salmon in the Com~ercial and Recreational Fishe~ies of Labrador,
Based on CAFSAC (Anon. 1983)
Commarcial Catch
Grilse Salm.on Total
Recreational Catch
Grilse Salmon Total Grand Total
------------------------------------------------------------------1952 1953 1954 1955 1956 1957 1958 1959 1960 1961 1962 1963 1964 1965· 1966 1967 1968 1969 1970 1971 1972 1973 1974 1975 1976 1977 1978 1979 1980 1981 1982 1983
60 ' 56 75 48 55 57 56 60 4-2 82 61 62 85 63 62 84 63 82
107 14q 105 132 111 208 153 142
57 92
221 245 157
87
298 251 340 218 249 258 250 268 188 367 272 276 381 283 2130 376 285 379 351-501 432. 5·G7 603 497 603
'570 378 233 632 569 391 257
328 307 4,15 266 304 .315 305 328 230 449 333 338 466 346 342 460 348 461 458 641 537 639 714-705 756 712 435 325 853 814 548 344
1 + + 2 2 2. + 1 2. 3 4
- 3 4 2, 4 3 5 6 S
12 4 6 6 6 4 6 6 7 6 4
1 +
+ + + + 1 + + 1 1 2 1 2 1 1 1 2 3 3 1 3 4-4 3 . 3 2 3 2
2 + + 2 2 2. + 2 2 3 5 4 6 3 6 4 6 7 7
15 , 7
7 9
10 8 9 9 9 9 6
Numbers converted to ~eight assuming 1.9 kg per gri1se and 4.5 kg per salmon
328 307 417 266 304 317 307 330 230 451 335 341 471 350 348 463 354-465 464 648 544-654-721 712 765 722 443 334 862 823 557 350

,. = -:: u. ..... ¢ ~
.J, <I: z -z: Q Z.
CF1NAOA·
7500
6000
4S00
lOOO
1500
Q~~~~~~~~~~~~MT~~"ITMTMTnTMTM~~~~' .
10· IS %0 %5 30 3S 40 46 sa 56 60 RNNUAL CATAI 19.10· 1983
55 70 75 so
Fig u.r e 1. Nom ina 1 'c a t c h (M.T) 0 fAt 1 ant i c sal m 0 n inC a n a d a •
CRNROA
a 14
... a: C..I
~ = 12 z 0 ... <I:
"" =:. C..I
"" 10 =: ... z loW U =: loW ~ a
S+-~~~~~~-r~~~~~~~~-r~~~~~~~~I~
52 54 S5 58 50 52 64 56 sa 70 1% 14 75 60 ez RNNUAL OATA: 1952 - 1983
Figure 2. Proportion of recreational component of nominal catch of Atlantic salmon in Canada.
-1:
== u .. = u--' a: z -z: c z
%500
%000
lSQQ
. , .. 1000 " .
-, soa I \
I
.' , .
SCOTLANO
" OR IlSE , \ ~, \ , \
: " I '. '.' r\. ,
• 1.\ I ,' ........... , '"j \ I ,.oJ' •
I " I \
\ , ...... , tI
' .... ,.;' SRll"lON'
.g ••••
O~~~~~~~~~~~~~~~~~~~~~-r~~~~
SZ 54- 56 sa 60 5% 64. 66 58 70 7% 14 76 78 eo !% ANHUA~ OATR: 19S% - 1983
Figure 3. Nominal catch (MT) of Atlantic salmon in Scotland.
,.. 1:
U .. = !..J
.oJ =-z -z: Q Z
eNGlANO ANO WALeS .'
ssa
480
4QO
320
240
L50 I I SO 51 52 53 84 5S 56 67 158 55 7Q 11 72 73 7. 7S i5 77 78 79 eo 81 ez e~
ANNUAL OATR: 19S0 - 1983
Figure 4. Nominal catch (MT) of Atl~ntic salmon in England and Wales.
10
..

.... ::
:: u ~ G: u ...a cz: z -z: c z
IRELANO
2S0a
2Doa
ISOO
1000
soa
. ... •.•.• S.Al110N •.... . ,I: ••• , , • , .• ' ...
Q I I SO. 51 52 53 S" 65 S5 57 6a 5S 7a 71 7'Z 13 1-4 75 76 77 18 79 eo 81 82 6.3
AAHUA\. OATA:. 19 60 • 1983
Figure 5. N~minal catch (MT) of Atlantic salmon in Ireland.
,.. ::
1: u -=-U
...I c: =. = Q. z
NORTHERN IRELANO
,so
'00
320
24Q
160
!a~~I--~~~~~~~~~~--~~~~~~~~~~--~
SO 51 52 53 6" 55 55 67 58 5S 70 11 7'Z 73 74 75 75 71 78 79 80 81 82 83 AHHUA\. CATR: 19S0· 1983
Figure 6. Nominal catch (MT) of. Atlantic salmon i:1 Northern Ireland.

~
::
:I: u ~
c: u
-' a: :: J: = z
FRANCE
1S~----------------------~
so
4.5
30
15
O+-~~~I~~~~~~I~--~~~~~~~~~~~~~~
eo 51 5Z 53 5~ 6S 56 51 68 59 7Q 71 7~ 73 74 7S 7& 77 78 19 ao Sl 52 8S RNNUA~ OATRa 1960· 1983
Figure 7. Nominal catch (MT) of Atlantic salmon in France.
-... ::
%sOQ
ZOOO
= lSllO u ... =: u
-' i 1000 -z: Q Z
seo
NORWAT
. '. .. .......... " I •
Si11110N • " ".
.......
a+-~~~~--~~~~~~~~~~~~--~~~~~~--~
eo e1 52 53 64 65 66 57 68 55 70 11 12 73 74 75 16 77 78 73 ao at 82 8S AN~~ DATAa 1960· 1983
Fig u r e 8. Nom ina 1 cat c h' (M T ) 0 fAt 1 ant i c sal m 0 n inN 0 rw a y •

~81
I 'Q~
:
32
1 e 24
uj · a I ( I i I I I I I I I I I I I I I
SO 51 52 53 S~ 6& 55 57 sa 59 70 7\ 72 73 7. 15 75 77 78 i9 eo 5t S2 ANNUAL QAfAt 1960· L982
Figure 9. Nominal catch (MT) of Atlantic salmon in Sweden (Wast Coast)e
-~ : : ~
; ~
USSR·
::::~ \
sao
aao f\ jaG
%OQ~~~~~~~--~~~I~~~~~~~I~~~~~~~
sa 51 12 53 6~ 56 S6 57 58 59 70 7\ 1% 73 7~ 'S 75 71 78 19 sa st S2 ~NMUAL QAfAt 1510· 1982
Figure lO. Nominal catch (MT) of Atlantic salmon in the USSR.

•
.... z: -:: u .. = Coi
..,j c: z -I: Q Z
ICELANO
3SIl
3ao
ZSO
zoo
ISO
100 I SO 51 S2 53 54 5S as 5i sa 59 10 71 72 73 74 7S 76 71 7e 79 eo 81 az 83
AHNUA~ DATA: 19S0· 1983
Figu~e L1. Nominal c~tch (MT) of Atlantic salmon in Iceland."
.. z:
:: u ... = c..I
-' c: z -%: Q Z
HlOH" SERS INTERCEPTION FISHERIES
4000
32QO
Z4QO , "
, - , "
, \ , \
latiD \ I WEST GREENLANO ,~~
\ \
" eao .. NQRWEGIAN SER
........... 't. " ... .... \ .,
a~~~~I~~~~·i~~I~~~~~I~~~I~~~~~~~-r~
so 51 62 S3 54 5S 55 6i 5a 69 70 71 7Z 73 74 7S 75 77 78 79 so 81 az 63 ANNUA~ OATR: 1960· 19a3
Figure 12. Nominal catch (MT) of Atlantic salmon in the high seas interception fisheries.

l~aa
12110
'IOlJ .... I: -:: u « SDtJ '"
loa
. ~\ S .. bo a, • .,.-./-'\U._ \
) '\ ,. . \
.,. ... \ I.: '.'"00 '. '. \ '\ ,. 0 &. \ .: ., 1"0 \
\., .. " \ :, ,'.
. \", '\ ". :"'1
M sa 'I 50 S2 &4 S8 68 70 '2' '14 ,. '8 aa 1% lEJ;.'
Figure l~G Nominal com~ercial catch (MT) of Atlantic salmon in Newfoundland ..
c
~A8RAOQR CCMMERCIR~
loaa 1
soa
sao
ZDO
"
.. ... . ....... .. -......... .
J' , , I ,
I
1\ ,'" ""SallDon 1 \,'
Gr115e, .... ·· ... .... . .....
" '.
S2. 5<1 51 sa so 5: 64 68 sa 7a 12 74 7S TEAR
: .'0
"
'.
. ....
aa 52
Figure 14. Nominal commercial catch (MT) of Atlantic salmon in Labrador.
Related Documents