i-ALERT ® Monitoring Solution Sensor | App | Ai Platform Application Guide

Welcome message from author
This document is posted to help you gain knowledge. Please leave a comment to let me know what you think about it! Share it to your friends and learn new things together.
Transcript
i-ALERT®Monitoring Solution
Sensor | App | Ai Platform
Application Guide
2 i-ALERT®2 Application Guide
Table of ContentsIntroduction ...............................................................................................................................................................3 How i-ALERT2 monitor augments a condition monitoring program .............................................................................4Reliability ....................................................................................................................................................................5 Reliability Overview .....................................................................................................................................................5 Introduction to condition monitoring ..........................................................................................................................6System Overview .......................................................................................................................................................8 Device technology background ....................................................................................................................................8Application Best Practices .......................................................................................................................................10 Choosing the correct measures and assets .................................................................................................................10 Machine selection criteria ..........................................................................................................................................11 Where to start? .........................................................................................................................................................12 Condition monitoring measures ................................................................................................................................13Installation Best Practices .......................................................................................................................................15 Mounting locations ...................................................................................................................................................15 Mounting methods ...................................................................................................................................................18Commissioning ........................................................................................................................................................18 Activate the i-ALERT2 Equipment Health Monitor ......................................................................................................18 Resetting the i-ALERT2 ..............................................................................................................................................18 i-ALERT2 Equipment Health Monitor routine operation ..............................................................................................19 i-ALERT2 Equipment Health Monitor troubleshooting ................................................................................................19i-ALERT2 Mobile App Operation .............................................................................................................................20 Installing the App ......................................................................................................................................................20 Connecting to the i-ALERT2 devices ...........................................................................................................................20 Sensor Registration ...................................................................................................................................................21 Dashboard ................................................................................................................................................................33 Trending ...................................................................................................................................................................33 Advanced tools .........................................................................................................................................................36 Equipment information .............................................................................................................................................37 Report generator .......................................................................................................................................................40 Routes ......................................................................................................................................................................41 Help / FAQ ................................................................................................................................................................44 Service locator ...........................................................................................................................................................44 User setting ..............................................................................................................................................................45Technical references ................................................................................................................................................45
i-ALERT®2 Application Guide 3
IntroductionThis guide is designed to assist reliability practitioners in optimizing the performance of their rotating equipment assets using modern condition monitoring technologies.
Traditional condition monitoring techniques and budget constraints force practitioners to make difficult choices as to which pieces of equipment they can focus on while relegating many of the less critical assets to a suboptimal time based maintenance regime or a “fix it when it breaks” mentality. Even in those plants that do perform periodic predictive maintenance (PdM) inspections, the frequency or time between inspections is a month or more, sometimes up to a year. Many failure mechanisms can develop and progress into catastrophic failure well before the next inspection, rendering the PdM program ineffectual for “balance of plant” equipment.
Using the latest Micro-Electromechanical Sensors (MEMS) and Bluetooth® wireless communications technologies ITT has created a tool that better fits the needs of reliability practitioners.
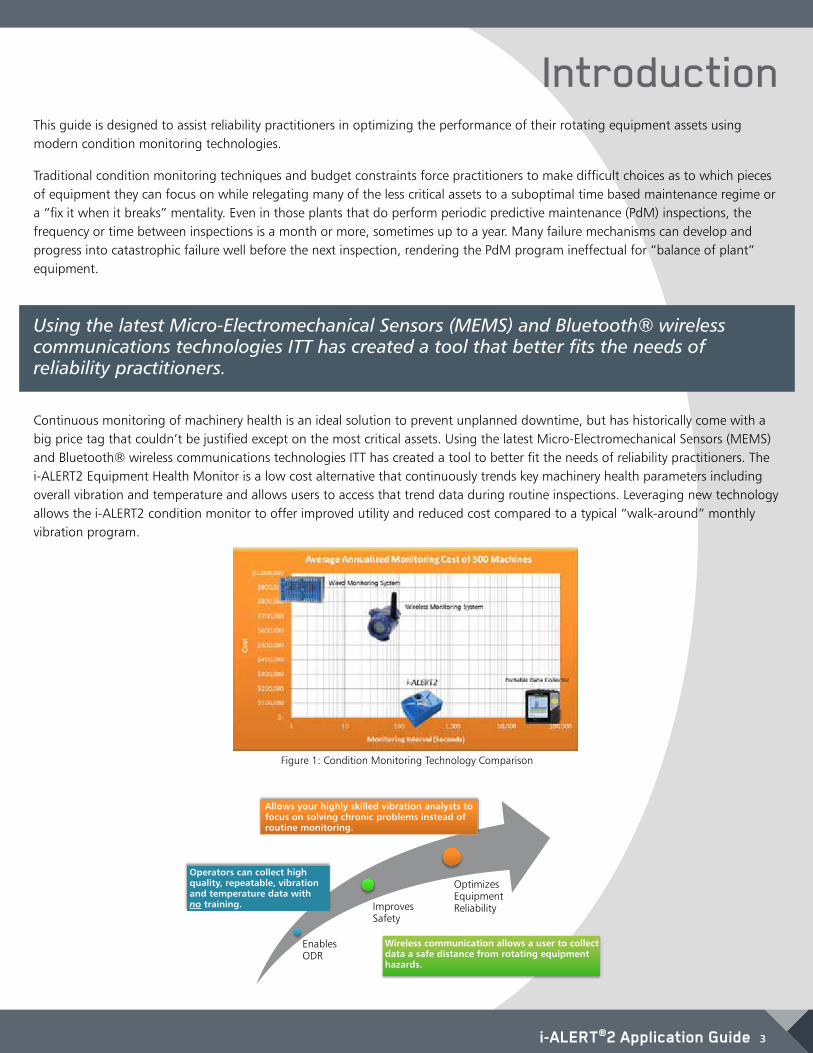
Continuous monitoring of machinery health is an ideal solution to prevent unplanned downtime, but has historically come with a big price tag that couldn’t be justified except on the most critical assets. Using the latest Micro-Electromechanical Sensors (MEMS) and Bluetooth® wireless communications technologies ITT has created a tool to better fit the needs of reliability practitioners. The i-ALERT2 Equipment Health Monitor is a low cost alternative that continuously trends key machinery health parameters including overall vibration and temperature and allows users to access that trend data during routine inspections. Leveraging new technology allows the i-ALERT2 condition monitor to offer improved utility and reduced cost compared to a typical “walk-around” monthly vibration program.
Figure 1: Condition Monitoring Technology Comparison
Allows your highly skilled vibration analysts to focus on solving chronic problems instead of routine monitoring.
Operators can collect high quality, repeatable, vibration and temperature data with no training.
Wireless communication allows a user to collect data a safe distance from rotating equipment hazards.
Optimizes Equipment ReliabilityImproves
Safety
Enables ODR
4 i-ALERT®2 Application Guide
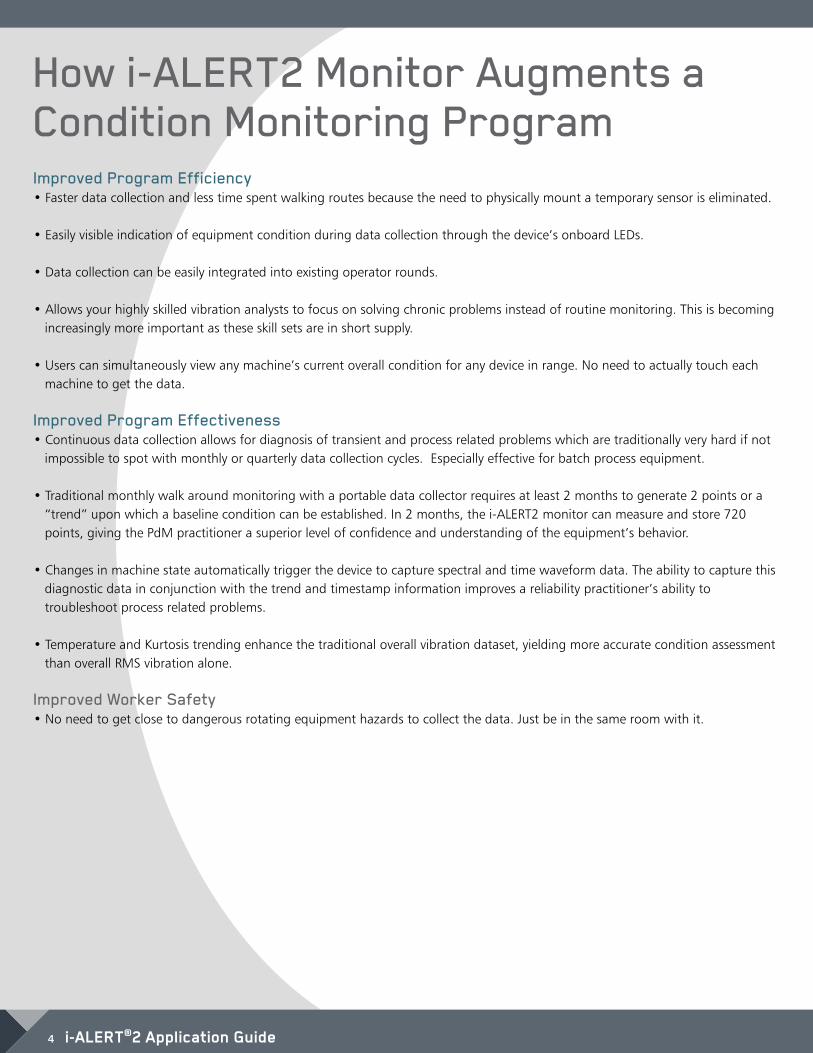
How i-ALERT2 Monitor Augments a Condition Monitoring ProgramImproved Program Efficiency • Faster data collection and less time spent walking routes because the need to physically mount a temporary sensor is eliminated. • Easily visible indication of equipment condition during data collection through the device’s onboard LEDs. • Data collection can be easily integrated into existing operator rounds. • Allows your highly skilled vibration analysts to focus on solving chronic problems instead of routine monitoring. This is becoming increasingly more important as these skill sets are in short supply. • Users can simultaneously view any machine’s current overall condition for any device in range. No need to actually touch each machine to get the data. Improved Program Effectiveness • Continuous data collection allows for diagnosis of transient and process related problems which are traditionally very hard if not impossible to spot with monthly or quarterly data collection cycles. Especially effective for batch process equipment. • Traditional monthly walk around monitoring with a portable data collector requires at least 2 months to generate 2 points or a “trend” upon which a baseline condition can be established. In 2 months, the i-ALERT2 monitor can measure and store 720 points, giving the PdM practitioner a superior level of confidence and understanding of the equipment’s behavior. • Changes in machine state automatically trigger the device to capture spectral and time waveform data. The ability to capture this diagnostic data in conjunction with the trend and timestamp information improves a reliability practitioner’s ability to troubleshoot process related problems. • Temperature and Kurtosis trending enhance the traditional overall vibration dataset, yielding more accurate condition assessment than overall RMS vibration alone. Improved Worker Safety • No need to get close to dangerous rotating equipment hazards to collect the data. Just be in the same room with it.
i-ALERT®2 Application Guide 5
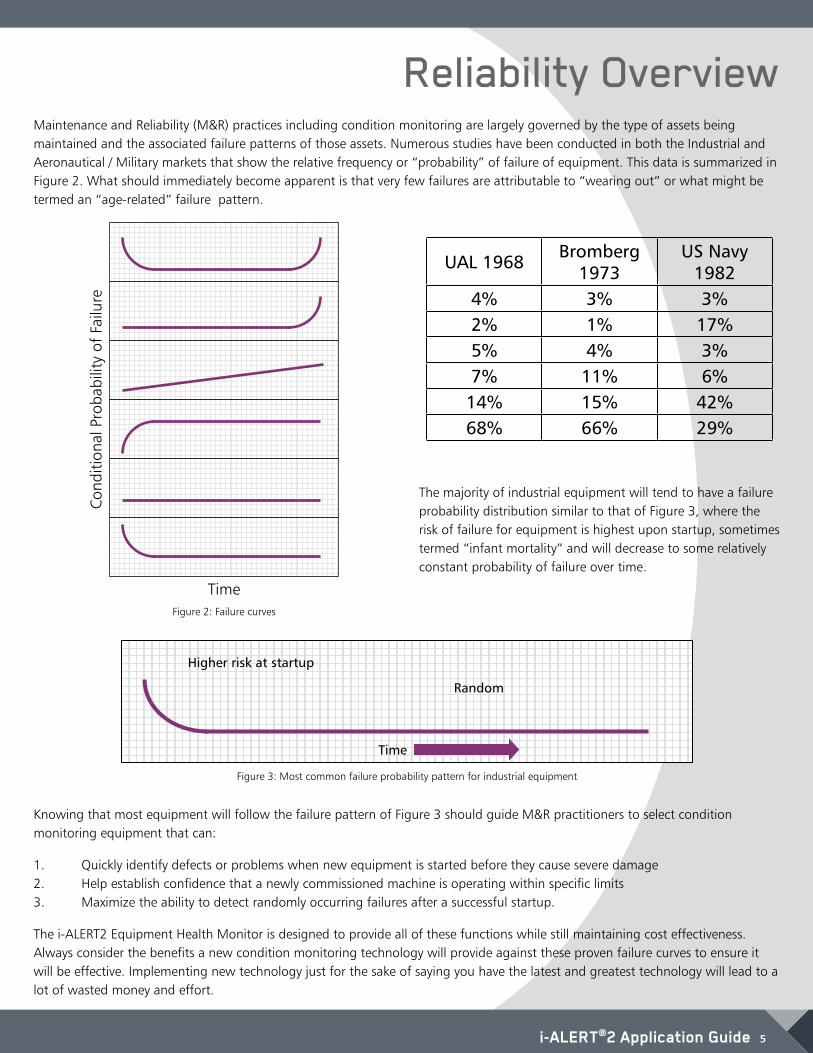
Reliability OverviewMaintenance and Reliability (M&R) practices including condition monitoring are largely governed by the type of assets being maintained and the associated failure patterns of those assets. Numerous studies have been conducted in both the Industrial and Aeronautical / Military markets that show the relative frequency or “probability” of failure of equipment. This data is summarized in Figure 2. What should immediately become apparent is that very few failures are attributable to “wearing out” or what might be termed an “age-related” failure pattern.
Time
Cond
ition
al P
roba
bilit
y of
Fai
lure
UAL 1968 Bromberg 1973
US Navy 1982
4% 3% 3%2% 1% 17%5% 4% 3%7% 11% 6%14% 15% 42%68% 66% 29%
The majority of industrial equipment will tend to have a failure probability distribution similar to that of Figure 3, where the risk of failure for equipment is highest upon startup, sometimes termed “infant mortality” and will decrease to some relatively constant probability of failure over time.
Figure 2: Failure curves
Higher risk at startup
Random
Time
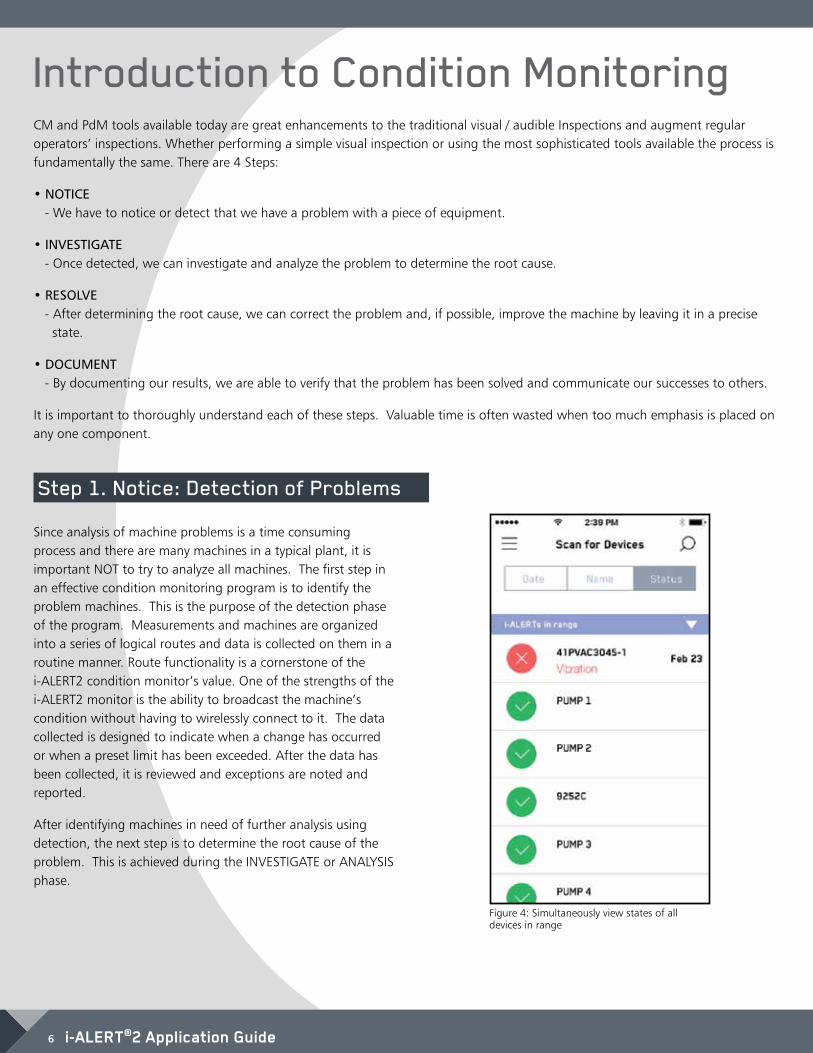
Knowing that most equipment will follow the failure pattern of Figure 3 should guide M&R practitioners to select condition monitoring equipment that can:
1. Quickly identify defects or problems when new equipment is started before they cause severe damage 2. Help establish confidence that a newly commissioned machine is operating within specific limits 3. Maximize the ability to detect randomly occurring failures after a successful startup.
The i-ALERT2 Equipment Health Monitor is designed to provide all of these functions while still maintaining cost effectiveness. Always consider the benefits a new condition monitoring technology will provide against these proven failure curves to ensure it will be effective. Implementing new technology just for the sake of saying you have the latest and greatest technology will lead to a lot of wasted money and effort.
Figure 3: Most common failure probability pattern for industrial equipment
6 i-ALERT®2 Application Guide
Introduction to Condition MonitoringCM and PdM tools available today are great enhancements to the traditional visual / audible Inspections and augment regular operators’ inspections. Whether performing a simple visual inspection or using the most sophisticated tools available the process is fundamentally the same. There are 4 Steps:
• NOTICE - We have to notice or detect that we have a problem with a piece of equipment.
• INVESTIGATE - Once detected, we can investigate and analyze the problem to determine the root cause.
• RESOLVE - After determining the root cause, we can correct the problem and, if possible, improve the machine by leaving it in a precise state.
• DOCUMENT - By documenting our results, we are able to verify that the problem has been solved and communicate our successes to others.
It is important to thoroughly understand each of these steps. Valuable time is often wasted when too much emphasis is placed on any one component.
Step 1. Notice: Detection of Problems
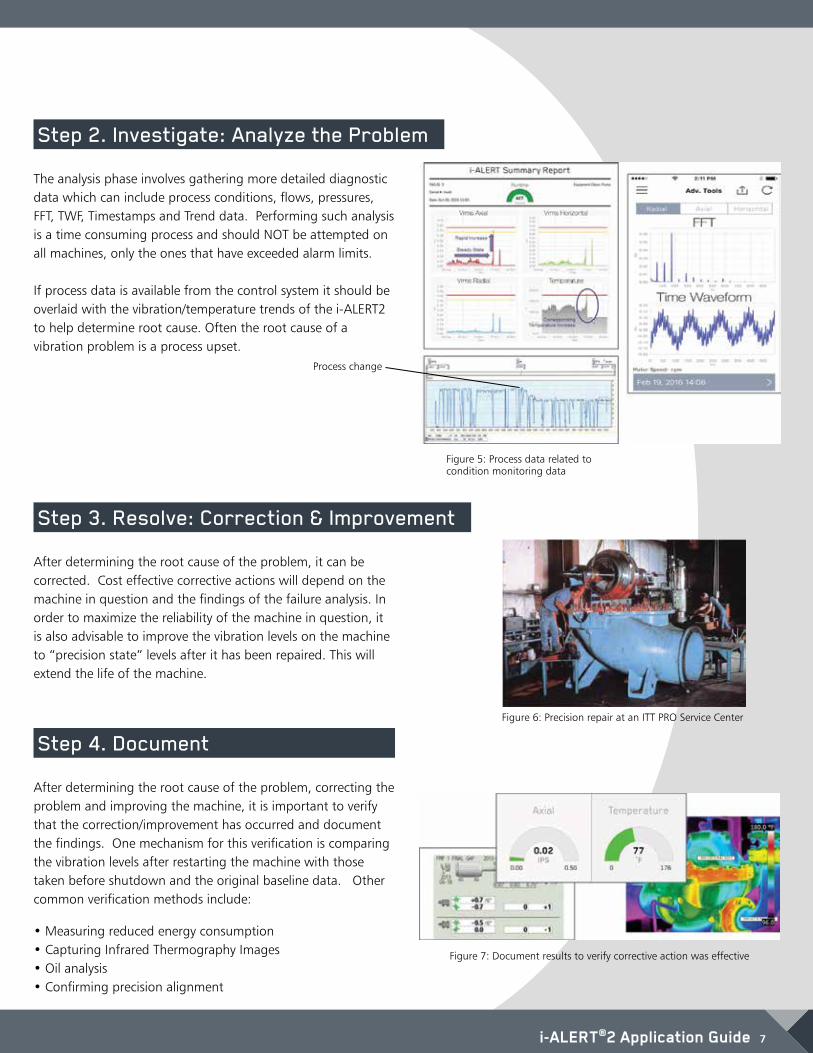
Since analysis of machine problems is a time consuming process and there are many machines in a typical plant, it is important NOT to try to analyze all machines. The first step in an effective condition monitoring program is to identify the problem machines. This is the purpose of the detection phase of the program. Measurements and machines are organized into a series of logical routes and data is collected on them in a routine manner. Route functionality is a cornerstone of the i-ALERT2 condition monitor’s value. One of the strengths of the i-ALERT2 monitor is the ability to broadcast the machine’s condition without having to wirelessly connect to it. The data collected is designed to indicate when a change has occurred or when a preset limit has been exceeded. After the data has been collected, it is reviewed and exceptions are noted and reported.
After identifying machines in need of further analysis using detection, the next step is to determine the root cause of the problem. This is achieved during the INVESTIGATE or ANALYSIS phase.
Figure 4: Simultaneously view states of all devices in range
i-ALERT®2 Application Guide 7
Step 2. Investigate: Analyze the Problem
The analysis phase involves gathering more detailed diagnostic data which can include process conditions, flows, pressures, FFT, TWF, Timestamps and Trend data. Performing such analysis is a time consuming process and should NOT be attempted on all machines, only the ones that have exceeded alarm limits. If process data is available from the control system it should be overlaid with the vibration/temperature trends of the i-ALERT2 to help determine root cause. Often the root cause of a vibration problem is a process upset.
Figure 5: Process data related to condition monitoring data
Process change
Step 3. Resolve: Correction & Improvement
After determining the root cause of the problem, it can be corrected. Cost effective corrective actions will depend on the machine in question and the findings of the failure analysis. In order to maximize the reliability of the machine in question, it is also advisable to improve the vibration levels on the machine to “precision state” levels after it has been repaired. This will extend the life of the machine.
Figure 6: Precision repair at an ITT PRO Service Center
Step 4. Document
After determining the root cause of the problem, correcting the problem and improving the machine, it is important to verify that the correction/improvement has occurred and document the findings. One mechanism for this verification is comparing the vibration levels after restarting the machine with those taken before shutdown and the original baseline data. Other common verification methods include:
• Measuring reduced energy consumption • Capturing Infrared Thermography Images • Oil analysis • Confirming precision alignment
Figure 7: Document results to verify corrective action was effective
8 i-ALERT®2 Application Guide
System OverviewDevice Technology Background Micro-Electro-Mechanical Systems, or MEMS, is a technology that is best defined as miniaturized mechanical and electro-mechanical elements that are made using the techniques of microfabrication. MEMS represent the next generation of sensing technology. OEMs in all industries including automotive, industrial and aerospace are migrating away from older macro-scale transducers due the various advantages MEMS can provide. The physical dimensions of MEMS devices can be less than a micron up to several millimeters. MEMS devices can vary from relatively simple structures having no moving elements, to extremely complex electromechanical systems with multiple moving elements under the control of integrated microelectronics. One of the most prevalent uses for MEMS is the construction of miniaturized sensors that convert energy from one form to another, known as transducers. In the case of MEMS sensors, the device typically converts a measured mechanical signal into an electrical signal.
Over the past several decades a large number of micro-sensors have been developed for almost every type of physical measurement including temperature, pressure, inertial forces, vibration, magnetic fields, etc. Surprisingly many of these MEMS sensors have proven to be more accurate and precise than their macro-scale counterparts. In example, the MEMS version of a pressure transducer usually outperforms a pressure sensor made using the most precise macro-scale level machining techniques. Not only is the performance of MEMS devices exceptional, but their method of production leverages the same batch fabrication techniques used in the integrated circuit industry – which translates into low per-unit production costs.
The latest generation of MEMS includes micro-sensors, micro-actuators and micro-electronics integrated onto a single microchip. This has resulted in the explosive development of smart products which integrate computing intelligence with sensing and control. Because MEMS devices are manufactured using batch fabrication techniques, similar to integrated circuits, high levels of reliability are being achieved at very low costs. The i-ALERT2 monitor leverages recent advancements in MEMS vibration transducers to achieve impressive performance at a minimum cost. The sensors’ data gathering capabilities are then mated to another leading technology known as Bluetooth Smart or Bluetooth Low Energy.
Bluetooth is a wireless signal protocol that was first developed in 1994 as a way for computers to communicate to other devices without cables. Bluetooth is an open standard that allows disparate devices to communicate using the same “language”. Over the last few decades the technology has been steadily improved to be able to transmit more data faster while simultaneously reducing the amount of power the wireless radios consumed. Bluetooth Smart allows tiny batteries to power wireless radios for years at a time without recharging and is one of the technologies enabling the rapid rise of the Industrial Internet of Things (IIOT). IIOT is a term that describes the reality of hundreds (or thousands) of smart devices communicating hordes of data to enable smarter, more efficient operations.
Many of the existing condition monitoring hardware manufacturers are aware of the potential for MEMS and Smart sensors however they are reluctant to offer this new technology due to the potential for cannibalization of their existing macro-scale sensor products. ITT is free from this commercial constraint and will continue to utilize the best and latest technology that allows our customers to optimize the reliability of their rotating equipment assets. Device Overview The i-ALERT2 Equipment Health Monitor is a compact, battery-operated monitoring device that continuously measures the vibration and temperature of a piece of rotating equipment. The i-ALERT2 Equipment Health Monitor uses blinking red LED and wireless notification to alert operators when the equipment exceeds vibration and temperature limits. This allows the operator to make changes to the process or the equipment before catastrophic failure occurs. The Equipment Health Monitor is also equipped with a single green LED to indicate when it is operational and has sufficient battery life. The i-ALERT2 Equipment Health Monitor also contains a Bluetooth radio that communicates to certain Bluetooth 4.0 equipped devices through a mobile application. Data is shared between the i-ALERT2 Equipment Health Monitor, the mobile application, phone, and the data servers.
i-ALERT®2 Application Guide 9
The i-ALERT2 Equipment Health Monitor will communicate sensor related data (such as vibration, temperature, runtime information, and device statistics) stored in the device to the mobile application. The mobile application will send commands to the device.
The Mobile application will back up device data as well as app usage information on the data servers. The data servers will send the mobile application equipment technical data. For full details about data storage and rights please review the Privacy Policy.
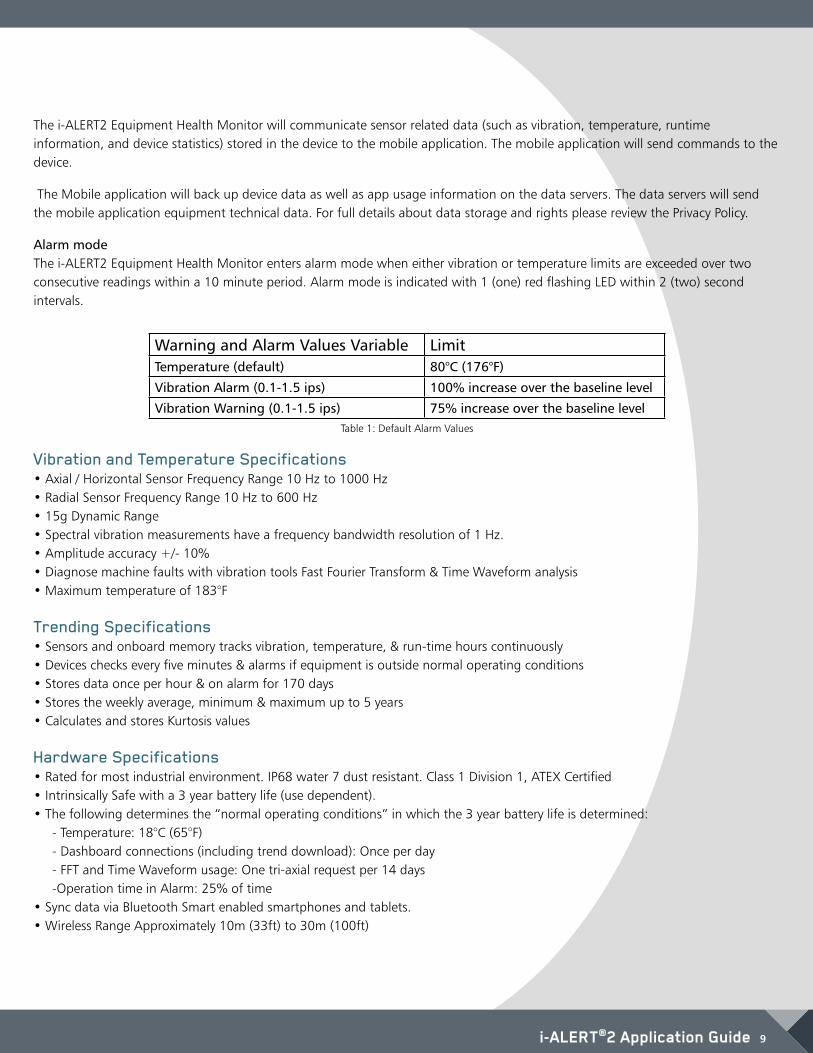
Alarm mode The i-ALERT2 Equipment Health Monitor enters alarm mode when either vibration or temperature limits are exceeded over two consecutive readings within a 10 minute period. Alarm mode is indicated with 1 (one) red flashing LED within 2 (two) second intervals.
Warning and Alarm Values Variable LimitTemperature (default) 80°C (176°F)
Vibration Alarm (0.1-1.5 ips) 100% increase over the baseline level
Vibration Warning (0.1-1.5 ips) 75% increase over the baseline level
Vibration and Temperature Specifications • Axial / Horizontal Sensor Frequency Range 10 Hz to 1000 Hz • Radial Sensor Frequency Range 10 Hz to 600 Hz • 15g Dynamic Range • Spectral vibration measurements have a frequency bandwidth resolution of 1 Hz. • Amplitude accuracy +/- 10% • Diagnose machine faults with vibration tools Fast Fourier Transform & Time Waveform analysis • Maximum temperature of 183°F Trending Specifications • Sensors and onboard memory tracks vibration, temperature, & run-time hours continuously • Devices checks every five minutes & alarms if equipment is outside normal operating conditions • Stores data once per hour & on alarm for 170 days • Stores the weekly average, minimum & maximum up to 5 years • Calculates and stores Kurtosis values Hardware Specifications • Rated for most industrial environment. IP68 water 7 dust resistant. Class 1 Division 1, ATEX Certified • Intrinsically Safe with a 3 year battery life (use dependent). • The following determines the “normal operating conditions” in which the 3 year battery life is determined: - Temperature: 18°C (65°F) - Dashboard connections (including trend download): Once per day - FFT and Time Waveform usage: One tri-axial request per 14 days -Operation time in Alarm: 25% of time • Sync data via Bluetooth Smart enabled smartphones and tablets. • Wireless Range Approximately 10m (33ft) to 30m (100ft)
Table 1: Default Alarm Values
10 i-ALERT®2 Application Guide
Application Best PracticesChoosing the Correct Measures and Assets
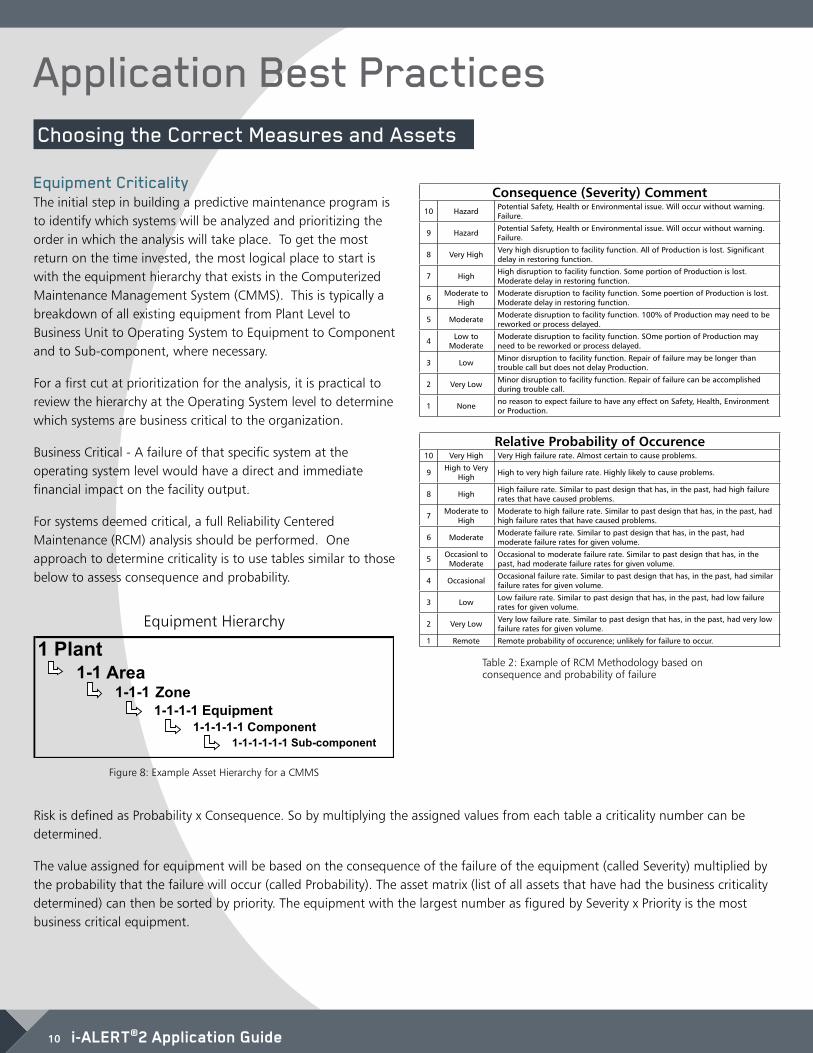
Equipment Criticality The initial step in building a predictive maintenance program is to identify which systems will be analyzed and prioritizing the order in which the analysis will take place. To get the most return on the time invested, the most logical place to start is with the equipment hierarchy that exists in the Computerized Maintenance Management System (CMMS). This is typically a breakdown of all existing equipment from Plant Level to Business Unit to Operating System to Equipment to Component and to Sub-component, where necessary.
For a first cut at prioritization for the analysis, it is practical to review the hierarchy at the Operating System level to determine which systems are business critical to the organization.
Business Critical - A failure of that specific system at the operating system level would have a direct and immediate financial impact on the facility output.
For systems deemed critical, a full Reliability Centered Maintenance (RCM) analysis should be performed. One approach to determine criticality is to use tables similar to those below to assess consequence and probability.
AreaZone
Figure 8: Example Asset Hierarchy for a CMMS
Equipment Hierarchy
Consequence (Severity) Comment10 Hazard Potential Safety, Health or Environmental issue. Will occur without warning.
Failure.
9 Hazard Potential Safety, Health or Environmental issue. Will occur without warning. Failure.
8 Very High Very high disruption to facility function. All of Production is lost. Significant delay in restoring function.
7 High High disruption to facility function. Some portion of Production is lost. Moderate delay in restoring function.
6 Moderate to High
Moderate disruption to facility function. Some poertion of Production is lost. Moderate delay in restoring function.
5 Moderate Moderate disruption to facility function. 100% of Production may need to be reworked or process delayed.
4 Low to Moderate
Moderate disruption to facility function. SOme portion of Production may need to be reworked or process delayed.
3 Low Minor disruption to facility function. Repair of failure may be longer than trouble call but does not delay Production.
2 Very Low Minor disruption to facility function. Repair of failure can be accomplished during trouble call.
1 None no reason to expect failure to have any effect on Safety, Health, Environment or Production.
Relative Probability of Occurence10 Very High Very High failure rate. Almost certain to cause problems.
9 High to Very High High to very high failure rate. Highly likely to cause problems.
8 High High failure rate. Similar to past design that has, in the past, had high failure rates that have caused problems.
7 Moderate to High
Moderate to high failure rate. Similar to past design that has, in the past, had high failure rates that have caused problems.
6 Moderate Moderate failure rate. Similar to past design that has, in the past, had moderate failure rates for given volume.
5 Occasionl to Moderate
Occasional to moderate failure rate. Similar to past design that has, in the past, had moderate failure rates for given volume.
4 Occasional Occasional failure rate. Similar to past design that has, in the past, had similar failure rates for given volume.
3 Low Low failure rate. Similar to past design that has, in the past, had low failure rates for given volume.
2 Very Low Very low failure rate. Similar to past design that has, in the past, had very low failure rates for given volume.
1 Remote Remote probability of occurence; unlikely for failure to occur.
Table 2: Example of RCM Methodology based on consequence and probability of failure
Risk is defined as Probability x Consequence. So by multiplying the assigned values from each table a criticality number can be determined.
The value assigned for equipment will be based on the consequence of the failure of the equipment (called Severity) multiplied by the probability that the failure will occur (called Probability). The asset matrix (list of all assets that have had the business criticality determined) can then be sorted by priority. The equipment with the largest number as figured by Severity x Priority is the most business critical equipment.
i-ALERT®2 Application Guide 11
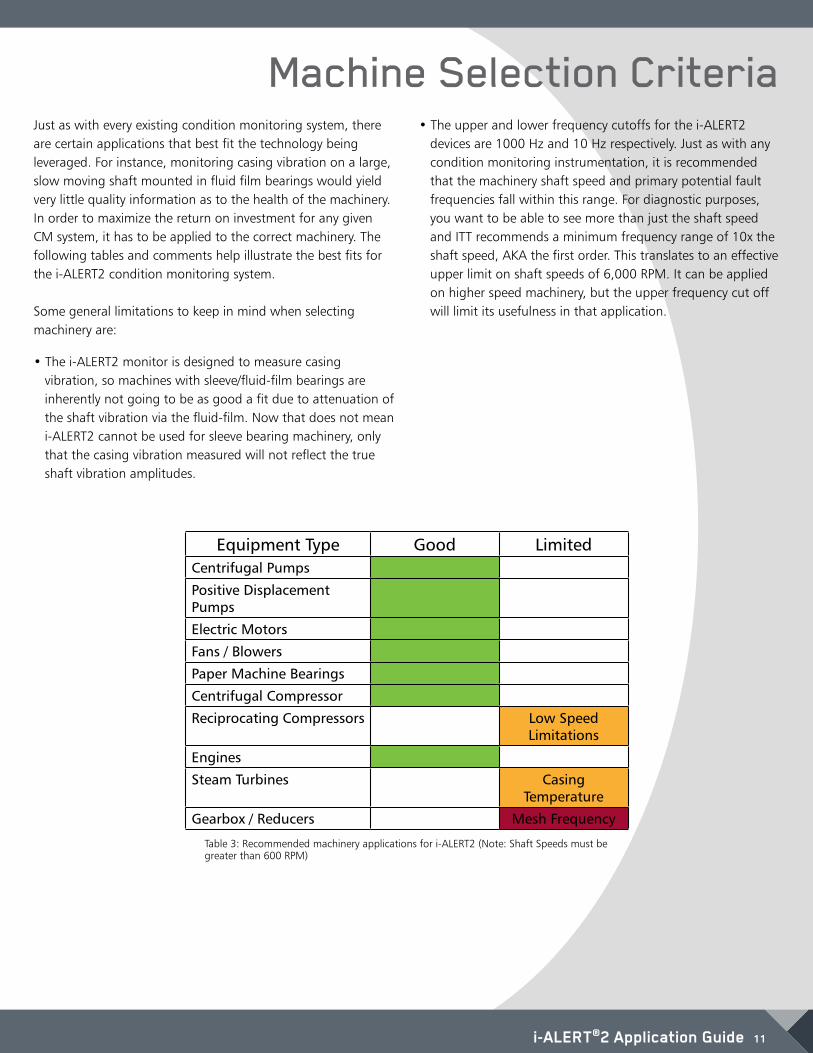
Just as with every existing condition monitoring system, there are certain applications that best fit the technology being leveraged. For instance, monitoring casing vibration on a large, slow moving shaft mounted in fluid film bearings would yield very little quality information as to the health of the machinery. In order to maximize the return on investment for any given CM system, it has to be applied to the correct machinery. The following tables and comments help illustrate the best fits for the i-ALERT2 condition monitoring system. Some general limitations to keep in mind when selecting machinery are:
• The i-ALERT2 monitor is designed to measure casing vibration, so machines with sleeve/fluid-film bearings are inherently not going to be as good a fit due to attenuation of the shaft vibration via the fluid-film. Now that does not mean i-ALERT2 cannot be used for sleeve bearing machinery, only that the casing vibration measured will not reflect the true shaft vibration amplitudes.
Equipment Type Good LimitedCentrifugal Pumps
Positive Displacement Pumps
Electric Motors
Fans / Blowers
Paper Machine Bearings
Centrifugal Compressor
Reciprocating Compressors Low Speed Limitations
Engines
Steam Turbines Casing Temperature
Gearbox / Reducers Mesh Frequency
• The upper and lower frequency cutoffs for the i-ALERT2 devices are 1000 Hz and 10 Hz respectively. Just as with any condition monitoring instrumentation, it is recommended that the machinery shaft speed and primary potential fault frequencies fall within this range. For diagnostic purposes, you want to be able to see more than just the shaft speed and ITT recommends a minimum frequency range of 10x the shaft speed, AKA the first order. This translates to an effective upper limit on shaft speeds of 6,000 RPM. It can be applied on higher speed machinery, but the upper frequency cut off will limit its usefulness in that application.
Table 3: Recommended machinery applications for i-ALERT2 (Note: Shaft Speeds must be greater than 600 RPM)
Machine Selection Criteria
12 i-ALERT®2 Application Guide
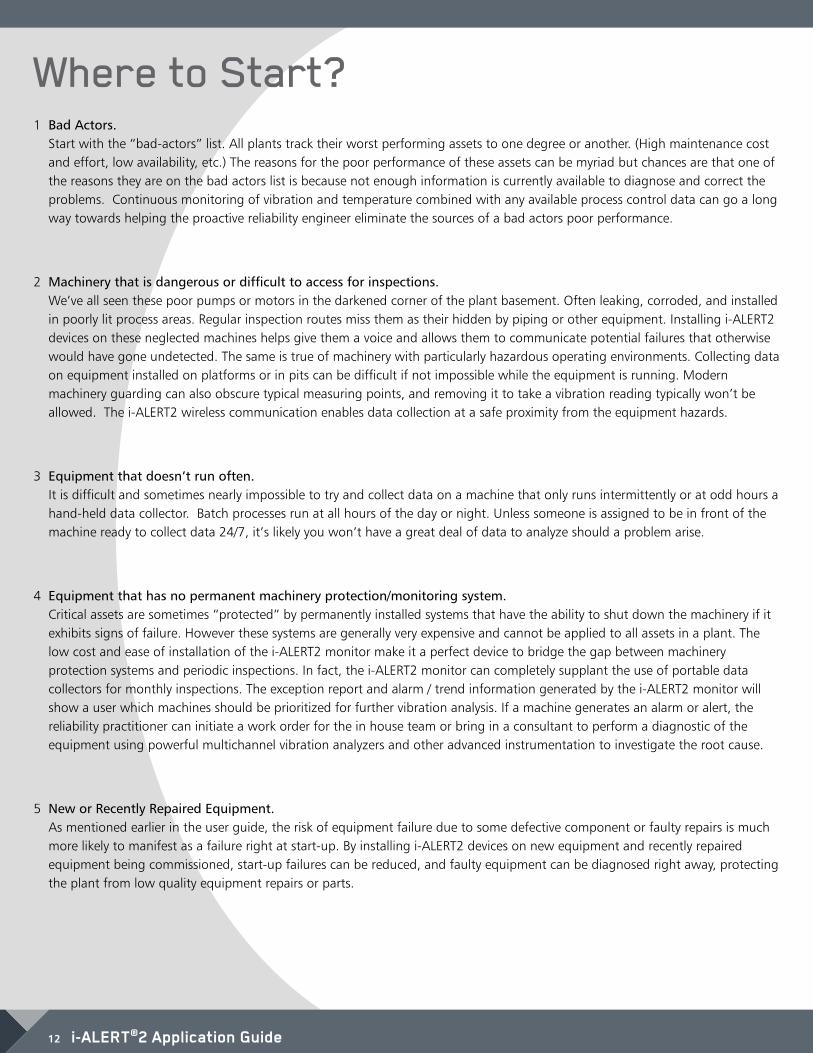
1 Bad Actors. Start with the “bad-actors” list. All plants track their worst performing assets to one degree or another. (High maintenance cost and effort, low availability, etc.) The reasons for the poor performance of these assets can be myriad but chances are that one of the reasons they are on the bad actors list is because not enough information is currently available to diagnose and correct the problems. Continuous monitoring of vibration and temperature combined with any available process control data can go a long way towards helping the proactive reliability engineer eliminate the sources of a bad actors poor performance.
2 Machinery that is dangerous or difficult to access for inspections. We’ve all seen these poor pumps or motors in the darkened corner of the plant basement. Often leaking, corroded, and installed in poorly lit process areas. Regular inspection routes miss them as their hidden by piping or other equipment. Installing i-ALERT2 devices on these neglected machines helps give them a voice and allows them to communicate potential failures that otherwise would have gone undetected. The same is true of machinery with particularly hazardous operating environments. Collecting data on equipment installed on platforms or in pits can be difficult if not impossible while the equipment is running. Modern machinery guarding can also obscure typical measuring points, and removing it to take a vibration reading typically won’t be allowed. The i-ALERT2 wireless communication enables data collection at a safe proximity from the equipment hazards.
3 Equipment that doesn’t run often. It is difficult and sometimes nearly impossible to try and collect data on a machine that only runs intermittently or at odd hours a hand-held data collector. Batch processes run at all hours of the day or night. Unless someone is assigned to be in front of the machine ready to collect data 24/7, it’s likely you won’t have a great deal of data to analyze should a problem arise.
4 Equipment that has no permanent machinery protection/monitoring system. Critical assets are sometimes “protected” by permanently installed systems that have the ability to shut down the machinery if it exhibits signs of failure. However these systems are generally very expensive and cannot be applied to all assets in a plant. The low cost and ease of installation of the i-ALERT2 monitor make it a perfect device to bridge the gap between machinery protection systems and periodic inspections. In fact, the i-ALERT2 monitor can completely supplant the use of portable data collectors for monthly inspections. The exception report and alarm / trend information generated by the i-ALERT2 monitor will show a user which machines should be prioritized for further vibration analysis. If a machine generates an alarm or alert, the reliability practitioner can initiate a work order for the in house team or bring in a consultant to perform a diagnostic of the equipment using powerful multichannel vibration analyzers and other advanced instrumentation to investigate the root cause.
5 New or Recently Repaired Equipment. As mentioned earlier in the user guide, the risk of equipment failure due to some defective component or faulty repairs is much more likely to manifest as a failure right at start-up. By installing i-ALERT2 devices on new equipment and recently repaired equipment being commissioned, start-up failures can be reduced, and faulty equipment can be diagnosed right away, protecting the plant from low quality equipment repairs or parts.
Where to Start?
i-ALERT®2 Application Guide 13
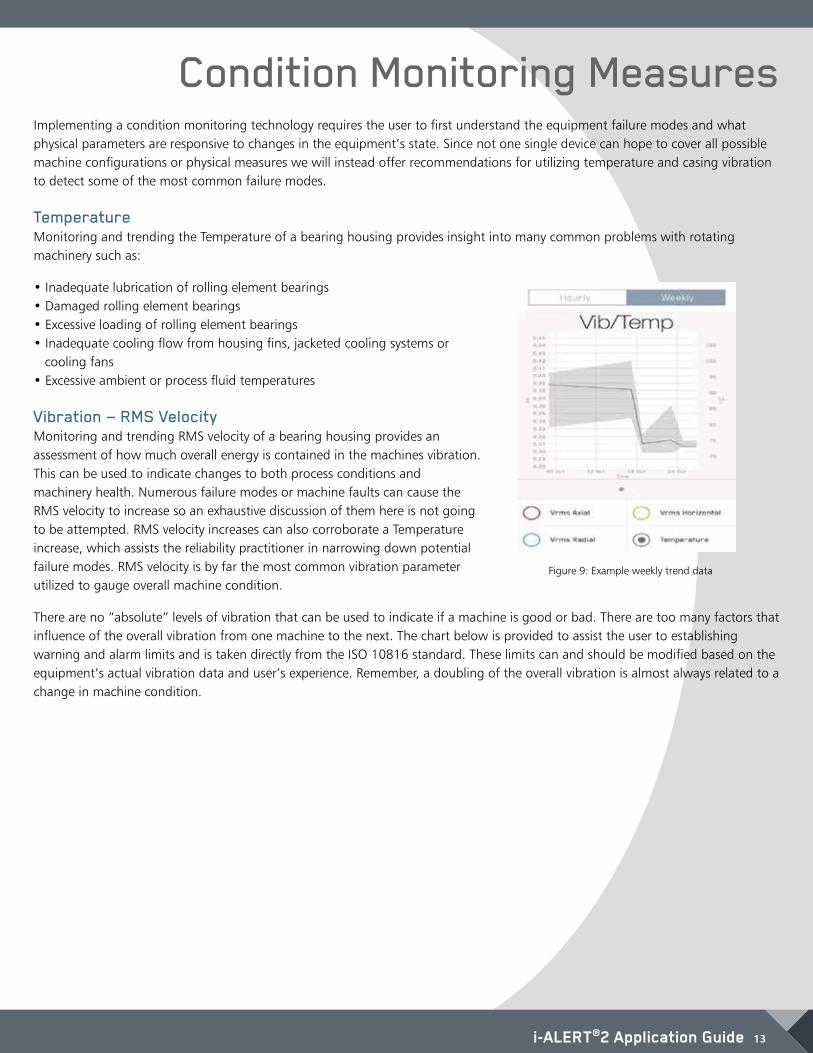
Implementing a condition monitoring technology requires the user to first understand the equipment failure modes and what physical parameters are responsive to changes in the equipment’s state. Since not one single device can hope to cover all possible machine configurations or physical measures we will instead offer recommendations for utilizing temperature and casing vibration to detect some of the most common failure modes. Temperature Monitoring and trending the Temperature of a bearing housing provides insight into many common problems with rotating machinery such as:
• Inadequate lubrication of rolling element bearings • Damaged rolling element bearings • Excessive loading of rolling element bearings • Inadequate cooling flow from housing fins, jacketed cooling systems or cooling fans • Excessive ambient or process fluid temperatures Vibration — RMS Velocity Monitoring and trending RMS velocity of a bearing housing provides an assessment of how much overall energy is contained in the machines vibration. This can be used to indicate changes to both process conditions and machinery health. Numerous failure modes or machine faults can cause the RMS velocity to increase so an exhaustive discussion of them here is not going to be attempted. RMS velocity increases can also corroborate a Temperature increase, which assists the reliability practitioner in narrowing down potential failure modes. RMS velocity is by far the most common vibration parameter utilized to gauge overall machine condition.
There are no “absolute” levels of vibration that can be used to indicate if a machine is good or bad. There are too many factors that influence of the overall vibration from one machine to the next. The chart below is provided to assist the user to establishing warning and alarm limits and is taken directly from the ISO 10816 standard. These limits can and should be modified based on the equipment’s actual vibration data and user’s experience. Remember, a doubling of the overall vibration is almost always related to a change in machine condition.
Figure 9: Example weekly trend data
Condition Monitoring Measures
14 i-ALERT®2 Application Guide
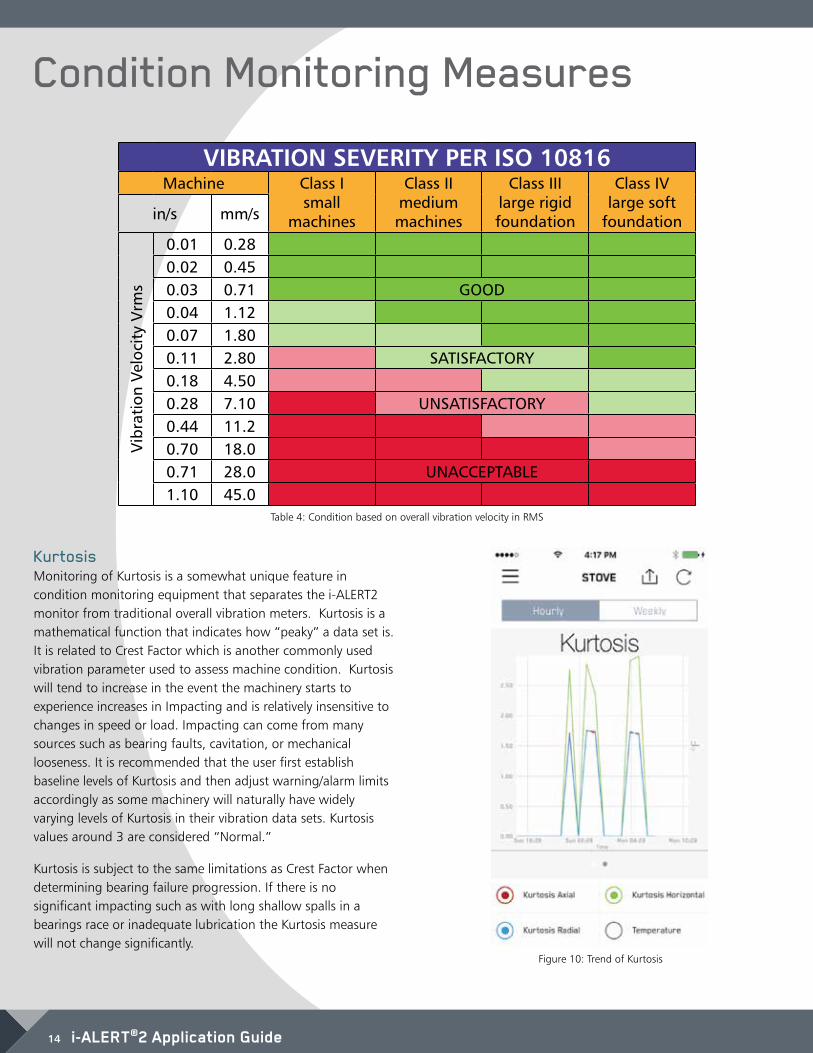
VIBRATION SEVERITY PER ISO 10816Machine Class I
small machines
Class II medium machines
Class III large rigid foundation
Class IV large soft
foundationin/s mm/s
Vib
rati
on V
eloc
ity
Vrm
s
0.01 0.280.02 0.450.03 0.71 GOOD0.04 1.120.07 1.800.11 2.80 SATISFACTORY0.18 4.500.28 7.10 UNSATISFACTORY0.44 11.20.70 18.00.71 28.0 UNACCEPTABLE1.10 45.0
Table 4: Condition based on overall vibration velocity in RMS
Kurtosis Monitoring of Kurtosis is a somewhat unique feature in condition monitoring equipment that separates the i-ALERT2 monitor from traditional overall vibration meters. Kurtosis is a mathematical function that indicates how “peaky” a data set is. It is related to Crest Factor which is another commonly used vibration parameter used to assess machine condition. Kurtosis will tend to increase in the event the machinery starts to experience increases in Impacting and is relatively insensitive to changes in speed or load. Impacting can come from many sources such as bearing faults, cavitation, or mechanical looseness. It is recommended that the user first establish baseline levels of Kurtosis and then adjust warning/alarm limits accordingly as some machinery will naturally have widely varying levels of Kurtosis in their vibration data sets. Kurtosis values around 3 are considered “Normal.”
Kurtosis is subject to the same limitations as Crest Factor when determining bearing failure progression. If there is no significant impacting such as with long shallow spalls in a bearings race or inadequate lubrication the Kurtosis measure will not change significantly.
Figure 10: Trend of Kurtosis
Condition Monitoring Measures
i-ALERT®2 Application Guide 15
Installation Best PracticesMounting Locations
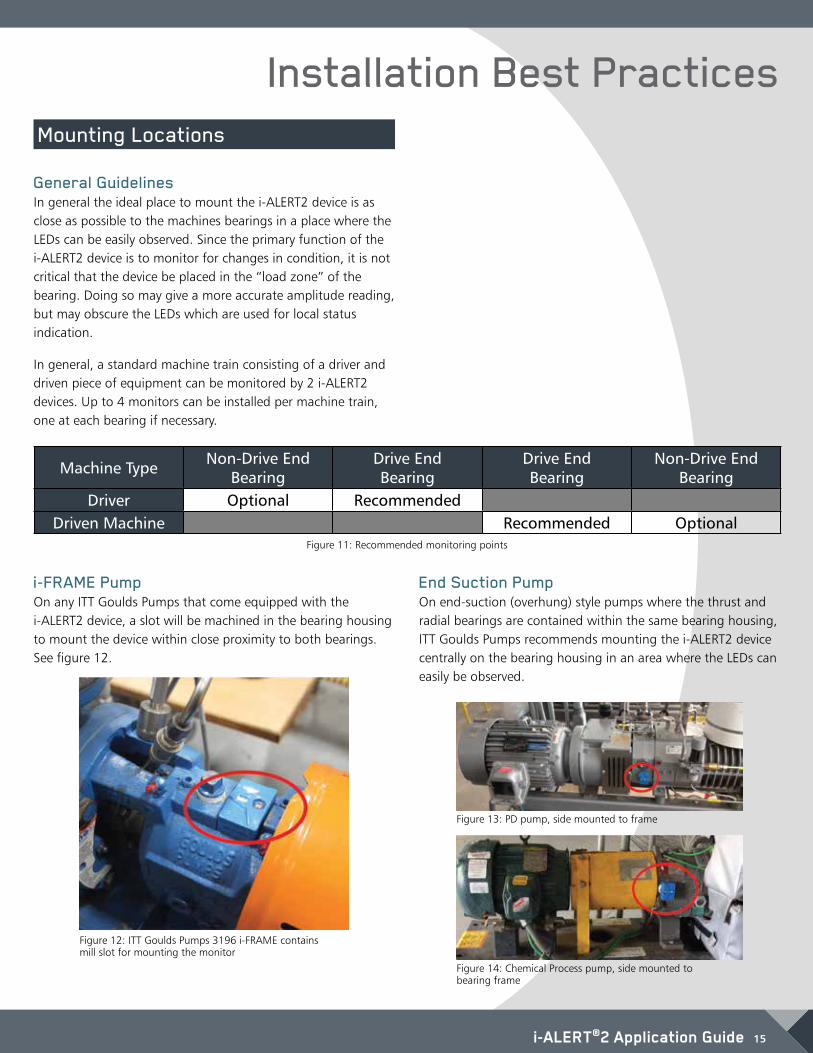
General Guidelines In general the ideal place to mount the i-ALERT2 device is as close as possible to the machines bearings in a place where the LEDs can be easily observed. Since the primary function of the i-ALERT2 device is to monitor for changes in condition, it is not critical that the device be placed in the “load zone” of the bearing. Doing so may give a more accurate amplitude reading, but may obscure the LEDs which are used for local status indication.
In general, a standard machine train consisting of a driver and driven piece of equipment can be monitored by 2 i-ALERT2 devices. Up to 4 monitors can be installed per machine train, one at each bearing if necessary.
Machine Type Non-Drive End Bearing
Drive End Bearing
Drive End Bearing
Non-Drive End Bearing
Driver Optional RecommendedDriven Machine Recommended Optional
Figure 11: Recommended monitoring points
i-FRAME Pump On any ITT Goulds Pumps that come equipped with the i-ALERT2 device, a slot will be machined in the bearing housing to mount the device within close proximity to both bearings. See figure 12.
Figure 12: ITT Goulds Pumps 3196 i-FRAME contains mill slot for mounting the monitor
End Suction Pump On end-suction (overhung) style pumps where the thrust and radial bearings are contained within the same bearing housing, ITT Goulds Pumps recommends mounting the i-ALERT2 device centrally on the bearing housing in an area where the LEDs can easily be observed.
Figure 13: PD pump, side mounted to frame
Figure 14: Chemical Process pump, side mounted to bearing frame
16 i-ALERT®2 Application Guide
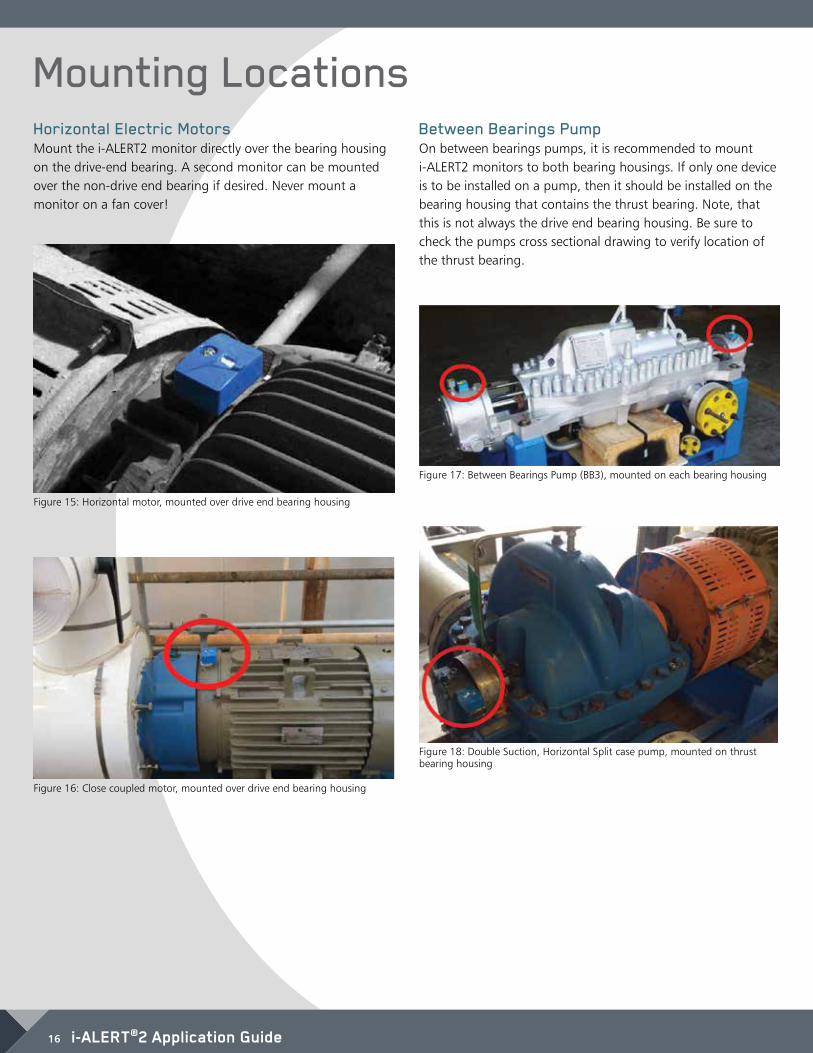
Mounting LocationsHorizontal Electric Motors Mount the i-ALERT2 monitor directly over the bearing housing on the drive-end bearing. A second monitor can be mounted over the non-drive end bearing if desired. Never mount a monitor on a fan cover!
Between Bearings Pump On between bearings pumps, it is recommended to mount i-ALERT2 monitors to both bearing housings. If only one device is to be installed on a pump, then it should be installed on the bearing housing that contains the thrust bearing. Note, that this is not always the drive end bearing housing. Be sure to check the pumps cross sectional drawing to verify location of the thrust bearing.
Figure 15: Horizontal motor, mounted over drive end bearing housing
Figure 16: Close coupled motor, mounted over drive end bearing housing
Figure 17: Between Bearings Pump (BB3), mounted on each bearing housing
Figure 18: Double Suction, Horizontal Split case pump, mounted on thrust bearing housing
i-ALERT®2 Application Guide 17
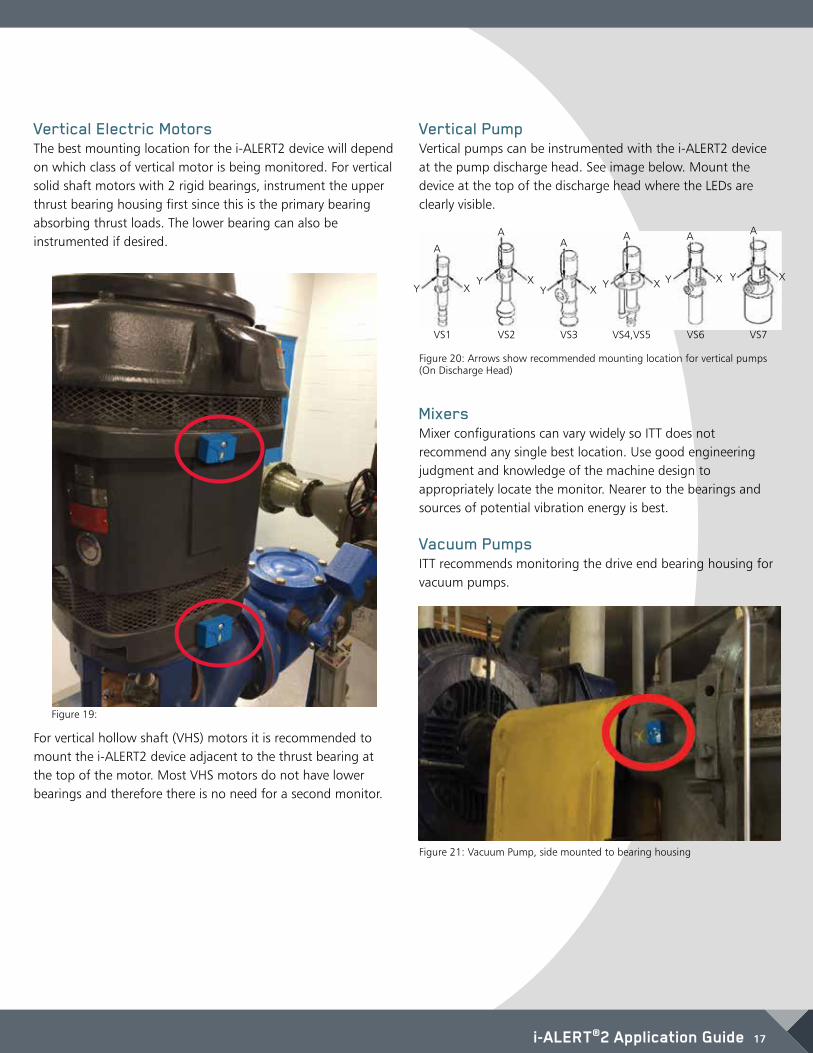
Vertical Electric Motors The best mounting location for the i-ALERT2 device will depend on which class of vertical motor is being monitored. For vertical solid shaft motors with 2 rigid bearings, instrument the upper thrust bearing housing first since this is the primary bearing absorbing thrust loads. The lower bearing can also be instrumented if desired.
Vertical Pump Vertical pumps can be instrumented with the i-ALERT2 device at the pump discharge head. See image below. Mount the device at the top of the discharge head where the LEDs are clearly visible.
For vertical hollow shaft (VHS) motors it is recommended to mount the i-ALERT2 device adjacent to the thrust bearing at the top of the motor. Most VHS motors do not have lower bearings and therefore there is no need for a second monitor.
A
AA
A A A
YY
Y Y Y YX
XX X X X
VS1 VS2 VS3 VS4,VS5 VS6 VS7
Figure 20: Arrows show recommended mounting location for vertical pumps (On Discharge Head)
Mixers Mixer configurations can vary widely so ITT does not recommend any single best location. Use good engineering judgment and knowledge of the machine design to appropriately locate the monitor. Nearer to the bearings and sources of potential vibration energy is best. Vacuum Pumps ITT recommends monitoring the drive end bearing housing for vacuum pumps.
Figure 21: Vacuum Pump, side mounted to bearing housing
Figure 19:

18 i-ALERT®2 Application Guide
Mounting Methods / Commissioning / Reset the i-ALERT2Mounting There are four methods that can be used to mount the i-ALERT2 device to a machine. They are shown in the figure below. On new pumps and pumps repaired through ITT PRO Services, a slot will be milled into an appropriate location on the bearing housing and the device will be secured with a screw. Alternatively, a hole can be drilled and tapped and a small adapter plate can then be used to secure the device. Lastly, the device can be epoxied directly the machine via the mounting plate. Make sure to use a good quality, rigid epoxy. Do not use RTV or Silicon to mount the device.
Figure 22: Mounting Methods
Caution: Always wear protective gloves. The equipment and the i-ALERT2 device can be hot.
EpoxyScrew: ¼-28 x 1.125in
Epoxy: application specific
Commissioning Steps to activate the i-ALERT2 Equipment Health Monitor: 1. Remove sticker. 2. The i-ALERT2 device will look for light. Note: If in a dark environment use light source to activate. 3. When activated a sequence of flashing LEDs will start to indicate that the unit is powered on. 4. When sequence is completed the green LED will flash every 5 sec under normal operating conditions.
To Reset the i-ALERT2:
Action LED
Action performed if magnet is
removed
System Action performed if magnet is
removedApply magnet over Bluetooth symbol for 1 second
Red LED active Red LED active Nothing
Magnet held in place for additional 2 seconds
Blue LED active
Red LED Flash: Bluetooth OFF
Green LED Flash: Bluetooth ON
Bluetooth radio On/Off toggle
Magnet held in place for additional 4 second
LEDs cycle through all
colors
All three LEDs will Flash and
turn OFF
Unit RESETS when LEDs
stop Flashing
Figure 23: Using a magnet to reset an i-ALERT2
Mill a SlotScrew: ¼-28 x 1.125in
Slot: 2.25in x 1.6in W
Drill and TapScrew: ¼-28 x 1.5in
Tap: ¼-28 UNF x ¼in deep
MagneticScrew 1: ¼-28 x 1.125 in
Screw 2: ¼-28 x 0.75 in

i-ALERT®2 Application Guide 19
Routine Operation / Troubleshootingi-ALERT2 Equipment Health Monitor Routine Operation Measurement interval The measurement interval for the condition monitor during normal and alarm operation is 5 minutes. When the monitor measures a reading beyond the specified temperature and vibration limits, the appropriate red LED flashes (after 2 consecutive readings). After the process or pump condition that causes the alarm is corrected, the condition monitor returns to normal mode after one normal-level measurement.
Alarm mode The condition monitor’s alarm mode is activated after two consecutive readings. When the alarm mode is on, you should investigate the cause of the condition and make necessary corrections in a timely manner.
Magnetic device considerations Be careful when you use magnetic devices in close proximity of the condition monitor, such as magnetic vibration-monitoring probes or dial indicators. These magnetic devices can accidentally activate or deactivate the condition monitor resulting in improper alarm levels or loss of monitoring.
Wireless Integration A Bluetooth Low Energy Radio is utilized to communicate condition monitoring information to a mobile Smart device that the operator can easily view and react to.
i-ALERT2 Equipment Health Monitor Troubleshooting
Symptom Cause Remedy
There are no red, green, or blue flashing LED
The battery is dead. Replace the equipment health monitor.
The unit is in sleep mode. Activate the condition monitor using magnet.
The unit is malfunctioning. Consult your ITT representative for a warranty replacement.
The red LED is flashing, but the temperature and vibration are at acceptable levels.
The baseline is too low.
Check the temperature and vibration levels and request new baseline. Or manually change alarm limits.
The unit is malfunctioning. Consult your ITT representative for a warranty replacement.
Figure 24: Troubleshooting
If you are unable to resolve an issue with a sensor using this guide, please reach out to us by email or phone - we will be gladly assist: email: [email protected] phone: +1 315-568-7290
20 i-ALERT®2 Application Guide
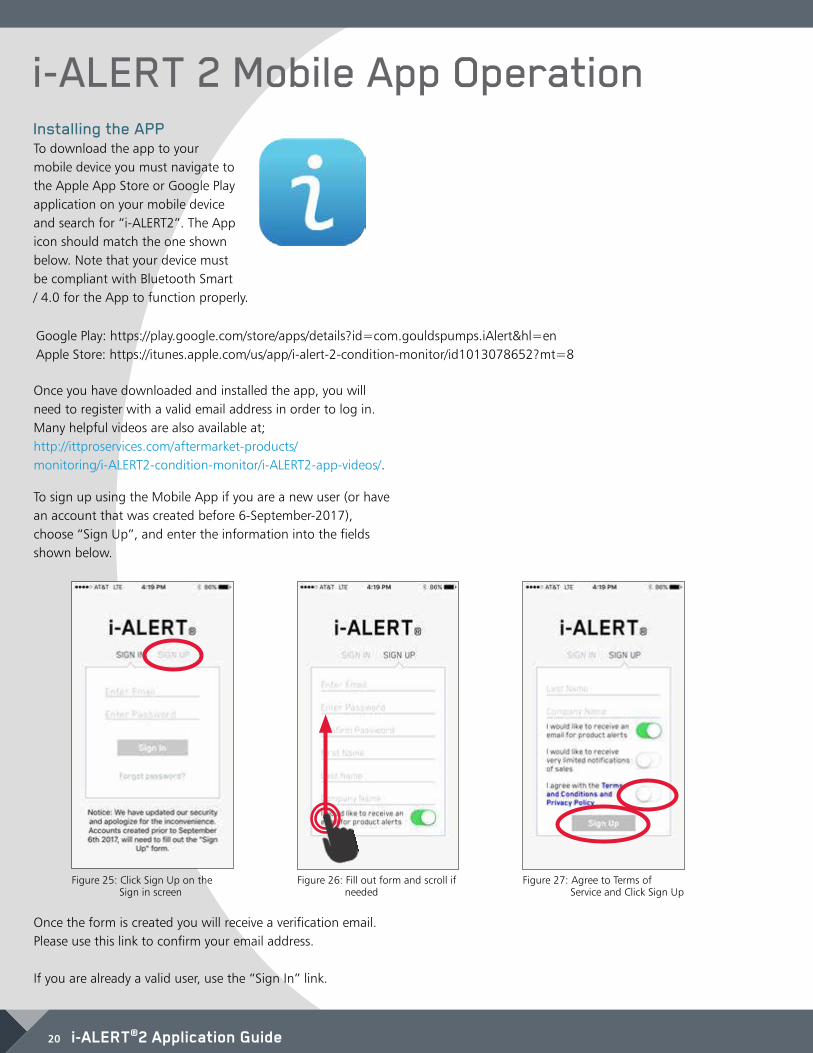
i-ALERT 2 Mobile App OperationInstalling the APP To download the app to your mobile device you must navigate to the Apple App Store or Google Play application on your mobile device and search for “i-ALERT2”. The App icon should match the one shown below. Note that your device must be compliant with Bluetooth Smart / 4.0 for the App to function properly. Once you have downloaded and installed the app, you will need to register with a valid email address in order to log in. Many helpful videos are also available at; http://ittproservices.com/aftermarket-products/monitoring/i-ALERT2-condition-monitor/i-ALERT2-app-videos/.
To sign up using the Mobile App if you are a new user (or have an account that was created before 6-September-2017), choose “Sign Up”, and enter the information into the fields shown below.
Once the form is created you will receive a verification email. Please use this link to confirm your email address. If you are already a valid user, use the “Sign In” link.
Figure 25: Click Sign Up on the Sign in screen
Figure 26: Fill out form and scroll if needed
Figure 27: Agree to Terms of Service and Click Sign Up
Google Play: https://play.google.com/store/apps/details?id=com.gouldspumps.iAlert&hl=en Apple Store: https://itunes.apple.com/us/app/i-alert-2-condition-monitor/id1013078652?mt=8
i-ALERT®2 Application Guide 21
Sensor RegistrationOverview This section will cover: • Associating (registering) a sensor to an account
• Configuring the sensor’s installation details
• Creating an asset
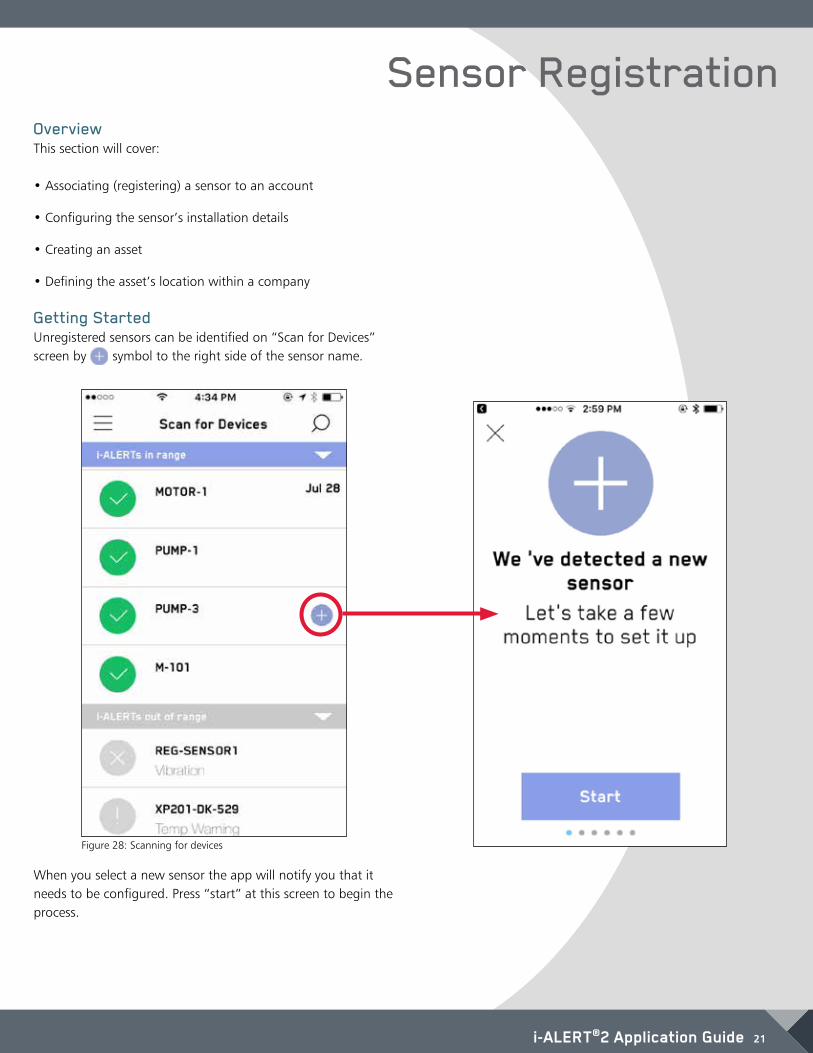
• Defining the asset’s location within a company Getting Started Unregistered sensors can be identified on “Scan for Devices” screen by symbol to the right side of the sensor name.
When you select a new sensor the app will notify you that it needs to be configured. Press “start” at this screen to begin the process.
Figure 28: Scanning for devices
22 i-ALERT®2 Application Guide
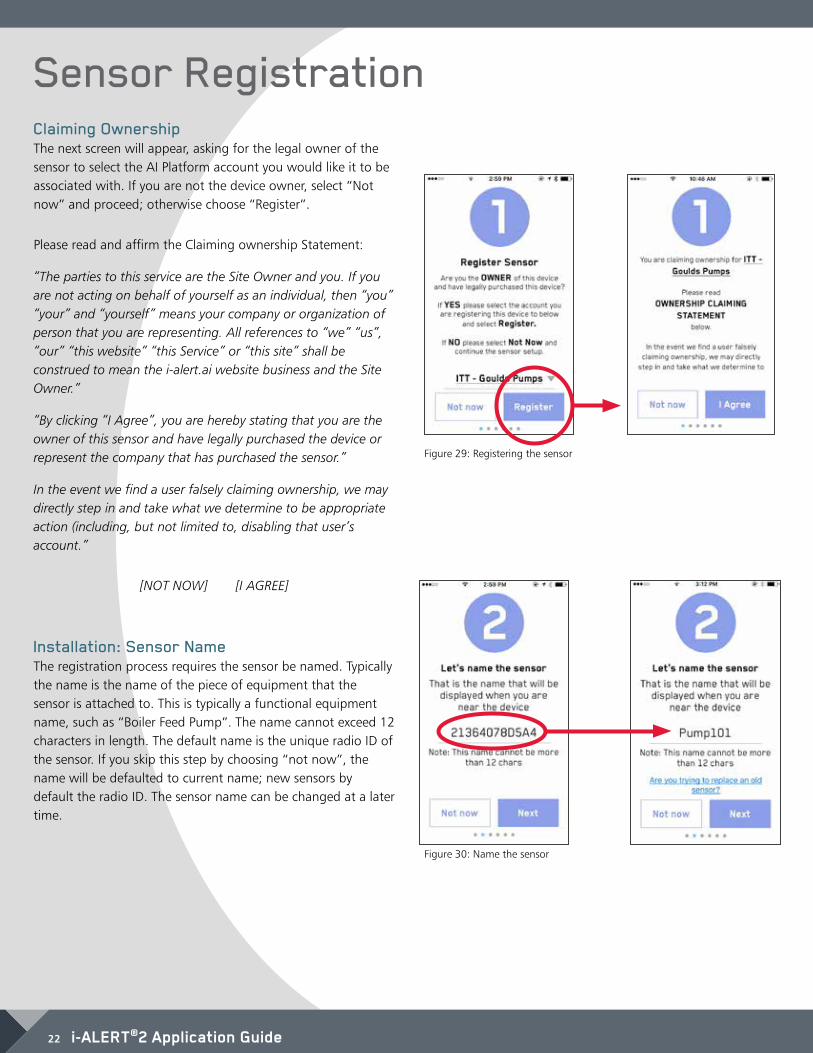
Claiming Ownership The next screen will appear, asking for the legal owner of the sensor to select the AI Platform account you would like it to be associated with. If you are not the device owner, select “Not now” and proceed; otherwise choose “Register”.
Please read and affirm the Claiming ownership Statement:
“The parties to this service are the Site Owner and you. If you are not acting on behalf of yourself as an individual, then “you” “your” and “yourself” means your company or organization of person that you are representing. All references to “we” “us”, “our” “this website” “this Service” or “this site” shall be construed to mean the i-alert.ai website business and the Site Owner.”
“By clicking “I Agree”, you are hereby stating that you are the owner of this sensor and have legally purchased the device or represent the company that has purchased the sensor.”
In the event we find a user falsely claiming ownership, we may directly step in and take what we determine to be appropriate action (including, but not limited to, disabling that user’s account.”
[NOT NOW] [I AGREE]
Installation: Sensor Name The registration process requires the sensor be named. Typically the name is the name of the piece of equipment that the sensor is attached to. This is typically a functional equipment name, such as “Boiler Feed Pump”. The name cannot exceed 12 characters in length. The default name is the unique radio ID of the sensor. If you skip this step by choosing “not now”, the name will be defaulted to current name; new sensors by default the radio ID. The sensor name can be changed at a later time.
Sensor Registration
Figure 29: Registering the sensor
Figure 30: Name the sensor
i-ALERT®2 Application Guide 23
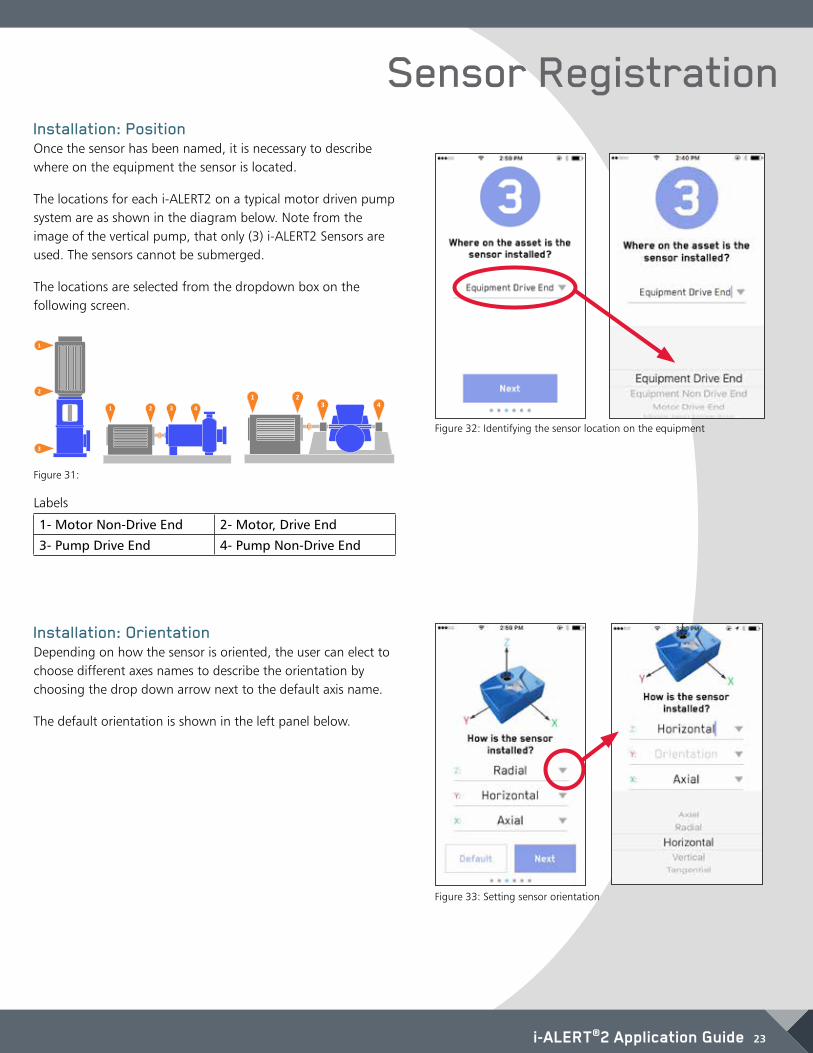
Installation: Position Once the sensor has been named, it is necessary to describe where on the equipment the sensor is located.
The locations for each i-ALERT2 on a typical motor driven pump system are as shown in the diagram below. Note from the image of the vertical pump, that only (3) i-ALERT2 Sensors are used. The sensors cannot be submerged.
The locations are selected from the dropdown box on the following screen.
Installation: Orientation Depending on how the sensor is oriented, the user can elect to choose different axes names to describe the orientation by choosing the drop down arrow next to the default axis name.
The default orientation is shown in the left panel below.
1
2
3
1 2 3 4
1 23 4
Labels
1- Motor Non-Drive End 2- Motor, Drive End
3- Pump Drive End 4- Pump Non-Drive End
Sensor Registration
Figure 31:
Figure 32: Identifying the sensor location on the equipment
Figure 33: Setting sensor orientation

24 i-ALERT®2 Application Guide
Sensor RegistrationExamples of various mounting locations are shown below:
Figure 35: In the image above Vertical is also Radial.
Figure 36: In the image above, Horizontal is also Radial.
Figure 37: In the image above, Horizontal is also Radial.Figure 34: Standard orientation on a
vertical pump
Axial
Horizontal
Radial
Axial
Horizontal
Vertical
Axial
Horizontal
Vertical
Axial
Horizontal
Vertical
i-ALERT®2 Application Guide 25
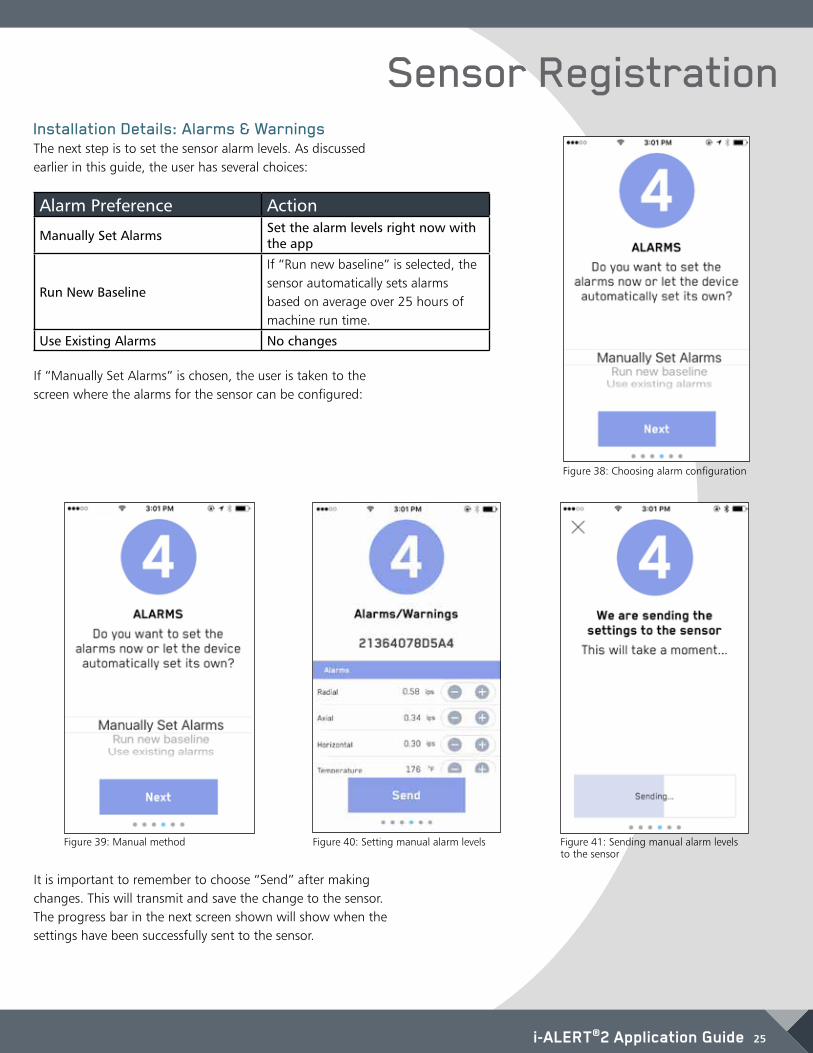
Sensor RegistrationInstallation Details: Alarms & Warnings The next step is to set the sensor alarm levels. As discussed earlier in this guide, the user has several choices:
If “Manually Set Alarms” is chosen, the user is taken to the screen where the alarms for the sensor can be configured:
Alarm Preference Action
Manually Set Alarms Set the alarm levels right now with the app
Run New Baseline
If “Run new baseline” is selected, the sensor automatically sets alarms based on average over 25 hours of machine run time.
Use Existing Alarms No changes
It is important to remember to choose “Send” after making changes. This will transmit and save the change to the sensor. The progress bar in the next screen shown will show when the settings have been successfully sent to the sensor.
Figure 38: Choosing alarm configuration
Figure 39: Manual method Figure 41: Sending manual alarm levels to the sensor
Figure 40: Setting manual alarm levels
26 i-ALERT®2 Application Guide
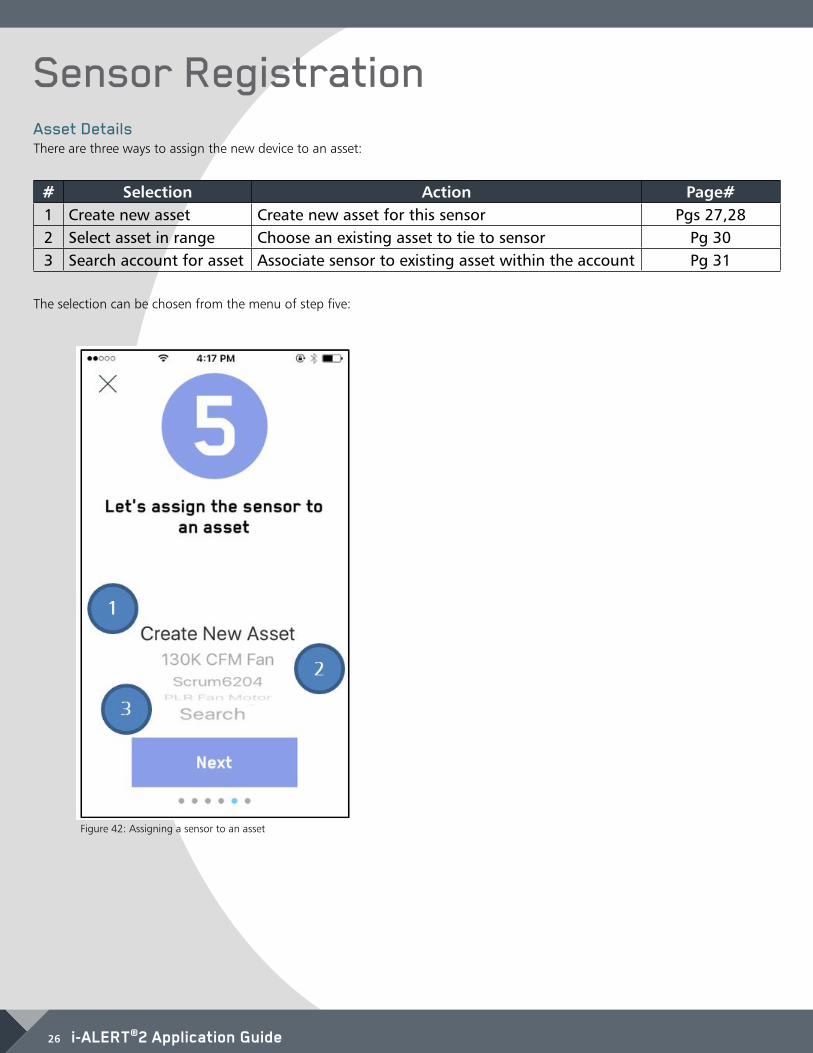
Sensor RegistrationAsset Details There are three ways to assign the new device to an asset:
# Selection Action Page#1 Create new asset Create new asset for this sensor Pgs 27,282 Select asset in range Choose an existing asset to tie to sensor Pg 303 Search account for asset Associate sensor to existing asset within the account Pg 31
The selection can be chosen from the menu of step five:
Figure 42: Assigning a sensor to an asset

i-ALERT®2 Application Guide 27
Sensor RegistrationAsset Details: Create a New Asset (Goulds) Next, make the asset to sensor association:
The asset name will be pulled in from naming the sensor earlier.
Select the equipment manufacturer from the dropdown.
Ai Platform Users: This photo will be a reference for when you are viewing your account.
You may be asked for access to the camera. Add a photo from the gallery or use the camera.
Next, add some details, and if a Gould’s Pump, automatically pull in technical details tied to the specific pump serial number entered in the second panel below:
Select the equipment manufacturer from the dropdown A valid Gould’s Serial Number will automatically load the equipment Details. It may take a minute to load.
When the record is found, the equipment data will populate automatically.
Figure 43:
Figure 47:
Figure 44: Figure 45: Figure 46:
Figure 48: Figure 49:
28 i-ALERT®2 Application Guide
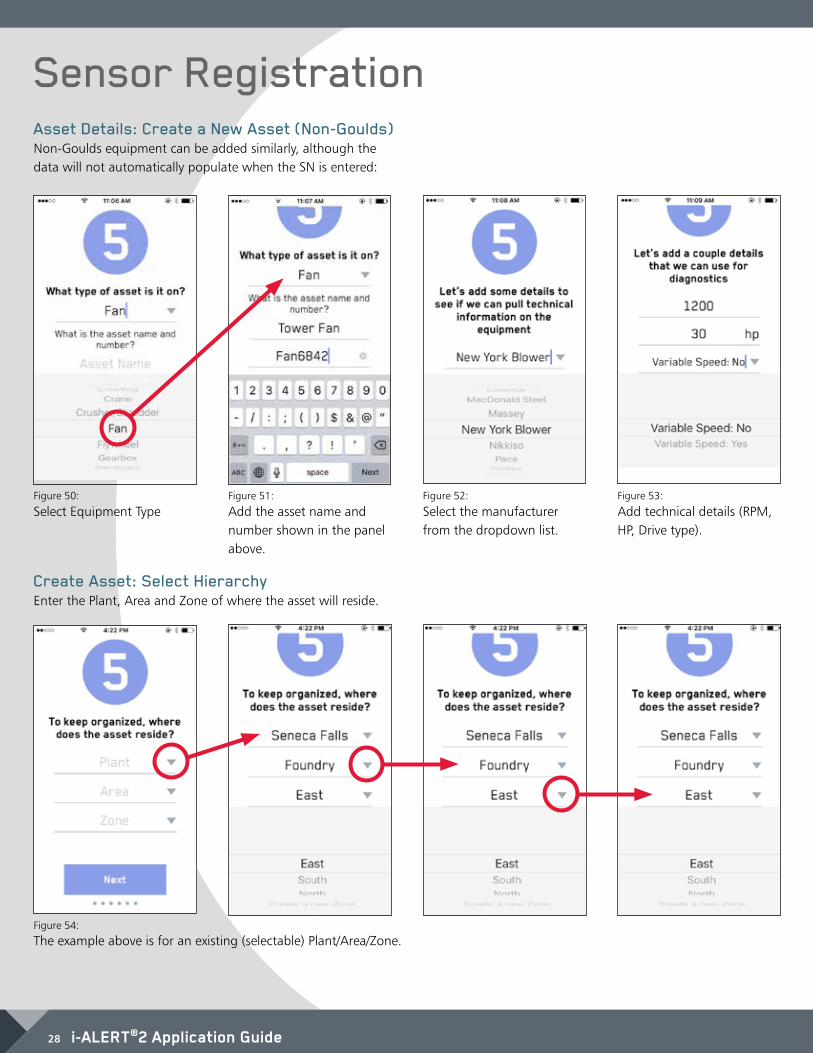
Sensor RegistrationAsset Details: Create a New Asset (Non-Goulds) Non-Goulds equipment can be added similarly, although the data will not automatically populate when the SN is entered:
Select Equipment Type Add the asset name and number shown in the panel above.
Select the manufacturer from the dropdown list.
Add technical details (RPM, HP, Drive type).
Create Asset: Select Hierarchy Enter the Plant, Area and Zone of where the asset will reside.
The example above is for an existing (selectable) Plant/Area/Zone.
Figure 50:
Figure 54:
Figure 51: Figure 52: Figure 53:

i-ALERT®2 Application Guide 29
Sensor RegistrationCreate Asset Part 3: New Hierarchy For a new Plant, Area or Zone is desired: • Select “Plant” >”Create new Plant” (Will require physical address) • Select “Area” >”Create new Area” • Select “Zone” >”Create new Zone” To create a Plant/Area/Zone, it is necessary to have sufficient rights on the AI Platform. Please contact your site administrator if additional rights are required.
Select the pin next to the “new plant” to open the mapping tool and add the address as shown below:
Enter the address in the open map view; this will associate the Plant to a physical location
Choose the newly created Plant
Create Area and Zone from their respective drop down boxes
Figure 55: Figure 56: Figure 57: Figure 58:
30 i-ALERT®2 Application Guide
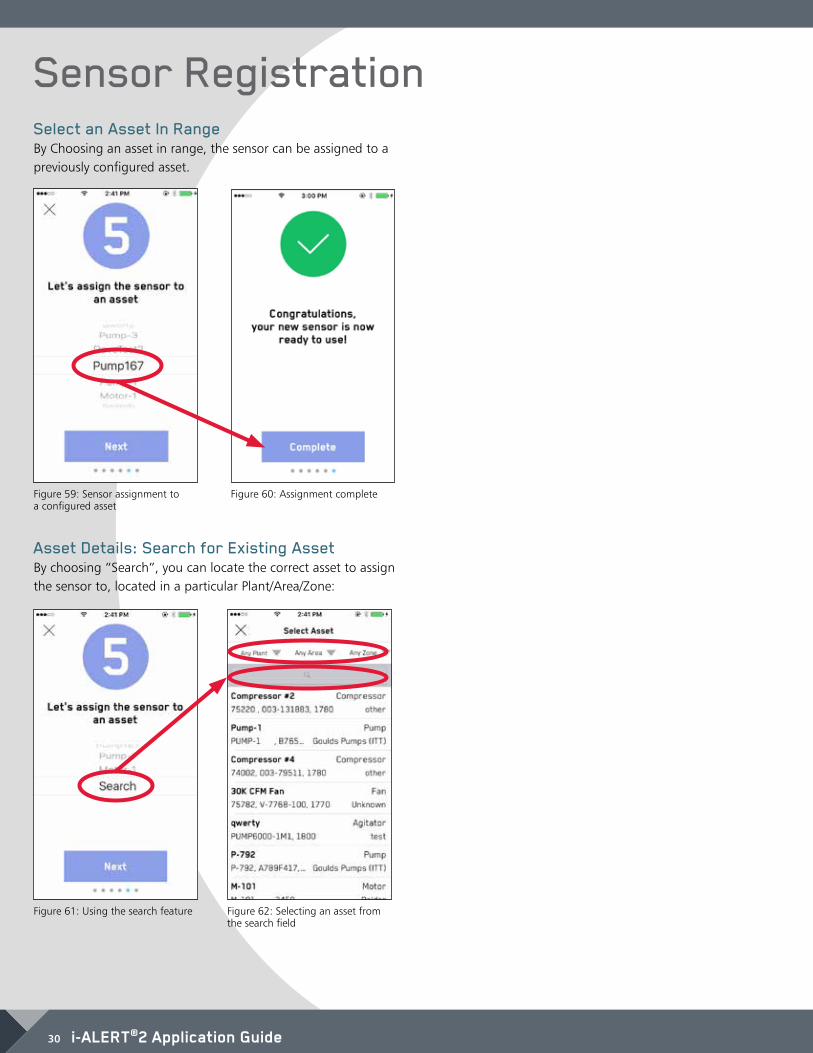
Sensor RegistrationSelect an Asset In Range By Choosing an asset in range, the sensor can be assigned to a previously configured asset.
Asset Details: Search for Existing Asset By choosing “Search”, you can locate the correct asset to assign the sensor to, located in a particular Plant/Area/Zone:
Figure 59: Sensor assignment to a configured asset
Figure 61: Using the search feature
Figure 60: Assignment complete
Figure 62: Selecting an asset from the search field
i-ALERT®2 Application Guide 31
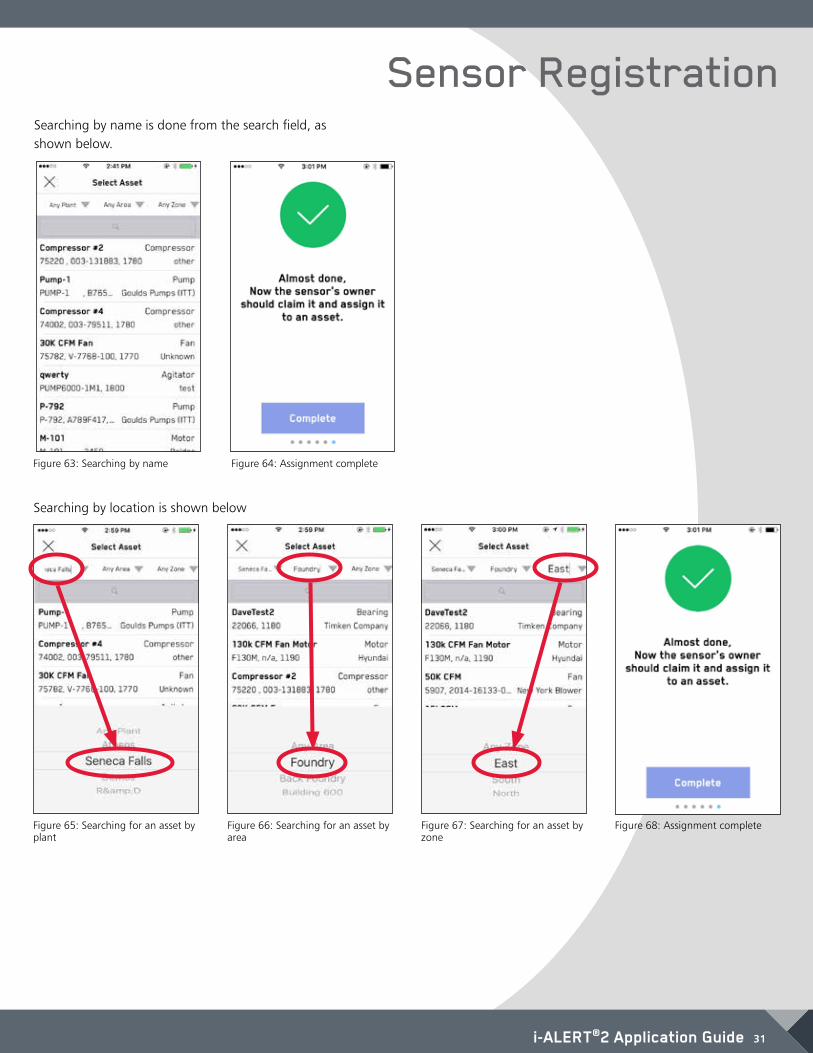
Sensor RegistrationSearching by name is done from the search field, as shown below.
Searching by location is shown below
Figure 63: Searching by name
Figure 65: Searching for an asset by plant
Figure 64: Assignment complete
Figure 66: Searching for an asset by area
Figure 67: Searching for an asset by zone
Figure 68: Assignment complete
32 i-ALERT®2 Application Guide
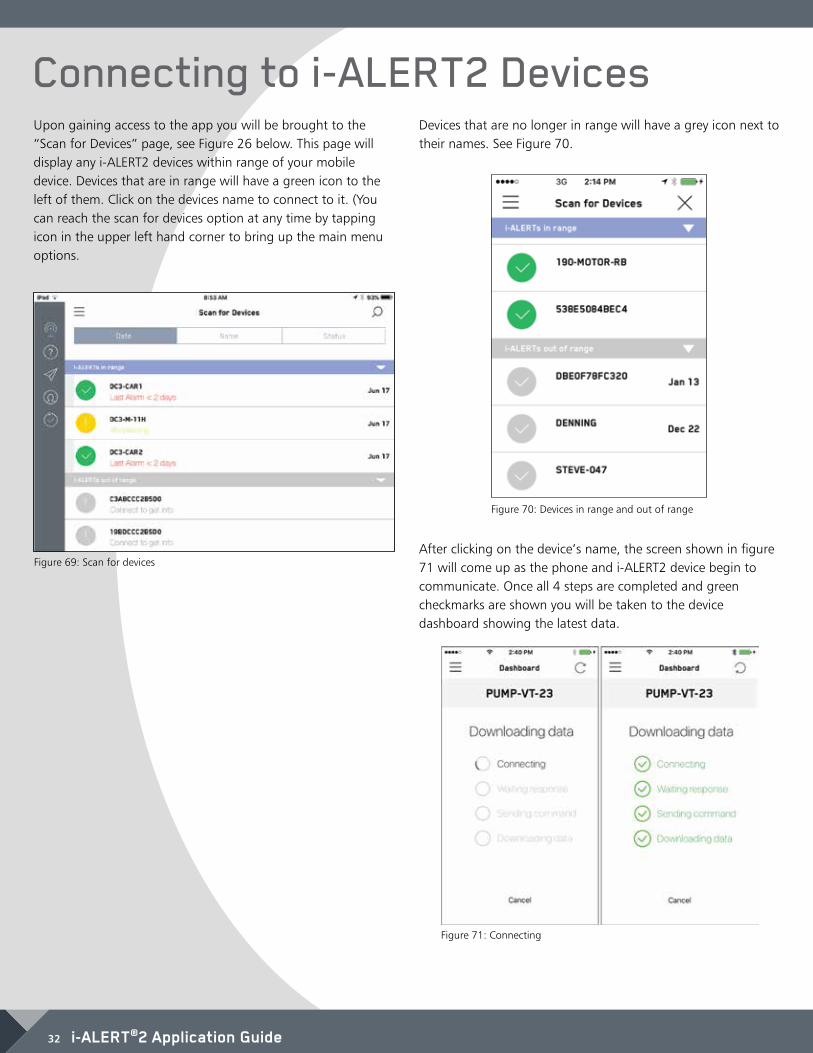
Upon gaining access to the app you will be brought to the “Scan for Devices” page, see Figure 26 below. This page will display any i-ALERT2 devices within range of your mobile device. Devices that are in range will have a green icon to the left of them. Click on the devices name to connect to it. (You can reach the scan for devices option at any time by tapping icon in the upper left hand corner to bring up the main menu options.
Figure 69: Scan for devices
Devices that are no longer in range will have a grey icon next to their names. See Figure 70.
Figure 70: Devices in range and out of range
After clicking on the device’s name, the screen shown in figure 71 will come up as the phone and i-ALERT2 device begin to communicate. Once all 4 steps are completed and green checkmarks are shown you will be taken to the device dashboard showing the latest data.
Figure 71: Connecting
Connecting to i-ALERT2 Devices

i-ALERT®2 Application Guide 33
Dashboard / TrendingDashboard The Dashboard page (Figure 72) shows the latest overall vibration amplitudes and temperature measurements as well as the total Runtime hours and Battery Status. To refresh the dashboard and request the latest reading, tap the circular arrow icon on the top right hand portion of the screen.
Trending Tap on any of the individual measurement icons on the Dashboard page to bring up the Trend page. Alternatively, you can tap the icon in the top left corner that looks like 3 horizontal lines and select “Trending” from the drop list. (Figure 73)
Figure 72: Dashboard
Figure 73: Trending
The Trend page shows the historical values of each individual measurement. You can overlay or remove measurement trends by clicking the radio buttons on the bottom of the screen. See Figure 74.
Figure 74: Default Trend view on left, trend view with several measurement de-selected shown on the right.

34 i-ALERT®2 Application Guide
To change the trend chart to show a longer time frame, tap the “Weekly” button above the chart. This will change the chart to display the last 4 weeks of trend data. To view the numerical values instead of the graphical trend, tap the icon that looks like an arrow pointing up next to the devices name. See figure 75. To return to the graphical trend, click the “DONE” button at the top left.
If you would like to export the numerical data click on the up arrow icon at the bottom left of the page. (Note: the upload icon may not always be at the bottom left, in some cases it is at the upper right. Regardless of location the function remains the same.) See figure 76. You will have a choice to print it directly to a local printer, or attach it to an email in the CSV file format. CSV files are universal and can be imported to plant historians or opened with a spreadsheet processing program.
Trending
Figure 75: Tap the upward facing arrow to view numerical data, tap the icon again on the subsequent page to export the data
Figure 76: Export trend data by printing or attaching to email
The trend data may be difficult to see in the default window. Fortunately, you can zoom in and out as well as pan right or left using standard mobile touchscreen commands. To pan, simply swipe right or left to move the chart. To Zoom In, touch the trend chart with 2 fingers and spread them apart. You can use this gesture to change both the X and Y scales on the chart. You can also Zoom in on a specific area of the graph by double tapping. To Zoom Out, touch the screen with pinch your fingers together. To reset the zoom to the default setting, you will have to leave this screen by either going into the Kurtosis trend or switching to “Weekly” and back.
Figure 77: Trend graph zoomed in
ZOOM IN
ZOOM OUT
i-ALERT®2 Application Guide 35
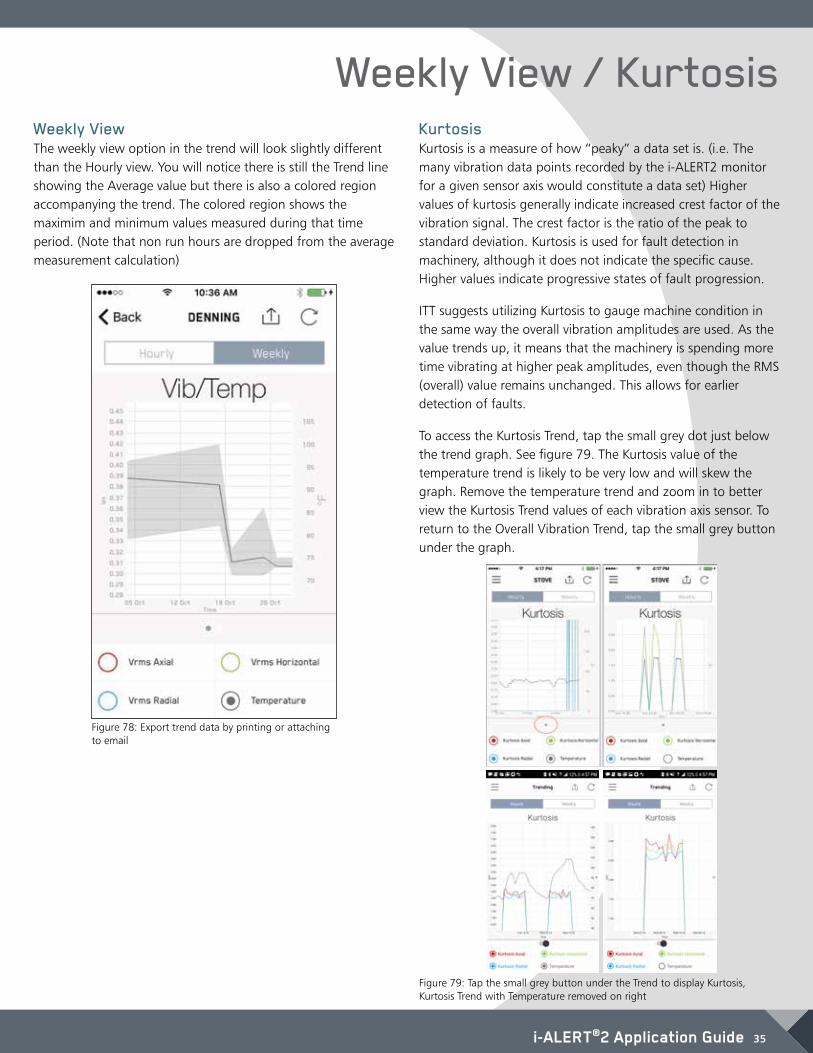
Weekly View / KurtosisWeekly View The weekly view option in the trend will look slightly different than the Hourly view. You will notice there is still the Trend line showing the Average value but there is also a colored region accompanying the trend. The colored region shows the maximim and minimum values measured during that time period. (Note that non run hours are dropped from the average measurement calculation)
Figure 78: Export trend data by printing or attaching to email
Kurtosis Kurtosis is a measure of how “peaky” a data set is. (i.e. The many vibration data points recorded by the i-ALERT2 monitor for a given sensor axis would constitute a data set) Higher values of kurtosis generally indicate increased crest factor of the vibration signal. The crest factor is the ratio of the peak to standard deviation. Kurtosis is used for fault detection in machinery, although it does not indicate the specific cause. Higher values indicate progressive states of fault progression.
ITT suggests utilizing Kurtosis to gauge machine condition in the same way the overall vibration amplitudes are used. As the value trends up, it means that the machinery is spending more time vibrating at higher peak amplitudes, even though the RMS (overall) value remains unchanged. This allows for earlier detection of faults.
To access the Kurtosis Trend, tap the small grey dot just below the trend graph. See figure 79. The Kurtosis value of the temperature trend is likely to be very low and will skew the graph. Remove the temperature trend and zoom in to better view the Kurtosis Trend values of each vibration axis sensor. To return to the Overall Vibration Trend, tap the small grey button under the graph.
Figure 79: Tap the small grey button under the Trend to display Kurtosis, Kurtosis Trend with Temperature removed on right
36 i-ALERT®2 Application Guide
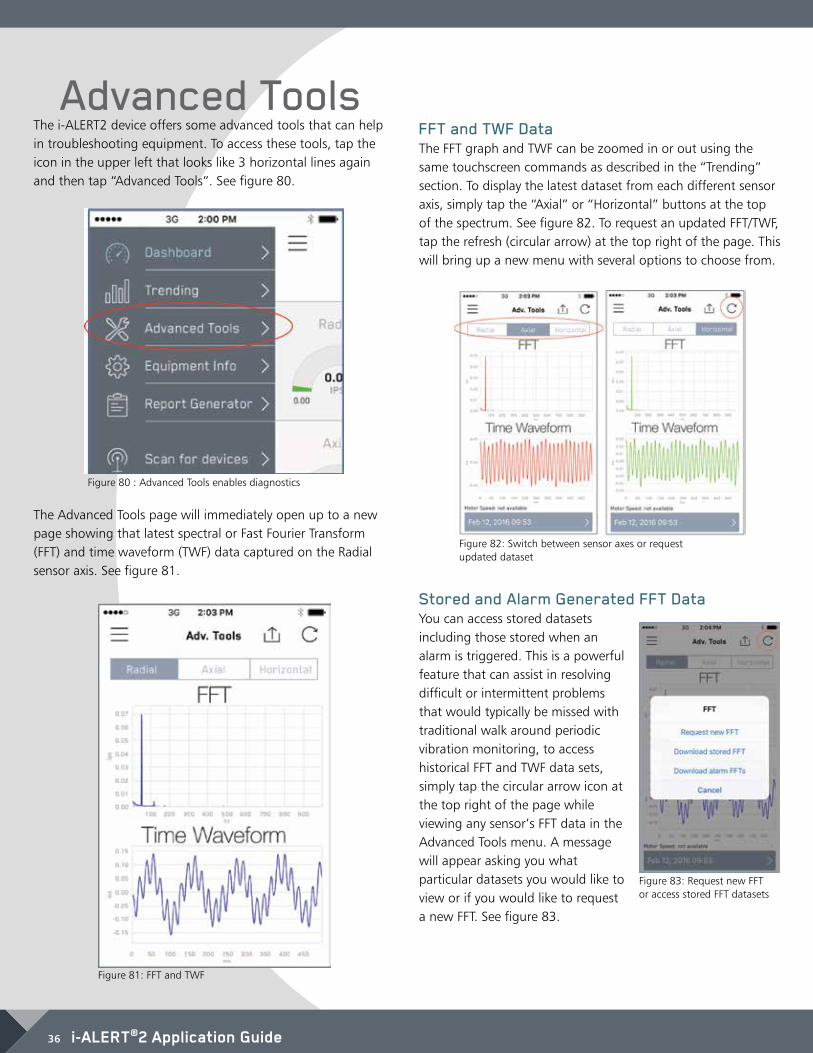
Advanced ToolsThe i-ALERT2 device offers some advanced tools that can help in troubleshooting equipment. To access these tools, tap the icon in the upper left that looks like 3 horizontal lines again and then tap “Advanced Tools”. See figure 80.
The Advanced Tools page will immediately open up to a new page showing that latest spectral or Fast Fourier Transform (FFT) and time waveform (TWF) data captured on the Radial sensor axis. See figure 81.
Figure 80 : Advanced Tools enables diagnostics
Figure 81: FFT and TWF
FFT and TWF Data The FFT graph and TWF can be zoomed in or out using the same touchscreen commands as described in the “Trending” section. To display the latest dataset from each different sensor axis, simply tap the “Axial” or “Horizontal” buttons at the top of the spectrum. See figure 82. To request an updated FFT/TWF, tap the refresh (circular arrow) at the top right of the page. This will bring up a new menu with several options to choose from.
Figure 82: Switch between sensor axes or request updated dataset
Stored and Alarm Generated FFT Data You can access stored datasets including those stored when an alarm is triggered. This is a powerful feature that can assist in resolving difficult or intermittent problems that would typically be missed with traditional walk around periodic vibration monitoring, to access historical FFT and TWF data sets, simply tap the circular arrow icon at the top right of the page while viewing any sensor’s FFT data in the Advanced Tools menu. A message will appear asking you what particular datasets you would like to view or if you would like to request a new FFT. See figure 83.
Figure 83: Request new FFT or access stored FFT datasets

i-ALERT®2 Application Guide 37
Runtime Settings Choosing quiet mode enables the sensor to detect smooth running equipment such as motors under light loads. A sensistivity slider allows the user to increase or decrease the sensitivity further.
Equipment Information / Alarms Equipment Information One of the most useful features of the i-ALERT2 mobile app is the ability to instantly access equipment details. The “Equipment Information” page also includes functionality that allows a user to adjust alarm and warning limits as well as send commands to the i-ALERT2 monitor to reset the device. To access the Equipment information page, tap the icon in the upper left that looks like three horizontal lines and then choose “Equipment Info.” See figure 84.
Figure 84: Equipment informationAlarms / Warnings To view and change the Alarm/Warning limits in the i-ALERT2 monitor, tap the “Alarms / Warnings” tag. See figure 24.
The “Alarm Settings” page will be displayed. (figure 42) From here a user can adjust the overall vibration amplitudes and temperatures that cause the device to go into alarm or warning modes. Tap the “ + “ or “ – “ icons at the right hand side to adjust values.
After updating the alarm or warning settings, they must then be sent down to the i-ALERT2 device in order to be programmed in. To do this, tap the “Send” button at the top right. (Figure 89). Figure 85: Equipment Info Settings
Figure 89: use the + and - buttons to adjust values.Tap “Send” to program the new device settings.
Figure 90:
Installation Details User setting/definition of location and orientation of the sensor.
Figure 87:
Figure 88:
Temperature Offset This setting allows a temperature offset to be applied to the sensor readings to compensate for sensor ambient cooling and heat transfer losses in the heat path from the equipment surface to the sensor. Alarm and warning settings include this offset.
Figure 86:
Change Sensor Name This setting changes the sensor name on the scan screen as well as reports.
38 i-ALERT®2 Application Guide
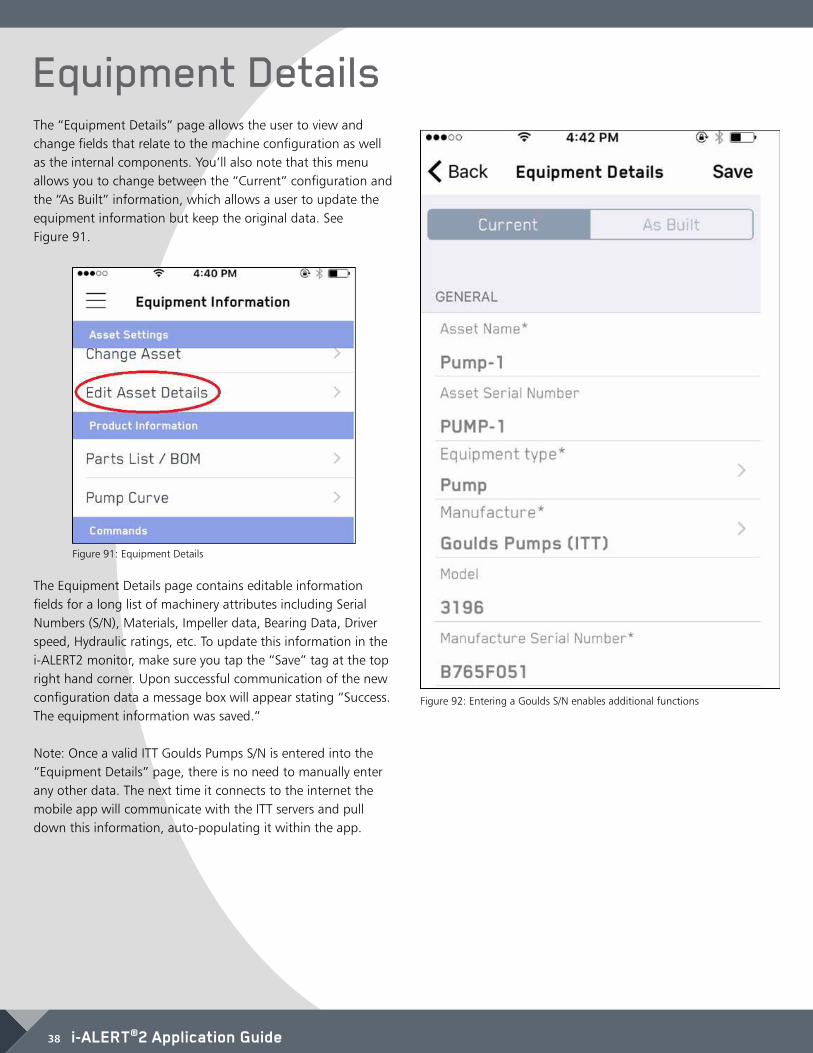
Equipment DetailsThe “Equipment Details” page allows the user to view and change fields that relate to the machine configuration as well as the internal components. You’ll also note that this menu allows you to change between the “Current” configuration and the “As Built” information, which allows a user to update the equipment information but keep the original data. See Figure 91.
Figure 91: Equipment Details
The Equipment Details page contains editable information fields for a long list of machinery attributes including Serial Numbers (S/N), Materials, Impeller data, Bearing Data, Driver speed, Hydraulic ratings, etc. To update this information in the i-ALERT2 monitor, make sure you tap the “Save” tag at the top right hand corner. Upon successful communication of the new configuration data a message box will appear stating “Success. The equipment information was saved.” Note: Once a valid ITT Goulds Pumps S/N is entered into the “Equipment Details” page, there is no need to manually enter any other data. The next time it connects to the internet the mobile app will communicate with the ITT servers and pull down this information, auto-populating it within the app.
Figure 92: Entering a Goulds S/N enables additional functions
i-ALERT®2 Application Guide 39
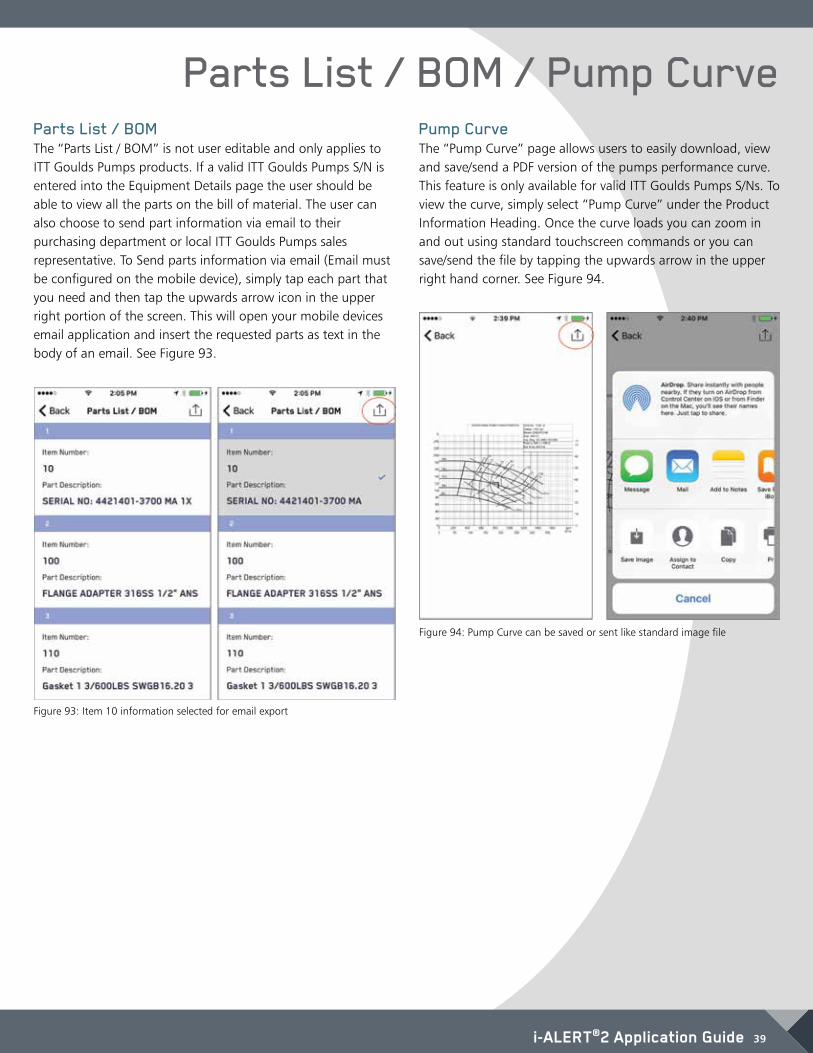
Parts List / BOM / Pump Curve Parts List / BOM The “Parts List / BOM” is not user editable and only applies to ITT Goulds Pumps products. If a valid ITT Goulds Pumps S/N is entered into the Equipment Details page the user should be able to view all the parts on the bill of material. The user can also choose to send part information via email to their purchasing department or local ITT Goulds Pumps sales representative. To Send parts information via email (Email must be configured on the mobile device), simply tap each part that you need and then tap the upwards arrow icon in the upper right portion of the screen. This will open your mobile devices email application and insert the requested parts as text in the body of an email. See Figure 93.
Figure 93: Item 10 information selected for email export
Pump Curve The “Pump Curve” page allows users to easily download, view and save/send a PDF version of the pumps performance curve. This feature is only available for valid ITT Goulds Pumps S/Ns. To view the curve, simply select “Pump Curve” under the Product Information Heading. Once the curve loads you can zoom in and out using standard touchscreen commands or you can save/send the file by tapping the upwards arrow in the upper right hand corner. See Figure 94.
Figure 94: Pump Curve can be saved or sent like standard image file
40 i-ALERT®2 Application Guide
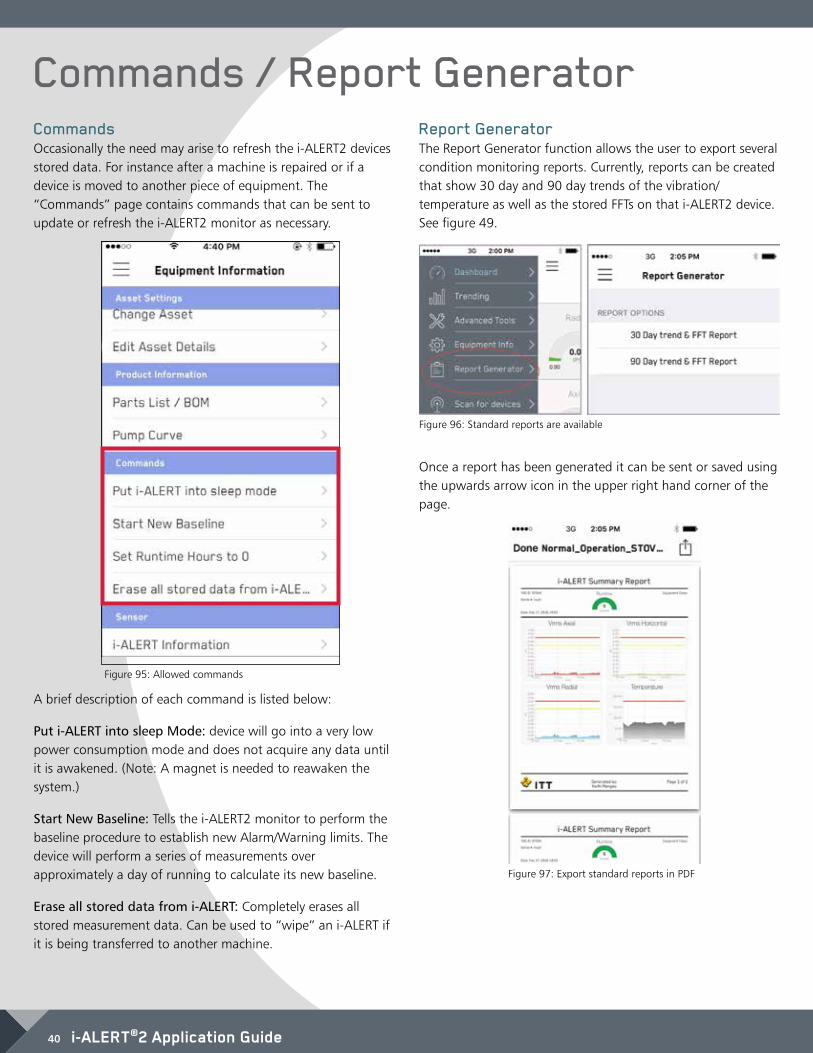
Commands / Report GeneratorCommands Occasionally the need may arise to refresh the i-ALERT2 devices stored data. For instance after a machine is repaired or if a device is moved to another piece of equipment. The “Commands” page contains commands that can be sent to update or refresh the i-ALERT2 monitor as necessary.
A brief description of each command is listed below:
Put i-ALERT into sleep Mode: device will go into a very low power consumption mode and does not acquire any data until it is awakened. (Note: A magnet is needed to reawaken the system.)
Start New Baseline: Tells the i-ALERT2 monitor to perform the baseline procedure to establish new Alarm/Warning limits. The device will perform a series of measurements over approximately a day of running to calculate its new baseline.
Erase all stored data from i-ALERT: Completely erases all stored measurement data. Can be used to “wipe” an i-ALERT if it is being transferred to another machine.
Figure 95: Allowed commands
Report Generator The Report Generator function allows the user to export several condition monitoring reports. Currently, reports can be created that show 30 day and 90 day trends of the vibration/temperature as well as the stored FFTs on that i-ALERT2 device. See figure 49.
Figure 96: Standard reports are available
Once a report has been generated it can be sent or saved using the upwards arrow icon in the upper right hand corner of the page.
Figure 97: Export standard reports in PDF
i-ALERT®2 Application Guide 41
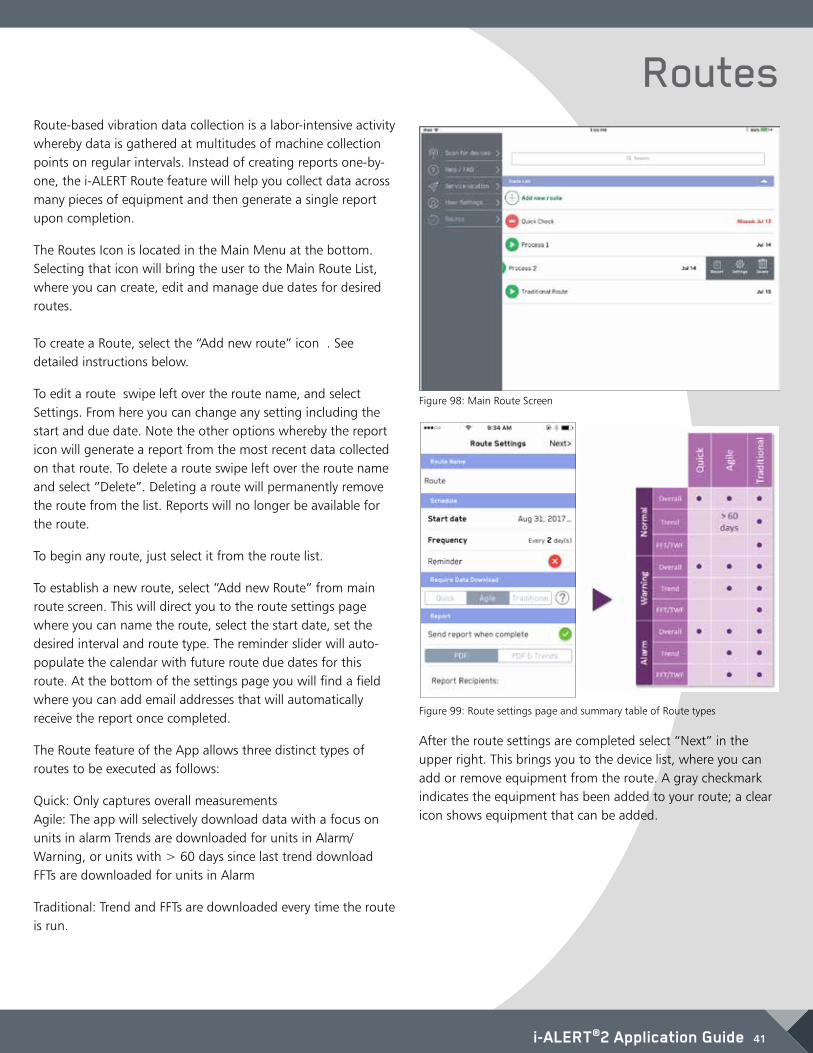
Routes Route-based vibration data collection is a labor-intensive activity whereby data is gathered at multitudes of machine collection points on regular intervals. Instead of creating reports one-by-one, the i-ALERT Route feature will help you collect data across many pieces of equipment and then generate a single report upon completion.
The Routes Icon is located in the Main Menu at the bottom. Selecting that icon will bring the user to the Main Route List, where you can create, edit and manage due dates for desired routes. To create a Route, select the “Add new route” icon . See detailed instructions below.
To edit a route swipe left over the route name, and select Settings. From here you can change any setting including the start and due date. Note the other options whereby the report icon will generate a report from the most recent data collected on that route. To delete a route swipe left over the route name and select “Delete”. Deleting a route will permanently remove the route from the list. Reports will no longer be available for the route.
To begin any route, just select it from the route list.
To establish a new route, select “Add new Route” from main route screen. This will direct you to the route settings page where you can name the route, select the start date, set the desired interval and route type. The reminder slider will auto-populate the calendar with future route due dates for this route. At the bottom of the settings page you will find a field where you can add email addresses that will automatically receive the report once completed.
The Route feature of the App allows three distinct types of routes to be executed as follows:
Quick: Only captures overall measurements Agile: The app will selectively download data with a focus on units in alarm Trends are downloaded for units in Alarm/Warning, or units with > 60 days since last trend download FFTs are downloaded for units in Alarm
Traditional: Trend and FFTs are downloaded every time the route is run.
Figure 98: Main Route Screen
After the route settings are completed select “Next” in the upper right. This brings you to the device list, where you can add or remove equipment from the route. A gray checkmark indicates the equipment has been added to your route; a clear icon shows equipment that can be added.
Figure 99: Route settings page and summary table of Route types
42 i-ALERT®2 Application Guide
Routes
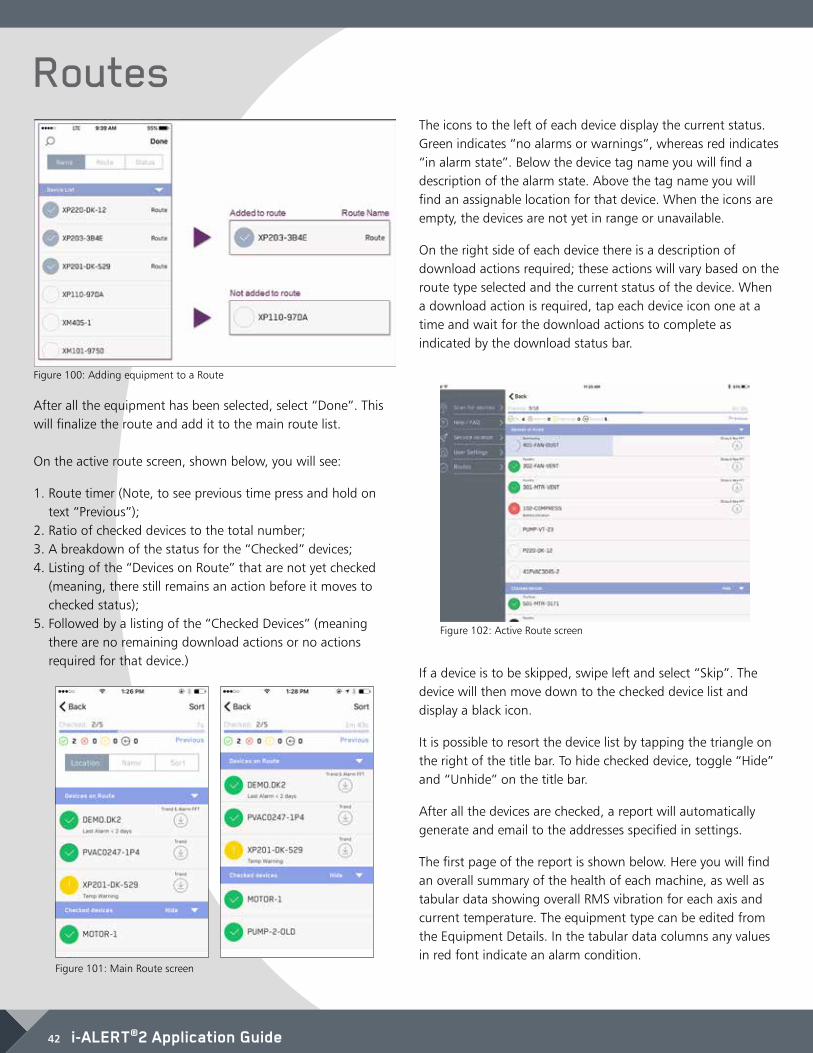
After all the equipment has been selected, select “Done”. This will finalize the route and add it to the main route list. On the active route screen, shown below, you will see:
1. Route timer (Note, to see previous time press and hold on text “Previous”); 2. Ratio of checked devices to the total number; 3. A breakdown of the status for the “Checked” devices; 4. Listing of the “Devices on Route” that are not yet checked (meaning, there still remains an action before it moves to checked status); 5. Followed by a listing of the “Checked Devices” (meaning there are no remaining download actions or no actions required for that device.)
Figure 100: Adding equipment to a Route
Figure 101: Main Route screen
The icons to the left of each device display the current status. Green indicates “no alarms or warnings”, whereas red indicates “in alarm state”. Below the device tag name you will find a description of the alarm state. Above the tag name you will find an assignable location for that device. When the icons are empty, the devices are not yet in range or unavailable.
On the right side of each device there is a description of download actions required; these actions will vary based on the route type selected and the current status of the device. When a download action is required, tap each device icon one at a time and wait for the download actions to complete as indicated by the download status bar.
If a device is to be skipped, swipe left and select “Skip”. The device will then move down to the checked device list and display a black icon.
It is possible to resort the device list by tapping the triangle on the right of the title bar. To hide checked device, toggle “Hide” and “Unhide” on the title bar.
After all the devices are checked, a report will automatically generate and email to the addresses specified in settings.
The first page of the report is shown below. Here you will find an overall summary of the health of each machine, as well as tabular data showing overall RMS vibration for each axis and current temperature. The equipment type can be edited from the Equipment Details. In the tabular data columns any values in red font indicate an alarm condition.
Figure 102: Active Route screen

i-ALERT®2 Application Guide 43
Figure 103: Route report summary page
Figure 104: Route report trend details screen
Figure 105: Route report FFT and TWF screen
At the top of each page a summary of equipment details is found followed by either trends or FFT’s for that device. The timestamp for each FFT is found in the upper right corner of each graph.

44 i-ALERT®2 Application Guide
Help/FAQ / Service LocatorHelp/FAQ The Help/FAQ section provides useful tools In the event you encounter a problem or need additional assistance with the i-ALERT2 or mobile application. Within the Help/FAQ menu you can access the FAQ or Troubleshooting documentation for the product. (Internet connection is required). You also access ITT’s website, contact us via email, or view the software policy information.
Figure 106: Help/FAQ menu offers additional tools and links
Service Locator ITT makes it easy to get in touch with local resources that can assist with equipment repairs, spare parts, and field service. Upon tapping the “Service Locator” tag in the main menu, you will be prompted to allow access to you location in order for the application to locate the nearest service center or sales office. Tap the pin with the wrench icon to bring up the service center contact information.
Figure 107: Service locator finds nearest sales or service centers

i-ALERT®2 Application Guide 45
User SettingsUser Settings The “User Settings” menu allows you to change your account details including your name and password. It also allows you to adjust the unit system and specify FFT options.
To edit account details, select it, and edit user information as shown below. Note that “Last Name” is a required field.
To transfer assets between accounts, select “Transfer Assets” as shown below. User can sort by Plant / Area / Zone, and move an asset providing they have rights to the new location.
Choose “Select Account” to change between accounts. Note: user must have access to account they wish to change to.
Figure 108:
Figure 109:
Figure 110:
Figure 111:
46 i-ALERT®2 Application Guide
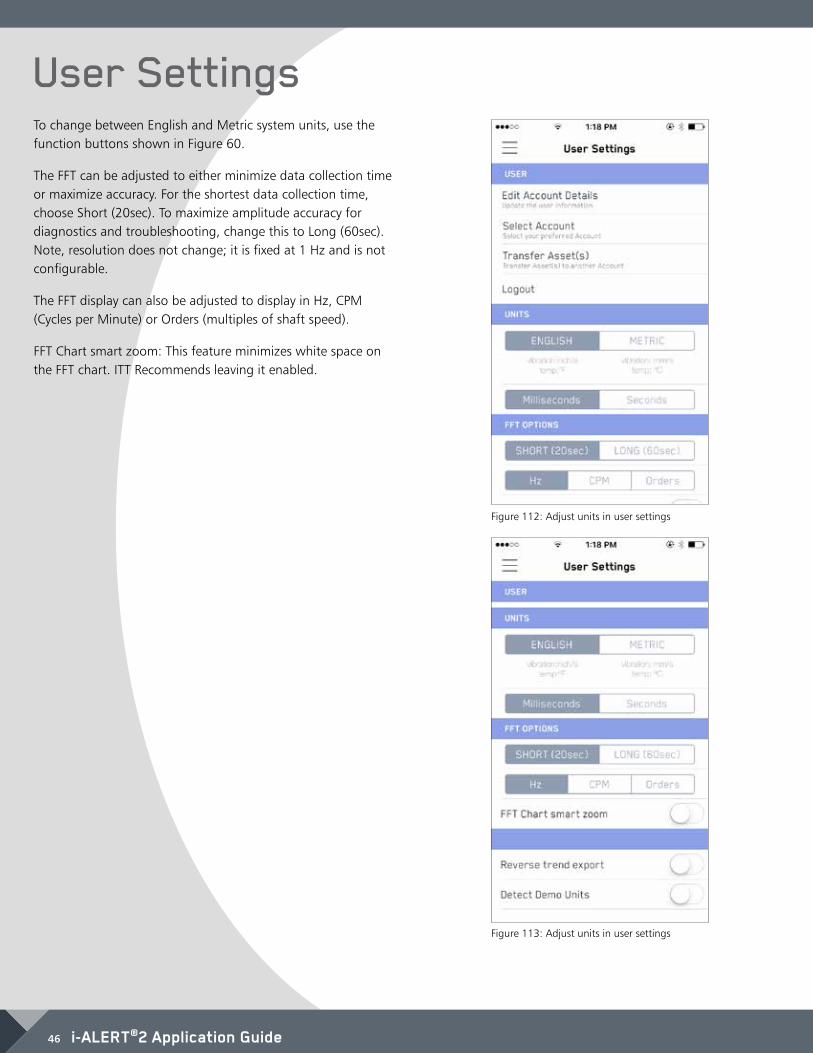
User SettingsTo change between English and Metric system units, use the function buttons shown in Figure 60.
The FFT can be adjusted to either minimize data collection time or maximize accuracy. For the shortest data collection time, choose Short (20sec). To maximize amplitude accuracy for diagnostics and troubleshooting, change this to Long (60sec). Note, resolution does not change; it is fixed at 1 Hz and is not configurable.
The FFT display can also be adjusted to display in Hz, CPM (Cycles per Minute) or Orders (multiples of shaft speed).
FFT Chart smart zoom: This feature minimizes white space on the FFT chart. ITT Recommends leaving it enabled.
Figure 113: Adjust units in user settings
Figure 112: Adjust units in user settings

i-ALERT®2 Application Guide 47
Technical ReferencesTechnical References 1. Moore, Ron. Making Common Sense Common Practice. Models for Manufacturing Excellence Third Edition, Elsevier, Copyright 2004
2. Crawford, Arthur. The Simplified Handbook of Vibration Analysis Volume II, Computational Systems Incorporated, Copyright 1992
3. Eshleman, Ronald. Machinery Vibration Analysis: Diagnostics, Condition Evaluation, and Correction, Vibration Institute, Copyright 2002

G.iALERT2AppGuide.en-US.2017-12240 Fall StreetSeneca Falls, NY 13148www.itt.com
© 2017 ITT Goulds Pumps Inc.
For More Details:visit: https://www.i-alert.ai
contact: [email protected]
call: 1.315.568.7290
Related Documents