© 2016 Ke Yang

Welcome message from author
This document is posted to help you gain knowledge. Please leave a comment to let me know what you think about it! Share it to your friends and learn new things together.
Transcript

© 2016 Ke Yang
SYNTHESIS AND APPLICATION OF IONIC MOLECULAR AND
POLYMERIC MATERIALS
BY
KE YANG
DISSERTATION
Submitted in partial fulfillment of requirements
for the degree of Doctor of Philosophy in Materials Science and Engineering
in the Graduate College of the
University of Illinois at Urbana-Champaign, 2016
Urbana, Illinois
Doctoral Committee:
Professor Jeffrey S. Moore, Chair
Professor Kenneth S. Schweizer
Assistant Professor Yang Zhang
Assistant Professor Qian Chen
Assistant Professor Kristopher A. Kilian
ii
ABSTRACT
Materials are built from atoms and molecules through different interactions. Few
artificial material is built primarily with ionic interaction despite its ubiquitous existence
in living systems. My research has focused on filling this void by developing novel ionic
molecular and polymeric materials for both fundamental understandings of the systems and
various applications such as self-healing. With one theme of ionic functional materials, my
research has broadly evolved into three areas: Chapters 2-3 focus on the development of
structure-property relationship of network-forming ionic glasses and liquids; Chapter 4
focus on the application of network-forming ionic liquids for the cause of shockwave
absorption; Chapter 5 extends the exploration into the realm of polymeric ionic rubber and
its application as self-healing materials.
The network-forming ionic glass is a stable glassy organic network that is primarily
connected by ionic interaction. It was found that the glass transition temperature of ionic
glass series with increasing alkyl backbone length showed an intriguing odd-even effect.
The mechanism was revealed by inelastic neutron scattering as different dynamics of odd-
and even-numbered cations in liquid state. Structurally, thanks to the nano-segregation, the
network-forming ionic liquid proved to be an excellent shockwave absorption material.
Further investigation indicated that a shock-induced ordering in network-forming ionic
liquids contributed to its overall shockwave absorption performance. Similar to the small
molecule ionic glass and liquids, an oligomeric anion, a carboxylate-terminated copolymer
of polybutadiene(PBD) and polyacrylonitrile(PAN), was chosen as the counterion for
multivalent cations to build a polymeric amorphous ionic network. An ionic rubber that
combines competitive mechanical properties and full reprocessibiltiy was successfully
prepared where ionic interaction plays the key role of the dynamic crosslink. The reversible
ionic crosslink renders excellent properties including high plateau modulus, rate-dependent
stress releasing and super-fast self-healing at room temperature. These studies on the ionic
glass and ionic rubber have advanced the development of artificial ionic materials in the
aspect of both fundamental knowledges on structure-property relationship and practical
application including shockwave absorption and self-healing.
iii
ACKNOWLEDGEMENT
I know this will be the most read part of my thesis. I have a long list of people to
thank for helping me pursue my Ph.D. degree. After all, obtaining this degree is not as easy
as I thought when I accepted the offer as a senior undergrad. Most importantly, it will not
happen if I haven’t received the help and support from the people in the list. The five years
at UIUC have definitely changed my life and shaped myself into who I am now in a lot of
ways.
First, I want to thank my advisor, Prof. Jeff Moore, for taking me in his group and
cultivating me with his advising philosophy. Even though I did not realize this at first,
eventually I come to this conclusion that he is the best advisor in the world. I appreciate all
his advice to me, whether it is about research, work or life. He is critical in the world of
science but supportive for his students. We have a lot of stories with our individual
meetings such as Jeff’s brother’s mushroom farm, Jeff’s mandatory working hours during
his graduate time by his wife, and so on. Jeff always wants me to figure out the question
by myself even though he may know the answer (or not), and I have to admit that helps me
a lot not only in academia but also in life. Likewise, I would like to thank my coadvisor,
Prof. Yang Zhang for his support along the way. We started as collaborators on the project
of ionic glass. I really admired his intelligence and diligence as a scientist. I cherished the
time when we drove to national labs to do neutron scattering experiments and chatted along
the way. I am really glad to hear that the proposal we wrote together got funded.
I would also like to thank my prelim and thesis committee, Prof. Ken Schweizer,
Prof. Qian Chen, Prof. Kris Kilian, Prof. Paul Braun, and Prof. Nancy Sottos. We had a lot
of fruitful discussions during subgroup meetings and my prelim test. I have taken classes
from them as a student and taken great suggestions from them as a young researcher. They
really made me feel choosing UIUC as my graduate school is a great choice.
As an AMS group member, I would like to thank Prof. Nancy Sottos and Prof. Scott
White. They are amazing scientists and engineers. I learned a lot from them during AMS
group meetings. They gave me guidance on my research both directly and indirectly.
iv
I can’t express enough gratitude to be able to work with all the Moore group
members. Being more like a family, we have a very healthy and friendly atmosphere in the
group. For every important moment of my Ph.D. life, the Moore group is always there,
guiding me, encouraging me and having fun with me. Dr. Preston May and I talked about
work, life, and a lot together when both of us worked late in the lab. These talks make me
know more about mechanophore and graduate life. Dr. Hefei Dong shared the fume hood
with me for my first two years. He was the only other MatSE student in the Moore group
back then and had provided me with numerous valuable guidance. Dr. Windy Santa Cruz
worked beside me for almost four years and she later inherited “Beckman Mom” from
Preston. She was super helpful with everything from simple lab questions to manuscript
proofread. Dr. Charles Diesendruck is the most resourceful person in the lab and he is a
great scientist that I learned a lot from. Dr. Tomohiro Shiraki is an excellent chemist and
my scientific brainstorm listener. We hang out together and explored the cuisine of
Champaign-Urbana together.
Special thanks to Dr. Jun Li, Yi Ren, Dr. Bora Inci, Dr. Olivia Lee, Dr. Semin Lee,
Dr. Scott Sisco, Dr. Xiaocun Lu for helpful discussions and their intelligent suggestions.
Thank you to the past and current Beckman Crew: Dr. Matthew Kryger, Dr. Koushik
Ghosh, Catherine Casey, Yang Song, Josh Grolman, Shijia Tang, Dr. Maxwell Robb, Ian
Robertson, Jose Zavala and Abigail Halmes. Beckman is a nice place to work at and you
are awesome people to work with. Also thanks to RAL Crew: Dr. Nina Sekerak, Dr. Joshua
Kaitz, Dr. James Herbison, Dr. Michael Evans, Dr. Pin-Nan Cheng, Dr. Nagarjuna
Gavvalapalli, Dr. Nagamani Chikkanagari, Dr. Etienne Chenard, Dr. Shawn Miller, Anna
Yang, Kevin Cheng, Anderson Coates, Huiying Liu, Timothy Moneypenny, and Chengtian
Shen. I would like to give special thanks to Ashley Trimmel as the manager of the group.
Ashley helped me with purchasing orders, reserving space, registering conference and so
much more. She is the one that keeps the group running.
AMS group is too large to list, but I would like to give special thanks to Dr. Sen
Kang, Dr. Wenle Li, Jaejun Lee, Dr. Brett Krull, and Tae Ann Kim. I am very proud to be
the TGA and DSC manager for the AMS group for more than 4 years. I always joked about
getting a job from either Mettler Toledo or TA Instruments because I know their
v
instruments to every screw. Thanks to the Zhang group member: Abhishek Jaiswal, Zhikun
Cai, and Nathan Walter. We did several national lab experiments together and had a lot of
fun.
Thank you to my undergraduates: Isac Lim, Andrew Chancellor, Yangyang Zhou,
Aileen Nolan and Matthew Wong. You are great people to work with and I have also
learned a lot from you as your mentor. I am very proud of everything you have
accomplished during your time in Moore group and I wish you the very best in your future
career.
The life in Champaign-Urbana becomes colorful with all my friends. We went out
eating, playing sports, partying, and traveling together. We shared our memory in UIUC
and became lifetime friends. Thank you for all your company and encouragement: Junjie
Wang, Sichao Ma, Helin Zhu, Lu Xu, Yifei Meng, Kanuo Chen, Weili Chen, Zihe Gao,
Liang Ma, Dr. Sen Kang, Dr. Chunjie Zhang, Jie Zhang, Dr. Sizhu You, Dr. Zhi Su and
Mian Duan.
I want to thank my family, especially to my mom and dad. You always give me the
best of everything. Your love and support make me who I am today. I know you are always
proud of me.
Finally, I would like to thank my wife, Ruiwen Sun. You are the best thing that
ever happened to me. We’ve attended the same high school, same university, and same
graduate school. Whenever I am happy or sad, you are always by my side and support me
without any condition. You have the courage to start your new career in order to solve our
two-body problem. You have a beautiful heart to help other people as a social worker. I
cherish every memory we have together. I am looking forward to exploring the rest of my
life with you by my side. I love you.
vi
TABLE OF CONTENTS
Chapter 1: Ionic Molecular/Polymeric Materials: An Overview ........................................ 1
1.1 Ionic interaction ........................................................................................................ 1
1.2 Examples of ionic interactions in living system ....................................................... 2
1.3 Ionic molecular glass: combination of ionic liquids and molecular glass ................ 5
1.4 Ionic polymeric materials ......................................................................................... 8
1.5 Current application of ionic interaction in self-healing materials ............................ 9
1.6 References ............................................................................................................... 12
Chapter 2: Synthesis and Structure-Property Relationship of Network-Forming
Ionic Glass ............................................................................................................... 16
2.1 Abstract ................................................................................................................... 16
2.2 Introduction ............................................................................................................. 16
2.3 Structure-property relationship of di-ammonium ionic glass ................................. 18
2.3.1 Microstructure analysis and frustrate crystallization in di-ammonium ionic
glass........................................................................................................................... 18
2.3.2. Thermal properties of di-ammonium ionic glass ............................................ 23
2.3.3 Mechanical properties and viscosity of ionic glass .......................................... 26
2.4 Structure-property relationship of di-imidazolium ionic glass ............................... 29
2.5 Experimental details................................................................................................ 29
2.5.1. Materials and methods .................................................................................... 29
2.5.2. Synthesis of diammonium ionic glass............................................................. 31
2.5.3. Synthesis of diimidazolium ionic glass........................................................... 41
2.6 References ............................................................................................................... 44
Chapter 3: Odd-even Effect in Network-forming Ionic Glass and Liquid ....................... 46
3.1 Abstract ................................................................................................................... 46
vii
3.2 Introduction ............................................................................................................. 46
3.3 Odd-even glass transition temperatures in network-forming ionic glass homolog 47
3.4 Dynamic odd-even effect in network-forming ionic liquids ................................... 50
3.5 Odd-even effect of diffusional coefficient in n-alkane ........................................... 59
3.6 Experimental section ............................................................................................... 68
3.6.1 Quasi-elastic neutron scattering (QENS) experiment ...................................... 68
3.6.2 X-ray and neutron pair distribution function (PDF) experiment ..................... 70
3.7 References ............................................................................................................... 71
Chapter 4. Application of Network-forming Ionic Liquids in Shockwave Absorption
Application ........................................................................................................................ 75
4.1 Abstract ................................................................................................................... 75
4.2 Introduction ............................................................................................................. 75
4.3 Comparison of shockwave absorption performance between polyurea and
network-forming ionic liquids ...................................................................................... 77
4.4 Shock-induced ordering in the nano-segregated network-forming ionic liquid ..... 80
4.5 Experimental section ............................................................................................... 83
4.5.1. Materials and methods .................................................................................... 83
4.5.2 Preparation of NIL shockwave impact test specimen ...................................... 84
4.5.3 Laser-induced Shockwave Test Protocol ......................................................... 85
4.6 References ............................................................................................................... 87
Chapter 5: Facile Design and Synthesis of Thermoplastic Ionic Elastomer with Fast
Automatic Self-healing ..................................................................................................... 90
5.1 Abstract ................................................................................................................... 90
5.2 Introduction ............................................................................................................. 90
5.3 Synthesis of imidazolium and guanidinium-based ionic rubber ............................. 92
5.4 Thermal analysis ..................................................................................................... 94
viii
5.5 Mechanical performance ......................................................................................... 95
5.6 Rate-dependent stress release ................................................................................. 96
5.7 Super-fast self-healing at room temperature ........................................................... 98
5.8 Experimental section ............................................................................................. 100
5.8.1 Materials and methods ................................................................................... 100
5.8.2 Synthesis of triimidazolium and diguanidinium ionic rubber........................ 101
5.8.3 Tensile stress experiment using loading frame .............................................. 105
5.8.4 Self-healing experiment of ionic rubber ........................................................ 105
5.9 References ............................................................................................................. 106
1
CHAPTER 1
IONIC MOLECULAR/POLYMERIC MATERIALS: AN OVERVIEW
1.1 Ionic interaction
Why do molecules bond with each other? How do they form a macroscopic piece
of materials? These are the questions we ask when we first learned about chemistry.
According to a common classification, chemical bond includes covalent bond, ionic bond,
and metallic bond. The covalent bond is a shared-electron-pair bond, ionic bond is a
definite electrostatic bond, and metallic bond is a fractional bond. 1,2 Besides primary
interactions, secondary interactions refer to relatively weaker attractions between nearby
atoms or molecules such as ion-dipole attractions or dipole-dipole attractions. As a brief
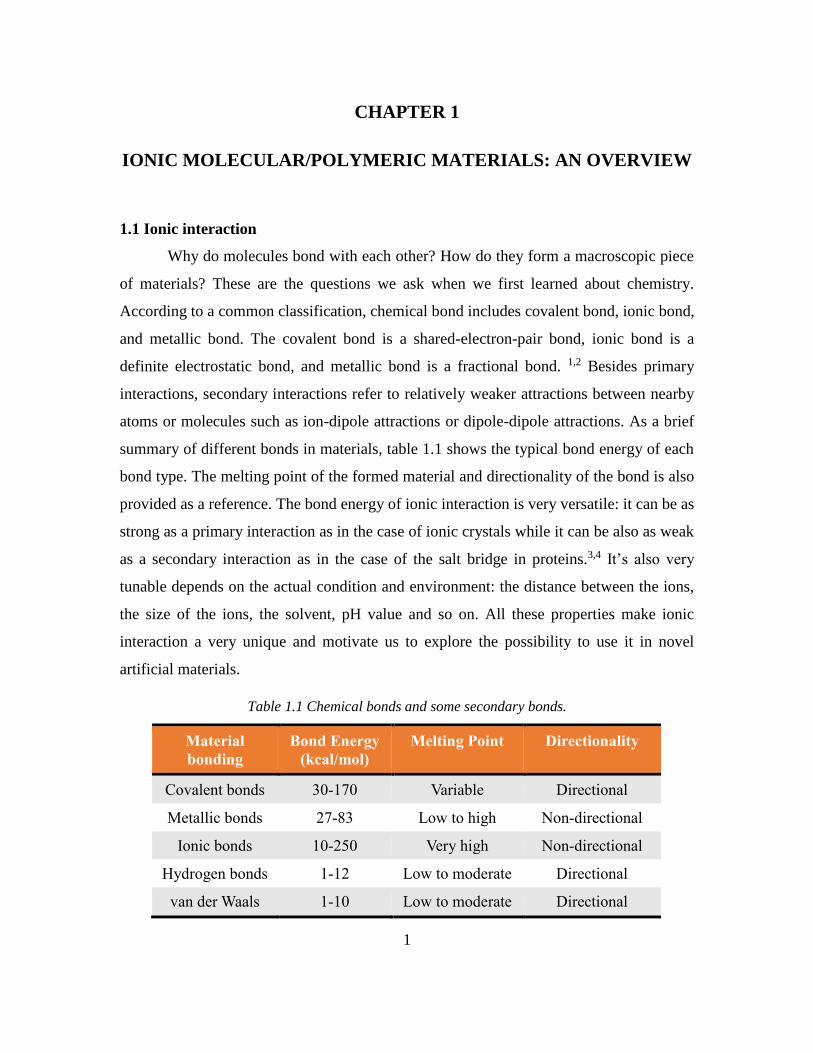
summary of different bonds in materials, table 1.1 shows the typical bond energy of each
bond type. The melting point of the formed material and directionality of the bond is also
provided as a reference. The bond energy of ionic interaction is very versatile: it can be as
strong as a primary interaction as in the case of ionic crystals while it can be also as weak
as a secondary interaction as in the case of the salt bridge in proteins.3,4 It’s also very
tunable depends on the actual condition and environment: the distance between the ions,
the size of the ions, the solvent, pH value and so on. All these properties make ionic
interaction a very unique and motivate us to explore the possibility to use it in novel
artificial materials.
Table 1.1 Chemical bonds and some secondary bonds.
Material
bonding
Bond Energy
(kcal/mol)
Melting Point Directionality
Covalent bonds 30-170 Variable Directional
Metallic bonds 27-83 Low to high Non-directional
Ionic bonds 10-250 Very high Non-directional
Hydrogen bonds 1-12 Low to moderate Directional
van der Waals 1-10 Low to moderate Directional
2
Calculating the ionic interaction strength renders the possibilities to predict the
properties of novel ionic materials. The ionic interaction strength has intrinsic relation with
most of their physicochemical properties such as melting point, density, vapor pressure and
viscosity. For ionic crystals, the calculation is simply by calculating the lattice energy, U,
which equals to the energy (dissociation heat) to separate one mole of ionic crystal into
cations and anions. 5
𝑈 = 𝐴𝑁𝑒2𝜂1𝜂2
𝑟(1 −
1
𝑚) (1.1)
where η1, η2, and e are the ionic and electronic charges, r is the distance between
ions, m is electronic shells repulsion exponent, N is Avogadro constant, and A is the
Madelung constant.
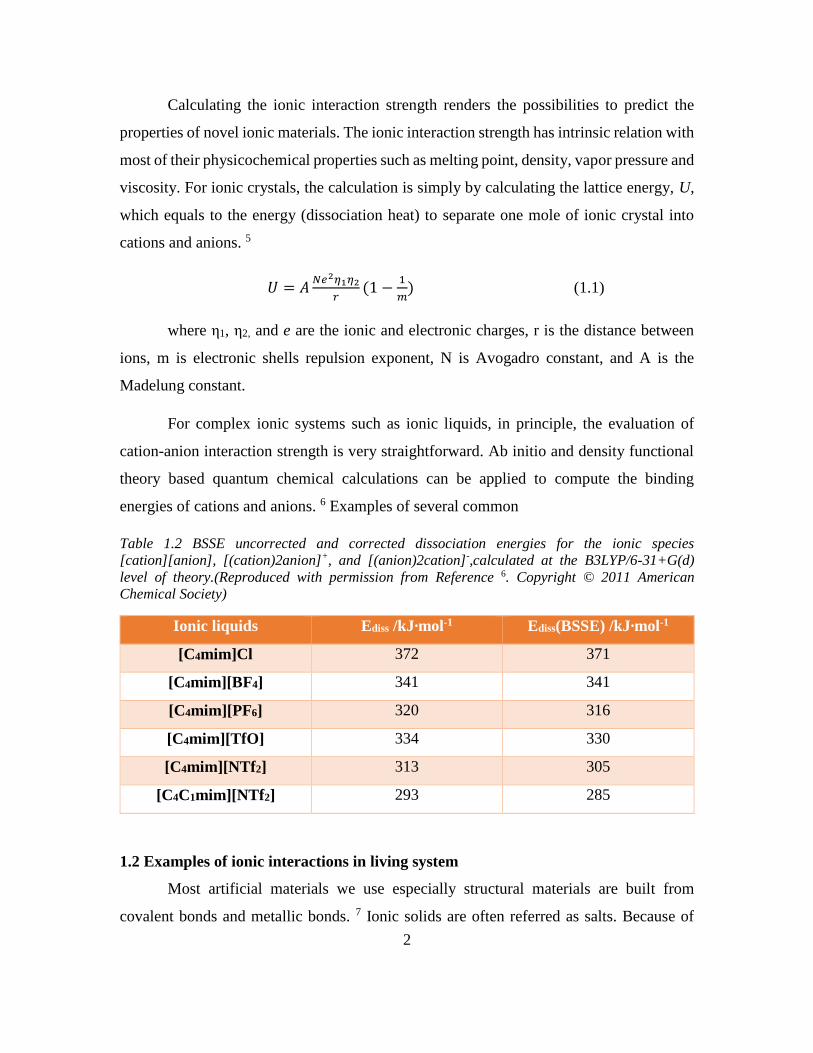
For complex ionic systems such as ionic liquids, in principle, the evaluation of
cation-anion interaction strength is very straightforward. Ab initio and density functional
theory based quantum chemical calculations can be applied to compute the binding
energies of cations and anions. 6 Examples of several common
Table 1.2 BSSE uncorrected and corrected dissociation energies for the ionic species
[cation][anion], [(cation)2anion]+, and [(anion)2cation]-,calculated at the B3LYP/6-31+G(d)
level of theory.(Reproduced with permission from Reference 6. Copyright © 2011 American
Chemical Society)
Ionic liquids Ediss /kJ∙mol-1 Ediss(BSSE) /kJ∙mol-1
[C4mim]Cl 372 371
[C4mim][BF4] 341 341
[C4mim][PF6] 320 316
[C4mim][TfO] 334 330
[C4mim][NTf2] 313 305
[C4C1mim][NTf2] 293 285
1.2 Examples of ionic interactions in living system
Most artificial materials we use especially structural materials are built from
covalent bonds and metallic bonds. 7 Ionic solids are often referred as salts. Because of
3
their brittle nature and low resistance to polar solvents such as water, they are rarely used
as a material but rather in the form of ions/electrolyte in solution.
Despite rare application in artificial materials, ionic bond is one of the most
common interactions in biological systems. Its ubiquitous existence is because of its
reversibility and versatile bond energy compared with other supramolecular forces. 8 For
example, it has been shown that salt bridges play an important role in stabilizing proteins
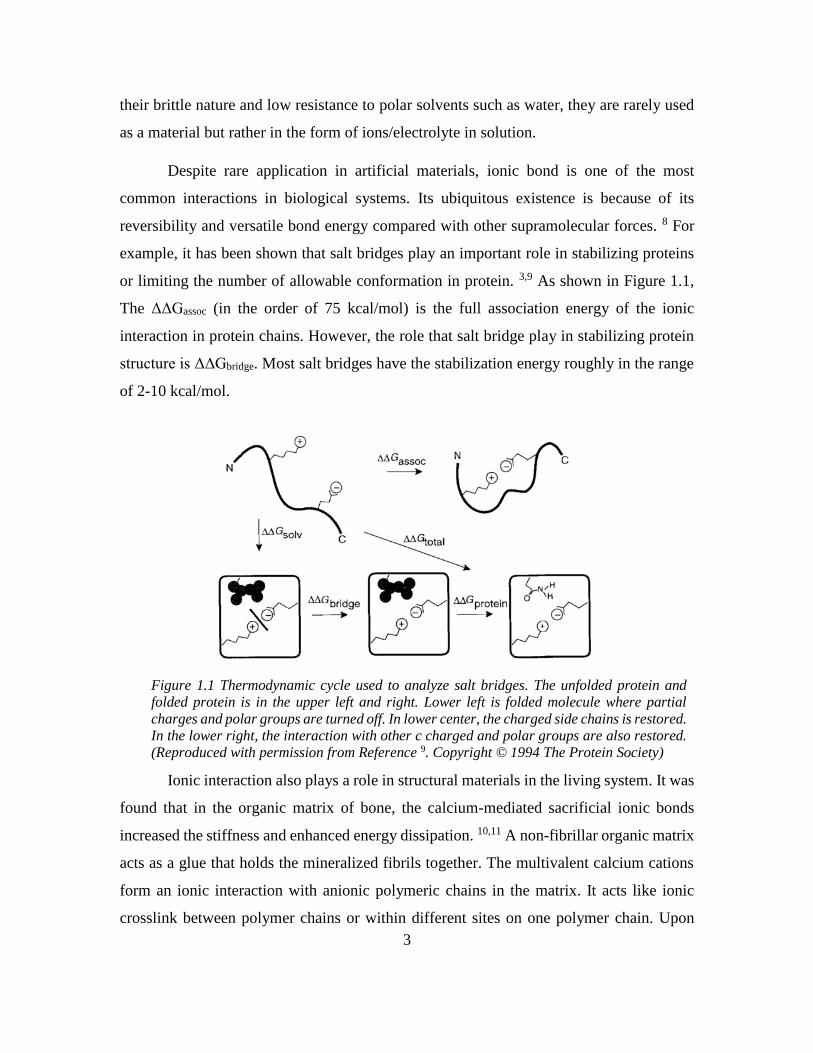
or limiting the number of allowable conformation in protein. 3,9 As shown in Figure 1.1,
The ΔΔGassoc (in the order of 75 kcal/mol) is the full association energy of the ionic
interaction in protein chains. However, the role that salt bridge play in stabilizing protein
structure is ΔΔGbridge. Most salt bridges have the stabilization energy roughly in the range
of 2-10 kcal/mol.
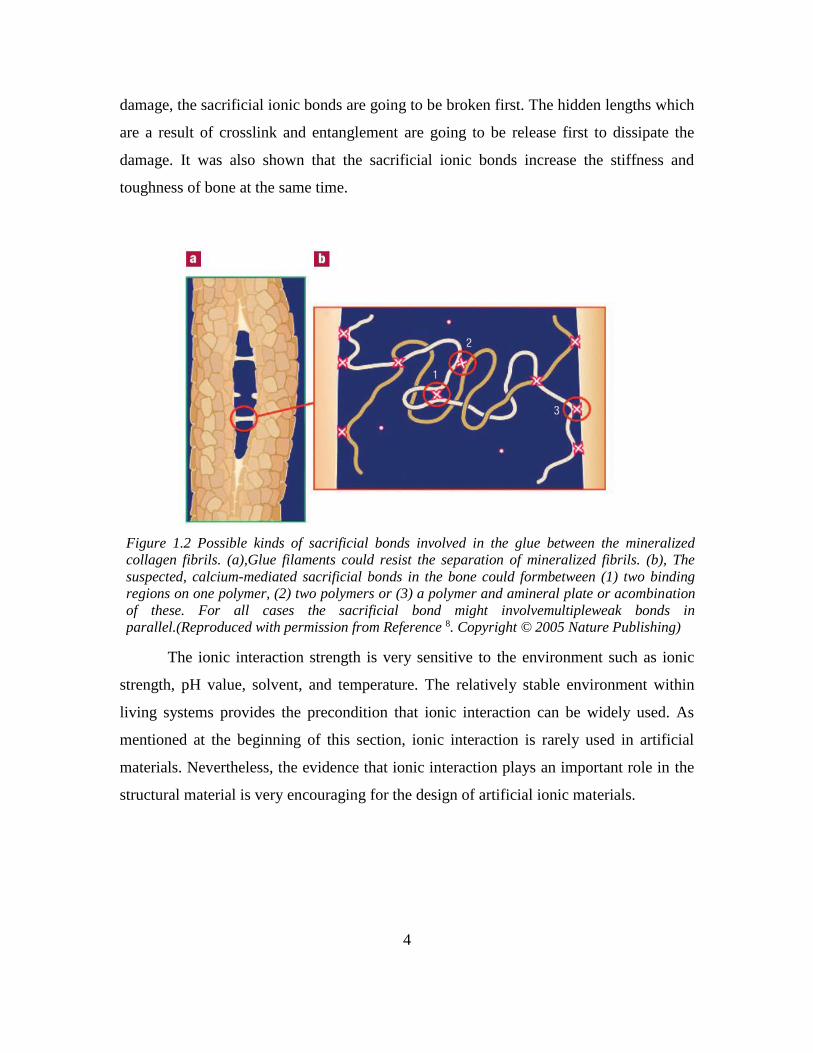
Ionic interaction also plays a role in structural materials in the living system. It was
found that in the organic matrix of bone, the calcium-mediated sacrificial ionic bonds
increased the stiffness and enhanced energy dissipation. 10,11 A non-fibrillar organic matrix
acts as a glue that holds the mineralized fibrils together. The multivalent calcium cations
form an ionic interaction with anionic polymeric chains in the matrix. It acts like ionic
crosslink between polymer chains or within different sites on one polymer chain. Upon
Figure 1.1 Thermodynamic cycle used to analyze salt bridges. The unfolded protein and
folded protein is in the upper left and right. Lower left is folded molecule where partial
charges and polar groups are turned off. In lower center, the charged side chains is restored.
In the lower right, the interaction with other c charged and polar groups are also restored.
(Reproduced with permission from Reference 9. Copyright © 1994 The Protein Society)
4
damage, the sacrificial ionic bonds are going to be broken first. The hidden lengths which
are a result of crosslink and entanglement are going to be release first to dissipate the
damage. It was also shown that the sacrificial ionic bonds increase the stiffness and
toughness of bone at the same time.
The ionic interaction strength is very sensitive to the environment such as ionic
strength, pH value, solvent, and temperature. The relatively stable environment within
living systems provides the precondition that ionic interaction can be widely used. As
mentioned at the beginning of this section, ionic interaction is rarely used in artificial
materials. Nevertheless, the evidence that ionic interaction plays an important role in the
structural material is very encouraging for the design of artificial ionic materials.
Figure 1.2 Possible kinds of sacrificial bonds involved in the glue between the mineralized
collagen fibrils. (a),Glue filaments could resist the separation of mineralized fibrils. (b), The
suspected, calcium-mediated sacrificial bonds in the bone could formbetween (1) two binding
regions on one polymer, (2) two polymers or (3) a polymer and amineral plate or acombination
of these. For all cases the sacrificial bond might involvemultipleweak bonds in
parallel.(Reproduced with permission from Reference 8. Copyright © 2005 Nature Publishing)
5
1.3 Ionic molecular glass: combination of ionic liquids and molecular glass
Ionic molecular materials refer to organic molecules that are primarily bound by
ionic interaction. Obviously, the most famous and explored ionic molecular materials are
ionic liquids. The definition of ionic liquids is ambiguous to some extent. Usually, people
refer ionic liquids as “organic salts with a melting temperature below 100 °C”. 12,13
However, as the library of ionic liquids extends dramatically, the “100°C” in definition
extends to other arbitrary temperature. For example, room temperature ionic liquids refer
to organic salts that are in their liquid state at room temperature. 13 The field of ionic liquid
expands dramatically because its application in green solvents, catalysts, electrolytes and
pharmaceuticals. 14
By definition, ionic liquids are molten salts. However, once they are cooled down,
many of the ionic liquids form semi-crystal instead of complete crystalline. The direct
reflection is in their differential scanning calorimetry (DSC) scans, a glass transition
exists.15 This is because of the structural frustration in the ionic liquid molecules. In glassy
state, the ionic liquid or ionic glass in a more accurate definition has a similar property to
a molecular glass, which possesses pretty high modulus (around GPa).16 Compared with
inorganic ionic glass, they are much less brittle. 17 They are good candidates for practical
applications if their glass transition temperature can be higher than room temperature.
However, in the literature, these ionic liquids usually have pretty low Tg which is well
below 0 °C. 16,18–21
Multivalence is another important issue that limits the mechanical property and
glass transition temperature in ionic liquids. Because most ionic liquids research actually
focuses on lowering the viscosity of ionic liquid for application in solvent and electrolyte.
22–25 As a result, multivalence has been avoided in the area of ionic liquids. Nevertheless,
for the better mechanical property at room temperature and higher glass transition
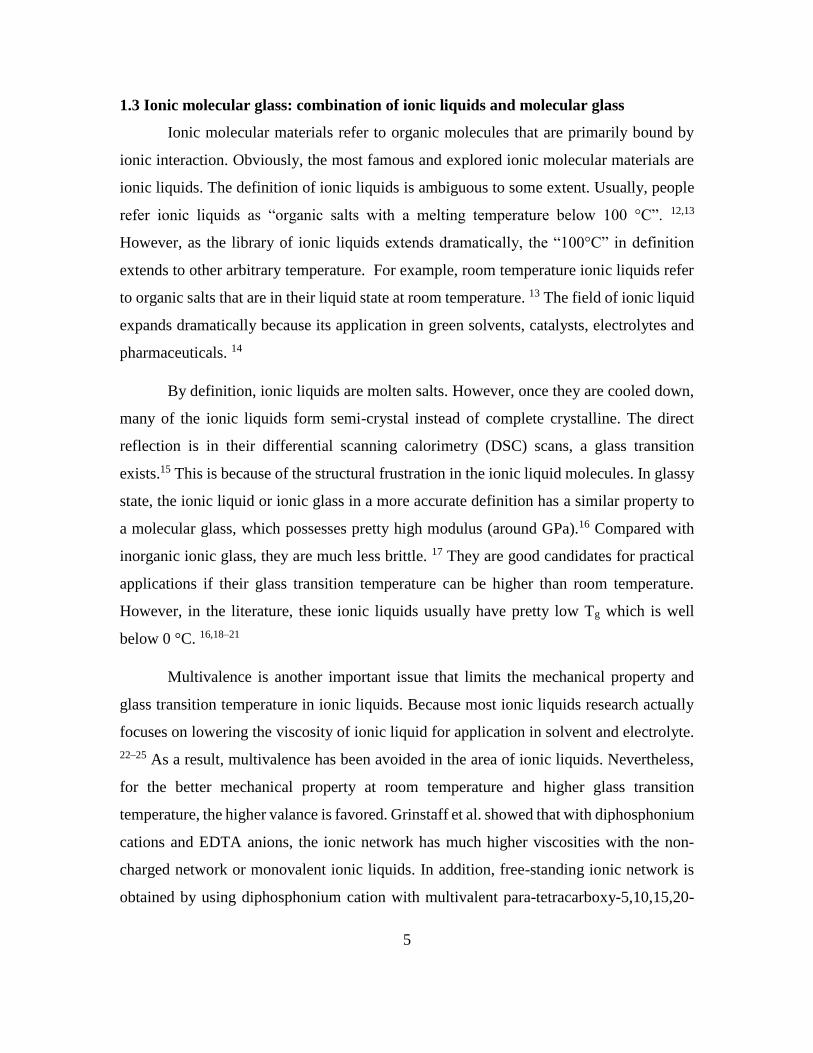
temperature, the higher valance is favored. Grinstaff et al. showed that with diphosphonium
cations and EDTA anions, the ionic network has much higher viscosities with the non-
charged network or monovalent ionic liquids. In addition, free-standing ionic network is
obtained by using diphosphonium cation with multivalent para-tetracarboxy-5,10,15,20-
6
tetraphenyl-21H,23H-porphine anion. (Figure 1.3) The similar supramolecular ionic
network has also been reported by Aboudazadeh et al. using dications and citrate. 26
Another important issue is that because the structural frustration in these ionic
liquids is usually limited, the glass is not very stable and will slowly go through cold
crystallization process to form crystal or semi-crystal over time, which affects their
mechanical properties.16,27 Here we turn to the area of organic molecular glass for more
stable ionic glass. The organic molecular glass is a class of organic molecules which do
not crystallize readily upon cooling. There are several structure design principles for the
organic molecular glass to avoid crystallization including nonpolar molecules structures,
bulky heavy substituents, and large molecule size.28 Figure 1.4 shows the typical structure
of two molecular glasses which includes heavy pendant group, non-planar structure, and
pretty large molecular size.29 Incorporating these design principles, we aimed to frustrate
any crystallization which may result in inhomogeneity in materials, leading to disruption
of network and compromise of strength.
7
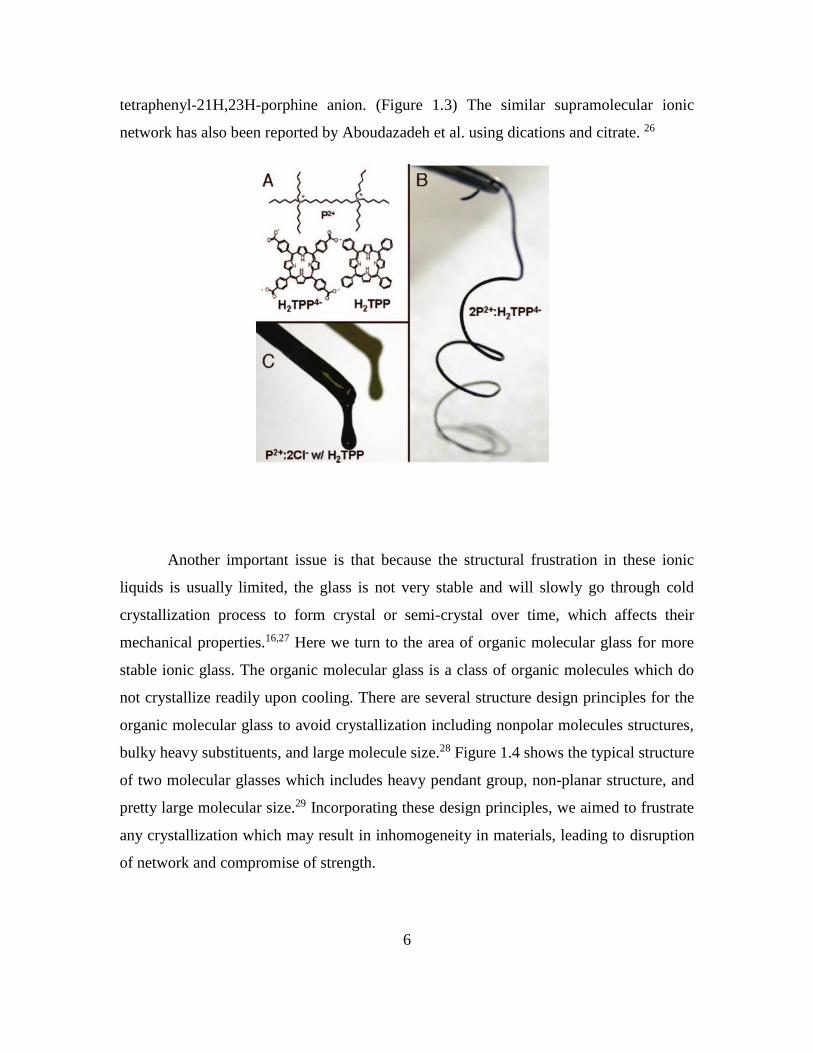
Combining glass-forming ionic liquid, the importance of multivalence in the
supramolecular ionic network and organic molecular glass, we aim to synthesize a new
material that we named network-forming ionic glass. The definition for network-forming
ionic glass is a stable glassy organic network that is primarily connected by ionic
interaction. The key elements in network-forming ionic glass is: 1) the material is a stable
glass which is ensured by excessive structural frustration; 2) the ionic network is connected
only by ionic interaction, which is another way of saying the network is composed of
cations and anions; 3) in order to form the network, the cation and anion need to be
multivalent, which means the valence/functionality/number of charges of cation/anion
needs to be larger than two and the counterion’s functionality needs to be larger than three.
The network-forming ionic glass can also be considered as a counterpart to
conventional thermosets, which is a heavily crosslinked network formed by covalent bonds.
Instead, ionic glass is a reversible network primarily with ionic crosslinks, combining both
strength and adaptivity. Building the structure-property relationship of ionically-connected
material is beneficial for the development of new generation of functional materials such
as self-healing materials30 and malleable thermoset31.
8
1.4 Ionic polymeric materials
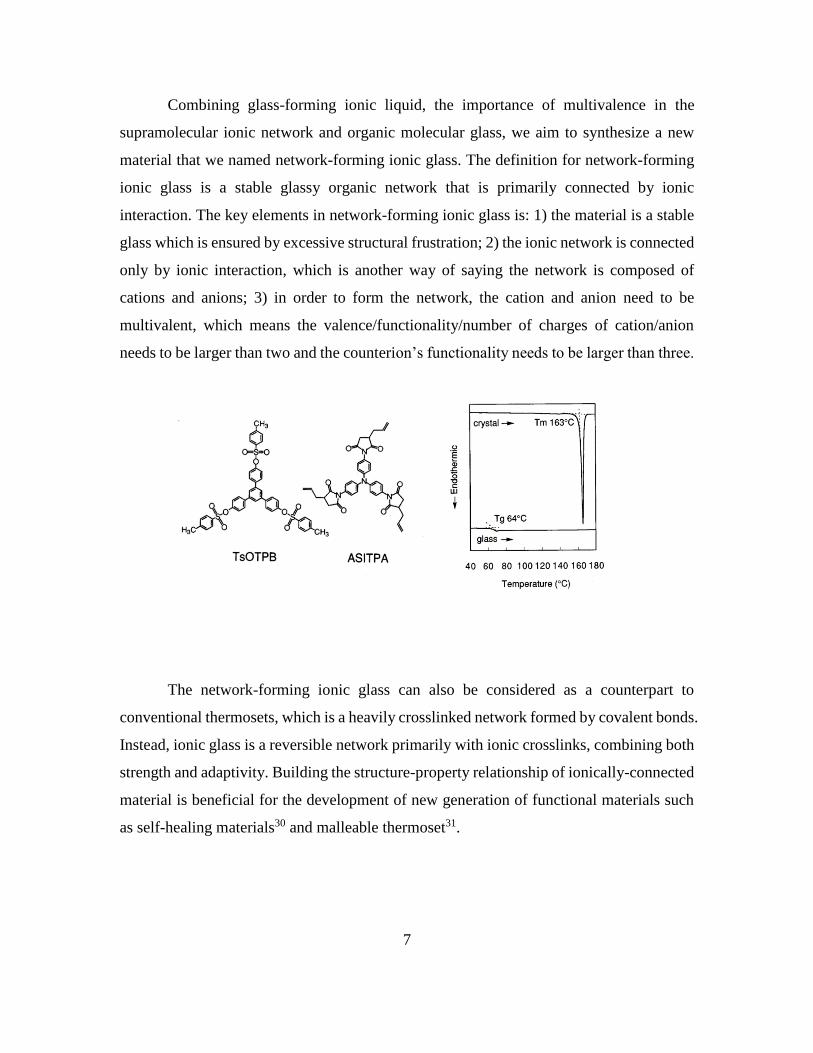
As mentioned earlier in section 1.2, nature has attributed a critical role to ionic
interaction in living systems mostly in the form of ionic biopolymers. Ionic polymer is the
artificial version of these ionic biopolymers. Depending on the actual classification, ionic
polymeric materials have different percentages of the ionic moiety. For example, ionenes
are polymers with ionic repeating units in the backbone. Polyelectrolytes usually refer to
polymers where the ionic groups are covalently bonded to the polymer backbone and the
ionic groups’ mole substation level is usually larger than 80% (high ionic content). While
ionomers refer to the similar polymers with ionic pendant groups with less than 15 mole
percent of ionic content. Ionic polymers can also be categorized based on the type of
charges they carry. (Figure 1.5)32
The effect of ions on the structure-morphology-property relations is one of the most
significant and well-studied aspects of ionic polymers. There are several models that
describe morphology of ionomers. One of the most popular model, the so-called Eisenberg-
Hird-Moore (EHM) model is based on ionic aggregate. Basically, there are primary ionic
aggregates that are consist of several ion pairs in ionic polymers. The size of the aggregate
is affected by the dielectric constant of the polymer backbone. The chain mobility is
constrained by the ionic aggregates.33
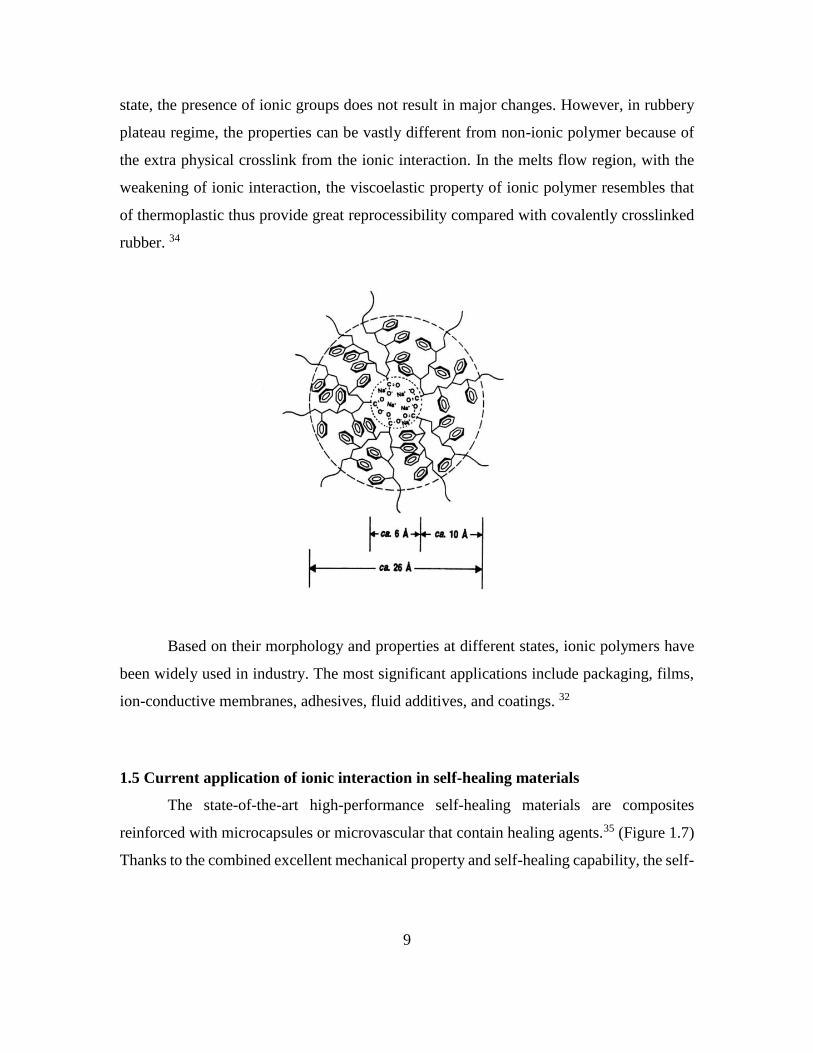
For ionic polymers, the existence of ionic moiety strongly affects the properties of
the polymers. The effect of ionic interaction is quite different depending on the states of
the materials. With respect to the viscoelastic properties of ionic polymers in their glassy
9
state, the presence of ionic groups does not result in major changes. However, in rubbery
plateau regime, the properties can be vastly different from non-ionic polymer because of
the extra physical crosslink from the ionic interaction. In the melts flow region, with the
weakening of ionic interaction, the viscoelastic property of ionic polymer resembles that
of thermoplastic thus provide great reprocessibility compared with covalently crosslinked
rubber. 34
Based on their morphology and properties at different states, ionic polymers have
been widely used in industry. The most significant applications include packaging, films,
ion-conductive membranes, adhesives, fluid additives, and coatings. 32
1.5 Current application of ionic interaction in self-healing materials
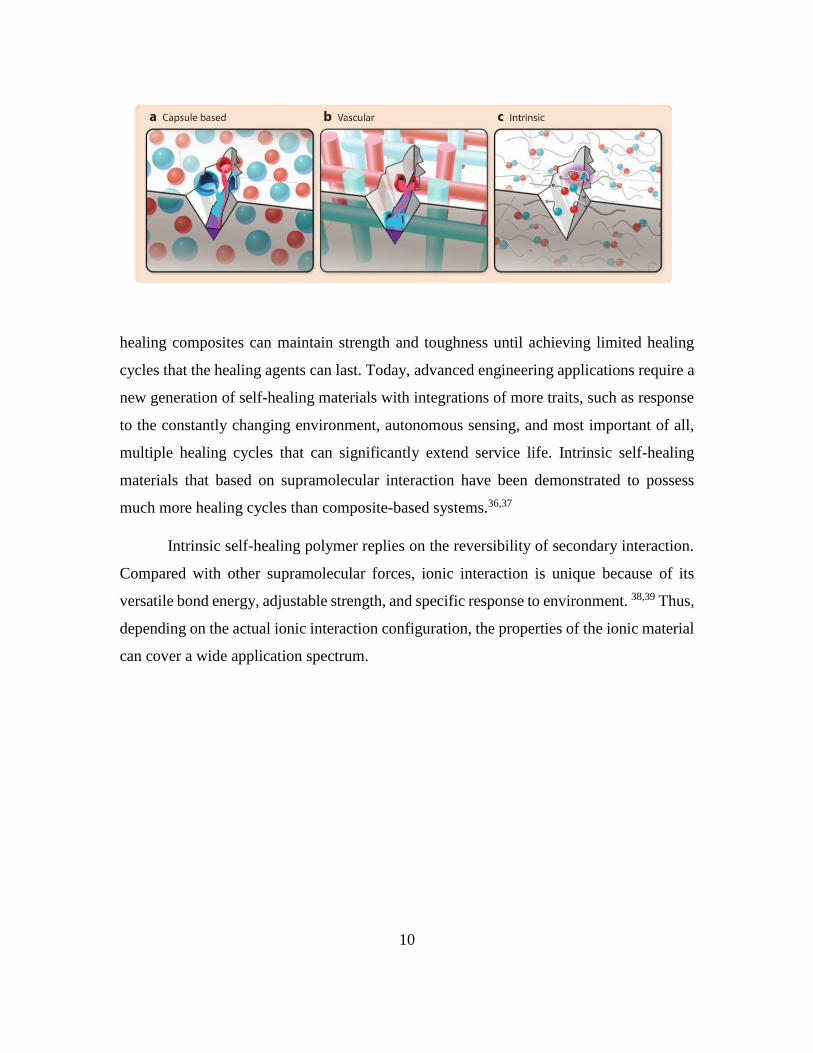
The state-of-the-art high-performance self-healing materials are composites
reinforced with microcapsules or microvascular that contain healing agents.35 (Figure 1.7)
Thanks to the combined excellent mechanical property and self-healing capability, the self-
10
healing composites can maintain strength and toughness until achieving limited healing
cycles that the healing agents can last. Today, advanced engineering applications require a
new generation of self-healing materials with integrations of more traits, such as response
to the constantly changing environment, autonomous sensing, and most important of all,
multiple healing cycles that can significantly extend service life. Intrinsic self-healing
materials that based on supramolecular interaction have been demonstrated to possess
much more healing cycles than composite-based systems.36,37
Intrinsic self-healing polymer replies on the reversibility of secondary interaction.
Compared with other supramolecular forces, ionic interaction is unique because of its
versatile bond energy, adjustable strength, and specific response to environment. 38,39 Thus,
depending on the actual ionic interaction configuration, the properties of the ionic material
can cover a wide application spectrum.
11
Compared to H-bond based supramolecular self-healing polymer, the exposure of
ionic interactions in literature isn’t quite as high.40 Nevertheless, there are still some
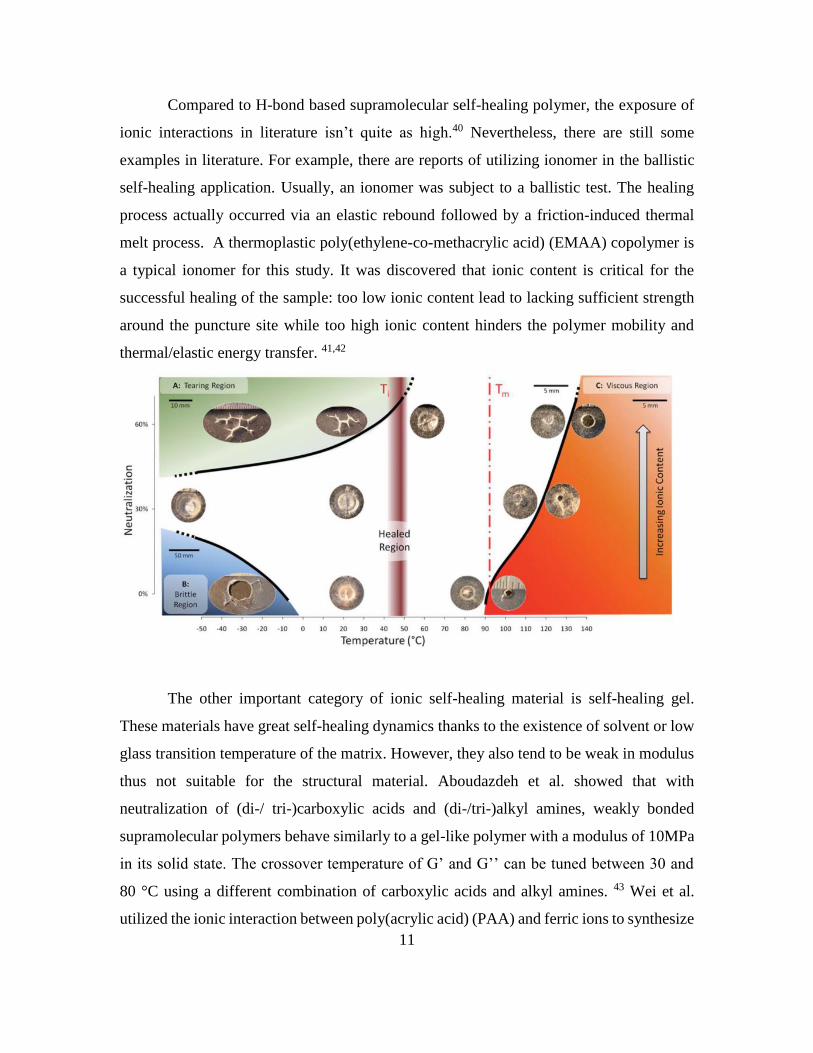
examples in literature. For example, there are reports of utilizing ionomer in the ballistic
self-healing application. Usually, an ionomer was subject to a ballistic test. The healing
process actually occurred via an elastic rebound followed by a friction-induced thermal
melt process. A thermoplastic poly(ethylene-co-methacrylic acid) (EMAA) copolymer is
a typical ionomer for this study. It was discovered that ionic content is critical for the
successful healing of the sample: too low ionic content lead to lacking sufficient strength
around the puncture site while too high ionic content hinders the polymer mobility and
thermal/elastic energy transfer. 41,42
The other important category of ionic self-healing material is self-healing gel.
These materials have great self-healing dynamics thanks to the existence of solvent or low
glass transition temperature of the matrix. However, they also tend to be weak in modulus
thus not suitable for the structural material. Aboudazdeh et al. showed that with
neutralization of (di-/ tri-)carboxylic acids and (di-/tri-)alkyl amines, weakly bonded
supramolecular polymers behave similarly to a gel-like polymer with a modulus of 10MPa
in its solid state. The crossover temperature of G’ and G’’ can be tuned between 30 and
80 °C using a different combination of carboxylic acids and alkyl amines. 43 Wei et al.
utilized the ionic interaction between poly(acrylic acid) (PAA) and ferric ions to synthesize

12
a self-healing ionic gel. The gel is pretty weak in modulus (10kPa) but has fast dynamics
to self-heal at room temperature. 44 To overcome the weakness of poor mechanical property,
attempts have been made by making tough double network hydrogels with ionic interaction.
Henderson et al. shown that by ionically crosslinking PMMA backbone with solvated
PMAA midblock as ending groups with divalent acetates (Zn, Ca, Ni, Co, Cu), the
consequence mechanical property has been improved to up to 21 MPa.45 Generally
speaking, gel-like materials indicate weak mechanical properties, which greatly limited the
practical application of this class of materials.
In view of the above discussion, the self-healing via ionic interaction relies either
on the elevated temperature (in the case of ionomer ballistic test) or on the existence of
extra solvents (in the case of ionic gels). Apparently, the efficient self-healing at ambient
environments cannot be achieved without a reasonable fast chain dynamics. However, fast
dynamics at room temperature means lower Tg, which indicates the mechanical properties
will be affected. The current challenge in the ionic self-healing materials or even for other
intrinsic self-healing materials is to achieve self-healing at ambient conditions for the
polymeric network with high Tg or competitive mechanical performance.
1.6 References
(1) Pauling, L. The Nature of the Chemical Bond and the Structure of Molecules and
Crystals; Cornell University Press, 1960.
(2) Morokuma, K. Acc. Chem. Res. 1977, 10, 294.
(3) Xu, D.; Tsai, C. J.; Nussinov, R. Protein Eng. 1997, 10, 999–1012.
(4) Yang, X.; Kim, J.-C. Int. J. Pharm. 2010, 388, 58–63.
(5) Kapustinskii, A. F. Q. Rev. Chem. Soc. 1956, 10, 283–294.
(6) Fernandes, A. M.; Rocha, M. A. A.; Freire, M. G.; Marrucho, I. M.; Coutinho, J. A.
P.; Santos, L. M. N. B. F. J. Phys. Chem. B 2011, 115, 4033–4041.
(7) Wathier, M.; Grinstaff, M. W. J. Am. Chem. Soc. 2008, 130, 9648–9649.
13
(8) Fantner, G. E.; Hassenkam, T.; Kindt, J. H.; Weaver, J. C.; Birkedal, H.; Pechenik,
L.; Cutroni, J. A.; Cidade, G. a G.; Stucky, G. D.; Morse, D. E.; Hansma, P. K. Nat.
Mater. 2005, 4, 612–616.
(9) Hendsch, Z. S.; Tidor, B. Protein Sci. 1994, 3, 211–226.
(10) Fantner, G. E.; Hassenkam, T.; Kindt, J. H.; Weaver, J. C.; Birkedal, H.; Pechenik,
L.; Cutroni, J. A.; Cidade, G. A. G.; Stucky, G. D.; Morse, D. E.; Hansma, P. K. Nat.
Mater. 2005, 4, 612–616.
(11) Hansma, P. K.; Fantner, G. E.; Kindt, J. H.; Thurner, P. J.; Schitter, G.; Turner, P.
J.; Udwin, S. F.; Finch, M. M. J. Musculoskelet. Neuronal Interact. 2005, 5, 313–
315.
(12) Leys, J.; Wübbenhorst, M.; Preethy Menon, C.; Rajesh, R.; Thoen, J.; Glorieux, C.;
Nockemann, P.; Thijs, B.; Binnemans, K.; Longuemart, S. J. Chem. Phys. 2008, 128,
064509.
(13) Hallett, J. P.; Welton, T. Chem. Rev. 2011, 111, 3508–3576.
(14) Ohno, H. Bull. Chem. Soc. Jpn. 2006, 79, 1665–1680.
(15) Ramos, J. J. M.; Afonso, C. A. M.; Branco, L. C. J. Therm. Anal. Calorim. 2003, 71,
659–666.
(16) Shamim, N.; McKenna, G. B. J. Phys. Chem. B 2010, 114, 15742–15752.
(17) Angell, C. A. Proc. Natl. Acad. Sci. U. S. A. 1995, 92, 6675–6682.
(18) Chhotaray, P. K.; Gardas, R. L. J. Chem. Thermodyn. 2014, 72, 117–124.
(19) Kadoya, S.; Izutsu, K.; Yonemochi, E.; Terada, K.; Yomota, C.; Kawanishi, T.
Chem. Pharm. Bull. (Tokyo). 2008, 56, 821–826.
(20) Greaves, T. L.; Drummond, C. J. Chem. Rev. 2008, 108, 206–237.
(21) Domańska, U. Thermochim. Acta 2006, 448, 19–30.
(22) Martinez, L. M.; Angell, C. A. Nature 2001, 410, 663–667.
14
(23) Zhang, Y.; Zhang, S.; Lu, X.; Zhou, Q.; Fan, W.; Zhang, X. Chemistry 2009, 15,
3003–3011.
(24) Daguenet, C.; Dyson, P. J.; Krossing, I.; Oleinikova, A.; Slattery, J.; Wakai, C.;
Weingärtner, H. J. Phys. Chem. B 2006, 110, 12682–12688.
(25) Zhou, Z.-B.; Matsumoto, H.; Tatsumi, K. Chemistry 2005, 11, 752–766.
(26) Aboudzadeh, M. A.; Muñoz, M. E.; Santamaría, A.; Fernández-Berridi, M. J.; Irusta,
L.; Mecerreyes, D. Macromolecules 2012, 45, 7599–7606.
(27) Imanari, M.; Fujii, K.; Endo, T.; Seki, H.; Tozaki, K.; Nishikawa, K. J. Phys. Chem.
B 2012, 116, 3991–3997.
(28) Shirota, Y.; Kageyama, H. Chem. Rev. 2007, 107, 953–1010.
(29) Yoshiiwa, M.; Kageyama, H.; Shirota, Y.; Wakaya, F.; Gamo, K.; Takai, M. Appl.
Phys. Lett. 1996, 69, 2605.
(30) Varley, R. In Self Healing Materials; Sybrand van der Zwaag, Ed.; Springer
Netherlands, 2008; pp. 95–114.
(31) Montarnal, D.; Capelot, M.; Tournilhac, F.; Leibler, L. Science 2011, 334, 965–968.
(32) Schlick, S. Ionomers: Charaterization, Theory, and Applications; CRC Press, 1996.
(33) Eisenberg, A.; Hird, B.; Moore, R. B. Macromolecules 1990, 23, 4098–4107.
(34) Tant, M. R.; Wilkes, G. L. J. Macromol. Sci., Rev. Macromol. Chem. Phys. 1988,
C28, 1–63.
(35) Blaiszik, B. J.; Kramer, S. L. B.; Olugebefola, S. C.; Moore, J. S.; Sottos, N. R.;
White, S. R. Annu. Rev. Mater. Res. 2010, 40, 179–211.
(36) Cordier, P.; Tournilhac, F.; Soulié-Ziakovic, C.; Leibler, L. Nature 2008, 451, 977–
980.
(37) Hentschel, J.; Kushner, A. M.; Ziller, J.; Guan, Z. Angew. Chem. Int. Ed. Engl. 2012,
51, 10561–10565.
15
(38) Yang, Y.; Urban, M. W. Chem. Soc. Rev. 2013, 42, 7446–7467.
(39) Craig, S. L. Angew. Chem. Int. Ed. Engl. 2009, 48, 2645–2647.
(40) Syrett, J. A.; Becer, C. R.; Haddleton, D. M. Polym. Chem. 2010, 1, 978–987.
(41) Varley, R. In Self Healing Materials. An Alternative Approach to 20 Centuries of
Materials Science; Springer, 2007; pp. 95–114.
(42) Kalista, S. J.; Pflug, J. R.; Varley, R. J. Polym. Chem. 2013, 4, 4910-4926.
(43) Aboudzadeh, M. A.; Muñoz, M. E.; Santamaría, A.; Marcilla, R.; Mecerreyes, D.
Macromol. Rapid Commun. 2012, 33, 314–318.
(44) Wei, Z.; He, J.; Liang, T.; Oh, H.; Athas, J.; Tong, Z.; Wang, C.; Nie, Z. Polym.
Chem. 2013, 4, 4601-4605.
(45) Henderson, K. J.; Zhou, T. C.; Otim, K. J.; Shull, K. R. Macromolecules 2010, 43,
6193–6201.
16
CHAPTER 2
SYNTHESIS AND STRUCTURE-PROPERTY RELATIONSHIP OF
NETWORK-FORMING IONIC GLASS
2.1 Abstract
The structure-property relationship for ionic glass is critical for rational design and
preparation of functional ionic materials. Combing the two aspects of molecular glass and
ionic liquids, we intend to build a stable molecular glassy network primarily connected by
ionic interaction. A major advantage of ionic networks from small organic molecules is the
possibility to fine-tune the macroscopic properties, such as the glass transition temperature
and even the fragility, by modifying the chain lengths and molecular architecture of the
building blocks. While empirical observations of the dependence of macroscopic
properties on the discrete molecular structure exist for certain ionic molecular supercooled
liquids and glasses, the general structure-function and the dynamics-function dualities
remain unexplored. The molecular packing structure and dynamics of the random
interconnected network are not known, because of the reasons stated previously. By
synthesizing a series of same class ionic glass, we studied the role of minor structural
variation in the determination of ionic glasses’ microstructure, glass transition temperature,
and mechanical properties.
2.2 Introduction
Compared with secondary bonds (H-bonding, π-π stacking etc.), the advantage of
ionic interaction includes, 1) high tunability over interaction strength only by minor
structure modification; 2) isotropic connection. As a counterpart to crosslinked network
formed by covalent bonds, it would be worthwhile to build a reversible network primarily
with ionic interaction. For this desired network which we name Crosslinking Ionic Network
(CIN), building the structure-property relationship is beneficial for the development of new
class of functional materials such as self-healing materials and malleable thermoset. In
17
addition to the potential materials application, the glasses formed primarily by ionic
interaction, which we named Network-forming Ionic Glass, is rather an extension of ionic
liquids into its glass regime. They are of great fundamental scientific interests, possessing
the potential to solve some long standing questions about glass transition and fragility.1–3
In order to build the desired ionic glass, we drew on the experience of structure
design principles from organic molecular glass. Organic molecular glass or amorphous
molecular materials is a class of organic molecules which do not crystallize readily upon
cooling.4 These materials have been widely explored previously for various application
including electrically conducting materials, resists and OLEDs.5–8 They are readily
prepared from melt sample or solution by either rapid cooling or air standing cooling. The
stability of these molecular glasses depends on the designed structure. Some molecular
glasses tend to crystallize on heating above Tg, with polymorphism. However, if structural
frustration is large enough, it is very easy to enter the thermodynamic non-equilibrium state,
and can avoid crystallization for usual processing condition even above Tg. There are
several structure design principles for organic molecular glass to avoid crystallization
including nonpolar molecules structures, and existence of different conformers.4 It has been
shown that the incorporation of aryl substituents into TDAB allows the formation of
amorphous glasses. The reason why alkyl chain could promote glass-forming capability is
that the flexibility of alkyl chain increase the possibilities of different conformers. This
effect can be dramatically enlarged by employing longer alkyl chains. 9–11
On the other hand, ionic liquids as a “molten salts”, has been studied intensively
over two decades. Conventionally ionic liquids (or technically room temperature ionic
liquids) are organic salts with a melting temperature below 100 °C by definition. It was
found later that some classes of ionic liquids are glass formers as well.12,13 Many ionic
liquids easily form a glass with DSC curve showing a clear signature of glass transition.14–
16 Generally speaking, ionic liquids’ crystallization is hindered. So it is not uncommon that
ionic liquid can exhibit glass transition together with other phase transition such as cold
recrystallization and fusion.17 However, glass forming ionic liquids often have relatively
low glass transition temperature (commonly below 200K), which limits the application of

18
these materials in solid state. The low Tg of ionic liquids is due to weak cohesive energy,
which is determined by the balance of attractive (electrostatic force) and repulsive (Pauli
repulsions of outer shell electrons) contributions to the cation and anion potential. Another
reason for low Tg of ionic liquids is actually due to focus of application. A lot of efforts
have been devoted to lower the glass transition temperature. That is because lower viscosity
is more appreciated in the application of IL as solvents.
Combining the “frustration of crystallization” architecture design principles in
organic molecular glass area and various selections of ionic pairs in ionic liquids area, we
built series of ionic glasses with systematically varying structure. In our study, in order to
increase the density of ionic crosslink, we used small diammonium cations and citrate
anions to address both the formation of network and degree of crosslink. A major advantage
of building network using small organic molecules is the possibility to fine-tune the
macroscopic properties by tailoring the chain lengths and molecular architecture of the
building blocks. Herein we show an example of establishing the structure-property
relationship by simply changing the length in either side chain or backbone of ionic glass’s
building block.
2.3 Structure-property relationship of di-ammonium ionic glass
2.3.1 Microstructure analysis and frustrate crystallization in di-ammonium ionic
glass
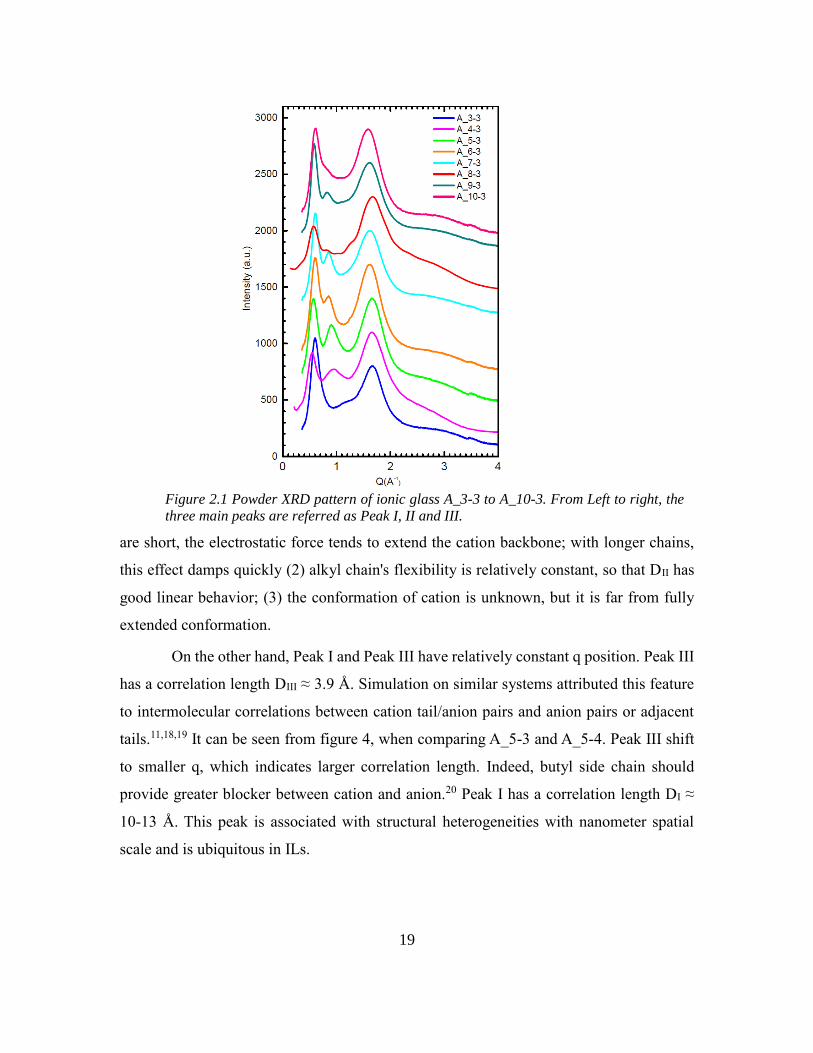
Peak assignments is given to the main three peaks that are shown in Figure 2.1.
Peak II and III are related to first-neighbor interactions or to intramolecular correlations.
Specifically, peak II has amplitude that is smaller compared with Peak I and Peak III. Peak
II shift from higher q to lower q with longer backbone chain length. In order to estimate
the spatial correlation length D, which corresponds to the size of structural heterogeneities
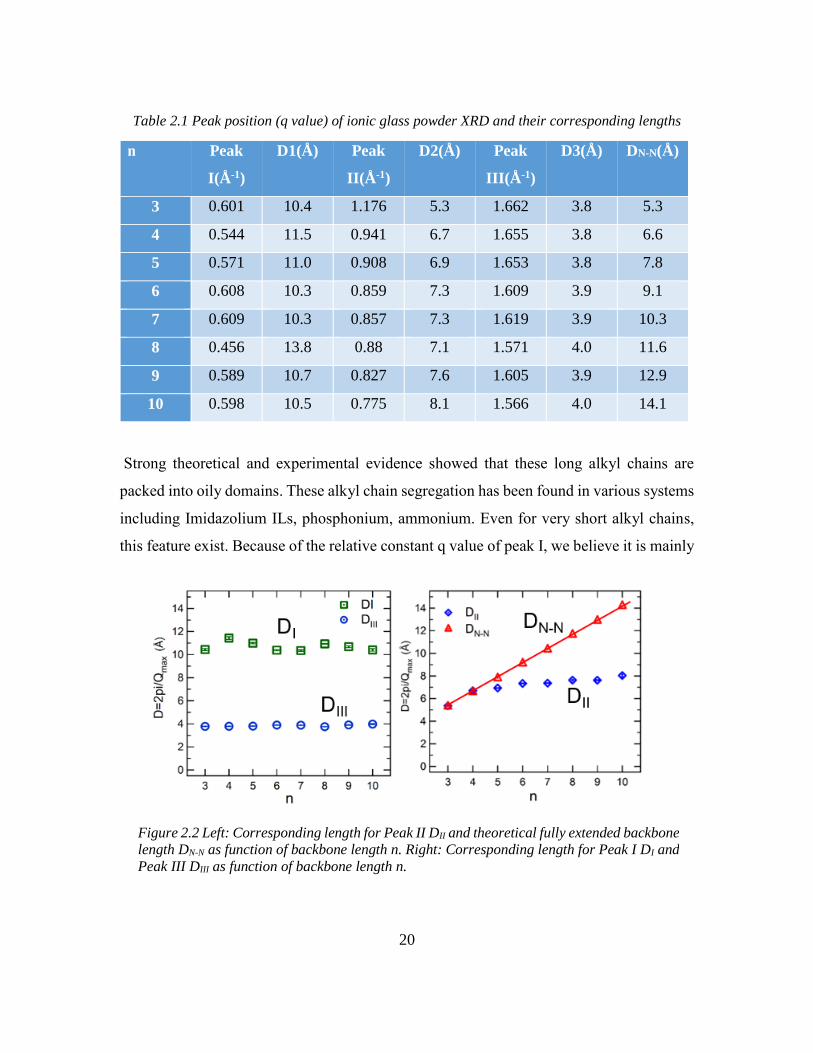
from peak positions, we use D=2π/Qmax as approximation. DII varies linearly with
backbone alkyl chain length. For n=3, the DII is in accordance with fully extended
intramolecular N-N distance in cation. However, with longer backbone chain length, the
two linear fitting line deviate with either other. 1) when spacer between positive charges
19
are short, the electrostatic force tends to extend the cation backbone; with longer chains,
this effect damps quickly (2) alkyl chain's flexibility is relatively constant, so that DII has
good linear behavior; (3) the conformation of cation is unknown, but it is far from fully
extended conformation.
On the other hand, Peak I and Peak III have relatively constant q position. Peak III
has a correlation length DIII ≈ 3.9 Å. Simulation on similar systems attributed this feature
to intermolecular correlations between cation tail/anion pairs and anion pairs or adjacent
tails.11,18,19 It can be seen from figure 4, when comparing A_5-3 and A_5-4. Peak III shift
to smaller q, which indicates larger correlation length. Indeed, butyl side chain should
provide greater blocker between cation and anion.20 Peak I has a correlation length DI ≈
10-13 Å. This peak is associated with structural heterogeneities with nanometer spatial
scale and is ubiquitous in ILs.
Figure 2.1 Powder XRD pattern of ionic glass A_3-3 to A_10-3. From Left to right, the
three main peaks are referred as Peak I, II and III.
20
Table 2.1 Peak position (q value) of ionic glass powder XRD and their corresponding lengths
Strong theoretical and experimental evidence showed that these long alkyl chains are
packed into oily domains. These alkyl chain segregation has been found in various systems
including Imidazolium ILs, phosphonium, ammonium. Even for very short alkyl chains,
this feature exist. Because of the relative constant q value of peak I, we believe it is mainly
n Peak
I(Å-1)
D1(Å) Peak
II(Å-1)
D2(Å) Peak
III(Å-1)
D3(Å) DN-N(Å)
3 0.601 10.4 1.176 5.3 1.662 3.8 5.3
4 0.544 11.5 0.941 6.7 1.655 3.8 6.6
5 0.571 11.0 0.908 6.9 1.653 3.8 7.8
6 0.608 10.3 0.859 7.3 1.609 3.9 9.1
7 0.609 10.3 0.857 7.3 1.619 3.9 10.3
8 0.456 13.8 0.88 7.1 1.571 4.0 11.6
9 0.589 10.7 0.827 7.6 1.605 3.9 12.9
10 0.598 10.5 0.775 8.1 1.566 4.0 14.1
Figure 2.2 Left: Corresponding length for Peak II DII and theoretical fully extended backbone
length DN-N as function of backbone length n. Right: Corresponding length for Peak I DI and
Peak III DIII as function of backbone length n.
21
contributed by side chains of the ionic glass. Another evidence is that A_5-4 again has a
quite noticeable change.
Backbone chains are greatly affected by charged polar head. Unlike side chains
with one free tail, both ends of backbone alkyl chain are connected to charged polar head,
intermolecular “packing” of these alkyl chains are greatly inhibited. As a consequence, for
short backbones, because of strong electrostatic repulsion, alkyl chain is fully extended.
For longer backbones, the electrostatic repulsion solvophobically repel alkyl backbone into
a high degree of curvature.
Backbone in cations affects glass transition temperature greatly. Previously, an odd-
even effect of glass transition temperature as a function of backbone chain length has been
reported by out group. It is very intriguing that, without periodic packing, how the
difference between odd-number and even-number cations is manifested into alternation of
macroscopic property. It has been argued that the structural heterogeneity may cause
dynamic heterogeneity in ionic liquids. It is currently under investigation whether the glass
transition temperature difference between odd-number and even-number ionic glass is
caused by either heterogeneity.
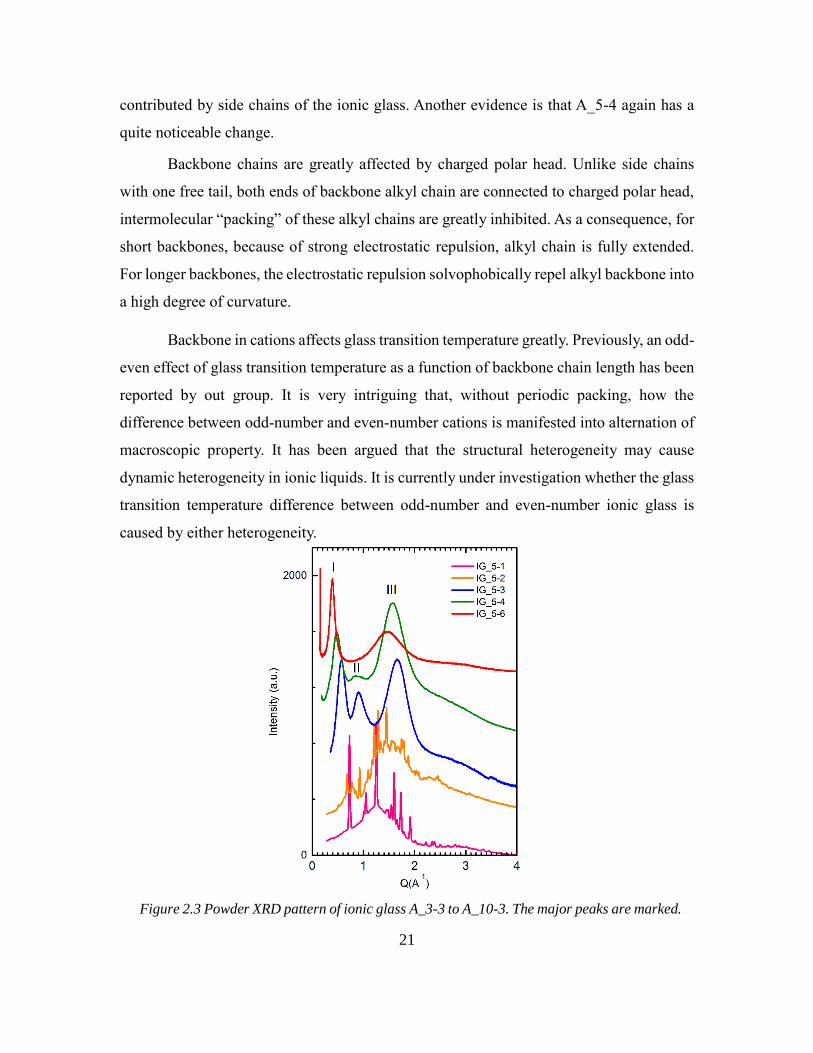
Figure 2.3 Powder XRD pattern of ionic glass A_3-3 to A_10-3. The major peaks are marked.
22
One big advantage of ionic glass is the tunability of ionic interaction strength.
Given the certain type of ionic interaction (same charge distribution and size), the strength
depends on the distance between cation and anion. We are able to tune the strength of ionic
interaction easily by extending or shortening the steric hindrance between charges. In the
simplest case, we can easily tune ionic glass's crystallinity by adjusting the side chain
length. As shown in figure 2.4, the ionic materials consist of diammonium cation and citrate
anion. When varying the side chain length from methyl to butyl, the crystallinity decreases
till fully amorphous phase. In the case of diammonium cation, propyl side chain is enough
to frustrate all crystallization.
From XRD results, we've shown Peak I and Peak III are mainly correlated with side
chains. Peak I is a common feature in ionic liquids. In various system, structural
heterogeneity exists over domains of around 1 nm. This nanostructure is the result of
nanoscale phase separation between charged polar heads and uncharged alkyl chains. These
polar and nonpolar domains percolate through the liquid phase and form sponge-like
structure. The position of Peak I is strongly affected by side chain length as can be seen in
Figure 2.4. Comparing A 5-4 with A 5-3, longer side chains result in considerable shift of
Peak I position towards lower q, indicating larger nanoscale structure. To our surprise, Peak
I position is independent of backbone length. This means in the diammonium ionic glass
system, the nanoscale “oily” domains are mainly constructed by the alkyl side chains other
than alkyl backbone.
As mentioned previously, the alkyl side chains around N atom is designed to
introduce frustration into the molecule structure. Because of the great flexibility of alkyl
chain, great number of conformers with similar conformational energy is possible. When
the cations and anions are packed, numerous choices of packing result in frustration of
crystallization. There are two aspects that longer side chains can promote glass-forming
capability. Firstly, with longer alkyl chain, there are much more potential conformers,
which means these structure frustration is more populated in the system. Second, strong
intermolecular interaction promote local crystallization because it results in more aligned
packing and reduces the number of conformers. Side chains adjust ionic interaction
23
strength, which controls distance between charge center in cation (in this case, N atom) and
anion (O atom). In this sense, when ionic interaction is weaker, materials are harder to
crystallize. This is also true in ionic liquids, where ionic liquids containing pyridinium or
imidazolium cations are better glass-formers because of delocalization of charge.
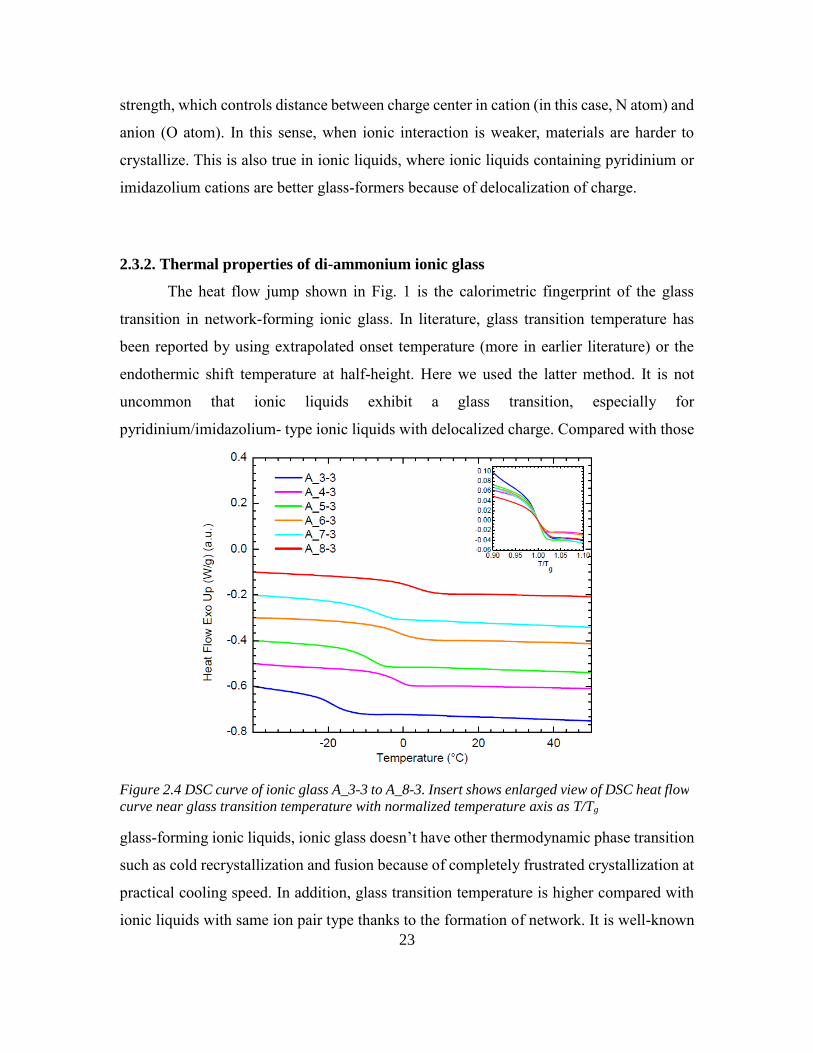
2.3.2. Thermal properties of di-ammonium ionic glass
The heat flow jump shown in Fig. 1 is the calorimetric fingerprint of the glass
transition in network-forming ionic glass. In literature, glass transition temperature has
been reported by using extrapolated onset temperature (more in earlier literature) or the
endothermic shift temperature at half-height. Here we used the latter method. It is not
uncommon that ionic liquids exhibit a glass transition, especially for
pyridinium/imidazolium- type ionic liquids with delocalized charge. Compared with those
glass-forming ionic liquids, ionic glass doesn’t have other thermodynamic phase transition
such as cold recrystallization and fusion because of completely frustrated crystallization at
practical cooling speed. In addition, glass transition temperature is higher compared with
ionic liquids with same ion pair type thanks to the formation of network. It is well-known
Figure 2.4 DSC curve of ionic glass A_3-3 to A_8-3. Insert shows enlarged view of DSC heat flow
curve near glass transition temperature with normalized temperature axis as T/Tg
24
that enthalpy relaxation is quite common in glass-forming materials depending on the
cooling process prior to heating. However, such overshoot peak in the heat capacity is
barely seen in ionic glass. This indicates at experimental cooling rate (10K/min), mobility
of molecules is low, structural relaxation is greatly limited in these network-forming ionic
glasses. This is due to the heavy crosslink density in the ionic network. Usually the glass
transition spans a range of 7-10 K determined by the extrapolated onset and end from DSC
curve.
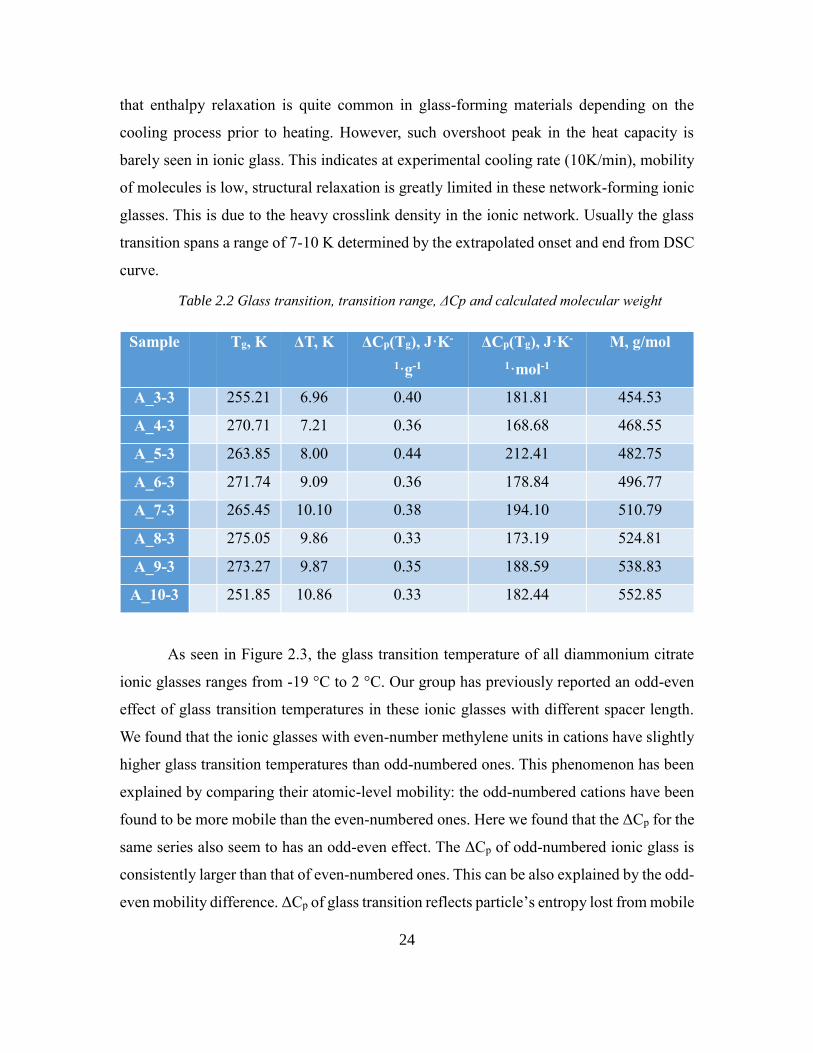
Table 2.2 Glass transition, transition range, ΔCp and calculated molecular weight
As seen in Figure 2.3, the glass transition temperature of all diammonium citrate
ionic glasses ranges from -19 °C to 2 °C. Our group has previously reported an odd-even
effect of glass transition temperatures in these ionic glasses with different spacer length.
We found that the ionic glasses with even-number methylene units in cations have slightly
higher glass transition temperatures than odd-numbered ones. This phenomenon has been
explained by comparing their atomic-level mobility: the odd-numbered cations have been
found to be more mobile than the even-numbered ones. Here we found that the ΔCp for the
same series also seem to has an odd-even effect. The ΔCp of odd-numbered ionic glass is
consistently larger than that of even-numbered ones. This can be also explained by the odd-
even mobility difference. ΔCp of glass transition reflects particle’s entropy lost from mobile
Sample Tg, K ΔT, K ΔCp(Tg), J·K-
1·g-1
ΔCp(Tg), J·K-
1·mol-1
M, g/mol
A_3-3 255.21 6.96 0.40 181.81 454.53
A_4-3 270.71 7.21 0.36 168.68 468.55
A_5-3 263.85 8.00 0.44 212.41 482.75
A_6-3 271.74 9.09 0.36 178.84 496.77
A_7-3 265.45 10.10 0.38 194.10 510.79
A_8-3 275.05 9.86 0.33 173.19 524.81
A_9-3 273.27 9.87 0.35 188.59 538.83
A_10-3 251.85 10.86 0.33 182.44 552.85
25
liquid state to frozen glassy state. The odd-numbered species with higher mobility will lose
more entropy during glass transition.
We also listed ΔCp with different units for easier comparison with other glass
forming systems. For ΔCp(Tg) with unit J·K-1·g-1, it is directly calculated by DSC heat flow
curve. The ΔCp(Tg), J·K-1·mol-1 is otherwise calculated by molecular weight of ionic
glasses. However, because in network-forming ionic glass, it is hard to define such a
molecular unit, we use [(diammonium cation)1 (citrate)2/3] as the unit for calculating
molecular weight and thus ΔCp(Tg), J·K-1·mol-1.
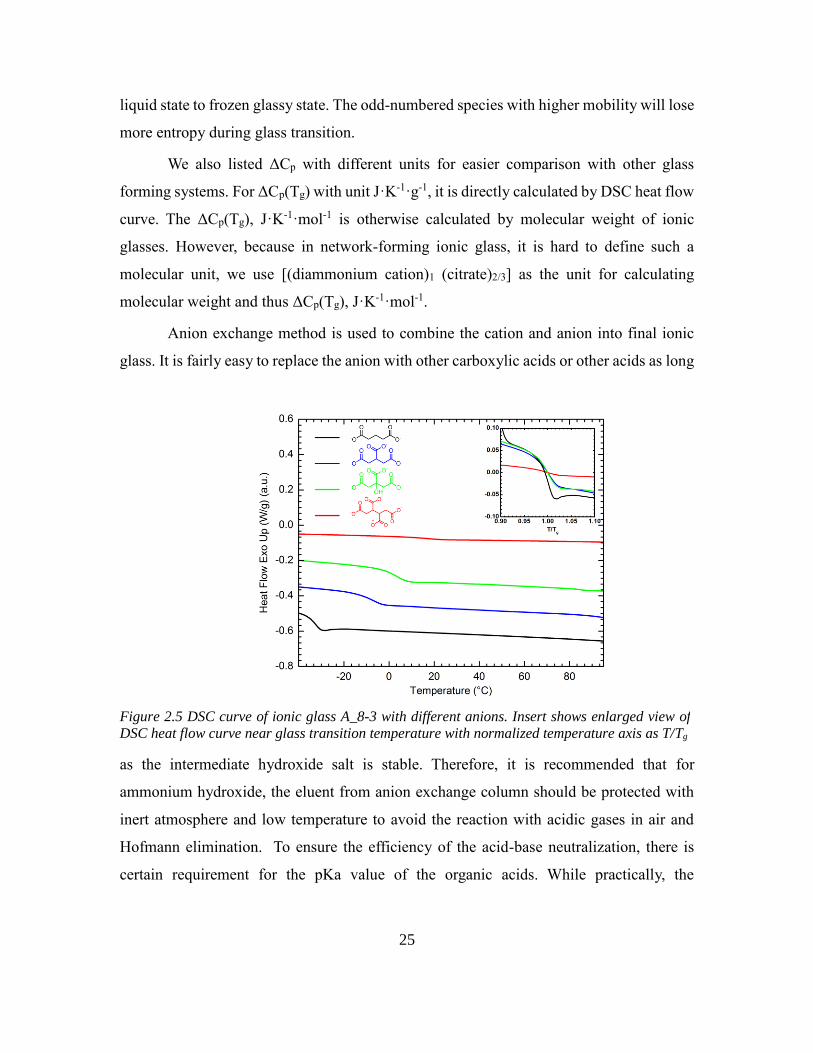
Anion exchange method is used to combine the cation and anion into final ionic
glass. It is fairly easy to replace the anion with other carboxylic acids or other acids as long
as the intermediate hydroxide salt is stable. Therefore, it is recommended that for
ammonium hydroxide, the eluent from anion exchange column should be protected with
inert atmosphere and low temperature to avoid the reaction with acidic gases in air and
Hofmann elimination. To ensure the efficiency of the acid-base neutralization, there is
certain requirement for the pKa value of the organic acids. While practically, the
Figure 2.5 DSC curve of ionic glass A_8-3 with different anions. Insert shows enlarged view of
DSC heat flow curve near glass transition temperature with normalized temperature axis as T/Tg
26
neutralization reaction happens in methanol with very small amount of water, most
carboxylic acids can react with ammonium hydroxide with almost 100% conversion rate.
One of the key features of ionic glass is the formation of network. Theoretically the
glass transition temperature of ionic glass should depends on both the strength of ionic
interaction and ionic crosslink density. To test whether the multivalency of anion has effect
on the glass transition temperature, we prepared series of ionic glass with same cation
(A_8-3) and different anions with same ion exchange method. The acids we tested have
similar backbone structure and different carboxylic acids number. From glutaric acid to
tricarballylic acid and 1,2,3,4-Butanetetracarboxylic acid, the carboxylic acid functional
group number increase from 2 to 4 per molecule. Because of the same ion pair type, the
ionic interaction strength in these ionic glasses is considered to be similar. The DSC trace
of these ionic glasses has been shown in Figure 6. Not surprisingly, the glass transition
temperature of ionic glasses increase with higher functionality of anion. In addition,
compared with tricarballylic acid, citric acid provides same functionality but additional
hydrogen bonding. This results in slightly higher Tg than ionic glass formed by
tricarballylic acid. Interestingly, the glass transition ΔCp decreases with increasing
functionality. The same trend has been observed before in thiol-ene system. The more rigid
network exhibit less enthalpy relaxation and smaller ΔCp. The crosslink density will control
the absorption of heat as temperature increases, i.e., the more flexible and lower crosslinked
networks will have the highest heat capacities. Same trend goes with enthalpy relaxation
which is mentioned previously. For glutaric acid anion, the enthalpy relaxation is present
in DSC trace; which with higher crosslink density, it is not seen.
2.3.3 Mechanical properties and viscosity of ionic glass
The rheological measurement was performed using TA Instruments AR-G2
Rheometer. The geometry used was 8mm aluminum plates and the testing method was
temperature sweep in oscillation mode. The frequency of dynamic loading was 1Hz and
the strain was 0.3%. During the testing procedure, the gap was controlled between 900-
27
1200μm with active axial force adjustment. Temperature control was made using active
cooling system and environmental test chamber.
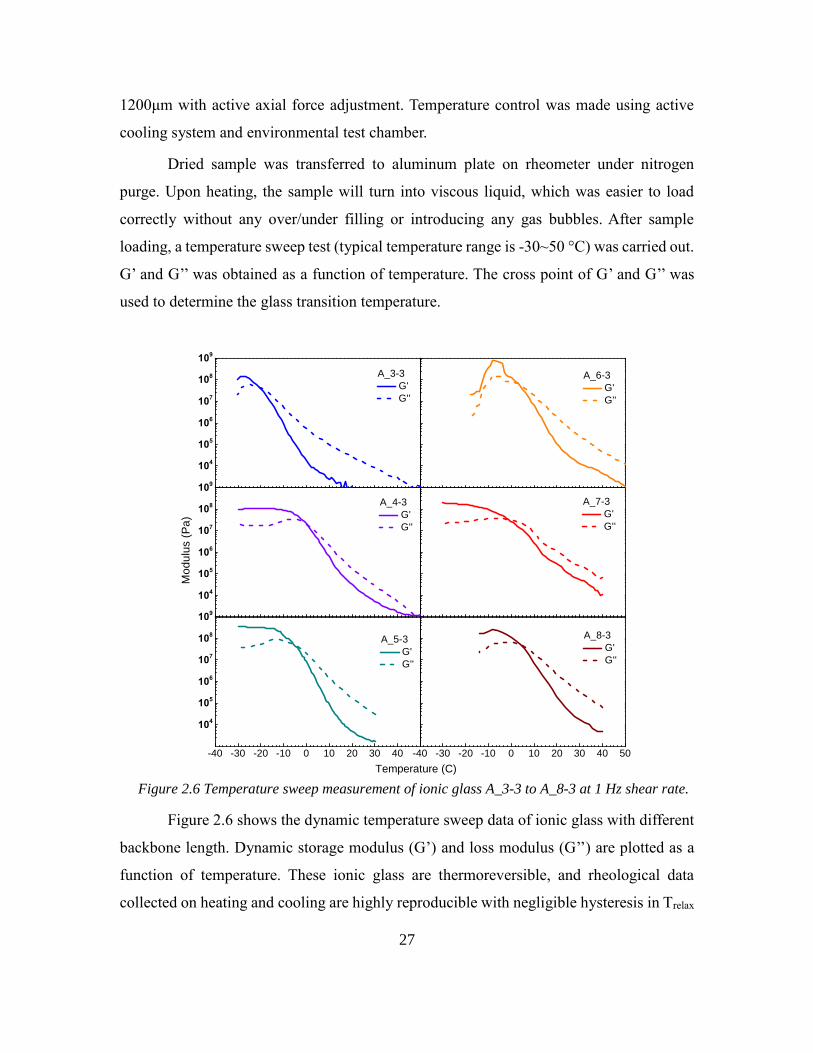
Dried sample was transferred to aluminum plate on rheometer under nitrogen
purge. Upon heating, the sample will turn into viscous liquid, which was easier to load
correctly without any over/under filling or introducing any gas bubbles. After sample
loading, a temperature sweep test (typical temperature range is -30~50 °C) was carried out.
G’ and G’’ was obtained as a function of temperature. The cross point of G’ and G’’ was
used to determine the glass transition temperature.
Figure 2.6 Temperature sweep measurement of ionic glass A_3-3 to A_8-3 at 1 Hz shear rate.
Figure 2.6 shows the dynamic temperature sweep data of ionic glass with different
backbone length. Dynamic storage modulus (G’) and loss modulus (G’’) are plotted as a
function of temperature. These ionic glass are thermoreversible, and rheological data
collected on heating and cooling are highly reproducible with negligible hysteresis in Trelax
104
105
106
107
108
109
104
105
106
107
108
109
-40 -30 -20 -10 0 10 20 30 40
104
105
106
107
108
109
-40 -30 -20 -10 0 10 20 30 40 50
A_3-3
G'
G''
A_4-3
G'
G''
A_5-3
G'
G''
A_6-3
G'
G''
A_7-3
G'
G''
A_8-3
G'
G''
Mo
du
lus (
Pa
)
Temperature (C)
28
(1-2 °C difference). These figures shows the dramatic change of ionic glasses’ viscoelastic
property over a certain temperature range. At low temperature, the materials’ rheological
response is highly elastic (or solid-like) with G’>G’’. The temperature-independent plateau
in G’ below certain temperature indicates well-defined ionic network at low temperature.
Common value for this plateau storage modulus is 0.2-0.4 GPa. For comparison, typical
molecular glasses and glass-forming ionic liquids have plateau modulus around 1 GPa.
Similar to above mentioned molecular glasses, because of lacking of entanglement, the
materials appear brittle.
At high temperature, the rheological response is predominantly viscous with
G’<G’’. The materials undergo a transition from viscous liquid-like behavior to elastic
solid-like behavior. In supramolecular materials area, the crossover temperature where
G’=G’’ has been used as convenient indicator for Tgel. Here, we also used this crossover
temperature as relaxation temperature. At this temperature, the ionic glass has a longest
relaxation time comparable to the time scale of experiment (τ ≈ ω-1 = 10 s). Compared with
Tg obtained from DSC measurement, Trelax is a little higher because glass transition
temperature is usually defined with τ ≈ 100 s.
It is worthwhile to point out that for supramolecular network, usually G’ (G’’) at
Tgel is low; for ionic glass, the modulus at Tgel is around 40 MPa, which is similar to the
rubbery plateau modulus of a rubber. This can be explained by lacking of chain
entanglement in ionic glass.
29
2.4 Structure-property relationship of di-imidazolium ionic glass
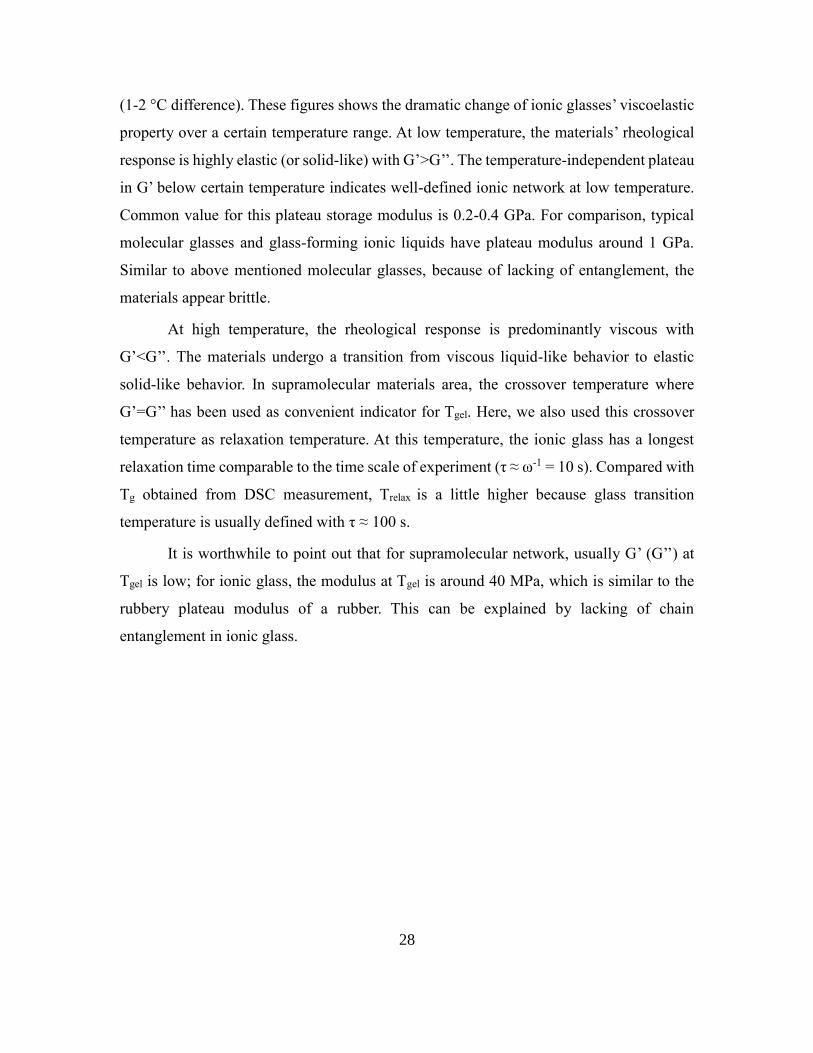
The transition glass
temperatures of the di-imidazole
complexes with citric acid do not
show an odd-even effect as in the di-
ammonia network. In contrast, the Tg
for the material are very similar near
253 K. The di-imidazole bromide
salt displayed increased
hydrophobicity by increasing the
time it takes to dissolve in methanol.
This phenomenon was observed
when dissolving the bromide salt for
the anion exchange column.
2.5 Experimental details
2.5.1. Materials and methods
All chemicals were purchased from Aldrich as highest purity grade and used
without further purification. All reactions were performed under nitrogen/argon
atmosphere. NMR spectra were recorded on Varian Unity 400 NB, Varian VXR 500 and
Varian Unity 500 NB spectrometer. High resolution electrospray mass spectra were
obtained on a Micromass Q-Tof Ultima. Elemental analysis was obtained from Exeter
Analytical CE 440 CHN Analyzer and PerkinElmer 2400 Series II CHN/O Elemental
Analyzer and Thermo Scientific Orin Ion Selective Electrodes.
DSC Measurement. The DSC measurement was performed using TA Instrument
Q20 Differential Scanning Calorimeter equipped with a Liquid Nitrogen Cooling System
(LNCS). Nitrogen was used as sample purge gas. Typical sample loading is 10-20 mg.
Typical DSC measurement procedure includes 4 cyclic scans. One cyclic scan includes one
heating and cooling process. The trace started from cooling from room temperature.
Figure 2.7 DSC curve of ionic glass Im_3-1 to Im_6-1
with citric acid as anion.
30
Temperature range for scan is -100~100 °C with heating/cooling rate 10°C/min. There was
a slight difference between the first scan and the latter three scans due to thermal history
of the sample. The latter three heating curves overlap with each other. The glass transition
temperatures were determined at the inflection point of the step from the last heating scan.
Rheometer Measurement. The rheological measurement was performed using
TA Instruments AR-G2 Rheometer. The geometry used was 8mm aluminum plates and the
testing method was temperature sweep in oscillation mode. The frequency of dynamic
loading was 1Hz and the strain was 0.3%. During the testing procedure, the gap was
controlled between 900-1200μm with active axial force adjustment. Temperature control
was made using active cooling system and environmental test chamber.
Dried sample was transferred to aluminum plate on rheometer under nitrogen purge.
Upon heating, the sample will turn into viscous liquid, which was easier to load correctly
without any over/under filling or introducing any gas bubbles. After sample loading, a
temperature sweep test (typical temperature range is -30~50 °C) was carried out. G’ and
G’’ was obtained as a function of temperature. We used the cross point of G’ and G’’ to
determine the glass transition temperature.
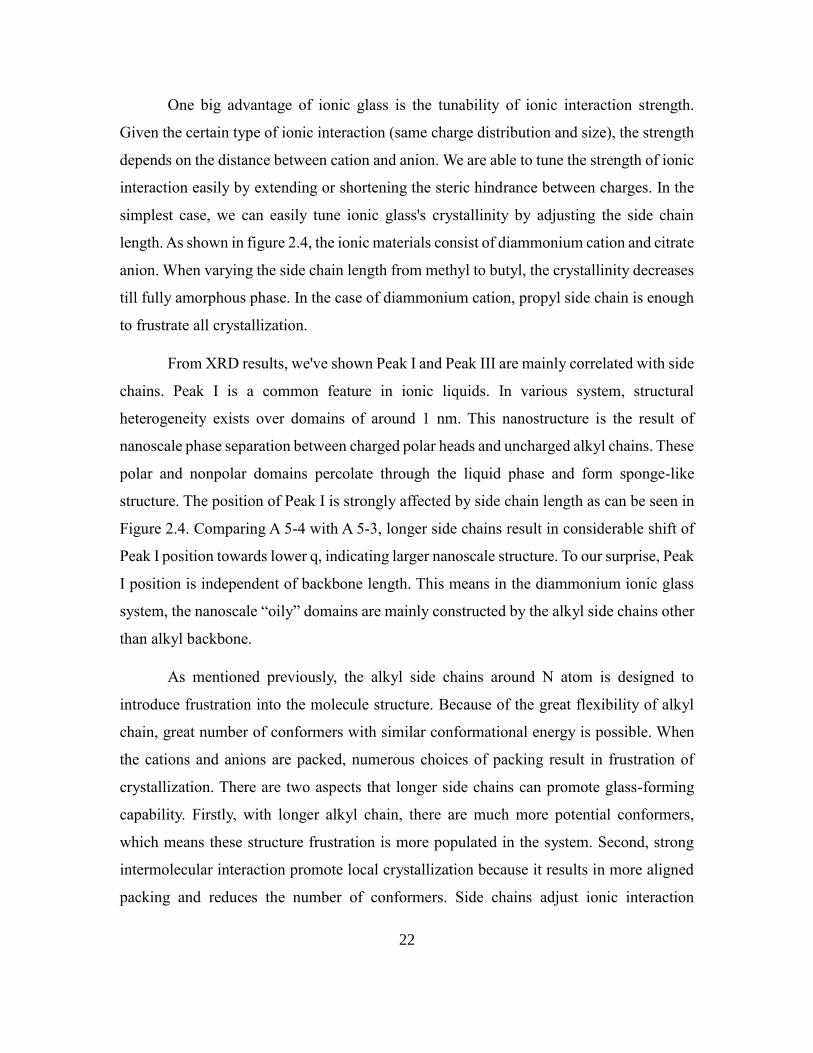
SWAXS Measurements. The wide angle X-ray diffraction was conducted for all
samples using Bruker General Area Detector Diffraction System (GADDS) and Rigaku
Miniflex 600 powder XRD. Powder diffraction was done at -10 °C and room temperature
(RT). For all ionic glasses, we did not observe any structure difference from the XRD
patterns at -10 °C and RT (above and below Tg). Figure 3 shows XRD of A_x-3 in 0-4 A-
1 Q range. All ionic glass in this series show four major diffraction features in this Q-range:
(i) a peak (I) at low Q (Qmax ≈ 0.6 Å-1 ) that is relatively unaffected by backbone length in
amplitude and peak position; (ii) a minor peak (II) at intermediate Q (Qmax ≈ 0.8-1.1 Å-1)
that is strongly affected by backbone length in peak position; (iii) a peak (III) at high Q
(Qmax ≈ 1.6 Å-1 ) that is relatively unaffected by backbone length in peak position; (iv) a
minor shoulder peak (IV) at higher Q (Qmax ≈ 2.8-3.0 Å-1 ) that appears as a bump in the
background.
31
2.5.2. Synthesis of diammonium ionic glass
General procedure
Di-bromoalkane (20mmol) and tri-alkylamine (80mmol) was loaded into a round-
bottom flask with nitrogen inlet and condenser, followed by adding 100mL appropriate
solvent. For 1,3-dibromopropane, 1,4-dibromobutane, 1,5-dibromopentane, 1,6-
dibromohexane, the solvent was ethanol, for 1,7-dibromoheptane, 1,8-dibromooctane, 1,9-
dibromononane, the solvent was isopropanol or acetonitrile. For higher di-bromoalkane the
solvent was methyl isobutyl ketone. The reactions were carried out under nitrogen
atmosphere and at reflux temperature for 48-96 hours. For 1,3-dibromopropane, 1,4-
dibromobutane, 1,5-dibromopentane, 1,6-dibromohexane, 1,7-dibromoheptane, 1,8-
dibromooctane, 1,9-dibromononane reaction, the diammonium bromide salt was obtained
by recrystallization using ethanol-ethyl acetate. For higher di-bromoalkane, the product
was obtained by extraction using water-ethyl ether for multiple times followed by
recrystallization in ethanol-ethyl acetate at -20 °C.
N1,N1,N1,N3,N3,N3-hexapropylpropane-1,3-diaminium bromide
A white crystal was obtained after recrystallization in 95% yield. 1H NMR (DMSO): δ 0.90
(t, 18, CH3); 1.50-1.72 (br, 12, CH2); 1.94-2.09 (br, 2, CH2); 3.18-3.35 (br, 16, CH2-N). 13C
NMR (DMSO): δ 10.50 (CH3); 14.89, 15.50 (CH2); 54.34 (CH2-N); 59.44 (CH2-N). ESI
MS: 164.2. Elemental analysis: (theory: C, 51.64%; H, 9.91%; N, 5.74%) Found: C,
51.49%, H, 9.72%, N, 5.36%.
32
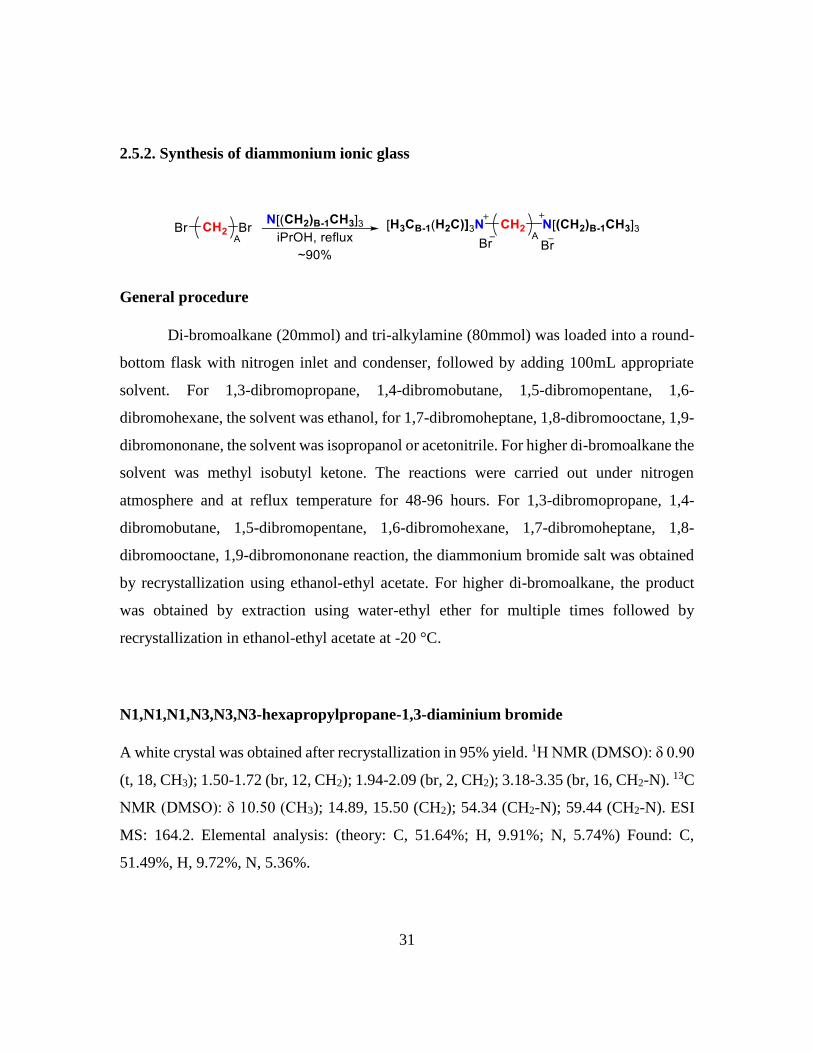
Figure 2.8 1H NMR spectrum of IG 3-3 diaminium bromide salts.
N1,N1,N1,N4,N4,N4-hexapropylbutane-1,4-diaminium bromide
A white crystal was obtained after recrystallization in 92% yield. 1H NMR (DMSO): δ 0.91
(t, 18, CH3); 1.57-1.70 (br, 16, CH2); 3.10-3.27 (br, 16, CH2-N). 13C NMR (DMSO): δ
10.58 (CH3); 14.81, 18.44 (CH2); 57.22 (CH2-N); 59.42 (CH2-N). ESI MS: 171.2.
Elemental analysis: (theory: C, 52.59%; H, 10.03%; N, 5.58%) Found: C, 52.27%, H,
9.63%, N, 5.19%.
33
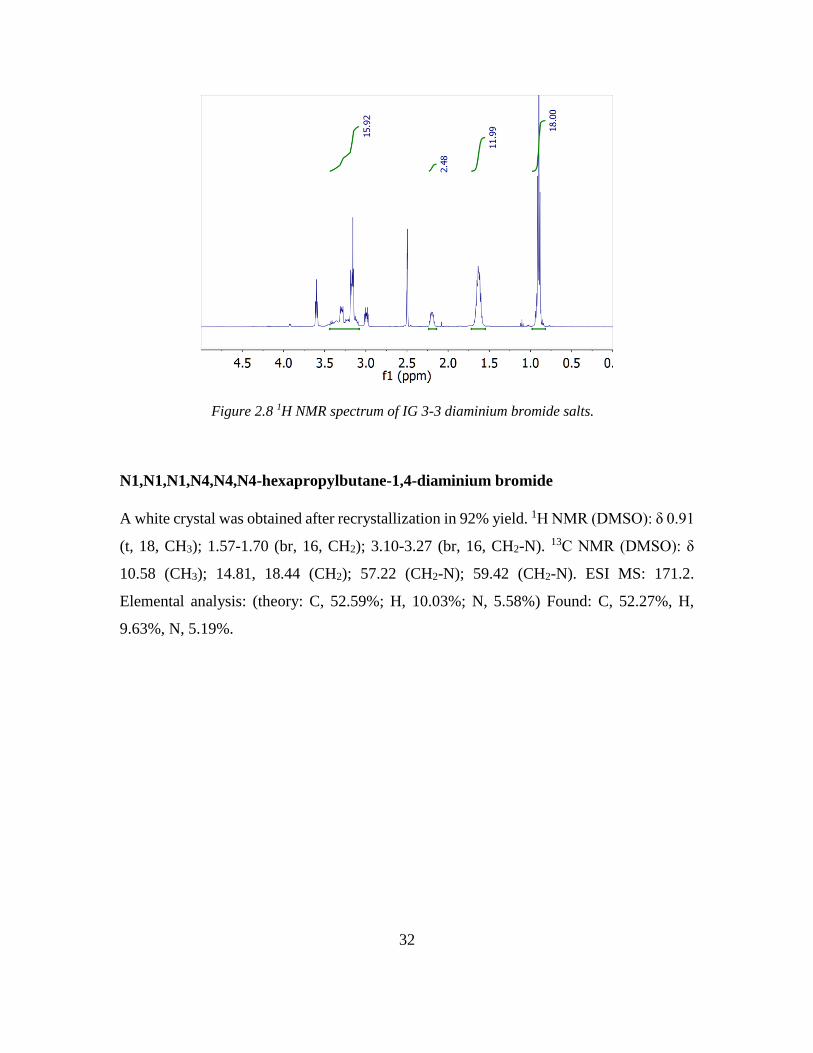
Figure 2.9 1H NMR spectrum of IG 4-3 diaminium bromide salts.
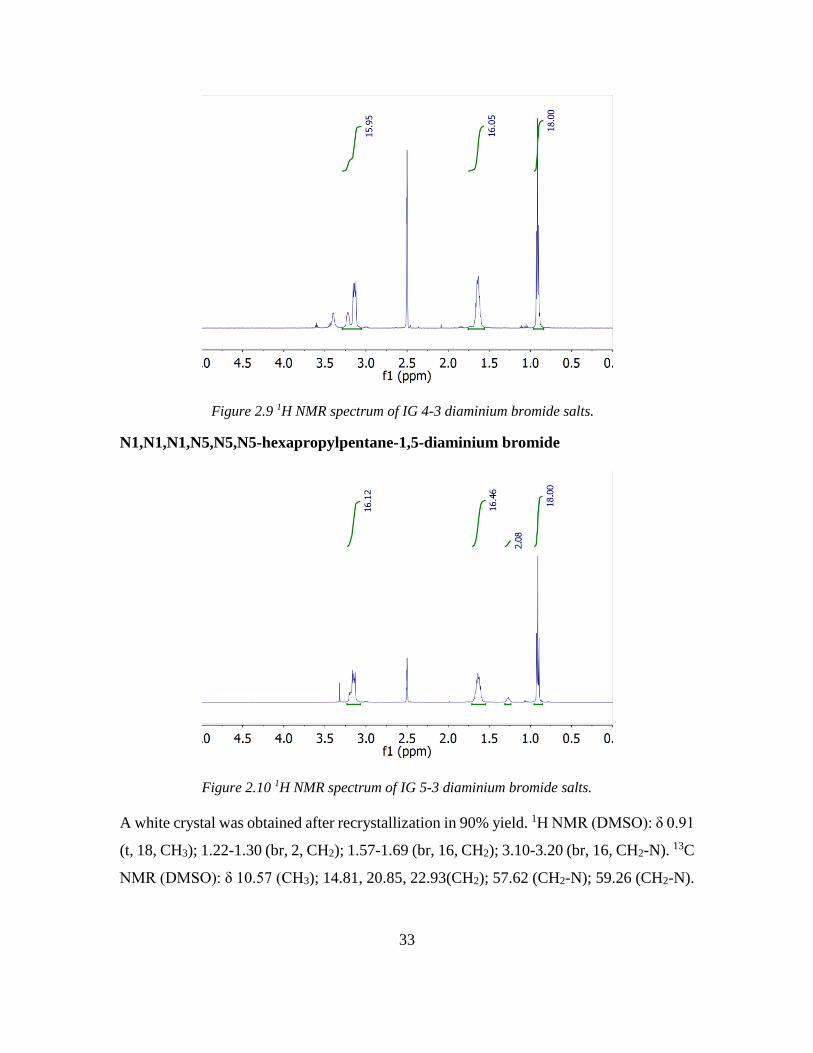
N1,N1,N1,N5,N5,N5-hexapropylpentane-1,5-diaminium bromide
A white crystal was obtained after recrystallization in 90% yield. 1H NMR (DMSO): δ 0.91
(t, 18, CH3); 1.22-1.30 (br, 2, CH2); 1.57-1.69 (br, 16, CH2); 3.10-3.20 (br, 16, CH2-N). 13C
NMR (DMSO): δ 10.57 (CH3); 14.81, 20.85, 22.93(CH2); 57.62 (CH2-N); 59.26 (CH2-N).
Figure 2.10 1H NMR spectrum of IG 5-3 diaminium bromide salts.
34
ESI MS: 178.2. Elemental analysis: (theory: C, 53.49%; H, 10.15%; N, 5.42%) Found: C,
53.32%, H, 10.29%, N, 5.25%.
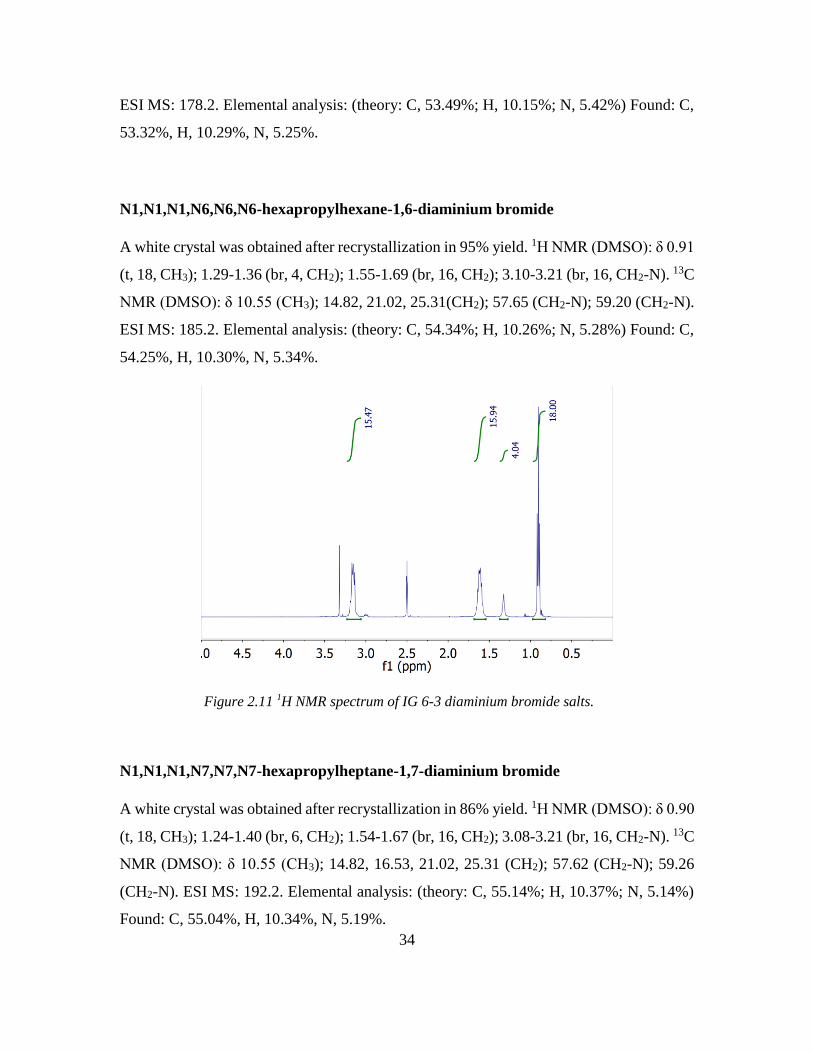
N1,N1,N1,N6,N6,N6-hexapropylhexane-1,6-diaminium bromide
A white crystal was obtained after recrystallization in 95% yield. 1H NMR (DMSO): δ 0.91
(t, 18, CH3); 1.29-1.36 (br, 4, CH2); 1.55-1.69 (br, 16, CH2); 3.10-3.21 (br, 16, CH2-N). 13C
NMR (DMSO): δ 10.55 (CH3); 14.82, 21.02, 25.31(CH2); 57.65 (CH2-N); 59.20 (CH2-N).
ESI MS: 185.2. Elemental analysis: (theory: C, 54.34%; H, 10.26%; N, 5.28%) Found: C,
54.25%, H, 10.30%, N, 5.34%.
Figure 2.11 1H NMR spectrum of IG 6-3 diaminium bromide salts.
N1,N1,N1,N7,N7,N7-hexapropylheptane-1,7-diaminium bromide
A white crystal was obtained after recrystallization in 86% yield. 1H NMR (DMSO): δ 0.90
(t, 18, CH3); 1.24-1.40 (br, 6, CH2); 1.54-1.67 (br, 16, CH2); 3.08-3.21 (br, 16, CH2-N). 13C
NMR (DMSO): δ 10.55 (CH3); 14.82, 16.53, 21.02, 25.31 (CH2); 57.62 (CH2-N); 59.26
(CH2-N). ESI MS: 192.2. Elemental analysis: (theory: C, 55.14%; H, 10.37%; N, 5.14%)
Found: C, 55.04%, H, 10.34%, N, 5.19%.
35
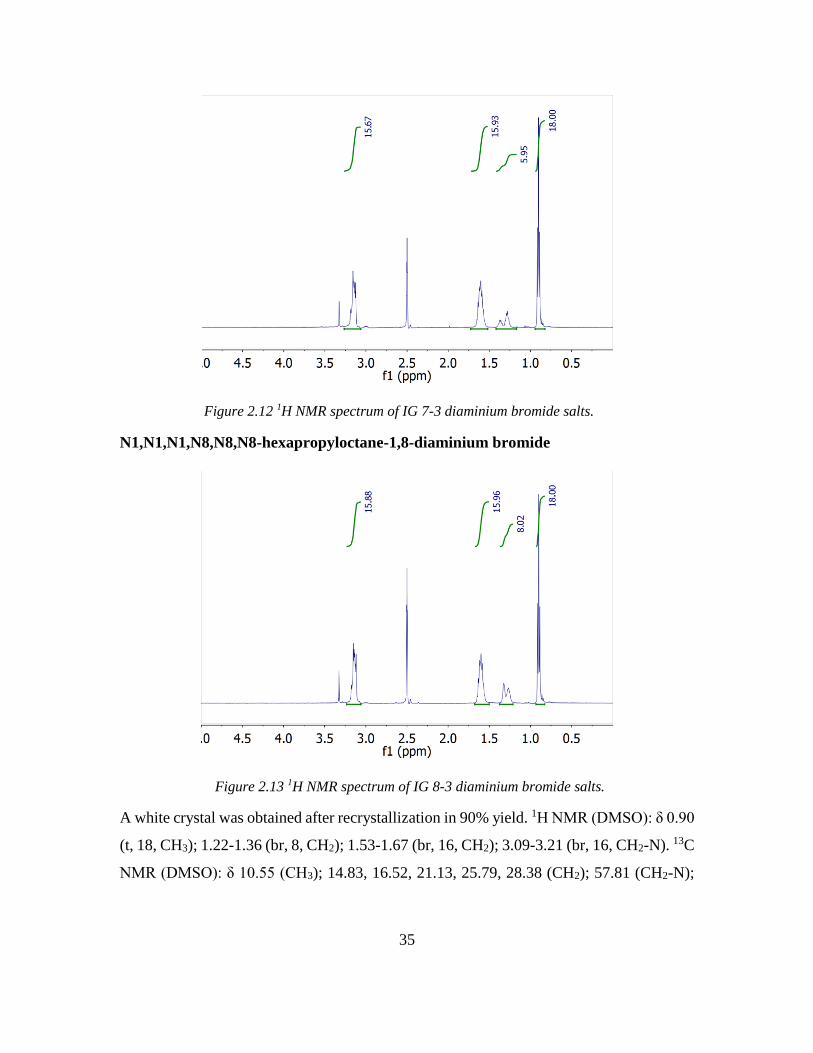
Figure 2.12 1H NMR spectrum of IG 7-3 diaminium bromide salts.
N1,N1,N1,N8,N8,N8-hexapropyloctane-1,8-diaminium bromide
Figure 2.13 1H NMR spectrum of IG 8-3 diaminium bromide salts.
A white crystal was obtained after recrystallization in 90% yield. 1H NMR (DMSO): δ 0.90
(t, 18, CH3); 1.22-1.36 (br, 8, CH2); 1.53-1.67 (br, 16, CH2); 3.09-3.21 (br, 16, CH2-N). 13C
NMR (DMSO): δ 10.55 (CH3); 14.83, 16.52, 21.13, 25.79, 28.38 (CH2); 57.81 (CH2-N);
36
59.20 (CH2-N). ESI MS: 199.2. Elemental analysis: (theory: C, 55.91%; H, 10.47%; N,
5.02%) Found: C, 55.43%, H, 10.48%, N, 5.08%.
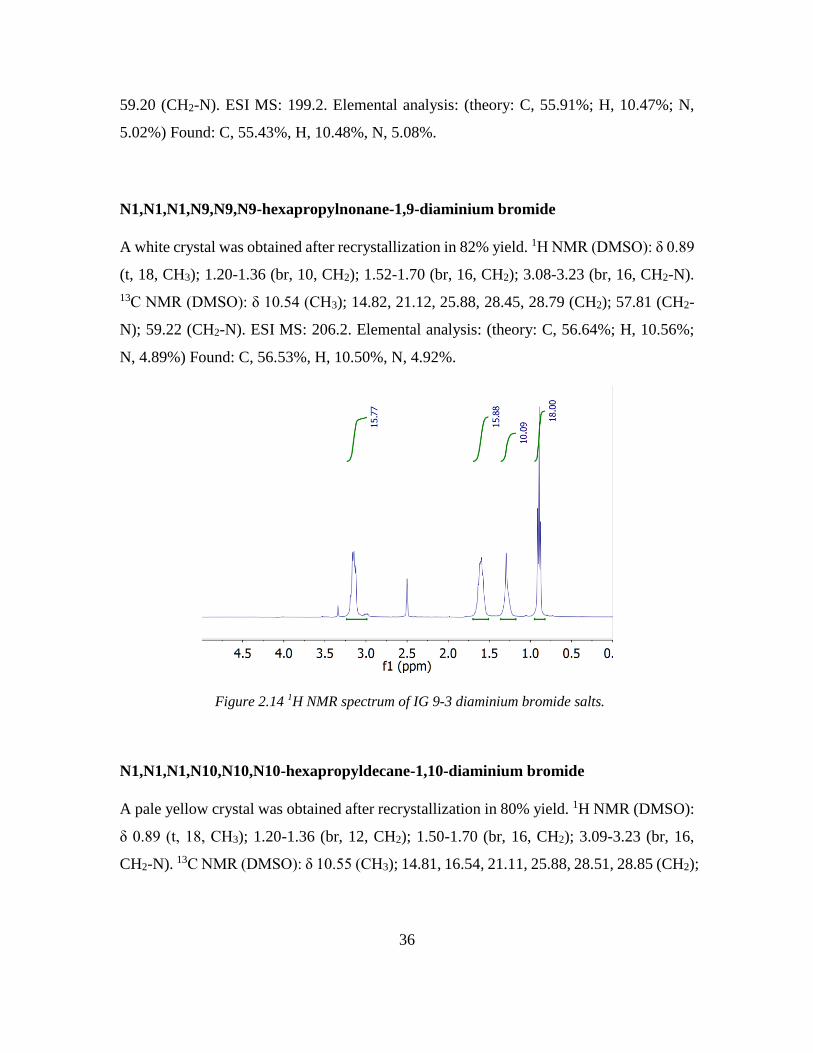
N1,N1,N1,N9,N9,N9-hexapropylnonane-1,9-diaminium bromide
A white crystal was obtained after recrystallization in 82% yield. 1H NMR (DMSO): δ 0.89
(t, 18, CH3); 1.20-1.36 (br, 10, CH2); 1.52-1.70 (br, 16, CH2); 3.08-3.23 (br, 16, CH2-N).
13C NMR (DMSO): δ 10.54 (CH3); 14.82, 21.12, 25.88, 28.45, 28.79 (CH2); 57.81 (CH2-
N); 59.22 (CH2-N). ESI MS: 206.2. Elemental analysis: (theory: C, 56.64%; H, 10.56%;
N, 4.89%) Found: C, 56.53%, H, 10.50%, N, 4.92%.
Figure 2.14 1H NMR spectrum of IG 9-3 diaminium bromide salts.
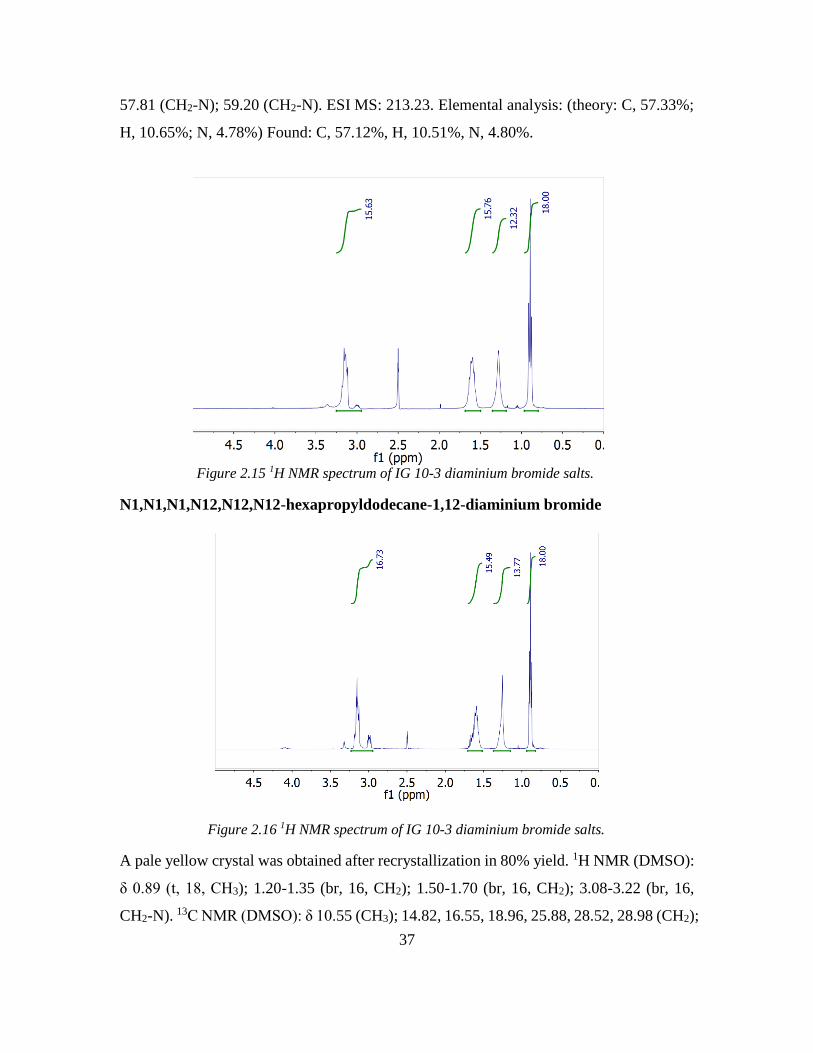
N1,N1,N1,N10,N10,N10-hexapropyldecane-1,10-diaminium bromide
A pale yellow crystal was obtained after recrystallization in 80% yield. 1H NMR (DMSO):
δ 0.89 (t, 18, CH3); 1.20-1.36 (br, 12, CH2); 1.50-1.70 (br, 16, CH2); 3.09-3.23 (br, 16,
CH2-N). 13C NMR (DMSO): δ 10.55 (CH3); 14.81, 16.54, 21.11, 25.88, 28.51, 28.85 (CH2);
37
57.81 (CH2-N); 59.20 (CH2-N). ESI MS: 213.23. Elemental analysis: (theory: C, 57.33%;
H, 10.65%; N, 4.78%) Found: C, 57.12%, H, 10.51%, N, 4.80%.
Figure 2.15 1H NMR spectrum of IG 10-3 diaminium bromide salts.
N1,N1,N1,N12,N12,N12-hexapropyldodecane-1,12-diaminium bromide
Figure 2.16 1H NMR spectrum of IG 10-3 diaminium bromide salts.
A pale yellow crystal was obtained after recrystallization in 80% yield. 1H NMR (DMSO):
δ 0.89 (t, 18, CH3); 1.20-1.35 (br, 16, CH2); 1.50-1.70 (br, 16, CH2); 3.08-3.22 (br, 16,
CH2-N). 13C NMR (DMSO): δ 10.55 (CH3); 14.82, 16.55, 18.96, 25.88, 28.52, 28.98 (CH2);
38
57.81 (CH2-N); 59.20 (CH2-N). ESI MS: 227.3. Elemental analysis: (theory: C, 58.62%;
H, 10.82%; N, 4.56%) Found: C, 58.44%, H, 10.78%, N, 4.57%.
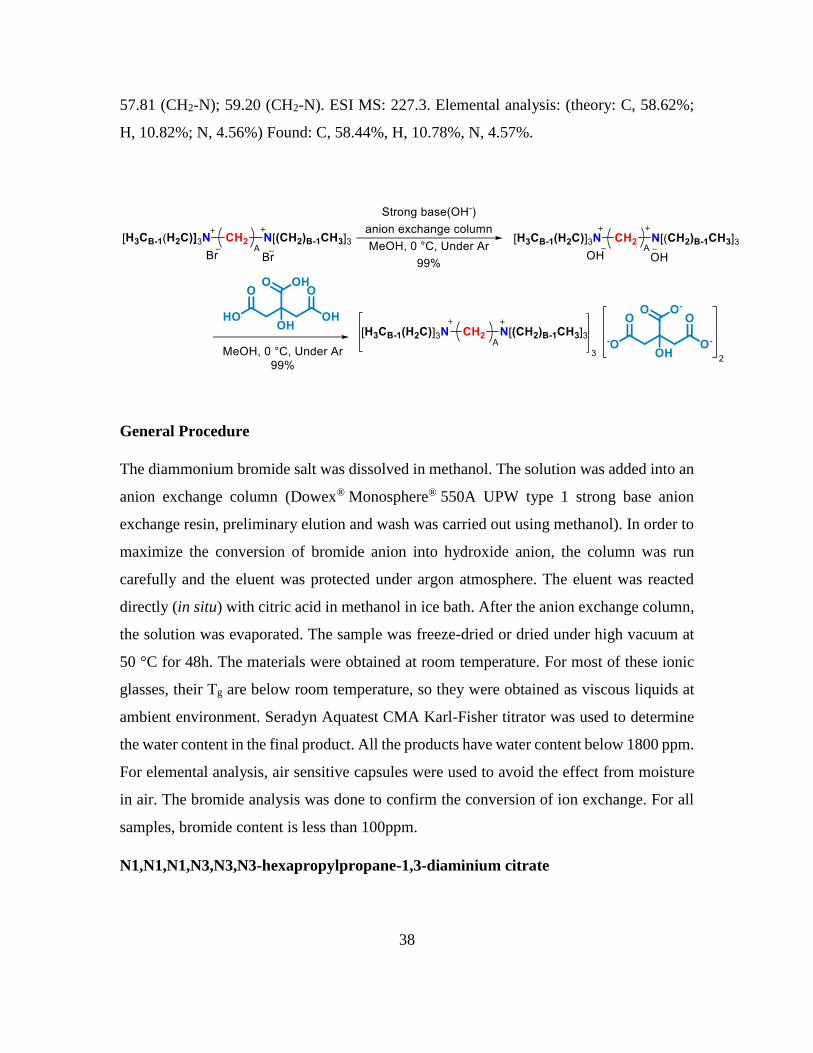
General Procedure
The diammonium bromide salt was dissolved in methanol. The solution was added into an
anion exchange column (Dowex® Monosphere® 550A UPW type 1 strong base anion
exchange resin, preliminary elution and wash was carried out using methanol). In order to
maximize the conversion of bromide anion into hydroxide anion, the column was run
carefully and the eluent was protected under argon atmosphere. The eluent was reacted
directly (in situ) with citric acid in methanol in ice bath. After the anion exchange column,
the solution was evaporated. The sample was freeze-dried or dried under high vacuum at
50 °C for 48h. The materials were obtained at room temperature. For most of these ionic
glasses, their Tg are below room temperature, so they were obtained as viscous liquids at
ambient environment. Seradyn Aquatest CMA Karl-Fisher titrator was used to determine
the water content in the final product. All the products have water content below 1800 ppm.
For elemental analysis, air sensitive capsules were used to avoid the effect from moisture
in air. The bromide analysis was done to confirm the conversion of ion exchange. For all
samples, bromide content is less than 100ppm.
N1,N1,N1,N3,N3,N3-hexapropylpropane-1,3-diaminium citrate
39
A transparent viscous liquid was obtained after drying in >99% yield. 1H NMR (D2O): δ
0.95 (t, 54, CH3); 1.64-1.76 (br, 36, CH2); 2.00-2.10(br, 6, CH2); 2.59 (d, 4, CH2); 2.64 (d,
4, CH2); 3.20-3.27 (br, 48, CH2-N). 13C NMR (D2O): δ 9.90 (CH3); 14.94-15.28 (CH2) ;
45.32 (CH2-COO-); 54.49 (CH2-N); 60.47 (CH2-N); 75.01 (C-OH); 178.46 (COO-), ESI
MS: positive ion 163.7 m/z, negative ion 190.9 m/z. Elemental analysis: (theory: C,66.04%;
H,11.38%; N, 6.16%) Found: C, 65.83%, H, 11.26%, N, 5.89%.
N1,N1,N1,N4,N4,N4-hexapropylbutane-1,4-diaminium citrate
A transparent viscous liquid was obtained after drying in >99% yield. 1H NMR (D2O): δ
0.94 (t, 54, CH3); 1.63-1.79 (br, 48, CH2); 2.57 (d, 4, CH2); 2.63 (d, 4, CH2); 3.13-3.31 (br,
48, CH2-N). 13C NMR (D2O): δ 9.89 (CH3); 14.97-15.17 (CH2) ;18.66 (CH2); 45.54 (CH2-
COO-); 57.38 (CH2-N); 60.16 (CH2-N); 74.86 (C-OH); 181.51 (COO-), ESI MS: positive
ion 171.2 m/z, negative ion 190.9 m/z. Elemental analysis: (theory: C,66.62%; H,11.47%;
N, 5.98%) Found: C, 66.53%, H, 11.12%, N, 5.76%.
N1,N1,N1,N5,N5,N5-hexapropylpentane-1,5-diaminium citrate
A transparent viscous liquid was obtained after drying in >99% yield. 1H NMR (D2O): δ
0.94 (t, 54, CH3); 1.34-1.41 (br, 6, CH2); 1.63-1.78 (br, 48, CH2); 2.57 (d, 4, CH2); 2.62 (d,
4, CH2); 3.11-3.26 (br, 48, CH2-N). 13C NMR (D2O): δ 9.92 (CH3); 14.97 (CH2); 21.12-
22.86 (CH2) ; 45.61 (CH2-COO-); 58.00 (CH2-N); 60.06 (CH2-N); 75.28 (C-OH); 181.20
(COO-), ESI MS: positive ion 178.7 m/z, negative ion 190.9 m/z. Elemental analysis:
(theory: C,67.18%; H,11.55%; N, 5.80%) Found: C, 66.88%, H, 11.08%, N, 5.51%.
N1,N1,N1,N6,N6,N6-hexapropylhexane-1,6-diaminium citrate
A transparent viscous liquid was obtained after drying in >99% yield. 1H NMR (D2O): δ
0.92 (t, 54, CH3); 1.29-1.40 (br, 12, CH2); 1.55-1.73 (br, 48, CH2); 2.58 (d, 4, CH2); 2.63
(d, 4, CH2); 3.10-3.22 (br, 48, CH2-N). 13C NMR (D2O): δ 9.94 (CH3); 14.96 (CH2); 21.12-
25.38 (CH2) ; 45.42 (CH2-COO-); 58.23 (CH2-N); 59.98 (CH2-N); 75.10 (C-OH); 178.66
(COO-), ESI MS: positive ion 185.8 m/z, negative ion 190.9 m/z. Elemental analysis:
(theory: C,67.70%; H,11.63%; N, 5.64%) Found: C, 67.55%, H, 11.48%, N, 5.32%.
40
N1,N1,N1,N7,N7,N7-hexapropylheptane-1,7-diaminium citrate
A transparent viscous liquid was obtained after drying in >99% yield. 1H NMR (D2O): δ
0.91 (t, 54, CH3); 1.21-1.44 (br, 18, CH2); 1.54-1.73 (br, 48, CH2); 2.56 (d, 4, CH2); 2.61
(d, 4, CH2); 3.00-3.17 (br, 48, CH2-N). 13C NMR (D2O): δ 9.98 (CH3); 14.96 (CH2); 21.15-
28.01 (CH2) ; 45.45 (CH2-COO-); 58.41 (CH2-N); 59.95 (CH2-N); 75.10 (C-OH); 178.65
(COO-), ESI MS: positive ion 192.7 m/z, negative ion 190.9 m/z. Elemental analysis:
(theory: C,68.19%; H,11.71%; N, 5.48%) Found: C, 68.05%, H, 11.42%, N, 5.23%.
N1,N1,N1,N8,N8,N8-hexapropyloctane-1,8-diaminium citrate
A transparent viscous liquid was obtained after drying in >99% yield. 1H NMR (D2O): δ
0.93 (t, 54, CH3); 1.28-1.39 (br, 24, CH2); 1.55-1.73 (br, 48, CH2); 2.58 (d, 4, CH2); 2.63
(d, 4, CH2); 3.06-3.21 (br, 48, CH2-N). 13C NMR (D2O): δ 9.93 (CH3); 14.94 (CH2); 21.20-
28.24 (CH2) ; 45.49 (CH2-COO-); 58.48 (CH2-N); 59.94 (CH2-N); 75.18 (C-OH); 177.25
(COO-), ESI MS: positive ion 199.8 m/z, negative ion 190.9 m/z. Elemental analysis:
(theory: C,68.66%; H,11.78%; N, 5.34%) Found: C, 68.32%, H, 11.56%, N, 5.20%.
N1,N1,N1,N9,N9,N9-hexapropylnonane-1,9-diaminium citrate
A transparent viscous liquid was obtained after drying in >99% yield. 1H NMR (D2O): δ
0.92 (t, 54, CH3); 1.29-1.40 (br, 30, CH2); 1.54-1.73 (br, 48, CH2); 2.57 (d, 4, CH2); 2.62
(d, 4, CH2); 3.10-3.23 (br, 48, CH2-N). 13C NMR (D2O): δ 9.97 (CH3); 14.95 (CH2); 21.25-
28.46 (CH2) ; 45.48 (CH2-COO-); 58.49 (CH2-N); 59.97 (CH2-N); 75.20 (C-OH); 178.36
(COO-), ESI MS: positive ion 206.7 m/z, negative ion 190.9 m/z. Elemental analysis:
(theory: C,69.10%; H,11.85%; N, 5.20%) Found: C, 68.90%, H, 11.65%, N, 5.13%.
N1,N1,N1,N10,N10,N10-hexapropyldecane-1,10-diaminium citrate
A transparent viscous liquid was obtained after drying in >99% yield. 1H NMR (D2O): δ
0.92 (t, 54, CH3); 1.30-1.40 (br, 36, CH2); 1.55-1.74 (br, 48, CH2); 2.58 (d, 4, CH2); 2.63
(d, 4, CH2); 3.11-3.25 (br, 48, CH2-N). 13C NMR (D2O): δ 9.96 (CH3); 14.94 (CH2); 21.26-
28.87 (CH2) ; 45.49 (CH2-COO-); 58.48 (CH2-N); 59.97 (CH2-N); 75.21 (C-OH); 178.52
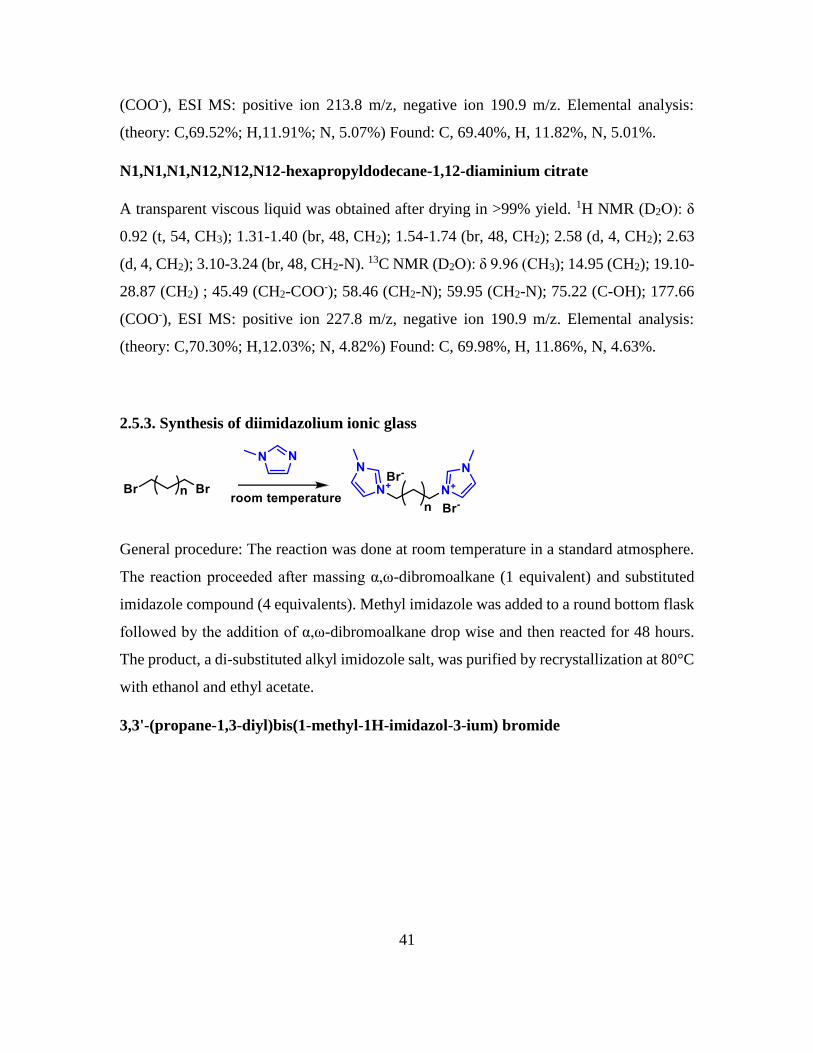
41
(COO-), ESI MS: positive ion 213.8 m/z, negative ion 190.9 m/z. Elemental analysis:
(theory: C,69.52%; H,11.91%; N, 5.07%) Found: C, 69.40%, H, 11.82%, N, 5.01%.
N1,N1,N1,N12,N12,N12-hexapropyldodecane-1,12-diaminium citrate
A transparent viscous liquid was obtained after drying in >99% yield. 1H NMR (D2O): δ
0.92 (t, 54, CH3); 1.31-1.40 (br, 48, CH2); 1.54-1.74 (br, 48, CH2); 2.58 (d, 4, CH2); 2.63
(d, 4, CH2); 3.10-3.24 (br, 48, CH2-N). 13C NMR (D2O): δ 9.96 (CH3); 14.95 (CH2); 19.10-
28.87 (CH2) ; 45.49 (CH2-COO-); 58.46 (CH2-N); 59.95 (CH2-N); 75.22 (C-OH); 177.66
(COO-), ESI MS: positive ion 227.8 m/z, negative ion 190.9 m/z. Elemental analysis:
(theory: C,70.30%; H,12.03%; N, 4.82%) Found: C, 69.98%, H, 11.86%, N, 4.63%.
2.5.3. Synthesis of diimidazolium ionic glass
General procedure: The reaction was done at room temperature in a standard atmosphere.
The reaction proceeded after massing α,ω-dibromoalkane (1 equivalent) and substituted
imidazole compound (4 equivalents). Methyl imidazole was added to a round bottom flask
followed by the addition of α,ω-dibromoalkane drop wise and then reacted for 48 hours.
The product, a di-substituted alkyl imidozole salt, was purified by recrystallization at 80°C
with ethanol and ethyl acetate.
3,3'-(propane-1,3-diyl)bis(1-methyl-1H-imidazol-3-ium) bromide
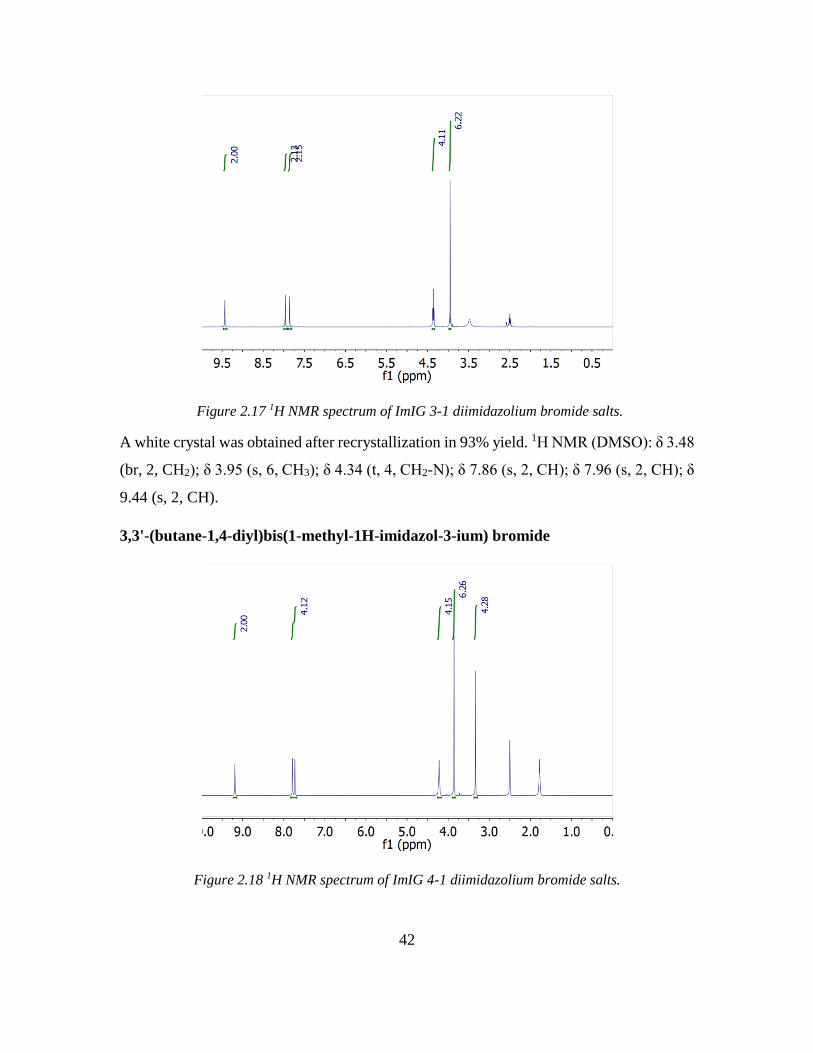
42
Figure 2.17 1H NMR spectrum of ImIG 3-1 diimidazolium bromide salts.
A white crystal was obtained after recrystallization in 93% yield. 1H NMR (DMSO): δ 3.48
(br, 2, CH2); δ 3.95 (s, 6, CH3); δ 4.34 (t, 4, CH2-N); δ 7.86 (s, 2, CH); δ 7.96 (s, 2, CH); δ
9.44 (s, 2, CH).
3,3'-(butane-1,4-diyl)bis(1-methyl-1H-imidazol-3-ium) bromide
Figure 2.18 1H NMR spectrum of ImIG 4-1 diimidazolium bromide salts.
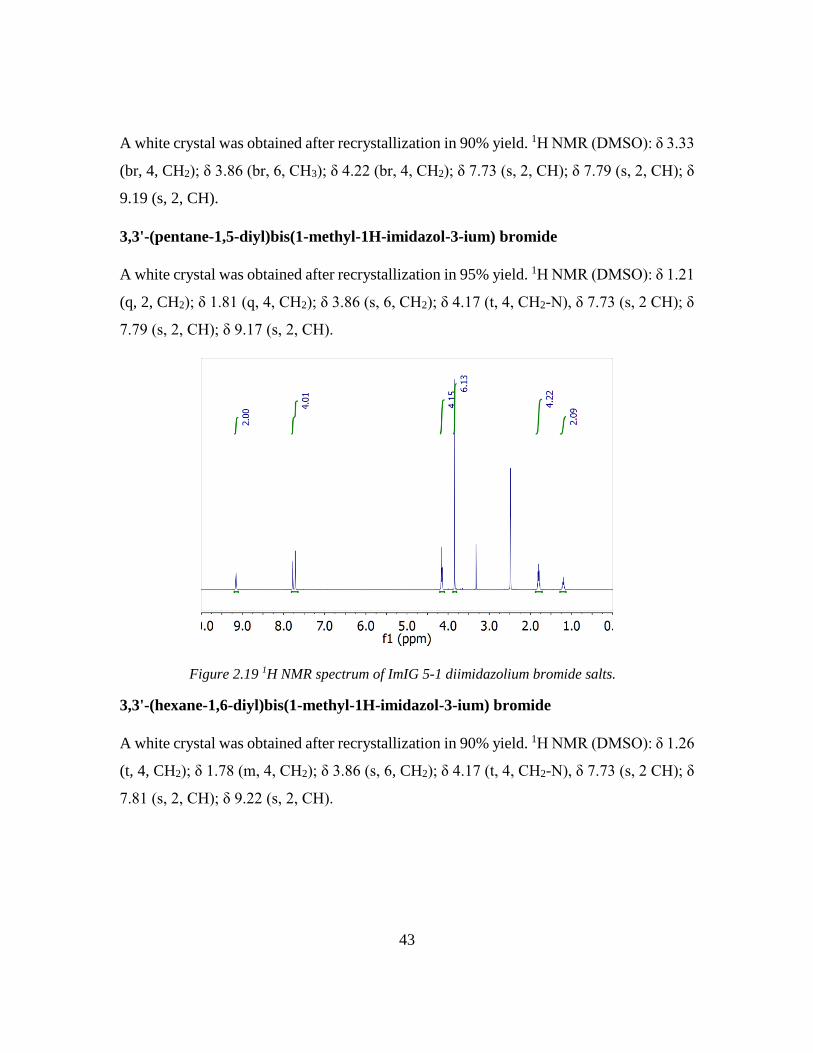
43
A white crystal was obtained after recrystallization in 90% yield. 1H NMR (DMSO): δ 3.33
(br, 4, CH2); δ 3.86 (br, 6, CH3); δ 4.22 (br, 4, CH2); δ 7.73 (s, 2, CH); δ 7.79 (s, 2, CH); δ
9.19 (s, 2, CH).
3,3'-(pentane-1,5-diyl)bis(1-methyl-1H-imidazol-3-ium) bromide
A white crystal was obtained after recrystallization in 95% yield. 1H NMR (DMSO): δ 1.21
(q, 2, CH2); δ 1.81 (q, 4, CH2); δ 3.86 (s, 6, CH2); δ 4.17 (t, 4, CH2-N), δ 7.73 (s, 2 CH); δ
7.79 (s, 2, CH); δ 9.17 (s, 2, CH).
Figure 2.19 1H NMR spectrum of ImIG 5-1 diimidazolium bromide salts.
3,3'-(hexane-1,6-diyl)bis(1-methyl-1H-imidazol-3-ium) bromide
A white crystal was obtained after recrystallization in 90% yield. 1H NMR (DMSO): δ 1.26
(t, 4, CH2); δ 1.78 (m, 4, CH2); δ 3.86 (s, 6, CH2); δ 4.17 (t, 4, CH2-N), δ 7.73 (s, 2 CH); δ
7.81 (s, 2, CH); δ 9.22 (s, 2, CH).
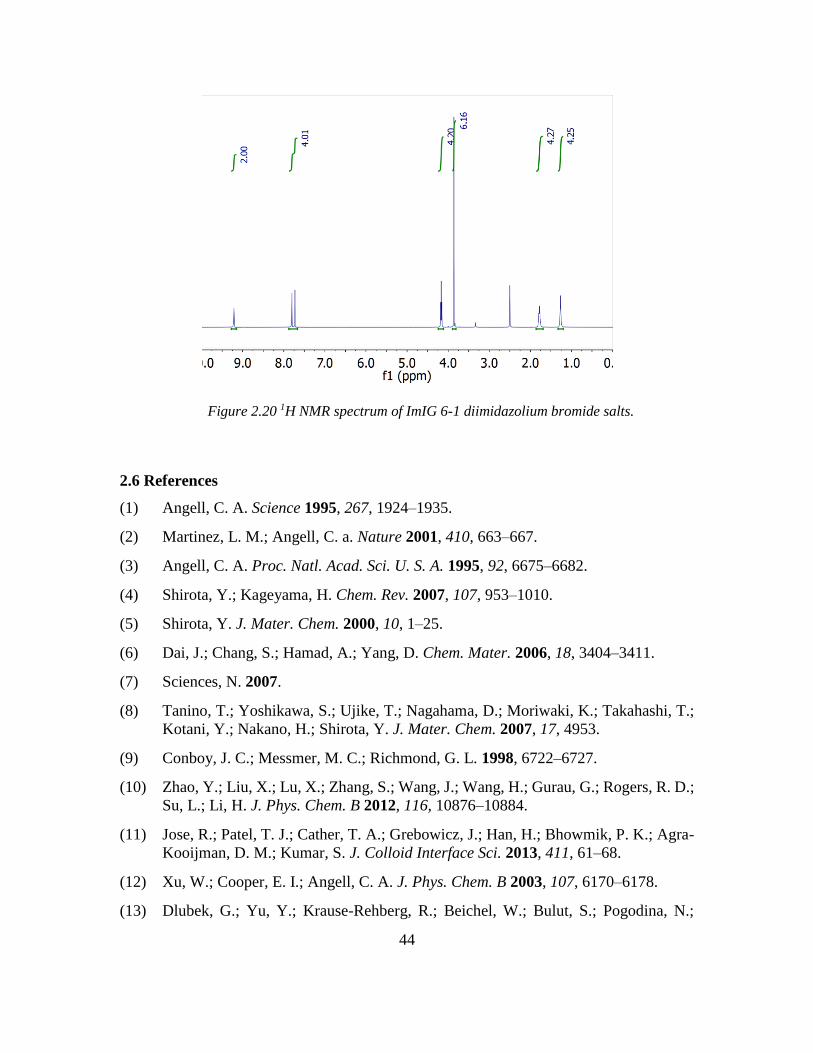
44
Figure 2.20 1H NMR spectrum of ImIG 6-1 diimidazolium bromide salts.
2.6 References
(1) Angell, C. A. Science 1995, 267, 1924–1935.
(2) Martinez, L. M.; Angell, C. a. Nature 2001, 410, 663–667.
(3) Angell, C. A. Proc. Natl. Acad. Sci. U. S. A. 1995, 92, 6675–6682.
(4) Shirota, Y.; Kageyama, H. Chem. Rev. 2007, 107, 953–1010.
(5) Shirota, Y. J. Mater. Chem. 2000, 10, 1–25.
(6) Dai, J.; Chang, S.; Hamad, A.; Yang, D. Chem. Mater. 2006, 18, 3404–3411.
(7) Sciences, N. 2007.
(8) Tanino, T.; Yoshikawa, S.; Ujike, T.; Nagahama, D.; Moriwaki, K.; Takahashi, T.;
Kotani, Y.; Nakano, H.; Shirota, Y. J. Mater. Chem. 2007, 17, 4953.
(9) Conboy, J. C.; Messmer, M. C.; Richmond, G. L. 1998, 6722–6727.
(10) Zhao, Y.; Liu, X.; Lu, X.; Zhang, S.; Wang, J.; Wang, H.; Gurau, G.; Rogers, R. D.;
Su, L.; Li, H. J. Phys. Chem. B 2012, 116, 10876–10884.
(11) Jose, R.; Patel, T. J.; Cather, T. A.; Grebowicz, J.; Han, H.; Bhowmik, P. K.; Agra-
Kooijman, D. M.; Kumar, S. J. Colloid Interface Sci. 2013, 411, 61–68.
(12) Xu, W.; Cooper, E. I.; Angell, C. A. J. Phys. Chem. B 2003, 107, 6170–6178.
(13) Dlubek, G.; Yu, Y.; Krause-Rehberg, R.; Beichel, W.; Bulut, S.; Pogodina, N.;
45
Krossing, I.; Friedrich, C. J. Chem. Phys. 2010, 133, 124502.
(14) Shi, C.; Li, S.; Zhang, W.; Qiu, L.; Yan, F. J. Mater. Chem. A 2013, 1, 13956-13962.
(15) Lowe, A. B.; McCormick, C. L. Chem. Rev. 2002, 102, 4177–4189.
(16) Pas, S. J.; Dargusch, M. S.; MacFarlane, D. R. Phys. Chem. Chem. Phys. 2011, 13,
12033–12040.
(17) Dean, P. M.; Turanjanin, J.; Yoshizawa-Fujita, M.; MacFarlane, D. R.; Scott, J. L.
Cryst. Growth Des. 2009, 9, 1137–1145.
(18) Zheng, W.; Mohammed, A.; Hines, L. G.; Xiao, D.; Martinez, O. J.; Bartsch, R. A.;
Simon, S. L.; Russina, O.; Triolo, A.; Quitevis, E. L. J. Phys. Chem. B 2011, 115,
6572–6584.
(19) Rocha, M. A. A.; Neves, C. M. S. S.; Freire, M. G.; Russina, O.; Triolo, A.; Coutinho,
J. A. P. C.; Santos, L. M. N. B. F. J. Phys. Chem. B 2013, 117, 10889–10897.
(20) Hayes, R.; Imberti, S.; Warr, G. G.; Atkin, R. Phys. Chem. Chem. Phys. 2011, 13,
13544–13551.
46
CHAPTER 3
ODD-EVEN EFFECT IN NETWORK-FORMING IONIC GLASS
AND LIQUID
3.1 Abstract
Odd-even effects, the non-monotonic dependency of physical properties on
odd/even structural units, are widely observed in homologous series of crystalline materials.
However, such alternation is not expected for molecular amorphous materials. Herein, we
report the synthesis of a class of network-forming ionic glasses (IG) using multivalent
ammonium cations and citrate anions. The glass transition temperatures of these
amorphous solids show an alternating pattern with increasing backbone length. To
understand the phenomenon’s molecular origin, we performed incoherent elastic neutron
scattering measurements of the nano-second atomic dynamics. Our results suggest that the
molecules’ mobility, thus the glass transition temperature, correlates with their structural
symmetry.
3.2 Introduction
In 1877, A. Baeyer discovered that the melting point of fatty acids does not exhibit
a monotonic increase with increasing chain length.1 Later on, almost all standard organic
chemistry textbooks mention that even-membered n-alkanes and most of their α- and α,ω-
substituents have higher melting temperatures than the odd membered counterparts.
Besides melting point,2,3 odd-even effects of various systems have been shown in other
properties such as fusion/sublimation enthalpy,4 density,5 mechanical properties6,7 and
surface properties8. In general, “packing effects” are used to explain this alternation trend
in crystalline materials. However, periodic packing does not exist in amorphous solids.
Thus, the odd-even effect was not expected for molecular amorphous materials. For
example, in most semi-crystalline polymer homologues, although the melting temperatures
(Tm) show odd-even alternation, the glass transition temperatures (Tg) only have a
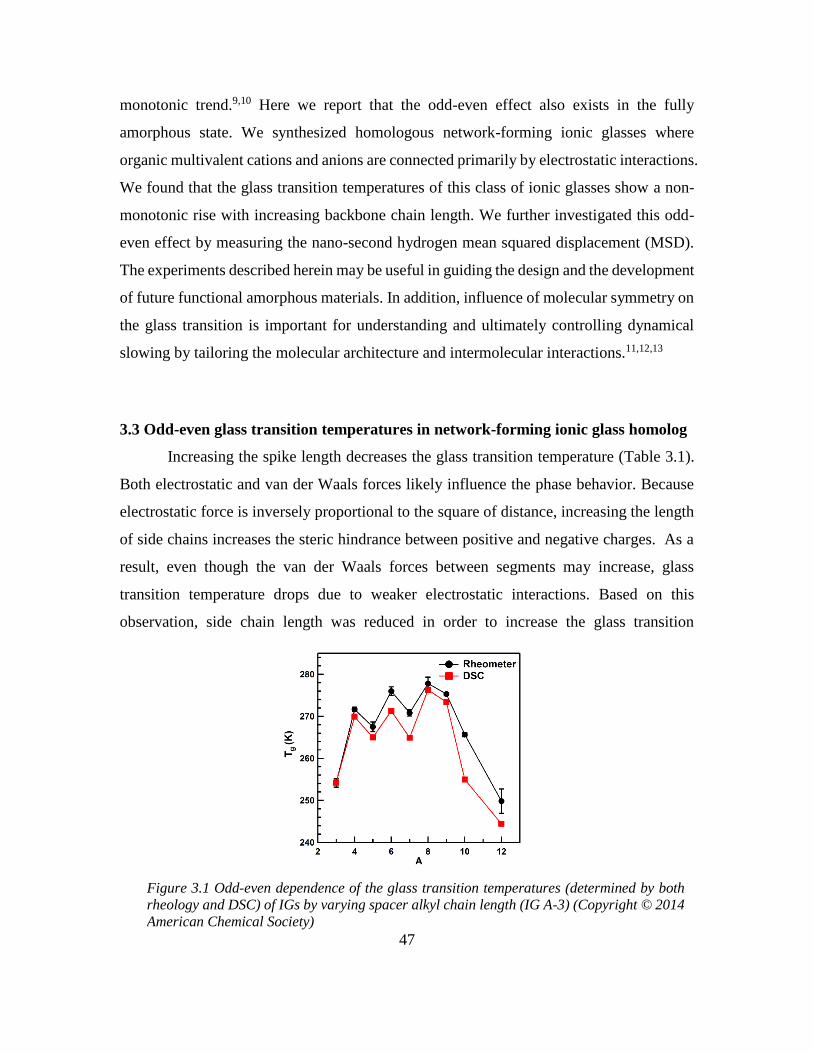
47
monotonic trend.9,10 Here we report that the odd-even effect also exists in the fully
amorphous state. We synthesized homologous network-forming ionic glasses where
organic multivalent cations and anions are connected primarily by electrostatic interactions.
We found that the glass transition temperatures of this class of ionic glasses show a non-
monotonic rise with increasing backbone chain length. We further investigated this odd-
even effect by measuring the nano-second hydrogen mean squared displacement (MSD).
The experiments described herein may be useful in guiding the design and the development
of future functional amorphous materials. In addition, influence of molecular symmetry on
the glass transition is important for understanding and ultimately controlling dynamical
slowing by tailoring the molecular architecture and intermolecular interactions.11,12,13
3.3 Odd-even glass transition temperatures in network-forming ionic glass homolog
Increasing the spike length decreases the glass transition temperature (Table 3.1).
Both electrostatic and van der Waals forces likely influence the phase behavior. Because
electrostatic force is inversely proportional to the square of distance, increasing the length
of side chains increases the steric hindrance between positive and negative charges. As a
result, even though the van der Waals forces between segments may increase, glass
transition temperature drops due to weaker electrostatic interactions. Based on this
observation, side chain length was reduced in order to increase the glass transition
Figure 3.1 Odd-even dependence of the glass transition temperatures (determined by both
rheology and DSC) of IGs by varying spacer alkyl chain length (IG A-3) (Copyright © 2014
American Chemical Society)
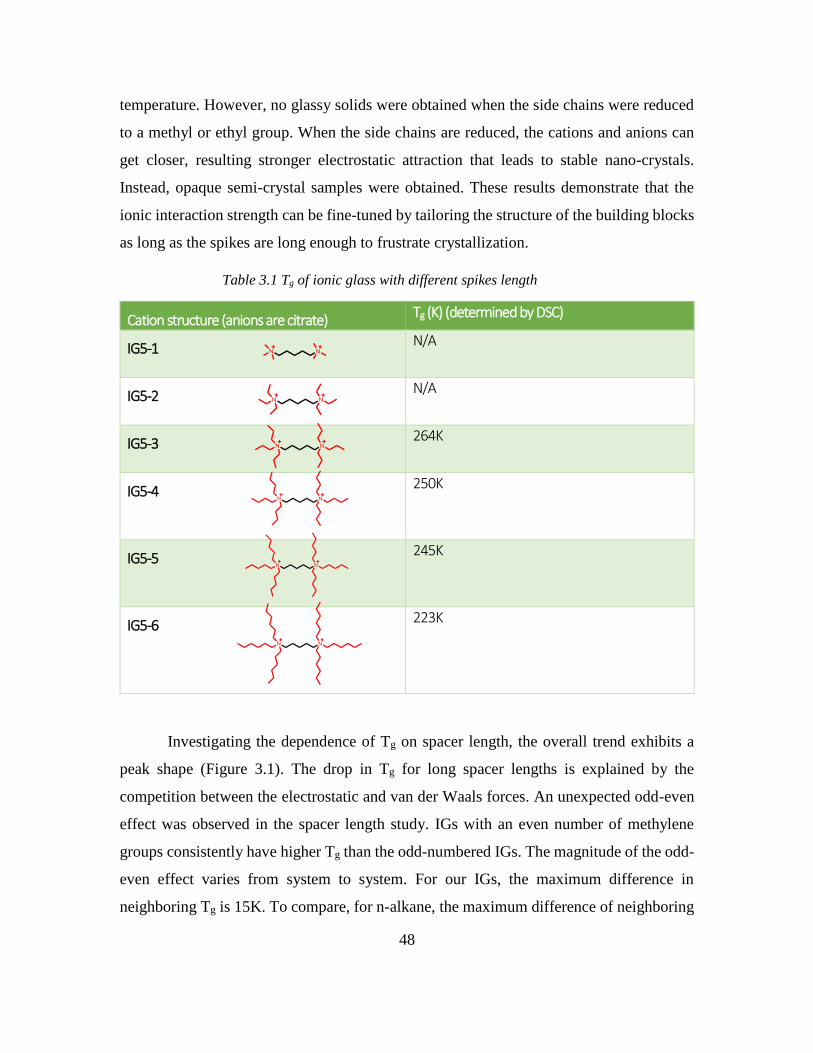
48
temperature. However, no glassy solids were obtained when the side chains were reduced
to a methyl or ethyl group. When the side chains are reduced, the cations and anions can
get closer, resulting stronger electrostatic attraction that leads to stable nano-crystals.
Instead, opaque semi-crystal samples were obtained. These results demonstrate that the
ionic interaction strength can be fine-tuned by tailoring the structure of the building blocks
as long as the spikes are long enough to frustrate crystallization.
Table 3.1 Tg of ionic glass with different spikes length
Cation structure (anions are citrate) Tg (K) (determined by DSC)
IG5-1
N/A
IG5-2
N/A
IG5-3
264K
IG5-4
250K
IG5-5
245K
IG5-6
223K
Investigating the dependence of Tg on spacer length, the overall trend exhibits a
peak shape (Figure 3.1). The drop in Tg for long spacer lengths is explained by the
competition between the electrostatic and van der Waals forces. An unexpected odd-even
effect was observed in the spacer length study. IGs with an even number of methylene
groups consistently have higher Tg than the odd-numbered IGs. The magnitude of the odd-
even effect varies from system to system. For our IGs, the maximum difference in
neighboring Tg is 15K. To compare, for n-alkane, the maximum difference of neighboring
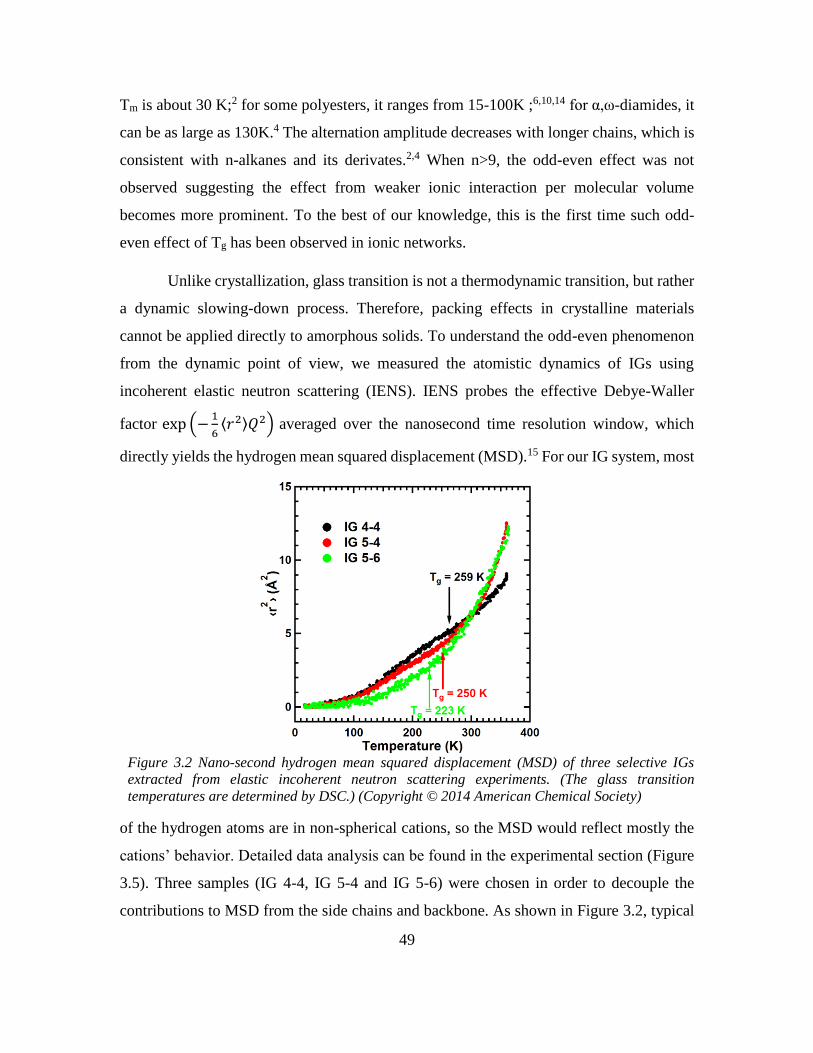
49
Tm is about 30 K;2 for some polyesters, it ranges from 15-100K ;6,10,14 for α,ω-diamides, it
can be as large as 130K.4 The alternation amplitude decreases with longer chains, which is
consistent with n-alkanes and its derivates.2,4 When n>9, the odd-even effect was not
observed suggesting the effect from weaker ionic interaction per molecular volume
becomes more prominent. To the best of our knowledge, this is the first time such odd-
even effect of Tg has been observed in ionic networks.
Unlike crystallization, glass transition is not a thermodynamic transition, but rather
a dynamic slowing-down process. Therefore, packing effects in crystalline materials
cannot be applied directly to amorphous solids. To understand the odd-even phenomenon
from the dynamic point of view, we measured the atomistic dynamics of IGs using
incoherent elastic neutron scattering (IENS). IENS probes the effective Debye-Waller
factor exp (−1
6⟨𝑟2⟩𝑄2) averaged over the nanosecond time resolution window, which
directly yields the hydrogen mean squared displacement (MSD).15 For our IG system, most
of the hydrogen atoms are in non-spherical cations, so the MSD would reflect mostly the
cations’ behavior. Detailed data analysis can be found in the experimental section (Figure
3.5). Three samples (IG 4-4, IG 5-4 and IG 5-6) were chosen in order to decouple the
contributions to MSD from the side chains and backbone. As shown in Figure 3.2, typical
Figure 3.2 Nano-second hydrogen mean squared displacement (MSD) of three selective IGs
extracted from elastic incoherent neutron scattering experiments. (The glass transition
temperatures are determined by DSC.) (Copyright © 2014 American Chemical Society)
50
IG’s nanosecond hydrogen MSD as a function of temperature can be divided into three
regimes: (i) below 100 K, MSD shows pure harmonic behavior, almost all relaxational
degrees of freedom freeze; (ii) From 100K to 250 K, anharmonic motions start contributing.
IG 4-4 and IG 5-4 with the same spike length show similar temperature dependence, while
IG 5-6 with longer hexyl side chain exhibits slower motions. This contrast suggests that
the motion of the IG alkyl side chain (spikes group) dominates in this temperature range.
In comparison, the backbone is primarily immobile in this regime as the ionic cross-links
behave like “anchors” and restrict the backbone diffusional movement; (iii) above 250K,
which is close to the glass transition temperature, the hydrogen MSDs increase
dramatically. IG 5-4 and IG 5-6 with the same backbone length behave almost identically
while IG 4-4 moves much slower. Therefore we can reasonably conclude that the
nanosecond molecular motions of IG are determined by the backbone rather than the side
chain in this temperature range.
Comparing IG 4-4 and IG 5-4, which have the same number of spike groups but
adjacent number of spacer groups, the main difference of their MSD lies in regime (iii)
(T>Tg), where IG 4-4 molecules exhibit considerably slower motions compared to IG 5-4.
This measurement of the molecular mobility explains why IG 4-4 has a higher Tg than its
odd membered counterparts. Indeed, the mobility of the molecules is influenced by their
structural symmetry, central symmetry for even membered IG and mirror symmetry for
odd membered IG, which ultimately determines the configurational entropy of the system
and thus affects the glass transition temperature. Another interesting feature of the MSD
plot is that all three curves seem to have a common crossover point around 300 K, which
is under current investigation.
3.4 Dynamic odd-even effect in network-forming ionic liquids
Despite the existence of odd-even effect in various systems, odd-even effect of
dynamic properties was rarely reported in literature. An early case is the odd-even effect
on the viscoelastic properties in nematic liquid crystal. Rotational viscosity of these liquid
crystals exhibit alternation trend with alkyl chain length.16–18 More recent molecular
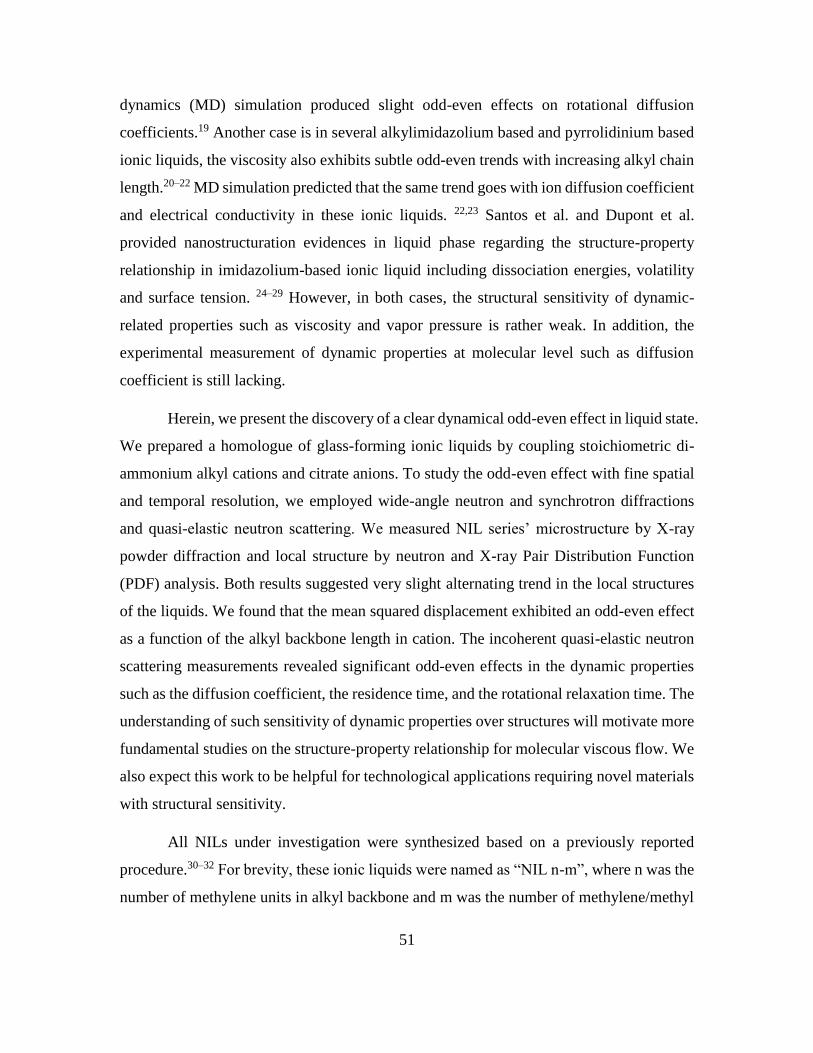
51
dynamics (MD) simulation produced slight odd-even effects on rotational diffusion
coefficients.19 Another case is in several alkylimidazolium based and pyrrolidinium based
ionic liquids, the viscosity also exhibits subtle odd-even trends with increasing alkyl chain
length.20–22 MD simulation predicted that the same trend goes with ion diffusion coefficient
and electrical conductivity in these ionic liquids. 22,23 Santos et al. and Dupont et al.
provided nanostructuration evidences in liquid phase regarding the structure-property
relationship in imidazolium-based ionic liquid including dissociation energies, volatility
and surface tension. 24–29 However, in both cases, the structural sensitivity of dynamic-
related properties such as viscosity and vapor pressure is rather weak. In addition, the
experimental measurement of dynamic properties at molecular level such as diffusion
coefficient is still lacking.
Herein, we present the discovery of a clear dynamical odd-even effect in liquid state.
We prepared a homologue of glass-forming ionic liquids by coupling stoichiometric di-
ammonium alkyl cations and citrate anions. To study the odd-even effect with fine spatial
and temporal resolution, we employed wide-angle neutron and synchrotron diffractions
and quasi-elastic neutron scattering. We measured NIL series’ microstructure by X-ray
powder diffraction and local structure by neutron and X-ray Pair Distribution Function
(PDF) analysis. Both results suggested very slight alternating trend in the local structures
of the liquids. We found that the mean squared displacement exhibited an odd-even effect
as a function of the alkyl backbone length in cation. The incoherent quasi-elastic neutron
scattering measurements revealed significant odd-even effects in the dynamic properties
such as the diffusion coefficient, the residence time, and the rotational relaxation time. The
understanding of such sensitivity of dynamic properties over structures will motivate more
fundamental studies on the structure-property relationship for molecular viscous flow. We
also expect this work to be helpful for technological applications requiring novel materials
with structural sensitivity.
All NILs under investigation were synthesized based on a previously reported
procedure.30–32 For brevity, these ionic liquids were named as “NIL n-m”, where n was the
number of methylene units in alkyl backbone and m was the number of methylene/methyl
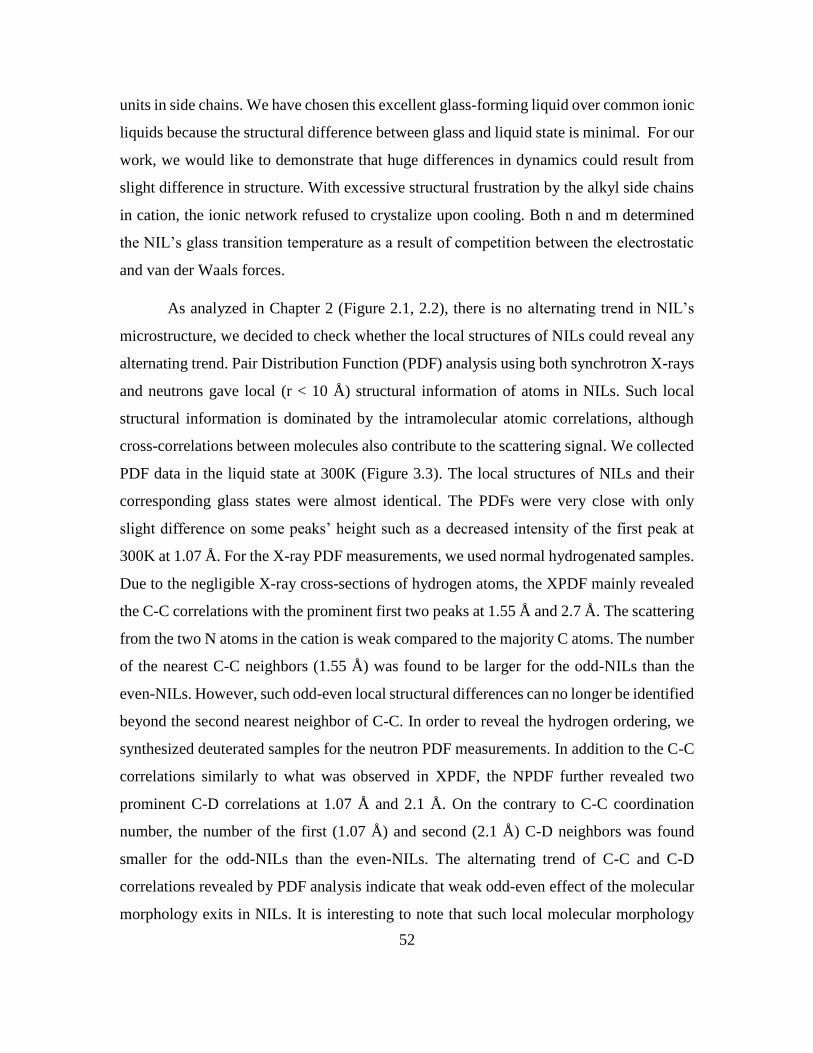
52
units in side chains. We have chosen this excellent glass-forming liquid over common ionic
liquids because the structural difference between glass and liquid state is minimal. For our
work, we would like to demonstrate that huge differences in dynamics could result from
slight difference in structure. With excessive structural frustration by the alkyl side chains
in cation, the ionic network refused to crystalize upon cooling. Both n and m determined
the NIL’s glass transition temperature as a result of competition between the electrostatic
and van der Waals forces.
As analyzed in Chapter 2 (Figure 2.1, 2.2), there is no alternating trend in NIL’s
microstructure, we decided to check whether the local structures of NILs could reveal any
alternating trend. Pair Distribution Function (PDF) analysis using both synchrotron X-rays
and neutrons gave local (r < 10 Å) structural information of atoms in NILs. Such local
structural information is dominated by the intramolecular atomic correlations, although
cross-correlations between molecules also contribute to the scattering signal. We collected
PDF data in the liquid state at 300K (Figure 3.3). The local structures of NILs and their
corresponding glass states were almost identical. The PDFs were very close with only
slight difference on some peaks’ height such as a decreased intensity of the first peak at
300K at 1.07 Å. For the X-ray PDF measurements, we used normal hydrogenated samples.
Due to the negligible X-ray cross-sections of hydrogen atoms, the XPDF mainly revealed
the C-C correlations with the prominent first two peaks at 1.55 Å and 2.7 Å. The scattering
from the two N atoms in the cation is weak compared to the majority C atoms. The number
of the nearest C-C neighbors (1.55 Å) was found to be larger for the odd-NILs than the
even-NILs. However, such odd-even local structural differences can no longer be identified
beyond the second nearest neighbor of C-C. In order to reveal the hydrogen ordering, we
synthesized deuterated samples for the neutron PDF measurements. In addition to the C-C
correlations similarly to what was observed in XPDF, the NPDF further revealed two
prominent C-D correlations at 1.07 Å and 2.1 Å. On the contrary to C-C coordination
number, the number of the first (1.07 Å) and second (2.1 Å) C-D neighbors was found
smaller for the odd-NILs than the even-NILs. The alternating trend of C-C and C-D
correlations revealed by PDF analysis indicate that weak odd-even effect of the molecular
morphology exits in NILs. It is interesting to note that such local molecular morphology
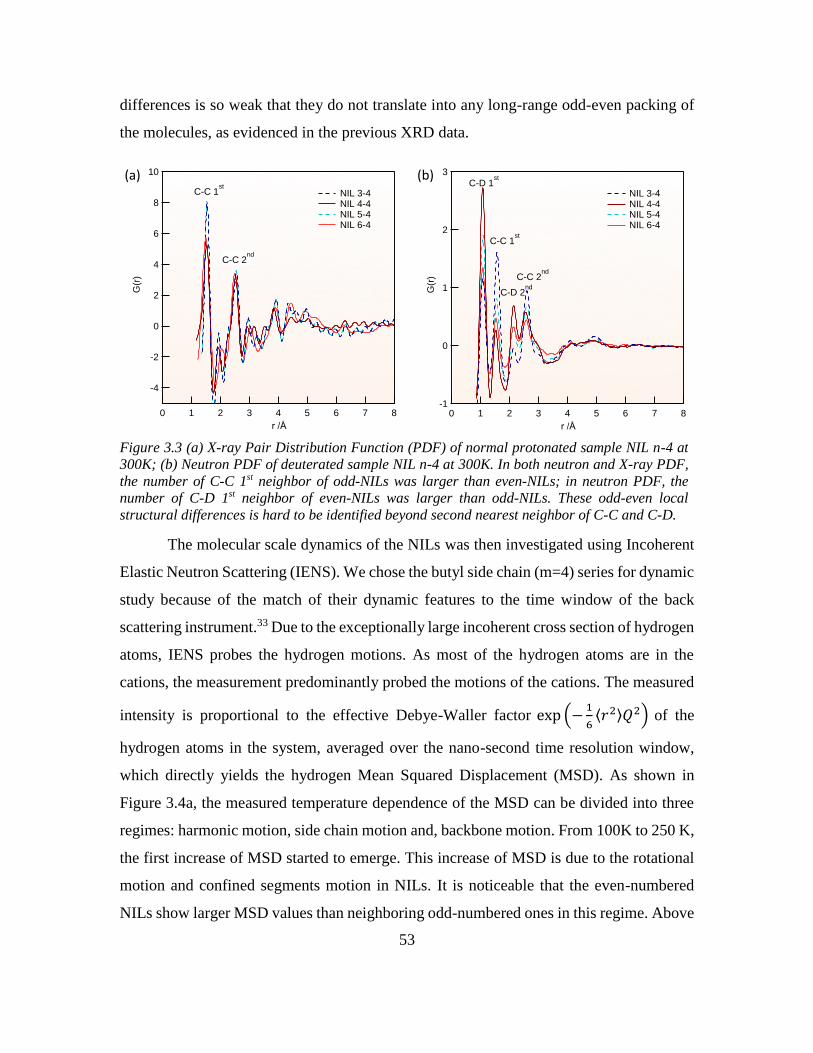
53
differences is so weak that they do not translate into any long-range odd-even packing of
the molecules, as evidenced in the previous XRD data.
The molecular scale dynamics of the NILs was then investigated using Incoherent
Elastic Neutron Scattering (IENS). We chose the butyl side chain (m=4) series for dynamic
study because of the match of their dynamic features to the time window of the back
scattering instrument.33 Due to the exceptionally large incoherent cross section of hydrogen
atoms, IENS probes the hydrogen motions. As most of the hydrogen atoms are in the
cations, the measurement predominantly probed the motions of the cations. The measured
intensity is proportional to the effective Debye-Waller factor exp (−1
6⟨𝑟2⟩𝑄2) of the
hydrogen atoms in the system, averaged over the nano-second time resolution window,
which directly yields the hydrogen Mean Squared Displacement (MSD). As shown in
Figure 3.4a, the measured temperature dependence of the MSD can be divided into three
regimes: harmonic motion, side chain motion and, backbone motion. From 100K to 250 K,
the first increase of MSD started to emerge. This increase of MSD is due to the rotational
motion and confined segments motion in NILs. It is noticeable that the even-numbered
NILs show larger MSD values than neighboring odd-numbered ones in this regime. Above
876543210
r /Å
3
2
1
0
-1
G(r
)
NIL 3-4 NIL 4-4 NIL 5-4 NIL 6-4
C-D 1st
C-C 1st
C-D 2nd
C-C 2nd
876543210
r /Å
10
8
6
4
2
0
-2
-4
G(r
)
NIL 3-4 NIL 4-4 NIL 5-4 NIL 6-4
C-C 1st
C-C 2nd
(b)(a)
Figure 3.3 (a) X-ray Pair Distribution Function (PDF) of normal protonated sample NIL n-4 at
300K; (b) Neutron PDF of deuterated sample NIL n-4 at 300K. In both neutron and X-ray PDF,
the number of C-C 1st neighbor of odd-NILs was larger than even-NILs; in neutron PDF, the
number of C-D 1st neighbor of even-NILs was larger than odd-NILs. These odd-even local
structural differences is hard to be identified beyond second nearest neighbor of C-C and C-D.
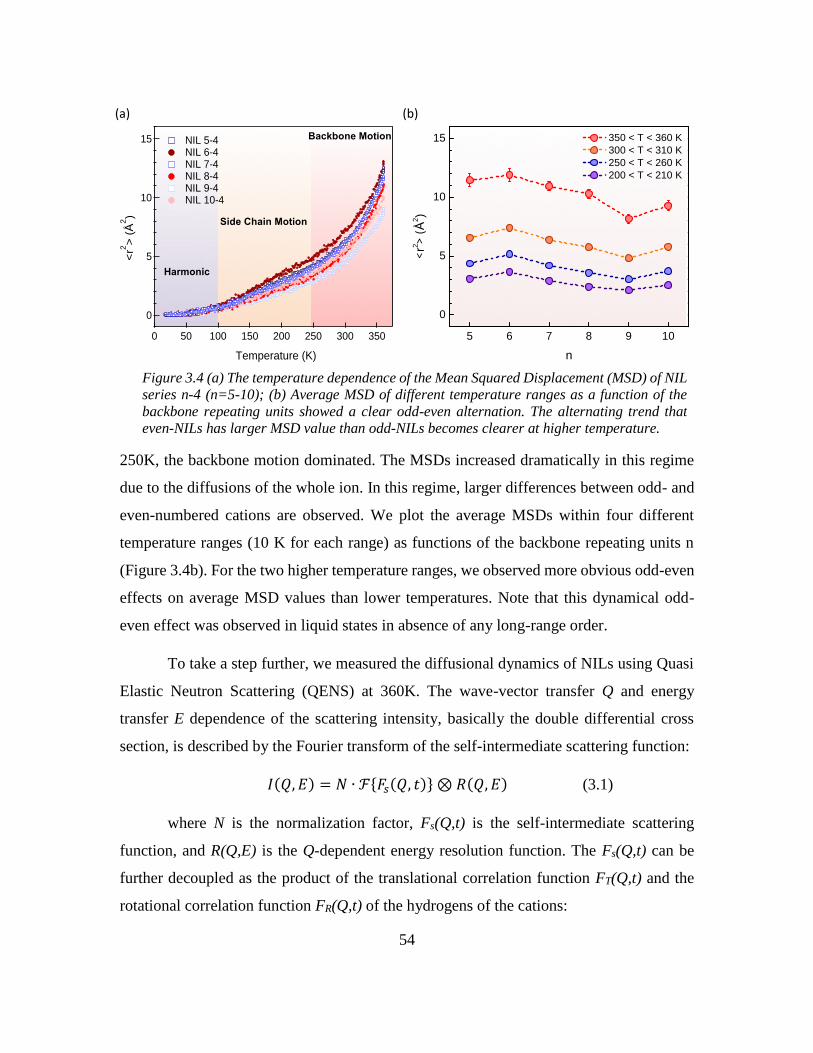
54
250K, the backbone motion dominated. The MSDs increased dramatically in this regime
due to the diffusions of the whole ion. In this regime, larger differences between odd- and
even-numbered cations are observed. We plot the average MSDs within four different
temperature ranges (10 K for each range) as functions of the backbone repeating units n
(Figure 3.4b). For the two higher temperature ranges, we observed more obvious odd-even
effects on average MSD values than lower temperatures. Note that this dynamical odd-
even effect was observed in liquid states in absence of any long-range order.
To take a step further, we measured the diffusional dynamics of NILs using Quasi
Elastic Neutron Scattering (QENS) at 360K. The wave-vector transfer Q and energy
transfer E dependence of the scattering intensity, basically the double differential cross
section, is described by the Fourier transform of the self-intermediate scattering function:
𝐼(𝑄, 𝐸) = 𝑁 ∙ ℱ{𝐹𝑠(𝑄, 𝑡)} ⊗ 𝑅(𝑄, 𝐸) (3.1)
where N is the normalization factor, Fs(Q,t) is the self-intermediate scattering
function, and R(Q,E) is the Q-dependent energy resolution function. The Fs(Q,t) can be
further decoupled as the product of the translational correlation function FT(Q,t) and the
rotational correlation function FR(Q,t) of the hydrogens of the cations:
(a) (b)
15
10
5
0
<r2
> (
Å2)
350300250200150100500
Temperature (K)
NIL 5-4 NIL 6-4 NIL 7-4 NIL 8-4 NIL 9-4 NIL 10-4
5 6 7 8 9 10
0
5
10
15 350 < T < 360 K
300 < T < 310 K
250 < T < 260 K
200 < T < 210 K
<r2
> (Å
2)
n
Harmonic
Side Chain Motion
Backbone Motion
Figure 3.4 (a) The temperature dependence of the Mean Squared Displacement (MSD) of NIL
series n-4 (n=5-10); (b) Average MSD of different temperature ranges as a function of the
backbone repeating units showed a clear odd-even alternation. The alternating trend that
even-NILs has larger MSD value than odd-NILs becomes clearer at higher temperature.
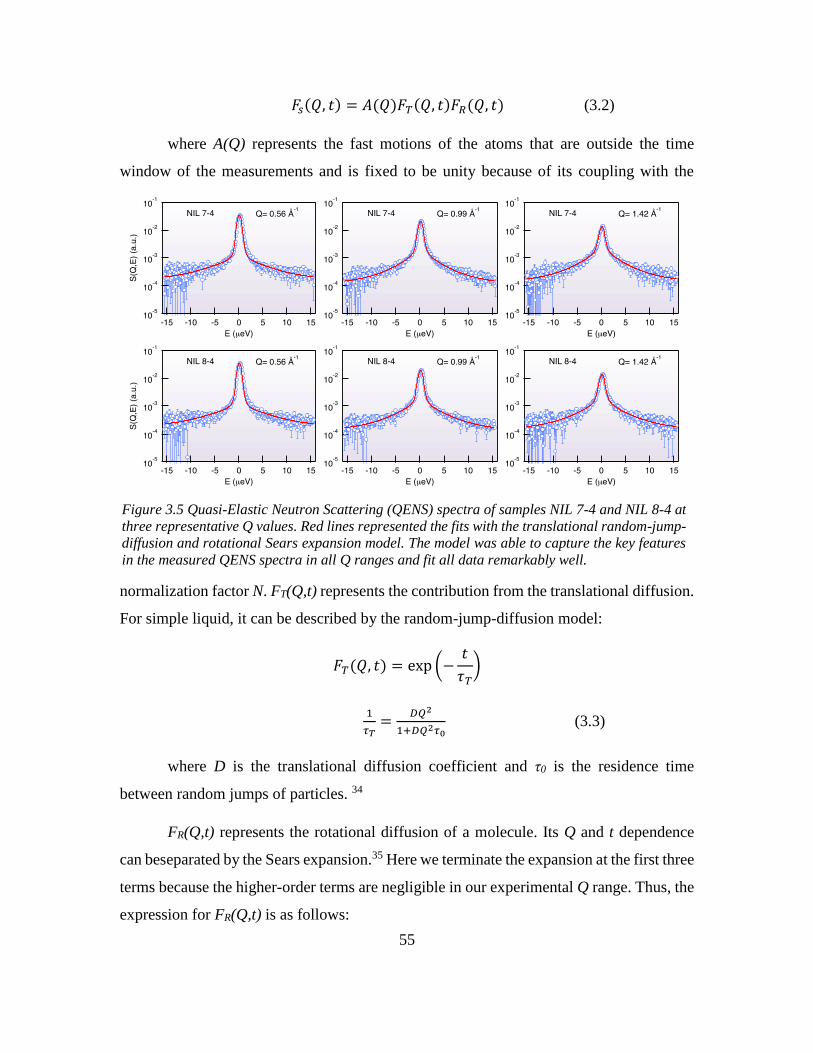
55
𝐹𝑠(𝑄, 𝑡) = 𝐴(𝑄)𝐹𝑇(𝑄, 𝑡)𝐹𝑅(𝑄, 𝑡) (3.2)
where A(Q) represents the fast motions of the atoms that are outside the time
window of the measurements and is fixed to be unity because of its coupling with the
normalization factor N. FT(Q,t) represents the contribution from the translational diffusion.
For simple liquid, it can be described by the random-jump-diffusion model:
𝐹𝑇(𝑄, 𝑡) = exp (−𝑡
𝜏𝑇)
1
𝜏𝑇=
𝐷𝑄2
1+𝐷𝑄2𝜏0 (3.3)
where D is the translational diffusion coefficient and τ0 is the residence time
between random jumps of particles. 34
FR(Q,t) represents the rotational diffusion of a molecule. Its Q and t dependence
can beseparated by the Sears expansion.35 Here we terminate the expansion at the first three
terms because the higher-order terms are negligible in our experimental Q range. Thus, the
expression for FR(Q,t) is as follows:
Figure 3.5 Quasi-Elastic Neutron Scattering (QENS) spectra of samples NIL 7-4 and NIL 8-4 at
three representative Q values. Red lines represented the fits with the translational random-jump-
diffusion and rotational Sears expansion model. The model was able to capture the key features
in the measured QENS spectra in all Q ranges and fit all data remarkably well.
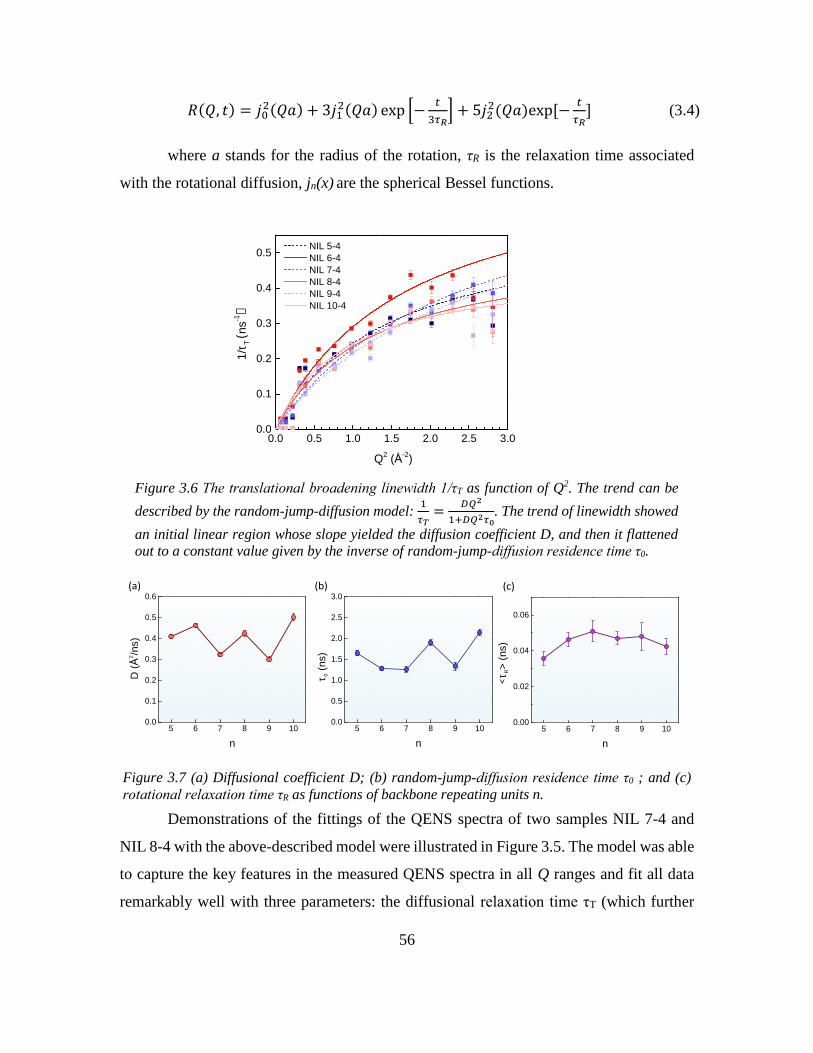
56
𝑅(𝑄, 𝑡) = 𝑗02(𝑄𝑎) + 3𝑗1
2(𝑄𝑎) exp [−𝑡
3𝜏𝑅] + 5𝑗2
2(𝑄𝑎)exp[−𝑡
𝜏𝑅] (3.4)
where a stands for the radius of the rotation, τR is the relaxation time associated
with the rotational diffusion, jn(x) are the spherical Bessel functions.
Demonstrations of the fittings of the QENS spectra of two samples NIL 7-4 and
NIL 8-4 with the above-described model were illustrated in Figure 3.5. The model was able
to capture the key features in the measured QENS spectra in all Q ranges and fit all data
remarkably well with three parameters: the diffusional relaxation time τT (which further
0.0 0.5 1.0 1.5 2.0 2.5 3.00.0
0.1
0.2
0.3
0.4
0.5
NIL 5-4
NIL 6-4
NIL 7-4
NIL 8-4
NIL 9-4
NIL 10-4
Q2 (Å
-2)
1/t
T (
ns
-1)
Figure 3.6 The translational broadening linewidth 1/τT as function of Q2. The trend can be
described by the random-jump-diffusion model: 1
𝜏𝑇=
𝐷𝑄2
1+𝐷𝑄2𝜏0. The trend of linewidth showed
an initial linear region whose slope yielded the diffusion coefficient D, and then it flattened
out to a constant value given by the inverse of random-jump-diffusion residence time τ0.
(e)
5 6 7 8 9 100.0
0.1
0.2
0.3
0.4
0.5
0.6
D (Å
2/n
s)
n
5 6 7 8 9 100.0
0.5
1.0
1.5
2.0
2.5
3.0
t 0 (
ns)
n
5 6 7 8 9 100.00
0.02
0.04
0.06
<t R
> (
ns)
n
(d)
(a) (c)(b)
Figure 3.7 (a) Diffusional coefficient D; (b) random-jump-diffusion residence time τ0 ; and (c)
rotational relaxation time τR as functions of backbone repeating units n.
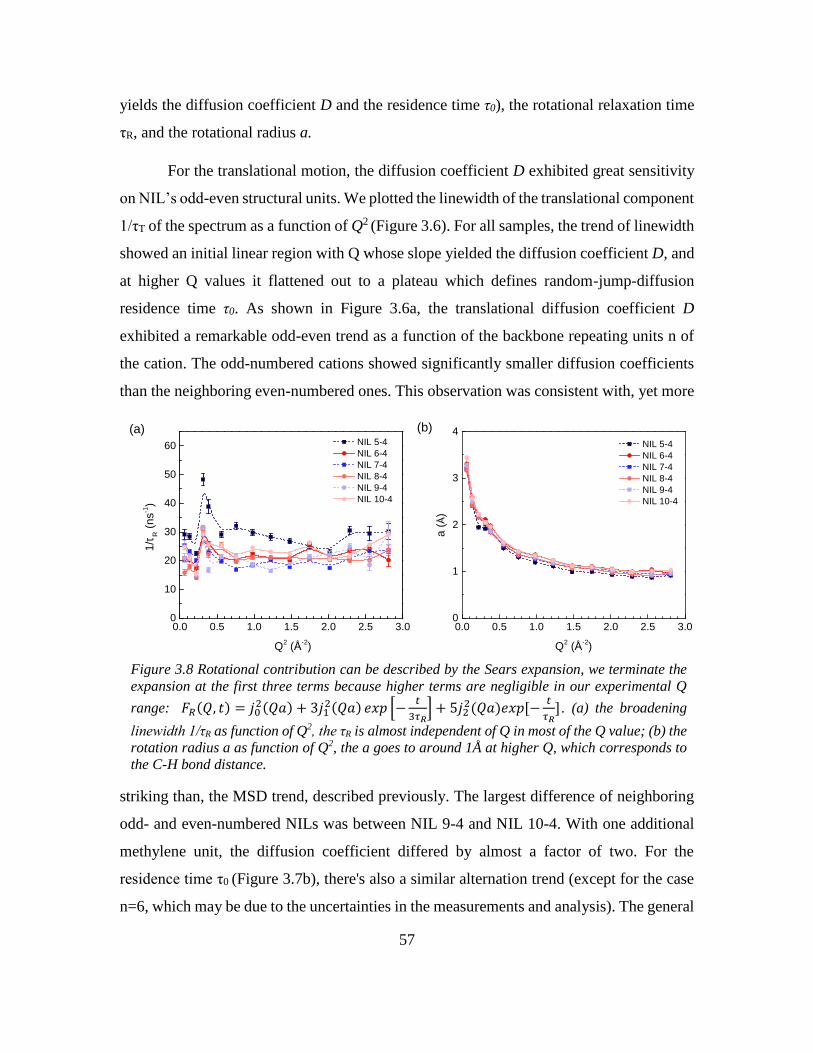
57
yields the diffusion coefficient D and the residence time τ0), the rotational relaxation time
τR, and the rotational radius a.
For the translational motion, the diffusion coefficient D exhibited great sensitivity
on NIL’s odd-even structural units. We plotted the linewidth of the translational component
1/τT of the spectrum as a function of Q2 (Figure 3.6). For all samples, the trend of linewidth
showed an initial linear region with Q whose slope yielded the diffusion coefficient D, and
at higher Q values it flattened out to a plateau which defines random-jump-diffusion
residence time τ0. As shown in Figure 3.6a, the translational diffusion coefficient D
exhibited a remarkable odd-even trend as a function of the backbone repeating units n of
the cation. The odd-numbered cations showed significantly smaller diffusion coefficients
than the neighboring even-numbered ones. This observation was consistent with, yet more
striking than, the MSD trend, described previously. The largest difference of neighboring
odd- and even-numbered NILs was between NIL 9-4 and NIL 10-4. With one additional
methylene unit, the diffusion coefficient differed by almost a factor of two. For the
residence time τ0 (Figure 3.7b), there's also a similar alternation trend (except for the case
n=6, which may be due to the uncertainties in the measurements and analysis). The general
0.0 0.5 1.0 1.5 2.0 2.5 3.00
1
2
3
4
Q2 (Å
-2)
NIL 5-4
NIL 6-4
NIL 7-4
NIL 8-4
NIL 9-4
NIL 10-4
a (Å
)
0.0 0.5 1.0 1.5 2.0 2.5 3.00
10
20
30
40
50
60
Q2 (Å
-2)
1/t
R (
ns
-1)
NIL 5-4
NIL 6-4
NIL 7-4
NIL 8-4
NIL 9-4
NIL 10-4
(a) (b)
Figure 3.8 Rotational contribution can be described by the Sears expansion, we terminate the
expansion at the first three terms because higher terms are negligible in our experimental Q
range: 𝐹𝑅(𝑄, 𝑡) = 𝑗02(𝑄𝑎) + 3𝑗1
2(𝑄𝑎) 𝑒𝑥𝑝 [−𝑡
3𝜏𝑅] + 5𝑗2
2(𝑄𝑎)𝑒𝑥𝑝[−𝑡
𝜏𝑅] . (a) the broadening
linewidth 1/τR as function of Q2, the τR is almost independent of Q in most of the Q value; (b) the
rotation radius a as function of Q2, the a goes to around 1Å at higher Q, which corresponds to
the C-H bond distance.
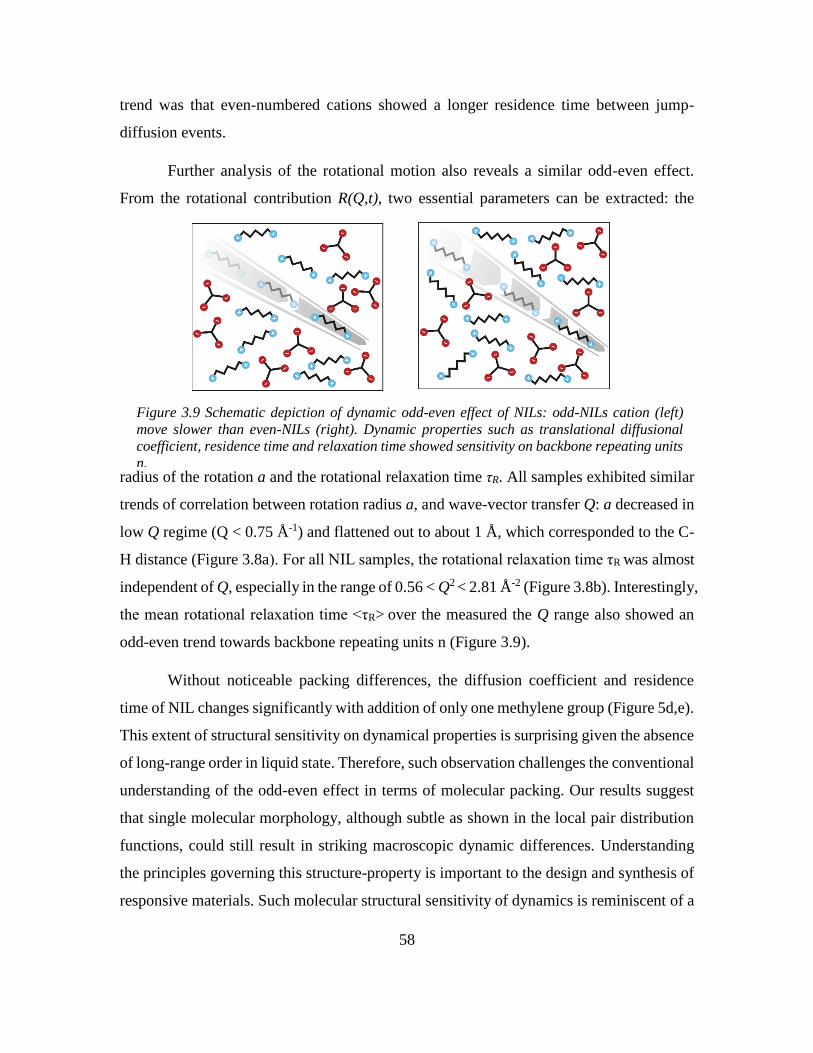
58
trend was that even-numbered cations showed a longer residence time between jump-
diffusion events.
Further analysis of the rotational motion also reveals a similar odd-even effect.
From the rotational contribution R(Q,t), two essential parameters can be extracted: the
radius of the rotation a and the rotational relaxation time τR. All samples exhibited similar
trends of correlation between rotation radius a, and wave-vector transfer Q: a decreased in
low Q regime (Q < 0.75 Å-1) and flattened out to about 1 Å, which corresponded to the C-
H distance (Figure 3.8a). For all NIL samples, the rotational relaxation time τR was almost
independent of Q, especially in the range of 0.56 < Q2 < 2.81 Å-2 (Figure 3.8b). Interestingly,
the mean rotational relaxation time <τR> over the measured the Q range also showed an
odd-even trend towards backbone repeating units n (Figure 3.9).
Without noticeable packing differences, the diffusion coefficient and residence
time of NIL changes significantly with addition of only one methylene group (Figure 5d,e).
This extent of structural sensitivity on dynamical properties is surprising given the absence
of long-range order in liquid state. Therefore, such observation challenges the conventional
understanding of the odd-even effect in terms of molecular packing. Our results suggest
that single molecular morphology, although subtle as shown in the local pair distribution
functions, could still result in striking macroscopic dynamic differences. Understanding
the principles governing this structure-property is important to the design and synthesis of
responsive materials. Such molecular structural sensitivity of dynamics is reminiscent of a
Figure 3.9 Schematic depiction of dynamic odd-even effect of NILs: odd-NILs cation (left)
move slower than even-NILs (right). Dynamic properties such as translational diffusional
coefficient, residence time and relaxation time showed sensitivity on backbone repeating units
n.
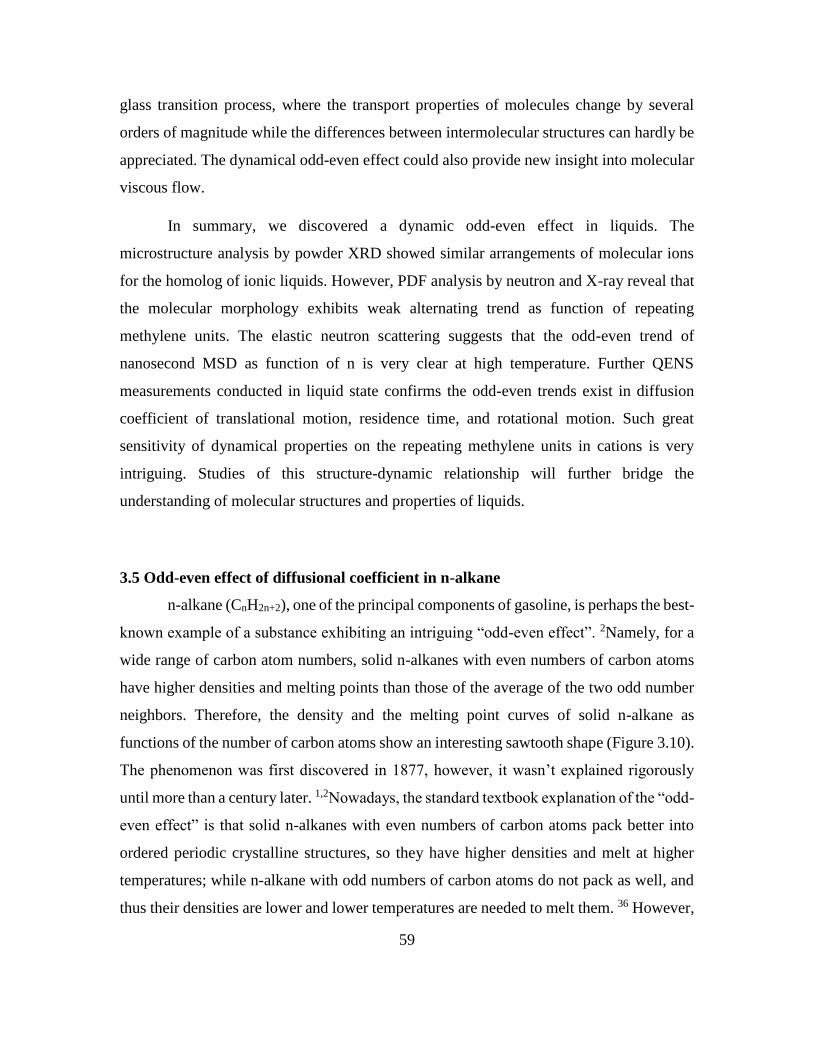
59
glass transition process, where the transport properties of molecules change by several
orders of magnitude while the differences between intermolecular structures can hardly be
appreciated. The dynamical odd-even effect could also provide new insight into molecular
viscous flow.
In summary, we discovered a dynamic odd-even effect in liquids. The
microstructure analysis by powder XRD showed similar arrangements of molecular ions
for the homolog of ionic liquids. However, PDF analysis by neutron and X-ray reveal that
the molecular morphology exhibits weak alternating trend as function of repeating
methylene units. The elastic neutron scattering suggests that the odd-even trend of
nanosecond MSD as function of n is very clear at high temperature. Further QENS
measurements conducted in liquid state confirms the odd-even trends exist in diffusion
coefficient of translational motion, residence time, and rotational motion. Such great
sensitivity of dynamical properties on the repeating methylene units in cations is very
intriguing. Studies of this structure-dynamic relationship will further bridge the
understanding of molecular structures and properties of liquids.
3.5 Odd-even effect of diffusional coefficient in n-alkane
n-alkane (CnH2n+2), one of the principal components of gasoline, is perhaps the best-
known example of a substance exhibiting an intriguing “odd-even effect”. 2Namely, for a
wide range of carbon atom numbers, solid n-alkanes with even numbers of carbon atoms
have higher densities and melting points than those of the average of the two odd number
neighbors. Therefore, the density and the melting point curves of solid n-alkane as
functions of the number of carbon atoms show an interesting sawtooth shape (Figure 3.10).
The phenomenon was first discovered in 1877, however, it wasn’t explained rigorously
until more than a century later. 1,2Nowadays, the standard textbook explanation of the “odd-
even effect” is that solid n-alkanes with even numbers of carbon atoms pack better into
ordered periodic crystalline structures, so they have higher densities and melt at higher
temperatures; while n-alkane with odd numbers of carbon atoms do not pack as well, and
thus their densities are lower and lower temperatures are needed to melt them. 36 However,
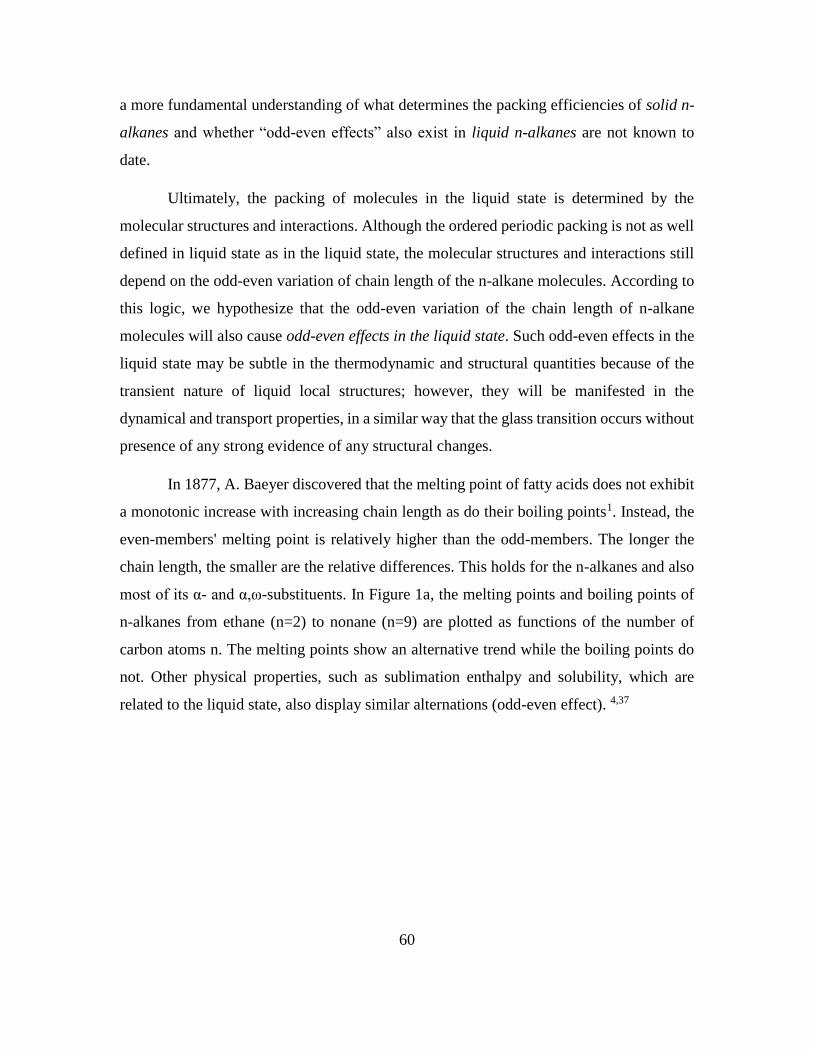
60
a more fundamental understanding of what determines the packing efficiencies of solid n-
alkanes and whether “odd-even effects” also exist in liquid n-alkanes are not known to
date.
Ultimately, the packing of molecules in the liquid state is determined by the
molecular structures and interactions. Although the ordered periodic packing is not as well
defined in liquid state as in the liquid state, the molecular structures and interactions still
depend on the odd-even variation of chain length of the n-alkane molecules. According to
this logic, we hypothesize that the odd-even variation of the chain length of n-alkane
molecules will also cause odd-even effects in the liquid state. Such odd-even effects in the
liquid state may be subtle in the thermodynamic and structural quantities because of the
transient nature of liquid local structures; however, they will be manifested in the
dynamical and transport properties, in a similar way that the glass transition occurs without
presence of any strong evidence of any structural changes.
In 1877, A. Baeyer discovered that the melting point of fatty acids does not exhibit
a monotonic increase with increasing chain length as do their boiling points1. Instead, the
even-members' melting point is relatively higher than the odd-members. The longer the
chain length, the smaller are the relative differences. This holds for the n-alkanes and also
most of its α- and α,ω-substituents. In Figure 1a, the melting points and boiling points of
n-alkanes from ethane (n=2) to nonane (n=9) are plotted as functions of the number of
carbon atoms n. The melting points show an alternative trend while the boiling points do
not. Other physical properties, such as sublimation enthalpy and solubility, which are
related to the liquid state, also display similar alternations (odd-even effect). 4,37
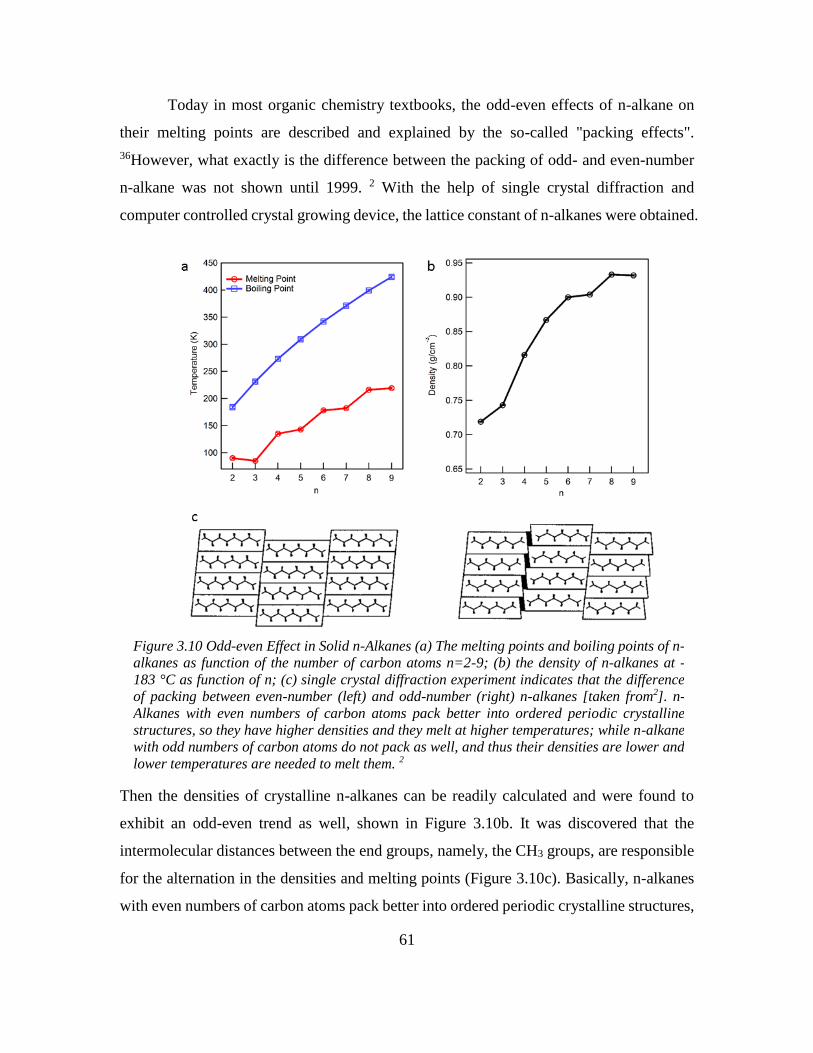
61
Today in most organic chemistry textbooks, the odd-even effects of n-alkane on
their melting points are described and explained by the so-called "packing effects".
36However, what exactly is the difference between the packing of odd- and even-number
n-alkane was not shown until 1999. 2 With the help of single crystal diffraction and
computer controlled crystal growing device, the lattice constant of n-alkanes were obtained.
Then the densities of crystalline n-alkanes can be readily calculated and were found to
exhibit an odd-even trend as well, shown in Figure 3.10b. It was discovered that the
intermolecular distances between the end groups, namely, the CH3 groups, are responsible
for the alternation in the densities and melting points (Figure 3.10c). Basically, n-alkanes
with even numbers of carbon atoms pack better into ordered periodic crystalline structures,
Figure 3.10 Odd-even Effect in Solid n-Alkanes (a) The melting points and boiling points of n-
alkanes as function of the number of carbon atoms n=2-9; (b) the density of n-alkanes at -
183 °C as function of n; (c) single crystal diffraction experiment indicates that the difference
of packing between even-number (left) and odd-number (right) n-alkanes [taken from2]. n-
Alkanes with even numbers of carbon atoms pack better into ordered periodic crystalline
structures, so they have higher densities and they melt at higher temperatures; while n-alkane
with odd numbers of carbon atoms do not pack as well, and thus their densities are lower and
lower temperatures are needed to melt them. 2
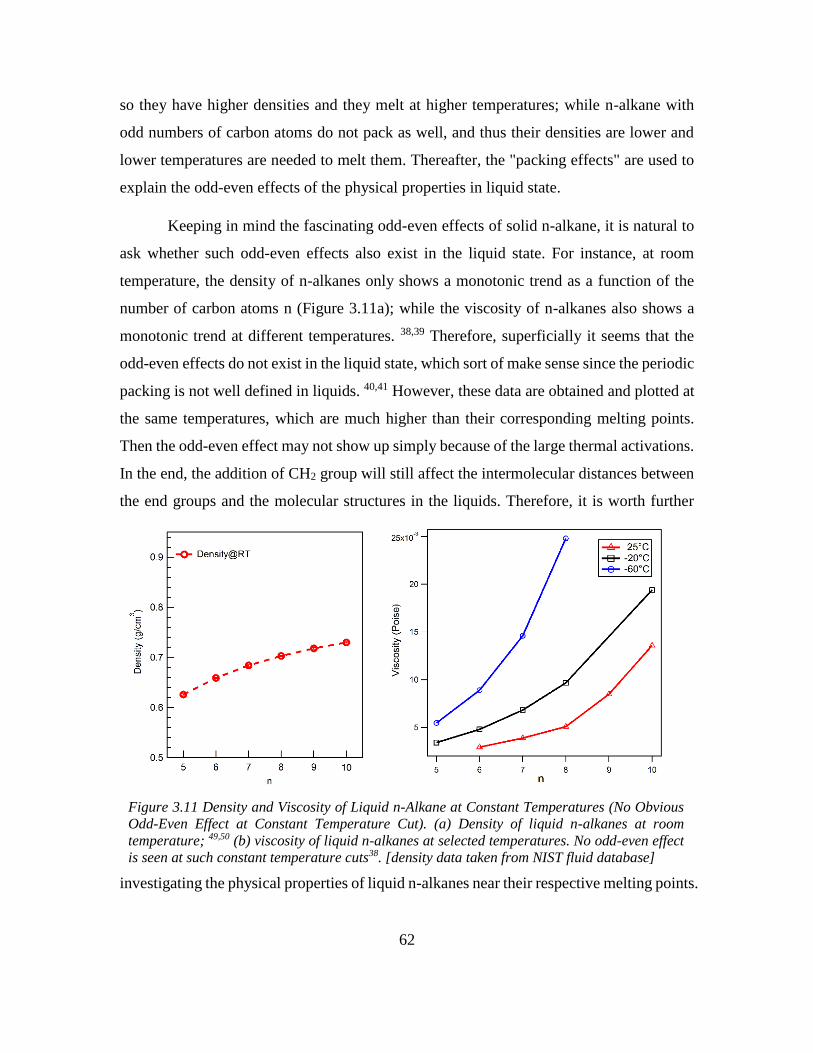
62
so they have higher densities and they melt at higher temperatures; while n-alkane with
odd numbers of carbon atoms do not pack as well, and thus their densities are lower and
lower temperatures are needed to melt them. Thereafter, the "packing effects" are used to
explain the odd-even effects of the physical properties in liquid state.
Keeping in mind the fascinating odd-even effects of solid n-alkane, it is natural to
ask whether such odd-even effects also exist in the liquid state. For instance, at room
temperature, the density of n-alkanes only shows a monotonic trend as a function of the
number of carbon atoms n (Figure 3.11a); while the viscosity of n-alkanes also shows a
monotonic trend at different temperatures. 38,39 Therefore, superficially it seems that the
odd-even effects do not exist in the liquid state, which sort of make sense since the periodic
packing is not well defined in liquids. 40,41 However, these data are obtained and plotted at
the same temperatures, which are much higher than their corresponding melting points.
Then the odd-even effect may not show up simply because of the large thermal activations.
In the end, the addition of CH2 group will still affect the intermolecular distances between
the end groups and the molecular structures in the liquids. Therefore, it is worth further
investigating the physical properties of liquid n-alkanes near their respective melting points.
Figure 3.11 Density and Viscosity of Liquid n-Alkane at Constant Temperatures (No Obvious
Odd-Even Effect at Constant Temperature Cut). (a) Density of liquid n-alkanes at room
temperature; 49,50 (b) viscosity of liquid n-alkanes at selected temperatures. No odd-even effect
is seen at such constant temperature cuts38. [density data taken from NIST fluid database]
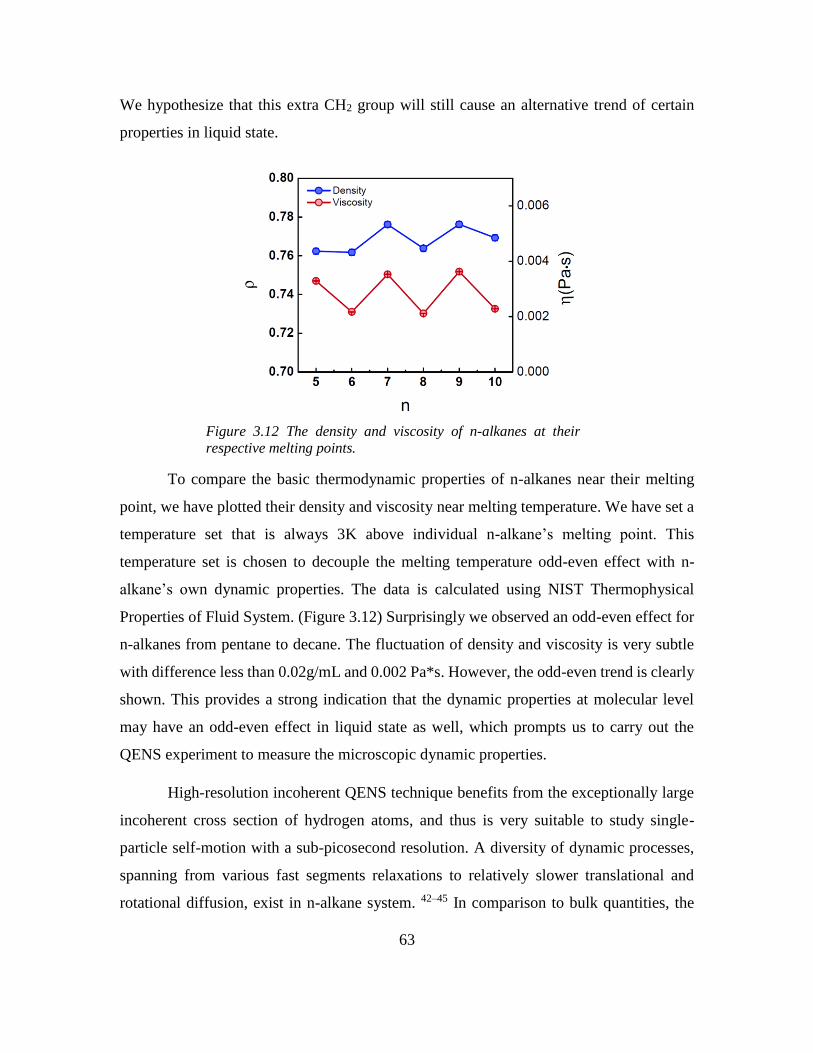
63
We hypothesize that this extra CH2 group will still cause an alternative trend of certain
properties in liquid state.
To compare the basic thermodynamic properties of n-alkanes near their melting
point, we have plotted their density and viscosity near melting temperature. We have set a
temperature set that is always 3K above individual n-alkane’s melting point. This
temperature set is chosen to decouple the melting temperature odd-even effect with n-
alkane’s own dynamic properties. The data is calculated using NIST Thermophysical
Properties of Fluid System. (Figure 3.12) Surprisingly we observed an odd-even effect for
n-alkanes from pentane to decane. The fluctuation of density and viscosity is very subtle
with difference less than 0.02g/mL and 0.002 Pa*s. However, the odd-even trend is clearly
shown. This provides a strong indication that the dynamic properties at molecular level
may have an odd-even effect in liquid state as well, which prompts us to carry out the
QENS experiment to measure the microscopic dynamic properties.
High-resolution incoherent QENS technique benefits from the exceptionally large
incoherent cross section of hydrogen atoms, and thus is very suitable to study single-
particle self-motion with a sub-picosecond resolution. A diversity of dynamic processes,
spanning from various fast segments relaxations to relatively slower translational and
rotational diffusion, exist in n-alkane system. 42–45 In comparison to bulk quantities, the
Figure 3.12 The density and viscosity of n-alkanes at their
respective melting points.
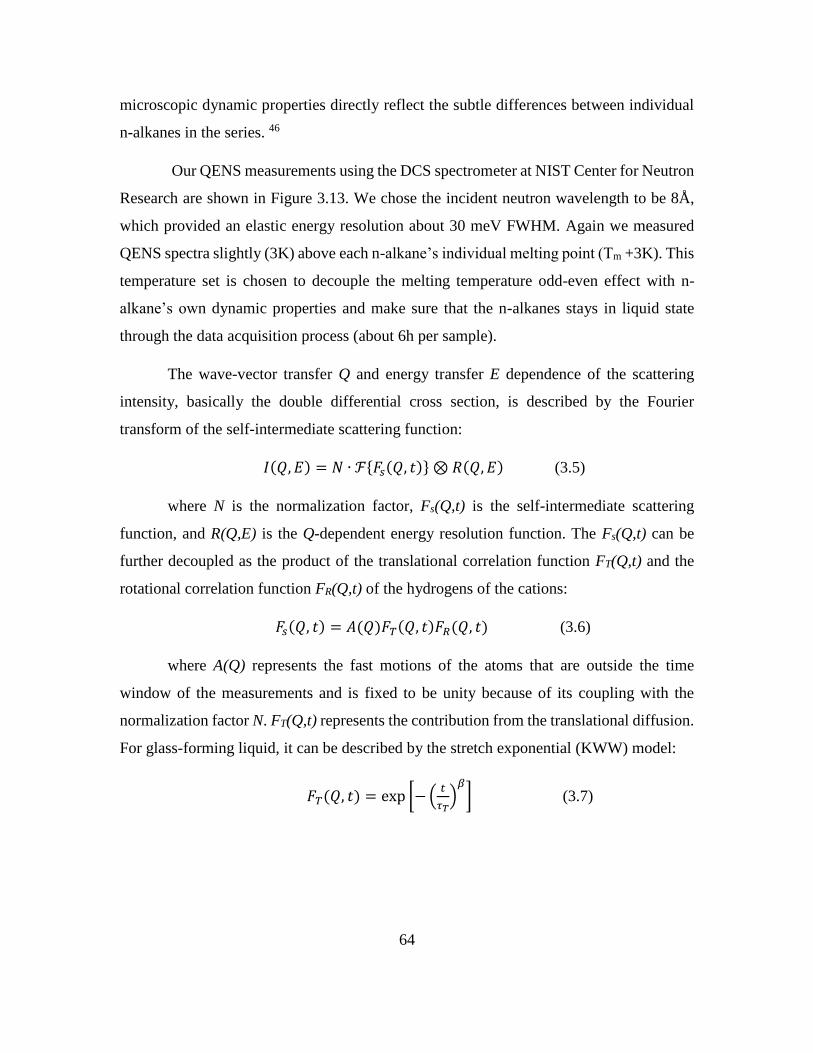
64
microscopic dynamic properties directly reflect the subtle differences between individual
n-alkanes in the series. 46
Our QENS measurements using the DCS spectrometer at NIST Center for Neutron
Research are shown in Figure 3.13. We chose the incident neutron wavelength to be 8Å,
which provided an elastic energy resolution about 30 meV FWHM. Again we measured
QENS spectra slightly (3K) above each n-alkane’s individual melting point (Tm +3K). This
temperature set is chosen to decouple the melting temperature odd-even effect with n-
alkane’s own dynamic properties and make sure that the n-alkanes stays in liquid state
through the data acquisition process (about 6h per sample).
The wave-vector transfer Q and energy transfer E dependence of the scattering
intensity, basically the double differential cross section, is described by the Fourier
transform of the self-intermediate scattering function:
𝐼(𝑄, 𝐸) = 𝑁 ∙ ℱ{𝐹𝑠(𝑄, 𝑡)} ⊗ 𝑅(𝑄, 𝐸) (3.5)
where N is the normalization factor, Fs(Q,t) is the self-intermediate scattering
function, and R(Q,E) is the Q-dependent energy resolution function. The Fs(Q,t) can be
further decoupled as the product of the translational correlation function FT(Q,t) and the
rotational correlation function FR(Q,t) of the hydrogens of the cations:
𝐹𝑠(𝑄, 𝑡) = 𝐴(𝑄)𝐹𝑇(𝑄, 𝑡)𝐹𝑅(𝑄, 𝑡) (3.6)
where A(Q) represents the fast motions of the atoms that are outside the time
window of the measurements and is fixed to be unity because of its coupling with the
normalization factor N. FT(Q,t) represents the contribution from the translational diffusion.
For glass-forming liquid, it can be described by the stretch exponential (KWW) model:
𝐹𝑇(𝑄, 𝑡) = exp [−(𝑡
𝜏𝑇)𝛽
] (3.7)

65
where τT is the relaxation time and β is the stretch exponent.
FR(Q,t) represents the rotational diffusion of a molecule. Its Q and t dependence
can beseparated by the Sears expansion.35 Here we terminate the expansion at the first three
terms because the higher-order terms are negligible in our experimental Q range. Thus, the
expression for FR(Q,t) is as follows:
𝑅(𝑄, 𝑡) = 𝑗02(𝑄𝑎) + 3𝑗1
2(𝑄𝑎) exp [−𝑡
3𝜏𝑅] + 5𝑗2
2(𝑄𝑎)exp[−𝑡
𝜏𝑅] (3.8)
where a stands for the radius of the rotation, τR is the relaxation time associated
with the rotational diffusion, jn(x) are the spherical Bessel functions.
Figure 3.13 Quasi-Elastic Neutron Scattering (QENS) spectra of samples pentane, hexane,
heptane, octane, nonane and decane at three representative Q values. Solid lines represented
the fits with the translational stretched exponential model. The model was able to capture the
key features in the measured QENS spectra in all Q ranges and fit all data remarkably well.
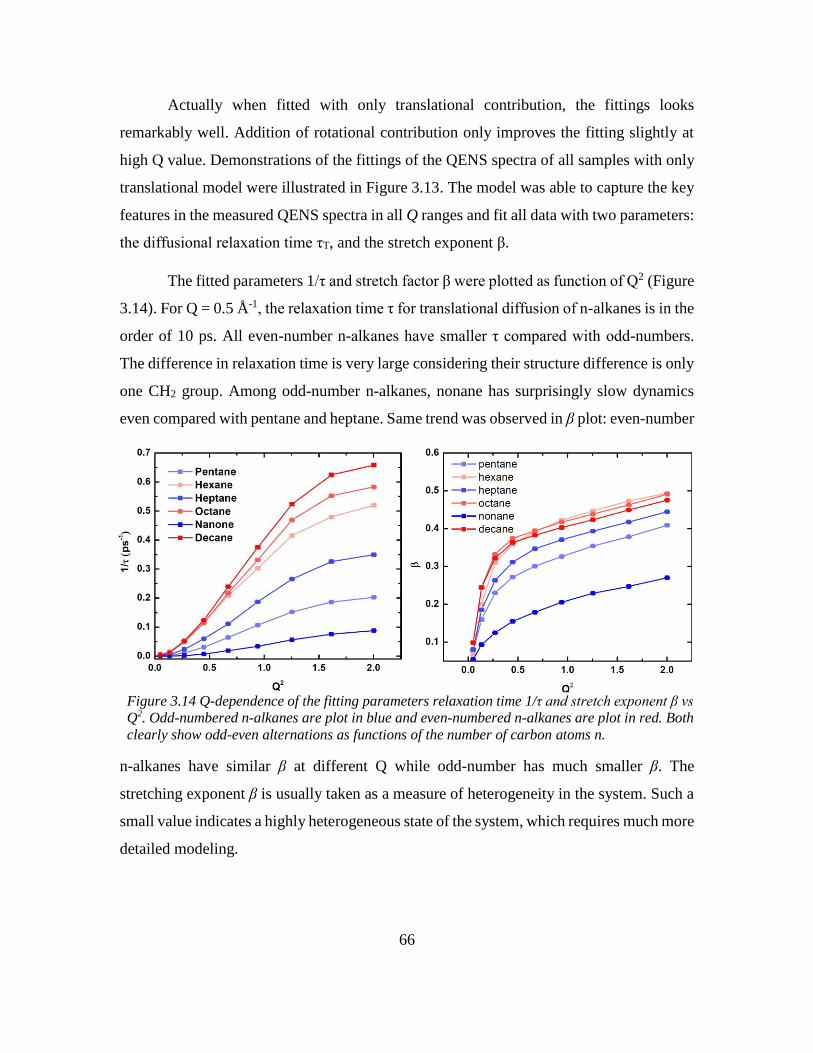
66
Actually when fitted with only translational contribution, the fittings looks
remarkably well. Addition of rotational contribution only improves the fitting slightly at
high Q value. Demonstrations of the fittings of the QENS spectra of all samples with only
translational model were illustrated in Figure 3.13. The model was able to capture the key
features in the measured QENS spectra in all Q ranges and fit all data with two parameters:
the diffusional relaxation time τT, and the stretch exponent β.
The fitted parameters 1/τ and stretch factor β were plotted as function of Q2 (Figure
3.14). For Q = 0.5 Å-1, the relaxation time τ for translational diffusion of n-alkanes is in the
order of 10 ps. All even-number n-alkanes have smaller τ compared with odd-numbers.
The difference in relaxation time is very large considering their structure difference is only
one CH2 group. Among odd-number n-alkanes, nonane has surprisingly slow dynamics
even compared with pentane and heptane. Same trend was observed in β plot: even-number
n-alkanes have similar β at different Q while odd-number has much smaller β. The
stretching exponent β is usually taken as a measure of heterogeneity in the system. Such a
small value indicates a highly heterogeneous state of the system, which requires much more
detailed modeling.
Figure 3.14 Q-dependence of the fitting parameters relaxation time 1/τ and stretch exponent β vs
Q2. Odd-numbered n-alkanes are plot in blue and even-numbered n-alkanes are plot in red. Both
clearly show odd-even alternations as functions of the number of carbon atoms n.
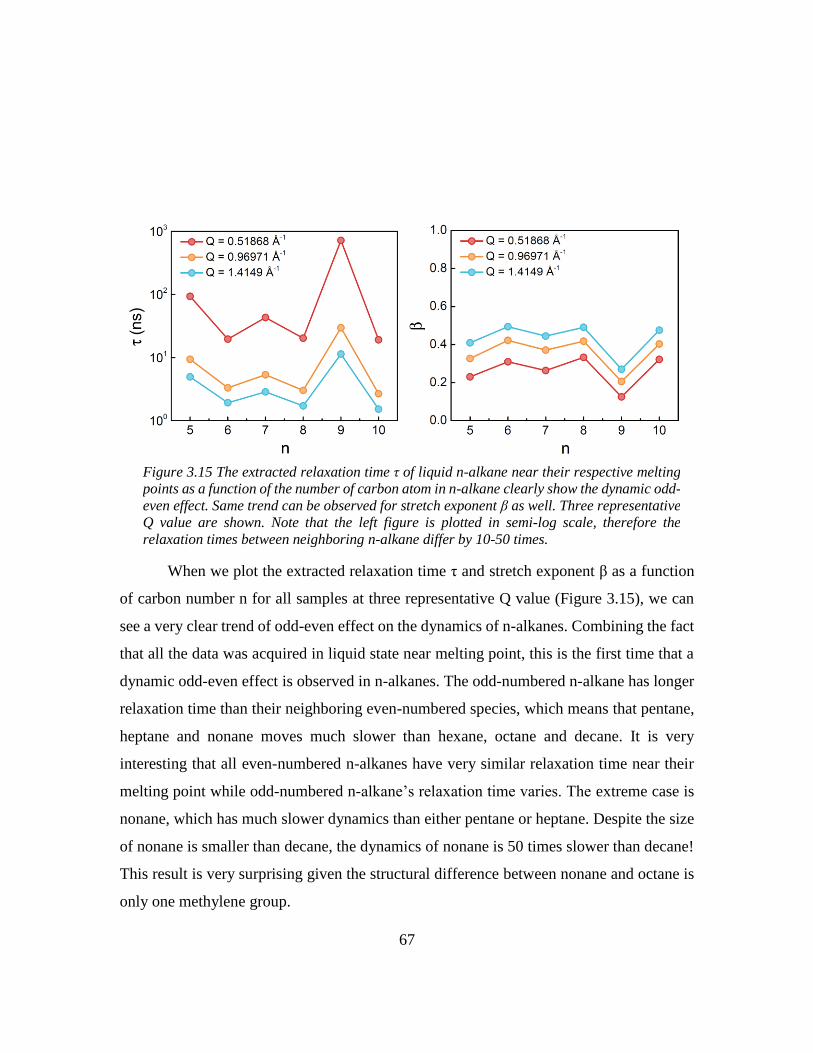
67
When we plot the extracted relaxation time τ and stretch exponent β as a function
of carbon number n for all samples at three representative Q value (Figure 3.15), we can
see a very clear trend of odd-even effect on the dynamics of n-alkanes. Combining the fact
that all the data was acquired in liquid state near melting point, this is the first time that a
dynamic odd-even effect is observed in n-alkanes. The odd-numbered n-alkane has longer
relaxation time than their neighboring even-numbered species, which means that pentane,
heptane and nonane moves much slower than hexane, octane and decane. It is very
interesting that all even-numbered n-alkanes have very similar relaxation time near their
melting point while odd-numbered n-alkane’s relaxation time varies. The extreme case is
nonane, which has much slower dynamics than either pentane or heptane. Despite the size
of nonane is smaller than decane, the dynamics of nonane is 50 times slower than decane!
This result is very surprising given the structural difference between nonane and octane is
only one methylene group.
Figure 3.15 The extracted relaxation time τ of liquid n-alkane near their respective melting
points as a function of the number of carbon atom in n-alkane clearly show the dynamic odd-
even effect. Same trend can be observed for stretch exponent β as well. Three representative
Q value are shown. Note that the left figure is plotted in semi-log scale, therefore the
relaxation times between neighboring n-alkane differ by 10-50 times.

68
The stretch exponent β shows the similar trend as relaxation time. It is worthwhile
to note here that unlike common expectation that n-alkane is far away from a very jammed
system because of its low viscosity, the stretch exponent is pretty low near their melting
point with the all the samples.
3.6 Experimental section
3.6.1 Quasi-elastic neutron scattering (QENS) experiment
The QENS experiment was carried out using the High Flux Back Scattering (HFBS)
instrument at NIST Center for Neutron Scattering (NCNR). Thin layer of samples were
loaded into cylindrical aluminum containers. Helium glove box was used in order to avoid
moisture and enhance heat conductivity. The sample cans were sealed using indium wires.
The sealed sample container was then mounted in a top-loading closed-cycle refrigerator
(CCR) with temperature accuracy better than 0.1 K. The nominal incident neutron
wavelength was 6.271 Å (2.08 meV in energy). The instrument was firstly operated in the
fix-window mode, i.e., the Doppler drive was stopped. In this mode, only the elastically
scattered neutrons were detected. The temperature was continuously ramped up from 15 K
to 363 K with a heating rate of 1 K/min.
After the fix-window scan, the instrument was operated at dynamic-window mode,
where the Doppler drive was operated in such a way to provide an energy transfer range of
±17 μeV, a wave-vector transfer Q range of 0.25-1.75 Å-1. The energy resolution near the
elastic line was about 1 μeV. All quasi-elastic measurements were taken at 360 K, where
all samples were in the liquid phases. Vanadium run was used for detector calibration and
instrument resolution.
The elastic scattering intensity is normalized by the base temperature measurement
at each wave vector transfer Q. The normalized elastic intensity 𝑰𝑻(𝑸, 𝑬 = 𝟎) can be
expanded as a function of Q2:
𝑰𝑻(𝑸, 𝑬 = 𝟎) =𝑰𝑻(𝑸,𝑬=𝟎)
𝑰𝑻𝟎(𝑸,𝑬=𝟎)= 𝐞𝐱𝐩(−⟨𝒙𝟐⟩𝑸𝟐 +
𝟏
𝟐𝜶𝟐(⟨𝒙
𝟐⟩𝑸𝟐)𝟐 +⋯) (3.9)
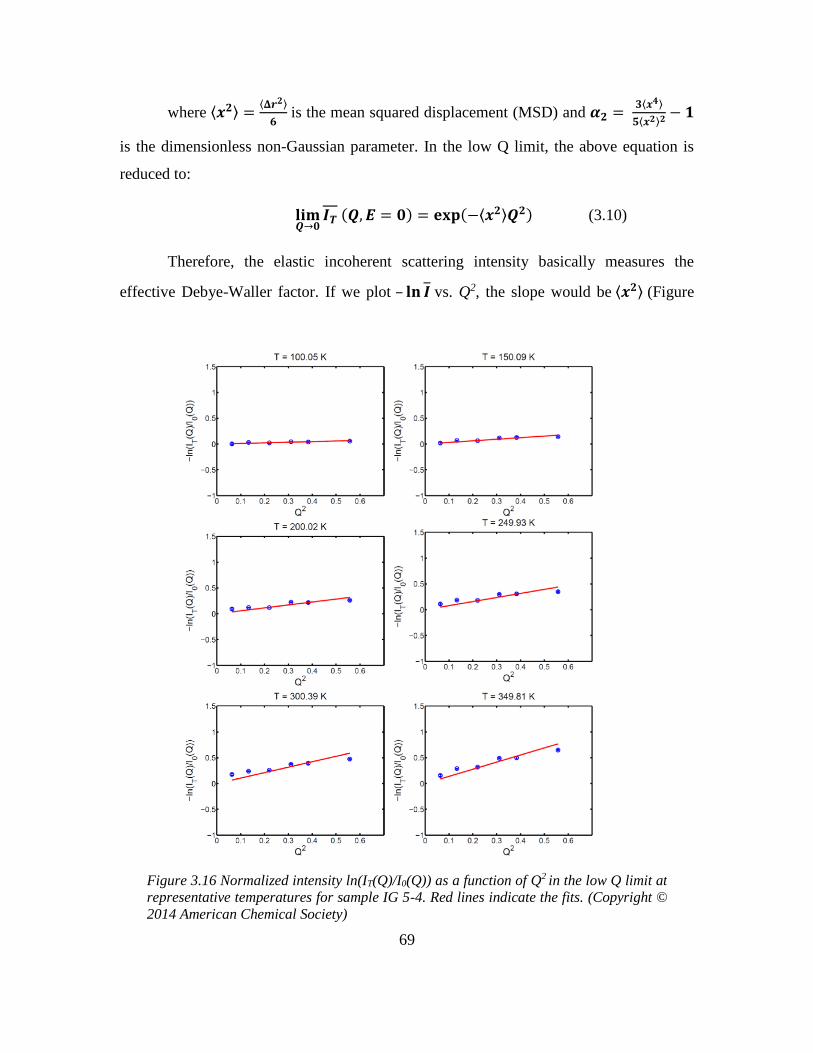
69
where ⟨𝒙𝟐⟩ =⟨𝚫𝒓𝟐⟩
𝟔 is the mean squared displacement (MSD) and 𝜶𝟐 =
𝟑⟨𝒙𝟒⟩
𝟓⟨𝒙𝟐⟩𝟐− 𝟏
is the dimensionless non-Gaussian parameter. In the low Q limit, the above equation is
reduced to:
𝐥𝐢𝐦𝑸→𝟎
𝑰𝑻(𝑸, 𝑬 = 𝟎) = 𝐞𝐱𝐩(−⟨𝒙𝟐⟩𝑸𝟐) (3.10)
Therefore, the elastic incoherent scattering intensity basically measures the
effective Debye-Waller factor. If we plot – 𝐥𝐧 𝑰 vs. Q2, the slope would be⟨𝒙𝟐⟩ (Figure
Figure 3.16 Normalized intensity ln(IT(Q)/I0(Q)) as a function of Q2 in the low Q limit at
representative temperatures for sample IG 5-4. Red lines indicate the fits. (Copyright ©
2014 American Chemical Society)
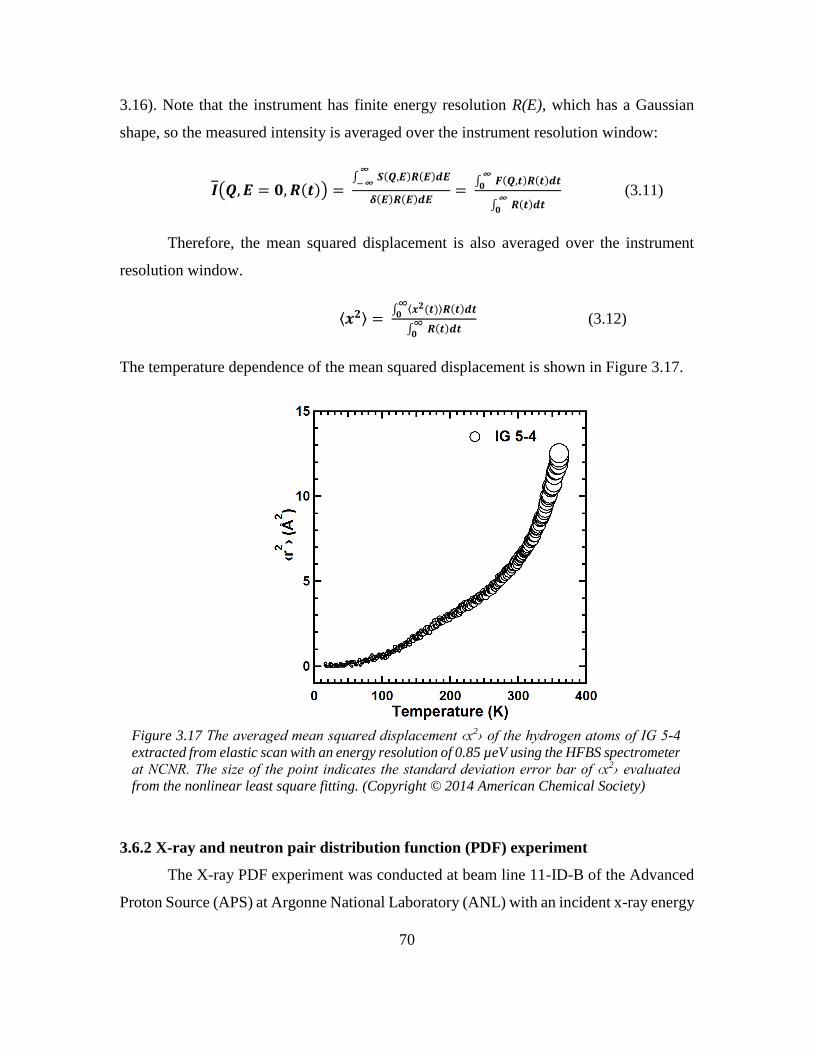
70
3.16). Note that the instrument has finite energy resolution R(E), which has a Gaussian
shape, so the measured intensity is averaged over the instrument resolution window:
𝑰(𝑸,𝑬 = 𝟎,𝑹(𝒕)) = ∫ 𝑺(𝑸,𝑬)𝑹(𝑬)𝒅𝑬∞
−∞
𝜹(𝑬)𝑹(𝑬)𝒅𝑬=
∫ 𝑭(𝑸,𝒕)𝑹(𝒕)𝒅𝒕∞𝟎
∫ 𝑹(𝒕)𝒅𝒕∞𝟎
(3.11)
Therefore, the mean squared displacement is also averaged over the instrument
resolution window.
⟨𝒙𝟐⟩ = ∫ ⟨𝒙𝟐(𝒕)⟩𝑹(𝒕)𝒅𝒕∞𝟎
∫ 𝑹(𝒕)𝒅𝒕∞𝟎
(3.12)
The temperature dependence of the mean squared displacement is shown in Figure 3.17.
3.6.2 X-ray and neutron pair distribution function (PDF) experiment
The X-ray PDF experiment was conducted at beam line 11-ID-B of the Advanced
Proton Source (APS) at Argonne National Laboratory (ANL) with an incident x-ray energy
Figure 3.17 The averaged mean squared displacement ‹x2› of the hydrogen atoms of IG 5-4
extracted from elastic scan with an energy resolution of 0.85 µeV using the HFBS spectrometer
at NCNR. The size of the point indicates the standard deviation error bar of ‹x2› evaluated
from the nonlinear least square fitting. (Copyright © 2014 American Chemical Society)

71
of 58.66 keV. The samples were settled inside Kapton capillaries and sealed with epoxy.
The samples were aligned both in horizontal and vertical directions within the X-ray beam.
The measurements were carried out at room temperature in ambient conditions. The
scattering structure factor, with corrections for background scattering, X-ray transmission,
and Compton scattering, was obtained from the diffraction data using the PDFgetX2
software package. 47
The neutron PDF experiment was conducted at the Nanoscale-ordered Materials
Diffractometer (NOMAD) beam line of the Spallation Neutron Source (SNS) at Oak Ridge
National Laboratory (ORNL).48 Deuterated samples were used to reduce the incoherent
scattering from hydrogen. The samples were sealed inside 3mm quartz capillaries. The
room temperature measurement took about 0.5 h to obtain high resolution PDF.
3.7 References
(1) Baeyer, A. Ber. Dtsch. Chem. Ges 1877, 10, 1286–1288.
(2) Boese, R.; Weiss, H.; Blaser, D. Angew. Chem. Int. Ed. 1999, 38, 988–992.
(3) Morishige, K.; Kato, T. J. Chem. Phys. 1999, 111, 7095.
(4) Badea, E.; Gatta, G. Della; D’Angelo, D.; Brunetti, B.; Rečková, Z. J. Chem.
Thermodyn. 2006, 38, 1546–1552.
(5) Mukherjee, G.; Biradha, K. Cryst. Growth Des. 2011, 11, 924–929.
(6) Jeong, Y. G.; Jo, W. H.; Lee, S. C. Polymer (Guildf). 2004, 45, 3321–3328.
(7) Shiotani, A.; Kohda, M. J. Appl. Polym. Sci. 1999, 74, 2404–2413.
(8) Tao, F.; Bernasek, S. L. Chem. Rev. 2007, 107, 1408–1453.
(9) Craig, A. a.; Imrie, C. T. Macromolecules 1999, 32, 6215–6220.
(10) Mary, L. J. F.; Kannan, P. J. Polym. Sci., Part A Polym. Chem 1999, 37, 1755–1761.
(11) Debenedetti, P. G.; Stillinger, F. H. Nature 2001, 410, 259–267.
72
(12) Chandler, D. Proc. Natl. Acad. 2009, 106, 15111–15112.
(13) Angell, C. A. Science 1995, 267, 1924–1935.
(14) Hägele, C.; Wuckert, E.; Laschat, S.; Giesselmann, F. Chemphyschem 2009, 10,
1291–1298.
(15) Wolfgang Doster, Stephen Cusack, W. P. Nature 1989, 337, 754–756.
(16) Chen, F.-L.; Jamieson, A. M. Macromolecules 1993, 26, 6576–6582.
(17) Buchecker, R.; Schadt, M. Mol. Cryst. Liq. Cryst. 1987, 149, 359–373.
(18) Bock, F.-J.; Kneppe, H.; Schneider, F. Liq. Cryst. 1986, 1, 239–251.
(19) Capar, M.; Cebe, E. Phys. Rev. E 2006, 73, 061711.
(20) Rocha, M. A. A.; Neves, C. M. S. S.; Freire, M. G.; Russina, O.; Triolo, A.; Coutinho,
J. A. P. C.; Santos, L. M. N. B. F. J. Phys. Chem. B 2013, 117, 10889–10897.
(21) Martins, M. A. R.; Neves, C. M. S. S.; Kurnia, K. A.; Carvalho, P. J.; Rocha, M. A.
A.; Santos, L. M. N. B. F.; Pinho, S. P.; Freire, M. G. Fluid Phase Equilib. 2015,
407, 188–196.
(22) Leys, J.; Wübbenhorst, M.; Preethy Menon, C.; Rajesh, R.; Thoen, J.; Glorieux, C.;
Nockemann, P.; Thijs, B.; Binnemans, K.; Longuemart, S. J. Chem. Phys. 2008, 128,
064509.
(23) Zheng, W.; Mohammed, A.; Hines, L. G.; Xiao, D.; Martinez, O. J.; Bartsch, R. A.;
Simon, S. L.; Russina, O.; Triolo, A.; Quitevis, E. L. J. Phys. Chem. B 2011, 115,
6572–6584.
(24) Rocha, M. A. A.; Coutinho, J. A. P.; Santos, L. M. N. B. F. J. Chem. Phys. 2013,
139, 104502.
(25) Vilas, M.; Rocha, M. A. A.; Fernandes, A. M.; Tojo, E.; Santos, L. M. N. B. F. Phys.
Chem. Chem. Phys. 2015, 17, 2560–2572.
(26) Almeida, H. F. D.; Freire, M. G.; Fernandes, A. M.; Lopes-da-Silva, J. A.; Morgado,
73
P.; Shimizu, K.; Filipe, E. J. M.; Canongia Lopes, J. N.; Santos, L. M. N. B. F. L.
M. N. B. F.; Coutinho, J. A. P. Langmuir 2014, 30, 6408–6418.
(27) Rocha, M. A. A.; Lima, C. F. R. A. C.; Gomes, L. R.; Schröder, B.; Coutinho, J. A.
P.; Marrucho, I. M.; Esperança, J. M. S. S.; Rebelo, L. P. N.; Shimizu, K.; Lopes, J.
N. C.; Santos, L. M. N. B. F. J. Phys. Chem. B 2011, 115, 10919–10926.
(28) Dupont, J. J. Braz. Chem. Soc. 2004, 15, 341–350.
(29) Consorti, C. S.; Suarez, P. A. Z.; De Souza, R. F.; Burrow, R. A.; Farrar, D. H.;
Lough, A. J.; Loh, W.; Da Suva, L. H. M.; Dupont, J. J. Phys. Chem. B 2005, 109,
4341–4349.
(30) Wathier, M.; Grinstaff, M. W. J. Am. Chem. Soc. 2008, 130, 9648–9649.
(31) Aboudzadeh, M. A.; Muñoz, M. E.; Santamaría, A.; Fernández-Berridi, M. J.; Irusta,
L.; Mecerreyes, D. Macromolecules 2012, 45, 7599–7606.
(32) Yang, K.; Tyagi, M.; Moore, J. S.; Zhang, Y. J. Am. Chem. Soc. 2014, 136, 1268–
1271.
(33) Meyer, A.; Dimeo, R. M.; Gehring, P. M.; Neumann, D. A. Rev. Sci. Instrum. 2003,
74, 2759–2777.
(34) Singwi, K. S.; Sjölander, A. Phys. Rev. 1960, 119, 863–871.
(35) Sears, V. F. Can. J. Phys. 1967, 45, 237–254.
(36) Wade, L. G. Organic Chemistry; Prentice Hall, 2012.
(37) Rocha, M. a a; Coutinho, J. a P.; Santos, L. M. N. B. F. J. Phys. Chem. B 2012, 116,
10922–10927.
(38) Hirst, L. L.; Corporation, M. Ind. Eng. Chem. 1949, 41, 2067–2069.
(39) Yoo, C. Do; Kim, S.; Lee, S. H. 2008, 29, 1059–1062.
(40) Eyring, H. J. Chem. Phys. 1936, 4, 283.
74
(41) Kauzmann, W.; Eyring, H. J. Am. Chem. Soc. 1940, 62, 3113–3125.
(42) Kowert, B. A.; Sobush, K. T.; Fuqua, C. F.; Mapes, C. L.; Jones, J. B.; Zahm, J. A.
2003, 4790–4795.
(43) von Meerwall, E.; Beckman, S.; Jang, J.; Mattice, W. L. J. Chem. Phys. 1998, 108,
4299.
(44) Feng, H.; Gao, W.; Nie, J.; Wang, J.; Chen, X.; Chen, L.; Liu, X.; Lüdemann, H.-
D.; Sun, Z. J. Mol. Model. 2013, 19, 73–82.
(45) Morhenn, H.; Busch, S.; Unruh, T. J. Phys. Condens. Matter 2012, 24, 375108.
(46) Yu, Y.; Gao, G. 2000.
(47) Qiu, X.; Thompson, J. W.; Billinge, S. J. L. J. Appl. Cryst. 2004, 37, 678.
(48) Neuefeind, J.; Feygenson, M.; Carruth, J.; Hoffmann, R.; Chipley, K. K. Nucl.
Instruments Methods Phys. Res. B 2012, 287, 68–75.
(49) Span, R. Multiparameter Equations of State - An Accurate Source of
Thermodynamic Property Data; Springer, Berlin, 2000.
(50) Starling, K. E. Fluid Thermodynamic Properties for Light Petroleum Systems; Gulf
Publishing Company, Houston, Texas, 1973.
75
CHAPTER 4
APPLICATION OF NETWORK-FORMING IONIC LIQUIDS IN
SHOCKWAVE ABSORPTION APPLICATION
4.1 Abstract
Understanding shockwave-induced physical and chemical changes of impact-
absorbing materials is an important step toward the rational design of materials that
mitigate the damage. In this work, we report a series of network-forming ionic liquids
(NILs) that possess an intriguing shockwave absorption property upon laser-induced
shockwave. Microstructure analysis by X-ray scattering suggests nano-segregation of alkyl
side chains and charged head groups in NILs. Further post-shock observations indicate
changes in the low Q region implying that the soft alkyl domain in NIL plays an important
role in absorbing shockwaves. Interestingly, we observe a shock-induced ordering in the
NIL with longest hexyl side chain, indicating that both nano-segregated structure and
shock-induced ordering contribute to NIL’s shockwave absorption performance.
4.2 Introduction
Shockwave dissipation materials function to protect personnel and structures from
blast overpressure. During shockwave propagation, the brain is especially susceptible to
shockwave overpressure. Previous studies have revealed that when brain tissues are
exposed to high-intensity shockwaves greater than 10 MPa, severe hemorrhage is possible.
Exposure to low-intensity shockwaves less than 1MPa also cause minor morphological
changes in neurons, leading to mild-to-moderate traumatic brain injury (mTBI).1 The
human resourse loss from mTBI have significant direct economic impact and indirect costs
due to loss of earning ability and the burden of care.2 Therefore, there are urgent needs to
develop materials that effectively absorb low-intensity shockwaves.
76
Polyurea (PU) is the benchmark material that exhibits effective shockwave
absorption properties. In spite of more than 5 years of study, the mechanism by which
polyurea absorbs shockwave is still under debate.3–5 Both experimental data and
computational models (mesoscale, all-atom, and coarse-grained molecular level) have
offered insights into polyurea’s shockwave attenuation capability.6–8 Roland et al.
suggested that hydrogen bond-abundant, hard domains of PU have a small or negligible
role in shockwave absorption.9 Grujicic et al. confirmed that the impact-induced, rubbery-
to-glassy transition acts as a potent ballistic-resistance-enhancing but not a shock-
mitigating mechanism.10 In addition, Grujicic et al. stated that the shock-induced hydrogen
bond breaking in hard domains plays an important role in the shock-impact mitigation
capacity of polyurea.6 They also proposed shockwave induced ordering within the hard
domains and viscoelastic relaxation within the hard/soft interfacial regions as another
mechanism for reducing shock impact.11 Even though an explicit shockwave absorption
mechanism is absent, both groups along with other researchers reached the agreement that
the micro-phase segregation in polyurea plays an important role for the high shockwave
absorption performance.
Similar to the micro-phase segregation observed in polyurea, amphiphilic ionic
liquids with alkyl tails also display structural heterogeneities on the nanometer spatial scale
that may serve as an effective candidate for shockwave energy dissipation.12–17 Evidence
from both computer simulation and neutron/X-ray diffraction suggested that the alkyl
chains in ionic liquids pack into a "soft, oily" matrix while the charged head groups tend
to segregate into "hard" domains.18,19 Recently, Yang et al. studied a class of network-
forming ionic liquids (NIL), which are composed of alkyl-diammonium cations and citrate
anions.20 The long alkyl side chains of cations are used to frustrate the crystallization so
that amorphous glassy solids form upon cooling. Peaks in the low Q (Q ≈ 0.4-0.7 Å-1)
regime, corresponding to the nanometer spatial scale, provide the signature of structural
heterogeneities in NILs.
77
4.3 Comparison of shockwave absorption performance between polyurea and
network-forming ionic liquids
Laser induced stress waves are used to characterize the shockwave absorption
property of NILs. Shockwaves are generated by impingement of a high-energy Nd:YAG
pulsed laser on a 400 nm thick Al energy absorbing layer 21–26. Transfer of energy from
the laser pulse leads to rapid expansion of the Al layer. The presence of the confining layer
on top of the Al film causes a high amplitude compressive shock wave to propagate through
the specimen. The YAG laser power and beam diameter were varied to systematically
control the input laser fluence. The out of plane displacement of the specimen surface was
measured using a Michelson interferometer with a 532 nm laser diagnostic beam. A
photodetector connected with 40GHz oscilloscope recorded the interference signal, which
was converted to displacement and velocity history (as described previously by Wang et
al).21 The pressure profile, P(t), was obtained from velocity history using conservation of
momentum,
𝑃(𝑡) = 𝜌0(𝑈𝑠(𝑡)) ∗ 𝑈𝑝(𝑡) = 𝜌0 (𝑠 + 𝑐𝑈𝑝(𝑡)) ∗ 𝑈𝑝(𝑡) (4.1)
where 𝜌0 is initial material density, and 𝑈𝑝(𝑡) is particle velocity0 which is obtained from
the measurement. Shock velocity, 𝑈𝑠(𝑡), is given by 𝑠 + 𝑐𝑈𝑝(𝑡) where 𝑠 and 𝑐 are fitted
parameters from 𝑈𝑠 - 𝑈𝑝 Hugoniot of the aluminum substrate. The energy per area, i.e.
total transmitted energy, was calculated from the velocity history using conservation of
energy and momentum,
𝐽(𝑡) = 1
2𝜌0 ∫ (𝑈𝑝(𝑡))
2
∗𝑡
0(𝑠 + 𝑐𝑈𝑝(𝑡)) 𝑑𝑡 (4.2)
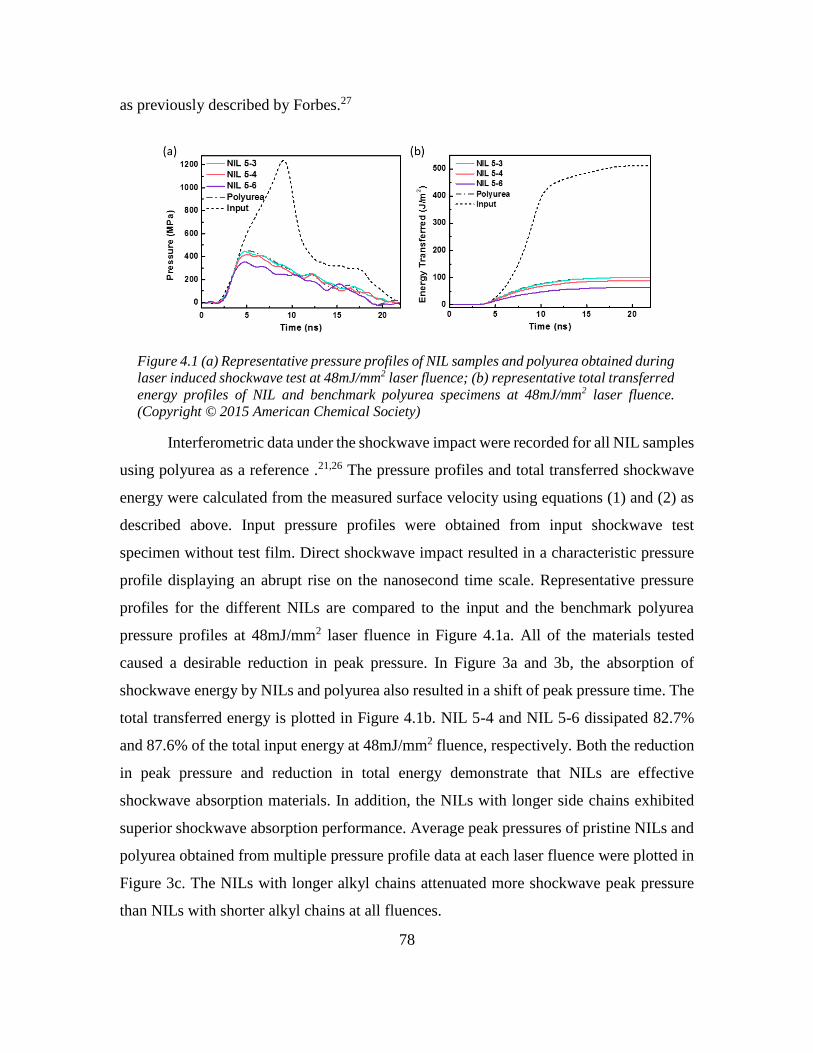
78
as previously described by Forbes.27
Interferometric data under the shockwave impact were recorded for all NIL samples
using polyurea as a reference .21,26 The pressure profiles and total transferred shockwave
energy were calculated from the measured surface velocity using equations (1) and (2) as
described above. Input pressure profiles were obtained from input shockwave test
specimen without test film. Direct shockwave impact resulted in a characteristic pressure
profile displaying an abrupt rise on the nanosecond time scale. Representative pressure
profiles for the different NILs are compared to the input and the benchmark polyurea
pressure profiles at 48mJ/mm2 laser fluence in Figure 4.1a. All of the materials tested
caused a desirable reduction in peak pressure. In Figure 3a and 3b, the absorption of
shockwave energy by NILs and polyurea also resulted in a shift of peak pressure time. The
total transferred energy is plotted in Figure 4.1b. NIL 5-4 and NIL 5-6 dissipated 82.7%
and 87.6% of the total input energy at 48mJ/mm2 fluence, respectively. Both the reduction
in peak pressure and reduction in total energy demonstrate that NILs are effective
shockwave absorption materials. In addition, the NILs with longer side chains exhibited
superior shockwave absorption performance. Average peak pressures of pristine NILs and
polyurea obtained from multiple pressure profile data at each laser fluence were plotted in
Figure 3c. The NILs with longer alkyl chains attenuated more shockwave peak pressure
than NILs with shorter alkyl chains at all fluences.
Figure 4.1 (a) Representative pressure profiles of NIL samples and polyurea obtained during
laser induced shockwave test at 48mJ/mm2 laser fluence; (b) representative total transferred
energy profiles of NIL and benchmark polyurea specimens at 48mJ/mm2 laser fluence.
(Copyright © 2015 American Chemical Society)
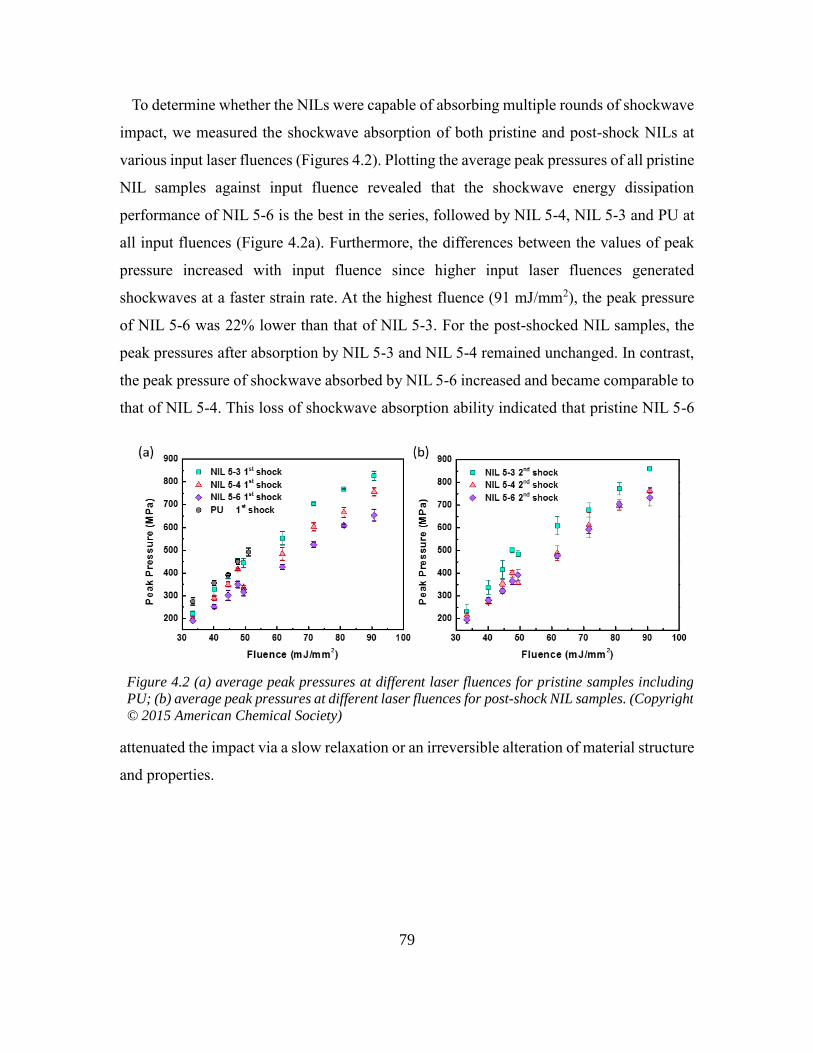
79
To determine whether the NILs were capable of absorbing multiple rounds of shockwave
impact, we measured the shockwave absorption of both pristine and post-shock NILs at
various input laser fluences (Figures 4.2). Plotting the average peak pressures of all pristine
NIL samples against input fluence revealed that the shockwave energy dissipation
performance of NIL 5-6 is the best in the series, followed by NIL 5-4, NIL 5-3 and PU at
all input fluences (Figure 4.2a). Furthermore, the differences between the values of peak
pressure increased with input fluence since higher input laser fluences generated
shockwaves at a faster strain rate. At the highest fluence (91 mJ/mm2), the peak pressure
of NIL 5-6 was 22% lower than that of NIL 5-3. For the post-shocked NIL samples, the
peak pressures after absorption by NIL 5-3 and NIL 5-4 remained unchanged. In contrast,
the peak pressure of shockwave absorbed by NIL 5-6 increased and became comparable to
that of NIL 5-4. This loss of shockwave absorption ability indicated that pristine NIL 5-6
attenuated the impact via a slow relaxation or an irreversible alteration of material structure
and properties.
Figure 4.2 (a) average peak pressures at different laser fluences for pristine samples including
PU; (b) average peak pressures at different laser fluences for post-shock NIL samples. (Copyright
© 2015 American Chemical Society)
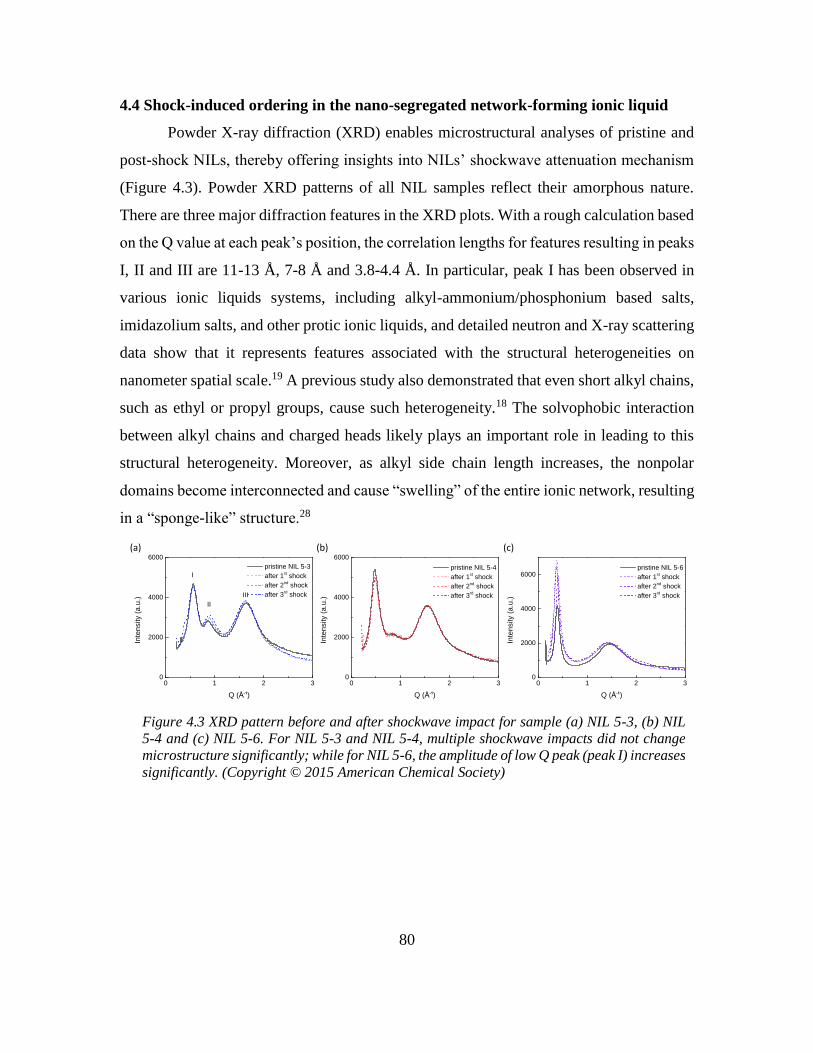
80
4.4 Shock-induced ordering in the nano-segregated network-forming ionic liquid
Powder X-ray diffraction (XRD) enables microstructural analyses of pristine and
post-shock NILs, thereby offering insights into NILs’ shockwave attenuation mechanism
(Figure 4.3). Powder XRD patterns of all NIL samples reflect their amorphous nature.
There are three major diffraction features in the XRD plots. With a rough calculation based
on the Q value at each peak’s position, the correlation lengths for features resulting in peaks
I, II and III are 11-13 Å, 7-8 Å and 3.8-4.4 Å. In particular, peak I has been observed in
various ionic liquids systems, including alkyl-ammonium/phosphonium based salts,
imidazolium salts, and other protic ionic liquids, and detailed neutron and X-ray scattering
data show that it represents features associated with the structural heterogeneities on
nanometer spatial scale.19 A previous study also demonstrated that even short alkyl chains,
such as ethyl or propyl groups, cause such heterogeneity.18 The solvophobic interaction
between alkyl chains and charged heads likely plays an important role in leading to this
structural heterogeneity. Moreover, as alkyl side chain length increases, the nonpolar
domains become interconnected and cause “swelling” of the entire ionic network, resulting
in a “sponge-like” structure.28
0 1 2 30
2000
4000
6000
II
III
Inte
nsity (
a.u
.)
Q (Å-1)
pristine NIL 5-3
after 1st shock
after 2nd
shock
after 3rd shock
I
0 1 2 30
2000
4000
6000
Inte
nsity (
a.u
.)
Q (Å-1)
pristine NIL 5-4
after 1st shock
after 2nd
shock
after 3rd shock
0 1 2 30
2000
4000
6000
Inte
nsity (
a.u
.)
Q (Å-1)
pristine NIL 5-6
after 1st shock
after 2nd
shock
after 3rd shock
(a) (b) (c)
Figure 4.3 XRD pattern before and after shockwave impact for sample (a) NIL 5-3, (b) NIL
5-4 and (c) NIL 5-6. For NIL 5-3 and NIL 5-4, multiple shockwave impacts did not change
microstructure significantly; while for NIL 5-6, the amplitude of low Q peak (peak I) increases
significantly. (Copyright © 2015 American Chemical Society)
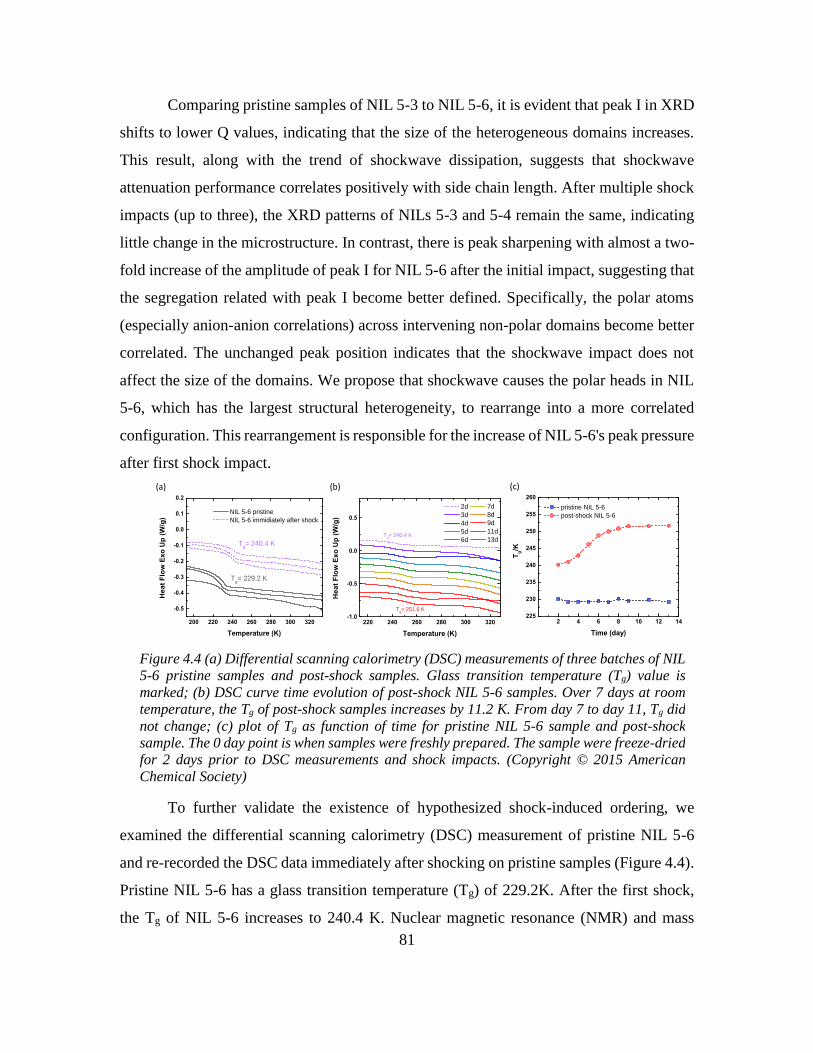
81
Comparing pristine samples of NIL 5-3 to NIL 5-6, it is evident that peak I in XRD
shifts to lower Q values, indicating that the size of the heterogeneous domains increases.
This result, along with the trend of shockwave dissipation, suggests that shockwave
attenuation performance correlates positively with side chain length. After multiple shock
impacts (up to three), the XRD patterns of NILs 5-3 and 5-4 remain the same, indicating
little change in the microstructure. In contrast, there is peak sharpening with almost a two-
fold increase of the amplitude of peak I for NIL 5-6 after the initial impact, suggesting that
the segregation related with peak I become better defined. Specifically, the polar atoms
(especially anion-anion correlations) across intervening non-polar domains become better
correlated. The unchanged peak position indicates that the shockwave impact does not
affect the size of the domains. We propose that shockwave causes the polar heads in NIL
5-6, which has the largest structural heterogeneity, to rearrange into a more correlated
configuration. This rearrangement is responsible for the increase of NIL 5-6's peak pressure
after first shock impact.
To further validate the existence of hypothesized shock-induced ordering, we
examined the differential scanning calorimetry (DSC) measurement of pristine NIL 5-6
and re-recorded the DSC data immediately after shocking on pristine samples (Figure 4.4).
Pristine NIL 5-6 has a glass transition temperature (Tg) of 229.2K. After the first shock,
the Tg of NIL 5-6 increases to 240.4 K. Nuclear magnetic resonance (NMR) and mass
200 220 240 260 280 300 320
-0.5
-0.4
-0.3
-0.2
-0.1
0.0
0.1
0.2
Tg= 240.4 K
NIL 5-6 pristine
NIL 5-6 immidiately after shock
Hea
t F
low
Ex
o U
p (
W/g
)
Temperature (K)
Tg= 229.2 K
(a) (b)
2 4 6 8 10 12 14225
230
235
240
245
250
255
260
Tg/K
Time (day)
pristine NIL 5-6
post-shock NIL 5-6
(c)
220 240 260 280 300 320-1.0
-0.5
0.0
0.5
Tg= 251.6 K
7d
8d
9d
11d
13d
2d
3d
4d
5d
6d
Hea
t F
low
Ex
o U
p (
W/g
)
Temperature (K)
Tg= 240.4 K
Figure 4.4 (a) Differential scanning calorimetry (DSC) measurements of three batches of NIL
5-6 pristine samples and post-shock samples. Glass transition temperature (Tg) value is
marked; (b) DSC curve time evolution of post-shock NIL 5-6 samples. Over 7 days at room
temperature, the Tg of post-shock samples increases by 11.2 K. From day 7 to day 11, Tg did
not change; (c) plot of Tg as function of time for pristine NIL 5-6 sample and post-shock
sample. The 0 day point is when samples were freshly prepared. The sample were freeze-dried
for 2 days prior to DSC measurements and shock impacts. (Copyright © 2015 American
Chemical Society)
82
spectrometry on post-shock sample ruled out the possibility of any shock-induced chemical
changes. These results are consistent with our hypothesis of the shock-induced ordering in
the heterogeneous domain. The 11.2 K increase of Tg may be due to the extra spatial
hindrance from more ordered heterogeneous domain. To examine whether this
rearrangement relaxes after shockwave impact, we kept the post-shock NIL 5-6 sample at
room temperature and recorded the DSC curves time evolution of post-shock sample over
a period of 11 days. The Tg of NIL 5-6 increased by another 11.2 K over 7 days and reached
a stable value of 251.6K. This result indicates that the ordering process continues for days
even after the shockwave impacts. The relaxing dynamics is rather slow due to high
viscosity of NILs at room temperature. For comparison, the Tg of pristine NIL 5-6 is rather
stable for months at room temperature.
The energy landscape theory of amorphous materials provides a viewpoint to
qualitatively explain our observations. We hypothesize that the spatial correlation of polar
heads and non-polar alkyl chains can potentially be rearranged by overcoming an energy
barrier. Similar effects have been observed under high hydrostatic pressures. For example,
high pressure can cause configurational changes in the alkyl groups of imidazolium ionic
liquids.29,30 Apparently, NIL with longer alkyl chains such as NIL 5-6 is easier to
reorganize because of less restriction from the charged head group. The major structural
change occurs at the first shock impact because the more correlated conformation are more
stable. We also hypothesize that the molecular conformation does not reach local energy
minimum immediately after the shockwave impacts, so the ordering processes slowly
continues over time. To the best of our knowledge, this is the first time that shock-induced
ordering in the liquid phase has been observed. With higher shockwave energy, further
configurational changes of NIL along its energy landscape may occur, including possible
formation of a crystal or ideal glass.
Combining these findings with the multiple shock experiments, the relationship of
the microstructures of NILs and their shockwave absorption performances is evident. In
NIL 5-3 and 5-4, the microstructure and shockwave absorption performance do not change
through multiple shocks. In NIL 5-6, subsequent shockwave absorption performance is
83
reduced by irreversible shock-induced structural evolution and ordering in nano-segregated
domains from the first shockwave impact. We conclude that the observed shock-induced
ordering contributes to the better shockwave absorption performance in the initial shock of
NIL 5-6. Thus, at least two mechanisms of shockwave absorption exist in the NIL system.
Firstly, in the case of NIL 5-3 and NIL 5-4, the nano-segregated ionic network in NIL
dissipate shockwave kinetic energy without causing noticeable structural change. In
addition, in the case of NIL 5-6, irreversible change in spatial ordering within the ionic
network also play a key role in extra shockwave energy absorbing capability.
4.5 Experimental section
4.5.1. Materials and methods
All chemicals were purchased from Aldrich as highest purity grade and used
without further purification. All reactions were performed under nitrogen/argon
atmosphere. NMR spectra were recorded on Varian Unity 400 NB, Varian VXR 500 and
Varian Unity 500 NB spectrometer. High resolution electrospray mass spectra were
obtained on a Micromass Q-Tof Ultima.
X-ray powder diffraction of NIL
X-ray diffraction experiment was conducted using Rigaku Miniflex 600 X-ray
diffractometer with Cu Kα radiation. A thin layer of sample was pasted on a glass sample
holder, which was then tested in the measurement chamber.
Differential scanning calorimetry (DSC) measurement of NIL
The DSC measurement was performed using TA Instrument Q20 Differential
Scanning Calorimeter equipped with a Liquid Nitrogen Cooling System (LNCS). Tzero
aluminum pan and lids were used as sample testing containers. Nitrogen was used as
sample purge gas.
Typical DSC measurement procedure includes 3 cyclic scans. One cyclic scan
includes one heating and cooling process. To minimize the aging effect of NIL at higher
84
temperature, temperature range for each scan is -100~60 °C with heating/cooling rate
10°C/min. The glass transition temperatures were determined at the inflection point of the
step from the second heating scan. For post-shock samples, we used sample that is untested
by DSC to avoid any aging effect from the heating process in DSC runs.
4.5.2 Preparation of NIL shockwave impact test specimen
NIL test specimens, shown schematically in Figure 4.5, were prepared by drop
casting 20mg of NIL on a glass substrate (2.5mm x 2.5mm square, 1 mm thick) with a
50μm thick polyimide spacer to control the thickness of the NIL layer. A second glass
substrate was then placed on top of the specimen with a pressure of 55 kPa. A NIL layer
with 50μm thickness was confirmed by scanning electron microscope. Polyurea test
specimens were prepared in a similar fashion by drop casting a mixture of 80 wt% of an
oligomeric amine (Versalink P-1000, Air Product and Chemicals) and 20 wt% of a multi-
functional isocyanate precursor (Isonate 143L, Dow Chemical) onto a glass substrate with
a 50μm thick polyimide spacer. A second glass substrate was then placed on top of the
specimen and the mixture was cured 24 hours at room temperature and another 24 hours at
60 °C. Both the NIL and polyuria sandwich specimens were prepared for laser-induced
shockwave testing by electron beam deposition of a 400 nm thick Al layer (400 nm) on the
outer surface of one glass substrate , followed by spin coat deposition of a 6 µm thick
sodium silicate layer on the top of the Al layer. Another Al layer (200 nm) was deposited
on the surface of the glass substrate on the opposite side of the specimen via electron beam
deposition.
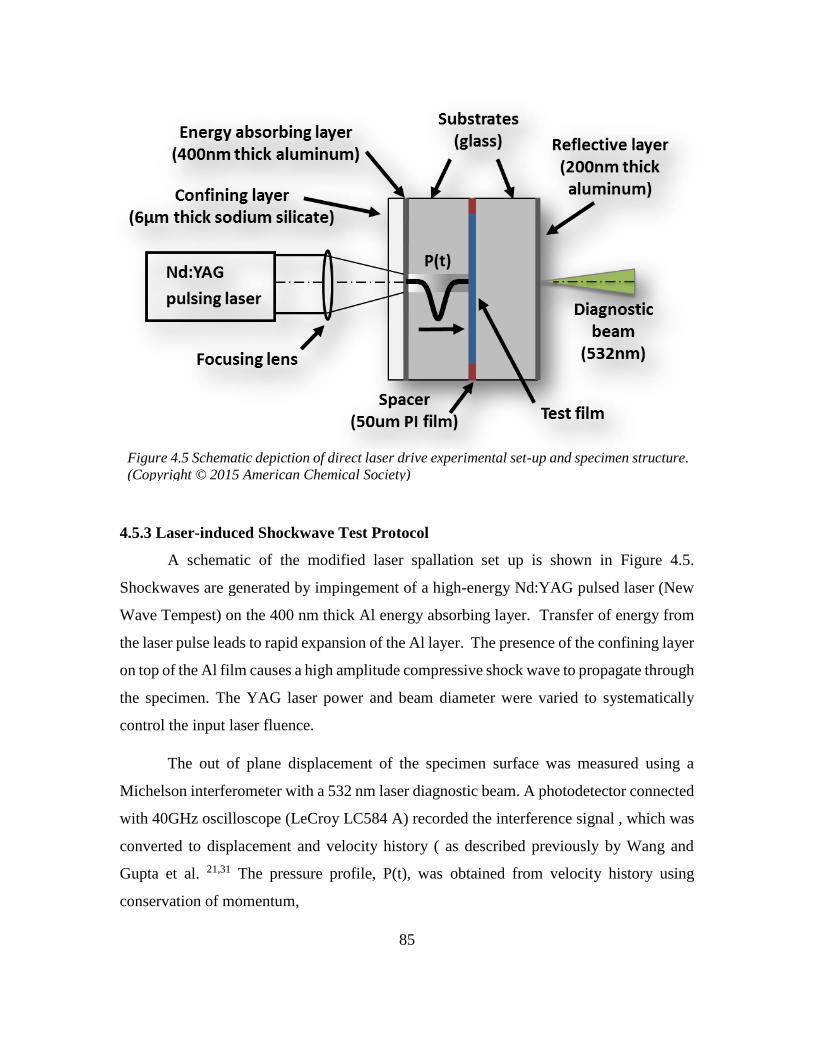
85
4.5.3 Laser-induced Shockwave Test Protocol
A schematic of the modified laser spallation set up is shown in Figure 4.5.
Shockwaves are generated by impingement of a high-energy Nd:YAG pulsed laser (New
Wave Tempest) on the 400 nm thick Al energy absorbing layer. Transfer of energy from
the laser pulse leads to rapid expansion of the Al layer. The presence of the confining layer
on top of the Al film causes a high amplitude compressive shock wave to propagate through
the specimen. The YAG laser power and beam diameter were varied to systematically
control the input laser fluence.
The out of plane displacement of the specimen surface was measured using a
Michelson interferometer with a 532 nm laser diagnostic beam. A photodetector connected
with 40GHz oscilloscope (LeCroy LC584 A) recorded the interference signal , which was
converted to displacement and velocity history ( as described previously by Wang and
Gupta et al. 21,31 The pressure profile, P(t), was obtained from velocity history using
conservation of momentum,
Figure 4.5 Schematic depiction of direct laser drive experimental set-up and specimen structure.
(Copyright © 2015 American Chemical Society)
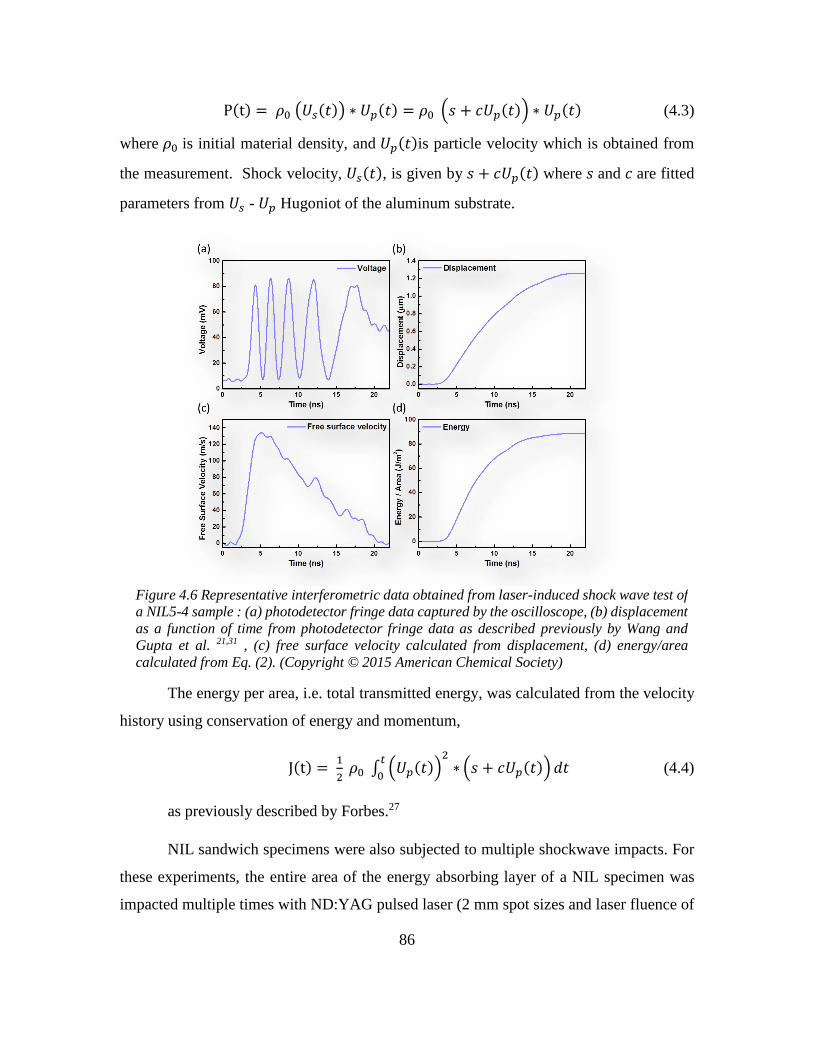
86
P(t) = 𝜌0(𝑈𝑠(𝑡)) ∗ 𝑈𝑝(𝑡) = 𝜌0 (𝑠 + 𝑐𝑈𝑝(𝑡)) ∗ 𝑈𝑝(𝑡) (4.3)
where 𝜌0 is initial material density, and 𝑈𝑝(𝑡)is particle velocity which is obtained from
the measurement. Shock velocity, 𝑈𝑠(𝑡), is given by 𝑠 + 𝑐𝑈𝑝(𝑡) where 𝑠 and 𝑐 are fitted
parameters from 𝑈𝑠 - 𝑈𝑝 Hugoniot of the aluminum substrate.
The energy per area, i.e. total transmitted energy, was calculated from the velocity
history using conservation of energy and momentum,
J(t) = 1
2𝜌0 ∫ (𝑈𝑝(𝑡))
2
∗𝑡
0(𝑠 + 𝑐𝑈𝑝(𝑡)) 𝑑𝑡 (4.4)
as previously described by Forbes.27
NIL sandwich specimens were also subjected to multiple shockwave impacts. For
these experiments, the entire area of the energy absorbing layer of a NIL specimen was
impacted multiple times with ND:YAG pulsed laser (2 mm spot sizes and laser fluence of
Figure 4.6 Representative interferometric data obtained from laser-induced shock wave test of
a NIL5-4 sample : (a) photodetector fringe data captured by the oscilloscope, (b) displacement
as a function of time from photodetector fringe data as described previously by Wang and
Gupta et al. 21,31 , (c) free surface velocity calculated from displacement, (d) energy/area
calculated from Eq. (2). (Copyright © 2015 American Chemical Society)
87
91 mJ/mm2). Each 2mm impact spot was created with a 2.5mm center to center distance
from adjacent impact spots across the entire specimen. After the energy absorbing
aluminum layer was fully consumed, the shocked NIL layer was transferred to a new set
of glass substrates with a pristine Al energy absorbing layer for a subsequent round of
shock testing.
4.6 References
(1) Nakagawa, A.; Manley, G. T.; Gean, A. D.; Ohtani, K.; Armonda, R.; Tsukamoto,
A.; Yamamoto, H.; Takayama, K.; Tominaga, T. J. Neurotrauma 2011, 28, 1101–
1119.
(2) Courtney, A. C.; Courtney, M. W. Med. Hypotheses 2009, 72, 76–83.
(3) Bahei-El-Din, Y. A.; Dvorak, G. J.; Fredricksen, O. J. Int. J. Solids Struct. 2006, 43,
7644–7658.
(4) Grujicic, A.; LaBerge, M.; Grujicic, M.; Pandurangan, B.; Runt, J.; Tarter, J.; Dillon,
G. J. Mater. Eng. Perform. 2011, 21, 1562–1579.
(5) Gardner, N.; Wang, E.; Kumar, P.; Shukla, A. Exp. Mech. 2011, 52, 119–133.
(6) Grujicic, M.; Pandurangan, B.; Bell, W. C.; Cheeseman, B. A.; Yen, C.-F.; Randow,
C. L. Mater. Sci. Eng. A 2011, 528, 3799–3808.
(7) Grujicic, M.; Pandurangan, B. J. Mater. Sci. 2012, 47, 3876–3889.
(8) Arman, B.; Reddy, A. S.; Arya, G. Macromolecules 2012, 45, 3247–3255.
(9) Bogoslovov, R. B.; Roland, C. M.; Gamache, R. M. Appl. Phys. Lett. 2007, 90,
221910.
(10) Grujicic, M.; Pandurangan, B.; He, T.; Cheeseman, B. A.; Yen, C.-F.; Randow, C.
L. Mater. Sci. Eng. A 2010, 527, 7741–7751.
(11) Grujicic, M.; Snipes, J. S.; Ramaswami, S.; Yavari, R.; Runt, J.; Tarter, J.; Dillon,
G. J. Mater. Eng. Perform. 2013, 22, 1964–1981.
88
(12) Zhao, Y.; Hu, Z. Chem. Commun. 2012, 48, 2231–2233.
(13) Song, X.; Hamano, H.; Minofar, B.; Kanzaki, R.; Fujii, K.; Kameda, Y.; Kohara, S.;
Watanabe, M.; Ishiguro, S.; Umebayashi, Y. J. Phys. Chem. B 2012, 116, 2801–
2813.
(14) Ji, Y.; Shi, R.; Wang, Y.; Saielli, G. J. Phys. Chem. B 2013, 117, 1104–1109.
(15) Canongia Lopes, J. N. A.; Pádua, A. A. H. J. Phys. Chem. B 2006, 110, 3330–3335.
(16) Hettige, J. J.; Araque, J. C.; Margulis, C. J. J. Phys. Chem. B 2014, 118, 12706–
12716.
(17) Li, S.; Bañuelos, J. L.; Zhang, P.; Feng, G.; Dai, S.; Rother, G.; Cummings, P. T.
Soft Matter 2014, 10, 9193–9200.
(18) Atkin, R.; Warr, G. G. J. Phys. Chem. B 2008, 112, 4164–4166.
(19) Zheng, W.; Mohammed, A.; Hines, L. G.; Xiao, D.; Martinez, O. J.; Bartsch, R. A.;
Simon, S. L.; Russina, O.; Triolo, A.; Quitevis, E. L. J. Phys. Chem. B 2011, 115,
6572–6584.
(20) Yang, K.; Tyagi, M.; Moore, J. S.; Zhang, Y. J. Am. Chem. Soc. 2014, 136, 1268–
1271.
(21) Wang, J.; Weaver, R. L.; Sottos, N. R. Exp. Mech. 2002, 42, 74–83.
(22) Grady, M. E.; Geubelle, P. H.; Braun, P. V; Sottos, N. R. Langmuir 2014, 30,
11096–11102.
(23) Grady, M. E.; Beiermann, B. A.; Moore, J. S.; Sottos, N. R. ACS Appl. Mater.
Interfaces 2014, 6, 5350–5355.
(24) Youssef, G.; Gupta, V. Exp. Mech. 2012, 53, 145–154.
(25) Youssef, G.; Gupta, V. Mech. Time-Dependent Mater. 2011, 16, 317–328.
(26) Gupta, V.; Argon, A. S.; Parks, D. M.; Cornie, J. A. J. Mech. Phys. Solids 1992, 40,
141–180.
89
(27) Forbes, J. W. In Shock Wave Compression of Condensed Matter; Springer, 2012;
pp. 13–29.
(28) Hayes, R.; Imberti, S.; Warr, G. G.; Atkin, R. Phys. Chem. Chem. Phys. 2011, 13,
13544–13551.
(29) Zhao, Y.; Liu, X.; Lu, X.; Zhang, S.; Wang, J.; Wang, H.; Gurau, G.; Rogers, R. D.;
Su, L.; Li, H. J. Phys. Chem. B 2012, 116, 10876–10884.
(30) Gardas, R. L.; Freire, M. G.; Caryalho, P. J.; Marrucho, I. M.; Fonseca, I. M. A.;
Ferreira, A. G. M.; Coutinho, J. A. P. J. Chem. Eng. Data 2007, 52, 80–88.
(31) Gupta, V.; Argon, A. S.; Parks, D. M.; Cornie, J. A. J. Mech. Phys. Solids 1992, 40,
141–180.
90
CHAPTER 5
FACILE DESIGN AND SYNTHESIS OF THERMOPLASTIC IONIC
ELASTOMER WITH FAST AUTOMATIC SELF-HEALING
5.1 Abstract
An intrinsic self-healing material that can repair itself without consuming healing
agents or external energy would improve the material lifetime span, maintaining and
energy cost, and environmental impact significantly. The combination of high modulus and
intrinsic self-healing ability remains a key challenge in this area. The only few available
examples of stiff intrinsic self-healing polymers involves expensive raw materials and
intensive synthesis efforts, which partly compromise the motivation for intrinsic self-
healing material. Here we design an ionically crosslinked network that is low cost, facile
to synthesize and show stiff plateau modulus while still maintaining self-healing capability.
By ionically associating a commercially available low Tg oligomer with multivalent
organic cations, the resulting ionic network exhibit competitive plateau modulus. Thanks
to the dynamic nature of ionic interaction, this ionic network is capable of releasing
excessive stress and super-fast self-healing at room temperature. The low cost, facile
synthesis, stiff modulus, and excellent stress-releasing and self-healing abilities make the
ionic elastomer a unique system for future applications.
5.2 Introduction
The reprocessing and recycling of conventional rubber has been greatly limited by
permanent covalent crosslinks. In terms of reprocessibility or self-healing ability,
supramolecular rubbers provide approachable solutions based on the reversible nature of
the bonds.1–6 Specifically, H-bond based system has becomes very successful because of
the feasibility of incorporating multiple H-bond donor/acceptors in monomers and
excellent reversibility based on low bond energy of H-bonds. However, the low bond
energy of H-bond also limit the mechanical properties of supramolecular polymers. As a
91
consequence, supramolecular elastomers usually have lower Young’s modulus compared
to covalent rubber. 2,3,7–9 To some extent, the lack of competitive mechanical properties
compromises the potential application of self-healing supramolecular rubbers.
The selection of non-covalent interaction is a challenge for the goal of forming a
stiffer supramolecular network while maintaining complete reversibility.10–12 Compared
with H-bonds, ionic interactions have a much wider range of bond energy. In addition, the
bond energy of ionic interaction depends on the ion pairs and also the distance between
cations and anions thus can be further fined-tuned with selections.13 We propose to use
ionic interaction as the crosslinking bond type to form a supramolecular network. We rely
on small ions and short oligomer blocks rather than long polymers for higher density of
crosslinks (lower molecular weight between crosslinks Mc), which is supposed to yield a
better elastic modulus in the case of an ideal crosslinked highly elastic network. By
crosslinking oligomeric anion with different types of cations, we have obtained a stiff
supramolecular elastomer that we named ionic rubber (IR).
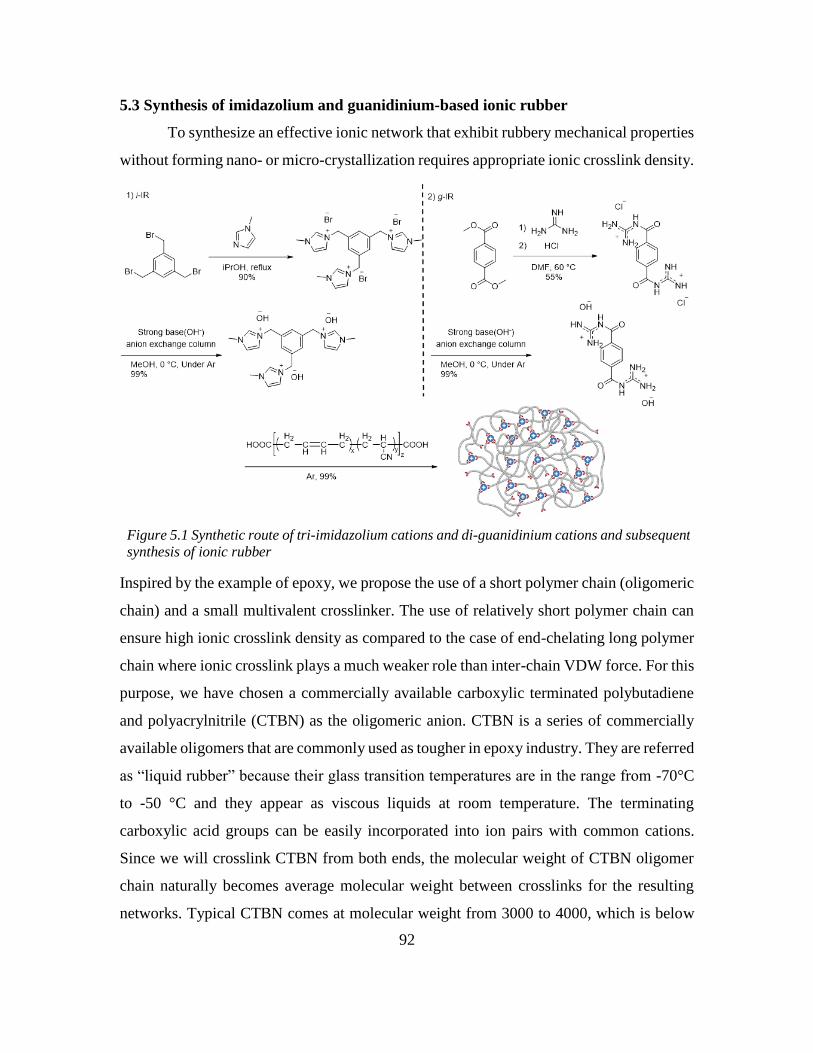
92
5.3 Synthesis of imidazolium and guanidinium-based ionic rubber
To synthesize an effective ionic network that exhibit rubbery mechanical properties
without forming nano- or micro-crystallization requires appropriate ionic crosslink density.
Inspired by the example of epoxy, we propose the use of a short polymer chain (oligomeric
chain) and a small multivalent crosslinker. The use of relatively short polymer chain can
ensure high ionic crosslink density as compared to the case of end-chelating long polymer
chain where ionic crosslink plays a much weaker role than inter-chain VDW force. For this
purpose, we have chosen a commercially available carboxylic terminated polybutadiene
and polyacrylnitrile (CTBN) as the oligomeric anion. CTBN is a series of commercially
available oligomers that are commonly used as tougher in epoxy industry. They are referred
as “liquid rubber” because their glass transition temperatures are in the range from -70°C
to -50 °C and they appear as viscous liquids at room temperature. The terminating
carboxylic acid groups can be easily incorporated into ion pairs with common cations.
Since we will crosslink CTBN from both ends, the molecular weight of CTBN oligomer
chain naturally becomes average molecular weight between crosslinks for the resulting
networks. Typical CTBN comes at molecular weight from 3000 to 4000, which is below
Figure 5.1 Synthetic route of tri-imidazolium cations and di-guanidinium cations and subsequent
synthesis of ionic rubber
93
or near its critical entanglement molecular weight but ideal in our case for the formation a
stiff elastic network.
As the other part of ionic rubber, cations play the role of multivalent crosslinker.
Naturally, the strength of ionic interaction is one critical parameter that determines the
performance of the proposed ionic network. We proposed two kinds of small molecular
crosslinker with discrete ionic bond energy. One is multivalent imidazolium cation and the
other is multivalent guanidinium cation. Imidazolium-carboxylate is well-studied ionic
interaction type in the area of ionic liquids that has weak to medium ionic interaction
strength (bond energy ~ 30 kcal/mol).14 Whereas guanidinium-carboxylic interaction is
quite common in bio-macromolecules, specifically in protein-DNA interaction. It is a very
strong hydrogen-bonding assisted ionic interaction (bond energy ~ 120kcal/mol).15,16 A
simple one-step synthetic pathway introduces desired imidazolium and guanidinium
functional groups to a multivalent core. The halogen counter-anion was then replaced with
hydroxide using a strong base type anion exchange column. In situ reaction with CTBN
yields the mixture of desired ionic product and water. The materials were vacuum dried at
elevated temperature for two days to drive off the remaining solvent and water. We name
this new material ionic rubber, specifically, the imidazolium based ionic rubber (i-IR) and
the guanidinium based ionic rubber (g-IR).
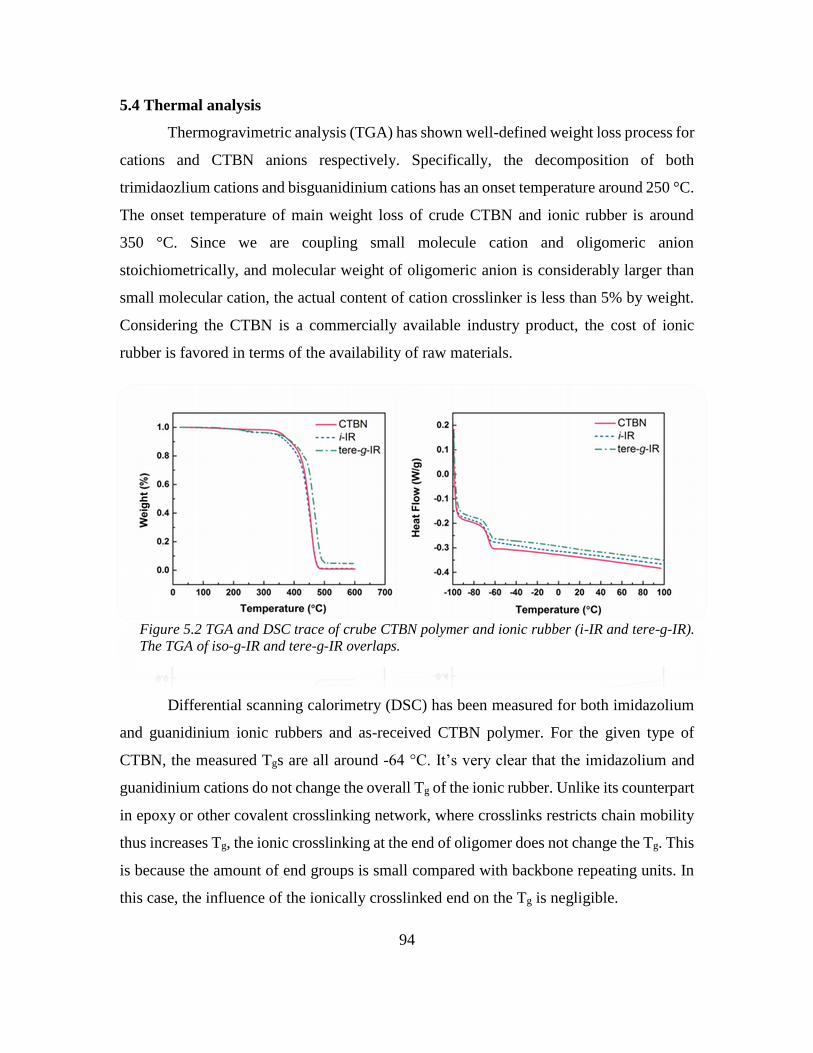
94
5.4 Thermal analysis
Thermogravimetric analysis (TGA) has shown well-defined weight loss process for
cations and CTBN anions respectively. Specifically, the decomposition of both
trimidaozlium cations and bisguanidinium cations has an onset temperature around 250 °C.
The onset temperature of main weight loss of crude CTBN and ionic rubber is around
350 °C. Since we are coupling small molecule cation and oligomeric anion
stoichiometrically, and molecular weight of oligomeric anion is considerably larger than
small molecular cation, the actual content of cation crosslinker is less than 5% by weight.
Considering the CTBN is a commercially available industry product, the cost of ionic
rubber is favored in terms of the availability of raw materials.
Differential scanning calorimetry (DSC) has been measured for both imidazolium
and guanidinium ionic rubbers and as-received CTBN polymer. For the given type of
CTBN, the measured Tgs are all around -64 °C. It’s very clear that the imidazolium and
guanidinium cations do not change the overall Tg of the ionic rubber. Unlike its counterpart
in epoxy or other covalent crosslinking network, where crosslinks restricts chain mobility
thus increases Tg, the ionic crosslinking at the end of oligomer does not change the Tg. This
is because the amount of end groups is small compared with backbone repeating units. In
this case, the influence of the ionically crosslinked end on the Tg is negligible.
Figure 5.2 TGA and DSC trace of crube CTBN polymer and ionic rubber (i-IR and tere-g-IR).
The TGA of iso-g-IR and tere-g-IR overlaps.
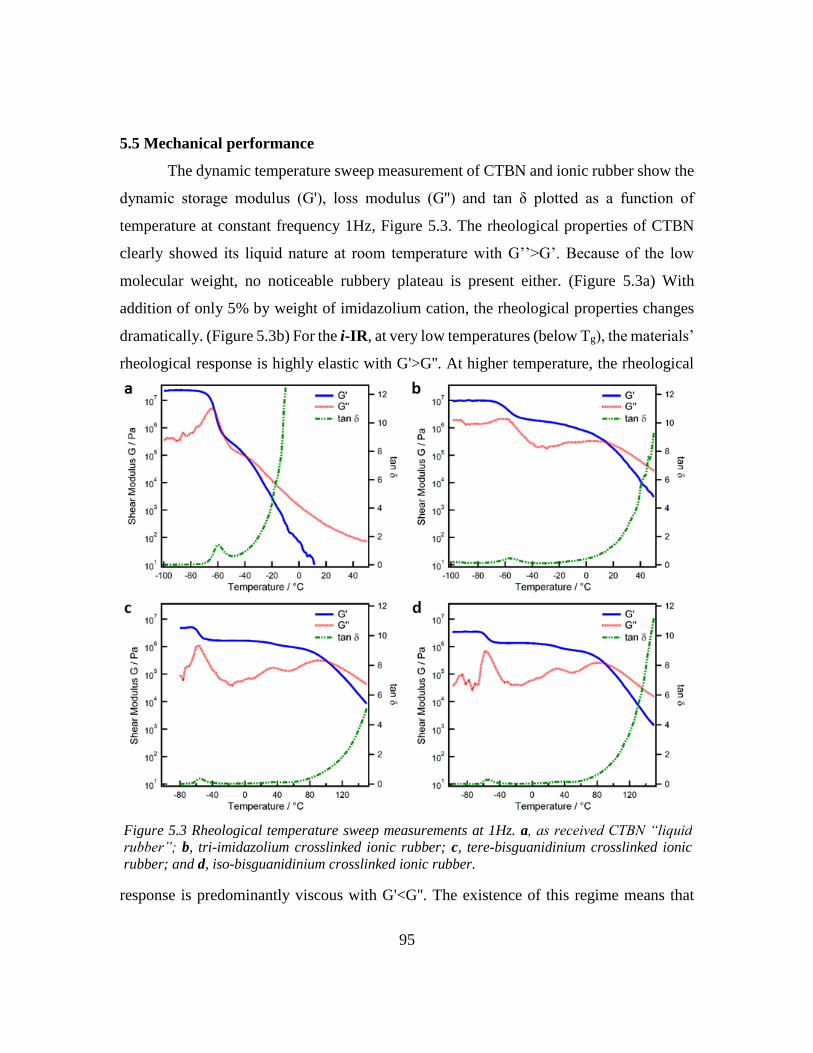
95
5.5 Mechanical performance
The dynamic temperature sweep measurement of CTBN and ionic rubber show the
dynamic storage modulus (G'), loss modulus (G'') and tan δ plotted as a function of
temperature at constant frequency 1Hz, Figure 5.3. The rheological properties of CTBN
clearly showed its liquid nature at room temperature with G’’>G’. Because of the low
molecular weight, no noticeable rubbery plateau is present either. (Figure 5.3a) With
addition of only 5% by weight of imidazolium cation, the rheological properties changes
dramatically. (Figure 5.3b) For the i-IR, at very low temperatures (below Tg), the materials’
rheological response is highly elastic with G'>G''. At higher temperature, the rheological
response is predominantly viscous with G'<G''. The existence of this regime means that
Figure 5.3 Rheological temperature sweep measurements at 1Hz. a, as received CTBN “liquid
rubber”; b, tri-imidazolium crosslinked ionic rubber; c, tere-bisguanidinium crosslinked ionic
rubber; and d, iso-bisguanidinium crosslinked ionic rubber.
96
this crosslinked network is completely malleable either thermally or with the aid of solvent.
The material undergoes a transition from rubbery behavior to viscous liquid-like behavior.
The crossover temperature (Tc) of G' and G'' is the solid-to-liquid transition temperature
measured mechanically at the given frequency. For i-IR, the crossover temperature is 15 °C,
which is around room temperature. Between Tg and Tc, a well-defined rubbery plateau is
observed in i-IR, having a storage shear modulus above 1 MPa. The high rubbery plateau
modulus is well above common supramolecular elastomers that are based on H-bonding,
ionic interaction and some reversible covalent bonds. It is even competitive with
conventional permanent covalent rubber. For practical application around room
temperature, the below-room temperature Tc for i-IR is still not satisfying. This is mainly
due to the relatively weaker ionic linkage between imidazolium and carboxylate. In
addition, peak of tan δ also indicates Tg. In all samples, the Tg from rheometer overlaps
with DSC measurements.
We propose to use a stronger ionic interaction to increase the Tc of the resulting
ionic network. Since we are not changing the molecular weight of CTBN, which is the
average molecular weight between crosslinks of the rubber network, the resulting ionic
rubber will have similar elastic modulus at the rubbery plateau. Rather, we are elevating
the temperature at which the ionic network will collapse and goes into liquid state. The
interaction between guanidinium and carboxylate is one of the strongest ionic interaction
that involve carboxylate. As shown in Figure 5.3c&d, by incorporating the much stronger
ionic interaction, the Tc is 102 °C for tere-g-IR and 90 °C for iso-g-IR. Just like our
prediction, the modulus of g-IR is in the same range as i-IR, which is more or less
determined by molecular weight of CTBN we used. The g-IR combines competitive elastic
modulus at rubbery plateau and the complete reprocessibility if heated above its Tc.
5.6 Rate-dependent stress release
The ionic rubber network is capable of releasing internal stress at different strain
rate. Figure 5.4 shows stress-strain curves that exhibit a highly rate-dependent behavior.
Take tere-g-IR for example, when pulling fast at 0.3 s-1, the ionic rubber resemble the
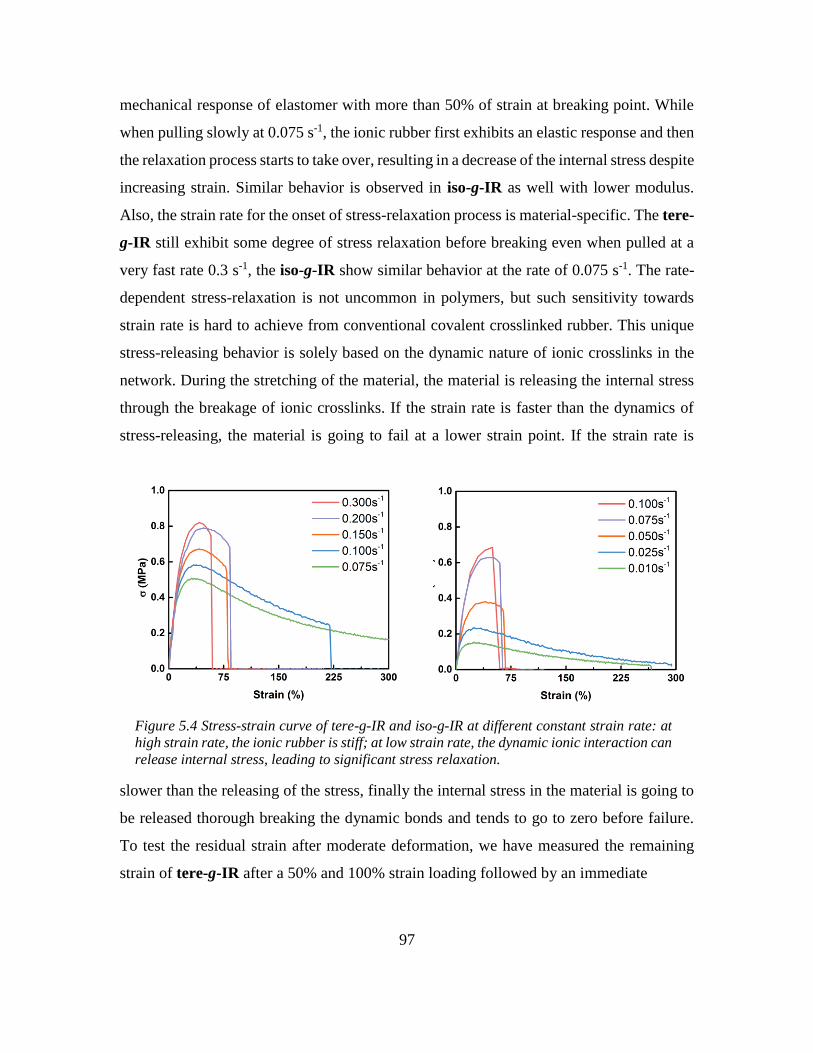
97
mechanical response of elastomer with more than 50% of strain at breaking point. While
when pulling slowly at 0.075 s-1, the ionic rubber first exhibits an elastic response and then
the relaxation process starts to take over, resulting in a decrease of the internal stress despite
increasing strain. Similar behavior is observed in iso-g-IR as well with lower modulus.
Also, the strain rate for the onset of stress-relaxation process is material-specific. The tere-
g-IR still exhibit some degree of stress relaxation before breaking even when pulled at a
very fast rate 0.3 s-1, the iso-g-IR show similar behavior at the rate of 0.075 s-1. The rate-
dependent stress-relaxation is not uncommon in polymers, but such sensitivity towards
strain rate is hard to achieve from conventional covalent crosslinked rubber. This unique
stress-releasing behavior is solely based on the dynamic nature of ionic crosslinks in the
network. During the stretching of the material, the material is releasing the internal stress
through the breakage of ionic crosslinks. If the strain rate is faster than the dynamics of
stress-releasing, the material is going to fail at a lower strain point. If the strain rate is
slower than the releasing of the stress, finally the internal stress in the material is going to
be released thorough breaking the dynamic bonds and tends to go to zero before failure.
To test the residual strain after moderate deformation, we have measured the remaining
strain of tere-g-IR after a 50% and 100% strain loading followed by an immediate
Figure 5.4 Stress-strain curve of tere-g-IR and iso-g-IR at different constant strain rate: at
high strain rate, the ionic rubber is stiff; at low strain rate, the dynamic ionic interaction can
release internal stress, leading to significant stress relaxation.

98
5.7 Super-fast self-healing at room temperature
In contrast to covalent rubber, ionic rubber can self-heal at room temperature
simply after the broken parts are put into contact. Compared with other supramolecular
elastomer, the self-healing of ionic rubber does not require solvent, strong pressure and
will complete within seconds or a few minutes. After being cut into pieces, the samples are
brought into contact at room temperature. The healed samples are able to recover the
original shape, size and modulus. Figure 5.5a demonstrates the mechanical response of
tere-g-IR after certain healing time after being put into contact immediately (within 5
minutes) after being cut. The material is able to sustain larger deformations and thus release
stress further. Impressively, even after 15s, the ionic rubber can self-healing and fully
Figure 5.5 Fast self-healing at room temperature of iso-g-IR. Cut parts are brought into
contact at room temperature (20 °C) immediately after being cut (within 5 minutes). Stress-
strain curve of self-healed tere-g-IR at different healing time. The strain rate for all tests is
0.075 s-1.
99
recover the modulus. The stress-strain curves superpose and show a larger deformation at
break. After 10min, the sample is fully healed and sustain same damage as pristine sample.
The self-healing nature of the ionic rubber is also based on the dynamic nature of
ionic interaction. The superfast self-healing of this material depends on two factors. First,
the dynamic nature of ionic interaction plays the most important role. When two parts are
put into contact, the smaller cation can diffuse throughout the interface and form new
crosslinks with oligomeric anions. Second, the oligomeric anion itself has relatively fast
dynamics at room temperature as well. As indicated by DSC result, the glass transition
temperature of the ionic rubber is -64 °C. At room temperature, the oligomeric anion is
able to contribute to the self-healing result as well. As a consequence of both effects, the
ionic rubber can achieve superfast self-healing even at room temperature.
Unlike other supramolecular self-healing materials, the healing of the ionic rubber
does not depend on the free groups for self-healing mechanism. Rather, it is determined by
the distance between the cut pieces and the diffusive motion of the ions. The ionic rubber
does not suffer from the loss of free groups during waiting time when the cut pieces are
separated. Theoretically, if the cut surface can sustain its original shape, ionic rubber
should sustain its self-healing capability for however long the cut pieces are separated,
because the dynamics of the ions is determined by temperature only. However, practically,
after certain time, the self-healing efficiency is slowing down. Figure 5.5b&c show the
material can still heal efficiently in a few minutes after a waiting time of 6h and 12h.
However, after 48h of waiting time, the healing efficiency decreases significantly
compared with the case in 6h and 12h. Still, after only 2 min of healing, the sample is able
to sustain almost 25% strain before breaking point. The reason why the healing
performance deteriorated over longer time is because the slight change of shape of the cut
surface. We did observe the edge of the cut surfaces becomes more rounded after 48h of
waiting time because of gravity and the fast dynamic nature of this material. This slight
change of shape results in mismatch of cut surfaces and thus much bigger gap for ionic
rubber to fill to achieve the self-healing. To confirm this mechanism, we did same healing
experiment for 48h samples at 50 °C and 100 °C. Not surprisingly, with much faster
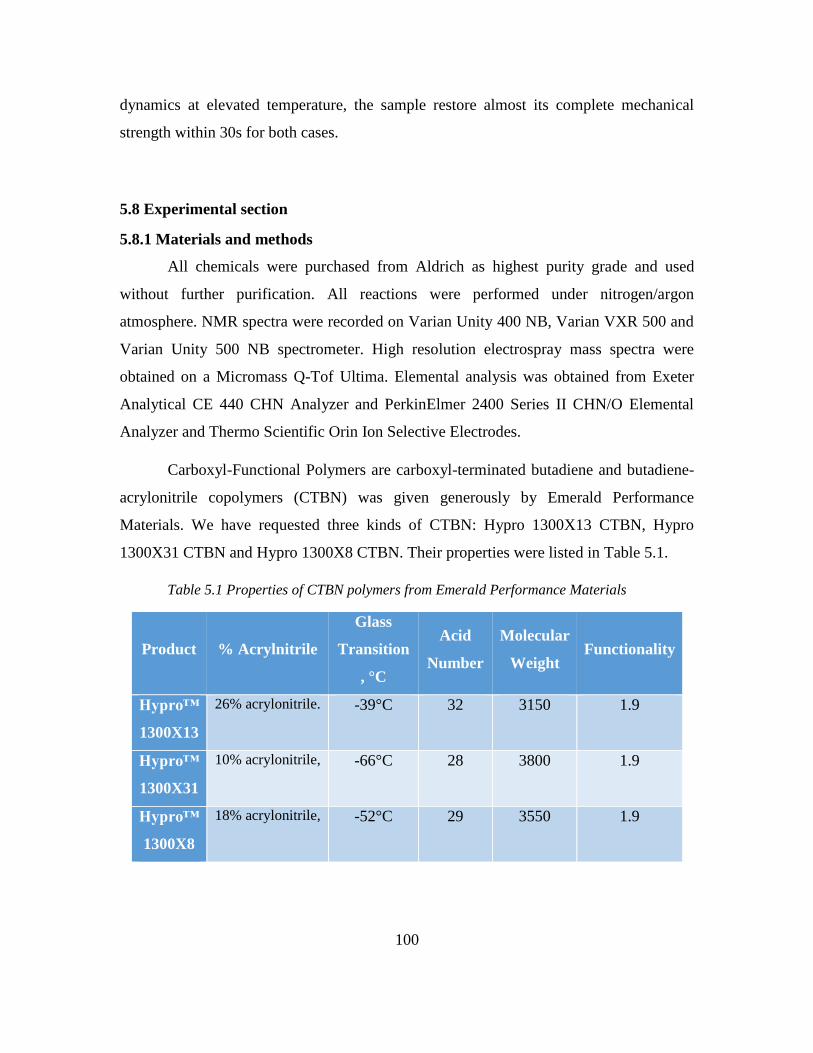
100
dynamics at elevated temperature, the sample restore almost its complete mechanical
strength within 30s for both cases.
5.8 Experimental section
5.8.1 Materials and methods
All chemicals were purchased from Aldrich as highest purity grade and used
without further purification. All reactions were performed under nitrogen/argon
atmosphere. NMR spectra were recorded on Varian Unity 400 NB, Varian VXR 500 and
Varian Unity 500 NB spectrometer. High resolution electrospray mass spectra were
obtained on a Micromass Q-Tof Ultima. Elemental analysis was obtained from Exeter
Analytical CE 440 CHN Analyzer and PerkinElmer 2400 Series II CHN/O Elemental
Analyzer and Thermo Scientific Orin Ion Selective Electrodes.
Carboxyl-Functional Polymers are carboxyl-terminated butadiene and butadiene-
acrylonitrile copolymers (CTBN) was given generously by Emerald Performance
Materials. We have requested three kinds of CTBN: Hypro 1300X13 CTBN, Hypro
1300X31 CTBN and Hypro 1300X8 CTBN. Their properties were listed in Table 5.1.
Table 5.1 Properties of CTBN polymers from Emerald Performance Materials
Product % Acrylnitrile
Glass
Transition
, °C
Acid
Number
Molecular
Weight Functionality
Hypro™
1300X13
26% acrylonitrile. -39°C 32 3150 1.9
Hypro™
1300X31
10% acrylonitrile, -66°C 28 3800 1.9
Hypro™
1300X8
18% acrylonitrile, -52°C 29 3550 1.9
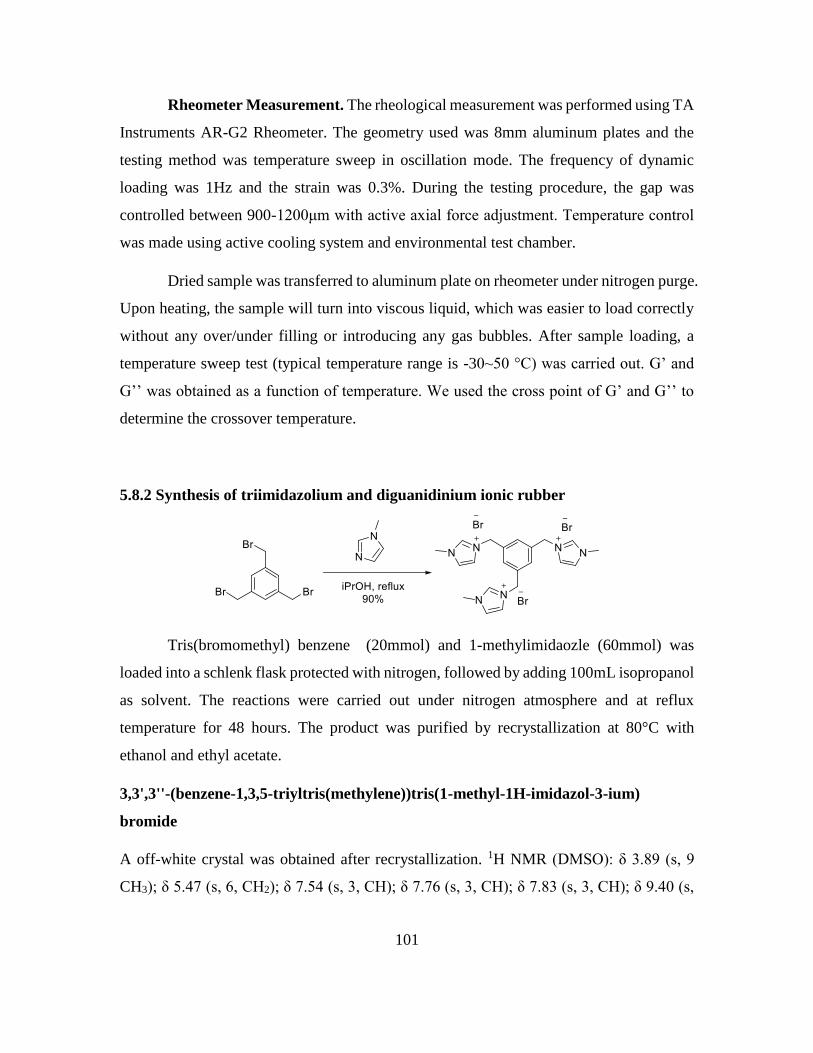
101
Rheometer Measurement. The rheological measurement was performed using TA
Instruments AR-G2 Rheometer. The geometry used was 8mm aluminum plates and the
testing method was temperature sweep in oscillation mode. The frequency of dynamic
loading was 1Hz and the strain was 0.3%. During the testing procedure, the gap was
controlled between 900-1200μm with active axial force adjustment. Temperature control
was made using active cooling system and environmental test chamber.
Dried sample was transferred to aluminum plate on rheometer under nitrogen purge.
Upon heating, the sample will turn into viscous liquid, which was easier to load correctly
without any over/under filling or introducing any gas bubbles. After sample loading, a
temperature sweep test (typical temperature range is -30~50 °C) was carried out. G’ and
G’’ was obtained as a function of temperature. We used the cross point of G’ and G’’ to
determine the crossover temperature.
5.8.2 Synthesis of triimidazolium and diguanidinium ionic rubber
Tris(bromomethyl) benzene (20mmol) and 1-methylimidaozle (60mmol) was
loaded into a schlenk flask protected with nitrogen, followed by adding 100mL isopropanol
as solvent. The reactions were carried out under nitrogen atmosphere and at reflux
temperature for 48 hours. The product was purified by recrystallization at 80°C with
ethanol and ethyl acetate.
3,3',3''-(benzene-1,3,5-triyltris(methylene))tris(1-methyl-1H-imidazol-3-ium)
bromide
A off-white crystal was obtained after recrystallization. 1H NMR (DMSO): δ 3.89 (s, 9
CH3); δ 5.47 (s, 6, CH2); δ 7.54 (s, 3, CH); δ 7.76 (s, 3, CH); δ 7.83 (s, 3, CH); δ 9.40 (s,
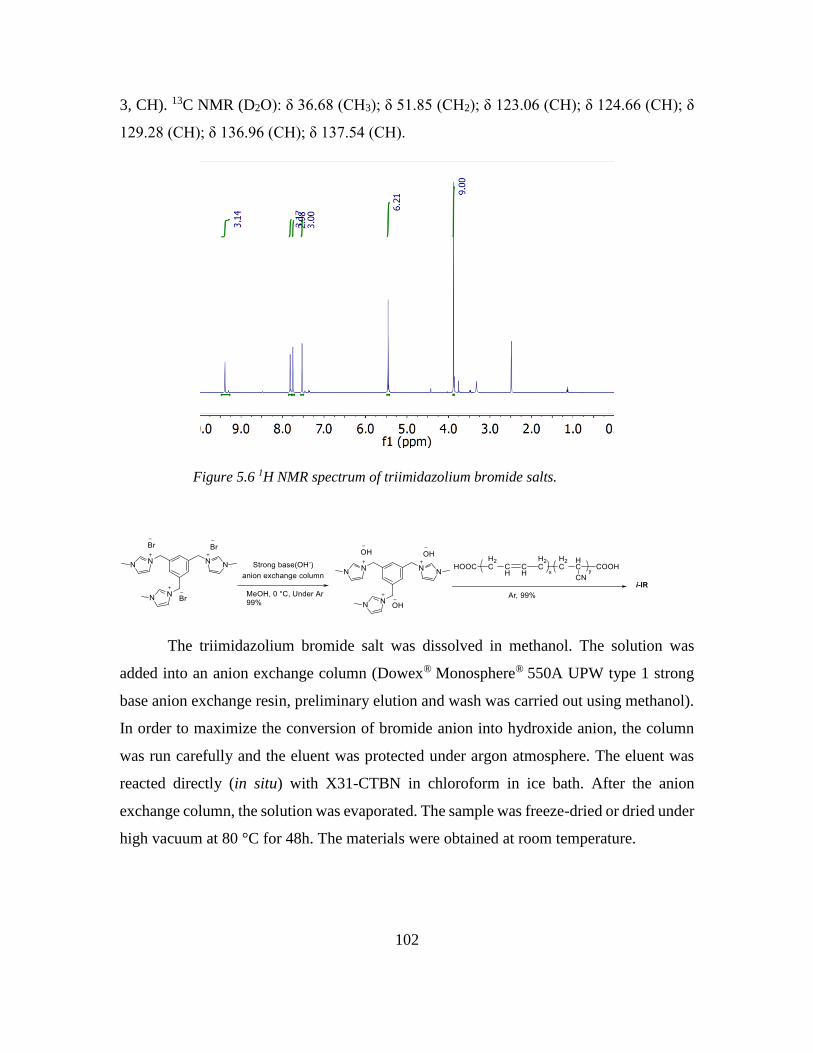
102
3, CH). 13C NMR (D2O): δ 36.68 (CH3); δ 51.85 (CH2); δ 123.06 (CH); δ 124.66 (CH); δ
129.28 (CH); δ 136.96 (CH); δ 137.54 (CH).
Figure 5.6 1H NMR spectrum of triimidazolium bromide salts.
The triimidazolium bromide salt was dissolved in methanol. The solution was
added into an anion exchange column (Dowex® Monosphere® 550A UPW type 1 strong
base anion exchange resin, preliminary elution and wash was carried out using methanol).
In order to maximize the conversion of bromide anion into hydroxide anion, the column
was run carefully and the eluent was protected under argon atmosphere. The eluent was
reacted directly (in situ) with X31-CTBN in chloroform in ice bath. After the anion
exchange column, the solution was evaporated. The sample was freeze-dried or dried under
high vacuum at 80 °C for 48h. The materials were obtained at room temperature.
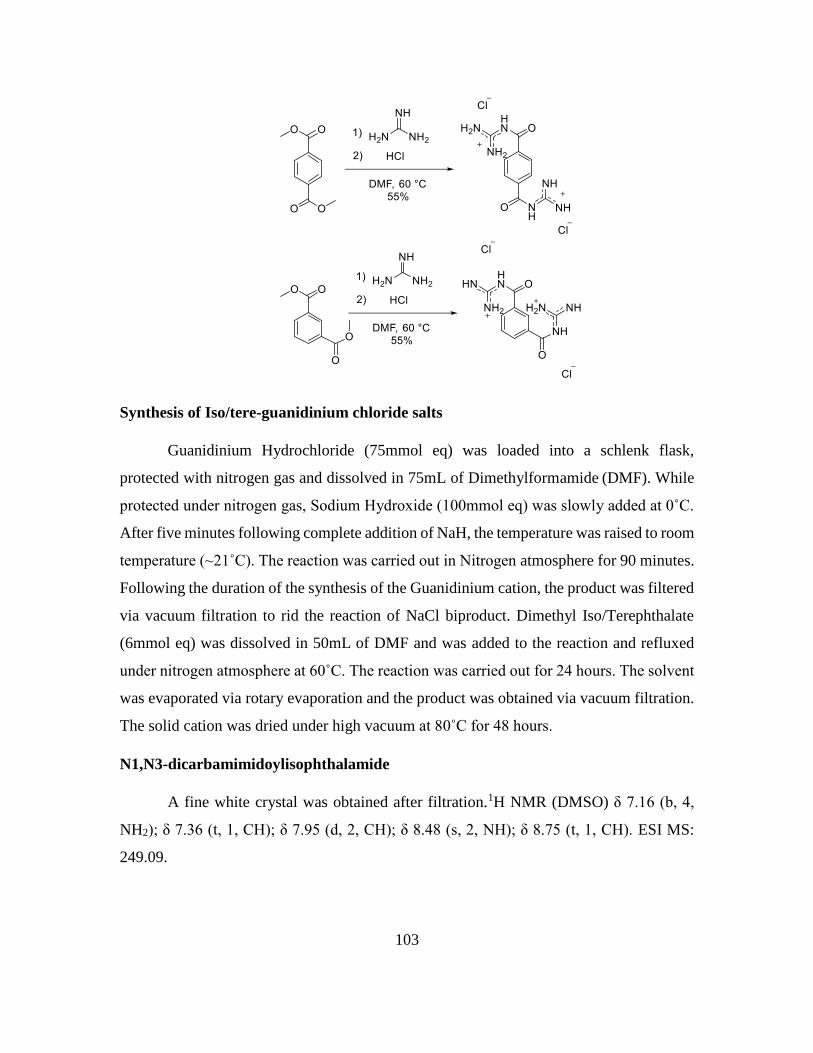
103
Synthesis of Iso/tere-guanidinium chloride salts
Guanidinium Hydrochloride (75mmol eq) was loaded into a schlenk flask,
protected with nitrogen gas and dissolved in 75mL of Dimethylformamide (DMF). While
protected under nitrogen gas, Sodium Hydroxide (100mmol eq) was slowly added at 0˚C.
After five minutes following complete addition of NaH, the temperature was raised to room
temperature (~21˚C). The reaction was carried out in Nitrogen atmosphere for 90 minutes.
Following the duration of the synthesis of the Guanidinium cation, the product was filtered
via vacuum filtration to rid the reaction of NaCl biproduct. Dimethyl Iso/Terephthalate
(6mmol eq) was dissolved in 50mL of DMF and was added to the reaction and refluxed
under nitrogen atmosphere at 60˚C. The reaction was carried out for 24 hours. The solvent
was evaporated via rotary evaporation and the product was obtained via vacuum filtration.
The solid cation was dried under high vacuum at 80˚C for 48 hours.
N1,N3-dicarbamimidoylisophthalamide
A fine white crystal was obtained after filtration.1H NMR (DMSO) δ 7.16 (b, 4,
NH2); δ 7.36 (t, 1, CH); δ 7.95 (d, 2, CH); δ 8.48 (s, 2, NH); δ 8.75 (t, 1, CH). ESI MS:
249.09.
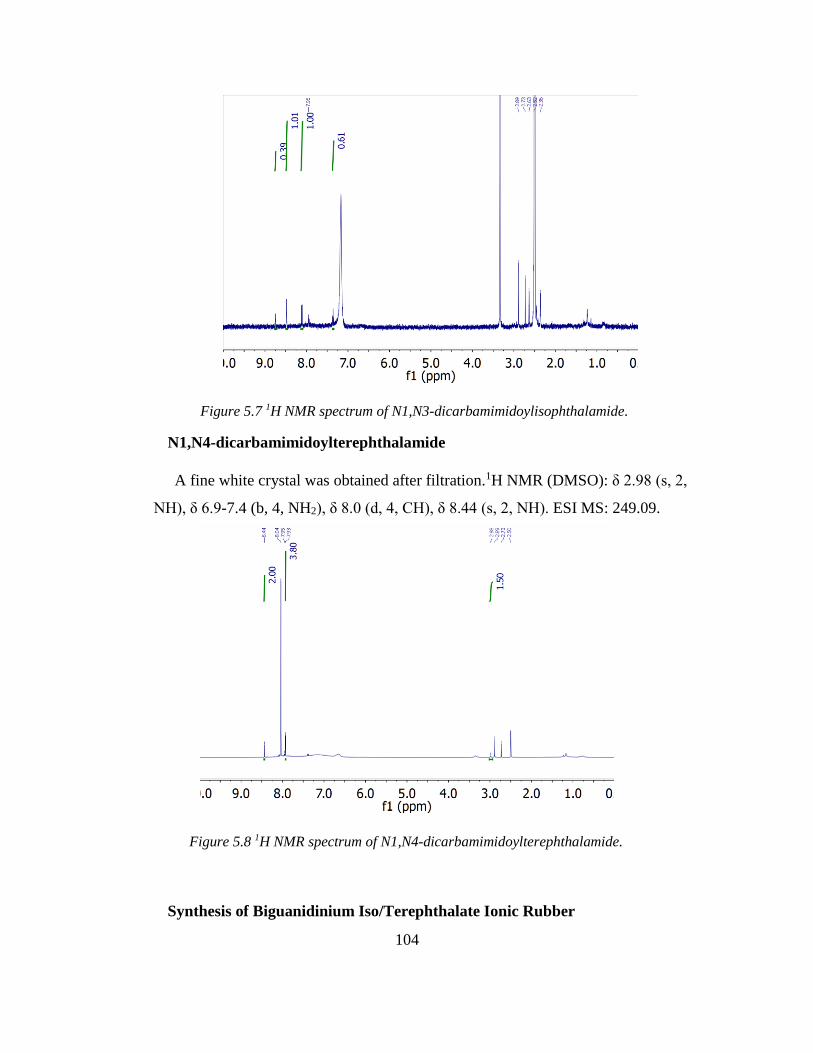
104
Figure 5.7 1H NMR spectrum of N1,N3-dicarbamimidoylisophthalamide.
N1,N4-dicarbamimidoylterephthalamide
A fine white crystal was obtained after filtration.1H NMR (DMSO): δ 2.98 (s, 2,
NH), δ 6.9-7.4 (b, 4, NH2), δ 8.0 (d, 4, CH), δ 8.44 (s, 2, NH). ESI MS: 249.09.
Figure 5.8 1H NMR spectrum of N1,N4-dicarbamimidoylterephthalamide.
Synthesis of Biguanidinium Iso/Terephthalate Ionic Rubber
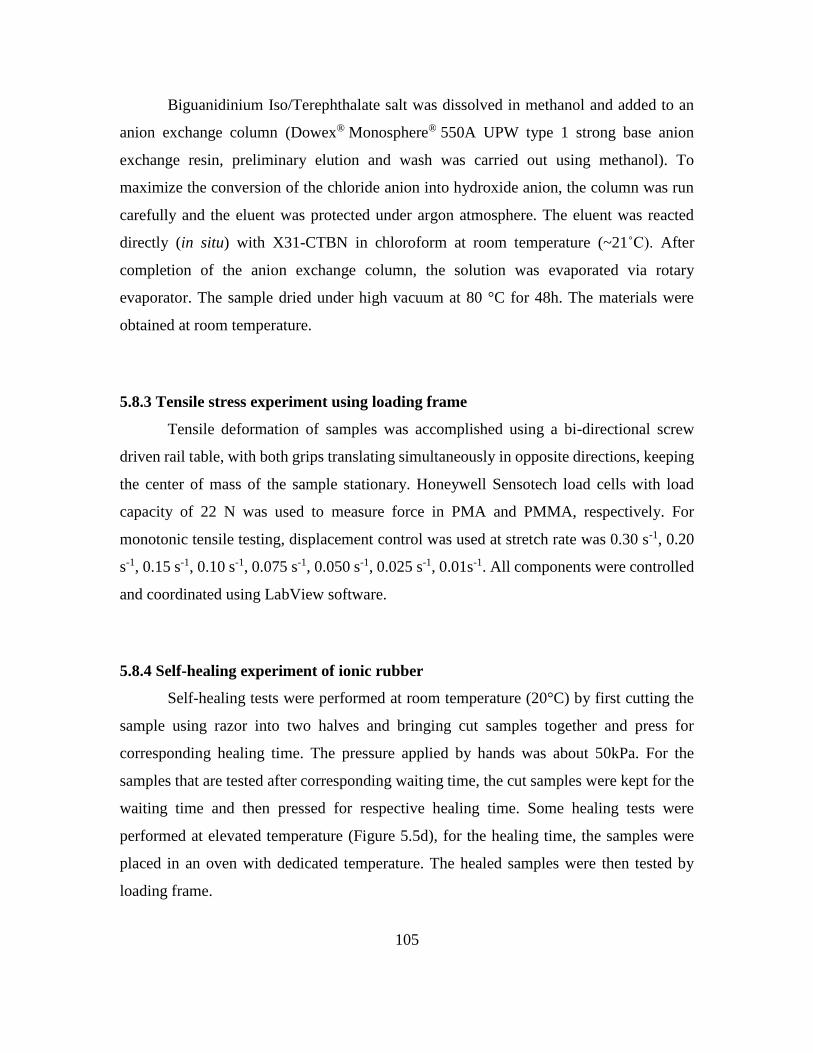
105
Biguanidinium Iso/Terephthalate salt was dissolved in methanol and added to an
anion exchange column (Dowex® Monosphere® 550A UPW type 1 strong base anion
exchange resin, preliminary elution and wash was carried out using methanol). To
maximize the conversion of the chloride anion into hydroxide anion, the column was run
carefully and the eluent was protected under argon atmosphere. The eluent was reacted
directly (in situ) with X31-CTBN in chloroform at room temperature (~21˚C). After
completion of the anion exchange column, the solution was evaporated via rotary
evaporator. The sample dried under high vacuum at 80 °C for 48h. The materials were
obtained at room temperature.
5.8.3 Tensile stress experiment using loading frame
Tensile deformation of samples was accomplished using a bi-directional screw
driven rail table, with both grips translating simultaneously in opposite directions, keeping
the center of mass of the sample stationary. Honeywell Sensotech load cells with load
capacity of 22 N was used to measure force in PMA and PMMA, respectively. For
monotonic tensile testing, displacement control was used at stretch rate was 0.30 s-1, 0.20
s-1, 0.15 s-1, 0.10 s-1, 0.075 s-1, 0.050 s-1, 0.025 s-1, 0.01s-1. All components were controlled
and coordinated using LabView software.
5.8.4 Self-healing experiment of ionic rubber
Self-healing tests were performed at room temperature (20°C) by first cutting the
sample using razor into two halves and bringing cut samples together and press for
corresponding healing time. The pressure applied by hands was about 50kPa. For the
samples that are tested after corresponding waiting time, the cut samples were kept for the
waiting time and then pressed for respective healing time. Some healing tests were
performed at elevated temperature (Figure 5.5d), for the healing time, the samples were
placed in an oven with dedicated temperature. The healed samples were then tested by
loading frame.
106
5.9 References
(1) Rybtchinski, B. ACS Nano 2011, 5, 6791–6818.
(2) Cordier, P.; Tournilhac, F.; Soulié-Ziakovic, C.; Leibler, L. Nature 2008, 451, 977–
980.
(3) Chino, K.; Ashiura, M. Macromolecules 2001, 34, 9201–9204.
(4) Godeau, G.; Navailles, L.; Nallet, F.; Lin, X.; McIntosh, T. J.; Grinstaff, M. W.
Macromolecules 2012, 45, 2509–2513.
(5) Burnworth, M.; Tang, L.; Kumpfer, J. R.; Duncan, A. J.; Beyer, F. L.; Fiore, G. L.;
Rowan, S. J.; Weder, C. Nature 2011, 472, 334–337.
(6) Chen, Y.; Kushner, A. M.; Williams, G. A.; Guan, Z. Nat. Mater. 2012, 4, 467–472.
(7) Hettige, J. J.; Araque, J. C.; Margulis, C. J. J. Phys. Chem. B 2014, 118, 12706–
12716.
(8) Lange, J.; Ekel, R.; John, N. A. S.; George, G. A. In Structure and Properties of
Glassy Polymers 1999, 258-271.
(9) Gao, G.; Karaaslan, M. a.; Kadla, J. F. Macromol. Mater. Eng. 2014, n/a – n/a.
(10) Yoshida, M. Chem. Rec. 2010, 10, 230–242.
(11) Chen, W.; Sauer, J. a.; Hara, M. Polymer (Guildf). 2003, 44, 7729–7738.
(12) Aboudzadeh, M. A.; Muñoz, M. E.; Santamaría, A.; Fernández-Berridi, M. J.; Irusta,
L.; Mecerreyes, D. Macromolecules 2012, 45, 7599–7606.
(13) Yang, K.; Tyagi, M.; Moore, J. S.; Zhang, Y. J. Am. Chem. Soc. 2014, 136, 1268–
1271.
(14) Tsuzuki, S.; Tokuda, H.; Hayamizu, K.; Watanabe, M. J. Phys. Chem. B 2005, 109,
16474–16481.

107
(15) Schlund, S. Quantifying Non-covalent Interactions – Rational in-silico Design of
Guanidinium-based Carboxylate Receptors, Julius-Maximilians-Universität
Würzburg, 2007.
(16) Sapse, A. M.; Russell, C. S. Int. J. Quantum Chem. 1984, 26, 91–99.
Related Documents