© 2013 James Warren Hempfling ALL RIGHTS RESERVED

Welcome message from author
This document is posted to help you gain knowledge. Please leave a comment to let me know what you think about it! Share it to your friends and learn new things together.
Transcript

© 2013
James Warren Hempfling
ALL RIGHTS RESERVED

ANTHRACNOSE OF ANNUAL BLUEGRASS PUTTING GREEN TURF AFFECTED
BY SAND TOPDRESSING AND CULTIVATION
by
JAMES WARREN HEMPFLING
A Thesis submitted to the
Graduate School-New Brunswick
Rutgers, The State University of New Jersey
in partial fulfillment of the requirements
for the degree of
Master of Science
Graduate Program in Plant Biology
written under the direction of
Dr. James A. Murphy and Dr. Bruce B. Clarke
and approved by
________________________
________________________
________________________
________________________
New Brunswick, New Jersey
OCTOBER, 2013
ii
ABSTRACT OF THE THESIS
Anthracnose of Annual Bluegrass Putting Green Turf Affected by Sand Topdressing and
Cultivation
By JAMES WARREN HEMPFLING
Thesis Directors:
Dr. James A. Murphy and Dr. Bruce B. Clarke
Anthracnose, caused by the fungus Colletotrichum cereale Manns sensu lato
Crouch, Clarke, and Hillman, is a devastating disease of annual bluegrass [Poa annua L.
forma reptans (Hausskn.) T. Koyama] (ABG) putting green turf. Four field trials were
conducted from 2009 to 2011 to examine the effects of sand topdressing and midseason
cultivation on anthracnose severity of ABG turf mowed at 3.2-mm. Increased rate of
spring (0, 1.2 and 2.4 L m-2
) and summer (0, 0.075, 0.15, 0.3 and 0.6 L m-2
) topdressing
reduced disease severity linearly throughout most of 2009 and 2010. However, increased
summer topdressing rate produced a quadratic decrease in disease severity by mid-2010;
increased spring topdressing rate reduced the amount (rate) of summer topdressing
needed to reduce disease. Sand topdressing during the onset of disease (approximately
10% of the plot area infested with C. cereale) in 2009 and 2010 caused a 9 to 14%
increase in disease severity 16- to 18-d after treatments were initiated. However, these
disease increases lasted only 6- to 9-d and continued sand topdressing reduced disease
severity 13 to 20% by the end of each growing season. Verticutting, scarifying and solid-
tining increased disease severity up to 18, 10 and 5%, respectively, when performed
iii
when symptoms were present (11 to 20% disease severity). These cultivation treatments
reduced disease severity relative to the control before treatments were initiated again in
2010 (second trial-year); however, verticutting, scarifying and solid-tining increased
disease once again by late-2010. Weekly grooming reduced disease severity up to 9%
relative to the control during both trial-years. Cultivation typically did not affect disease
severity when curative fungicide was also being applied. Deep vertical cutting (7.6-mm)
increased disease 4% relative to the control and 5% relative to shallow vertical cutting
(1.3-mm) on 6% of rating dates. Shallow vertical cutting produced small, marginally
significant reductions in disease severity compared to the control on 16% of rating dates.
Spring topdressing is a strategy for anthracnose suppression that may also reduce the rate
of summer topdressing needed to reduce disease severity. Additionally, cultivation
practices that only affect leaves, such as grooming, may slightly reduce anthracnose
severity.

iv
ACKNOWLEDGEMENTS
I would like to express my gratitude to my advisors Dr. James Murphy and Dr.
Bruce Clarke for the invaluable guidance during the completion of this thesis. These men
are true role models and scientists of the highest integrity. Additionally, I want to thank
the members of my graduate committee Dr. Bingru Huang and Dr. John Inguagiato for
contributing their insight during my scientific endeavors.
I thank all the faculty, staff and students who have offered their assistance during
my graduate studies. I am especially grateful for T.J. Lawson, who has been a continual
source of support in the management of my research plots. I also thank Bill Dickson, Joe
Clark, Chas Schmid, Wrennie Wang, Joseph Roberts, Brad Park, Pradip Majumdar and
the numerous undergraduate research assistants for working by my side in the field.
I thank the Rutgers Center for Turfgrass Science, United States Golf Association,
Golf Course Superintendents Association of America, Golf Course Superintendents
Association of New Jersey, and the Tri-State Turf Research Foundation for funding the
research included in this thesis.
I am grateful for the mentorship and support from the golf course superintendents
and assistant superintendents I have worked with in Oklahoma and New Jersey. I
particularly want to thank Travis Levings, Scott Brady, Todd Raisch, and Curt Chambers
not only for teaching me how to manage golf course turf but, more importantly, for
imparting wisdom regarding professionalism, organization and leadership.
Lastly, I would like to thank my loved ones, who have supported me throughout
this entire process by helping me maintain harmony with my surroundings and clarity of
mind. Mom, Dad, Anna, Jonathan, Edison, and Hayley; thanks for believing in me.
v
TABLE OF CONTENTS
ABSTRACT OF THE THESIS .......................................................................................... ii
ACKNOWLEDGMENTS ................................................................................................. iv
TABLE OF CONTENTS .....................................................................................................v
LIST OF TABLES ............................................................................................................. ix
LIST OF FIGURES ...........................................................................................................xv
CHAPTER 1. Literature Review ........................................................................................1
Introduction ..............................................................................................................1
Anthracnose Disease ................................................................................................3
Symptomology .............................................................................................4
Causal Agent ................................................................................................5
Disease Cycle ...............................................................................................7
Hemibiotrophy: Why does C. cereale switch lifestyles? ...........................10
Epidemiology .............................................................................................12
Hosts ..........................................................................................................16
Chemical Control .......................................................................................20
Cultural Management Practices Affecting Anthracnose........................................22
Fertility .......................................................................................................22
Growth Regulation .....................................................................................23
Mowing ......................................................................................................24
Rolling........................................................................................................25
Irrigation ....................................................................................................26
Sand Topdressing .......................................................................................26
vi
Vertical Cutting ..........................................................................................27
Cultural Practices for Thatch Management ...........................................................30
Sand Topdressing .......................................................................................31
Cultivation..................................................................................................37
Summary ................................................................................................................42
Research Objectives ...............................................................................................43
References ..............................................................................................................45
CHAPTER 2. Anthracnose Disease Development on Annual Bluegrass Influenced by
Spring and Summer Sand Topdressing Rate ...............................................................62
Abstract ..................................................................................................................62
Introduction ............................................................................................................64
Materials and Methods ...........................................................................................67
Experimental Design and Treatments ..............................................................67
Field Maintenance ............................................................................................68
Data Collection ................................................................................................69
Data Analysis ...................................................................................................71
Results ....................................................................................................................73
Anthracnose Severity .......................................................................................73
Turf Quality .....................................................................................................75
Incorporation of Summer Topdressing Sand ...................................................77
Volumetric Water Content ...............................................................................80
Surface Hardness .............................................................................................80
Turf Color ........................................................................................................80
vii
Thatch/Mat Layer Depth and Soil Nutrient Analysis ......................................81
Discussion ..............................................................................................................83
References ..............................................................................................................88
CHAPTER 3. Anthracnose of Annual Bluegrass Affected by Sand Topdressing Rate
Applied During Disease Emergence ..........................................................................108
Abstract ................................................................................................................108
Introduction ..........................................................................................................110
Materials and Methods .........................................................................................112
Experimental Design and Treatments ............................................................112
Field Maintenance ..........................................................................................113
Data Collection and Analysis.........................................................................115
Results and Discussion ........................................................................................117
Anthracnose Severity .....................................................................................117
Turf Quality ...................................................................................................120
Conclusions ....................................................................................................121
References ............................................................................................................122
CHAPTER 4. Effects of Midseason Cultivation Practices on Anthracnose of Annual
Bluegrass Putting Green Turf ....................................................................................130
Abstract ................................................................................................................130
Introduction ..........................................................................................................132
Materials and Methods .........................................................................................137
Experimental Design and Treatments ............................................................137
Field Maintenance ..........................................................................................139
viii
Data Collection and Analysis.........................................................................141
Results ..................................................................................................................143
Anthracnose Severity .....................................................................................143
Turf Quality ...................................................................................................145
Discussion ............................................................................................................148
References ............................................................................................................153
CHAPTER 5. Vertical Cutting Depth Effects on Anthracnose Severity of Annual
Bluegrass Putting Green Turf ....................................................................................170
Abstract ................................................................................................................170
Introduction ..........................................................................................................171
Materials and Methods .........................................................................................175
Experimental Design and Treatments ............................................................175
Field Maintenance ..........................................................................................175
Data Collection and Analysis.........................................................................177
Results ..................................................................................................................179
Anthracnose Severity .....................................................................................179
Turf Quality ...................................................................................................180
Discussion ............................................................................................................181
References ............................................................................................................186
APPENDIX ......................................................................................................................199
CURRICULUM VITAE ..................................................................................................209

ix
LIST OF TABLES
Chapter 2:
Table 2.1. Particle size distribution of sand used for topdressing in 2009 and 2010...92
Table 2.2. Anthracnose severity response to spring and summer sand topdressing rate
on an annual bluegrass turf mowed at 3.2 mm in North Brunswick, NJ
during 2009 ..................................................................................................93
Table 2.3. Anthracnose severity response to spring and summer sand topdressing rate
on an annual bluegrass turf mowed at 3.2 mm in North Brunswick, NJ
during 2010 ..................................................................................................94
Table 2.4. Anthracnose severity response to spring and summer sand topdressing rate
on an annual bluegrass turf mowed at 3.2 mm in North Brunswick, NJ
during 2009 ..................................................................................................95
Table 2.5. Anthracnose severity response to spring and summer sand topdressing rate
on an annual bluegrass turf mowed at 3.2 mm in North Brunswick, NJ
during 2009 ..................................................................................................96
Table 2.6. Turf quality response to spring and summer sand topdressing rate on an
annual bluegrass turf mowed at 3.2 mm in North Brunswick, NJ during
2009 .............................................................................................................97
Table 2.7. Turf quality response to spring and summer sand topdressing rate on an
annual bluegrass turf mowed at 3.2 mm in North Brunswick, NJ during
2010 .............................................................................................................98
x
Table 2.8. Turf quality response to spring and summer sand topdressing rate on an
annual bluegrass turf mowed at 3.2 mm in North Brunswick, NJ during
2009 and 2010 .............................................................................................99
Table 2.9. Sand incorporation response to spring and summer sand topdressing rate
on an annual bluegrass turf mowed at 3.2 mm in North Brunswick, NJ after
three topdressing events in 2009 ...............................................................100
Table 2.10. Sand incorporation response to spring and summer sand topdressing rate
on an annual bluegrass turf mowed at 3.2 mm in North Brunswick, NJ
during 2009 ................................................................................................101
Table 2.11. Number of days for topdressing sand to achieve an acceptable level of
incorporation for spring and summer sand topdressing rates on an annual
bluegrass turf mowed at 3.2 mm in North Brunswick, NJ during 2009 ....102
Table 2.12. Volumetric water content (measured at a 0-2.54 cm depth using time
domain reflectometry) response to spring and summer sand topdressing rate
on an annual bluegrass turf mowed at 3.2 mm in North Brunswick, NJ
during 2009 and 2010 ................................................................................103
Table 2.13. Surface hardness response to spring and summer sand topdressing rate on
an annual bluegrass turf mowed at 3.2 mm in North Brunswick, NJ during
2010 ...........................................................................................................104
Table 2.14. Turf color response to spring and summer sand topdressing rate on an
annual bluegrass turf mowed at 3.2 mm in North Brunswick, NJ during
2011 ...........................................................................................................105

xi
Table 2.15. Turf color response to spring and summer sand topdressing rate on an
annual bluegrass turf mowed at 3.2 mm in North Brunswick, NJ during
2011 ...........................................................................................................106
Table 2.16. Results of nutrient analysis (performed by Mehlich III extraction) of the
thatch fraction of two sand topdressing treatments on an annual bluegrass
turf mowed at 3.2 mm in North Brunswick, NJ taken on 28 Nov. 2011 ...107
Table 2.17. Results of nutrient analysis (performed by Mehlich III extraction) of the
soil fraction of two sand topdressing treatments on an annual bluegrass turf
mowed at 3.2 mm in North Brunswick, NJ taken on 28 Nov. 2011 .........107
Chapter 3:
Table 3.1. Particle size distribution of sand used for topdressing in 2009 and 2010.125
Table 3.2. Anthracnose severity response to sand topdressing rate applied during the
emergence of disease symptoms on an annual bluegrass turf mowed at 3.2
mm in North Brunswick, NJ during 2009 .................................................126
Table 3.3. Anthracnose severity response to sand topdressing rate applied during the
emergence of disease symptoms on an annual bluegrass turf mowed at 3.2
mm in North Brunswick, NJ during 2010 .................................................127
Table 3.4. Turf quality response to sand topdressing rate applied during the
emergence of disease symptoms on an annual bluegrass turf mowed at 3.2
mm in North Brunswick, NJ during 2009 .................................................128
Table 3.5. Turf quality response to sand topdressing rate applied during the
emergence of disease symptoms on an annual bluegrass turf mowed at 3.2
mm in North Brunswick, NJ during 2010 .................................................129
xii
Chapter 4:
Table 4.1. Anthracnose severity response to mid-season cultivation practices applied
during the emergence of disease symptoms on an annual bluegrass turf
mowed at 3.2 mm in North Brunswick, NJ during 2009. .........................160
Table 4.2. Anthracnose severity response to mid-season cultivation practices applied
during the emergence of disease symptoms on an annual bluegrass turf
mowed at 3.2 mm in North Brunswick, NJ during 2010 ..........................162
Table 4.3. Analysis of variance of anthracnose severity as affected by mid-season
cultivation practices and fungicide applications applied during the
emergence of disease symptoms on an annual bluegrass turf mowed at 3.2
mm in North Brunswick, NJ during 2010 .................................................163
Table 4.4. Anthracnose severity response to mid-season cultivation practices under no
or curative fungicide programs applied during the emergence of disease
symptoms on an annual bluegrass turf mowed at 3.2 mm in North
Brunswick, NJ during 2010 .......................................................................164
Table 4.5. Anthracnose severity response to the main effect of mid-season cultivation
practices applied during the emergence of disease symptoms on an annual
bluegrass turf mowed at 3.2 mm in North Brunswick, NJ during 2010 ....165
Table 4.6. Turf quality response to mid-season cultivation practices applied during
the emergence of disease symptoms on an annual bluegrass turf mowed at
3.2 mm in North Brunswick, NJ during 2009 ...........................................166
xiii
Table 4.7. Turf quality response to mid-season cultivation practices applied during
the emergence of disease symptoms on an annual bluegrass turf mowed at
3.2 mm in North Brunswick, NJ during 2010 ...........................................167
Table 4.8. Analysis of variance of turf quality as affected by mid-season cultivation
practices and fungicide applications applied during the emergence of
disease symptoms on an annual bluegrass turf mowed at 3.2 mm in North
Brunswick, NJ during 2010 .......................................................................168
Table 4.9. Turf quality response to mid-season cultivation practices under no or
curative fungicide programs applied during the emergence of disease
symptoms on an annual bluegrass turf mowed at 3.2 mm in North
Brunswick, NJ during 2010 .......................................................................169
Chapter 5:
Table 5.1. Anthracnose severity response to depth of vertical cutting on an annual
bluegrass turf mowed at 3.2 mm in North Brunswick, NJ during 2010 ....191
Table 5.2. Anthracnose severity response to depth of vertical cutting on an annual
bluegrass turf mowed at 3.2 mm in North Brunswick, NJ during 2011 ....193
Table 5.3. Anthracnose severity response to depth of vertical cutting on an annual
bluegrass turf mowed at 3.2 mm in North Brunswick, NJ during 2011 ....195
Table 5.4. Turf quality response to depth of vertical cutting on an annual bluegrass
turf mowed at 3.2 mm in North Brunswick, NJ during 2011 ....................197
Table 5.5. Turf quality response to depth of vertical cutting on an annual bluegrass
turf mowed at 3.2 mm in North Brunswick, NJ during 2011 ....................198

xiv
Appendix:
Table A.1. Anthracnose severity response to sand topdressing frequency and rate
applied during the emergence of disease symptoms on an annual bluegrass
turf mowed at 3.2 mm in North Brunswick, NJ during 2009 ..................199
Table A.2. Anthracnose severity response to sand topdressing frequency and rate
applied during the emergence of disease symptoms on an annual bluegrass
turf mowed at 3.2 mm in North Brunswick, NJ during 2010 ..................200
Table A.3. Anthracnose severity response to sand topdressing frequency and rate
applied during the emergence of disease symptoms on an annual bluegrass
turf mowed at 3.2 mm in North Brunswick, NJ during 13 Aug. 2009. ...201
Table A.4. Turf quality response to sand topdressing frequency and rate applied
during the emergence of disease symptoms on an annual bluegrass turf
mowed at 3.2 mm in North Brunswick, NJ during 2009 .........................203
Table A.5. Turf quality response to sand topdressing frequency and rate applied
during the emergence of disease symptoms on an annual bluegrass turf
mowed at 3.2 mm in North Brunswick, NJ during 2010 .........................204
Table A.6. Turf quality response to sand topdressing frequency and rate applied
during the emergence of disease symptoms on an annual bluegrass turf
mowed at 3.2 mm in North Brunswick, NJ during 2009 .........................205
Table A.7. Turf quality response to sand topdressing frequency and rate applied
during the emergence of disease symptoms on an annual bluegrass turf
mowed at 3.2 mm in North Brunswick, NJ during 2010 .........................207
xv
LIST OF FIGURES
Chapter 4:
Figure 4.1. Anthracnose severity response to mid-season cultivation practices applied
during the emergence of disease symptoms on an annual bluegrass turf
mowed at 3.2 mm in North Brunswick, NJ during 2009. Grooming (1.3
mm depth, 1.5 mm blade width, 5 mm lateral blade spacing), verticutting
(3.8 mm depth, 1.5 mm blade width, 10 mm lateral blade spacing),
scarifying (7.6 mm depth, 1.5 mm blade width, 40 mm lateral blade
spacing), and solid-tining (57 mm depth, 6 mm tine width, 38 by 38 mm
spacing) were applied on 24 July and 14 Aug. 2009. Weekly grooming
was applied every 7 d from 24 July to 28 Aug. 2009. Error bar indicates
Fisher’s protected LSD at α = 0.05 for treatment comparison on a specific
rating date; no error bar indicates the date is not significant ...................161
Chapter 5:
Figure 5.1. Anthracnose severity response to depth of vertical cutting on an annual
bluegrass turf mowed at 3.2 mm in North Brunswick, NJ during 2010.
Vertical cutting was applied once on 23 July 2010 using blades that were
1.5 mm thick and spaced 40 mm apart. Error bar indicates Fisher’s
protected LSD at α = 0.05 for treatment comparison on a specific rating
date; no error bar indicates a non-significant F test .................................192
Figure 5.2. Anthracnose severity response to depth of vertical cutting on an annual
bluegrass turf mowed at 3.2 mm in North Brunswick, NJ during 2011.
Vertical cutting was applied once on 6 July 2011 using blades that were
xvi
1.5 mm thick and spaced 40 mm apart. No error bar indicates a non-
significant F test .......................................................................................194
Figure 5.3. Anthracnose severity response to depth of vertical cutting on an annual
bluegrass turf mowed at 3.2 mm in North Brunswick, NJ during 2011.
Vertical cutting was applied once on 3 Aug. 2011 using blades that were
1.5 mm thick and spaced 40 mm apart. No error bar indicates a non-
significant F test .......................................................................................196
Appendix:
Figure A.1. Anthracnose severity response to sand topdressing frequency and rate
applied during the emergence of disease symptoms on an annual bluegrass
turf mowed at 3.2 mm in North Brunswick, NJ during 2009. Sand
topdressing applications were initiated on 28 July 2009 for both single
(dashed trendline) and biweekly (solid trendline) frequencies. Biweekly
applications continued to 24 August 2009 ...............................................202
Figure A.2. Turf quality response to sand topdressing frequency and rate applied
during the emergence of disease symptoms on an annual bluegrass turf
mowed at 3.2 mm in North Brunswick, NJ during 2009. Sand topdressing
applications were initiated on 28 July 2009 for both single (dashed
trendline) and biweekly (solid trendline) frequencies. Biweekly
applications continued to 24 August 2009. Nine (9) represents the best
turf characteristic and 5 represents the minimally acceptable rating .......206
Figure A.3. Turf quality response to sand topdressing frequency and rate applied
during the emergence of disease symptoms on an annual bluegrass turf

xvii
mowed at 3.2 mm in North Brunswick, NJ during 2010. Sand topdressing
applications were initiated on 24 May 2010 for both single (dashed
trendline) and biweekly (solid trendline) frequencies. Biweekly
applications continued to 19 July 2010. Nine (9) represents the best turf
characteristic and 5 represents the minimally acceptable rating ..............208
1
CHAPTER 1. Literature Review
INTRODUCTION
Anthracnose, caused by the fungus Colletotrichum cereale Manns sensu lato
Crouch, Clarke, and Hillman (Crouch et al., 2006) is an important disease of cool-season
grasses in temperate climates throughout the United States, Canada, Western Europe,
South America, Southeast Asia, New Zealand, and Australia (Crouch and Beirn, 2009).
Outbreaks of the disease increased in frequency and severity during the mid-1990s on
annual bluegrass [Poa annua L. forma reptans (Hausskn.) T. Koyama] (ABG) and
creeping bentgrass (Agrostis stolonifera L.) putting green turf. Annual bluegrass putting
greens have been observed to be the most susceptible turf, possibly due to the weak
perennial nature of the species and the stress of low cutting heights (Murphy et al., 2008).
The disease produces symptoms on leaves, crowns, stolons and roots and can eventually
cause death and severe thinning of the turf. Because thinned, symptomatic turf affects
playability and aesthetics of putting greens, outbreaks of anthracnose can result in severe
economic losses.
Control options are limited for the management of anthracnose on ABG. Host
resistance to C. cereale is not available due to the instability of the greens-type phenotype
in cultivated Poa annua L. (La Mantia and Huff, 2011). Thus, golf course
superintendents rely upon applications of costly fungicides to obtain acceptable levels of
disease control (Bigelow and Tudor Jr, 2012; Murphy et al., 2008; Young et al., 2010a).
Repeated applications of fungicides with site-specific modes of action has resulted in
resistance of C. cereale to the benzimidazole (Wong et al, 2008) and strobilurin (Wong et
al., 2007) fungicide classes and reduced sensitivity has also been observed in the sterol

2
demethylation inhibitor (DMI) class (Wong and Midland, 2007). However,
superintendents can reduce the severity of serious anthracnose outbreaks through the
implementation of improved cultural practices, such as increasing mowing height and
providing adequate nitrogen fertility, irrigation and sand topdressing (Inguagiato et al.,
2008; Inguagiato et al., 2009a; Inguagiato et al., 2012; Roberts et al., 2011). Because of
the development of fungicide resistance and the inability of even the best fungicide
programs to control the disease (Smiley et al., 2005), there is an ongoing need to develop
and refine programmatic cultural practices, such as sand topdressing, to manage
anthracnose on golf course putting green turf.
Anthracnose disease severity is enhanced when turf stands are stressed (Smiley et
al., 2005). Scientists have found that the disease severity is greatest when ABG is
weakened due to drought and heat stress (Danneberger et al., 1995; Roberts et al., 2011;
Sprague and Evaul, 1930) and conditions that reduce plant vigor such as low nitrogen
fertility and low mowing (Inguagiato et al., 2008; Inguagiato et al., 2009a). Furthermore,
mechanical injury from abrasive cultural practices that create wounds may enable C.
cereale to be more invasive (Smiley et al., 2005). However, results from field trials have
shown that foot traffic, rolling, brushing, and double-cutting, all practices that wound
turf, do not appear to increase anthracnose severity (Inguagiato et al., 2009a; Inguagiato
et al., 2012; Roberts et al., 2012). Results on the effect of vertical cutting (VC) on
anthracnose are conflicting. This practice consistently increased disease severity when
applied to plots maintained at 2.0, 3.3 and 5.1 mm mowing heights (Uddin et al., 2008).
In contrast, VC had no effect on the disease on an ABG fairway (Burpee and Goulty,
1984). Vertical cutting also had no effect on anthracnose severity on ABG putting green
3
turf (3.2 mm mowing height) throughout most rating dates during a 3 yr. field trial
conducted by Inguagiato et al. (2008); however, the practice did briefly reduce or
increase disease during one year in this study. Sand topdressing, often thought of as an
abrasive practice, has reduced disease severity on ABG putting green turf in several
studies; however, brief increases were observed during the first years of these trials
(Inguagiato et al., 2012; Inguagiato et al., 2013; Roberts, 2009). Although most previous
research has suggested that wounding does not influence anthracnose development in
ABG, results from the aforementioned trials indicate that wounding caused by VC or
sand topdressing may, at times, enhance disease severity. However, more research is
needed to test this hypothesis and determine under what conditions these practices might
affect disease.
ANTHRACNOSE DISEASE
Anthracnose, meaning blackening (from anthrax = carbon = black), is the name
applied to leaf diseases caused by fungi that produce their asexual spores (conidia) in an
acervulus (Agrios, 2005; Smiley et al., 2005). These diseases, particularly those caused
by members of the ascomycete genus Colletotrichum, occur worldwide and are very
common and damaging on numerous crop and ornamental plants including at least 42
genera of plants in the family Poaceae (Agrios, 2005; Crouch and Beirn, 2009). The
sexual state of Colletotrichum spp. is in the genus Glomerella, however the teleomorph is
either rare or absent and have not been observed on infected turfgrasses in the field
(Crouch and Beirn, 2009). The pathogen C. cereale lives saprophytically on residues in
turf (e.g., thatch) and usually colonizes senescing leaves and tillers, although it may
attack younger plant tissues (Smiley et al., 2005). The disease can occur at almost any
4
time of year and is manifested as either a foliar blight or a basal rot of crown, stolon and
root tissue.
Symptomology
Anthracnose foliar blight usually occurs during high temperatures in the summer
and causes a yellowing or reddish brown discoloration of leaves and ultimately thinning
of the canopy (Smiley et al., 2005). The foliar blight phase can also result in oblong,
reddish brown leaf lesions. Distinctive acervuli (fruiting bodies) with black setae can be
observed with a hand lens on green, yellow or tan acropetal tissue during this phase
(Smiley et al., 2005; Smith et al., 1989). However, the presence of acervuli on residues
in thatch does not indicate that healthy plants are infected (Smiley et al., 2005).
Anthracnose basal rot first appears on ABG putting greens during cool weather
(winter or spring) as orange or yellow spots 6 to 12 mm in diameter that become large,
irregularly shaped patches by late spring (Smiley et al., 2005). The disease progresses
slowly throughout the summer, and yellowing begins on the oldest leaves from the tips
progressing downward to sheaths (Smith et al., 1989). The youngest (central) leaf is the
last to turn yellow and eventually red (Smiley et al., 2005). Thus, plants may display
both green, healthy tillers and yellow-orange infected tillers during this phase Removing
sheath tissues reveals black, rotting, water-soaked crown and stem tissues from which
acervuli are produced (Murphy et al., 2008; Smiley et al., 2005). The blackening of these
tissues is due to the dark-colored, dendroid hyphae and dense mycelial aggregates of the
fungus (Smith et al., 1989). Anthracnose basal rot may not produce yellowing on leaf
and sheath tissue until stem tissues have begun to rot (Smiley et al., 2005). Root systems
5
of plants with basal rot are poor and necrotic, and plants usually die once they reach
advanced stages of this phase of the disease (Smiley et al., 2005; Smith et al., 1989).
Causal Agent
The etiological agent of anthracnose of ABG, C. cereale, is also associated with
13 other genera of grasses with C3 (cool-season) photosynthetic pathways as either
pathogens or endophytes (Crouch and Beirn, 2009). It was only recently that Crouch et
al. (2006) resurrected the name C. cereale for the causal agent of anthracnose disease of
the Poaceae, subfamily Pooideae including turfgrasses. The name C. graminicola sensu
lato G.W. Wilson, causal agent of anthracnose of maize (Zea mays L.), was
inappropriately employed to describe anthracnose of turfgrasses for the majority of the
20th
century. The separation of maize-infecting isolates and pooid-infecting strains was
performed using phylogenetic reconstructions with data sets from 107 Colletotrichum
isolates at three variable loci using phylogenetic and network-based methodologies.
Additionally, it was suggested that C. cereale may be a species group comprised of two
or more species, rather than a single species, but further research is needed to test this
hypothesis (Crouch et al., 2006).
Colletotrichum cereale was first described as a pathogen of grasses in Ohio, US
during the early-20th
century (Selby and Manns, 1909); however, Wilson (1914) grouped
the pathogen with C. graminicola when he reported the fungus to be ubiquitous in cereal
crops and bluegrasses (Poa spp.) in New Jersey. Severe outbreaks of the pathogen on
ABG were reported (as C. cereale) in New Jersey in 1928 (Sprague and Burton, 1937;
Sprague and Evaul, 1930). Researchers performed experiments documenting the
pathogenicity of the fungus on ABG and other grass species during the middle of the 20th
6
century (Smith, 1954; Sprague and Evaul, 1930; Wolff, 1947). The name C. graminicola
given to the fungus by Wilson (1914) was upheld by von Arx (1957) during this time.
Reports of increased disease severity during the late-1960s and early-1970s led
researchers to consider C. cereale (reported as C. graminicola) to be a more serious
pathogen of turfgrasses (Alexander, 1969; Couch, 1973). The first major epidemic of
anthracnose of maize also occurred during the early-1970s, causing destruction of maize
crops in north-central and eastern United States (Bergstrom and Nicholson, 1999).
Controversy erupted during the late-1970s and early-1980s regarding whether summer
decline of ABG was caused by C. cereale (reported as C. graminicola), environmental
stress, a multipathogen complex/syndrome or by a combination of some or all of these
factors (Bolton and Cordukes, 1981; Couch, 1979; Jackson and Herting, 1985; Vargas,
1980). However, Koch’s postulates were fulfilled during the mid-1980s to confirm the
pathogenicity of C. cereale (reported as C. graminicola) on ABG in the United States
(Vargas and Detweiler, 1985). Anthracnose caused severe destruction to golf course
putting greens in mid-western, northeastern and northwestern United States during the
early-1990s and continues to be a major management issue for golf course
superintendents worldwide (Murphy et al., 2012).
A distinct morphological feature of C. cereale is the presence of dark brown to
black, melanized acervuli. Acervuli first appear immersed, then erumpent on shoot
bases, leaf sheaths and leaves (Smith et al., 1989). Their diameters range from 20 to 200
µm when separate, but acervuli may become confluent in a dark, continuous stroma.
Dark-brown, sterile setae (hair-like structures) develop around or within acervuli. Setae
are irregularly septate with up to 7 septa, measure 32 to 120 µm x 6 to 8 µm, and their
7
bases may be swollen or not swollen (Crouch et al., 2006). Colonies of C. cereale grown
on potato dextrose agar may appear as a dark mat of setae, and heavy accumulations of
conidia often cast an orange hue to the brown/black culture. Cultures of the fungus can
exhibit hyphal (septate, hyaline, 2 to 5 µm wide) or mycelial (gray hue) growth, and
mycelia usually overtake the entire culture as colonies age. Conidia are falcate or
fusiform, apices acute, individually hyaline (salmon/orange color en mass), guttulate, and
measure 6 to 34 µm in length and 2 to 6 µm in width. Conidia germinate to form hyaline
germ tubes that produce dark brown to black, rounded and smooth or irregularly shaped
appressoria (9 to 12 µm x 7 to 10 µm).
Disease Cycle
The source of primary inoculum for infection of leaf sheaths and stolons by C.
cereale is conidia produced on overwintered residues in thatch (Crouch and Beirn, 2009;
Settle et al., 2006). Conidia formed in acervuli are disseminated to the upper leaves or to
nearby plants by splashing, blowing or mechanical means. Because little is known about
the disease cycle of C. cereale, it is useful to summarize what has been reported for other
Colletotrichum species or graminaceous hosts. In maize, conidia of C. graminicola are
capable of long-term survival because they are surrounded by an extracellular
mucilaginous matrix that contains self-inhibitor and antidessicant compounds that
prevent premature germination and drying out, respectively (Bergstrom and Nicholson,
1999). This matrix also contains proline-rich proteins and several degrading enzymes
that aid the fungus during the infection process.
To successfully colonize host tissue, Colletotrichum species form specific
structures during pre- and post-invasive phases of the infection (Münch et al., 2008).
8
During host epidermal cell invasion, conidia adhere to host tissue and produce a germ
tube from which a melanized appressorium forms. Appressoria can survive on the
surface of plant tissues for an extended period of time before penetrating the cuticle,
which may cause a delayed appearance of symptoms after inoculation (Bergstrom and
Nicholson, 1999). A penetration peg, formed from the appressorium, directly invades
epidermal cells through the cuticle and cell wall (Crouch and Beirn, 2009). This process
is facilitated by a combination of enzymatic degradation and a powerful mechanical force
equaling 17 μN (Bechinger et al., 1999; Bergstrom and Nicholson, 1999). Crouch and
Clarke (2012) provided perspective on this forceful penetration stating, “if a force of 17
μN was exerted across the palm of a human hand, that individual would be able to lift a
school bus weighing almost 17,000 pounds (7.7 metric tons).”
Following penetration, Colletotricha first establish an initial, short-lived
biotrophic phase that is followed by a destructive nectrophoic phase. During its
biotrophic phase, the fungus obtains nutrients from living host cells via primary hyphae
that do not kill the host cell but rather become invaginated in the host plasma membrane
(Bergstrom and Nicholson, 1999; Münch et al., 2008; Perfect et al., 1999). The fungus
must employ strategies to suppress plant defense responses to achieve this biotrophic
interaction with the host (Münch et al., 2008). One strategy used by C. graminicola is to
convert the surface-exposed chitin of primary hyphae to chitosan via deacetylation to
avoid detection and degradation by plant chitinases, which also prevents further host
plant defense responses (El Gueddari et al., 2002). Additional strategies used by
Colletotrichum species to avoid plant defense will be discussed in the next section.
9
The beginning of the destructive necrotrophic phase of Colletotricha is marked by
the formation of secondary hyphae. These smaller hyphae kill the host cell by either
secreting plant cell wall-degrading enzymes or inducing cell death by generating reactive
oxygen species and then branch out within the necrotic tissue (Münch et al., 2008).
Smith (1954) observed that once epidermal cells and the cortex of infected stems below
the crown of ABG become overrun by C. cereale (reported as C. graminicola), the
fungus invades the vascular system and plugs xylem and phloem cells with mycelium.
However, studies with C. graminicola have provided no evidence that anthracnose is a
vascular wilt pathogen of maize (Sukno et al., 2008; Venard and Vaillancourt, 2007a).
Nevertheless, the likelihood of plant death increases greatly once C. cereale has entered
advanced stages of infection (Smiley et al., 2005).
Conidia produced in acervuli on necrotic plant tissue serve as secondary inoculum
to rapidly disperse the C. graminicola and cause repeated disease cycles on maize
throughout the season (Bergstrom and Nicholson, 1999). When conditions are
unfavorable for growth, C. cereale overwinters on infected residues (mycelium, conidia
or acervuli in thatch) where it survives as a saprophyte (Crouch and Beirn, 2009).
Survival of Colletotrichum species in the soil is heavily dependent on environmental
conditions, temperature and other soil microflora. Cool temperatures favor survival of C.
graminicola, which can overwinter for lengthy periods as long as sufficient plant debris is
present (Crouch and Beirn, 2009; Smith et al., 1989; Vizvary and Warren, 1982).
However, C. graminicola is a poor competitor with other soil organisms when not on
plant residues (Lipps, 1983). Cultures of the fungus were killed within a few days when
covered with field soil in absence of maize residue (Vizvary and Warren, 1982).
10
Hemibiotrophy: Why does C. cereale switch lifestyles?
Infection studies in maize show that of C. graminicola switches from a biotrophic
to necrotrophic lifestyle 48 to 72 hours after inoculation, depending on environmental
conditions (Bergstrom and Nicholson, 1999; Münch et al., 2008). However, the
mechanisms responsible for this change are not fully understood and researchers have
debated this topic for years (Mims and Vaillancourt, 2002; Perfect et al., 1999). Two
recent studies analyzed the transcriptomes—the complete set of RNA transcripts in a cell
and their quantity during a specific developmental stage or physiological condition
(Wang et al., 2009)—of four Colletotrichum species, including C. graminicola, during
various stages of the infection process to provide insights into this transition (Gan et al.,
2013; McDowell, 2013). In both studies the transcript profiles of the biotrophic and
necrotrophic phases were very different from one another.
During the biotrophic phase, the production of small, secreted proteins (SSPs;
effector molecules) and secondary metabolism enzymes was up-regulated by C.
graminicola (Gan et al., 2013; McDowell, 2013). The pathogen uses these molecules
during colonization and biotrophy to reprogram plant host cells to avoid immune
responses that may be triggered by conserved microbe-associated molecular patterns
(MAMPS), such as chitin. Contrastingly, the switch to the necrotrophic phase is marked
by the up-regulation of degrading enzymes, toxins and nutrient transporters. These
findings relate to a previous study which found that a mutant strain of C. graminicola did
not produce visible symptoms in colonized maize tissue because it did not secrete a
sufficient quantity of cell wall degrading enzymes and, thus, could not make the
transition from biotrophy to the necrotrophy (Mims and Vaillancourt, 2002).
11
Transcriptomic, histological and biochemical studies performed by Vargas et al.
(2012) showed that maize cells induced defense mechanisms during infection by C.
graminicola, even during its biotrophic phase. These findings suggest that the fungus
does not completely suppress the plant defense mechanisms during its biotrophic phase,
contrary to previous belief. Also, the switch to the necrotrophic lifestyle by C.
graminicola was associated with the highest activation of defense responses in the maize
plant. Thus, the authors suggest that the pathogen switches to the necrotrophic phase to
escape the effect of the plant immune responses (e.g. production of reactive oxygen
species) and continue its pathogenic activity (Vargas et al., 2012).
Several abscisic acid (ABA)-responsive genes were also up-regulated during
infection by C. graminicola (Vargas et al., 2012), relating to previous work that indicated
the involvement of ABA in the regulation of plant defense in maize (Jiang and Zhang,
2001). In a separate experiment, exogenous applications of ABA increased anthracnose
disease severity in maize plants infected with C. graminicola (Vargas et al., 2012); the
disease increase corresponded with the production of secondary hyphae by C.
graminicola, indicating that the pathogen had switched to a necrotrophic lifestyle after
the application of ABA. Increased ABA concentration has also been reported to enhance
susceptibility of chili pepper fruits (Capsicum annuum cv. Nokkwang) to infection by C.
acutatum (Hwang et al., 2008). The exact mechanisms responsible for the switch in
lifestyles by C. cereale remain unknown, but there is increasing evidence that plant
physiological responses play an important role in the transition. Bostock and Stermer
(1989) outline extensive similarities between plant responses to wounding and infection
by pathogens, which include increased levels of ABA and reactive oxygen species.
12
Therefore, it is possible that plant responses to wounding may also induce a lifestyle
switch by C. cereale from biotrophic to necrotrophic resulting in increased disease
severity; however, more research is needed to test this hypothesis.
Epidemiology
The basal rot phase of C. cereale can affect ABG putting greens during almost
any time of the year, but the disease is generally most destructive during the hot, humid
conditions during the summer in cool temperate climates (Smiley et al., 2005; Smith et
al., 1989). Growth chamber, greenhouse and laboratory experiments have shown that
increased temperature (25 to 33 C) and increased leaf wetting period (12 to 72 hours) are
most conducive to infection by C. cereale (Bolton and Cordukes, 1981; Bruehl and
Dickson, 1950; Smith, 1954; Sprague and Evaul, 1930; Vargas et al., 1992). A multiple
regression model predicted greater foliar anthracnose severity of ABG at higher
temperatures (18 to 28 C) and leaf wetness greater than 18 hr; however, the model was
limited to an observed temperature range of 16 to 28 C (Danneberger et al., 1984).
Conidial germination and appressorium formation by C. graminicola has a broad
temperature range (15 to 35 C), but host penetration occurs within a much narrower
temperature range (25 to 30 C) (Skoropad, 1967).
Anthracnose epidemics have been observed to develop rapidly on cool-season turf
under overcast conditions (Smiley et al., 2005). These conditions promote high humidity
and extended leaf wetness, which are known to enhance disease activity and are
necessary for sporulation of Colletotrichum species (Bergstrom and Nicholson, 1999;
Smiley et al., 2005). Anthracnose severity on ABG increased after a period of hot, humid
weather caused by abnormally heavy rainfall and high temperatures in New Jersey in

13
1928 (Sprague and Evaul, 1930). Disease spread is obviously favored by rain because
conidia are most easily dispersed by splashing raindrops (Bergstrom and Nicholson,
1999).
Overcast conditions reduce light intensity. Schall et al. (1980) reported that
decreased light intensity in the greenhouse increased susceptibility of some maize
genotypes to C. graminicola, and correspondingly, increased light intensity enhanced
resistance of maize to anthracnose (Jenns and Leonard, 1985). Anthracnose resistance in
maize involves biosynthesis of phenolic compounds, which is a light-dependent process
(Nicholson and Hammerschmidt, 1992). However, conidia formation by C. cereale has
been shown to be promoted by increased light intensity, perhaps due to increased
temperature which is often associated with increased light intensity (Crouch and Clarke,
2012).
Stressful conditions are believed to be necessary for infection by C. cereale.
Plants grown in soils that are compacted, drain poorly or exhibit nutrient (nitrogen,
phosphorus or potassium) or water deficiencies are more susceptible to anthracnose
(Smiley et al., 2005; Sprague and Burton, 1937). Stresses from heat, drought or low
mowing are thought to cause ABG to be particularly susceptible to anthracnose (Smiley
et al., 2005). Additionally, abrasive cultural management practices such as topdressing,
aerification and vertical cutting create wounds which have been proposed to be means of
ingress by C. cereale. However, research regarding the effect of wounding on the
development of fungal diseases, especially anthracnose, on turfgrasses is contradictory.
A preliminary research study examined the effect of the type (puncture or
abrasion) and location (leaf or crown) of wounding on the development of anthracnose
14
basal rot on ABG plants grown in a greenhouse (Landschoot and Hoyland, 1995).
Results of this experiment showed that plants that were crown-wounded prior to
inoculation, regardless of the type of wound, resulted in faster development of
anthracnose basal rot symptoms compared to unwounded, inoculated plants. However,
plants that were wounded above the crown prior to inoculation did not produce
anthracnose symptoms. In a laboratory experiment performed by Orshinsky et al. (2012),
infection by the fungus Sclerotinia homoeocarpa F.T. Bennett, the causal agent of dollar
spot disease, was more rapid in leaves of creeping bentgrass that were wounded
immediately before inoculation compared to unwounded leaves. These results suggest
that wounding, especially of crown tissue, might increase anthracnose severity of ABG,
but more research should be performed to test this hypothesis.
A relationship may exist between the feeding and wounding activity of parasitic
nematodes or insects and anthracnose severity of ABG (Jackson and Herting, 1985;
Smiley et al., 2005). Anthracnose leaf blight was more severe in maize plants stressed by
the root lesion nematode (Pratylenchus hexincisus) (Nicholson et al., 1985), and
anthracnose stalk rot of maize has been associated with stem wounding by the European
corn borer (Ostrinia nubilalis Hübner) (Bergstrom and Nicholson, 1999; White, 1999).
Ingress of nonsenescent maize stem tissue by C. graminicola is thought to occur through
wounds caused by the European corn borer (Bergstrom and Nicholson, 1999).
Muimba-Kankolongo (1991) observed that C. graminicola entered wound sites on
maize plants via extremely long germ tubes and at times via hyphal strands. However,
Bruehl and Dickson (1950) reported that germ tubes of the fungus did not penetrate
leaves of Sudan grass (Sorghum vulgare var. sudanense (Piper) Hitchc.) through wounds
15
or stomata; rather the fungus entered the host directly with a penetration peg. Wounding
was also not necessary for C. graminicola to penetrate even the highly lignified fiber
cells in rind tissue of maize, although penetration through wounds resulted in a more
rapid and efficient infection (Venard and Vaillancourt, 2007b). Moreover, Smith (1954)
determined that C. cereale (reported as C. graminicola) penetrated ABG directly and that
wounds were not necessary for infection.
Fungal infection through wounds is transitory by nature. Anthracnose of maize
and black dot of potato (Solanum tuberosum L.) [caused by C. graminicola and C.
coccodes (Wallr.) S. J. Hughes, respectively] were dramatically reduced when
inoculation was delayed by as little as 1 to 2 h after wounding compared to sites
inoculated immediately after wounding (Johnson and Miliczky, 1993; Muimba-
Kankolongo, 1991; Muimba-Kankolongo and Bergstrom, 1992; Muimba-Kankolongo
and Bergstrom, 1990; Muimba-Kankolongo and Bergstrom, 2011). The decrease in
disease severity observed when inoculation was delayed after wounding is thought to be a
“wound healing” response (Muimba-Kankolongo, 1991; Muimba-Kankolongo and
Bergstrom, 1992; Muimba-Kankolongo and Bergstrom, 1990; Muimba-Kankolongo and
Bergstrom, 2011).
Wound healing has been reported to confer disease resistance in several
plant/pathogen relationships (Bostock and Stermer, 1989; Lipetz, 1970). Monocots
achieve disease resistance from wound healing by infusing cells adjacent to wounds with
an extensive layer of lignin or other phenols (Bostock and Stermer, 1989). Venard and
Vaillancourt (2007a) observed this response, reporting a thickening (lignification) of
walls of parenchyma cells around wound sites of maize tissue infected with C.
16
graminicola. Moreover, anthracnose resistance in maize has been linked to the
phenylpropanoid pathway, which produces lignin and numerous metabolites involved in
defense responses (Bergstrom and Nicholson, 1999; Bostock and Stermer, 1989).
Resistance to C. graminicola from a wound healing response was demonstrated in
a simple study that involved wounding maize plants at sites that were previously
unwounded or wounded, then inoculating these sites with the fungus immediately after
wounding (or re-wounding). Previously wounded sites produced significantly less
anthracnose than previously unwounded sites (Muimba-Kankolongo and Bergstrom,
1990). In a similar study, Kim (2008) found that anthracnose of chili pepper was also
reduced by a wound healing response. Thus, research in other Colletotrichum spp.
suggests that ABG might achieve some level of resistance to C. cereale via a wound
healing response; however, experiments need to be designed to test this hypothesis.
Hosts
The fungus C. cereale colonizes grasses of the subfamily Pooideae and is
pathogenic to many common cool-season turfgrass species such as ABG, creeping
bentgrass, fine fescues (Festuca spp.), Kentucky bluegrass (Poa pratensis L.), ryegrasses
(Lolium spp.) and velvet bentgrass (Agrostis canina L.) (Crouch and Clarke, 2012).
Isolates of C. cereale can display a high degree of host specificity, meaning that an
isolate that is highly pathogenic to one turf species may not be pathogenic to another
(Backman et al., 1999; Browning et al., 1999; Hsiang and Goodwin, 2001; Khan and
Hsiang, 2003). The fungus is typically most destructive on ABG and creeping bentgrass
putting greens, but is especially devastating to ABG possibly due to the weak perennial

17
natures of the species (Murphy et al., 2008; Sprague and Burton, 1937; Sprague and
Evaul, 1930).
Annual bluegrass (also known as annual meadow-grass in Europe) has the most
widespread distribution of all managed turfgrasses but is most commonly found as an
invasive, annual weed in maintained turf (Huff, 2003; Vargas and Turgeon, 2004). The
value of ABG as a turfgrass has been debated for over a century, and literature on the
subject can be segregated into two basic categories: (1) ABG as a turf or (2) ABG as a
weed (Huff, 2003).
Although ABG can produce an excellent dense turf under favorable conditions, it
has long been regarded as an undependable species (Sprague and Burton, 1937).
Research performed during the 1930s provided insight into the requirements for growth
of ABG (Sprague and Burton, 1937; Sprague and Evaul, 1930). The authors of these
studies concluded that the primary reason of ABG failure during mid-summer is the lack
of heat and drought tolerance of the species; thus, research emphasis was placed on
discovering and implementing effective methods for ABG control. However, researchers
during the late-1960s began to claim that that biotic stress from diseases and insects were
often the primary cause of ABG failure rather than heat or drought stress (Alexander,
1969; Vargas Jr., 1976). Subsequent research has provided insight on the conditions
under which ABG grows best and the measures necessary to control pest problems,
which ultimately allowed superintendents to successfully maintain healthy ABG during
the summer months (Beard et al., 1978; Vargas Jr., 1977). Thus, for the past half-century
there has been increased effort to try to manage ABG as an important and reliable
component of existing turfs (Huff, 1998; Vermeulen, 1989; Zontek, 1973). However,
18
ABG is still regarded as a weed by most turf managers and is very rarely planted as the
intended species in a sward (Vargas and Turgeon, 2004).
Annual bluegrass produces a fine-textured turf of high shoot density, uniformity,
and overall quality when maintained under optimal growing conditions (Beard, 1970).
Most major tournaments of the United States Golf Association (USGA) and Professional
Golfers Association (PGA), and some European tournaments are played on greens
composed, in whole or in part, of ABG (Vargas and Turgeon, 2004). Annual bluegrass
can be described, generally, as a bunch-type or weakly-stoloniferous turf with folded
vernation, an acute ligule (0.8 to 3 mm long), a prominent midrib on adaxial leaf surface,
a boat-shaped leaf tip and no auricles (Huff, 2003). Panicle-shaped inflorescences are
produced during most of the growing season, but are predominately visible in a flush
during the spring (Huff, 2003). The prolific production of viable seed by ABG, even
under close mowing, contributes to its competitive nature in putting greens (Huff, 1999).
Annual bluegrass is an allotetraploid (2n = 4x = 28) that is believed to have
originated in Europe from a natural cross between the creeping perennial P. supine
Schrad. (2n = 2x = 14) and the upright-growing P. infirma H.B.K. (2n = 2x = 14)
(Nannfeldt, 1937; Tutin, 1952). Poa annua displays an extremely large level of
variability within the species due to multiple hybridization and chromosome doubling
events that have taken place during its evolution (Huff, 1999). The two primary
morphological types of ABG are the bunch-type, upright growing annual type (P. annua
f. annua L.) and the perennial type (P. annua f. reptans [Hausskn.] T. Koyama.) which
has a more prostrate, spreading growth habit (Huff, 2003). The perennial type is
19
preferred for golf greens because it provides a dense, uniform turf that produces fewer
inflorescences and tolerates more environmental stress (Huff, 2003; Huff, 2004)
Annual bluegrass is known for its susceptibility to many turfgrass diseases such as
anthracnose, dollar spot, summer patch (Magnaporthe poae Landschoot & Jackson), and
brown patch (Rhizoctonia solani Kühn) (Huff, 2003; Smiley et al., 2005). Thus, plant
breeders have sought for over fifty years to identify and develop strains of ABG that
possess desirable traits such as disease resistance (Duff, 1978; Johnson et al., 1993;
Youngner, 1959). Bolton and Cordukes (1981) identified two strains of ABG that
demonstrated high levels of anthracnose resistance in the growth chamber. More
recently, Huff (1999) discovered biotypes of ABG that exhibit excellent field resistance
to anthracnose and dollar spot. However, there is an inadequate supply of commercially
available ABG seed for superintendents who need it to repair or overseed existing ABG
greens (Huff, 2004). The development of cultivated varieties ABG is challenged by the
limitations of low seed yield and the indeterminacy of seed maturity (Huff, 2003).
Another major issue with production of greens-type ABG is their reversion from a
perennial type to an annual type when left unmowed as space plants in the breeding field
(La Mantia and Huff, 2011).
Bonos et al. (2009) identified enhanced tolerance to anthracnose in the creeping
bentgrass cultivars ‘Shark,’ ‘Penneagle II,’ ‘Runner,’ ‘Penn A-1,’ ‘Tyee’ and ‘Authority,’
and the velvet bentgrass (A. canina L.) cultivar ‘Greenwich’ and high susceptibility in the
creeping bentgrass cultivars ‘Viper,’ ‘Providence,’ ‘Penncross,’ ‘Brighton,’ ‘Seaside II,’
and ‘Pennlinks II.’ However, the specific mechanisms of resistance to C. cereale
identified in ABG and creeping bentgrass remain unknown . In maize, general responses
20
to C. graminicola infection involve stimulation of phenolic compound biosynthesis,
specifically phenylpropanoids, which triggers the fortification (lignification) of the cell
wall near pre- and post-penetration infection sites to prevent penetration or expansion of
the fungus, respectively (Bergstrom and Nicholson, 1999). Research to determine the
mechanisms of anthracnose resistance in ABG and creeping bentgrass would advance
breeding efforts to improve anthracnose resistance in these species.
Chemical Control
Superintendents who manage ABG rely on chemical and cultural options for
control of anthracnose due to the lack of host resistance to C. cereale. Chemical control
of anthracnose is best achieved with a preventative fungicide program (Murphy et al.,
2008). In swards with a previous history of the disease, preventative fungicide programs
should be initiated one month before anthracnose symptoms normally occur and
continued biweekly throughout the growing season (Murphy et al., 2008; Young et al.,
2010a). Depending on how early disease symptoms occur and the geographical location,
fungicide programs for anthracnose control can extend from April through October and
provide a significant cost for superintendents who battle this disease (Bigelow and Tudor
Jr, 2012; Young et al., 2010a)
Currently, the most effective chemistries for the control of anthracnose include
the nitriles (chlorothalonil), sterol-inhibitors (DMIs), strobilurins (QoIs) and
benzimidazoles (where resistant isolates are not present), the antibiotic polyoxin-D,
phosphonates (fosetyl-AL and the phosphites), the dicarboximide iprodione, and the
phenylpyrrole fludioxonil (Murphy et al., 2008). Recently, Clarke et al. (2011) reported
that two-component mixtures of chlorothalonil, phosphonates, and DMIs provided the
21
best preventative control of anthracnose in NJ during severe disease epidemics. The
authors also found that rotating among chemical families with different biochemical
modes of action provided the best disease control compared to the sequential use of
single chemistries (Clarke et al., 2011; Murphy et al., 2008). In general, superintendents
should avoid sequential applications of the same chemistries, especially single-site
inhibitors, due to the risk of fungicide resistance developing.
Unfortunately, fungicide resistance has developed in C. cereale to site-specific
fungicides including the QoIs, benzimidazoles, and DMIs (Wong and Midland, 2004).
Resistance to benomyl (benzimidazole) appeared as early as 1989 in Michigan (Detweiler
et al., 1989). More recently, resistance to the fungicides azoxystrobin, thiophanate-
methyl, and reduced sensitivity to propiconazole has been reported for C. cereale isolates
collected from ABG and creeping bentgrass putting greens across the United States and
Japan (Avila-Adame et al., 2003; Crouch et al., 2005; Mitkowski et al., 2009; Wong et
al., 2008; Wong and Midland, 2007; Wong et al., 2007; Young et al., 2010a; Young et
al., 2010b). Populations of C. cereale resistant to azoxystrobin and thiophanate-methyl
developed rather quickly due to a G143A substitution in the cytochrome b protein and
two mutations in ß-Tubulin 2 Gene, respectively (Avila-Adame et al., 2003; Wong et al.,
2008; Wong et al., 2007; Young et al., 2010a; Young et al., 2010b). Whereas resistance
to DMI fungicides, particularly propiconalzole, has developed gradually through reduced
sensitivity (Wong and Midland, 2007).
Superintendents can delay resistance and achieve good disease control by: (1)
rotating fungicide classes, (2) avoiding low-label-rate applications, (3) avoiding late
curative applications, (4) using multi-site, contact fungicides and (5) tank-mixing
22
fungicides (Murphy et al., 2008). Moreover, superintendents should use integrated
disease management programs that emphasize cultural management practices that reduce
host susceptibility to anthracnose (Brent and Hollomon, 2007).
CULTURAL MANAGEMENT PRACTICES AFFECTING ANTHRACNOSE
The emergence of anthracnose as a devastating pest of ABG turf during the 1990s
has been associated with management practices employed by superintendents to improve
playability and ball roll distance (green speed) (Landschoot and Hoyland, 1995; Mann
and Newell, 2005; Vermeulen, 2003; Zontek, 2004). Numerous field studies have been
conducted during the last decade to evaluate the effect of cultural management factors
including N fertility, chemical growth regulation, mowing, rolling, irrigation, sand
topdressing, and cultivation on anthracnose severity of ABG (Murphy et al., 2008;
Murphy et al., 2012).
Fertility
Preceding the rise of anthracnose epidemics during the 1990s and 2000s, there
was a trend among superintendents to decrease nitrogen fertility as a strategy to increase
ball roll distance (Radko, 1985). Since then research has shown that low nitrogen fertility
is one of the most important factors that predispose annual bluegrass to anthracnose. The
exact mechanism responsible for disease reduction produced by increased nitrogen
fertility is unknown, but improved plant vigor has been suggested (Murphy et al., 2008;
White et al., 1978).
The most effective soluble-nitrogen programs for anthracnose suppression include
light, frequent applications (e.g., 4.9 or 9.8 kg ha-1
every 7 or 14 d) throughout the
summer (Inguagiato et al., 2008; Roberts et al., 2010). Roberts et al. (2010) found that

23
initiating a low rate, summer soluble N program before symptom expression (mid-May)
reduced disease compared to initiating N fertilization at the onset of disease (mid-June).
Subsequent research has determined that increasing N rate up to 9.8 kg ha-1
every 7 d
decreased disease; however, excessive N rates of 19.5 to 24.4 kg ha-1
every 7 d resulted
in dramatic increases in anthracnose severity by mid-summer (Murphy et al., 2011).
Research examining the effect of soluble N form found that potassium nitrate reduced
disease compared to all other forms tested (urea, ammonium nitrate, calcium nitrate,
ammonium sulfate); whereas ammonium sulfate had the greatest disease severity
(Schmid et al., 2012a). Schmid et al. (2012b) reported that granular nitrogen
(isobutylidene urea; IBDU) applied at rates 48.8 to 97.6 kg ha-1
was most effective when
applied in the spring compared to autumn. Thus, best management practices (BMPs) for
N fertility include applications of granular fertility in spring (48.8 to 97.6 kg ha-1
) and
light, frequent applications of soluble N (e.g., 9.8 kg ha-1
every 7 d) during late spring
and summer months (Murphy et al., 2012).
Growth regulation
Plant growth regulators (PGRs) have become an important tool used by many
superintendents to improve shoot density, reduce shoot elongation, increase
environmental stress tolerance, reduce ABG seedhead expression, and ultimately,
enhance playability of putting greens (Danneberger, 2003; Dernoeden, 2012); however,
the effect of PGRs commonly used on ABG [mefluidide (ME), ethephon (EP) and
trinexapac-ethyl (TE)] on anthracnose severity were previously unknown prior to the
early-2000’s (USDA-CSREES, 2005).

24
Inguagiato et al. (2008) found that ME and TE applications (0.106 and 0.050 kg
a.i. ha-1
yr-1
, respectively) typically had no effect on anthracnose of ABG or, at times,
inconsistently increased or decreased disease severity. Similarly, increased TE rate (0,
0.04, 0.05 and 0.08 kg a.i. ha-1
every 7 d) had little effect on anthracnose during a 3 yr
trial or slightly reduced disease (linearly) during high disease pressure (Inguagiato et al.,
2009b). Factorial studies that examined the effects of EP, ME and TE applied alone or in
various combinations indicated that ME had little effect on the disease; whereas, EP
treated plots had less disease than non-EP plots on 54% of rating dates and TE treated
plots had less disease than non-TE-treated plots on 75% of rating dates (Inguagiato et al.,
2010). Inguagiato et al. (2010) suggested that EP may reduce anthracnose by enhancing
plant vigor (fewer seedheads) or inducing plant defense against disease. The authors also
hypothesized that TE may reduce disease severity by increasing plant vigor and
improving N use efficiency. Additional research is needed to test these hypotheses. Best
management practices for PGRs include the frequent (every 7 to 14 d) application of
these chemicals to maintain optimal quality and playability without concern that they
may enhance disease severity on ABG putting greens (Murphy et al., 2012).
Mowing
Superintendents decrease cutting heights and increase mowing frequency to
achieve faster green speeds (increased ball roll distance). Low mowing has been known
for over a decade to increase anthracnose disease severity (Backman et al., 2002; Uddin
and Soika, 2003). Recently, Inguagiato et al. (2009a) reported that increasing mowing
height as little as 0.4 mm (e.g., 2.8 to 3.2 mm, or 3.2 to 3.6 mm) significantly reduced
disease severity. The authors suggested that carbohydrates and rooting may have been

25
enhanced at increased mowing heights, thus reducing plant stress and improving
tolerance to anthracnose; however, the exact mechanism responsible for decreased
disease severity observed with increased cutting height has yet to be confirmed.
Contrary to expectations, increased mowing frequency (double cutting)
(Inguagiato et al., 2009a) and increased equipment traffic on the perimeter of a putting
green (Roberts et al., 2012) did not increase anthracnose severity. Thus, BMPs for
mowing to reduce anthracnose severity include maintaining cutting heights of 3.2 mm or
greater and adopting practices such as double cutting or rolling to achieve faster green
speeds (Murphy et al., 2012).
Rolling
Lightweight rolling is used to smooth and firm the surface of putting greens
which can also increase green speed (Hartwiger et al., 2001). But like other cultural
practice that may cause stress, rolling has been reputed to predispose turf to anthracnose
(Smiley et al., 2005). However, recent research on ABG putting green turf showed that
lightweight rolling (applied with a vibratory or sidewinder unit every other day) had no
effect or reduced disease severity (Inguagiato et al., 2009a), even when traffic stress was
increased due to changing direction of the roller at the perimeter of a putting green
(Roberts et al., 2012). Additionally, lightweight rolling increased green speed without
causing any detrimental effects to turf quality or soil bulk density (Inguagiato et al.,
2009a; Nikolai et al., 2001; Roberts et al., 2012). Therefore, BMPs for rolling include
lightweight rolling every other day to maintain acceptable green speed rather than
decreasing N fertility or decreasing cutting height (Murphy et al., 2012).
26
Irrigation
Conditions that produce inadequate or excessive water can make ABG more
susceptible to anthracnose (Danneberger et al., 1984; Danneberger et al., 1995; Smiley et
al., 2005; Sprague and Evaul, 1930). Recent field research has provided insight on how
different irrigation regimes [40, 60, 80, and 100% replacement of reference
evapotranspiration (ETo)] influence anthracnose disease severity. Turf subjected to
frequent wilt stress during the summer (e.g. ≤ 60% ETo) was most susceptible to
anthracnose; however, replacing 100% ETo also increased disease severity by the end of
the summer (Roberts et al., 2011). Irrigation BMPs include applying sufficient irrigation
(60 to 80% ETo) to prevent wilt stress while also avoiding saturated soil conditions.
Sand Topdressing
Topdressing is the addition of a soil (usually sand) or soil mix to a turf surface
which is usually incorporated by brushing, matting, raking, vibratory rolling and/or
irrigating (Beard and Beard, 2005; Carrow, 1979; Foy, 1999). Light, frequent sand
topdressing of putting greens has been a growing trend in the turfgrass industry since the
1970s (Madison et al., 1974). Wounding caused by sand topdressing and associated
incorporation methods was thought to contribute to outbreaks of anthracnose, leading
superintendents to forgo the practice when the disease was active (Backman et al., 2002;
Smiley et al., 2005). Recent research has shown that although sand topdressing may
cause small, brief increases in disease severity soon after applications are initiated,
continued topdressing at 0.3 to 0.6 L m-2
every 7 to 14 d during the summer provided
substantial disease reductions for the duration of the studies (Inguagiato et al., 2012;
Inguagiato et al., 2013; Roberts, 2009). Topdressing at intervals of 21 or 42 d also

27
reduced disease, but to a lesser extent than more frequent sand topdressing treatments
(Inguagiato et al., 2012).
Sand topdressing has been suggested to reduce anthracnose by effectively raising
the cutting height and burying and protecting crowns and leaf sheaths from
environmental or mechanical stresses, thereby promoting plant vigor (Inguagiato et al.,
2010). Initial increases in anthracnose observed during the first year of topdressing trials
have been attributed to wounding of crowns that were not yet buried with sand
(Inguagiato et al., 2013). However, more research is needed to determine the exact
mechanisms responsible for the effects of sand topdressing observed on anthracnose.
Even under conditions of intense foot traffic equal to the amount of footsteps
around the hole of a putting green that received 200 rounds of golf d-1
(327 footsteps m-2
d-1
), sand topdressing applied at 0.3 L m-2
every 7 d reduced disease severity compared to
non-topdressed turf (Roberts, 2009). Moreover, methods of sand incorporation (vibratory
rolling, stiff- or soft-bristled brush, or none) or sand particle shape (round vs. sub-
angular) did not enhance disease severity (Inguagiato et al., 2013). In fact, sub-angular
sand reduced disease severity compared to round sand on some rating dates throughout
the trial (Inguagiato et al., 2013). Thus, best management practices for sand topdressing
include topdressing at 0.3 to 0.6 L m-2
every 7 to 14 d throughout the summer to dilute
thatch, create a better growing medium and develop a mat layer that provides protection
of crowns (Murphy et al., 2008).
Vertical Cutting
Vertical cutting (VC) reduces puffiness and other problems caused by excessive
thatch on putting green surfaces (Vargas and Turgeon, 2004). This practice has been

28
suspected to enhance anthracnose severity by wounding, which may promote fungal
ingress (Dernoeden, 2012; Landschoot and Hoyland, 1995; Smiley et al., 2005).
Contrary to previous suspicions, biweekly VC (3 mm depth) of an ABG putting
green had little effect on anthracnose severity during a 3 yr trial; however, on one rating
date VC increased disease on PGR-treated (TE) plots and decreased disease on low-N
plots (Inguagiato et al., 2008). Burpee and Goulty (1984) hypothesized that turf
cultivation (coring and verticutting) during the spring and fall might enhance anthracnose
resistance of ABG fairway turf. But, similarly, no cultivation treatment affected disease
development during their one year trial. Colletotrichum spp. in ABG and maize do not
require wounds to penetrate their host (Bruehl and Dickson, 1950; Smith, 1954; Venard
and Vaillancourt, 2007b). In fact, wound healing responses can often confer host
resistance to fungal invasion (Bostock and Stermer, 1989; Lipetz, 1970), as demonstrated
by enhanced resistance to Colletotrichum spp. via wound healing responses in maize and
chili pepper (Kim, 2008; Muimba-Kankolongo, 1991; Muimba-Kankolongo and
Bergstrom, 1992; Muimba-Kankolongo and Bergstrom, 1990; Muimba-Kankolongo and
Bergstrom, 2011).
Contrastingly, increased depth (0, 3.3 and 5.1 mm) of VC increased anthracnose
severity linearly on a mixed creeping bentgrass and ABG putting green inoculated with
an aqueous suspension of C. cereale spores (104 conidia mL
-1) (Uddin et al., 2008).
Based on Landschoot and Hoyland’s (1995) observation that wounding ABG plants only
at the crown, not leaves, immediately before inoculation resulted in increased disease,
Inguagiato et al. (2008) hypothesized that VC to a depth that wounds crowns may
increase anthracnose severity but VC to a depth that affects only leaves may not enhance

29
the disease. Therefore, current BMPs include VC at shallow depths to only affect leaf
tissue to prevent crown and stolon injury (Murphy et al., 2008).
Inoculation immediately after wounding potato (Solanum tuberosum L.) and
maize plants resulted in increased infection by Colletotrichum spp.; whereas, wounded
tissue was nearly as tolerant to pathogen ingress as unwounded tissue within 1 to 2 h after
wounding (Johnson and Miliczky, 1993; Muimba-Kankolongo and Bergstrom, 1990).
Uddin et al. (2008) did not specify the timing of inoculation in their study, but if the
spore suspension was applied immediately after VC, then their report that VC increased
disease would relate to the previous research regarding the timing of wounding and
inoculation. Additional research is needed to confirm the influence of inoculation timing
after wounding on anthracnose of ABG putting green turf.
Epidemics of C. cereale on golf course putting greens occur naturally, not by
inoculation, during periods of high temperature, high humidity and prolonged leaf
wetness (Bolton and Cordukes, 1981; Bruehl and Dickson, 1950; Danneberger et al.,
1984; Smiley et al., 2005; Smith, 1954; Sprague and Evaul, 1930; Vargas et al., 1992).
Vertical cutting is usually applied when the turf canopy is dry (Beard, 2002); thus, the
timing of VC on golf courses typically would not typically occur in association with the
timing of environmental conditions most conducive for infection by the pathogen.
However, more research is needed to evaluate the how environmental conditions might
affect the influence of VC on anthracnose disease severity of ABG putting green turf.
Vertical cutting removes thatch, which is where C. cereale is believed to survive
on previously infected plant debris during unfavorable environmental conditions (Crouch
and Clarke, 2012; Settle et al., 2006; Smiley et al., 2005). Thus, VC may help to
30
contribute to reducing anthracnose by removing inoculated debris in thatch while also
improving the surface medium for plant growth. Anthracnose severity in maize is less
dramatic when plant debris is removed from field after harvest (Bergstrom and
Nicholson, 1999). Thus, additional research is needed to evaluate the effect of removal
of plant debris (thatch) on the severity of anthracnose on ABG putting green turf.
CULTURAL PRACTICES FOR THATCH MANAGEMENT
Superintendents commonly use cultural management practices such as sand
topdressing and cultivation to control thatch accumulation. Thatch is an intermingled
organic layer of dead and living shoots, stems, and roots that develops between the zone
of green vegetation and the soil surface. Mat is an intermixed layer of thatch and mineral
matter (e.g., sand) between the thatch and soil surface commonly found on greens and
other areas that have been topdressed (Beard and Beard, 2005). Thatch develops when
organic matter is produced at a rate faster than it is decomposed (Waddington, 1992).
Therefore, thatch accumulation is stimulated by climatic, edaphic or biotic factors that
promote organic matter production and/or inhibit its decomposition such as excessive N
fertility, high soil water content, anaerobic conditions, inadequate cultivation and/or
topdressing, and soil pH less than 6 (Beard, 1973; Carrow, 2003; Christians, 2011; Hurto
et al., 1980; Waddington, 1992).
A thin layer of thatch (≤ 6 mm) is considered beneficial to putting greens because
it insulates the soil from temperature extremes, provides resiliency to turf, and increases
wear tolerance (Beard, 1973). However, excessive thatch accumulation causes numerous
management problems including increased incidence of hydrophobicity and localized dry
spots, reduced water infiltration rates, reduced hydraulic conductivity, chlorosis, and

31
reduced pesticide effectiveness (Beard, 1973; Beard, 2002; Christians, 2011;
Waddington, 1992). Excess thatch is also associated with increased incidence of the
diseases brown patch, dollar spot, leaf spot (caused by Drechslera poae), snow molds
(Typhula spp.), and stripe smut (caused by Ustilago striiformis) (Beard, 1973). Another
deleterious effect of excess thatch is the elevation of crowns and reduction of rooting into
the underlying soil, thus creating a puffy turf surface that is prone to scalping, high or low
temperature stress, drought stress, foot printing and inconsistent ball roll (Beard, 1973;
Christians, 2011; Hurto et al., 1980; Ledeboer and Skogley, 1967).
Recommendations for optimal levels of surface organic matter in putting greens
range from 15 to 80 g kg-1
(Gaussoin et al., 2013); many authors recommend managing to
maintain an organic matter level of 40 g kg-1
(Carrow, 2003; Moeller, 2008; O'Brien and
Hartwiger, 2003). The three basic approaches to manage thatch accumulation are to: 1)
enhance its degradation, 2) dilute it with topdressing, or 3) mechanically remove it via
cultivation. Enhanced degradation involves using management practices or products that
promote the microbial decomposition of thatch (Gaussoin et al., 2013). The following
sections will discuss the secondary cultural management practices of sand topdressing
and cultivation and how they influence the thatch and mat layer.
Sand Topdressing
Recognized benefits of a good topdressing program include a smooth, firm
putting green surface; increased shoot density; reduced thatch; protection against winter
injury; reduced grain; and better movement of air, water, nutrients and roots into soil
(Beard, 2002; Cooper, 2004; Kowalewski et al., 2010; Zontek, 1979). Today the most
common topdressing program involves light-rate, frequent applications of sand on putting
32
greens, yet the widespread adoption of this program has only occurred within the last four
decades (Cooper, 2004; Zontek, 1979).
The practice of topdressing is believed to have been invented by Old Tom Morris
(1821-1908), pioneer of the game of golf and greenskeeper at St. Andrews Golf Course in
Scotland (Labance and Witteveen, 2002). In those days topdressing was applied using
wheelbarrows and shovels and applications were uneven, time-consuming and laborious
(Aylward, 2010). In fact, Old Tom Morris was thought to have discovered the benefits of
topdressing accidentally when he spilled a wheelbarrow of sand on a putting green and
noted the increased quality of that green thereafter (Hurdzan, 2004).
Piper and Oakley (1917) were among the first to publish recommendations for
topdressing in the United States, citing the benefits of “sanding” clay soil greens a few
times per season at a rate of 1.65 L m-2
to improve surface characteristics and provide
winter protection. Shortly after, agronomists from the U.S. Golf Association Green
Section (1925) noted that heavy, infrequent applications of compost topdressing could be
replaced more lighter-rate applications as often as every 7 d. The material used for
topdressing varied greatly from location to location, but the majority of superintendents
during this time were using a mix of sand, finer-textured soil and organic matter
(Bengeyfield, 1969; Carrow, 1979). Regardless of the material used, most topdressing
practices were suspended during the late-1930s and 1940s due to shortages in labor,
equipment and materials caused by the second World War (Bengeyfield, 1969). The
advent of the mechanical aerifier during the late-1940s also led to reduced topdressing
because many managers incorporated soil removed during coring instead of topdressing
(Bengeyfield, 1969). Although some scientists encouraged the use of frequent
33
topdressing at rates of 1.65 L m-2
(Musser, 1950), putting greens were generally
topdressed twice per year at most before the mid-1970s (Cooper, 2004).
The trend of frequent sand topdressing during the second half of the 20th
century
can be attributed primarily to research initiated by Dr. John Madison and coworkers at
the University of California at Davis during the late-1950s. Similar to Old Tom Morris,
Dr. Madison observed the benefits of sand topdressing accidentally when sand from a
nearby pile blew onto the corner of a research field and enhanced the quality of the
affected plots. Madison et al. (1974) promoted the use of a sand-only topdressing
medium because it was cheaper, easier to apply, and provided better protection from the
heavy traffic caused by increased play during the 1960s compared to sand-soil-peat
mixes. The authors recommended applying sand at a rate of 0.91 L m-2
every 21 d to
avoid creating alternating layers of sand and thatch. The advent of the first mechanized
topdresser in 1960s made topdressing at these rates and frequencies practicable for
superintendents, leading to the widespread adoption of the practice by the late-1970s
(Aylward, 2010; Cooper, 2004; Zontek, 1979).
Hall (1979) warned against using sand-only mediums because of the potential to
produce excessive water infiltration, excessive nutrient leaching, lower microbial activity,
hydrophobic drying, lower water availability, and susceptibility to layering. However,
proponents of a sand-only topdressing medium considered adding more organic matter to
be illogical because a primary benefit from topdressing is to prevent excessive organic
matter (thatch) accumulation (Cooper, 2004; Hummel, 1995). This debate continued into
the mid-1990s, but today an overwhelming majority of superintendents use a sand-only
medium for topdressing for the same reasons provided by Madison et al. (1974): sand is
34
cheaper, easier to apply, resistant to compaction, and free of organic matter (Cooper,
2004; Hummel, 1995).
Topdressing has become as routine as fertilization (Hummel, 1995). Modern
mechanized topdressers and material handlers allow for precise and accurate topdressing
applications to 18 greens in less than an hour (Aylward, 2010). Additionally, modern
equipment can apply sand at very low rates, allowing managers to topdress more
frequently. O'Brien and Hartwiger (2003) reported that 0.15, 0.6 and 1.2 L m-2
are
considered light, moderate and heavy rates of sand topdressing, respectively, and
topdressing is now applied as often as every 7 d on golf course putting greens (Aylward,
2010). However, many superintendents still lack a basic understanding of the impact of
topdressing programs on turfgrass health, good or bad, and the importance of choosing
the correct material, rate, timing and frequency of application (Hummel, 1995).
Additionally, superintendents lack a target quantity of sand needed to achieve the benefits
gained from a sound topdressing program (O'Brien and Hartwiger, 2003).
The primary considerations for developing a topdressing program are the
material, timing, frequency, rate, and method used for topdressing (Gaussoin et al.,
2013). Labor, material and equipment expenditures must be allowed for a successful
topdressing program; flawed programs can cause permanent damage that may require
expensive reconstruction (Beard, 2002; Carrow, 1979; Christians, 2011)
Particle size distributions and chemical compositions can vary greatly among
sands (Carrow, 1979), so it is recommended that only sands that meet USGA
specifications for putting green root zone mix be used for topdressing (Green Section
Staff, 2004). As a general rule, the texture of a topdressing material should be the same

35
or coarser than the texture of the underlying soil (Christians, 2011); however, researchers
have examined the effects, positive or negative, of using finer-textured sands for
topdressing (Moeller, 2008; Murphy and Hempfling, 2011; Taylor, 1986).
Topdressing rates should be based on the amount of sand required to fill the
thatch and the frequency of application should match the rate of thatch-verdure
accumulation (Beard, 1978; Beard, 2002; Madison et al., 1974). Light, frequent
topdressing reduces the production of alternate sand/thatch layers if matched with the rate
of thatch accumulation and minimizes interruption to play caused by excess sand on the
putting surface (Aylward, 2010; Cooper, 2004; Cooper and Skogley, 1981; Davis, 1977;
Fermanian et al., 1985; Hummel, 1995; Madison et al., 1974; O'Brien and Hartwiger,
2003; Zontek, 1983).
The extent to which benefits from topdressing are achieved depends upon the
frequency of application and the annual amount of sand applied to a putting green (Beard,
1978). O'Brien and Hartwiger (2003) outlined strategies to apply 12.2 to 15.2 L m-2
of
sand per year, a sufficient annual amount to maintain the concentration of organic matter
below a threshold of 40 g kg-1
(Carrow, 2003). The authors suggested applying 4.3 to
13.4 L m-2
of the annual sand amount as surface topdressing and the rest as back-fill after
cultivation.
Research regarding the effect of topdressing on turf diseases is limited to
incidental reports of disease outbreaks during trials with objectives unassociated with
disease incidence. Some studies found that dollar spot severity of creeping bentgrass and
velvet bentgrass putting green turf was increased by topdressing with sand, soil, or
sand/soil mixes (Cooper and Skogley, 1981; Engel and Alderfer, 1967; Fermanian et al.,

36
1985); whereas, Carrow et al. (1987) and Stier and Hollman (2003) reported that dollar
spot severity of ‘Tifway’ bermudagrass [Cynodon dactylon (L.) Pers. X C. transvaalensis
(Burtt-Davis)] managed as a homelawn and creeping bentgrass and ABG putting green
turf were not affected by sand topdressing, and Henderson and Miller (2010) reported
that sand topdressing reduced dollar spot on creeping bentgrass fairway turf. Outbreaks
of pythium blight (caused by Pythium spp.) and brown patch were reported to be more
severe on creeping bentgrass putting green turf that received a light, frequent sand
topdressing compared to turf that received a heavy, infrequent sand topdressing
(Shearman, 1984). Hawes (1980) reported that spring dead spot (Ophiosphaerella spp.)
of bermudagrass (Cynodon dactylon L.) mowed at 1.9 cm was reduced by sand
topdressing.
Recently, trials were initiated to evaluate the effects of sand topdressing
anthracnose on ABG putting green turf (Inguagiato et al., 2012; Inguagiato et al., 2013;
Roberts, 2009). Although topdressing briefly increased disease during the first year of
these trials, results indicated that cumulative annual amounts of 2.4 to 4.8 L m-2
of sand
applied every 7 to 14 d at rates of 0.3 to 0.6 L m-2
during the summer dramatically
reduced anthracnose severity (Inguagiato et al., 2012). However, topdressing at these
rates and frequencies during the summer can be an expensive and laborious practice for
golf course superintendents and can potentially interrupt play on the golf course for
several days after the application (Bigelow and Tudor Jr, 2012; O'Brien and Hartwiger,
2003; Vavrek Jr., 1995). Therefore, superintendents usually apply topdressing at rates
and frequencies less than the programs outlined above during the summer (Inguagiato et
al., 2012). It is apparent that more research is needed to identify sand topdressing
37
programs (i.e., rates and timings) that reduce anthracnose and provide acceptable playing
conditions throughout the summer.
Light, frequent topdressing during mid-summer is often supplemented with
higher-rate topdressing applied alone or in conjunction with cultivation events during the
spring and autumn when play is minimal (O'Brien and Hartwiger, 2003). Topdressing
during the spring and autumn is generally less expensive to implement and less disruptive
to play than summer topdressing programs. However, it is not known whether
topdressing during these time affects anthracnose severity or the impact of summer
topdressing on this disease. Also, more research is needed to explain the brief increases
in anthracnose reported in previous topdressing trials.
Cultivation
Turf cultivation is a broad term that includes many mechanical practices used to
modify the turf and/or root zone without destroying the turf (Bidwell, 1952; Dawson,
1934; Dawson and Ferro, 1939; Engel and Alderfer, 1967). Cultivation enhances
growing conditions in the surface root zone by decreasing compaction of the soil and,
thus, improving soil gas exchange, wetting and drying, water infiltration, root growth,
and response to fertilizers (Christians, 2011; Turgeon, 2011). Methods of cultivation
include tining (hollow or solid), spiking, slicing, drilling, vertical mowing (shallow;
grooming and deep; scarifying), and injecting air or water (Gaussoin et al., 2013).
One of the most common and effective practices used to manage thatch and
improve edaphic conditions is hollow tine cultivation, or coring (Beard, 1973; Christians,
2011). Coring is usually performed during the spring and/or autumn by using a machine
equipped with hollow tines to remove cores of soil, which creates vertical channels in the

38
surface root zone. The channels are typically back-filled with sand (Hartwiger and
O’Brien, 2001; Murphy and Rieke, 1994). Coring is rarely practiced during midseason
because it creates an uneven playing surface that can take several days or more to return
to normal (Christians, 2011). However, cultivation practices such as solid-tining and VC
can be used during midseason because they produce less disruption of the turf surface and
require less equipment and labor expenses (McCarty et al., 2007; Murphy et al., 1993).
Solid-tine cultivation, synonymous with the terms “forking, needle-tining,
punching, spiking, or venting,” penetrates the soil with solid tines (6 to 19 mm diameter)
mounted on the same machine used for coring and creates channels without removing
soil or turf (Beard, 1973; Beard, 2002; Brotherton, 2011; Carrow, 2003; Carrow and
Petrovic, 1992; Christians, 2011; Hartwiger and O'Brien, 2011). Benefits of solid-tining
include increased saturated hydraulic conductivity, increased soil porosity, increased
shoot density, increased overall turf quality, reduced soil electric conductivity, and
reduced soil compaction (Carrow, 1996; Carrow, 2003; Green et al., 2001; Murphy et al.,
1993).
Vertical cutting (VC), sometimes called “vertical mowing, verticutting, power
raking, vertical slicing, or dethatching,” can be performed with a variety of mechanical
devices equipped with vertically rotating blades that cut into a turf at varying depths,
blade spacings and blade thicknesses (Beard, 1973; Beard, 2002; Christians, 2011;
Gaussoin et al., 2013; Turgeon, 2011).
Shallow VC, or grooming, mainly slices leaves and sometimes stolons and is most
often performed to control grain, a condition where grass blades lay in a single direction
and affect ball roll (Beard, 2002; Christians, 2011; Gaussoin et al., 2013). Frequent
39
grooming also removes ABG seedheads and contributes to thatch control, especially
when combined with sand topdressing (Beard, 2002). Grooming equipment usually has a
thin blades (≤ 1 mm), a close blade spacing (5 to 19 mm), and a shallow operating depth
(0.4 to 0.8 mm below the effective height of cut) (Beard, 2002).
Moderate VC, or verticutting, cuts deeper into the canopy than grooming and
affects mostly leaf and stolon tissue but sometimes the crowns (Turgeon, 2011). Benefits
from verticutting are similar to grooming; however, the greater depth of verticutting
removes more thatch than grooming. Blades on verticutting equipment may be thicker (≤
2 mm) and spaced wider apart (13 to 19 mm) than blades on grooming equipment (Beard,
2002).
Deep VC, or scarifying, cuts through leaves, stolons and crowns and into the
upper root zone. Scarifying is useful for preparing turf surfaces for seeding during
renovation procedures or for correcting serious thatch problems (Beard, 2002; Turgeon,
2011). Scarifying blades can be as thick as 3 mm and spaced up to 40 mm apart and are
generally operated to depths up to 40 mm (Beard, 2002; Landreth et al., 2008). Research
suggests that scarifying is the best option for thatch removal if the target area is within
the first 40 mm depth of the turf surface (Lockyer, 2009). Landreth et al. (2008) reported
that scarifying removed more organic matter from the surface 25 mm of a putting green
rootzone than core cultivation. The greatest blade thickness (3 mm) removed the most
organic matter; however, that treatment also required the most time for healing (nearly 60
days). Thus, intensive scarifying should only be practiced when large amounts of organic
matter must be removed at once and a longer recovery time can be tolerated (Landreth et
al., 2008).
40
Stresses caused by excessive thatch or soil compaction may predispose turfgrasses
to diseases, thus cultivation practices are often recommended for disease management
(Smiley et al., 2005). Tisserat and Fry (1997) reported that a combination of hollow-tine
aeration plus VC to scarify the soil surface to a depth of 7 mm performed twice each year
was moderately effective in reducing spring dead spot in bermudagrass. Summer patch
was also reduced by deep and shallow coring on an ABG fairway (Clarke et al., 1995).
Mechanical thatch removal by VC (unknown depth) reduced dollar spot disease of
‘Merion’ Kentucky bluegrass (Poa pratensis L.) (Halisky et al., 1981).
Cultivation may enhance resistance to diseases through a wound response
mechanism. Moeller (2008) hypothesized that cored and topdressed creeping bentgrass
putting green plots had reduced dollar spot severity compared to plots that were only
topdressed because of increased production of phytoalexins, secondary metabolites
involved in plant defense responses, in the cored plots. However, these results appear to
contradict a previous report that coring had no effect on dollar spot incidence in creeping
bentgrass or ABG putting green turf (Stier and Hollman, 2003).
Cultivation can induce plant stress and create wounds, both of which are thought
to potentially enhance disease (Smiley et al., 2005). Carrow et al. (1987) reported that
VC and coring may have weakened bermudagrass turf maintained as a homelawn and
caused dollar spot to be more severe. Vertical cutting (2 mm depth) also increased dollar
spot in ‘Tifeagle’ bermudagrass putting green turf (Unruh et al., 2005).
The research summarized immediately above and in previous sections suggests
that cultivation practices may affect turf diseases, such as anthracnose, in a variety of
ways. Cultivation may decrease disease severity by: 1) alleviating stresses that may

41
promote disease caused by excess thatch or soil compaction or 2) producing a wound
healing response. Contrastingly, cultivation may increase disease severity by: 1)
promoting fungal ingress through wounds, 2) causing stress which can increase host
susceptibility, or 3) inducing certain plant responses which may cause pathogens to
become more destructive (e.g., triggering a hemibiotroph to become necrotrophic).
Summer cultivation has been suggested to improve summer stress tolerance of
ABG (Green et al., 2001). However, observational reports from the field have claimed
that anthracnose epidemics were enhanced after cultivation events (Landschoot and
Hoyland, 1995; Raisch, 2003), presumably caused by increased invasion of C. cereale
through wounds (Smiley et al., 2005). Field research has shown that VC, especially at
increased depths, can enhance anthracnose disease severity (Uddin et al., 2008).
Furthermore, wounding of ABG crown tissue resulted in more rapid disease development
compared to wounding of leaf tissue or no wounding in a greenhouse study (Landschoot
and Hoyland, 1995). Inguagiato et al. (2008) suggested that VC to a depth that injures
crown tissue may increase disease severity; whereas, shallow VC that affects only leaf
tissue should not affect disease. Additional research is needed to test this hypothesis.
Moreover, there is a lack of research regarding the effect of other mid-season cultivation
practices such as solid-tining initiated when symptoms of anthracnose first appear.
42
SUMMARY
The general aim of the research included in this thesis was to evaluate the effects
of various sand topdressing programs and mid-season cultivation practices on
anthracnose severity of ABG putting green turf. Previous work has shown that frequent,
moderate-rate sand topdressing during the summer reduces anthracnose disease; however,
this practice is associated with increased cost, labor and interruption to play. It is not
known whether applying heavy-rate topdressing during periods of less play, such as
spring, affects disease severity or the need for or benefits of summer topdressing.
Sand topdressing briefly enhanced disease severity during the first year of
previous trials, presumably due to wounding of crowns not yet protected by a mat layer
(Inguagiato et al., 2012; Inguagiato et al., 2013). Thus, researchers have suggested that
increased anthracnose severity observed on golf course putting greens that have been
topdressed may be an indication of insufficient topdressing rates or intervals (Inguagiato
et al., 2012). Furthermore, it is often recommended that topdressing programs not be
initiated during times when disease is active; however, research is needed to test this
hypothesis.
Similarly, there have been observational and empirical reports that wounding
caused by mid-season cultivation practices may increase anthracnose disease severity
(Inguagiato et al., 2008; Landschoot and Hoyland, 1995; Raisch, 2003; Smiley et al.,
2005; Uddin et al., 2008). Summer cultivation has been suggested to improve summer
stress tolerance of ABG (Green et al., 2001); however managers often forgo these
practices for fear of enhancing anthracnose disease severity especially when disease
symptoms are present. Research regarding the effect of mid-season cultivation is limited
43
and results are varied (Burpee and Goulty, 1984; Inguagiato et al., 2008; Uddin et al.,
2008); thus, it would be helpful to provide information to managers regarding which
cultivation practices, if any, affect anthracnose severity.
Previous greenhouse work showed that wounding ABG crown tissue increased
anthracnose disease severity but wounding leaf tissue had no effect (Landschoot and
Hoyland, 1995). Similarly, Uddin et al. (2008) found that increasing the depth (0, 3.3
and 5.1 mm) of VC caused a linear increase in anthracnose disease severity on a mixed
stand of creeping bentgrass and ABG maintained as putting green turf; whereas,
Inguagiato et al. (2008) found that VC an ABG putting green to a depth of 3 mm had
little effect on the disease. Field research is needed to test whether VC to a depth that
affects crowns (in addition to leaves and sheaths) influences disease compared to VC to a
depth that only affects leaves.
Anthracnose of ABG causes severe damage to putting greens across the world,
and options for control of this disease through host resistance or fungicide use are absent
or becomingly increasingly limited, respectively. Therefore, it is important to find ways
to augment these control methods by refining cultural management practices to decrease
susceptibility of ABG putting green turf to anthracnose.
RESEARCH OBJECTIVES
Research was undertaken to determine the effects of sand topdressing and mid-
season cultivation on anthracnose of ABG putting green turf beyond those previously
studied by Inguagiato et al. (2008,2012,2013), Roberts (2009), and Uddin et al. (2008).
This research will contribute meaningful information for golf course managers who battle
anthracnose. The specific research objectives were to:

44
1. Determine the effect of spring topdressing on anthracnose severity as well as the
potential for this factor to interact with the effects of summer topdressing
(Chapter 2).
2. Assess the impact of biweekly sand topdressing on anthracnose disease severity
when initiated during the early stages of disease symptoms (Chapter 3).
3. Evaluate the influence of grooming, verticutting, scarifying and solid-tining on
anthracnose severity when applied at the onset of disease symptoms (Chapter 4)
4. Examine the effect of depth of VC on anthracnose disease severity (Chapter 5).
45
REFERENCES
Agrios, G.N. 2005. Plant Pathology. Elsevier Inc., San Diego, CA.
Alexander, P.M. 1969. Anthracnose-Serious Disease Problem. U.S Golf Assoc. Green
Section Record 7(5):8-9.
Avila-Adame, C., G. Olaya, and W. Köller. 2003. Characterization of Colletotrichum
graminicola isolates resistant to strobilurin-related QoI fungicides. Plant Dis.
87(12):1426-1432.
Aylward, L. 2010. How topdressing became an art: Superintendents used to use
wheelbarrows and shovels. How times have changed. Golfdom 66(2):38-40.
Backman, P., G. Stahnke, and E. Miltner. 2002. Anthracnose update: Cultural practices
affect spread of disease in northwest. Turfgrass Trends 11:T1-T2, T4.
Backman, P.A., P.J. Landschoot, and D.R. Huff. 1999. Variation in Pathogenicity,
Morphology, and RAPD Marker Profiles in Colletotrichum graminicola from
Turfgrasses. Crop Sci. 39(4):1129-1135. DOI:
10.2135/cropsci1999.0011183X003900040030x.
Beard, J.B. 1970. An ecological study of annual bluegrass. U.S. Golf Assoc. Green
Section Record 8(2):13-18.
Beard, J.B. 1973. Turfgrass: Science and culture. Prentice Hall, Englewood Cliffs, NJ.
Beard, J.B. 1978. Topdressing Overview. Proc. 48th Annu. Michigan Turfgrass Conf.
7:36-39.
Beard, J.B. 2002. Turf management for golf courses. 2nd ed. Ann Arbor Press, Chelsea,
MI.
Beard, J.B., and H.J. Beard. 2005. Beard's turfgrass encyclopedia for golf courses,
grounds, lawns, sports fields. Michigan State Univ. Press, East Lansing, MI.

46
Beard, J.B., P.E. Rieke, A.J. Turgeon, and J.M. Vargas Jr. 1978. Annual bluegrass (Poa
annua L.): description, adatpation, culture and control. Michigan State Univ.
Agric. Exp. Stn. Res. Rep. 352.
Bechinger, C., K.-F. Giebel, M. Schnell, P. Leiderer, H.B. Deising, and M. Bastmeyer.
1999. Optical Measurements of Invasive Forces Exerted by Appressoria of a Plant
Pathogenic Fungus. Science 285(5435):1896-1899. DOI:
10.1126/science.285.5435.1896.
Bengeyfield, W.H. 1969. This year: Top-dress greens and see the difference. U.S. Golf
Assoc. Green Section Record 7(1):1-4.
Bergstrom, G.C., and R.L. Nicholson. 1999. The biology of corn anthracnose: knowledge
to exploit for improved management. Plant Dis. 83(7):596-608.
Bidwell, W. 1952. Reducing thatch brings back healthy turf. Golfdom 26(3):78,80,82.
Bigelow, C.A., and W.T. Tudor Jr. 2012. Economic analysis of creeping bentgrass and
annual bluegrass greens maintenance. Golf Course Manage. 80(10):76-78, 80, 82,
84, 86, 88, 90-93.
Bolton, A.T., and W.E. Cordukes. 1981. Resistance to Colletotrichum graminicola in
strains of Poa annua and reaction of other turfgrasses. Can. J. Plant Pathol.
3(2):94-96.
Bonos, S.A., E.N. Weibel, T.J. Lawson, and B.B. Clarke. 2009. Tolerance of creeping
bentgrass cultivars and selections to anthracnose in New Jersey. [Online]. Appl.
Turfgrass Sci.(August):1-4.
Bostock, R.M., and B.A. Stermer. 1989. Perspectives on Wound Healing in Resistance to
Pathogens. Annu. Rev. Phytopathol. 27(1):343-371. DOI:
doi:10.1146/annurev.py.27.090189.002015.
Brent, K.J., and D.W. Hollomon. 2007. Fungicide resistance in crop pathogens: how can
it be managed? FRAC Monogr. No. 1. Crop Life International, Brussels.
Brotherton, M.A. 2011. Influence of Cultural Practices on Creeping Bentgrass Putting
Green Quality, Disease Incidence, and Organic Matter Dynamics. M.S. Thesis:
North Carolina State Univ.
47
Browning, M., L.V. Rowley, P. Zeng, J.M. Chandlee, and N. Jackson. 1999.
Morphological, pathogenic, and genetic comparisons of Colletotrichum
graminicola isolates from Poaceae. Plant Dis. 83(3):286-292.
Bruehl, G.W., and J.G. Dickson. 1950. Anthracnose of cereals and grasses. USDA Tech.
Bull. 1005:1-37.
Burpee, L.L., and L.G. Goulty. 1984. Influence of cultivation practices and fungicides on
the development of anthracnose in a golf course fairway. Univ. of Guelph
Turfgrass Res. Rep.:8-10.
Carrow, R.N. 1979. Topdressing: An essential management tool. Golf Course Manage.
47(6):26-28, 30-32.
Carrow, R.N. 1996. Summer decline of bentgrass greens: Understanding the cause of this
problem not only helps you cure SBD, but also lets you initiate preventive
maintenance. Golf Course Manage. 64(6):51-56.
Carrow, R.N. 2003. Surface organic matter in bentgrass greens. [Online]. USGA
Turfgrass and Environ. Res. Online 2(17):1-12.
Carrow, R.N., B.J. Johnson, and R.E. Burns. 1987. Thatch and Quality of Tifway
Bermudagrass Turf in Relation to Fertility and Cultivation. Agron. J. 79(3):524-
530. DOI: 10.2134/agronj1987.00021962007900030025x.
Carrow, R.N., and M.A. Petrovic. 1992. Effects of traffic on turfgrasses, In: D. V.
Waddington, et al. (Eds.), Turfgrass, ASA, CSSA, & SSSA Inc., Madison, WI.
pp. 285-330.
Christians, N. 2011. Fundamentals of turfgrass management. John Wiley & Sons, Inc.,
Hoboken, NJ.
Clarke, B.B., P. Majumdar, A. Pitonak, S. Flatley, S. Alea, C. Estler, M. Peacos, T.J.
Lawson, C. Schmid, J.H. Hempfling, K. Clarke, R. Wang, W.K. Dickson, and
J.B. Clark. 2011. Control of anthracnose with selected fungicides and biorational
products on an annual bluegrass putting green turf. In: A. B. Gould, editor,
Rutgers Turfgrass Proc., New Brunswick, NJ. pp. 220-250.
48
Clarke, B.B., D. Thompson, J.A. Murphy, and P. Majumdar. 1995. Development of an
integrated summer patch control program for fine turf areas. Proc. of the Annu.
Rutgers Turfgrass Symp. 4:18-19.
Cooper, R. 2004. Refining your putting green topdressing program. North Carolina
Turfgrass:p. 14, 16-17.
Cooper, R., and C. Skogley. 1981. Putting green and sand/soil responses to sand
topdressing. U.S. Golf Assoc. Green Section Record 19:8-13.
Couch, H.B. 1973. Diseases of Turfgrasses. Krieger, New York.
Couch, H.B. 1979. Is it Anthracnose or is it wilt? The Greensmaster 15(5):3-6.
Crouch, J.A., and L.A. Beirn. 2009. Anthracnose of cereals and grasses. Fungal Diversity
39:19.
Crouch, J.A., and B.B. Clarke. 2012. Biology and pathology of turfgrass anthracnose.
Golf Course Manage. 80(5):96-102.
Crouch, J.A., B.B. Clarke, and B.I. Hillman. 2005. Phylogenetic relationships and
fungicide sensitivities of Colletotrichum graminicola isolates from turfgrass in
North America. Int. Turfgrass Soc. Res. J. 10:186-195.
Crouch, J.A., B.B. Clarke, and B.I. Hillman. 2006. Unraveling Evolutionary
Relationships Among the Divergent Lineages of Colletotrichum Causing
Anthracnose Disease in Turfgrass and Corn. Phytopathology 96(1):46-60. DOI:
10.1094/PHYTO-96-0046.
Danneberger, T., J. Vargas Jr, and A. Jones. 1984. A model for weather-based forecasting
of anthracnose on annual bluegrass. Phytopathology 74(4):448-451.
Danneberger, T.K. 2003. Nobody could have predicted how vital PGRs have become.
Golfdom 59(4):94.
Danneberger, T.K., M.J. Carroll, J.M. Vargas Jr, and P.E. Rieke. 1995. Susceptibility of
Poa annua L. to anthracnose as influenced by water stress. J. of Turfgrass
Manage. 1(2):19-24.
49
Davis, W.B. 1977. Sands and your putting green. California Turfgrass Culture 27(4):31-
32.
Dawson, R.B. 1934. Forking as an aid to turf recovery after drought. J. of the Board of
Greenkeeping Res. 3(11):233-241.
Dawson, R.B., and R.B. Ferro. 1939. Scarification and turf improvement. J. of the Board
of Greenkeeping Res. 6(20):11-17.
Dernoeden, P.H. 2012. Creeping bentgrass management. CRC Press.
Detweiler, R.A., J.M. Vargas Jr, and W.L. Brendt. 1989. Resistance of Colletotrichum
graminicola to benomyl. Proc. Int. Turf. Res. Conf. 6:359-362.
Duff, D.T. 1978. Disagreements arises over variant of annual bluegrass. Univ. of Rhode
Island Turfgrass Res. Rev. 3:1-3.
El Gueddari, N.E., U. Rauchhaus, B.M. Moerschbacher, and H.B. Deising. 2002.
Developmentally regulated conversion of surface‐exposed chitin to chitosan in
cell walls of plant pathogenic fungi. New Phytol. 156(1):103-112.
Engel, R.E., and R.B. Alderfer. 1967. The effect of cultivation, topdressing, lime,
nitrogen and wetting agent on thatch development in 1/4-inch bentgrass turf over
a ten-year period. New Jersey Agric. Exp. Stn. Bull. 818:32-45.
Fermanian, T.W., J.E. Haley, and R.E. Burns. 1985. The effects of sand topdressing on a
heavily thatched creeping bentgrass turf. Proc. Int. Turf. Res. Conf. 5:439-448.
Foy, J. 1999. May the force be with you: An alternative method for incorporating
topdressing sand into high-density putting green turf. U.S. Golf Assoc. Green
Section Record 37(3):27.
Gan, P., K. Ikeda, H. Irieda, M. Narusaka, R.J. O'Connell, Y. Narusaka, Y. Takano, Y.
Kubo, and K. Shirasu. 2013. Comparative genomic and transcriptomic analyses
reveal the hemibiotrophic stage shift of Colletotrichum fungi. New Phytol.
197(4):1236-1249.
50
Gaussoin, R.E., W.L. Berndt, C.A. Dockrell, and R.A. Drijber. 2013. Characterization,
development, and management of organic matter in turfgrass systems, In: J. C.
Stier, Horgan, Brian P., Bonos, Stacy A., and Schmitt, Gail K. (Ed.), Turfgrass:
Biology, Use, and Management, ASA, CSSA, & SSSA Inc., Madison, WI. pp.
1328.
Green, R.L., L. Wu, and G.J. Klein. 2001. Summer cultivation increases field infiltration
rates of water and reduces soil electrical conductivity on annual bluegrass golf
greens. HortScience 36(4):776-779.
Green Section Staff. 1925. General treatment in the upkeep of greens. Bull. of the U.S.
Golf Assoc. Green Section 5(5):118.
Green Section Staff. 2004. USGA recommendations for a method of putting green
construction. U.S. Golf Assoc. Green Section Construction Educ. Progr., Waco,
TX.
Halisky, P.M., R.F. Myers, and R.E. Wagner. 1981. Relationship of thatch to nematodes,
dollar spot and fungicides in Kentucky bluegrass turf. Proc. Int. Turf. Res. Conf.
4:415-420.
Hall, J.R.I. 1979. Avoid the temptation of sand topdressing. The Georgia Turf-Grass
News 7(1):4-5.
Hartwiger, C., and P. O'Brien. 2011. Back to the basics: Plan now for next summer.
Carolinas Green:14-15.
Hartwiger, C., and P. O’Brien. 2001. Core aeration by the numbers. U.S. Golf Assoc.
Green Section Record 39(4):8-9.
Hartwiger, C.E., C.H. Peacock, J.M. DiPaola, and D.K. Cassel. 2001. Impact of light-
weight rolling on putting green performance. Crop Sci. 41(4):1179-1184.
Hawes, D.T. 1980. Response of warm- and cool-season turfgrass polystands to nitrogen
and topdressing. Proc. Int. Turf. Res. Conf. 3:65-74.
Henderson, J.J., and N.A. Miller. 2010. Importance of particle size distribution,
application rate and sand depth in developing a fairway topdressing program.
Univ. of Conn. Turfgrass Res. Rep. 5:41-49.

51
Hsiang, T., and P.H. Goodwin. 2001. Ribosomal DNA sequence comparisons of
Colletotrichum graminicola from turfgrasses and other hosts. Eur. J. of Plant
Pathol. 107(6):593-599.
Huff, D. 2003. Annual bluegrass (Poa annua L.). Turfgrass biology, genetics, and
breeding. John Wiley and Sons, Hoboken, New Jersey:39-51.
Huff, D.R. 1998. The case for Poa annua on golf course greens. Golf Course
Management 66(10):54-56.
Huff, D.R. 1999. For richer, for Poa. U.S. Golf Assoc. Green Section Record 37(1):11-
14.
Huff, D.R. 2004. Developing annual bluegrass cultivars for putting greens. USGA
Turfgrass and Environ. Res. Online 3(9):1-8.
Hummel, N.W. 1995. Topdressing for success. Cornell Univ. Turfgrass Times 5(4):8-9.
Hurdzan, M.J. 2004. Golf greens: History, design, and construction. John Wiley & Sons,
Hoboken, NJ.
Hurto, K.A., A.J. Turgeon, and L.A. Spomer. 1980. Physical characteristics of thatch as a
turfgrass growing medium. Agron. J. 72(1):165-167.
Hwang, S., J. Kim, Y.H. Kim, and H.T. Kim. 2008. ABA increases susceptibility of
pepper fruits to infection of anthracnose by Collectotrichum acutatum. The Plant
Pathol. J. 24(4):400-406.
Inguagiato, J.C., J.A. Murphy, and B.B. Clarke. 2008. Anthracnose Severity on Annual
Bluegrass Influenced by Nitrogen Fertilization, Growth Regulators, and
Verticutting. Crop Sci. 48(4):1595-1607. DOI: 10.2135/cropsci2007.06.0343.
Inguagiato, J.C., J.A. Murphy, and B.B. Clarke. 2009a. Anthracnose Disease and Annual
Bluegrass Putting Green Performance Affected by Mowing Practices and
Lightweight Rolling. Crop Sci. 49(4):1454-1462. DOI:
10.2135/cropsci2008.07.0435.
52
Inguagiato, J.C., J.A. Murphy, and B.B. Clarke. 2009b. Anthracnose of annual bluegrass
putting green turf influenced by trinexapac-ethyl application interval and rate. Int.
Turfgrass Soc. Res. J. 11:207-218.
Inguagiato, J.C., J.A. Murphy, and B.B. Clarke. 2010. Anthracnose development on
annual bluegrass affected by seedhead and vegetative growth regulators. Appl.
Turf Sci. DOI: 10.1094/ATS-2010-0923-01-RS.
Inguagiato, J.C., J.A. Murphy, and B.B. Clarke. 2012. Sand Topdressing Rate and
Interval Effects on Anthracnose Severity of an Annual Bluegrass Putting Green.
Crop Sci. 52(3):1406-1415. DOI: 10.2135/cropsci2011.01.0010.
Inguagiato, J.C., J.A. Murphy, B.B. Clarke, and J.A. Roberts. 2013. Topdressing sand
particle shape and incorporation effects on anthracnose severity of an annual
bluegrass putting green. Int. Turfgrass Res. Soc. J. 12:(accepted).
Jackson, N., and V.J. Herting. 1985. Colletotrichum graminicola as an incitant of
anthracnose/basal stem rotting of cool season turfgrasses. Int. Turfgrass Soc. Res.
J. 5:647-656.
Jenns, A.E., and K.J. Leonard. 1985. Effect of illuminance on the resistance of inbred
lines of corn to isolates of Colletotrichum graminicola. Phytopathology
75(3):281-286.
Jiang, M., and J. Zhang. 2001. Effect of abscisic acid on active oxygen species,
antioxidative defence system and oxidative damage in leaves of maize seedlings.
Plant Cell Physiol. 42(11):1265-1273.
Johnson, D.A., and E.R. Miliczky. 1993. Effects of wounding and wetting duration on
infection of potato foliage by Colletotrichum coccodes. Plant Dis. 77(1):13-17.
Johnson, P.G., B.A. Ruemmele, P. Velguth, D.B. White, and P.D. Ascher. 1993. An
overview of Poa annua L. reproductive biology. Int. Turfgrass Soc. Res. J. 7:798-
804.
Khan, A., and T. Hsiang. 2003. The infection process of Colletotrichum graminicola and
relative aggressiveness on four turfgrass species. Can. J. Microbiol. 49(7):433-
442.

53
Kim, Y.H. 2008. Effect of delayed inoculation after wounding on the development of
anthracnose disease caused by Colletotrichum acutatum on chili pepper fruit. The
Plant Pathol. J. 24(4):392-399.
Kowalewski, A.R., J.N. Rogers, J.R. Crum, and J.C. Dunne. 2010. Sand topdressing
applications improve shear strength and turfgrass density on trafficked athletic
fields. HortTechnology 20(5):867-872.
La Mantia, J.M., and D.R. Huff. 2011. Instability of the Greens-Type Phenotype in Poa
annua L. pp. 1784-1792.
Labance, B., and G. Witteveen. 2002. Keepers of the Green: A History of Golf Course
Management. Ann Arbor Press, Chelsea, MI.
Landreth, J., D. Karcher, and M. Richardson. 2008. Cultivating to manage organic matter
in sand-based putting greens: University of Arkansas researchers provide
important insight for managing organic buildup on putting greens. U.S. Golf
Assoc. Green Section Record 46(1):16-19.
Landschoot, P., and B. Hoyland. 1995. Shedding some light on anthracnose basal rot.
Golf Course Manage 11:52-55.
Ledeboer, F.B., and C.R. Skogley. 1967. Investigations into the nature of thatch and
methods for its decomposition. Agron. J. 59(4):320-323.
Lipetz, J. 1970. Wound healing in higher plants. Int. Rev. Cytol 27(1):1-28.
Lipps, P.E. 1983. Survival of Colletotrichum graminicola in infested corn residues in
Ohio. Plant Dis. 67(1):102-104.
Lockyer, J. 2009. Successful fine turf organic matter management. Int. Turfgrass Bull.
244:9-11.
Madison, J.H., J.L. Paul, and W.B. Davis. 1974. Alternative method of greens
management. Proc. Int. Turf. Res. Conf. 2:431-437. DOI:
10.2135/1974.proc2ndintlturfgrass.c65.
54
Mann, R.L., and A.J. Newell. 2005. A survey to determine the incidence and severity of
pests and diseases on golf course putting greens in England, Ireland, Scotland,
and Wales. Int. Turfgrass Soc. Res. J. 10:224-229.
McCarty, L.B., M.F. Gregg, and J.E. Toler. 2007. Thatch and Mat Management in an
Established Creeping Bentgrass Golf Green. Agron. J. 99(6):1530-1537. DOI:
10.2134/agronj2006.0361.
McDowell, J.M. 2013. Genomic and transcriptomic insights into lifestyle transitions of a
hemi‐biotrophic fungal pathogen. New Phytol. 197(4):1032-1034.
Mims, C.W., and L.J. Vaillancourt. 2002. Ultrastructural characterization of infection and
colonization of maize leaves by Colletotrichum graminicola, and by a C.
graminicola pathogenicity mutant. Phytopathology 92(7):803-812.
Mitkowski, N.A., A.M. Madeiras, A. Chaves, and A. Wick. 2009. Fungicide sensitivity
of Colletotrichum cereale isolated from turfgrasses in the northeastern United
States [Online]. Appl. Turfgrass Sci.:[1-10].
Moeller, A.C. 2008. Evaluation of Putting Green Surface Organic Matter Management
Programs. M.S. Thesis: Purdue Univ.
Muimba-Kankolongo, A. 1991. Nature of resistance to anthracnose stalk rot associated
with maize genotype, ontogeny, and wound response. PhD Thesis: Cornell Univ.
Muimba-Kankolongo, A., and G. Bergstrom. 1992. Wound predisposition of maize to
anthracnose stalk rot as affected by internode position and inoculum concentration
of Colletotrichum graminicola. Plant disease 76(2):188-195.
Muimba-Kankolongo, A., and G.C. Bergstrom. 1990. Transitory wound predisposition of
maize to Anthracnose stalk rot. Can. J. Plant Pathol. 12(1):1-10.
Muimba-Kankolongo, A., and G.C. Bergstrom. 2011. Reduced Anthracnose Stalk Rot in
Resistant Maize is Associated with Restricted Development of Colletotrichum
graminicola in Pith Tissues. Phytopathology 159(5):329-341. DOI:
10.1111/j.1439-0434.2010.01766.x.
Münch, S., U. Lingner, D.S. Floss, N. Ludwig, N. Sauer, and H.B. Deising. 2008. The
hemibiotrophic lifestyle of Colletotrichum species. J. Plant Physiol. 165(1):41-51.

55
Murphy, J., F. Wong, L. Tredway, J.A. Crouch, J. Inguagiato, B. Clarke, T. Hsiang, and
F. Rossi. 2008. Best management practices for anthracnose on annual bluegrass
turf. Golf Course Manage. 24:93-104.
Murphy, J.A., B.B. Clarke, C.J. Schmid, J.W. Hempfling, and R. Wang. 2011.
Developing best management practices for anthracnose disease on annual
bluegrass putting green turf. In: 2011 USGA Turfgrass Environ. Res. Summ.
USGA Turfgrass and Environmental Research Online 10(23):2.
Murphy, J.A., and J.W. Hempfling. 2011. Impact of sand size and topdressing rate on
surface firmness and turf quality of velvet bentgrass. USGA Turfgrass and
Environmental Research Summary:39.
Murphy, J.A., J.C. Inguagiato, and B.B. Clarke. 2012. Best management practices for
anthracnose on annual bluegrass. Golf Course Manage. 80(5):104-110.
Murphy, J.A., and P.E. Rieke. 1994. High pressure water injection and core cultivation of
a compacted putting green. Agron. J. 86(4):719-724.
Murphy, J.A., P.E. Rieke, and A.E. Erickson. 1993. Core cultivation of a putting green
with hollow and solid tines. Agron. J. 85(1):1-9.
Musser, H.B. 1950. Turf Management. McGraw-Hill Book Company, Inc., New York,
NY.
Nannfeldt, J.A. 1937. The chromosome numbers of Poa sect. Ochlopoa A. & Gr. and
their taxonomical significance. Botanisker Notiser:238-254.
Nicholson, R.L., G.B. Bergeson, F.P. DeGennaro, and D.M. Viveiros. 1985. Single and
combined effects of the lesion nematode and Colletotrichum graminicola on
growth and anthracnose leaf blight of corn. Phytopathology 75(6):654-661.
Nicholson, R.L., and R. Hammerschmidt. 1992. Phenolic compounds and their role in
disease resistance. Annu. Rev. Phytopathol. 30(1):369-389.
Nikolai, T.A., P.E. Rieke, J.N. Rogers, and J.M. Vargas Jr. 2001. Turfgrass and soil
responses to lightweight rolling on putting green root zone mixes. Int. Turfgrass
Soc. Res. J 9:604-609.
56
O'Brien, P., and C. Hartwiger. 2003. Aeration and topdressing for the 21st century: Two
old concepts are linked together to offer up-to-date recommendations. U.S Golf
Assoc. Green Section Record 41(2):1-7.
Orshinsky, A.M., M.J. Boehm, and G.J. Boland. 2012. Plant wounding and Ophiostoma
mitovirus 3a (OMV3a) influence infection of creeping bentgrass by Sclerotinia
homoeocarpa. Can. J. Plant Pathol. 34:493.
Perfect, S.E., H.B. Hughes, R.J. O'Connell, and J.R. Green. 1999. Colletotrichum: A
Model Genus for Studies on Pathology and Fungal–Plant Interactions. Fungal
Genet. and Biol. 27(2):186-198.
Piper, C.V., and R.A. Oakley. 1917. Turf for golf courses. Macmillan, New York, NY.
Radko, A.M. 1985. Have we gone too far with low nitrogen on greens? U.S Golf Assoc.
Green Section Record 23:26-28.
Raisch, T. 2003. Anthracnose: One club's three-year battle. Golf Course Manage.
71(11):76-78,80,82,84.
Roberts, J.A. 2009. Impact of cultural management on anthracnose severity of annual
bluegrass putting green turf. M.S. Thesis: Rutgers Univ.
Roberts, J.A., J.C. Inguagiato, B.B. Clarke, and J.A. Murphy. 2011. Irrigation Quantity
Effects on Anthracnose Disease of Annual Bluegrass. Crop Sci. 51(3):1244-1252.
DOI: 10.2135/cropsci2010.07.0444.
Roberts, J.A., J.A. Murphy, and B.B. Clarke. 2010. Summer N-fertilization effects on
annual bluegrass putting green turf. Phytopathology 100(65):S197.
Roberts, J.A., J.A. Murphy, and B.B. Clarke. 2012. Lightweight Rolling Effects on
Anthracnose of Annual Bluegrass Putting Greens. Agron. J. 104(4):1176-1181.
DOI: 10.2134/agronj2011.0269.
Schall, R.A., R.L. Nicholson, and H.L. Warren. 1980. Influence of light on maize
anthracnose in the greenhouse. Phytopathology 70(10):1023-1026.
57
Schmid, C.J., B.B. Clarke, and J.A. Murphy. 2012a. Effect of Nitrogen Form on
Anthracnose Disease of Annual Bluegrass Turf. Eur. Turfgrass Soc. Conf. Proc.
3:Unknown.
Schmid, C.J., J.A. Murphy, and B.B. Clarke. 2012b. Anthracnose severity of annual
bluegrass putting green turf as influenced by nitrogen fertilization programming.
Phytopathology 102(1):S1.7.
Selby, A.D., and T.F. Manns. 1909. Studies in diseases of cereals and grasses. Ohio
Agric. Exp. Stn.
Settle, D.M., A.D. Martinez-Espinoza, and L.L. Burpee. 2006. Anthracnose of Turfgrass.
The Plant Health Instructor [Online]:[1-6]. DOI: DOI:10.1094/PHI-I-2006-1205-
01.
Shearman, R.C. 1984. Topdressing: Effects on cultural practices and disease incidence.
Proc. of 54th Annu. Michigan Turfgrass Conf. 13:98-99.
Skoropad, W.P. 1967. Effect of temperature on the ability of Colletotrichum graminicola
to form appressoria and penetrate barley leaves. Can. J. Plant Sci. 47(4):431-434.
Smiley, R.W., P.H. Dernoeden, and B.B. Clarke. 2005. Compendium of turfgrass
diseases. APS press, St. Paul, MN.
Smith, J.D. 1954. A disease of Poa annua. J. Sports Turf Res. Inst. 8:344-353.
Smith, J.D., N. Jackson, and A.R. Woolhouse. 1989. Fungal diseases of amenity turf
grasses. E. & FN Spon, New York, NY.
Sprague, H.B., and G.W. Burton. 1937. Annual bluegrass, Poa annua L. and its
requirements for growth. New Jersey Agric. Exp. Stn. Bull.
Sprague, H.B., and E.E. Evaul. 1930. Experiments with turf grasses in New Jersey. New
Jersey Agric. Exp. Stn. Bull.
Stier, J.C., and A.B. Hollman. 2003. Cultivation and topdressing requirements for thatch
management in A and G bentgrasses and creeping bluegrass. HortScience
38(6):1227-1231.

58
Sukno, S.A., V.M. García, B.D. Shaw, and M.R. Thon. 2008. Root infection and
systemic colonization of maize by Colletotrichum graminicola. Appl. Environ.
Microbiol. 74(3):823-832.
Taylor, D.H. 1986. Points of caution: Sand size for topdressing golf greens. Golf Course
Manage. 54(7):50, 52, 54, 58, 60, 62.
Tisserat, N.A., and J. Fry. 1997. Cultural practices to reduce spring dead spot
(Ophiosphaerella herpotricha) severity in Cynodon dactylon. Int. Turf. Soc. Res.
J. 8:931-936.
Turgeon, A.J. 2011. Turfgrass Management, Prentice Hall, Upper Saddle River, NJ.
Tutin, T.G. 1952. Origin of Poa annua L. Nature 169:160.
Uddin, W., M. Soika, and D. Livingston. 2008. Vertical mowing and mowing height
affect anthracnose basal rot. Golf Course Manage. 76:84-87.
Uddin, W., and M.D. Soika. 2003. Effects of turfgrass cultural management practices on
severity of anthracnose basal rot in mixed annual bluegrass and creeping
bentgrass greens. Phytopathology 93:S86.
Unruh, J.B., S.D. Davis, P.F. Colbaugh, B.J. Brecke, and D.O. Stephenson. 2005. Impact
of various chemical and nutrient inputs and cultural treatments on 'Tifeagle
bermudagrass (Cynodon dactylon x C. transvaalensis). Int. Turfgrass Soc. Res. J.
10(1):455-461.
USDA-CSREES. 2005. NE 1025: Biology, ecology and management of emerging pest of
annual bluegrass on golf courses. Nat'l. Info. Mgt. and Support System. USDA-
CSREES, Washington, DC.
Vargas, J., and A. Turgeon. 2004. Poa annua: physiology, culture, and control of annual
bluegrass, John Wiley & Sons, Inc, Hoboken, New Jersey.
Vargas, J.M. 1980. Anthracnose - rediscovering the wheel. GreenMaster 16(2):22-24.
Vargas, J.M., T.K. Danneberger, and A.L. Jones. 1992. Effects of temperature, leaf
wetness duration and inoculum concentration on infection of annual bluegrass by
59
Colletotrichum graminicola. International Turfgrass Society Research Journal
7:324-328.
Vargas, J.M., and A.R. Detweiler. 1985. Anthracnose of Poa annua: the pathogenicity of
Colletotrichum graminicola. Proc. Int. Turf. Res. Conf. 5:637-640.
Vargas Jr, J.M. 1976. Anthracnose: Disease poses threat to annual bluegrass. Golf
Superintendent 44:42-45.
Vargas Jr., J.M. 1977. Maintaining annual bluegrass. Proc. of the Annu. Illinois Turfgrass
Conf. 18:76-80.
Vargas, W.A., J.M.S. Martín, G.E. Rech, L.P. Rivera, E.P. Benito, J.M. Díaz-Mínguez,
M.R. Thon, and S.A. Sukno. 2012. Plant defense mechanisms are activated during
biotrophic and necrotrophic development of Colletotricum graminicola in maize.
Plant physiology 158(3):1342-1358.
Vavrek Jr., R.C. 1995. A successful topdressing program requires consistency,
commitment, and communication. U.S Golf Assoc. Green Section Record
33(5):8-10.
Venard, C., and L. Vaillancourt. 2007a. Colonization of fiber cells by Colletotrichum
graminicola in wounded maize stalks. Phytopathology 97(4):438-447. DOI:
10.1094/phyto-97-4-0438.
Venard, C., and L. Vaillancourt. 2007b. Penetration and colonization of unwounded
maize tissues by the maize anthracnose pathogen Colletotrichum graminicola and
the related nonpathogen C. sublineolum. Mycologia 99(3):368-377.
Vermeulen, P. 1989. Consider Poa annua for your new green. U.S Golf Assoc. Green
Section Record 27(5):17.
Vermeulen, P.H. 2003. Maybe it's time for a change. U.S Golf Assoc. Green Section
Record 41:28.
Vizvary, M.A., and H.L. Warren. 1982. Survival of Colletotrichum graminicola in Soil.
Phytopathology 72(5):522-525.
60
von Arx, J.A. 1957. Die Arten der Gattung Colletotrichum Cda. Phytopathologische
Zeitschrift 29:414-468.
Waddington, D.V. 1992. Soils, soil mixtures, and soil amendments, In: D. V.
Waddington, et al. (Eds.), Turfgrass, ASA, CSSA, & SSSA Inc., Madison, WI.
pp. 331-383.
Wang, Z., M. Gerstein, and M. Snyder. 2009. RNA-Seq: a revolutionary tool for
transcriptomics. Nature Rev. Genet. 10(1):57-63.
White, D.G. 1999. Compendium of corn diseases. American Phytopathological Society
(APS Press).
White, D.G., R.G. Hoeft, and J.T. Touchton. 1978. Effect of nitrogen and nitrapyrin on
stalk rot, stalk diameter, and yield of corn. Phytopathology 68:811-814.
Wilson, G.W. 1914. The identity of the anthracnose of grasses. Phytopathology 4:106-
112.
Wolff, E.T. 1947. An Experimental Study of Colletotrichum Graminicolum on Fine Turf.
PhD Thesis: Penn. State College.
Wong, F.P., K.A. de la Cerda, R. Hernandez-Martinez, and S.L. Midland. 2008.
Detection and characterization of benzimidazole resistance in California
populations of Colletotrichum cereale. Plant Dis. 92(2):239-246.
Wong, F.P., and S. Midland. 2004. Fungicide-resistant anthracnose: Bad news for greens
management. Golf Course Manage. 72(6):75-80.
Wong, F.P., and S.L. Midland. 2007. Sensitivity distributions of California populations of
Colletotrichum cereale to the DMI fungicides propiconazole, myclobutanil,
tebuconazole, and triadimefon. Plant Dis. 91(12):1547-1555.
Wong, F.P., S.L. Midland, and K.A. de la Cerda. 2007. Occurrence and distribution of
QoI-resistant isolates of Colletotrichum cereale from annual bluegrass in
California. Plant Dis. 91(12):1536-1546.
61
Young, J.R., M. Tomaso-Peterson, K. de la Cerda, and F.P. Wong. 2010a. Two mutations
in β-tubulin 2 gene associated with thiophanate-methyl resistance in
Colletotrichum cereale isolates from creeping bentgrass in Mississippi and
Alabama. Plant Dis. 94(2):207-212.
Young, J.R., M. Tomaso-Peterson, L.P. Tredway, and K. de la Cerda. 2010b. Occurrence
and molecular identification of azoxystrobin-resistant Colletotrichum cereale
isolates from golf course putting greens in the Southern United States. Plant Dis.
94(6):751-757.
Youngner, V.B. 1959. Ecological studies on Poa annua in turfgrasses. Grass Forage Sci.
14(4):233-237.
Zontek, S.J. 1973. A positive approach to Poa annua management. U.S Golf Assoc.
Green Section Record 11(2):1-5.
Zontek, S.J. 1979. Is sand topdressing right for you? Golf Course Manage. 47(6):15-17,
19-21.
Zontek, S.J. 1983. Mismanagement in topdressing greens. Proc. of the 53rd Annu.
Michigan Turfgrass Conf. 12:82-84.
Zontek, S.J. 2004. Have we gone too far? The grass is talking to you. Are you listening?
U.S Golf Assoc. Green Section Record 48:28.
62
CHAPTER 2. Anthracnose Disease Development on Annual Bluegrass Influenced
by Spring and Summer Sand Topdressing Rate
ABSTRACT
Anthracnose is a destructive disease of annual bluegrass [Poa annua L. f. reptans
(Hausskn) T. Koyama] (ABG) turf caused by the fungus Colletotrichum cereale Manns
sensu lato Crouch, Clarke, and Hillman. Sand topdressing during the summer can reduce
anthracnose severity of ABG turf but the effect of spring topdressing on this disease
remains unknown. A two year field study was initiated to evaluate the effect of spring
topdressing on anthracnose severity as well as the potential for this factor to interact with
the effects of summer topdressing on ABG maintained at 3.2-mm on a Nixon sandy loam
in North Brunswick, NJ. The trial used a 3 x 5 factorial arranged as a RCBD with four
replications. Spring topdressing was applied at rates of 0, 1.2 and 2.4 L m-2
as two split-
applications on 20 April and 4 May 2009 and 14 and 28 April 2010. Summer topdressing
was applied at rates of 0, 0.075, 0.15, 0.3 and 0.6 L m-2
every 14-d from 1 June to 24
August 2009 and 24 May to 17 August 2010. Generally, increased rate of spring and
summer topdressing reduced anthracnose disease severity linearly throughout most of
2009 and 2010. However, the response to increased summer topdressing rate became a
quadratic decrease in disease severity by the latter half of the 2010 season; the greatest
summer topdressing rates had a diminishing effect on disease reduction. Interaction data
from 2010 indicated that the rate of summer topdressing needed to reduce disease was
decreased when the rate of spring topdressing was increased. Thus, spring topdressing is

63
an effective practice to reduce anthracnose disease severity and may enable the use of
lower-rate summer topdressing to complement disease suppression.
64
64
INTRODUCTION
Anthracnose (Colletotrichum cereale Manns sensu lato Crouch, Clarke, and
Hillman) (Crouch et al., 2006) is a fungal disease that causes severe damage to annual
bluegrass [Poa annua L. forma reptans (Hausskn.) T. Koyama] (ABG) and creeping
bentgrass (Agrostis stolonifera L.) putting greens on golf courses in temperate climates
across the world. The disease is most devastating on ABG, especially when the turf is
maintained under stress-inducing cultural management programs to achieve faster green
speeds (longer ball roll distance) (Dernoeden, 2012).
Topdressing is the distribution of a thin layer of soil onto a turfgrass area (Beard,
1973). Sand topdressing has been used to smooth the surface, modify accumulating
thatch, improve surface soil root zones and provide winter protection of putting greens
since the early days of golf (Bengeyfield, 1969; O'Brien and Hartwiger, 2003; Piper and
Oakley, 1917). Previous research regarding the effect of topdressing on turf diseases is
limited and results are varied. Cooper and Skogley (1981), Engel and Alderfer (1967),
and Fermanian et al. (1985) found that topdressing (with coarse or loamy coarse sand,
sandy loam, or sand and sand/soil mixes, respectively) on creeping bentgrass and velvet
bentgrass putting green turf increased dollar spot (caused by Sclerotnia homoeocarpa
F.T. Bennett) severity. Contrastingly, other studies on of ‘Tifway’ bermudagrass
[Cynodon dactylon (L.) Pers. X C. transvaalensis (Burtt-Davis)] managed as a home
lawn and creeping bentgrass and ABG putting green turf found that dollar spot severity
was not affected by sand topdressing (Carrow et al., 1987; Stier and Hollman, 2003).
Sand topdressing reduced dollar spot on creeping bentgrass fairway turf and spring dead
spot (Ophiosphaerella spp.) in bermudagrass turf mowed at 1.9 cm (Hawes, 1980;
65
Henderson and Miller, 2010). No discussion was provided by the authors of these studies
regarding the possible mechanism(s) responsible for the effects of topdressing on the
severity of these diseases.
Contrary to the belief at the time that topdressing encouraged anthracnose (Smiley
et al., 2005), Inguagiato et al. (2012) found that topdressing during the summer every 7 to
42 d at rates ranging from 0.3 to 1.2 L m-2
reduced anthracnose severity. Another study
on the effect of sand particle shape on anthracnose showed that both sub-angular and
round topdressing sand applied at 0.3 L m-2
every 14 d reduced the disease (Inguagiato et
al., 2013). Most recently, Roberts (2009) observed that sand topdressing during the
summer at 0.3 L m-2
every 7 d reduced disease severity even under conditions of intense
foot traffic. Small increases in anthracnose severity from sand topdressing during the
summer were observed early in the first year of each of these previous trials (Inguagiato
et al., 2012; Inguagiato et al., 2013; Roberts, 2009). However, these initial increases in
disease severity dissipated as sand topdressing treatments continued. Inguagiato et al.
(2013) suggested that this initial increase in disease could have been caused by sand
abrasion injury to exposed crowns, and that a critical level of sand accumulation (i.e., mat
layer) must be achieved before sand topdressing could provide disease reductions.
Inguagiato et al. (2012) observed that cumulative amounts of 2.4 to 4.8 L m-2
of
sand were needed to reduce anthracnose severity. Specifically, sand topdressing at rates
of 0.3 to 0.6 L m-2
applied every 7 to 14 d during the summer provided the most rapid
and substantial disease reduction. However, topdressing at these rates and frequencies
during the summer can be an expensive and laborious practice for golf course
superintendents and can potentially interrupt play on the golf course for several days after
66
application (Bigelow and Tudor Jr, 2012; Vavrek, 1995). Therefore, there is a need to
determine sand topdressing programs (i.e., rates and timings) that reduce anthracnose and
provide more acceptable playing conditions throughout the summer.
Topdressing during the spring is generally less expensive to implement and less
disruptive to play than summer topdressing programs. It is not known whether
topdressing during the spring affects anthracnose severity or the impact of summer
topdressing on this disease. Therefore, the objective of this trial was to determine the
effect of spring topdressing on anthracnose severity as well as the potential for this factor
to interact with the effects of summer topdressing.

67
MATERIALS AND METHODS
Experimental Design and Treatments
A 2-yr. field trial was initiated in March 2009 on ABG turf grown on a Nixon
sandy loam (fine-loamy, mixed, semiactive, mesic Typic Hapludults, in some areas
altered to fine-loamy, mixed, semiactive, mesic Ultic Udarents) at Horticultural Farm No.
2 in North Brunswick, NJ (40°28’ N, 74°25’ W). The ABG monostand was established
in 2001 as described by Inguagiato et al. (2008) using the existing soil seed bank as well
as seed introduced from soil cores collected from Rutgers Golf Course in Piscataway, NJ.
The topdressing timing factors of spring and summer were arranged as a 3 x 5 factorial,
respectively, in a randomized complete block design with four replications. Spring
topdressing was applied at rates of 0, 1.2, and 2.4 L m-2
as split applications on 20 April
and 4 May 2009 and 14 and 28 April 2010. Summer topdressing was applied at rates of
0, 0.075, 0.15, 0.3, and 0.6 L m-2
every 14 d from 1 June to 24 August 2009 and 24 May
to 17 August 2010. Coring was not performed in combination with these treatments to
avoid any potential confounding effects. Plot size was 1.8 by 1.8 m.
All topdressing treatments, except for the 0.075 L m-2
summer rate, were applied
with a drop spreader (model SS-2, The Scotts Company, Marysville, OH) calibrated to
uniformly apply each volume over the plot in 4 passes. The 0.075 L m-2
summer rate was
applied uniformly with a shaker jar in 4 directions over the plot area. The topdressing
material was a kiln dried subangular silica sand (“310” U.S. Silica, Co., Mauricetown, NJ)
having a particle distribution that met USGA recommendations (2004) and a bulk density
of 1.56 g cm-3
(Table 2.1). Treatments were applied between 1200 and 1700 h when the
68
turf canopy was dry. Sand was incorporated using a soft-bristle brush as described by
Inguagiato et al. (2012) followed by a light irrigation (hose) of the entire trial area.
Field Maintenance
The trial was mowed six times wk-1
between 0800 and 0930 h with a walk-behind
greens mower (model 220A, Deere & Co., Moline, IL) set at a 3.2 mm bench setting.
During the period that topdressing treatments were applied, 48.8 and 58.6 kg ha-1
of N
was applied to the trial in 2009 and 2010, respectively. Once disease progress was
arrested, N was applied at 93.7 and 112.8 kg ha-1
from September to October 2009 and
September to November 2010, respectively. Irrigation was applied to maintain
moderately-dry conditions and to prevent wilt stress. Soil pH, P and K were managed
based on soil test recommendations common for putting greens in the northeastern United
States.
Ethephon [(2-chloroethyl)phosphonic acid] was applied at 3.81 kg a.i. ha-1
on 25
March, 13 and 28 April 2009, and 19 March, 2 April, and 23 April 2010 to suppress ABG
inflorescence expression. Trinexapac-ethyl [4-(cyclopropyl-α-hydroxy-methylene)-3,5-
dioxocyclohexanecarboxylic acid ethylester)] was applied at 0.05 kg a.i. ha-1
every 14 d
from 25 March until 2 October 2009 and from 19 March until 2 October 2010 to reduce
vertical shoot growth and increase lateral tillering. Biweekly applications were made to
control dollar spot disease with the fungicides vinclozolin [3-(3,5-dichlorophenyl)-5-
ethenyl-5-methyl-2,4-oxazolidinedione] at 1.52 kg a.i. ha-1
or boscalid {3-
pyridinecarboximide, 2-chloro-N-[4’chloro(1,1’-biphenyl)yl]} at 0.38 kg a.i. ha-1
. Brown
patch (caused by Rhizoctonia solani Kühn) and summer patch (caused by Magnaporthe
poae Landschoot & Jackson) were controlled using a biweekly rotation of the fungicides
69
azoxystrobin (Methyl(E)-2-{2-[6-(2-cyanophenoxy)pyrimidin-4-yloxy]phenyl}-3-
methoxyacrylate)} at 0.61 kg a.i. ha-1
, flutolanil {N-[3-(1-methylethoxy)phenyl]-2-
(trifluoromethyl)benzamide} at 6.41 kg a.i. ha-1
, and fluoxastrobin [(1E)-[2-[[6-(2-
Chlorophenoxy)-5-fluoro-4-pyrimidinyl]oxy]phenyl](5,6-dihydro-1,4,2-dioxazin-3-yl)
methanone-O-methyloxime] at 0.55 kg a.i. ha-1
. Mancozeb (ethylenebisdithiocarbamate)
was applied as needed to control algae using rates ranging from 20.1 to 30.5 kg a.i. ha-1
in
2009 and 2010. These fungicides were found to have no effect on anthracnose isolates
from this research location (Towers et al., 2003). Annual bluegrass weevils [Listronotus
maculicollis (Kirby)] were controlled with indoxacarb {(S)-methyl 7-chloro-2,5-dihydro-
2-[[(methoxycarbonyl)[4(trifluoromethoxy)phenyl]amino]-carbonyl]indeno[1,2-
e][1,3,4]oxadiazine-4a-(3H)-carboxylate} applied at 0.27 kg a.i. ha-1
and
chlorantraniliprole {3-Bromo-N-[4-chloro-2-methyl-6-[(methylamino)carbonyl]phenyl]-
1-(3-chloro-2-pyridinyl)-1H-pyrazole-5-carboxamide} applied at 0.18 kg a.i. ha-1
on 14
June 2009 and 30 April 2010, respectively. Fluazifop-P-butyl {Butyl (R)-2-[4-[[5-
(trifluoromethyl)-2-pyridinyl]oxy]phenoxy]propanoate} was applied at 0.21 kg a.i. ha-1
on 20 Sept. 2010 to suppress creeping bentgrass encroachment. Anthracnose disease was
arrested at the end of each trial-year by applying chlorothalonil
(tetrachloroisophthalonitrile) at 15.3 kg a.i. ha-1
on 3, 13 and 24 September 2009 and 18
September, 2 and 22 October 2010.
Data Collection
Anthracnose Disease Severity
Anthracnose severity was evaluated every 7 to 14 d when symptoms were present
with a line-intercept grid count method that generated 273 observations per plot

70
(Inguagiato et al., 2008). A count of intersects that overlaid diseased ABG turf was
recorded for each plot and transformed to a percentage using the equation:
(n/273) x 100;
where n represented the count of intersects that overlaid of diseased ABG turf.
Visual Ratings
Turfgrass quality was rated visually every 7 to 14 d using a 1 to 9 scale (9
represented the best quality and 5 was the minimally acceptable rating). Turf density,
uniformity, algae, and disease severity were considered when turf quality was evaluated.
The extent of sand incorporation (SI) was assessed visually on 10 dates between 15 June
and 27 July 2009 using a 1 to 9 scale [9 represented no visible sand on the canopy surface
(=sand fully incorporated into the canopy) and 5 was the minimally acceptable amount of
sand incorporated into the canopy). Additionally, the number of days required for all
four replications of each topdressing treatment to reach an acceptable level of sand
incorporation in the turf canopy was recorded after summer topdressing applications in
2009 and 2010. After the termination of the trial, turf color (1-9 scale; 9 represented the
darkest green color and 5 was the minimally acceptable rating) was rated four times from
March to November in 2011.
Volumetric Water Content
Volumetric water content (VWC) at the rootzone surface (0-7.5 cm depth) was
measured on 6 dates in 2009 and 2 dates in 2010 using a portable soil probe equipped
with time domain reflectometry (TDR), (Field Scout TDR 300 model, Spectrum
Technologies, Inc., Plainfield, IL). The average of three measurements taken per plot
was used for statistical analysis.

71
Surface Hardness
A Clegg Impact Soil Tester (CIST) (2.25 kg model, Lafayette Instrument Co.,
Lafayette, IN) and a USGA TruFirm device (TruFirm model, United States Golf
Association, Far Hills, NJ) were used to measure surface hardness (SH). Readings were
taken simultaneous with soil volumetric water content measurements of the upper 7.5 cm
rootzone on 30 July and 30 August 2010. The impact hammers of the CIST and TruFirm
devices were dropped from a 0.46 m height at three locations per plot and averaged for
statistical analysis. Units were recorded in gravities (gmax) for the CIST and in
centimeters for the TruFirm.
Thatch/Mat Layer Depth and Soil Nutrient Analysis
Samples for soil nutrient analysis were taken on 23 Nov. 2011 from plots that
received a total of 0 and 6.6 L m-2
yr-1
of topdressing sand. Four soil cores were taken to
a 17 cm depth using a 1.9 cm inside diameter probe. The thatch/mat layer of each core
was measured for depth and separated from the underlying sandy loam portion of the
sample. Verdure was removed from the thatch/mat portion. The thatch/mat and sandy
loam portions of the four cores from each plot were composited separately, air-dried for
24 hours, and sent to the Rutgers Soil Testing Laboratory (New Brunswick, NJ) for
analysis of soil pH and nutrient availability using the Mehlich III extraction method
(Mehlich, 1984).
Data Analysis
Data were subjected to ANOVA using the General Linear Model procedure of the
Statistical Analysis System (SAS) software v. 9.3 (SAS Institute, Cary, NC).
Anthracnose severity data were transformed to area under the disease progress curve

72
(AUDPC) values to summarize disease epidemics for the evaluation periods in 2009 and
2010 (12 June to 3 Sept. and 19 May to 3 Sept., respectively) using the equation:
1n
1i
i1i1ii
i
tt2
yyAUDPC
where “ti” is time in days, “i” is the order index for the ratings (and “ni” is the
number of ratings), “y” is the percent turf area infested at rating (Madden et al., 2007).
Orthogonal polynomial contrasts for the main effects of spring (linear and quadratic) and
summer (linear, quadratic, cubic, and quartic) topdressing rate were evaluated for the
response variables of disease severity, AUDPC, turf quality, turf color, SI, VWC, and
SH. Means of significant thatch/mat layer depth and soil nutrient analysis effects were
separated using Fisher’s protected least significant difference at the 0.05 probability
level.
73
RESULTS
Anthracnose Severity
Disease symptoms were slow to develop in 2009; disease severity averaged no
more than 3% on the four observation dates from 12 June to 23 July 2009 (Table 2.2).
Disease severity increased to as much as 9% by 30 July 2009 and no treatment had a
disease severity greater than 10% until early August. Maximum disease severity (35%)
was reached by 27 Aug. 2009. In contrast, disease severity exceeded 10% on several
treatments by 19 May 2010 and 25% on most plots on 28 June 2010 (Table 2.3).
Maximum severity reached 72% by 3 Sept. 2010.
Area Under Disease Progress Curve
Accordingly, the area under the disease progress curve (AUDPC) values were
much lower in 2009 than in 2010, due to the late onset of disease and the lower peak
disease severity in 2009 (Tables 2.2 and 2.3). The AUDPC response to increased spring
topdressing rate was a linear decrease in 2009 and 2010 (Tables 2.2 and 2.3). Similarly,
increased summer topdressing rate produced a linear reduction in AUDPC in 2009 (Table
2.2); however, summer topdressing produced a quadratic decrease in AUDPC in 2010
(Table 2.3). The minimum AUDPC value in 2010 was obtained at a 0.39 L m-2
rate of
summer topdressing as estimated from the quadratic polynomial equation.
Main Effects on Individual Observation Dates
Treatment differences on the first four rating dates in 2009 were not considered
practically important because of the very low disease pressure (Table 2.2). Increased
spring topdressing rate produced a linear reduction in disease severity on 6 August 2009
that continued from 20 Aug. through 3 Sept. 2009 providing up to a 10% reduction in
74
severity. This effect of increased spring topdressing rate producing a linear reduction in
anthracnose severity (6 to 21%) was observed from 28 May through 3 Sept. 2010 (Table
2.3).
Increased summer topdressing rate produced a strong linear reduction in disease
severity from 30 July until 3 Sept. 2009; however, the response was quadratic on 13
August and depended on the spring topdressing rate on 20 August (Table 2.2). The
quadratic response indicated that the minimum disease severity occurred at an estimated
rate of 0.58 L m-2
.
Summer topdressing rate provided a strong linear reduction in disease severity on
the first two rating dates in 2010; however, the response weakened and became quadratic
by 19 June 2010 (Table 2.3). A quadratic response to summer topdressing rate was
apparent from 15 July to 3 Sept. 2010 but the response depended on the spring
topdressing rate on 15 July, 28 July and 3 Sept. Minimum disease severity occurred at an
estimated summer topdressing rates of 0.36 and 0.39 L m-2
on 19 June and 16 Aug. 2010,
respectively.
Interaction Effects on Individual Observation Dates
As mentioned, interactions between spring and summer topdressing rate were
evident on 20 Aug. 2009 and 15 and 28 July and 3 Sept. 2010 (Tables 2.2 and 2.3).
Increased summer topdressing rate produced a cubic, quadratic, and linear decrease in
disease severity under the 0, 1.2, and 2.4 L m-2
rates of spring topdressing, respectively,
on 20 Aug. 2009 (Table 2.4). The cubic response indicated that lower summer
topdressing rates (0.075 and 0.15 L m-2
) caused a slight increase in disease (3-4%) that
was maximized at an estimated summer rate of 0.08 L m-2
; whereas greater rates (0.3 and
75
0.6 L m-2
) reduced disease (14 to 24%) minimizing at an estimated rate of 0.5 L m-2
. The
quadratic response under the spring topdressing rate of 1.2 L m-2
indicated that disease
severity was lowest at an estimated summer topdressing rate of 0.54 L m-2
. Increased
summer topdressing rate had the smallest reduction (linear) in disease severity under 2.4
L m-2
of spring topdressing probably because the disease severity was already low (19%)
due to spring topdressing.
The interactions in July 2010 indicated that increased summer topdressing rate
had the greatest effect (quadratic) on anthracnose severity under the 0 L m-2
spring
topdressing level (Table 2.5). Minimum disease severity occurred at an estimated
summer topdressing rate of 0.38 L m-2
for both 15 and 28 July 2010. The only other
response to summer topdressing in July 2010 was a cubic response to summer
topdressing under 1.2 L m-2
of spring topdressing on 15 July. This cubic response
indicated that minimum disease severity occurred at an estimated summer topdressing
rate of 0.13 L m-2
. On 3 Sept. 2010, the shape of the quadratic disease severity response
to summer topdressing rate depended on the spring topdressing rate. Disease severity
decreased as summer topdressing rate increased under no spring topdressing, and the
lowest disease severity occurred at estimated summer topdressing rates of 0.52 L m-2
. In
contrast, the quadratic response to summer topdressing under 1.2 and 2.4 L m-2
of spring
topdressing suggested that increasing summer topdressing rates beyond 0.37 and 0.35 L
m-2
, respectively, produced slight increases in disease severity.
Turf Quality
Turf quality of all treatments was acceptable (>5) on every rating date in 2009 due
to the mild severity of the disease epiphytotic (Table 2.6). Turf quality was acceptable
76
for all treatments until mid-July in 2010 when disease symptoms caused severe damage
to the plots (Table 2.7).
Main Effects
Increased spring topdressing rate produced a linear improvement in turf quality in
2009 on 8 of 10 rating dates (Table 2.6). A quadratic response to spring topdressing rate
was evident on 27 May 2009 when turf quality was maximized at an estimated spring
topdressing rate of 1.6 L m-2
. Turf quality was not affected by spring topdressing on 16
July or 1 August 2009.
The turf quality response to increased spring topdressing rate was a quadratic
improvement early in the 2010 growing season similar to 2009 (Table 2.7). The best turf
quality was achieved at estimated spring topdressing rates of 1.3, 1.91 and 2.29 L m-2
on
19 May, 28 May and 4 June 2010, respectively. The turf quality response to increased
spring topdressing rate became linear on 11 June and continued through 3 Sept. 2010.
Increased summer topdressing rate produced a linear improvement in turf quality
by 24 June 2009 that continued, except for 6 and 16 July, until 17 Aug. 2009 (Table 2.6).
The turf quality response depended on the spring topdressing rate on 6 July and was a
quadratic improvement on 27 Aug. 2009, maximizing at an estimated summer
topdressing rate of 0.6 L m-2
. Summer topdressing had no effect on turf quality on 16
July 2009.
Increased summer topdressing rate produced linear improvements in turf quality
on most dates through 5 July 2010 (Table 2.7). Increased summer topdressing rate
produced a quadratic improvement in turf quality on 19 June and 15 and 28 July, and the
best turf quality occurred at estimated summer topdressing rates of 0.44, 0.46, and 0.36 L
77
m-2
, respectively. The turf quality response to summer topdressing rate depended on the
spring topdressing rate on 16 August and 3 Sept. 2010 (pr > F = 0.055).
Interaction Effects
Turf quality had a cubic response to summer topdressing rate when no spring
topdressing was applied on 6 July 2009 (Table 2.8). The best turf quality occurred at an
estimated summer topdressing rate of 0.47 L m-2
. Turf quality did not respond to summer
topdressing rate when spring topdressing was 1.2 or 2.4 L m-2
. The interaction also
indicated that there was not a benefit to turf quality from spring topdressing when
summer topdressing was applied at 0.3 and 0.6 L m-2
.
Summer topdressing rate produced a quadratic improvement in turf quality on 16
Aug. 2010 at the 0 and 2.4 L m-2
spring topdressing rates, and the best turf quality
occurred at estimated summer topdressing rates of 0.43 and 0.4 L m-2
, respectively (Table
2.8).
The spring by summer interaction was very close to statistical significance
(p=0.055) and showed similar responses on 3 Sept. 2010 as the previous interactions
(Table 2.8). The strongest positive response of turf quality to summer topdressing rate
occurred when no spring topdressing was applied. The response to summer topdressing
rate was quadratic under no spring topdressing, and the best turf quality was achieved at
an estimated summer rate of 0.49 L m-2
on 3 Sept. The interaction also indicated that
there was not a benefit to turf quality from spring topdressing when summer topdressing
was applied at 0.3 and 0.6 L m-2
.
Incorporation of Summer Topdressing Sand
Main Effects
78
Spring topdressing rate affected the incorporation of sand into the turf canopy on
five of ten dates in 2009, all of which occurred within 9 to 14 days after a summer
topdressing application (Table 2.9). In general, increased spring topdressing rate reduced
sand incorporation; however, this response was dependent on summer topdressing on 3
dates in 2009.
As expected, the 0 L m-2
summer topdressing rate had the best sand incorporation
rating (9) on all dates because no topdressing sand was applied to these plots during the
summer (Table 2.9). Also as expected, increasing the rate of summer sand topdressing
decreased sand incorporation. The summer rates of 0.075 and 0.15 L m-2
provided
acceptable sand incorporation ratings (>5) on all rating dates in 2009. Sand incorporation
was often marginally acceptable at the 0.3 L m-2
summer topdressing rate and very poor
at the 0.6 L m-2
summer topdressing rate.
Interaction Effects
Sand incorporation after summer topdressing depended on spring topdressing on 3
of 10 dates in 2009 (Table 2.9). The degree of the polynomial response was complicated
but generally indicated that sand incorporation of summer topdressing became poorer as
spring topdressing rate increased (Table 2.10). Sand incorporated well (ratings ≥ 7.8) for
all summer topdressing rates under 0 L m-2
of spring topdressing on 15 June 2009. Sand
incorporation of the 0.075 L m-2
summer topdressing rate was acceptable under 1.2 L m-2
of spring topdressing and only marginally acceptable under 2.4 L m-2
of spring
topdressing. Sand incorporation was only marginally acceptable at summer topdressing
rates of 0.15, 0.3 and 0.6 L m-2
when spring topdressing rate was 1.2 and 2.4 L m-2
.
79
On 11 July 2009, lower summer topdressing rates (0.075 and 0.15 L m-2
) had
acceptable sand incorporation when no spring topdressing was applied; however, these
summer topdressing rates incorporated more poorly under the 1.2 and 2.4 L m-2
spring
rates (Table 2.10). Sand incorporation was only marginally acceptable for the summer
topdressing rates of 0.3 and 0.6 L m-2
regardless of the spring topdressing rate.
The interaction on 27 July indicated that any effect of spring topdressing was very
limited (Table 2.10). Lower summer topdressing rates (0.075 and 0.15 L m-2
) had
acceptable sand incorporation under all spring rates. Only marginally acceptable
incorporation of sand was observed at the summer topdressing rate of 0.6 L m-2
under all
spring topdressing rates and at the 0.3 L m-2
summer topdressing rate under the 0 and 2.4
L m-2
spring topdressing rates.
Number of Days Required for Sand to Incorporate
The number of days after topdressing required for sand to reach an acceptable
level of incorporation increased as summer topdressing rates increased in 2009 and 2010
(Table 2.11).
The summer topdressing rate of 0.075 L m-2
always incorporated to an acceptable
level on the day of application during 2009 and 2010. Summer topdressing at 0.15 L m-2
required 0 to 2 days after topdressing to achieve an acceptable level of incorporation in
2009 and 2010. The number of days after topdressing required to achieve an acceptable
level of incorporation increased from 2 to 6 from June to August 2009 and from 2 to 7
from May to August 2010 for the summer topdressing rate of 0.3 L m-2
. The summer
topdressing rate of 0.6 L m-2
required from 6 to 14 days after topdressing from June to
80
August 2009 and from 7 to 14 days after topdressing from May to August 2010 to reach
an acceptable level of incorporation.
Volumetric Water Content
Increased spring topdressing rate reduced volumetric water content (VWC)
linearly on 30 July and 30 Aug. 2010 (Table 2.12). Similarly, increased summer
topdressing rate produced a linear reduction in VWC on 30 July and 30 Aug. 2010.
There was also an unexplainable, weak quartic response in VWC to summer topdressing
rate on 30 Aug. 2010.
Surface Hardness
Spring topdressing rate had no effect on surface hardness measured on 30 July
and 30 Aug. 2010 despite the presence of negatively linear VWC responses to increased
spring topdressing rate (Table 2.13). Contrary to expectations, increased summer
topdressing rate produced a slight linear reduction in surface hardness on 30 July, and
this same response was close to statistical significance (pr > F = 0.07 for both CIST and
TruFirm) on 30 August 2010 despite the negatively linear VWC response to increased
summer topdressing rate.
Turf Color
Turf color was acceptable (>5) for all treatments on the four dates it was
evaluated in 2011, after the conclusion of the study (Table 2.14). Generally, increased
spring and summer topdressing rate produced linear reductions in turf color on both 9
May and 23 Nov. 2011. The spring by summer interaction on 23 Nov. 2011 indicated
that the effect of increased summer topdressing rate on reducing turf color was primarily
evident when spring topdressing rate was 2.4 L m-2
(Table 2.15).
81
Thatch/Mat Layer Depth and Soil Nutrient Analysis
Main Effects
The thatch/mat layer depth was 28 mm thicker in the treatment that received the
greatest amount of sand (2.4 L m-2
spring rate and 0.6 L m-2
summer rate; 6.6 L m-2
yr-1
)
compared to the treatment receiving no sand topdressing (Table 2.16). There were little
differences in nutrient concentrations between the 0 and 6.6 L m-2
yr-1
treatments, and all
nutrient concentrations in both treatments were within the same relative category for
Mehlich III values (Heckman, 2006). However, there was a slightly greater
concentration of boron (0.3 mg kg-1
) in the 6.6 L m-2
yr-1
treatment compared to no
topdressing treatment. For both 0 and 6.6 L m-2
yr-1
treatments, P, K, Ca, and Fe were in
the very low category, and Mg was in the low category. All other nutrients were in the
high (optimal) category for both treatments. The categories of very low, low and medium
are considered below optimum; high is considered optimum; and very high is considered
above optimum (Heckman, 2006).
Accordingly, the depth of the soil fraction of the sample was 28 mm smaller in the
6.6 L m-2
yr-1
treatment compared to the 0 L m-2
treatment (Table 2.17). The pH (5.9) of
the 0 L m-2
yr-1
treatment was higher than the pH (5.7) of 6.6 L m-2
yr-1
treatment, and
concentrations of P, K, Ca, Mg, Mn, and Cu were also higher in the 0 L m-2
yr-1
treatment
compared to the 6.6 L m-2
yr-1
treatment. Similar to the thatch/mat fraction,
concentrations of all nutrients were found within the same relative level category for both
treatments in the soil fraction. Boron was the only nutrient in the very low category, and
Ca was the only nutrient in the low category. Potassium and Mg were in the medium

82
category, and P, Zn, Mn, and Cu were all at acceptable concentrations. Iron was found at
an above optimum level in the soil fraction.
83
DISCUSSION
Spring topdressing reduced anthracnose disease severity and occasionally
reduced the rate of summer topdressing needed to decrease disease severity. This was
evidenced by significant linear reductions in AUDPC and disease severity on individual
observation dates caused by increased spring topdressing rate and by interaction data
from the latter half of the 2010 season that indicated that the response to summer
topdressing rate was less substantial under increased spring topdressing rate, respectively.
Findings of increased summer topdressing rate (0, 0.3, and 0.6 L m-2
) decreasing
anthracnose severity were first reported by Inguagiato et al. (2012). Our results
supported those previous reports and showed that increased summer topdressing rate
decreased disease severity linearly during most of the 2009 season and the beginning of
the 2010 season. However, the response to increased summer topdressing rate became a
quadratic decrease in disease severity by late-2010 indicating that the greatest summer
topdressing rates had a diminishing effect on disease suppression and maximum disease
suppression was estimated to occur at rates lower than the highest summer topdressing
rate evaluated in this study.
An interaction occurred on one date in 2009 where summer topdressing at 0.075
and 0.15 L m-2
slightly increased disease severity 3 to 4% when no spring topdressing
was applied. However, this effect was only observed during the first trial-year and
dissipated after continued sand topdressing applications, as reported in previous trials
(Inguagiato et al., 2012; Inguagiato et al., 2013; Roberts, 2009). Inguagiato et al. (2013)
hypothesized that initial increases in disease severity occurring shortly after the initiation
of treatments during the first year of trials could have been caused by sand abrasion
84
injury to crowns that were not yet buried and protected by a sand topdressing or mat
layer. Landschoot and Hoyland (1995) reported that wounding ABG plants only at the
crown, not leaves, immediately before inoculation resulted in increased severity of
anthracnose basal rot. Penetration through wounds resulted in a more rapid and efficient
infection of maize (Zea mays L.) by the closely related pathogen C. graminicola;
however, wounds are not required to for penetration of maize stalks by C. graminicola
(Venard and Vaillancourt, 2007) or ABG leaves, sheaths, and roots by C. cereale
(reported as Colletotrichum spp.) (Smith, 1954). In fact, wound healing responses in
monocots have been found to confer resistance to fungal invasion by the infusion of cells
adjacent to wounds with an extensive layer of lignin or other phenols (Bostock and
Stermer, 1989). Previously wounded sites produced significantly less anthracnose than
unwounded sites on maize plants inoculated with C. graminicola (Muimba-Kankolongo
and Bergstrom, 1990) and on chili pepper plants (Capsicum annuum cv. Nokkwang)
inoculated with C. acutatum (Kim, 2008). Thus, it is possible that ABG plants in the
current study may have gained a level of resistance against invasion by C. cereale
through the healing of sites wounded by initial applications of sand topdressing.
Anthracnose survives unfavorable environmental conditions as saprophytic
mycelium in thatch (Smiley et al., 2005). White and Dickens (1984) found that
topdressing was the most effective practice to reduce thatch accumulation, and previous
research has suggested that sand topdressing may reduce disease symptoms by the
burying and dilution of disease inoculum (Madison et al., 1974; Sprague and Evaul,
1930). Thus, anthracnose severity may have been reduced by sand topdressing through

85
modification of the thatch into a more suitable growth medium and through the burying
and dilution of disease inoculum (mycelium) that survives in thatch.
Mat, an intermixed layer of thatch and mineral matter (e.g., sand) between the
thatch and soil (Beard and Beard, 2005), provides a more desirable growth medium for
plants than thatch alone because crowns growing in a mat layer are better protected from
temperature and moisture fluctuations, conditions that enhance anthracnose disease
severity, than crowns growing in thatch (Beard, 1973; Hurto et al., 1980; Smiley et al.,
2005). Annual bluegrass plants observed in profile cores removed from topdressed plots
in the current trial had longer leaf sheaths and more deeply buried crowns than plants
taken from nontopdressed plots. A mat layer may also provide physical support to
individual grass plants by adding new soil (sand) particles that surround tillers, crowns,
and adventitious roots resulting in more erect plants and potentially enhancing
photosynthesis. Protected crowns and adventitious roots are better able to support shoot
vigor and help to create a tighter, finer textured turf (Beard, 2002; Bengeyfield, 1969;
Hoos, 1981). Moreover, Inguagiato et al. (2012) suggested that a firmer turf surface
improves tolerance to low mowing by increasing the effective cutting height, which can
reduce anthracnose disease severity (Inguagiato et al., 2009).
Heavy-rate spring topdressing can provide an opportunity to incorporate large
amounts of sand into the thatch during a period when the growth of the turf (thatch
accumulation and canopy biomass development) is maximized and disruption to play is
minimized (Beard, 1973; Turgeon, 2011). It is not uncommon for some managers to only
apply sand topdressing once or twice a year during the spring and/or autumn, likely in
conjunction with a cultivation event, and not apply topdressing during the summer. A

86
beneficial mat layer could possibly be achieved through the sole use of sand topdressing
during spring or autumn; however, this approach can also result in the formation of
alternate layers of thatch and topdressing in the rootzone (Carrow, 1979; Fermanian et al.,
1985). Rootzone layering can be prevented by making additional applications of sand in
the summer at rates and frequencies that match the growth rate of the turf.
Sand incorporation data indicated that biweekly summer topdressing at 0.3 and
0.6 L m-2
left excess sand at the turf surface because these rates exceeded canopy biomass
development, which is relatively low during the summer months for cool season grasses
(Turgeon, 2011). This excess sand would likely interfere with play or mowing on a golf
course and may have also been the reason that slight increases in disease severity were
observed at these rates, compared to the 0.15 L m-2
summer topdressing rate when spring
topdressing was applied at 1.2 or 2.4 L m-2
on interaction dates during late-2010. Excess
sand from the 0.3 and 0.6 L m-2
summer topdressing rates may have buried green leaf
tissue and reduced the amount of sunlight (light intensity) available to the plants, which
has been reported to increase susceptibility of some maize genotypes to infection by C.
graminicola (Schall et al., 1980). In contrast, the summer topdressing rates of 0.075 and
0.15 L m-2
did not result in excess sand at the turf surface and were more likely to match
the growth of the turf (thatch accumulation and canopy biomass development).
The variation in disease response attributed to each main effect varied across
years of study. Summer topdressing accounted for most (82%) of the disease response in
2009, whereas spring topdressing accounted for most (73%) of the disease response in
2010 (data not shown). The limited effect of spring topdressing on disease development
in 2009 was probably due to the lack of disease symptoms early in the season. In

87
contrast, anthracnose was active by mid-May 2010 and a spring topdressing effect was
evident from May until the end of the season. In addition, the variation in response to
each factor between years could also be attributed to differences in cumulative amounts
of sand in plots. Inguagiato et al. (2012) concluded that disease reductions from sand
topdressing occurred earlier in the second year of a trial because a mat layer was already
been established from sand topdressing treatments applied during the first year.
On some dates in 2011 after the conclusion of the study, plots with greater
cumulative amounts of sand demonstrated lower turf color than plots that received no
sand. Results of soil nutrient analysis revealed no differences in nutrient concentrations
in either the soil or thatch/mat fractions between plots receiving the highest and lowest
annual cumulative sand (0 and 6.6 L m-2
yr-1
, respectively). Soil pH was slightly lower in
the soil layer of the 6.6 L m-2
yr-1
sand plots compared to no sand plots, however the pH
of both were within the acceptable range for P. annua (5.5 to 6.5) (Beard, 1973). These
differences in turf color could have been caused by subtle changes in VWC and possibly
drought stress among the high sand treatments. Plots that received 6.6 L m-2
yr-1
of sand
had a deeper thatch/mat layer than the nontopdressed plots, providing a more sandy
growth medium with lower water retention. Thus, it is likely that lower water retention
in plot topdressed at 6.6 L m-2
yr-1
had less plant available water in the upper 80 mm of
the profile than the no sand treatment and experienced greater drought stress.
In conclusion, topdressing during spring can reduce anthracnose severity, and
may decrease the rate of summer topdressing needed to achieve disease reductions. In
future research, it will be important to determine whether autumn topdressing produces a
similar effect.
88
REFERENCES
Beard, J.B. 1973. Turfgrass: Science and culture. Prentice Hall, Englewood Cliffs, NJ.
Beard, J.B. 2002. Turf management for golf courses. 2nd ed. Ann Arbor Press, Chelsea,
MI.
Beard, J.B., and H.J. Beard. 2005. Beard's turfgrass encyclopedia for golf courses,
grounds, lawns, sports fields. Michigan State Univ. Press, East Lansing, MI.
Bengeyfield, W.H. 1969. This year: Top-dress greens and see the difference. U.S. Golf
Assoc. Green Section Record 7(1):1-4.
Bigelow, C.A., and W.T. Tudor Jr. 2012. Economic analysis of creeping bentgrass and
annual bluegrass greens maintenance. Golf Course Manage. 80(10):76-78, 80, 82,
84, 86, 88, 90-93.
Bostock, R.M., and B.A. Stermer. 1989. Perspectives on Wound Healing in Resistance to
Pathogens. Annu. Rev. Phytopathol. 27(1):343-371. DOI:
doi:10.1146/annurev.py.27.090189.002015.
Carrow, R.N. 1979. Topdressing: An essential management tool. Golf Course Manage.
47(6):26-28, 30-32.
Carrow, R.N., B.J. Johnson, and R.E. Burns. 1987. Thatch and Quality of Tifway
Bermudagrass Turf in Relation to Fertility and Cultivation. Agron. J. 79(3):524-
530. DOI: 10.2134/agronj1987.00021962007900030025x.
Cooper, R., and C. Skogley. 1981. Putting green and sand/soil responses to sand
topdressing. U.S. Golf Assoc. Green Section Record 19:8-13.
Crouch, J.A., B.B. Clarke, and B.I. Hillman. 2006. Unraveling Evolutionary
Relationships Among the Divergent Lineages of Colletotrichum Causing
Anthracnose Disease in Turfgrass and Corn. Phytopathology 96(1):46-60. DOI:
10.1094/PHYTO-96-0046.
Dernoeden, P.H. 2012. Creeping bentgrass management. CRC Press.
89
Engel, R.E., and R.B. Alderfer. 1967. The effect of cultivation, topdressing, lime,
nitrogen and wetting agent on thatch development in 1/4-inch bentgrass turf over
a ten-year period. New Jersey Agric. Exp. Stn. Bull. 818:32-45.
Fermanian, T.W., J.E. Haley, and R.E. Burns. 1985. The effects of sand topdressing on a
heavily thatched creeping bentgrass turf. Proc. Int. Turf. Res. Conf. 5:439-448.
Green Section Staff. 2004. USGA recommendations for a method of putting green
construction. U.S. Golf Assoc. Green Section Construction Educ. Progr., Waco,
TX.
Hawes, D.T. 1980. Response of warm- and cool-season turfgrass polystands to nitrogen
and topdressing. Proc. Int. Turf. Res. Conf. 3:65-74.
Heckman, J.R. 2006. Soil fertility test interpretation: Phosphorus, potassium, magnesium,
and calcium. Fact Sheet FS719 Rutgers Cooperative Extension, New Jersey
Agricultural Experimental Extension.
Henderson, J.J., and N.A. Miller. 2010. Importance of particle size distribution,
application rate and sand depth in developing a fairway topdressing program.
Univ. of Conn. Turfgrass Res. Rep. 5:41-49.
Hoos, D.D. 1981. Topdressing. U.S. Golf Assoc. Green Section Record 19:22.
Hurto, K.A., A.J. Turgeon, and L.A. Spomer. 1980. Physical characteristics of thatch as a
turfgrass growing medium. Agron. J. 72(1):165-167.
Inguagiato, J.C., J.A. Murphy, and B.B. Clarke. 2009. Anthracnose Disease and Annual
Bluegrass Putting Green Performance Affected by Mowing Practices and
Lightweight Rolling. Crop Sci. 49(4):1454-1462. DOI:
10.2135/cropsci2008.07.0435.
Inguagiato, J.C., J.A. Murphy, and B.B. Clarke. 2012. Sand Topdressing Rate and
Interval Effects on Anthracnose Severity of an Annual Bluegrass Putting Green.
Crop Sci. 52(3):1406-1415. DOI: 10.2135/cropsci2011.01.0010.
Inguagiato, J.C., J.A. Murphy, B.B. Clarke, and J.A. Roberts. 2013. Topdressing sand
particle shape and incorporation effects on anthracnose severity of an annual
bluegrass putting green. Int. Turfgrass Res. Soc. J. 12:(accepted).
90
Kim, Y.H. 2008. Effect of delayed inoculation after wounding on the development of
anthracnose disease caused by Colletotrichum acutatum on chili pepper fruit. The
Plant Pathol. J. 24(4):392-399.
Landschoot, P., and B. Hoyland. 1995. Shedding some light on anthracnose basal rot.
Golf Course Manage 11:52-55.
Madden, L.V., G. Hughes, and F.Van den Bosch. 2007. The Study of Plant Disease
Epidemics. The American Phytopathological Society, APS Press, St. Paul, MN.
Madison, J.H., J.L. Paul, and W.B. Davis. 1974. Alternative method of greens
management. Proc. Int. Turf. Res. Conf. 2:431-437. DOI:
10.2135/1974.proc2ndintlturfgrass.c65.
Mehlich, A. 1984. Mehlich 3 soil test extractant: A modification of Mehlich 2 extractant.
Communications in Soil Sci. & Plant Analysis 15(12):1409-1416.
Muimba-Kankolongo, A., and G.C. Bergstrom. 1990. Transitory wound predisposition of
maize to Anthracnose stalk rot. Can. J. Plant Pathol. 12(1):1-10.
O'Brien, P., and C. Hartwiger. 2003. Aeration and topdressing for the 21st century: Two
old concepts are linked together to offer up-to-date recommendations. U.S Golf
Assoc. Green Section Record 41(2):1-7.
Piper, C.V., and R.A. Oakley. 1917. Turf for golf courses. Macmillan, New York, NY.
Roberts, J.A. 2009. Impact of cultural management on anthracnose severity of annual
bluegrass putting green turf. M.S. Thesis: Rutgers Univ.
Schall, R.A., R.L. Nicholson, and H.L. Warren. 1980. Influence of light on maize
anthracnose in the greenhouse. Phytopathology 70(10):1023-1026.
Smiley, R.W., P.H. Dernoeden, and B.B. Clarke. 2005. Compendium of turfgrass
diseases. APS press, St. Paul, MN.
Smith, J.D. 1954. A disease of Poa annua. J. Sports Turf Res. Inst. 8:344-353.

91
Sprague, H.B., and E.E. Evaul. 1930. Experiments with turf grasses in New Jersey. New
Jersey Agric. Exp. Stn. Bull.
Stier, J.C., and A.B. Hollman. 2003. Cultivation and topdressing requirements for thatch
management in A and G bentgrasses and creeping bluegrass. HortScience
38(6):1227-1231.
Towers, G., K. Green, E. Weibel, P. Majumdar, and B.B. Clarke. 2003. Evaluation of
fungicides for the control of anthracnose basal rot on annual bluegrass. 2002.
Fungicide and Nematicide Tests 58:T017.
Turgeon, A.J. 2011. Turfgrass Management, Prentice Hall, Upper Saddle River, NJ.
Vavrek Jr., R.C. 1995. A successful topdressing program requires consistency,
commitment, and communication. U.S Golf Assoc. Green Section Record
33(5):8-10.
Venard, C., and L. Vaillancourt. 2007b. Penetration and colonization of unwounded
maize tissues by the maize anthracnose pathogen Colletotrichum graminicola and
the related nonpathogen C. sublineolum. Mycologia 99(3):368-377.
White, R.H., and R. Dickens. 1984. Thatch Accumulation in Bermudagrass as Influenced
by Cultural Practices. Agron. J. 76:19-22. DOI:
10.2134/agronj1984.00021962007600010006x.

92
Table 2.1. Particle size distribution of sand used for topdressing in 2009 and 2010.
Sieve size opening
2 mm 1 mm 500 μm 250 μm 149 μm 105 μm 53 μm Pan
-------------------------------------------- % retained (by weight) --------------------------------------------
0 <0.1 31.3 65.1 3.3 0.2 <0.1 <0.1
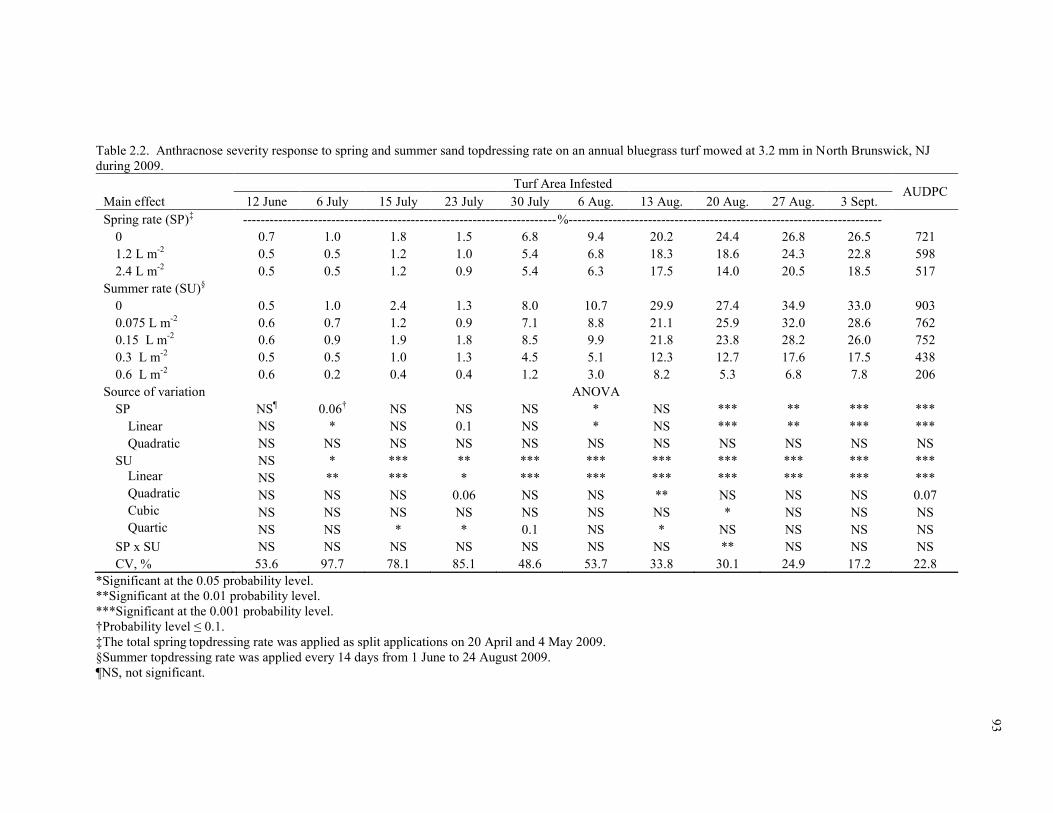
93
Table 2.2. Anthracnose severity response to spring and summer sand topdressing rate on an annual bluegrass turf mowed at 3.2 mm in North Brunswick, NJ
during 2009.
Turf Area Infested AUDPC
Main effect 12 June 6 July 15 July 23 July 30 July 6 Aug. 13 Aug. 20 Aug. 27 Aug. 3 Sept.
Spring rate (SP)‡ -----------------------------------------------------------------------%-----------------------------------------------------------------------
0 0.7 1.0 1.8 1.5 6.8 9.4 20.2 24.4 26.8 26.5 721
1.2 L m-2
0.5 0.5 1.2 1.0 5.4 6.8 18.3 18.6 24.3 22.8 598
2.4 L m-2
0.5 0.5 1.2 0.9 5.4 6.3 17.5 14.0 20.5 18.5 517
Summer rate (SU)§
0 0.5 1.0 2.4 1.3 8.0 10.7 29.9 27.4 34.9 33.0 903
0.075 L m-2
0.6 0.7 1.2 0.9 7.1 8.8 21.1 25.9 32.0 28.6 762
0.15 L m-2
0.6 0.9 1.9 1.8 8.5 9.9 21.8 23.8 28.2 26.0 752
0.3 L m-2
0.5 0.5 1.0 1.3 4.5 5.1 12.3 12.7 17.6 17.5 438
0.6 L m-2
0.6 0.2 0.4 0.4 1.2 3.0 8.2 5.3 6.8 7.8 206
Source of variation ANOVA
SP NS¶ 0.06
† NS NS NS * NS *** ** *** ***
Linear NS * NS 0.1 NS * NS *** ** *** ***
Quadratic NS NS NS NS NS NS NS NS NS NS NS
SU NS * *** ** *** *** *** *** *** *** ***
Linear NS ** *** * *** *** *** *** *** *** ***
Quadratic NS NS NS 0.06 NS NS ** NS NS NS 0.07
Cubic NS NS NS NS NS NS NS * NS NS NS
Quartic NS NS * * 0.1 NS * NS NS NS NS
SP x SU NS NS NS NS NS NS NS ** NS NS NS
CV, % 53.6 97.7 78.1 85.1 48.6 53.7 33.8 30.1 24.9 17.2 22.8
*Significant at the 0.05 probability level.
**Significant at the 0.01 probability level.
***Significant at the 0.001 probability level.
†Probability level ≤ 0.1.
‡The total spring topdressing rate was applied as split applications on 20 April and 4 May 2009.
§Summer topdressing rate was applied every 14 days from 1 June to 24 August 2009.
¶NS, not significant.
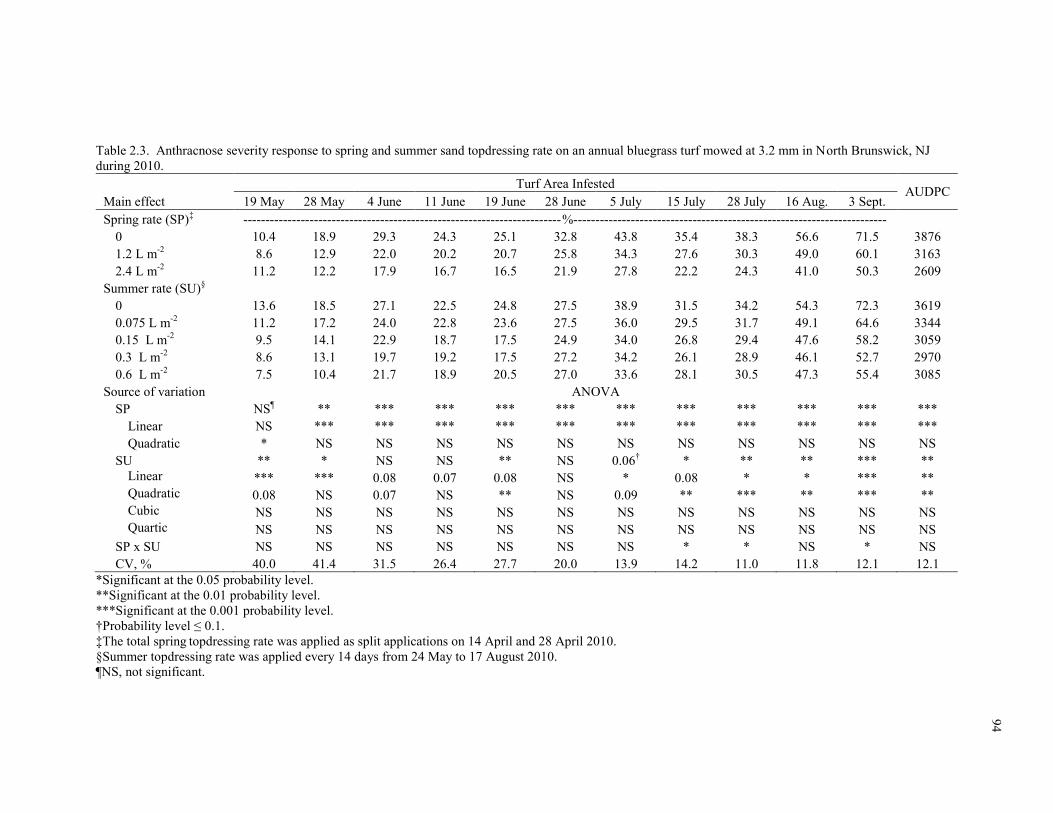
94
Table 2.3. Anthracnose severity response to spring and summer sand topdressing rate on an annual bluegrass turf mowed at 3.2 mm in North Brunswick, NJ
during 2010.
Turf Area Infested AUDPC
Main effect 19 May 28 May 4 June 11 June 19 June 28 June 5 July 15 July 28 July 16 Aug. 3 Sept.
Spring rate (SP)‡ ------------------------------------------------------------------------%-----------------------------------------------------------------------
0 10.4 18.9 29.3 24.3 25.1 32.8 43.8 35.4 38.3 56.6 71.5 3876
1.2 L m-2
8.6 12.9 22.0 20.2 20.7 25.8 34.3 27.6 30.3 49.0 60.1 3163
2.4 L m-2
11.2 12.2 17.9 16.7 16.5 21.9 27.8 22.2 24.3 41.0 50.3 2609
Summer rate (SU)§
0 13.6 18.5 27.1 22.5 24.8 27.5 38.9 31.5 34.2 54.3 72.3 3619
0.075 L m-2
11.2 17.2 24.0 22.8 23.6 27.5 36.0 29.5 31.7 49.1 64.6 3344
0.15 L m-2
9.5 14.1 22.9 18.7 17.5 24.9 34.0 26.8 29.4 47.6 58.2 3059
0.3 L m-2
8.6 13.1 19.7 19.2 17.5 27.2 34.2 26.1 28.9 46.1 52.7 2970
0.6 L m-2
7.5 10.4 21.7 18.9 20.5 27.0 33.6 28.1 30.5 47.3 55.4 3085
Source of variation ANOVA
SP NS¶ ** *** *** *** *** *** *** *** *** *** ***
Linear NS *** *** *** *** *** *** *** *** *** *** ***
Quadratic * NS NS NS NS NS NS NS NS NS NS NS
SU ** * NS NS ** NS 0.06† * ** ** *** **
Linear *** *** 0.08 0.07 0.08 NS * 0.08 * * *** **
Quadratic 0.08 NS 0.07 NS ** NS 0.09 ** *** ** *** **
Cubic NS NS NS NS NS NS NS NS NS NS NS NS
Quartic NS NS NS NS NS NS NS NS NS NS NS NS
SP x SU NS NS NS NS NS NS NS * * NS * NS
CV, % 40.0 41.4 31.5 26.4 27.7 20.0 13.9 14.2 11.0 11.8 12.1 12.1
*Significant at the 0.05 probability level.
**Significant at the 0.01 probability level.
***Significant at the 0.001 probability level.
†Probability level ≤ 0.1.
‡The total spring topdressing rate was applied as split applications on 14 April and 28 April 2010.
§Summer topdressing rate was applied every 14 days from 24 May to 17 August 2010.
¶NS, not significant.
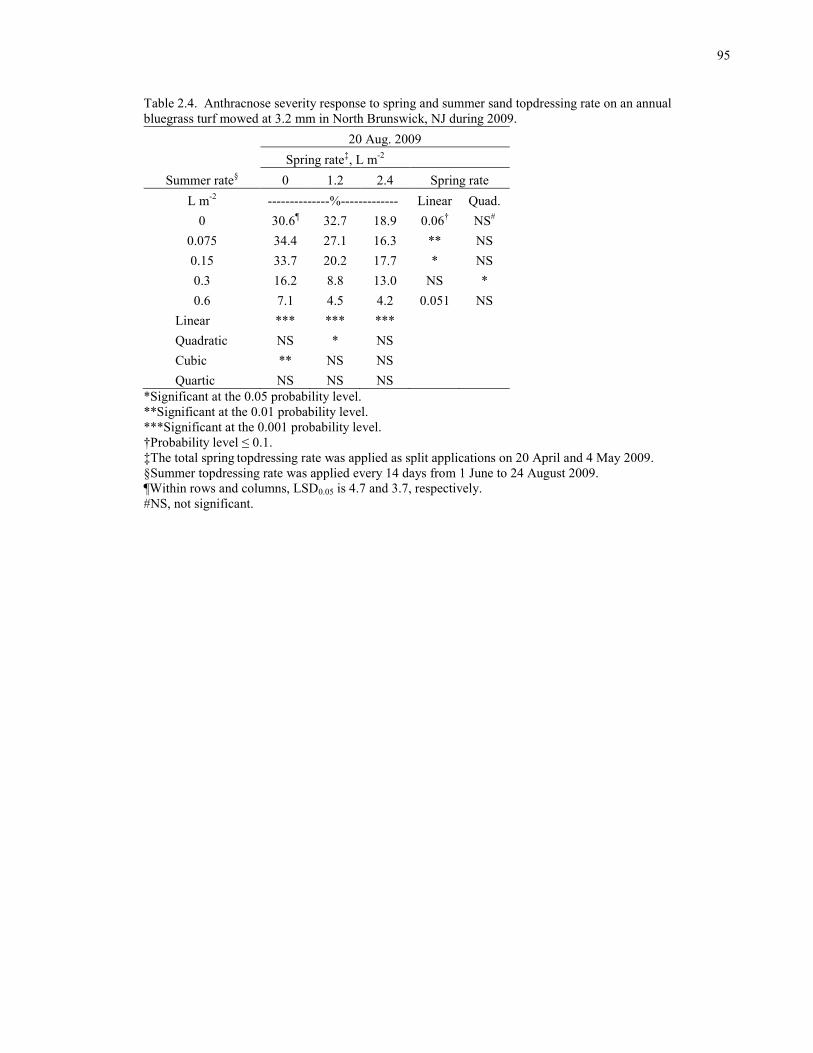
95
95
Table 2.4. Anthracnose severity response to spring and summer sand topdressing rate on an annual
bluegrass turf mowed at 3.2 mm in North Brunswick, NJ during 2009.
20 Aug. 2009
Spring rate‡, L m
-2
Summer rate§ 0 1.2 2.4 Spring rate
L m-2
--------------%------------- Linear Quad.
0 30.6¶ 32.7 18.9 0.06
† NS
#
0.075 34.4 27.1 16.3 ** NS
0.15 33.7 20.2 17.7 * NS
0.3 16.2 8.8 13.0 NS *
0.6 7.1 4.5 4.2 0.051 NS
Linear *** *** ***
Quadratic NS * NS
Cubic ** NS NS
Quartic NS NS NS
*Significant at the 0.05 probability level.
**Significant at the 0.01 probability level.
***Significant at the 0.001 probability level.
†Probability level ≤ 0.1.
‡The total spring topdressing rate was applied as split applications on 20 April and 4 May 2009.
§Summer topdressing rate was applied every 14 days from 1 June to 24 August 2009.
¶Within rows and columns, LSD0.05 is 4.7 and 3.7, respectively.
#NS, not significant.
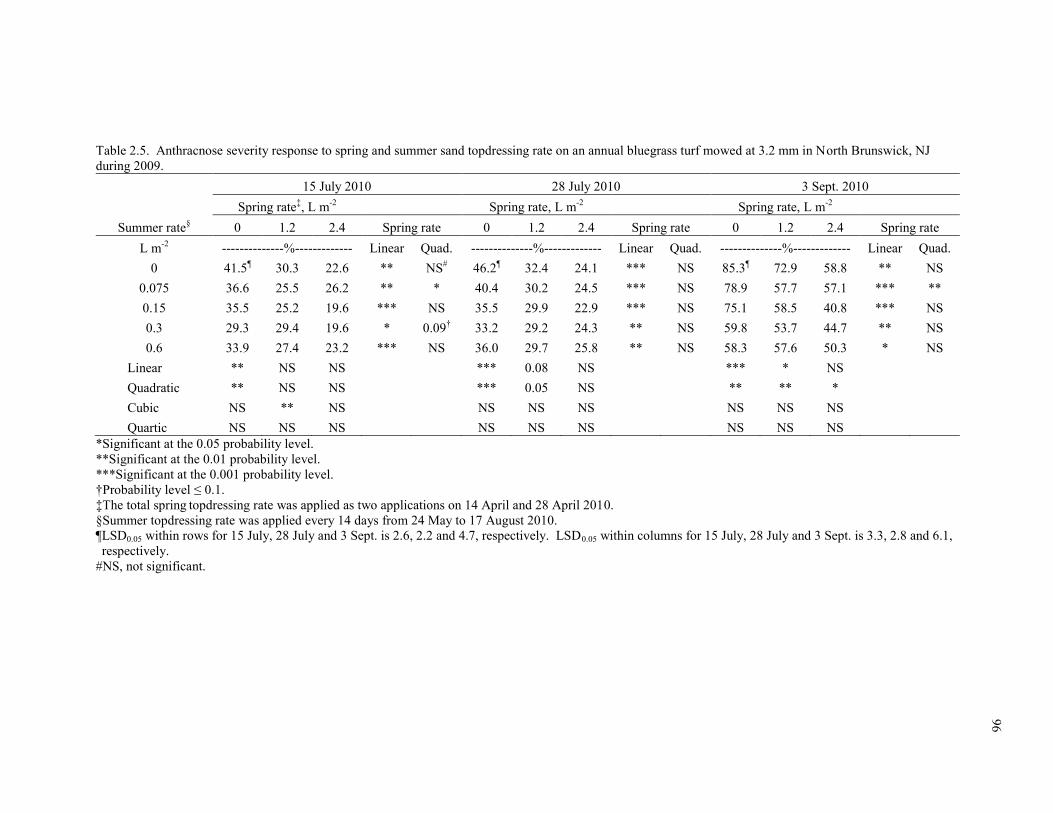
96
Table 2.5. Anthracnose severity response to spring and summer sand topdressing rate on an annual bluegrass turf mowed at 3.2 mm in North Brunswick, NJ
during 2009.
15 July 2010 28 July 2010 3 Sept. 2010
Spring rate‡, L m
-2 Spring rate, L m
-2 Spring rate, L m
-2
Summer rate§ 0 1.2 2.4 Spring rate 0 1.2 2.4 Spring rate 0 1.2 2.4 Spring rate
L m-2
--------------%------------- Linear Quad. --------------%------------- Linear Quad. --------------%------------- Linear Quad.
0 41.5¶ 30.3 22.6 ** NS
# 46.2
¶ 32.4 24.1 *** NS 85.3
¶ 72.9 58.8 ** NS
0.075 36.6 25.5 26.2 ** * 40.4 30.2 24.5 *** NS 78.9 57.7 57.1 *** **
0.15 35.5 25.2 19.6 *** NS 35.5 29.9 22.9 *** NS 75.1 58.5 40.8 *** NS
0.3 29.3 29.4 19.6 * 0.09† 33.2 29.2 24.3 ** NS 59.8 53.7 44.7 ** NS
0.6 33.9 27.4 23.2 *** NS 36.0 29.7 25.8 ** NS 58.3 57.6 50.3 * NS
Linear ** NS NS *** 0.08 NS *** * NS
Quadratic ** NS NS *** 0.05 NS ** ** *
Cubic NS ** NS NS NS NS NS NS NS
Quartic NS NS NS NS NS NS NS NS NS
*Significant at the 0.05 probability level.
**Significant at the 0.01 probability level.
***Significant at the 0.001 probability level.
†Probability level ≤ 0.1.
‡The total spring topdressing rate was applied as two applications on 14 April and 28 April 2010.
§Summer topdressing rate was applied every 14 days from 24 May to 17 August 2010.
¶LSD0.05 within rows for 15 July, 28 July and 3 Sept. is 2.6, 2.2 and 4.7, respectively. LSD0.05 within columns for 15 July, 28 July and 3 Sept. is 3.3, 2.8 and 6.1,
respectively.
#NS, not significant.
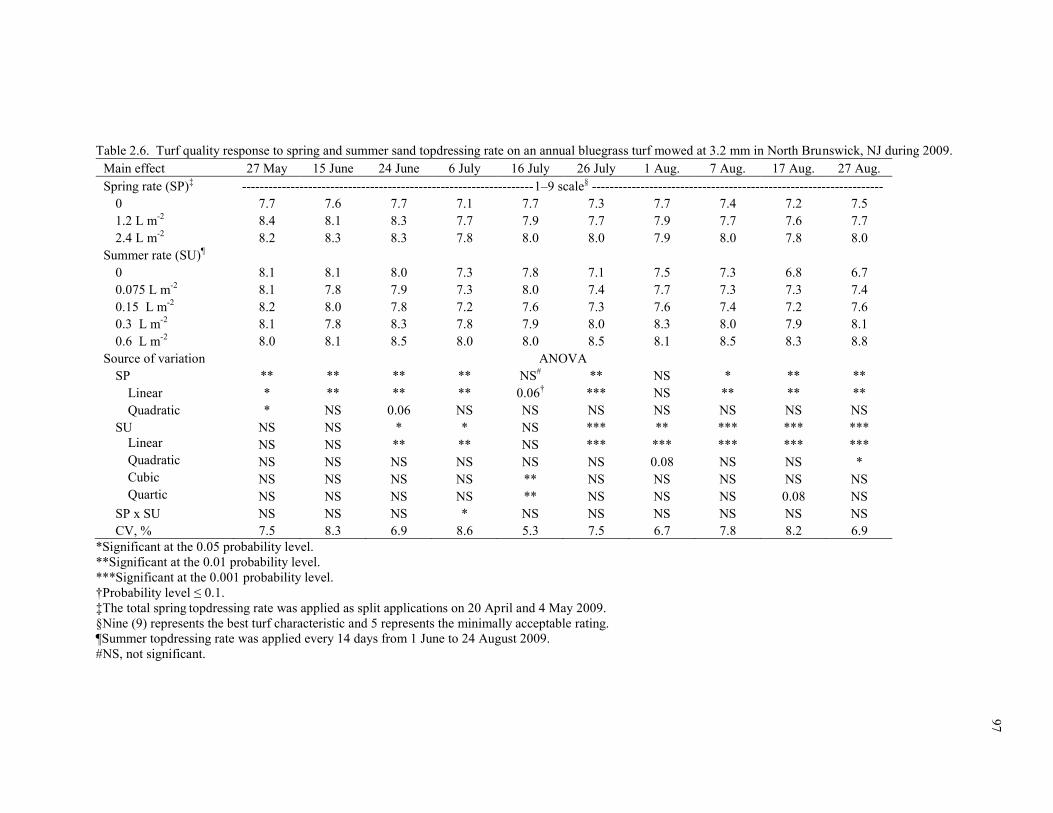
97
Table 2.6. Turf quality response to spring and summer sand topdressing rate on an annual bluegrass turf mowed at 3.2 mm in North Brunswick, NJ during 2009.
Main effect 27 May 15 June 24 June 6 July 16 July 26 July 1 Aug. 7 Aug. 17 Aug. 27 Aug.
Spring rate (SP)‡ ------------------------------------------------------------------1–9 scale
§ ------------------------------------------------------------------
0 7.7 7.6 7.7 7.1 7.7 7.3 7.7 7.4 7.2 7.5
1.2 L m-2
8.4 8.1 8.3 7.7 7.9 7.7 7.9 7.7 7.6 7.7
2.4 L m-2
8.2 8.3 8.3 7.8 8.0 8.0 7.9 8.0 7.8 8.0
Summer rate (SU)¶
0 8.1 8.1 8.0 7.3 7.8 7.1 7.5 7.3 6.8 6.7
0.075 L m-2
8.1 7.8 7.9 7.3 8.0 7.4 7.7 7.3 7.3 7.4
0.15 L m-2
8.2 8.0 7.8 7.2 7.6 7.3 7.6 7.4 7.2 7.6
0.3 L m-2
8.1 7.8 8.3 7.8 7.9 8.0 8.3 8.0 7.9 8.1
0.6 L m-2
8.0 8.1 8.5 8.0 8.0 8.5 8.1 8.5 8.3 8.8
Source of variation ANOVA
SP ** ** ** ** NS# ** NS * ** **
Linear * ** ** ** 0.06† *** NS ** ** **
Quadratic * NS 0.06 NS NS NS NS NS NS NS
SU NS NS * * NS *** ** *** *** ***
Linear NS NS ** ** NS *** *** *** *** ***
Quadratic NS NS NS NS NS NS 0.08 NS NS *
Cubic NS NS NS NS ** NS NS NS NS NS
Quartic NS NS NS NS ** NS NS NS 0.08 NS
SP x SU NS NS NS * NS NS NS NS NS NS
CV, % 7.5 8.3 6.9 8.6 5.3 7.5 6.7 7.8 8.2 6.9
*Significant at the 0.05 probability level.
**Significant at the 0.01 probability level.
***Significant at the 0.001 probability level.
†Probability level ≤ 0.1.
‡The total spring topdressing rate was applied as split applications on 20 April and 4 May 2009.
§Nine (9) represents the best turf characteristic and 5 represents the minimally acceptable rating.
¶Summer topdressing rate was applied every 14 days from 1 June to 24 August 2009.
#NS, not significant.

98
Table 2.7. Turf quality response to spring and summer sand topdressing rate on an annual bluegrass turf mowed at 3.2 mm in North Brunswick, NJ during 2010.
May June July Aug. Sept.
Main effect 19 28 4 11 19 28 5 15 28 16 3
Spring rate (SP)‡ -------------------------------------------------------------------------1–9 scale
§ -------------------------------------------------------------------------
0 7.0 6.2 5.9 6.2 6.2 5.3 5.0 4.5 4.5 3.1 2.7
1.2 L m-2
7.8 7.4 7.1 7.1 7.3 6.2 5.9 5.3 5.6 4.6 3.8
2.4 L m-2
7.2 7.5 7.5 7.9 7.9 6.9 6.8 6.5 6.7 5.5 4.8
Summer rate (SU)¶
0 7.1 6.5 6.3 6.7 6.4 5.7 5.4 5.0 4.8 3.3 2.5
0.075 L m-2
7.1 7.0 6.7 6.8 6.9 5.8 5.6 5.2 5.5 4.3 3.8
0.15 L m-2
7.6 7.1 6.8 7.0 7.3 6.2 6.0 5.5 5.8 4.6 4.1
0.3 L m-2
7.3 7.3 7.1 7.3 7.4 6.3 6.1 5.8 6.2 4.9 4.2
0.6 L m-2
7.6 7.2 7.3 7.5 7.5 6.6 6.3 5.6 5.7 4.8 4.3
Source of variation ANOVA
SP *** *** *** *** *** *** *** *** *** *** ***
Linear NS# *** *** *** *** *** *** *** *** *** ***
Quadratic *** * * NS NS NS NS NS NS 0.09† NS
SU 0.09 NS ** ** *** ** ** * *** *** ***
Linear * NS *** *** *** *** *** * *** *** ***
Quadratic NS NS NS NS ** NS NS * *** *** **
Cubic NS NS NS NS NS NS NS NS NS NS *
Quartic 0.09 NS NS NS NS NS NS NS NS NS NS
SP x SU NS NS NS NS NS NS NS NS NS * 0.055
CV, % 8.1 13.5 10.2 8.2 7.7 10.3 10.2 11.9 13.7 13.1 24.3
*Significant at the 0.05 probability level.
**Significant at the 0.01 probability level.
***Significant at the 0.001 probability level.
†Probability level ≤ 0.1.
‡The total spring topdressing rate was applied as split applications on 14 April and 28 April 2010.
§Nine (9) represents the best turf characteristic and 5 represents the minimally acceptable rating.
¶Summer topdressing rate was applied every 14 days from 24 May to 17 August 2010.
#NS, not significant
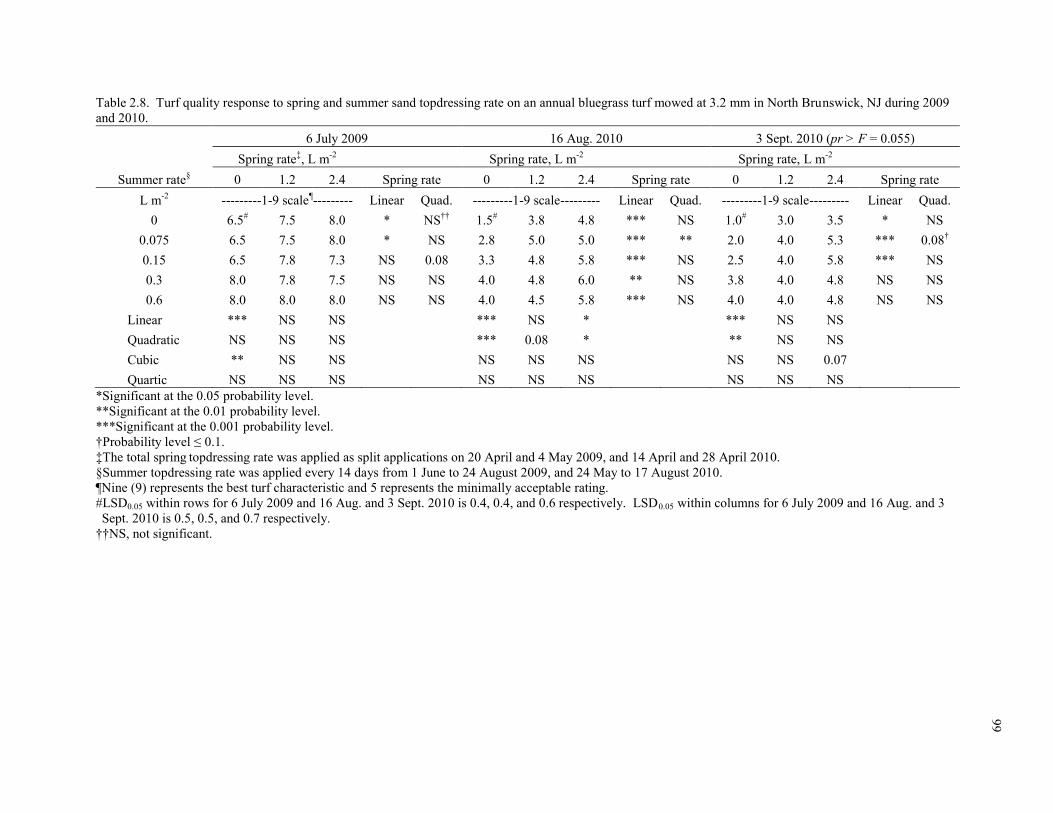
99
Table 2.8. Turf quality response to spring and summer sand topdressing rate on an annual bluegrass turf mowed at 3.2 mm in North Brunswick, NJ during 2009
and 2010.
6 July 2009 16 Aug. 2010 3 Sept. 2010 (pr > F = 0.055)
Spring rate‡, L m
-2 Spring rate, L m
-2 Spring rate, L m
-2
Summer rate§ 0 1.2 2.4 Spring rate 0 1.2 2.4 Spring rate 0 1.2 2.4 Spring rate
L m-2
---------1-9 scale¶--------- Linear Quad. ---------1-9 scale--------- Linear Quad. ---------1-9 scale--------- Linear Quad.
0 6.5# 7.5 8.0 * NS
†† 1.5
# 3.8 4.8 *** NS 1.0
# 3.0 3.5 * NS
0.075 6.5 7.5 8.0 * NS 2.8 5.0 5.0 *** ** 2.0 4.0 5.3 *** 0.08†
0.15 6.5 7.8 7.3 NS 0.08 3.3 4.8 5.8 *** NS 2.5 4.0 5.8 *** NS
0.3 8.0 7.8 7.5 NS NS 4.0 4.8 6.0 ** NS 3.8 4.0 4.8 NS NS
0.6 8.0 8.0 8.0 NS NS 4.0 4.5 5.8 *** NS 4.0 4.0 4.8 NS NS
Linear *** NS NS *** NS * *** NS NS
Quadratic NS NS NS *** 0.08 * ** NS NS
Cubic ** NS NS NS NS NS NS NS 0.07
Quartic NS NS NS NS NS NS NS NS NS
*Significant at the 0.05 probability level.
**Significant at the 0.01 probability level.
***Significant at the 0.001 probability level.
†Probability level ≤ 0.1.
‡The total spring topdressing rate was applied as split applications on 20 April and 4 May 2009, and 14 April and 28 April 2010.
§Summer topdressing rate was applied every 14 days from 1 June to 24 August 2009, and 24 May to 17 August 2010.
¶Nine (9) represents the best turf characteristic and 5 represents the minimally acceptable rating.
#LSD0.05 within rows for 6 July 2009 and 16 Aug. and 3 Sept. 2010 is 0.4, 0.4, and 0.6 respectively. LSD0.05 within columns for 6 July 2009 and 16 Aug. and 3
Sept. 2010 is 0.5, 0.5, and 0.7 respectively.
††NS, not significant.
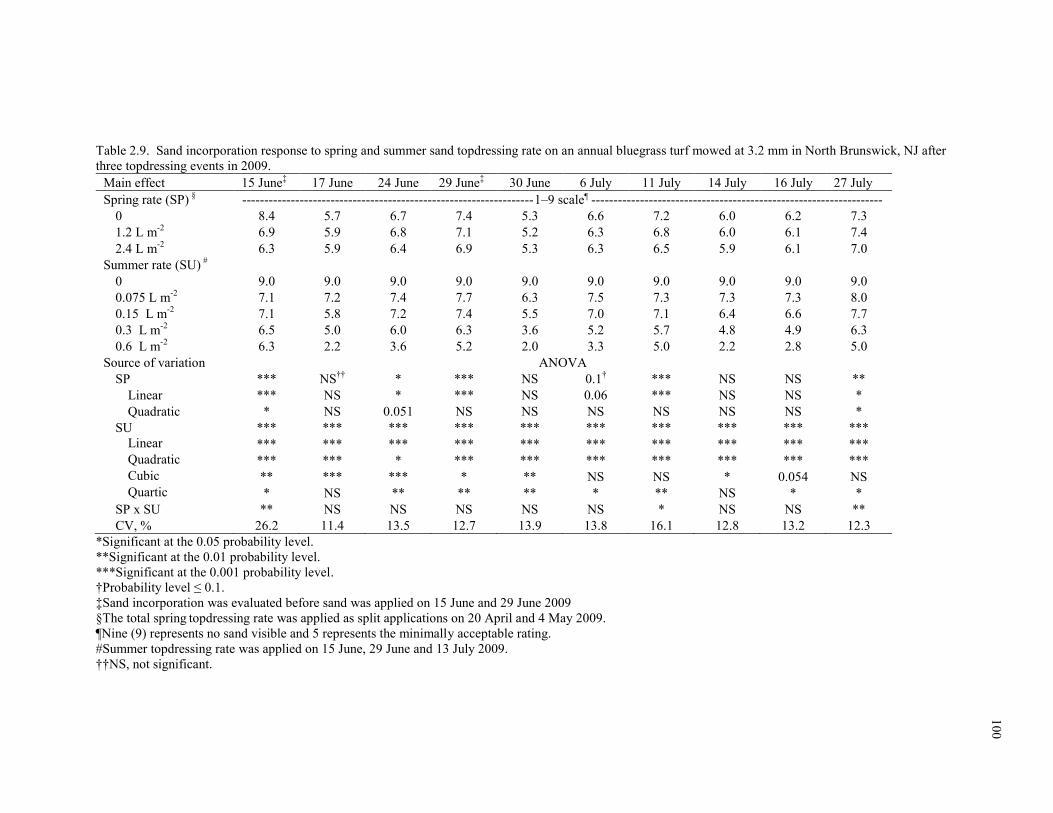
10
0
Table 2.9. Sand incorporation response to spring and summer sand topdressing rate on an annual bluegrass turf mowed at 3.2 mm in North Brunswick, NJ after
three topdressing events in 2009.
Main effect 15 June‡ 17 June 24 June 29 June
‡ 30 June 6 July 11 July 14 July 16 July 27 July
Spring rate (SP) § ------------------------------------------------------------------1–9 scale¶ ------------------------------------------------------------------
0 8.4 5.7 6.7 7.4 5.3 6.6 7.2 6.0 6.2 7.3
1.2 L m-2
6.9 5.9 6.8 7.1 5.2 6.3 6.8 6.0 6.1 7.4
2.4 L m-2
6.3 5.9 6.4 6.9 5.3 6.3 6.5 5.9 6.1 7.0
Summer rate (SU) #
0 9.0 9.0 9.0 9.0 9.0 9.0 9.0 9.0 9.0 9.0
0.075 L m-2
7.1 7.2 7.4 7.7 6.3 7.5 7.3 7.3 7.3 8.0
0.15 L m-2
7.1 5.8 7.2 7.4 5.5 7.0 7.1 6.4 6.6 7.7
0.3 L m-2
6.5 5.0 6.0 6.3 3.6 5.2 5.7 4.8 4.9 6.3
0.6 L m-2
6.3 2.2 3.6 5.2 2.0 3.3 5.0 2.2 2.8 5.0
Source of variation ANOVA
SP *** NS††
* *** NS 0.1† *** NS NS **
Linear *** NS * *** NS 0.06 *** NS NS *
Quadratic * NS 0.051 NS NS NS NS NS NS *
SU *** *** *** *** *** *** *** *** *** ***
Linear *** *** *** *** *** *** *** *** *** ***
Quadratic *** *** * *** *** *** *** *** *** ***
Cubic ** *** *** * ** NS NS * 0.054 NS
Quartic * NS ** ** ** * ** NS * *
SP x SU ** NS NS NS NS NS * NS NS **
CV, % 26.2 11.4 13.5 12.7 13.9 13.8 16.1 12.8 13.2 12.3
*Significant at the 0.05 probability level.
**Significant at the 0.01 probability level.
***Significant at the 0.001 probability level.
†Probability level ≤ 0.1.
‡Sand incorporation was evaluated before sand was applied on 15 June and 29 June 2009
§The total spring topdressing rate was applied as split applications on 20 April and 4 May 2009.
¶Nine (9) represents no sand visible and 5 represents the minimally acceptable rating.
#Summer topdressing rate was applied on 15 June, 29 June and 13 July 2009.
††NS, not significant.

10
1
Table 2.10. Sand incorporation response to spring and summer sand topdressing rate on an annual bluegrass turf mowed at 3.2 mm in North Brunswick, NJ
during 2009.
15 June 2009 11 July 2009 27 July 2009
Spring rate‡, L m
-2 Spring rate, L m
-2 Spring rate, L m
-2
Summer rate§ 0 1.2 2.4 Spring rate 0 1.2 2.4 Spring rate 0 1.2 2.4 Spring rate
L m-2
---------1–9 scale¶--------- Linear Quad. ----------1–9 scale--------- Linear Quad. ----------1–9 scale--------- Linear Quad.
0 9.0# 9.0 9.0 NS
†† NS 9.0
# 9.0 9.0 NS NS 9.0
# 9.0 9.0 NS NS
0.075 8.3 7.3 5.8 * NS 8.0 7.5 6.5 * NS 8.0 8.0 8.0 NS NS
0.15 9.0 6.5 5.8 ** NS 8.0 6.8 6.5 * NS 8.0 7.8 7.3 * NS
0.3 7.8 6.0 5.8 ** NS 5.8 5.8 5.5 NS NS 6.3 7.0 5.8 NS 0.06†
0.6 7.8 5.8 5.3 ** NS 5.3 5.0 4.8 NS NS 5.0 5.0 5.0 NS NS
Linear ** ** *** *** *** *** *** *** ***
Quadratic NS * *** ** *** ** ** NS ***
Cubic NS NS *** * 0.09 * 0.08 NS NS
Quartic * NS * * NS 0.054 ** NS NS
*Significant at the 0.05 probability level.
**Significant at the 0.01 probability level.
***Significant at the 0.001 probability level.
†Probability level ≤ 0.1.
‡The total spring topdressing rate was applied as split applications on 20 April and 4 May 2009.
§Summer topdressing rate was applied every 14 days from 1 June to 24 August 2009.
¶Nine (9) represents no sand visible above turf canopy and 5 represents the minimally acceptable rating.
#LSD0.05 within rows for 15 June, 11 July and 27 July is 0.5, 0.3 and 0.2, respectively. LSD0.05 within columns for 15 June, 11 July and 27 July is 0.6, 0.4 and
0.3, respectively.
††NS, not significant.

10
2
Table 2.11. Number of days for topdressing sand to achieve an acceptable level of incorporation for spring and summer sand topdressing rates on an annual
bluegrass turf mowed at 3.2 mm in North Brunswick, NJ during 2009.
2009 2010
Topdressing rate June July August May June July August
Spring† Summer
‡ 1 15 29 13 27 10 24 24 7 21 5 19 2 17
----------L m-2
---------- ------------------------------------------------------------days after topdressing------------------------------------------------------------
0 0 0 0 0 0 0 0 0 0 0 0 0 0 0 0
0 0.075 0 0 0 0 0 0 0 0 0 0 0 0 0 0
0 0.15 0 0 1 1 1 1 2 0 0 1 1 1 1 2
0 0.3 2 2 3 3 4 5 6 2 2 3 3 5 6 7
0 0.6 6 8 8 9 10 12 14 6 8 8 10 11 13 14
1.2 0 0 0 0 0 0 0 0 0 0 0 0 0 0 0
1.2 0.075 0 0 0 0 0 0 0 0 0 0 0 0 0 0
1.2 0.15 0 0 1 1 1 1 2 0 0 1 1 1 1 2
1.2 0.3 2 2 3 3 4 5 6 2 2 3 3 5 6 7
1.2 0.6 6 8 9 9 10 12 14 6 8 9 10 11 13 14
2.4 0 0 0 0 0 0 0 0 0 0 0 0 0 0 0
2.4 0.075 0 0 0 0 0 0 0 0 0 0 0 0 0 0
2.4 0.15 0 0 1 1 1 1 2 0 0 1 1 1 1 2
2.4 0.3 2 2 3 3 4 5 6 2 2 3 4 5 6 7
2.4 0.6 6 9 9 9 10 12 14 7 9 10 10 11 13 14
†The total spring topdressing rate was applied as split applications on 20 April and 4 May 2009, and 14 April and 28 April 2010.
‡Summer topdressing rate was applied on 1 June, 15 June, 29 June, 13 July, 27 July, 10 Aug., 24 Aug. 2009; and 24 May, 7 June , 21 June, 5 July, 19 July, 2
Aug. 17 Aug. 2010.

10
3
Table 2.12. Volumetric water content (measured at a 0-7.5 cm depth using time domain reflectometry) response to spring and summer sand topdressing rate on
an annual bluegrass turf mowed at 3.2 mm in North Brunswick, NJ during 2009 and 2010.
2009 2010
Main effect 2 June 15 June 3 July 10 July 13 July 14 July 30 July 30 Aug.
Spring rate (SP)‡ -----------------------------------------------------m
3 m
-3-----------------------------------------------------
0 21.3 28.5 19.1 15.5 30.9 28.8 25.4 24.5
1.2 L m-2
20.8 28.0 18.3 15.2 30.0 28.9 24.5 23.5
2.4 L m-2
20.5 27.3 17.6 15.1 30.5 27.9 22.8 20.6
Summer rate (SU)§
0 20.7 28.3 17.3 15.6 30.3 28.3 25.3 22.8
0.075 L m-2
21.3 28.1 19.3 14.1 30.7 28.4 25.6 24.7
0.15 L m-2
20.8 28.0 17.7 15.6 30.9 29.0 23.5 22.5
0.3 L m-2
21.7 27.9 19.0 16.7 30.7 28.7 24.1 23.5
0.6 L m-2
19.8 27.3 18.3 14.3 29.7 28.2 22.8 21.0
Source of variation ANOVA
SP NS¶ 0.07† 0.06 NS NS NS ** ***
Linear NS NS * NS NS NS ** ***
Quadratic NS NS NS NS NS NS NS NS
SU NS NS 0.06 NS NS NS ** *
Linear NS NS NS NS NS NS ** *
Quadratic NS NS NS NS NS NS NS NS
Cubic NS NS NS 0.09 NS NS NS NS
Quartic NS NS * NS NS NS NS *
SP x SU NS NS NS NS NS NS NS NS
CV, % 10.3 7.7 10.2 18.0 7.5 8.1 10.2 10.5
*Significant at the 0.05 probability level.
**Significant at the 0.01 probability level.
***Significant at the 0.001 probability level.
†Probability level ≤ 0.1.
‡The total spring topdressing rate was applied as split applications on 20 April and 4 May 2009, and 14 April and 28 April 2010.
§Summer topdressing rate was applied every 14 days from 1 June to 24 August 2009, and 24 May to 17 August 2010.
¶NS, not significant
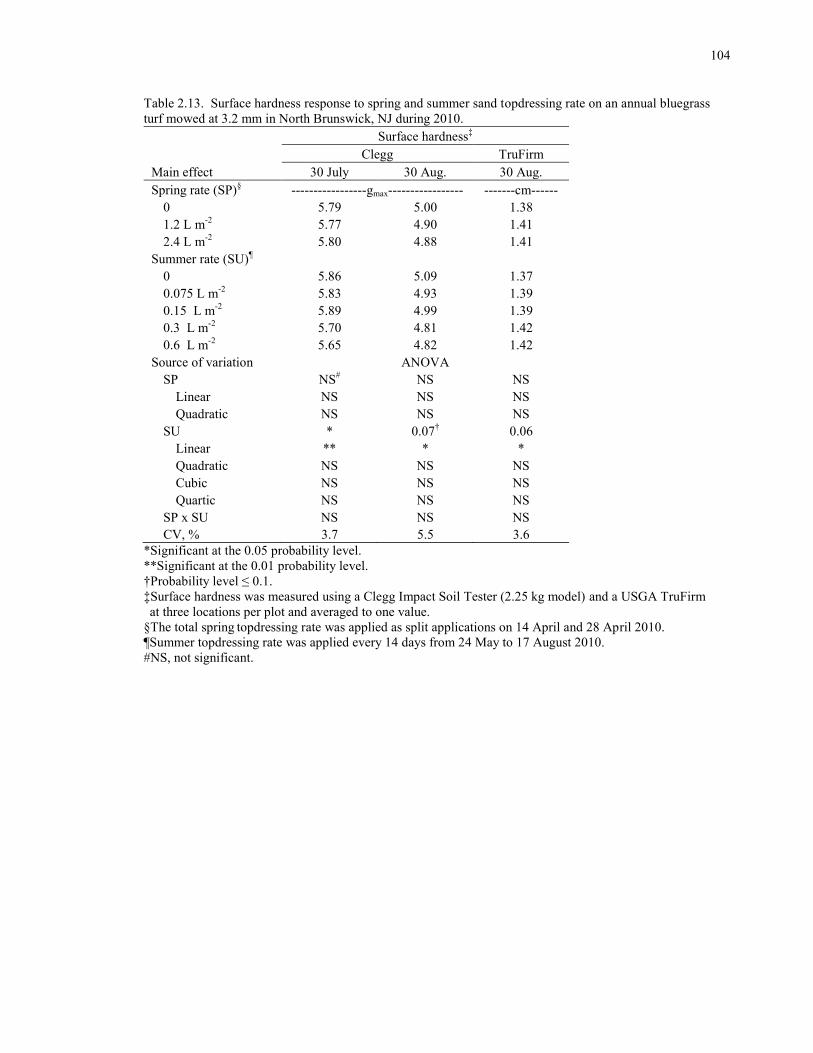
104
10
4
Table 2.13. Surface hardness response to spring and summer sand topdressing rate on an annual bluegrass
turf mowed at 3.2 mm in North Brunswick, NJ during 2010.
Surface hardness‡
Clegg TruFirm
Main effect 30 July 30 Aug. 30 Aug.
Spring rate (SP)§ -----------------gmax----------------- -------cm------
0 5.79 5.00 1.38
1.2 L m-2
5.77 4.90 1.41
2.4 L m-2
5.80 4.88 1.41
Summer rate (SU)¶
0 5.86 5.09 1.37
0.075 L m-2
5.83 4.93 1.39
0.15 L m-2
5.89 4.99 1.39
0.3 L m-2
5.70 4.81 1.42
0.6 L m-2
5.65 4.82 1.42
Source of variation ANOVA
SP NS# NS NS
Linear NS NS NS
Quadratic NS NS NS
SU * 0.07† 0.06
Linear ** * *
Quadratic NS NS NS
Cubic NS NS NS
Quartic NS NS NS
SP x SU NS NS NS
CV, % 3.7 5.5 3.6
*Significant at the 0.05 probability level.
**Significant at the 0.01 probability level.
†Probability level ≤ 0.1.
‡Surface hardness was measured using a Clegg Impact Soil Tester (2.25 kg model) and a USGA TruFirm
at three locations per plot and averaged to one value.
§The total spring topdressing rate was applied as split applications on 14 April and 28 April 2010.
¶Summer topdressing rate was applied every 14 days from 24 May to 17 August 2010.
#NS, not significant.
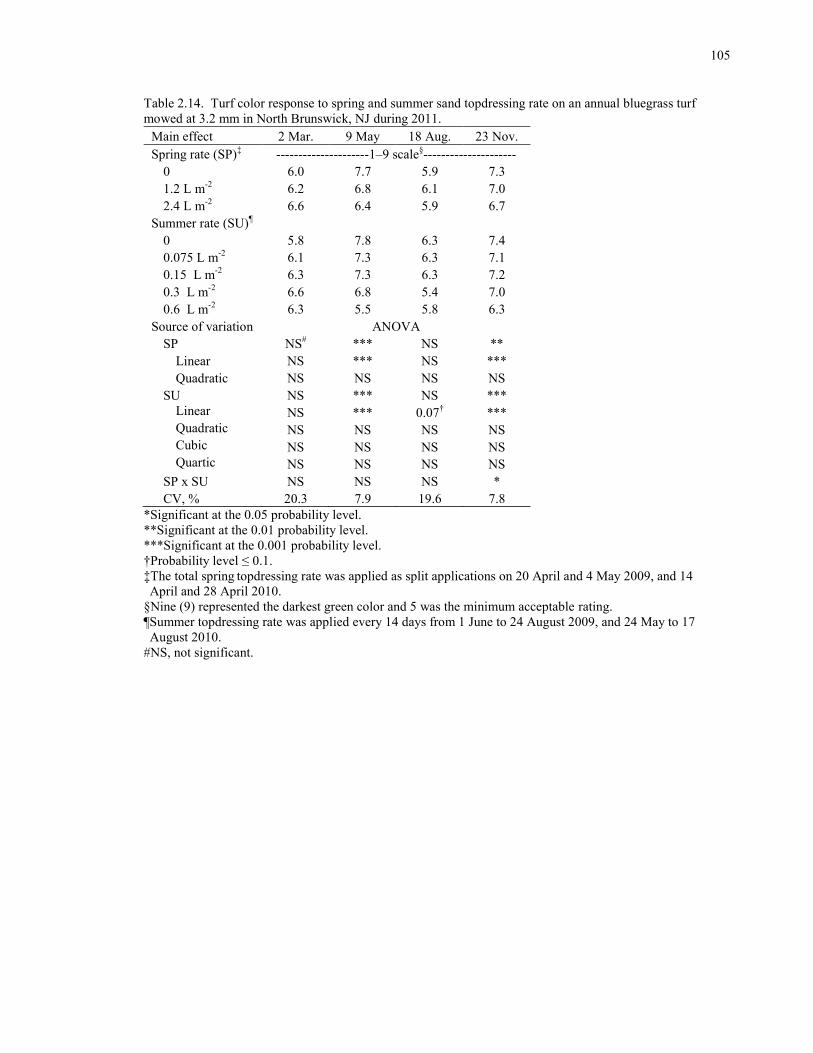
105
10
5
Table 2.14. Turf color response to spring and summer sand topdressing rate on an annual bluegrass turf
mowed at 3.2 mm in North Brunswick, NJ during 2011.
Main effect 2 Mar. 9 May 18 Aug. 23 Nov.
Spring rate (SP)‡ ---------------------1–9 scale
§---------------------
0 6.0 7.7 5.9 7.3
1.2 L m-2
6.2 6.8 6.1 7.0
2.4 L m-2
6.6 6.4 5.9 6.7
Summer rate (SU)¶
0 5.8 7.8 6.3 7.4
0.075 L m-2
6.1 7.3 6.3 7.1
0.15 L m-2
6.3 7.3 6.3 7.2
0.3 L m-2
6.6 6.8 5.4 7.0
0.6 L m-2
6.3 5.5 5.8 6.3
Source of variation ANOVA
SP NS# *** NS **
Linear NS *** NS ***
Quadratic NS NS NS NS
SU NS *** NS ***
Linear NS *** 0.07† ***
Quadratic NS NS NS NS
Cubic NS NS NS NS
Quartic NS NS NS NS
SP x SU NS NS NS *
CV, % 20.3 7.9 19.6 7.8
*Significant at the 0.05 probability level.
**Significant at the 0.01 probability level.
***Significant at the 0.001 probability level.
†Probability level ≤ 0.1.
‡The total spring topdressing rate was applied as split applications on 20 April and 4 May 2009, and 14
April and 28 April 2010.
§Nine (9) represented the darkest green color and 5 was the minimum acceptable rating.
¶Summer topdressing rate was applied every 14 days from 1 June to 24 August 2009, and 24 May to 17
August 2010.
#NS, not significant.
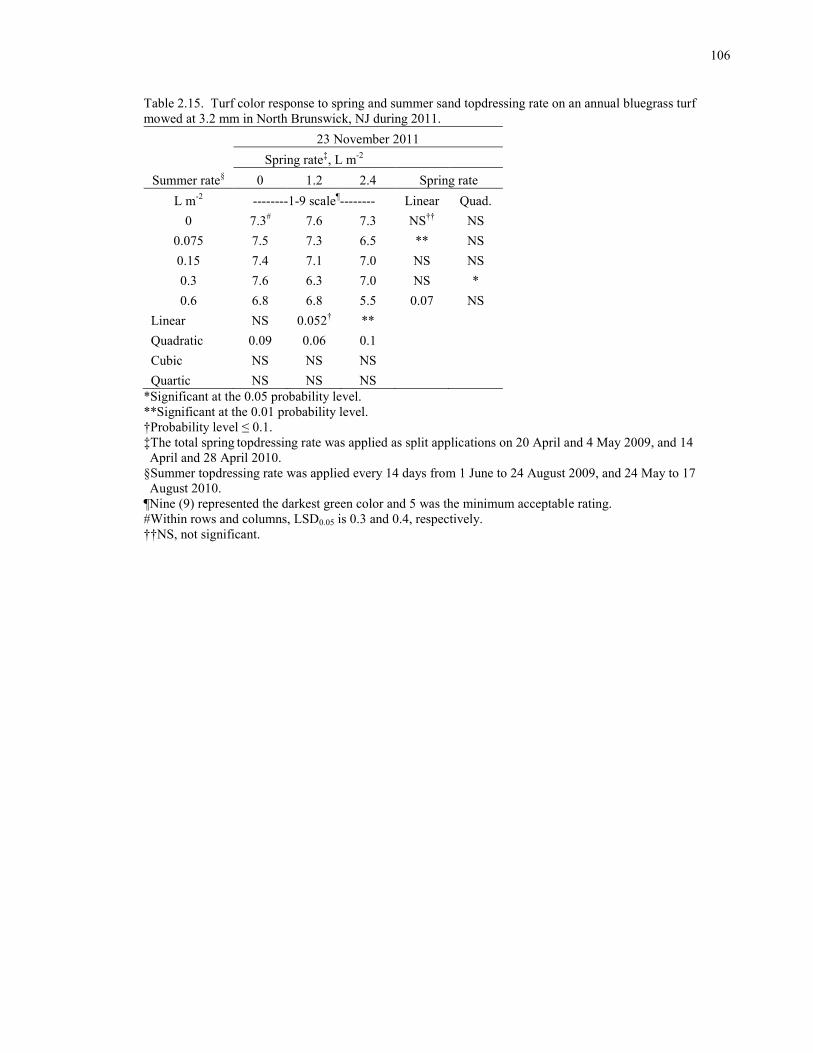
106
Table 2.15. Turf color response to spring and summer sand topdressing rate on an annual bluegrass turf
mowed at 3.2 mm in North Brunswick, NJ during 2011.
23 November 2011
Spring rate‡, L m
-2
Summer rate§ 0 1.2 2.4 Spring rate
L m-2
--------1-9 scale¶-------- Linear Quad.
0 7.3# 7.6 7.3 NS
†† NS
0.075 7.5 7.3 6.5 ** NS
0.15 7.4 7.1 7.0 NS NS
0.3 7.6 6.3 7.0 NS *
0.6 6.8 6.8 5.5 0.07 NS
Linear NS 0.052† **
Quadratic 0.09 0.06 0.1
Cubic NS NS NS
Quartic NS NS NS
*Significant at the 0.05 probability level.
**Significant at the 0.01 probability level.
†Probability level ≤ 0.1.
‡The total spring topdressing rate was applied as split applications on 20 April and 4 May 2009, and 14
April and 28 April 2010.
§Summer topdressing rate was applied every 14 days from 1 June to 24 August 2009, and 24 May to 17
August 2010.
¶Nine (9) represented the darkest green color and 5 was the minimum acceptable rating.
#Within rows and columns, LSD0.05 is 0.3 and 0.4, respectively.
††NS, not significant.
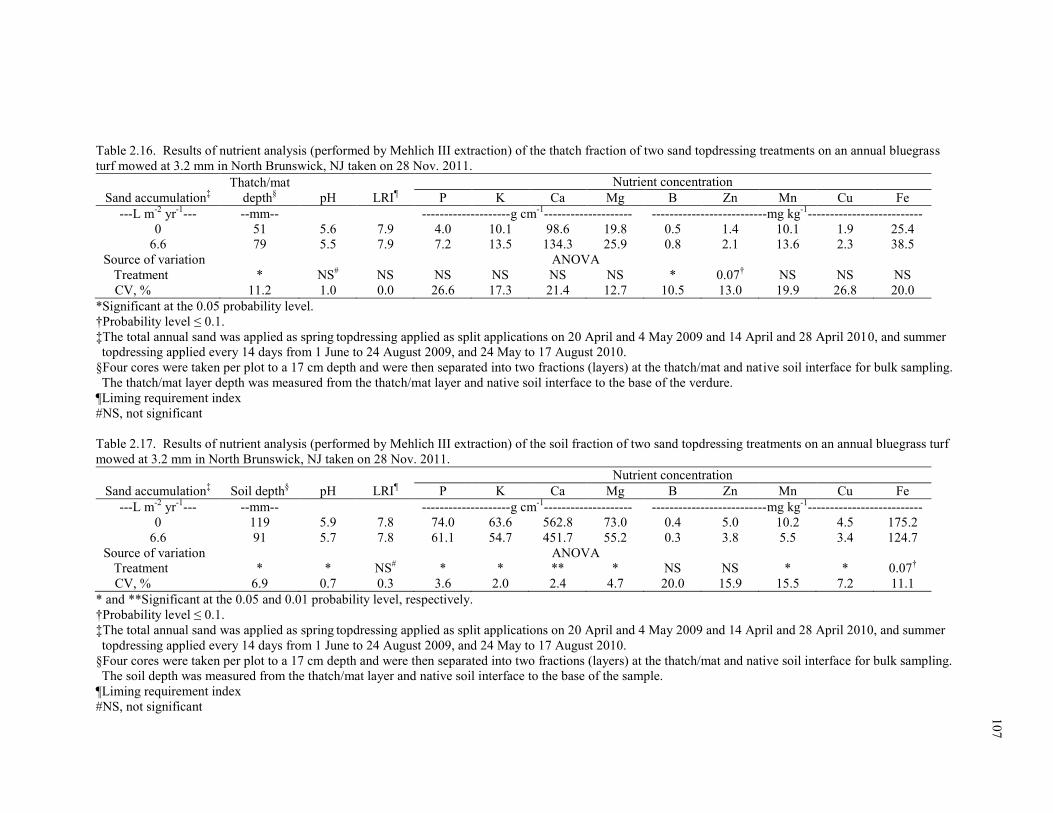
Table 2.16. Results of nutrient analysis (performed by Mehlich III extraction) of the thatch fraction of two sand topdressing treatments on an annual bluegrass
turf mowed at 3.2 mm in North Brunswick, NJ taken on 28 Nov. 2011.
Sand accumulation‡
Thatch/mat
depth§ pH LRI
¶
Nutrient concentration
P K Ca Mg B Zn Mn Cu Fe
---L m-2
yr-1
--- --mm-- --------------------g cm-1
-------------------- --------------------------mg kg-1
--------------------------
0 51 5.6 7.9 4.0 10.1 98.6 19.8 0.5 1.4 10.1 1.9 25.4
6.6 79 5.5 7.9 7.2 13.5 134.3 25.9 0.8 2.1 13.6 2.3 38.5
Source of variation ANOVA
Treatment * NS# NS NS NS NS NS * 0.07
† NS NS NS
CV, % 11.2 1.0 0.0 26.6 17.3 21.4 12.7 10.5 13.0 19.9 26.8 20.0
*Significant at the 0.05 probability level.
†Probability level ≤ 0.1.
‡The total annual sand was applied as spring topdressing applied as split applications on 20 April and 4 May 2009 and 14 April and 28 April 2010, and summer
topdressing applied every 14 days from 1 June to 24 August 2009, and 24 May to 17 August 2010.
§Four cores were taken per plot to a 17 cm depth and were then separated into two fractions (layers) at the thatch/mat and native soil interface for bulk sampling.
The thatch/mat layer depth was measured from the thatch/mat layer and native soil interface to the base of the verdure.
¶Liming requirement index
#NS, not significant
Table 2.17. Results of nutrient analysis (performed by Mehlich III extraction) of the soil fraction of two sand topdressing treatments on an annual bluegrass turf
mowed at 3.2 mm in North Brunswick, NJ taken on 28 Nov. 2011.
Sand accumulation‡ Soil depth
§ pH LRI
¶
Nutrient concentration
P K Ca Mg B Zn Mn Cu Fe
---L m-2
yr-1
--- --mm-- --------------------g cm-1
-------------------- --------------------------mg kg-1
--------------------------
0 119 5.9 7.8 74.0 63.6 562.8 73.0 0.4 5.0 10.2 4.5 175.2
6.6 91 5.7 7.8 61.1 54.7 451.7 55.2 0.3 3.8 5.5 3.4 124.7
Source of variation ANOVA
Treatment * * NS# * * ** * NS NS * * 0.07
†
CV, % 6.9 0.7 0.3 3.6 2.0 2.4 4.7 20.0 15.9 15.5 7.2 11.1
* and **Significant at the 0.05 and 0.01 probability level, respectively.
†Probability level ≤ 0.1.
‡The total annual sand was applied as spring topdressing applied as split applications on 20 April and 4 May 2009 and 14 April and 28 April 2010, and summer
topdressing applied every 14 days from 1 June to 24 August 2009, and 24 May to 17 August 2010.
§Four cores were taken per plot to a 17 cm depth and were then separated into two fractions (layers) at the thatch/mat and native soil interface for bulk sampling.
The soil depth was measured from the thatch/mat layer and native soil interface to the base of the sample.
¶Liming requirement index
#NS, not significant
10
7
108
CHAPTER 3. Anthracnose of Annual Bluegrass Affected by Sand Topdressing Rate
Applied During Disease Emergence
ABSTRACT
Sand topdressing on putting green turf is suspected of increasing the severity of
anthracnose disease, caused by the fungus Colletotrichum cereale Manns sensu lato
Crouch, Clarke, and Hillman, of annual bluegrass [Poa annua L. f. reptans (Hausskn) T.
Koyama] (ABG) turf. This field study was conducted to evaluate the effect of sand
topdressing applied at the onset of disease symptoms on anthracnose severity of ABG
turf. The turf was maintained at 3.2-mm on a Nixon sandy loam (fine-loamy, mixed,
mesic Typic Hapludaults) in North Brunswick, NJ. Summer topdressing rates of 0,
0.075, 0.15, 0.30 and 0.6 L m-2
were applied (28 July 2009 and 24 May 2010) once
disease severity had reached approximately 10% of the plot area infested with C. cereale
and biweekly topdressing continued through 24 Aug. 2009 and 19 July 2010. Treatments
were arranged in a RCBD with four replications. Sand topdressing at 0.15 and 0.3 L m-2
caused a 9 to 14% increase in disease severity 16 and 18 d after treatments were initiated
in 2009 and 2010, respectively. Estimated topdressing rates of 0.25 and 0.34 L m-2
caused the greatest increases in disease severity in 2009 and 2010, respectively. These
initial increases in disease severity were only apparent for 6- to 9-d and continued sand
topdressing reduced disease severity 13 to 20% by the end of the trial during 2009 and
2010, respectively. Increased topdressing rate produced a quadratic reduction in disease
severity by the end of the season in 2010, indicating that increasing topdressing rate
beyond 0.15 L m-2
produced little benefit in the form of disease reduction. Summer
topdressing applied at the onset of disease may cause relatively small, short-lived

109
increases in disease severity; however, continued sand topdressing can result in
reductions in anthracnose severity that outweigh any initial disease increases.
110
INTRODUCTION
Anthracnose, caused by the fungus Colletotrichum cereale Manns sensu lato
Crouch, Clarke, and Hillman (Crouch et al., 2006) is a problematic disease of annual
bluegrass [Poa annua L. forma reptans (Hausskn.) T. Koyama] (ABG) and creeping
bentgrass (Agrostis stolonifera L.) turf in many areas of United States and across the
world. The disease is particularly damaging to ABG putting greens during warm and
humid weather in the summer. Anthracnose severity has been reported to increase when
turf is weakened from stressful management practices used to improve playability of golf
turfs (Dernoeden, 2012).
Topdressing is the distribution of a thin layer of selected or prepared soil (often
sand on putting greens) to a turfgrass area (Beard, 1973; Cooper and Skogley, 1981).
The benefits of sand topdressing of putting greens include surface smoothing, thatch
prevention and modification, surface soil modification, and winter protection (Beard,
1973). Recent research has indicated that sand topdressing at 0.3 L m-2
every 7 to 14 d
during the summer can decrease anthracnose severity up to 47% on ABG turf maintained
at 3.2 mm (Inguagiato et al., 2012; Inguagiato et al., 2013; Roberts, 2009). This
reduction in disease severity produced by sand topdressing was attributed to the
development of a sand (mat) layer that buries crowns of the plants and provides
protection from abiotic and biotic stresses.
This previous research also reported that sand topdressing at these rates and
frequencies increased disease severity 4 to 14% when first applied to turf that had
received little to no previous sand topdressing during the growing season (Inguagiato et
al., 2012; Inguagiato et al., 2013; Roberts, 2009). This initial increase in disease was
111
observed early in the first year of these trials and was thought to have occurred due to
sand induced wounding of the crown before sufficient sand had accumulated to bury and
protect the crown in a mat layer (Inguagiato et al., 2013). In a greenhouse study, annual
bluegrass tillers inoculated with C. cereale developed disease symptoms when wounded
at the crown but not when wounded above the crown (Landschoot and Hoyland, 1995).
Inguagiato et al. (2012) speculated that topdressing programs which apply less
sand than is needed to bury and protect crowns may intensify disease symptoms when
one or more of the initial topdressings per season coincide with the early stages of disease
symptoms. Information is lacking on the impact of initiating a topdressing program when
disease symptoms first appear. Therefore, the objective of this study was to determine
the impact of biweekly sand topdressing on anthracnose disease severity when initiated
during the early stages of disease outbreaks.
112
MATERIALS AND METHODS
Experimental Design and Treatments
This field study was conducted on a putting green sward located at Horticultural
Farm No. 2, North Brunswick, NJ (40°28’ N, 74°25’ W), during 2009 and 2010. The soil
on this site is a modified Nixon sandy loam (fine-loamy, mixed, semiactive, mesic Typic
Hapludults, in some areas altered to fine-loamy, mixed, semiactive, mesic Ultic
Udarents). The turf was a seven-yr-old monostand of ABG that was established using
seed native to the site and ABG introduced from Plainfield Country Club, Plainfield, NJ
in 1998 (Inguagiato et al., 2009; Samaranayake et al., 2008). The site was previously
inoculated with C. cereale isolate HFIIA using 20,000 conidia mL-1
on 2 Aug. 2004
using the procedures described by Inguagiato et al. (2009) to ensure uniform distribution
of disease symptoms across the trial area, and subsequent outbreaks of the disease
occurred naturally.
The trial used a randomized complete block design with four replications. The
single factor studied was topdressing sand rate: 0, 0.075, 0.15, 0.3, and 0.6 L m-2
.
Topdressing treatments were initiated when disease severity had reached approximately
10% of the plot area infested with C. cereale (28 July 2009 and 24 May 2010). Biweekly
topdressing continued through 24 August 2009 (3 topdressings) and 19 July 2010 (5
topdressings). Plot size was 1.8 by 1.8 m.
The topdressing rates of 0.15, 0.3, and 0.6 L m-2
were applied with a drop
spreader (model SS-2, The Scotts Company, Marysville, OH) calibrated to uniformly
apply each volume over the plot in 4 passes. A shaker jar was used to apply the 0.075 L
m-2
topdressing rate. The topdressing material was kiln dried silica sand (subangular)
113
(“310” U.S. Silica, Co., Mauricetown, NJ) having a bulk density of 1.56 g cm-3
and a
particle distribution that met USGA recommendations (2004) (Table 3.1). Topdressing
was applied when the turf canopy was dry (between 1200 and 1700 h) and was
incorporated via soft-bristle brushing as described by Inguagiato et al. (2012). The entire
trial area received light hose-end irrigation after brushing.
Field Maintenance
Turf was mowed six times weekly between 0800 and 0930 h with a walking
greens mower (model 1000, Toro Co., Bloomington,, MN) bench set at 3.2 mm and
clippings were removed. Irrigation was applied to avoid wilt stress yet maintain
moderately-dry conditions and to water-in fertilizer. Nitrogen was applied before
treatments were initiated at 68.4 and 29.3 kg ha-1
from 7 Apr to 25 July 2009 and 21 Apr.
to 17 May 2010 to complete recovery from the previous year’s disease damage. During
the period that topdressing treatments were applied and disease evaluations were
performed, N was applied biweekly at 4.9 kg ha-1
totaling 9.8 and 29.3 kg ha-1
in 2009
and 2010, respectively. After disease progress was arrested, N was applied at 85 and 166
kg ha-1
from 7 Sept. to 6 Oct. 2009 and 17 Aug. to 11 Oct. 2010, respectively, to recover
turf from disease damage. Phosphorus and potassium were applied based on soil test
results at 30.3 and 143 kg ha-1
in 2009 and 26.9 and 45.2 kg ha-1
in 2010, respectively.
Dollar spot disease (caused by Sclerotnia homoeocarpa F.T. Bennett) was
controlled with biweekly applications of the fungicides boscalid {3-pyridinecarboximide,
2-chloro-N-[4’chloro(1,1’-biphenyl)yl]} at 0.38 kg a.i. ha-1
or vinclozolin [3-(3,5-
dichlorophenyl)-5-ethenyl-5-methyl-2,4-oxazolidinedione] at 1.52 kg a.i. ha-1
. The
diseases summer patch (caused by Magnaporthe poae Landschoot & Jackson) and brown

114
patch (caused by Rhizoctonia solani Kühn) were controlled using a rotation of the
fungicides azoxystrobin (Methyl(E)-2-{2-[6-(2-cyanophenoxy)pyrimidin-4-
yloxy]phenyl}-3-methoxyacrylate)} at 0.61 kg a.i. ha-1
, flutolanil {N-[3-(1-
methylethoxy)phenyl]-2-(trifluoromethyl)benzamide} at 6.41 kg a.i. ha-1
, and
fluoxastrobin [(1E)-[2-[[6-(2-Chlorophenoxy)-5-fluoro-4-pyrimidinyl]oxy]phenyl](5,6-
dihydro-1,4,2-dioxazin-3-yl) methanone-O-methyloxime] at 0.55 kg a.i. ha-1
applied
every 14 d. Algal growth was controlled with mancozeb (ethylenebisdithiocarbamate) on
5, 11 and 27 June 2010 at 24.4 kg a.i. ha-1
, and at 15, 20 and 28 July 2010 at 30.5, 20.1
and 28.7 kg a.i. ha-1
, respectively. These fungicides were found to have no effect on
anthracnose severity based on research conducted previously at this location (Towers et
al., 2003). Annual bluegrass inflorescence expression was suppressed with the growth
regulator ethephon [(2-chloroethyl)phosphonic acid] at a rate of 3.81 kg a.i. ha-1
on 25
March, 13 and 28 April 2009 and 19 March, 2 April, and 23 April 2010. Trinexapac-
ethyl [4-(cyclopropyl-α-hydroxy-methylene)-3,5-dioxocyclohexanecarboxylic acid
ethylester)] was applied at 0.05 kg a.i. ha-1
every 14 d from 25 March until 2 October
2009 and from 19 March until 2 October 2010 to regulate vegetative growth. The
insecticides chlorantraniliprole {3-Bromo-N-[4-chloro-2-methyl-6-
[(methylamino)carbonyl]phenyl]-1-(3-chloro-2-pyridinyl)-1H-pyrazole-5-carboxamide}
at 0.18 kg a.i. ha-1
and indoxacarb {(S)-methyl 7-chloro-2,5-dihydro-2-
[[(methoxycarbonyl)[4(trifluoromethoxy)phenyl]amino]-carbonyl]indeno[1,2-
e][1,3,4]oxadiazine-4a-(3H)-carboxylate} at 0.27 kg a.i. ha-1
were applied on 14 June
2009 and 30 April 2010, respectively, to control annual bluegrass weevils [Listronotus
maculicollis (Kirby)]. Creeping bentgrass was eliminated from the study area with
115
fluazifop-P-butyl {Butyl (R)-2-[4-[[5-(trifluoromethyl)-2-
pyridinyl]oxy]phenoxy]propanoate} at 0.21 kg a.i. ha-1
on 20 Sept. 2010. Anthracnose
disease progress was arrested on 3 Sept. 2009 and 17 Aug. 2010 using chlorothalonil
(tetrachloroisophthalonitrile) at 12.9 and 14.7 kg a.i. ha-1
, respectively.
Data Collection and Analysis
Anthracnose disease severity was evaluated on 9 dates from July to Sept. 2009
and on 10 dates from May to Aug. 2010 as the percent turf area infested with C. cereale
using a line-intercept grid count method that generated 273 observations per plot
(Inguagiato et al., 2008). Percent turf area infested with C. cereale was calculated using
the equation:
(n/273) x 100;
where n represented the count of intersects that overlaid ABG turf infested with
C. cereale. Area under the disease progress curve (AUDPC) values were calculated
using the equation:
1n
1i
i1i1ii
i
tt2
yyAUDPC
where “ti” is time in days, “i” is the order index for the ratings (and “ni” is the
number of ratings), “y” is the percent turf area infested at rating (Madden et al., 2007).
Turfgrass quality was rated visually every 7 to 14 d using a 1 to 9 scale (9 represented the
best quality and 5 was the minimally acceptable rating). Turf density, uniformity, algae,
topdressing sand incorporation and disease severity were all considered when turf quality
was evaluated.
Analysis of variance was performed by partitioning treatment effects into
orthogonal comparisons using CONRAST statements within the General Linear Model
116
procedure of the Statistical Analysis System (SAS) software v. 9.3 (SAS Institute, Cary,
NC). Trend comparison analysis was performed for topdressing rate effects by
partitioning topdressing rate sums of squares for disease severity and turf quality into
linear, quadratic and lack of fit components by orthogonal polynomial contrasts (Steel et
al., 1997; Yourstone, 1991). When the polynomial orthogonal contrasts were significant,
appropriate regression equations were fitted to the topdressing rate response data.
Orthogonal polynomial coefficients were computed by the ORPOL function using the
IML procedure in SAS. Treatment effects were considered significant if p ≤ 0.05.
117
11
7
RESULTS AND DISCUSSION
Anthracnose Severity
Initial symptoms of anthracnose basal rot developed as a natural infestation in
early July 2009. Disease severity was relatively low, no more than 18%, throughout July
and early August due to unfavorable environmental conditions for anthracnose
development (rain and mild temperatures). Disease severity increased during mid-
August and maximum disease severity (40%) was reached on 28 Aug. 2009, after which
disease severity declined to 31% on 3 Sept. due to cooler temperatures and lower
humidity (Table 3.2). Anthracnose symptoms developed earlier in 2010 and disease
severity was moderate (22 to 32%) by 28 May (Table 3.3). Disease severity progressed
slowly through June to early-July 2010 and increased to peak levels (41 to 61%) in mid-
August.
There were no significant differences in AUDPC among any treatments in 2009
or 2010 because treatment effects during early- and late-season were opposite and offset
each other when integrating over time (Tables 3.2 and 3.3).
Similar to results from previous work (Inguagiato et al., 2012; Inguagiato et al.,
2013; Roberts, 2009), sand topdressing caused a slight increase in disease compared to
nontopressed turf on one rating date during 2009. Increased topdressing rate produced a
quadratic increase in disease severity on 13 Aug. 2009, after two topdressing applications
(Table 3.2). Maximum disease severity occurred at a sand rate of 0.25 L m-2
as estimated
from the quadratic polynomial equation. However, the quadratic response also indicated
that disease severity was reduced to a level lower than the non-topdressed control when
topdressing rate was increased to 0.6 L m-2
on 13 Aug. As reported in other trials, this
118
initial increase in disease observed on 13 Aug. was short-lived and continued sand
topdressing reduced disease severity linearly by the end of the first year of the trial on 3
Sept. 2009 (Inguagiato et al., 2012; Inguagiato et al., 2013; Roberts, 2009). Quadratic
and lack-of-fit effects were also significant on 3 Sept. due to the 0.15 L m-2
rate
producing a greater disease reduction than the 0.3 L m-2
rate.
Anthracnose severity response to topdressing rate in 2010 was similar to 2009;
increased topdressing rate produced a quadratic increase in disease severity on 11 June
2010 after two topdressing applications, and maximum disease severity occurred at an
estimated rate of 0.34 L m-2
(Table 3.3). Increased topdressing rate produced a quadratic
reduction in anthracnose severity on 28 July and 11 Aug. 2010, and minimum disease
severity occurred at estimated rates of 0.4 and 0.41 L m-2
, respectively.
Previously, increases in disease severity caused by sand topdressing have only
been reported during the first year of a trial (Inguagiato et al., 2012; Inguagiato et al.,
2013; Roberts, 2009). As mentioned before, Inguagiato et al. (2013) attributed these
initial increases in disease observed in under-topdressed turf to the wounding of
unprotected crowns based on Landschoot and Hoyland’s (1995) reports that only
wounding of the crown, not leaves, increased anthracnose. The cumulative sand amounts
needed to reduce disease severity in first year of previous topdressing trials were within
the range of 2.4 to 4.8 L m-2
(Inguagiato et al., 2012). In those trials, crowns of plants in
topdressed plots were already buried and protected within a mat layer before topdressing
was initiated in the second year. Cumulative sand totals ranged from 0.23 to 1.8 L m-2
after the first year of the current trial. Therefore, crowns in topdressed plots were
119
probably not thoroughly surrounded and protected by sand within the mat layer and, thus,
were subject to wounding from sand topdressing applications during the second year.
Although mechanical stress is typically expected to increase anthracnose severity
(Smiley et al., 2005), species in the Colletotrichum genus do not require wounds or
existing openings to penetrate their host (Bruehl and Dickson, 1950; Smith, 1954; Venard
and Vaillancourt, 2007). Some studies have shown that infection by C. graminicola was
enhanced from indirect penetration through wounds (Venard and Vaillancourt, 2007;
Bergstrom and Nicholson, 1999). However, Crouch and Beirn (2009) suggested that
practices that incite injury must be evaluated individually as wounding does not always
facilitate infection from Colletotrichum spp. Recent research has shown that wounding
caused by verticutting (3 mm depth every 14 d) had little effect on disease severity
(Inguagiato et al., 2008), and foot traffic (equivalent to 200 rounds d-1
) caused substantial
reductions in disease severity (Roberts et al., 2013). Data from the current trial indicate
that crown wounding caused by applying sand to previously nontopdressed turf during
the emergence of disease symptoms slightly increased disease severity. However, these
increases were brief and not any greater than the increases observed in previous trials.
Moreover, continued sand topdressing reduced disease severity by the end of each
season, similar to other trials. These results suggest that practitioners may initiate a
biweekly sand topdressing program on ABG putting green turf during the early stages of
disease development to achieve disease reductions that will outweigh any brief increases
in disease severity that may result from initial topdressing applications.
120
Turf Quality
Turf quality was acceptable (≥5) for all treatments throughout 2009 (Table 3.4)
and until early-July 2010 (Table 3.5) under low or moderate levels of disease severity
(Tables 3.2 and 3.3). Any treatment differences on the first three rating dates in 2009
were considered random effects because treatments were not initiated until 28 July 2009
(Table 3.4).
Increased topdressing rate produced a linear reduction in turf quality on 1 and 7
Aug 2009 (Table 3.4). Turf quality did not respond to topdressing rate on any other date
in 2009. This linear reduction could be due to random effects; however, although not
significant, disease severity means of turf treated with the 0.3 and 0.6 L m-2
rates were
slightly higher than the control on 1 Aug. 2009 (6 and 1%, respectively) and 7 Aug. 2009
(2 and 1%, respectively) (Table 3.2).
Increased topdressing rate improved turf quality linearly on 21 June 2010 (Table
3.5). Topdressing rate did not affect turf quality again until 11 Aug., when the response
to increased topdressing rate was quadratic. The best turf quality occurred at an
estimated rate of 0.41 L m-2
. The quadratic responses in turf quality and disease severity
on 11 Aug 2010 were similar, and there was little improvement to turf quality or disease
reduction when topdressing rate was increased beyond 0.15 L m-2
on 11 Aug 2010
(Tables 3.3 and 3.5).
121
CONCLUSIONS
Sand topdressing at rates of 0.15 and 0.3 L m-2
applied during the early stages of
disease outbreaks caused small, short-lived increases in disease severity. However,
continued biweekly sand topdressing applications caused reductions in disease severity
by the end of each trial-year that were greater than any increase in disease severity
observed soon after treatments were initiated. These data suggest that initiating a
biweekly sand topdressing program when disease symptoms are present can be a
beneficial tool for anthracnose disease reduction, despite transient increases in disease
severity which may be observed shortly after the initiation of the program.
122
12
2
REFERENCES
Beard, J.B. 1973. Turfgrass: Science and culture. Prentice Hall, Englewood Cliffs, NJ.
Bergstrom, G.C., and R.L. Nicholson. 1999. The biology of corn anthracnose: knowledge
to exploit for improved management. Plant Dis. 83(7):596-608.
Bruehl, G.W., and J.G. Dickson. 1950. Anthracnose of cereals and grasses. USDA Tech.
Bull. 1005:1-37.
Cooper, R.J., and C.R. Skogley. 1981. An evaluation of several topdressing programs for
Agrostis palustris Huds. and Agrostis canina L. putting green turf. Proc. Int. Turf.
Res. Conf 4:129-136.
Crouch, J.A., and L.A. Beirn. 2009. Anthracnose of cereals and grasses. Fungal Diversity
39:19.
Crouch, J.A., B.B. Clarke, and B.I. Hillman. 2006. Unraveling Evolutionary
Relationships Among the Divergent Lineages of Colletotrichum Causing
Anthracnose Disease in Turfgrass and Corn. Phytopathology 96(1):46-60. DOI:
10.1094/PHYTO-96-0046.
Dernoeden, P.H. 2012. Creeping bentgrass management. CRC Press.
Green Section Staff. 2004. USGA recommendations for a method of putting green
construction. U.S. Golf Assoc. Green Section Construction Educ. Progr., Waco,
TX.
Inguagiato, J.C., J.A. Murphy, and B.B. Clarke. 2008. Anthracnose Severity on Annual
Bluegrass Influenced by Nitrogen Fertilization, Growth Regulators, and
Verticutting. Crop Sci. 48(4):1595-1607. DOI: 10.2135/cropsci2007.06.0343.
Inguagiato, J.C., J.A. Murphy, and B.B. Clarke. 2009. Anthracnose Disease and Annual
Bluegrass Putting Green Performance Affected by Mowing Practices and
Lightweight Rolling. Crop Sci. 49(4):1454-1462. DOI:
10.2135/cropsci2008.07.0435.
123
Inguagiato, J.C., J.A. Murphy, and B.B. Clarke. 2012. Sand Topdressing Rate and
Interval Effects on Anthracnose Severity of an Annual Bluegrass Putting Green.
Crop Sci. 52(3):1406-1415. DOI: 10.2135/cropsci2011.01.0010.
Inguagiato, J.C., J.A. Murphy, B.B. Clarke, and J.A. Roberts. 2013. Topdressing sand
particle shape and incorporation effects on anthracnose severity of an annual
bluegrass putting green. Int. Turfgrass Res. Soc. J. 12:(accepted).
Landschoot, P., and B. Hoyland. 1995. Shedding some light on anthracnose basal rot.
Golf Course Manage 11:52-55.
Madden, L.V., G. Hughes, and F. Van den Bosch. 2007. The Study of Plant Disease
Epidemics. The American Phytopathological Society, APS Press, St. Paul, MN.
Roberts, J.A. 2009. Impact of cultural management on anthracnose severity of annual
bluegrass putting green turf. M.S. Thesis: Rutgers Univ.
Samaranayake, H., T.J. Lawson, and J.A. Murphy. 2008. Traffic Stress Effects on
Bentgrass Putting Green and Fairway Turf. Crop Sci. 48(3):1193-1202. DOI:
10.2135/cropsci2006.09.0613.
Smiley, R.W., P.H. Dernoeden, and B.B. Clarke. 2005. Compendium of turfgrass
diseases. APS press, St. Paul, MN.
Smith, J.D. 1954. A disease of Poa annua. J. Sports Turf Res. Inst. 8:344-353.
Steel, G.D., J.H. Torrie, and D.A. Dickey. 1997. Procedures and principles of statistics: A
biometrical approach, McGraw-Hill, New York, NY.
Towers, G., K. Green, E. Weibel, P. Majumdar, and B.B. Clarke. 2003. Evaluation of
fungicides for the control of anthracnose basal rot on annual bluegrass. Fungicide
and Nematicide Tests 58:T017.
Venard, C., and L. Vaillancourt. 2007. Penetration and colonization of unwounded maize
tissues by the maize anthracnose pathogen Colletotrichum graminicola and the
related nonpathogen C. sublineolum. Mycologia 99(3):368-377.

124
Yourstone, K.S. 1991. Partitioning Variance and Comparing Treatment Means with
Contrast and Estimate. Proc. of the Northeast SAS User Group Conf. 4:288-293.

125
Table 3.1. Particle size distribution of sand used for topdressing in 2009 and 2010.
Sieve size opening
2 mm 1 mm 500 μm 250 μm 149 μm 105 μm 53 μm Pan
-------------------------------------------- % retained (by weight) --------------------------------------------
0 <0.1 31.3 65.1 3.3 0.2 <0.1 <0.1
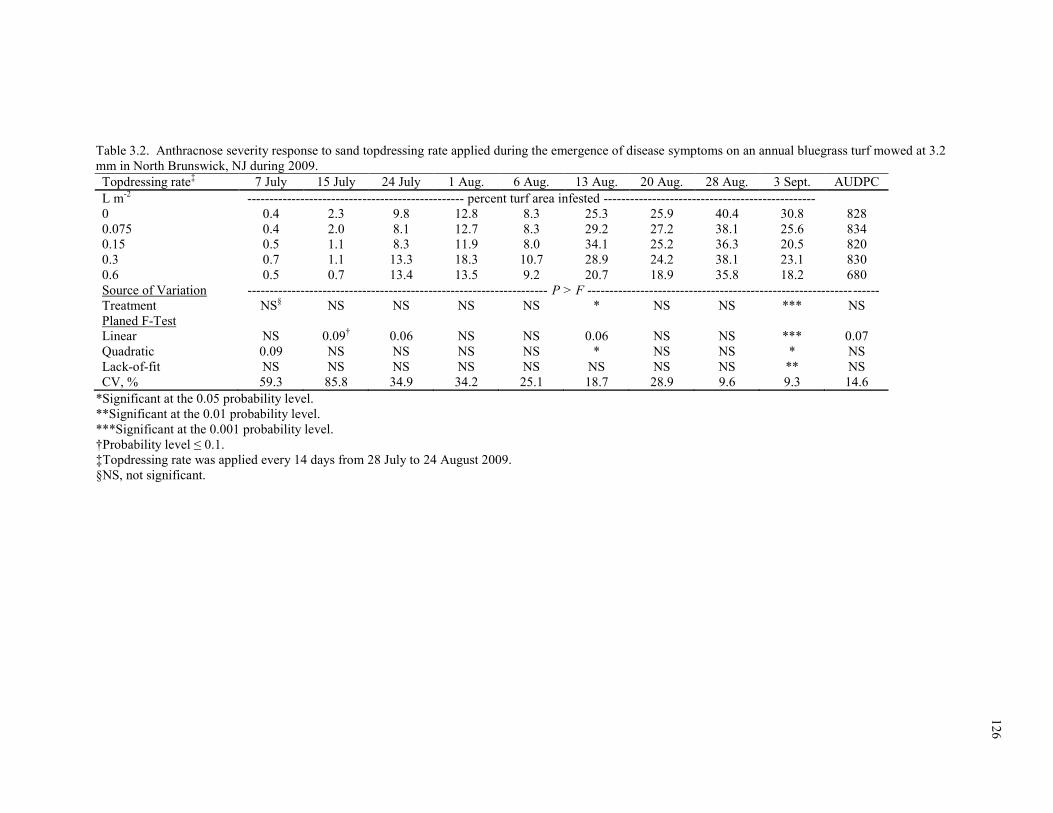
12
6
Table 3.2. Anthracnose severity response to sand topdressing rate applied during the emergence of disease symptoms on an annual bluegrass turf mowed at 3.2
mm in North Brunswick, NJ during 2009.
Topdressing rate‡ 7 July 15 July 24 July 1 Aug. 6 Aug. 13 Aug. 20 Aug. 28 Aug. 3 Sept. AUDPC
L m-2
------------------------------------------------- percent turf area infested ------------------------------------------------
0 0.4 2.3 9.8 12.8 8.3 25.3 25.9 40.4 30.8 828
0.075 0.4 2.0 8.1 12.7 8.3 29.2 27.2 38.1 25.6 834
0.15 0.5 1.1 8.3 11.9 8.0 34.1 25.2 36.3 20.5 820
0.3 0.7 1.1 13.3 18.3 10.7 28.9 24.2 38.1 23.1 830
0.6 0.5 0.7 13.4 13.5 9.2 20.7 18.9 35.8 18.2 680
Source of Variation -------------------------------------------------------------------- P > F ------------------------------------------------------------------
Treatment NS§ NS NS NS NS * NS NS *** NS
Planed F-Test
Linear NS 0.09† 0.06 NS NS 0.06 NS NS *** 0.07
Quadratic 0.09 NS NS NS NS * NS NS * NS
Lack-of-fit NS NS NS NS NS NS NS NS ** NS
CV, % 59.3 85.8 34.9 34.2 25.1 18.7 28.9 9.6 9.3 14.6
*Significant at the 0.05 probability level.
**Significant at the 0.01 probability level.
***Significant at the 0.001 probability level.
†Probability level ≤ 0.1.
‡Topdressing rate was applied every 14 days from 28 July to 24 August 2009.
§NS, not significant.

12
7
Table 3.3. Anthracnose severity response to sand topdressing rate applied during the emergence of disease symptoms on an annual bluegrass turf mowed at 3.2
mm in North Brunswick, NJ during 2010.
Topdressing rate‡ 19 May 28 May 4 June 11 June 21 June 28 June 7 July 15 July 28 July 11 Aug. AUDPC
L m-2
--------------------------------------------------- percent turf area infested -------------------------------------------------
0 12.2 24.8 23.9 16.3 21.7 29.0 35.1 30.5 41.4 60.7 2412
0.075 15.1 31.9 27.7 26.6 27.4 35.0 42.9 30.6 40.0 53.8 2647
0.15 9.0 22.4 21.6 22.6 24.8 30.9 34.0 28.8 30.8 41.8 2180
0.3 13.2 28.9 24.1 30.4 28.8 34.3 37.1 28.7 31.4 41.0 2375
0.6 11.6 25.0 27.8 22.5 30.3 38.6 38.2 30.7 32.0 41.1 2406
Source of Variation --------------------------------------------------------------------- P > F --------------------------------------------------------------------
Treatment NS§ NS NS 0.06
† NS NS NS NS * *** NS
Planed F-Test
Linear NS NS NS NS 0.07 0.09 NS NS * *** NS
Quadratic NS NS NS * NS NS NS NS * ** NS
Lack-of-fit NS NS NS NS NS NS 0.08 NS NS NS NS
CV, % 38.8 32.7 22.9 25.0 21.1 20.1 14.6 13.1 13.0 12.0 14.0
*Significant at the 0.05 probability level.
**Significant at the 0.01 probability level.
***Significant at the 0.001 probability level.
†Probability level ≤ 0.1.
‡Topdressing rate was applied every 14 days from 24 May 2010 to 19 July 2010.
§NS, not significant
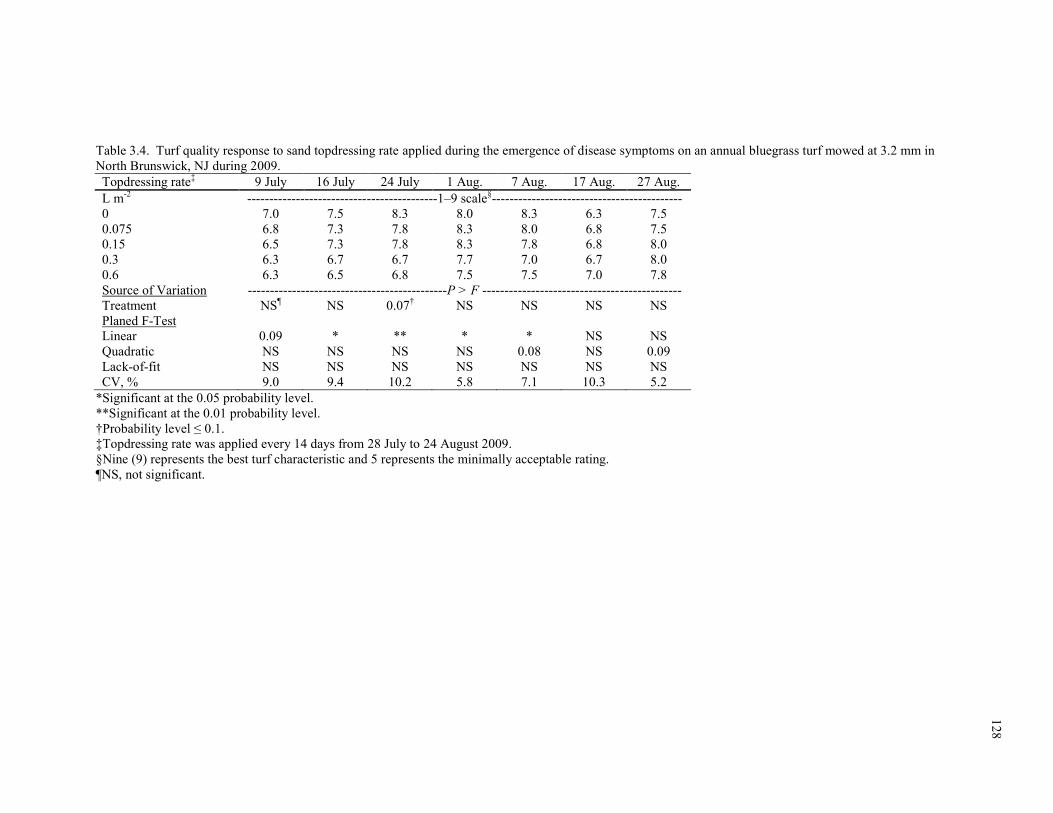
12
8
Table 3.4. Turf quality response to sand topdressing rate applied during the emergence of disease symptoms on an annual bluegrass turf mowed at 3.2 mm in
North Brunswick, NJ during 2009.
Topdressing rate‡ 9 July 16 July 24 July 1 Aug. 7 Aug. 17 Aug. 27 Aug.
L m-2
-------------------------------------------1–9 scale§-------------------------------------------
0 7.0 7.5 8.3 8.0 8.3 6.3 7.5
0.075 6.8 7.3 7.8 8.3 8.0 6.8 7.5
0.15 6.5 7.3 7.8 8.3 7.8 6.8 8.0
0.3 6.3 6.7 6.7 7.7 7.0 6.7 8.0
0.6 6.3 6.5 6.8 7.5 7.5 7.0 7.8
Source of Variation ---------------------------------------------P > F ---------------------------------------------
Treatment NS¶ NS 0.07
† NS NS NS NS
Planed F-Test
Linear 0.09 * ** * * NS NS
Quadratic NS NS NS NS 0.08 NS 0.09
Lack-of-fit NS NS NS NS NS NS NS
CV, % 9.0 9.4 10.2 5.8 7.1 10.3 5.2
*Significant at the 0.05 probability level.
**Significant at the 0.01 probability level.
†Probability level ≤ 0.1.
‡Topdressing rate was applied every 14 days from 28 July to 24 August 2009.
§Nine (9) represents the best turf characteristic and 5 represents the minimally acceptable rating.
¶NS, not significant.
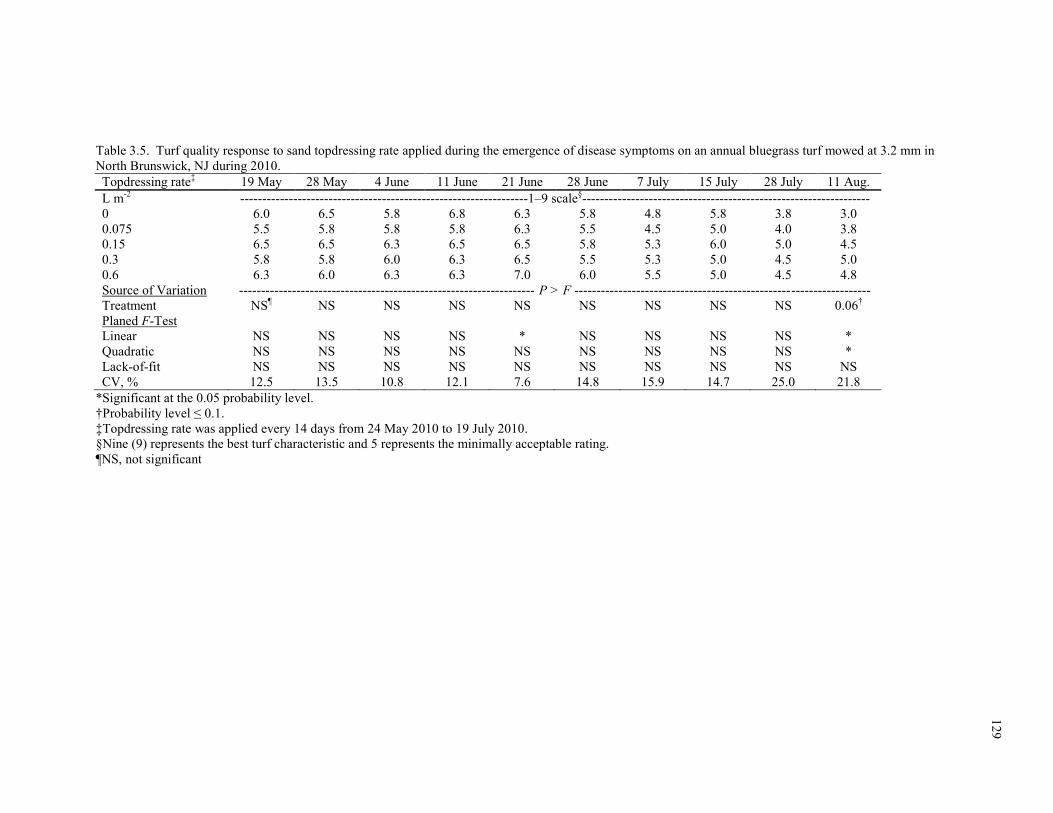
12
9
Table 3.5. Turf quality response to sand topdressing rate applied during the emergence of disease symptoms on an annual bluegrass turf mowed at 3.2 mm in
North Brunswick, NJ during 2010.
Topdressing rate‡ 19 May 28 May 4 June 11 June 21 June 28 June 7 July 15 July 28 July 11 Aug.
L m-2
-----------------------------------------------------------------1–9 scale§-----------------------------------------------------------------
0 6.0 6.5 5.8 6.8 6.3 5.8 4.8 5.8 3.8 3.0
0.075 5.5 5.8 5.8 5.8 6.3 5.5 4.5 5.0 4.0 3.8
0.15 6.5 6.5 6.3 6.5 6.5 5.8 5.3 6.0 5.0 4.5
0.3 5.8 5.8 6.0 6.3 6.5 5.5 5.3 5.0 4.5 5.0
0.6 6.3 6.0 6.3 6.3 7.0 6.0 5.5 5.0 4.5 4.8
Source of Variation ------------------------------------------------------------------- P > F -------------------------------------------------------------------
Treatment NS¶ NS NS NS NS NS NS NS NS 0.06
†
Planed F-Test
Linear NS NS NS NS * NS NS NS NS *
Quadratic NS NS NS NS NS NS NS NS NS *
Lack-of-fit NS NS NS NS NS NS NS NS NS NS
CV, % 12.5 13.5 10.8 12.1 7.6 14.8 15.9 14.7 25.0 21.8
*Significant at the 0.05 probability level.
†Probability level ≤ 0.1.
‡Topdressing rate was applied every 14 days from 24 May 2010 to 19 July 2010.
§Nine (9) represents the best turf characteristic and 5 represents the minimally acceptable rating.
¶NS, not significant

130
CHAPTER 4. Effects of Midseason Cultivation Practices on Anthracnose of Annual
Bluegrass Putting Green Turf
ABSTRACT
Annual bluegrass [Poa annua L. forma reptans (Hausskn.) T. Koyama] (ABG)
putting greens are particularly susceptible to the disease anthracnose, caused by the
fungus Colletotrichum cereale Manns sensu lato Crouch, Clarke, and Hillman.
Mechanical injury from cultivation practices has been reputed to enhance ABG
susceptibility to anthracnose via wounding, particularly if cultivation is conducted when
symptoms are present. The effect of midseason cultivation applied at the onset of disease
symptoms on anthracnose severity was studied on ABG turf maintained at 3.2-mm on a
Nixon sandy loam in North Brunswick, NJ. Treatments of no cultivation, grooming,
verticutting, solid-tining, scarifying and weekly grooming were arranged in a RCBD with
four replications in 2009. Treatments were initiated (24 July 2009 and 2 June 2010)
when 11 to 20% of the trial area was infested with C. cereale and were applied every 21-
d thereafter, except for weekly grooming which was applied every 7-d. The experimental
design was modified to a strip-plot design in 2010; cultivation plots were horizontally
stripped with a second factor of fungicide control (treated or untreated). Without
fungicide applications, verticutting increased disease severity 4 to 18% on 54% of rating
dates and scarifying increased disease 2 to 10% on 31% of rating dates during the
treatments periods of 2009 and 2010. Solid-tining was the only treatment to increase
disease severity (5%) on turf under fungicide control in 2010. Grooming reduced disease
relative to the control during both trial-years, especially when applied weekly under
fungicide control. Surprisingly, all cultivation practices reduced disease severity relative

131
to the control before the treatment period began again in 2010; however, verticutting,
scarifying and solid-tining increased disease by the end of the 2010 season in the absence
of fungicide. Midseason cultivation does not appear to greatly enhance the risk of
anthracnose on ABG turf under a fungicide program commonly used to control the
disease.
132
13
2
INTRODUCTION
Anthracnose, incited by the fungus Colletotrichum cereale Manns sensu lato
Crouch, Clarke, and Hillman, is a destructive disease of annual bluegrass [Poa annua L.
forma reptans (Hausskn.) T. Koyama] (ABG) and creeping bentgrass (Agrostis
stolonifera L.) putting greens (Crouch et al., 2006). Annual bluegrass is particularly
susceptible to anthracnose, possibly due to the weak perennial nature of the species and
its susceptibility to environmental stress (Murphy et al., 2008; Smiley et al., 2005).
Severe anthracnose outbreaks emerged during the early-1990s in North America and
have continued to appear ubiquitously throughout temperate climates across the world
(Crouch et al., 2006; Landschoot and Hoyland, 1995; Mann and Newell, 2005). Infection
by C. cereale can often result in death of ABG and, ultimately, severe loss of turf (Smiley
et al., 2005). Chemical control options have become increasingly limited due to the
emergence of resistant strains of C. cereale to several fungicide chemistries (Avila-
Adame et al., 2003; Crouch et al., 2005; Wong et al., 2008; Wong and Midland, 2007;
Wong et al., 2007; Young et al., 2010a; Young et al., 2010b). Thus, recent research has
focused on the effects, positive or negative, of cultural management practices on
anthracnose severity of ABG.
Management practices that enhance playability (ball roll distance) for golfers but
reduce plant vigor have been suspected to increase anthracnose severity (Vermeulen,
2003; Zontek, 2004). Research has proven that low mowing heights, low nitrogen
fertility, and limited irrigation increase damage of ABG from anthracnose (Inguagiato et
al., 2008; Inguagiato et al., 2009; Roberts et al., 2011). Cultivation practices have also
been suspected to increase anthracnose severity because wounding and increased plant

133
stress are believed to increase ABG susceptibility to anthracnose (Landschoot and
Hoyland, 1995; Smiley et al., 2005). However research is limited regarding the effects of
mechanical wounding caused by mid-season cultivation practices such as vertical cutting
(VC) and solid-tining on anthracnose of ABG.
Turf cultivation is a general term that describes mechanical practices that modify
the turf and/or root zone without destroying the sward (Bidwell, 1952; Dawson, 1934;
Dawson and Ferro, 1939; Engel and Alderfer, 1967). Cultivation decreases soil
compaction and, thus, enhances growing conditions in the surface root zone by improving
soil gas exchange, wetting and drying, water infiltration, root growth, and response to
fertilizers (Christians, 2011; Turgeon, 2011). Coring is a common and effective method
of cultivation that uses hollow tines to remove soil cores and create vertical channels in
the surface root zone that are typically back-filled with sand or sandy soil (Beard, 1973;
Christians, 2011; Hartwiger and O’Brien, 2001; Murphy and Rieke, 1994). Coring is
often performed during spring and/or autumn but rarely during midseason because it can
create an uneven playing surface that can take many days to return to normal (Christians,
2011).
Alternatively, solid-tining and VC are cultivation practices that are often used
during midseason because they are less disruptive to play and have reduced equipment
and labor costs compared to coring (McCarty et al., 2007; Murphy et al., 1993). Solid-
tine cultivation penetrates the soil and creates channels without removing soil or turf
(Murphy et al., 1993). Benefits of solid-tining include increased shoot density and
reduced soil compaction, which can increase saturated hydraulic conductivity and soil

134
porosity and, thus, indirectly reduce soil electric conductivity as well (Carrow, 1996;
Carrow, 2003; Green et al., 2001; Murphy et al., 1993).
Vertical cutting (VC) removes thatch, controls turf grain, a condition where grass
blades lay in a single direction and affect ball roll, and reduces canopy biomass by slicing
into a turf surface with mechanical devices equipped with vertically rotating blades
(Beard and Beard, 2005). Depending on the objective, VC machines may have different
blade spacings (5 to 40 mm) and thicknesses (1 to 3 mm) set to varying depths (0 to 40
mm) (Landreth et al., 2008; Lockyer, 2009; Moore, 2005). Shallow VC, or grooming,
smoothes putting surfaces by reducing puffiness caused by the high shoot density of
ABG (Vargas and Turgeon, 2004). Grooming equipment usually has thin blades (≤ 1
mm), close blade spacing (5 to 19 mm), and a shallow cutting depth (0.4 to 0.8 mm
below the effective height of cut) (Beard, 2002). Moderate VC, hereinafter referred to as
verticutting, cuts deeper into the canopy than grooming and affects mostly leaf and sheath
tissue but sometimes affects crowns (Turgeon, 2011). Verticutting improves smoothness
of a putting surface but provides greater thatch removal than grooming due to its
increased depth. Blades on verticutting equipment may be thicker (≤ 2 mm) and spaced
wider apart (13 to 19 mm) than blades on grooming equipment (Beard, 2002). Deep VC,
or scarifying, removes large amounts of thatch, readies surfaces for
renovation/overseeding and reduces compaction of the surface soil (Beard, 2002;
Turgeon, 2011). Scarifying blades can be as thick as 3 mm, are spaced up to 40 mm
apart and operated to depths up to 40 mm (Beard, 2002; Landreth et al., 2008).
Scarifying is rarely performed during midseason because of the extensive amount of time
135
required for turf to recover from the disruption caused by this practice (Landreth et al.,
2008; Lockyer, 2009).
Putting greens with excessive thatch and poor soil conditions are more susceptible
to disease (Beard, 1973; Smiley et al., 2005); therefore, cultivation can be an important
part of disease management programs (Smiley et al., 2005). Clarke et al. (1995) reported
that both deep and shallow coring reduced summer patch (caused by Magnaporthe poae
Landschoot & Jackson) on an ABG fairway. Spring dead spot (caused by
Ophiosphaerella herpotricha (Fr.:Fr.) J. Walker) on bermudagrass [Cynodon dactylon
(L.) Pers. X C. transvaalensis Burtt-Davy] maintained at a 13 mm mowing height was
moderately reduced by hollow-tine aerating and VC twice per year (Tisserat and Fry,
1997). Vertical cutting reduced dollar spot (caused by Sclerotinia homoeocarpa F.T.
Bennett) severity on Kentucky bluegrass (Poa pratensis L.) (Halisky et al., 1981). Dollar
spot was also reduced by coring a bentgrass putting green (Moeller, 2008) during spring
and late-summer; however, Stier and Hollman (2003) reported that coring once (October)
or four times annually (May, July, September, October) had no effect on dollar spot
incidence in creeping bentgrass or ABG putting green turf. Carrow et al. (1987) reported
that VC and coring may have weakened bermudagrass turf maintained as a homelawn
and caused dollar spot to be more severe. Unruh et al. (2005) also reported that VC
increased dollar spot severity on bermudagrass putting green turf.
Cultivation during midseason has been suggested to improve summer stress
tolerance of ABG (Green et al., 2001). Additionally, thatch removal from midseason
cultivation may reduce disease because primary inoculum for infection by pathogens
such as C. cereale is produced on overwintered residues in thatch (Couch, 1973).
136
However, observational reports from the field have associated cultivation with enhanced
anthracnose severity (Landschoot and Hoyland, 1995; Raisch, 2003), presumably by
facilitating invasion of C. cereale through wounds (Smiley et al., 2005). Thus, many turf
managers avoid the use of cultivation practices when anthracnose is active (Landschoot
and Hoyland, 1995; Smiley et al., 2005). Research regarding the effect of midseason
cultivation on anthracnose is limited and results have been conflicting. Increasing
verticutting depth up to 5.1 mm increased anthracnose severity linearly on a mixed stand
of creeping bentgrass and ABG putting green turf in a trial conducted by Uddin et al.
(2008); whereas, Inguagiato et al. (2008) reported found that VC to a 3 mm depth on an
ABG putting green had little effect on anthracnose. Wounding (puncture or abrasion) of
ABG crown tissue prior to inoculation with C. cereale resulted in more rapid disease
development in a greenhouse trial compared to wounding of leaf tissue or no wounding
(Landschoot and Hoyland, 1995). Therefore, Inguagiato et al. (2008) suggested that deep
VC (e.g., scarifying) of crown tissue may increase disease severity; whereas, shallow VC
(e.g., grooming) of only leaf tissue may not affect anthracnose severity. Research is
needed to test how these unique VC practices and other midseason cultivation practices
such as solid-tining affect anthracnose. Therefore, a trial was initiated in 2009 on ABG
putting green turf to evaluate the influence of grooming, verticutting, scarifying and
solid-tining on anthracnose severity when applied at the onset of disease symptoms.
137
13
7
MATERIALS AND METHODS
Experimental Design and Treatments
This field study was conducted on a seven-yr-old monostand of ABG turf grown
on a Nixon sandy loam (fine-loamy, mixed, semiactive, mesic Typic Hapludults, in some
areas altered to fine-loamy, mixed, semiactive, mesic Ultic Udarents) capped with a 50 to
60 mm deep sand topdressing layer at Horticultural Farm No. 2, North Brunswick, NJ
(40°28’ N, 74°25’ W). The sward was established in 2002 from seed indigenous to the
location as well as from soil cores introduced from Plainfield Country Club, Plainfield,
NJ in 1998 (Inguagiato et al., 2009; Samaranayake et al., 2008). The study location was
inoculated with a spore suspension (20,000 conidia mL-1
) of C. cereale isolate HFIIA on
2 Aug. 2004 (Inguagiato et al., 2009). Subsequent anthracnose outbreaks, including
those during the current trial, occurred naturally.
Cultivation technique was the single factor evaluated during 2009. Treatments
included no cultivation, grooming (1.3 mm depth, 1.5 mm blade width, 5 mm lateral
blade spacing), verticutting (3.8 mm depth, 1.5 mm blade width, 10 mm lateral blade
spacing), scarifying (7.6 mm depth, 1.5 mm blade width, 40 mm lateral blade spacing),
solid-tining (57.2 mm depth, 6.3 mm tine width, 38.1 by 38.1 mm tine spacing), and
weekly grooming. Grooming, verticutting and scarifying were applied using a triplex
mower (model 3150, Toro Co., Bloomington, MN) equipped with specialized reel-chassis
(model TA3TORO Thatch-Away Supa-System, Turfline Inc., Moscow Mills, MO) with
cassette-inserts designed for each practice (models TA3CAS GROTORO, TA3CAS
VERTORO, TA3CAS SCATORO, respectively, Turfline Inc., Moscow Mills, MO).
Solid-tining was performed using a walking aerator (model ProCore 648, Toro Co.,
138
Bloomington, MN). All cultivation treatments were applied between 1300 and 1600 hr
when turf was dry. Treatments were applied every 21 d from 24 July to 14 Aug. 2009 (2
applications) and from 2 June to 19 July 2010 (3 applications), except for weekly
grooming which was applied every 7 d from 24 July to 28 Aug. 2009 (5 total
applications) and from 2 June to 11 Aug. 2010 (10 total applications). Disease severity
was 11% and 20% of the trial area infested with C. cereale when treatments were
initiated in 2009 and 2010, respectively. The trial area was rolled with a sidewinder
roller (Tournament X-Press Greens Roller, SmithCo, Wayne, PA) to smooth the surface
after cultivation treatments were applied. No sand topdressing was applied during
treatments periods.
Treatments were arranged in a randomized complete block design with four
replications and plots dimensions were 1.5 by 3.7 m during 2009. Fungicide control was
included as a second factor in the same study location during 2010 to examine the effect
of cultivation treatments under reduced disease severity. A strip-plot design was used to
incorporate the fungicide control factor by dividing blocks (9.1 by 3.7 m) of the
vertically-aligned cultivation treatments (1.5 by 3.7 m) into two horizontal-strip plots (9.1
by 1.8 m) of fungicide treatments (treated or untreated). Fungicide treated plots received
curative applications of chlorothalonil (tetrachloroisophthalonitrile) and fosetyl-Al
[Aluminum tris (O-ethyl phosphonate)] at the rates of 12.6 and 9.8 kg ha-1
, respectively,
as a tank mix on 3 and 11 June and then every 14 d thereafter until 4 Aug. 2010.
Fungicides were applied using a gas-powered backpack sprayer (Model SHR-210, ECHO
Incorporated, Lake Zurich, IL) operated at 379 kPa of pressure to produce a water carrier
volume of 815 L ha-1
. The sprayer boom (The Broyhill CO, Dakota City, NE) was

139
equipped with 5 flat fan spray nozzles (Model XR8003, Tee Jet Technologies, Carol
Stream, IL) affixed to constant flow valves (Model CFValve G11-16SY, GATE LLC.,
Sebastian, FL) that were spaced 25.4 cm apart.
Field Maintenance
Mowing was performed 6 times wk-1
between 0800 and 0930 h with a walking
greens mower (model 1000, Toro Co., Bloomington, MN) bench set at a 3.2 mm height
of cut and clippings were removed. Moderately-dry conditions were maintained by
irrigating to avoid wilt stress and water-in fertilizer. Before treatments were initiated, N
was applied at 63.5 and 34.2 kg ha-1
from 7 Apr to 12 July 2009 and 21 Apr. to 27 May
2010 to complete recovery from disease damage from the previous year. When
cultivation treatments were being performed, N was applied every 14 d at 4.9 kg ha-1
totaling 14.7 and 29.3 kg ha-1
from 25 July to 23 Aug. 2009 and 11 June to 4 Aug. 2010,
respectively. After treatments were curtailed and disease progress was arrested with
fungicides, N was applied at 84.9 and 166 kg ha-1
from 7 Sept. to 6 Oct. 2009 and 17
Aug. to 11 Oct. 2010, respectively, to encourage recovery from disease damage.
Phosphorus and K were applied based on soil test results during the spring or autumn at
30.3 and 143 kg ha-1
in 2009 and 26.9 and 45.2 kg ha-1
in 2010, respectively.
Anthracnose epidemics were stopped at the conclusion of each trial year using the
fungicide chlorothalonil applied at 12.9 and 14.7 kg a.i. ha-1
on 3 Sept. 2009 and 17 Aug.
2010, respectively.
The plant growth regulator ethephon [(2-chloroethyl)phosphonic acid] was
applied at a rate of 3.81 kg a.i. ha-1
on 25 March, 13 and 28 April 2009 and 19 March, 2
April, and 23 April 2010 to suppress ABG inflorescence expression. Vegetative growth

140
was controlled with biweekly applications of the plant growth regulator trinexapac-ethyl
[4-(cyclopropyl-α-hydroxy-methylene)-3,5-dioxocyclohexanecarboxylic acid ethylester)]
at 0.05 kg a.i. ha-1
from 25 March until 2 October 2009 and from 19 March until 2
October 2010. Annual bluegrass weevils [Listronotus maculicollis (Kirby)] were
controlled with the insecticides chlorantraniliprole {3-Bromo-N-[4-chloro-2-methyl-6-
[(methylamino)carbonyl]phenyl]-1-(3-chloro-2-pyridinyl)-1H-pyrazole-5-carboxamide}
applied at 0.18 kg a.i. ha-1
and indoxacarb {(S)-methyl 7-chloro-2,5-dihydro-2-
[[(methoxycarbonyl)[4(trifluoromethoxy)phenyl]amino]-carbonyl]indeno[1,2-
e][1,3,4]oxadiazine-4a-(3H)-carboxylate} applied at 0.27 kg a.i. ha-1
on 14 June 2009 and
30 April 2010, respectively. Encroachment of creeping bentgrass was suppressed with
fluazifop-P-butyl {Butyl (R)-2-[4-[[5-(trifluoromethyl)-2-
pyridinyl]oxy]phenoxy]propanoate} applied at 0.21 kg a.i. ha-1
on 20 Sept. 2010.
A preventative program using fungicides that have been shown to not affect
anthracnose isolates from this research location was used to selectively control unwanted
diseases from 30 May to 19 Aug. 2009 and from 14 May to 14 Aug. 2010 (Towers et al.,
2003). Dollar spot disease was controlled with biweekly applications of the fungicides
boscalid {3-pyridinecarboximide, 2-chloro-N-[4’chloro(1,1’-biphenyl)yl]} at 0.38 kg a.i.
ha-1
or vinclozolin [3-(3,5-dichlorophenyl)-5-ethenyl-5-methyl-2,4-oxazolidinedione] at
1.52 kg a.i. ha-1
. Summer patch and brown patch (caused by Rhizoctonia solani Kühn)
were controlled using a biweekly rotation of the fungicides azoxystrobin (Methyl(E)-2-
{2-[6-(2-cyanophenoxy)pyrimidin-4-yloxy]phenyl}-3-methoxyacrylate)} at 0.61 kg a.i.
ha-1
, flutolanil {N-[3-(1-methylethoxy)phenyl]-2-(trifluoromethyl)benzamide} at 6.41 kg
a.i. ha-1
, and fluoxastrobin [(1E)-[2-[[6-(2-Chlorophenoxy)-5-fluoro-4-

141
pyrimidinyl]oxy]phenyl](5,6-dihydro-1,4,2-dioxazin-3-yl) methanone-O-methyloxime] at
0.55 kg a.i. ha-1
Algal growth was controlled as needed with mancozeb
(ethylenebisdithiocarbamate) applied at rates ranging from 20.1 to 30.5 kg a.i. ha-1
only
during 2010.
Data Collection and Analysis
Anthracnose disease severity was assessed on 11 dates from 12 June to 3 Sept.
2009 and on 9 dates from 19 May to 13 Aug. 2010 as the percent turf area infested with
C. cereale using a line-intercept grid count method modified from Inguagiato et al.
(2008) that generated 546 observations per plot for 12 June to 3 Sept. 2009 and 19 and 28
May 2010 and 273 observations per plot for 7 June to 13 Aug. 2010. Percent turf area
infested was calculated using the equations:
(n/546) x 100, and (n/273) x 100;
where n represented the count of intersects that overlaid ABG turf infested with
C. cereale. Area under the disease progress curve (AUDPC) values were calculated
using the equation:
1n
1i
i1i1ii
i
tt2
yyAUDPC
where “ti” is time in days, “i” is the order index for the ratings (and “ni” is the
number of ratings), and “y” is the percent turf area infested at rating (Madden et al.,
2007). Turfgrass quality was rated visually using a 1 to 9 scale (9 represented the best
quality and 6 was the minimally acceptable rating) on 7 dates from 9 July to 27 Aug.
2009 and on 9 dates from 19 May to 13 Aug. 2010. Turf density, uniformity, algae,
disease severity, and surface disruption caused by cultivation were considered when turf
quality was evaluated. Data were subjected to ANOVA using the General Linear Model

142
procedure (PROC GLM) in the Statistical Analysis System software v. 9.3 (SAS
Institute, Cary, NC). Means were separated using Fisher’s protected least significant
difference (p ≤ 0.05) using the appropriate error terms and formulae described by Gomez
and Gomez (1984).
143
14
3
RESULTS
Anthracnose Severity
Anthracnose basal rot was slow to develop from June to mid-July 2009 and
gradually increased during late-July and August to a maximum severity (17 to 27%) on 3
Sept. 2009 (Table 4.1 and Fig. 4.1). Any treatment differences from 12 June to 24 July
2009 were considered random effects; cultivation treatments were not initiated until after
disease assessments were made on 24 July. Anthracnose symptoms developed earlier
during 2010 and disease severity reached 14 to 26% by 28 May 2010 (Table 4.2).
Anthracnose severity did not increase greatly during June (Tables 4.3, 4.4 and 4.5);
however, dramatic increases occurred during July and August and maximum disease
severity ranged from 33 to 69% by 13 Aug. 2010 (Table 4.4).
The area under the disease progress curve (AUDPC) was much smaller in 2009
compared to 2010 due to the late onset of anthracnose and the lower maximum disease
severity during 2009 (Tables 4.1, 4.3 and 4.4). Verticutting increased and weekly
grooming decreased AUDPC compared to uncultivated turf during 2009. Midseason
cultivation interacted with fungicide control to affect AUDPC during 2010 (Table 4.3);
no cultivation treatment was different than the control under either level of fungicide, but
fungicide application reduced AUDPC in verticutting plots (Table 4.4).
When disease was analyzed for each observation date, the pooled effects of
cultivation increased disease severity 1 to 2% compared to no cultivation on 3 of 6 rating
dates during the treatment period of 1 Aug. to 3 Sept. 2009 (Table 4.1). However,
verticutting and scarifying were the only two treatments to increase disease severity
compared to the uncultivated control during 2009 (Table 4.1 and Fig. 4.1). Verticutting
144
increased anthracnose disease 6% relative to the control on 6 Aug. 2009. Verticutting
and scarifying increased disease severity compared to no cultivation on 23 Aug. (4 and
2%, respectively) and 31 Aug. (6 and 2%, respectively) 2009. Verticutting was the only
cultivation treatment to increase disease severity (9%) relative to the control on 3 Sept.
2009.
A residual effect of cultivation treatments applied in 2009 appeared during spring
2010, as evidenced by the pooled effects of cultivation reducing disease severity
compared to the uncultivated control on 19 and 28 May 2010 (Table 4.2). All cultivation
treatments reduced disease severity by 4 to 5% on 19 May. Verticutting, scarifying and
weekly grooming reduced disease 8 to 11% relative to the control on 28 May 2010.
Curative fungicide applications reduced disease severity on 3 of 7 rating dates
during cultivation treatments in 2010 (Table 4.3). Fungicide-treated plots had 5% less
disease than plots that received no fungicide on 7 June 2010. Similarly, fungicides
reduced disease severity by 8 and 17% compared to the untreated control on 28 July and
13 Aug. 2010, respectively.
Cultivation affected disease severity on 5 of 7 rating dates during the treatment
period in 2010 and interacted with the fungicide factor on 4 of those dates (Table 4.3).
There was a fungicide by cultivation interaction on 7 June 2010; the pooled effects of
cultivation significantly reduced disease 5% compared to no cultivation under no
fungicide but this response was nonsignificant under fungicide control (Table 4.4). The
individual treatments of grooming, verticutting and weekly grooming reduced disease
severity 4, 11 and 9% relative to the control, respectively, under no fungicide on 7 June.
In fungicide-treated plots, grooming was the only treatment that reduced disease (5%)
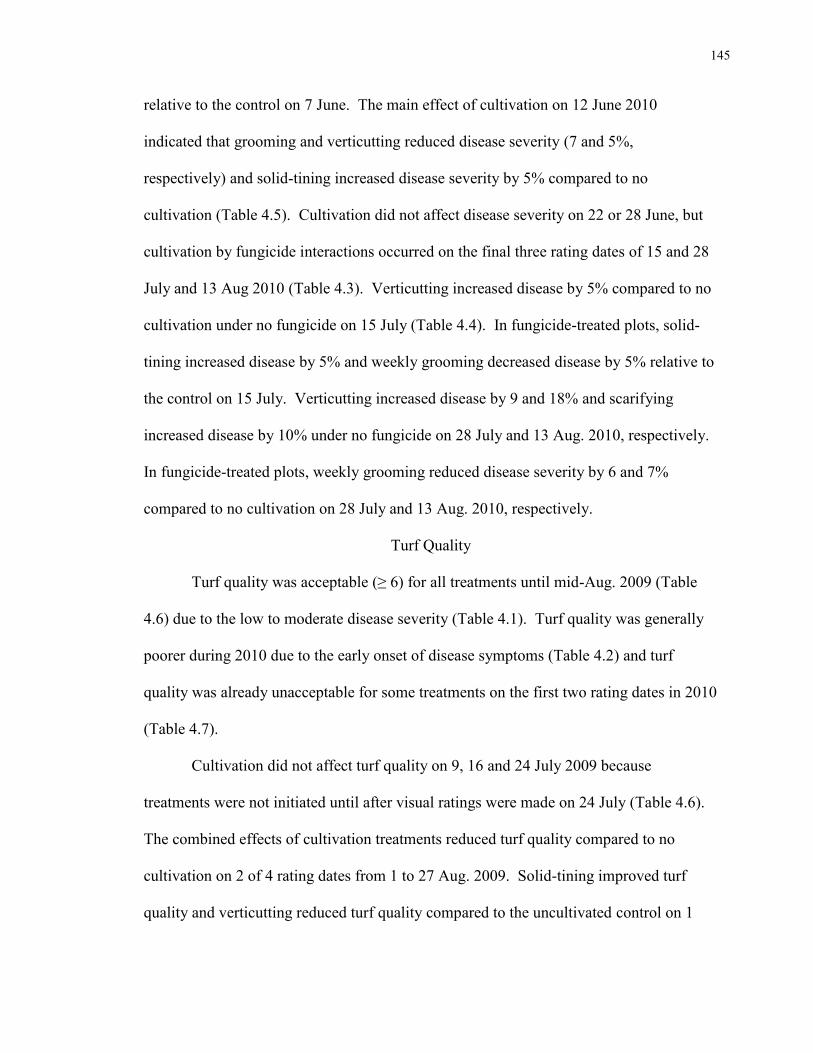
145
relative to the control on 7 June. The main effect of cultivation on 12 June 2010
indicated that grooming and verticutting reduced disease severity (7 and 5%,
respectively) and solid-tining increased disease severity by 5% compared to no
cultivation (Table 4.5). Cultivation did not affect disease severity on 22 or 28 June, but
cultivation by fungicide interactions occurred on the final three rating dates of 15 and 28
July and 13 Aug 2010 (Table 4.3). Verticutting increased disease by 5% compared to no
cultivation under no fungicide on 15 July (Table 4.4). In fungicide-treated plots, solid-
tining increased disease by 5% and weekly grooming decreased disease by 5% relative to
the control on 15 July. Verticutting increased disease by 9 and 18% and scarifying
increased disease by 10% under no fungicide on 28 July and 13 Aug. 2010, respectively.
In fungicide-treated plots, weekly grooming reduced disease severity by 6 and 7%
compared to no cultivation on 28 July and 13 Aug. 2010, respectively.
Turf Quality
Turf quality was acceptable (≥ 6) for all treatments until mid-Aug. 2009 (Table
4.6) due to the low to moderate disease severity (Table 4.1). Turf quality was generally
poorer during 2010 due to the early onset of disease symptoms (Table 4.2) and turf
quality was already unacceptable for some treatments on the first two rating dates in 2010
(Table 4.7).
Cultivation did not affect turf quality on 9, 16 and 24 July 2009 because
treatments were not initiated until after visual ratings were made on 24 July (Table 4.6).
The combined effects of cultivation treatments reduced turf quality compared to no
cultivation on 2 of 4 rating dates from 1 to 27 Aug. 2009. Solid-tining improved turf
quality and verticutting reduced turf quality compared to the uncultivated control on 1
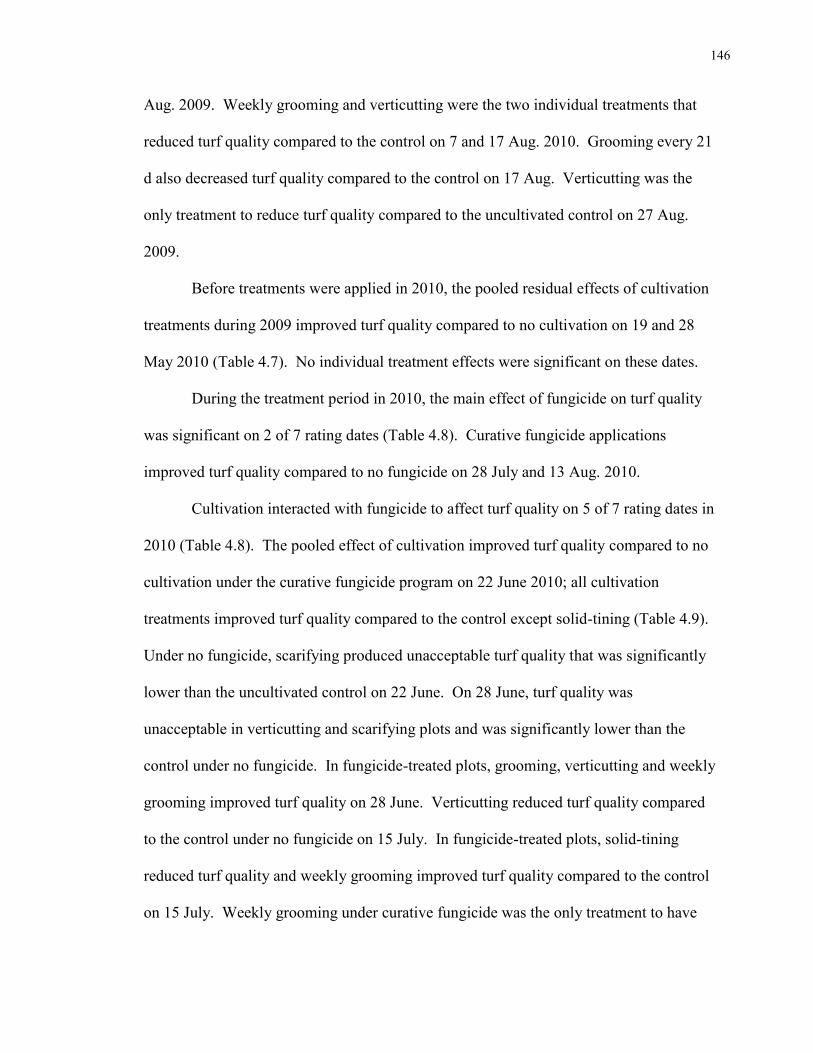
146
Aug. 2009. Weekly grooming and verticutting were the two individual treatments that
reduced turf quality compared to the control on 7 and 17 Aug. 2010. Grooming every 21
d also decreased turf quality compared to the control on 17 Aug. Verticutting was the
only treatment to reduce turf quality compared to the uncultivated control on 27 Aug.
2009.
Before treatments were applied in 2010, the pooled residual effects of cultivation
treatments during 2009 improved turf quality compared to no cultivation on 19 and 28
May 2010 (Table 4.7). No individual treatment effects were significant on these dates.
During the treatment period in 2010, the main effect of fungicide on turf quality
was significant on 2 of 7 rating dates (Table 4.8). Curative fungicide applications
improved turf quality compared to no fungicide on 28 July and 13 Aug. 2010.
Cultivation interacted with fungicide to affect turf quality on 5 of 7 rating dates in
2010 (Table 4.8). The pooled effect of cultivation improved turf quality compared to no
cultivation under the curative fungicide program on 22 June 2010; all cultivation
treatments improved turf quality compared to the control except solid-tining (Table 4.9).
Under no fungicide, scarifying produced unacceptable turf quality that was significantly
lower than the uncultivated control on 22 June. On 28 June, turf quality was
unacceptable in verticutting and scarifying plots and was significantly lower than the
control under no fungicide. In fungicide-treated plots, grooming, verticutting and weekly
grooming improved turf quality on 28 June. Verticutting reduced turf quality compared
to the control under no fungicide on 15 July. In fungicide-treated plots, solid-tining
reduced turf quality and weekly grooming improved turf quality compared to the control
on 15 July. Weekly grooming under curative fungicide was the only treatment to have

147
acceptable turf quality on 15 July and no treatment had acceptable turf quality by 28 July.
Verticutting and scarifying decreased turf quality compared to the control under no
fungicide and, similar to previous rating dates, weekly grooming improved turf quality
compared to no cultivation in fungicide-treated plots on 28 July and 13 Aug. 2010.

148
14
8
DISCUSSION
Results from this trial indicated that midseason cultivation influenced anthracnose
disease severity when applied at the onset of disease symptoms; however, the effect
depended on the type of cultivation applied. Verticutting, scarifying and solid-tining
were the only cultivation practices to increase anthracnose severity. Verticutting to a 3.8
mm depth primarily injured ABG leaf and sheath tissue, as evidenced by visual
observation of these tissues in the mower bucket after treatments were applied. However,
this treatment also injured crown tissue since the verticutting equipment was set to cut 0.6
mm deeper than the 3.2 mm mowing height. Previous greenhouse work indicated that
wounding crowns of ABG tillers prior to inoculation with C. cereale enhanced
anthracnose severity (Landschoot and Hoyland, 1995). Verticutting to a depth of 5.1
mm, which likely injured crowns, increased anthracnose severity relative verticutting to a
depth of 3.3 mm (Uddin et al., 2008). Moreover, our verticutting equipment had a blade
width and blade spacing that affected 15% of the turf surface and caused extensive
defoliation. Low mowing has been associated with enhanced outbreaks of C. cereale
due, in part, to defoliation of ABG turf (Backman et al., 2002; Inguagiato et al., 2009).
Similarly, the defoliation of maize plants enhanced infection by C. graminicola (Dodd,
1980; Mortimore and Ward, 1964).
Scarifying did not produce as frequent or as large increases in disease severity as
verticutting, despite the greater cutting depth of scarifying. Scarifying affected only 4%
of the turf area due to the wider blade spacing (40 mm), which would have injured fewer
crowns and caused substantially less defoliation than verticutting. Similarly, the limited
effect of solid-tining on disease was probably due to this practice affecting only 2% of
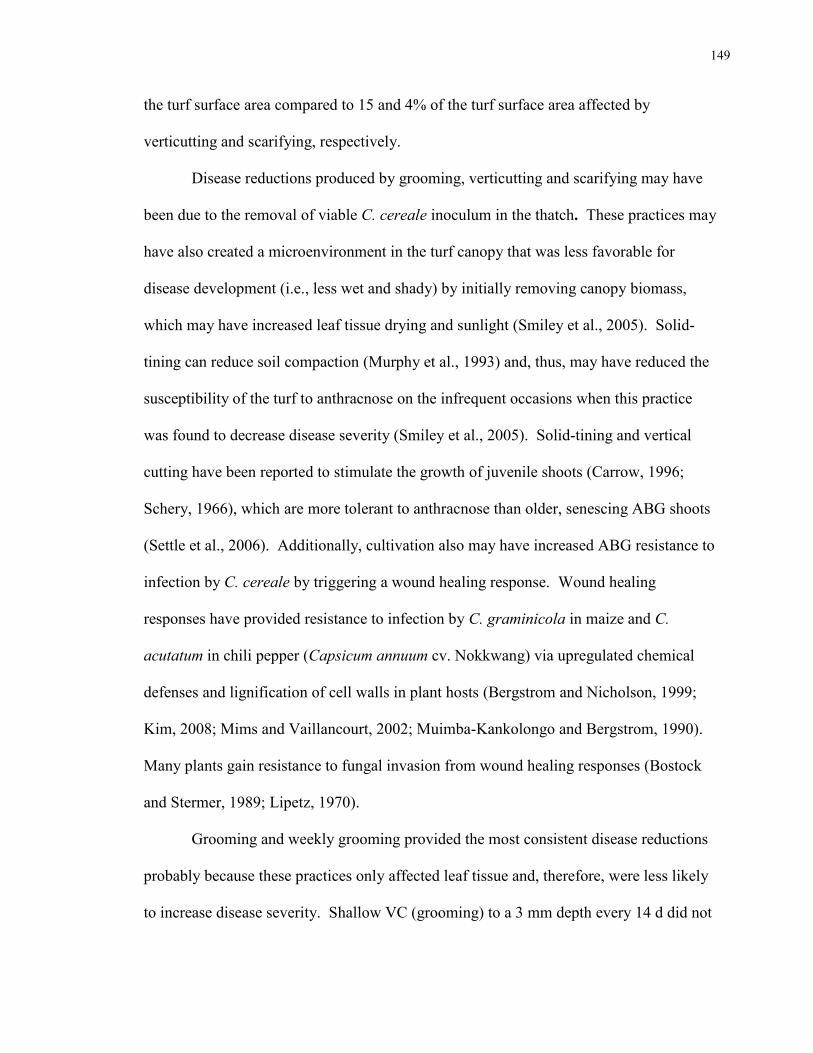
149
the turf surface area compared to 15 and 4% of the turf surface area affected by
verticutting and scarifying, respectively.
Disease reductions produced by grooming, verticutting and scarifying may have
been due to the removal of viable C. cereale inoculum in the thatch. These practices may
have also created a microenvironment in the turf canopy that was less favorable for
disease development (i.e., less wet and shady) by initially removing canopy biomass,
which may have increased leaf tissue drying and sunlight (Smiley et al., 2005). Solid-
tining can reduce soil compaction (Murphy et al., 1993) and, thus, may have reduced the
susceptibility of the turf to anthracnose on the infrequent occasions when this practice
was found to decrease disease severity (Smiley et al., 2005). Solid-tining and vertical
cutting have been reported to stimulate the growth of juvenile shoots (Carrow, 1996;
Schery, 1966), which are more tolerant to anthracnose than older, senescing ABG shoots
(Settle et al., 2006). Additionally, cultivation also may have increased ABG resistance to
infection by C. cereale by triggering a wound healing response. Wound healing
responses have provided resistance to infection by C. graminicola in maize and C.
acutatum in chili pepper (Capsicum annuum cv. Nokkwang) via upregulated chemical
defenses and lignification of cell walls in plant hosts (Bergstrom and Nicholson, 1999;
Kim, 2008; Mims and Vaillancourt, 2002; Muimba-Kankolongo and Bergstrom, 1990).
Many plants gain resistance to fungal invasion from wound healing responses (Bostock
and Stermer, 1989; Lipetz, 1970).
Grooming and weekly grooming provided the most consistent disease reductions
probably because these practices only affected leaf tissue and, therefore, were less likely
to increase disease severity. Shallow VC (grooming) to a 3 mm depth every 14 d did not

150
greatly affect anthracnose disease development on ABG maintained at 3.2 mm mowing
height (Inguagiato et al., 2008). Moreover, wounding leaves of ABG tillers prior to
inoculation in the greenhouse did not enhance anthracnose disease severity (Landschoot
and Hoyland, 1995). Grooming also affected the most turf surface area (30%), which
likely enhanced one or more of the plausible causes of disease reduction described above.
Similarly, weekly grooming probably enhanced disease reductions compared to grooming
every 21 d due to the increased frequency of this practice.
Based on our findings that cultivation practices typically did not increase disease
severity under fungicide control, we can speculate that the increased disease symptoms
observed in verticutting, scarifying and solid-tining plots under no fungicide control were
due to actual increases in anthracnose severity rather than “injury/yellowing” caused by
mechanical wounding. Moreover, these results suggest that midseason cultivation may
not be a great risk for enhancing anthracnose on golf courses where fungicide programs
are commonly employed to control anthracnose. It would have been useful to conduct
the current trial for a third year to provide two years of data including the fungicide
factor; however, renovation of the trial area was necessary after 2010 due to the extensive
damage caused by the disease.
Results from this trial suggest that the location of wounding of ABG plants and
the percent of the turf surface affected by midseason cultivation practices are factors that
influence anthracnose disease development. However, the factors of wounding location
and percent turf surface area affected (e.g., blade spacing) were confounded among the
grooming, verticutting and scarifying treatments in the current study. To prove this
hypothesis conclusively, additional studies to examine the effect of vertical cutting depth
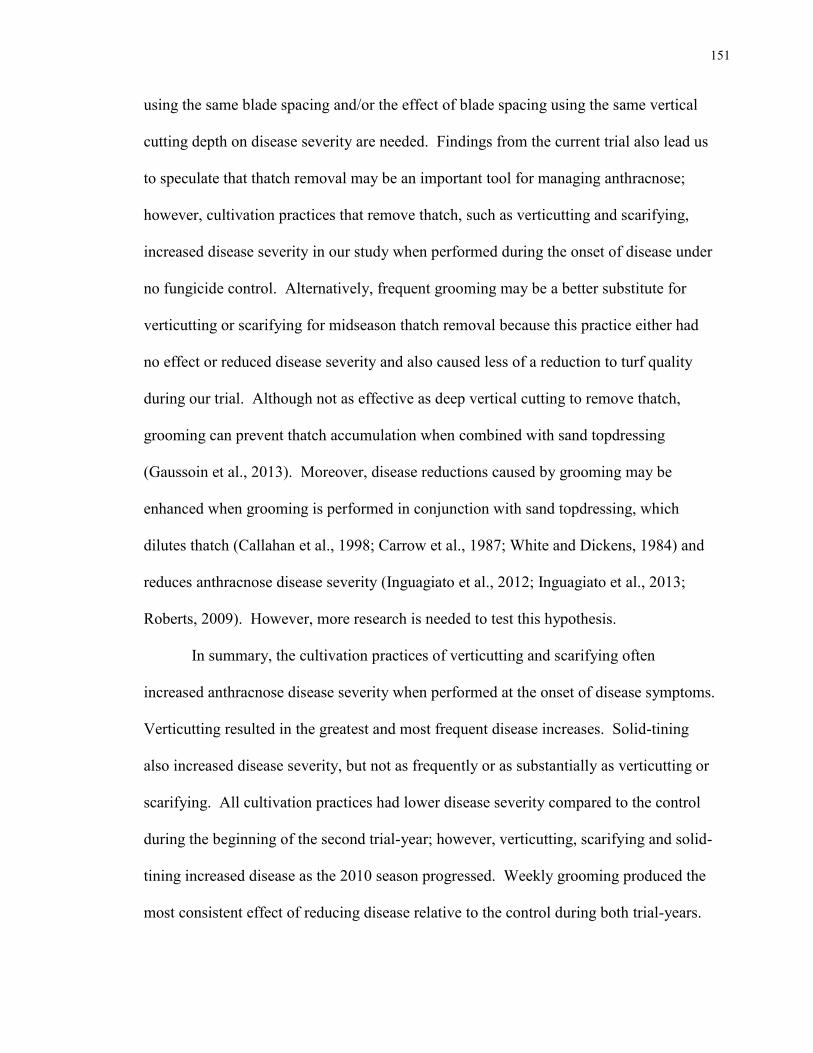
151
using the same blade spacing and/or the effect of blade spacing using the same vertical
cutting depth on disease severity are needed. Findings from the current trial also lead us
to speculate that thatch removal may be an important tool for managing anthracnose;
however, cultivation practices that remove thatch, such as verticutting and scarifying,
increased disease severity in our study when performed during the onset of disease under
no fungicide control. Alternatively, frequent grooming may be a better substitute for
verticutting or scarifying for midseason thatch removal because this practice either had
no effect or reduced disease severity and also caused less of a reduction to turf quality
during our trial. Although not as effective as deep vertical cutting to remove thatch,
grooming can prevent thatch accumulation when combined with sand topdressing
(Gaussoin et al., 2013). Moreover, disease reductions caused by grooming may be
enhanced when grooming is performed in conjunction with sand topdressing, which
dilutes thatch (Callahan et al., 1998; Carrow et al., 1987; White and Dickens, 1984) and
reduces anthracnose disease severity (Inguagiato et al., 2012; Inguagiato et al., 2013;
Roberts, 2009). However, more research is needed to test this hypothesis.
In summary, the cultivation practices of verticutting and scarifying often
increased anthracnose disease severity when performed at the onset of disease symptoms.
Verticutting resulted in the greatest and most frequent disease increases. Solid-tining
also increased disease severity, but not as frequently or as substantially as verticutting or
scarifying. All cultivation practices had lower disease severity compared to the control
during the beginning of the second trial-year; however, verticutting, scarifying and solid-
tining increased disease as the 2010 season progressed. Weekly grooming produced the
most consistent effect of reducing disease relative to the control during both trial-years.

152
These results suggest that turf managers can reduce the risk of increasing disease severity
by avoiding the use of midseason cultivation practices that wound crowns when
anthracnose is active. Furthermore, fungicides also appeared to negate the potential for
disease enhancement caused by midseason cultivation. Midseason cultivation practices
that wound leaf tissue, such as grooming, do not appear to increase disease severity and
may slightly reduce disease, especially when applied weekly and in combination with
fungicides.

153
15
3
REFERENCES
Avila-Adame, C., G. Olaya, and W. Köller. 2003. Characterization of Colletotrichum
graminicola isolates resistant to strobilurin-related QoI fungicides. Plant Dis.
87(12):1426-1432.
Backman, P., G. Stahnke, and E. Miltner. 2002. Anthracnose update: Cultural practices
affect spread of disease in northwest. Turfgrass Trends 11:T1-T2, T4.
Beard, J.B. 1973. Turfgrass: Science and culture. Prentice Hall, Englewood Cliffs, NJ.
Beard, J.B. 2002. Turf management for golf courses. 2nd ed. Ann Arbor Press, Chelsea,
MI.
Beard, J.B., and H.J. Beard. 2005. Beard's turfgrass encyclopedia for golf courses,
grounds, lawns, sports fields. Michigan State Univ. Press, East Lansing, MI.
Bergstrom, G.C., and R.L. Nicholson. 1999. The biology of corn anthracnose: knowledge
to exploit for improved management. Plant Dis. 83(7):596-608.
Bidwell, W. 1952. Reducing thatch brings back healthy turf. Golfdom 26(3):78,80,82.
Bostock, R.M., and B.A. Stermer. 1989. Perspectives on Wound Healing in Resistance to
Pathogens. Annu. Rev. Phytopathol. 27(1):343-371. DOI:
doi:10.1146/annurev.py.27.090189.002015.
Callahan, L.M., W.L. Sanders, J.M. Parham, C.A. Harper, L.D. Lester, and E.R.
McDonald. 1998. Cultural and Chemical Controls of Thatch and Their Influence
on Rootzone Nutrients in a Bentgrass Green. Crop Sci. 38(1):181-187. DOI:
10.2135/cropsci1998.0011183X003800010030x.
Carrow, R.N. 1996. Summer decline of bentgrass greens: Understanding the cause of this
problem not only helps you cure SBD, but also lets you initiate preventive
maintenance. Golf Course Manage. 64(6):51-56.
Carrow, R.N. 2003. Surface organic matter in bentgrass greens. [Online]. USGA
Turfgrass and Environ. Res. Online 2(17):1-12.
154
Carrow, R.N., B.J. Johnson, and R.E. Burns. 1987. Thatch and Quality of Tifway
Bermudagrass Turf in Relation to Fertility and Cultivation. Agron. J. 79(3):524-
530. DOI: 10.2134/agronj1987.00021962007900030025x.
Christians, N. 2011. Fundamentals of turfgrass management. John Wiley & Sons, Inc.,
Hoboken, NJ.
Clarke, B.B., D. Thompson, J.A. Murphy, and P. Majumdar. 1995. Development of an
integrated summer patch control program for fine turf areas. Proc. of the Annu.
Rutgers Turfgrass Symp. 4:18-19.
Couch, H.B. 1973. Diseases of Turfgrasses. 2nd ed. Kriger Publishing Co., Inc., Malabar,
FL.
Crouch, J.A., B.B. Clarke, and B.I. Hillman. 2005. Phylogenetic relationships and
fungicide sensitivities of Colletotrichum graminicola isolates from turfgrass in
North America. Int. Turfgrass Soc. Res. J. 10:186-195.
Crouch, J.A., B.B. Clarke, and B.I. Hillman. 2006. Unraveling Evolutionary
Relationships Among the Divergent Lineages of Colletotrichum Causing
Anthracnose Disease in Turfgrass and Corn. Phytopathology 96(1):46-60. DOI:
10.1094/PHYTO-96-0046.
Dawson, R.B. 1934. Forking as an aid to turf recovery after drought. J. of the Board of
Greenkeeping Res. 3(11):233-241.
Dawson, R.B., and R.B. Ferro. 1939. Scarification and turf improvement. J. of the Board
of Greenkeeping Res. 6(20):11-17.
Dodd, J.L. 1980. Grain sink size and predisposition of Zea mays to stalk rot.
Phytopathology 70:534-535.
Engel, R.E., and R.B. Alderfer. 1967. The effect of cultivation, topdressing, lime,
nitrogen and wetting agent on thatch development in 1/4-inch bentgrass turf over
a ten-year period. New Jersey Agric. Exp. Stn. Bull. 818:32-45.
Gaussoin, R.E., W.L. Berndt, C.A. Dockrell, and R.A. Drijber. 2013. Characterization,
development, and management of organic matter in turfgrass systems, In: J. C.
Stier, Horgan, Brian P., Bonos, Stacy A., and Schmitt, Gail K. (Ed.), Turfgrass:

155
Biology, Use, and Management, ASA, CSSA, & SSSA Inc., Madison, WI. pp.
1328.
Gomez, K.A., and A.A. Gomez. 1984. Statistical procedures for agricultural research.
2nd ed. John Wiley & Sons, Inc., New York, NY.
Green, R.L., L. Wu, and G.J. Klein. 2001. Summer cultivation increases field infiltration
rates of water and reduces soil electrical conductivity on annual bluegrass golf
greens. HortScience 36(4):776-779.
Halisky, P.M., R.F. Myers, and R.E. Wagner. 1981. Relationship of thatch to nematodes,
dollar spot and fungicides in Kentucky bluegrass turf. Proc. Int. Turf. Res. Conf.
4:415-420.
Hartwiger, C., and P. O’Brien. 2001. Core aeration by the numbers. U.S. Golf Assoc.
Green Section Record 39(4):8-9.
Inguagiato, J.C., J.A. Murphy, and B.B. Clarke. 2008. Anthracnose Severity on Annual
Bluegrass Influenced by Nitrogen Fertilization, Growth Regulators, and
Verticutting. Crop Sci. 48(4):1595-1607. DOI: 10.2135/cropsci2007.06.0343.
Inguagiato, J.C., J.A. Murphy, and B.B. Clarke. 2009. Anthracnose Disease and Annual
Bluegrass Putting Green Performance Affected by Mowing Practices and
Lightweight Rolling. Crop Sci. 49(4):1454-1462. DOI:
10.2135/cropsci2008.07.0435.
Inguagiato, J.C., J.A. Murphy, and B.B. Clarke. 2012. Sand Topdressing Rate and
Interval Effects on Anthracnose Severity of an Annual Bluegrass Putting Green.
Crop Sci. 52(3):1406-1415. DOI: 10.2135/cropsci2011.01.0010.
Inguagiato, J.C., J.A. Murphy, B.B. Clarke, and J.A. Roberts. 2013. Topdressing sand
particle shape and incorporation effects on anthracnose severity of an annual
bluegrass putting green. Int. Turfgrass Res. Soc. J. 12:(accepted).
Kim, Y.H. 2008. Effect of delayed inoculation after wounding on the development of
anthracnose disease caused by Colletotrichum acutatum on chili pepper fruit. The
Plant Pathol. J. 24(4):392-399.

156
Landreth, J., D. Karcher, and M. Richardson. 2008. Cultivating to manage organic matter
in sand-based putting greens: University of Arkansas researchers provide
important insight for managing organic buildup on putting greens. U.S. Golf
Assoc. Green Section Record 46(1):16-19.
Landschoot, P., and B. Hoyland. 1995. Shedding some light on anthracnose basal rot.
Golf Course Manage 11:52-55.
Lipetz, J. 1970. Wound healing in higher plants. Int. Rev. Cytol 27(1):1-28.
Lockyer, J. 2009. Successful fine turf organic matter management. Int. Turfgrass Bull.
244:9-11.
Madden, L.V., G. Hughes, and F. Van den Bosch. 2007. The Study of Plant Disease
Epidemics. The American Phytopathological Society, APS Press, St. Paul, MN.
Mann, R.L., and A.J. Newell. 2005. A survey to determine the incidence and severity of
pests and diseases on golf course putting greens in England, Ireland, Scotland,
and Wales. Int. Turfgrass Soc. Res. J. 10:224-229.
McCarty, L.B., M.F. Gregg, and J.E. Toler. 2007. Thatch and Mat Management in an
Established Creeping Bentgrass Golf Green. Agron. J. 99(6):1530-1537. DOI:
10.2134/agronj2006.0361.
Mims, C.W., and L.J. Vaillancourt. 2002. Ultrastructural characterization of infection and
colonization of maize leaves by Colletotrichum graminicola, and by a C.
graminicola pathogenicity mutant. Phytopathology 92(7):803-812.
Moeller, A.C. 2008. Evaluation of Putting Green Surface Organic Matter Management
Programs. M.S. Thesis: Purdue Univ.
Moore, D. 2005. The supa greens maintenance cassette system. Int. Turfgrass Bull.
228:21, 23.
Mortimore, C.G., and G.M. Ward. 1964. Root and stalk rot of corn in southwestern
Ontario: III. sugar levels as a measure of plant vigor and resistance. Can. J. Plant
Sci. 44:451-457.

157
Muimba-Kankolongo, A., and G.C. Bergstrom. 1990. Transitory wound predisposition of
maize to Anthracnose stalk rot. Can. J. Plant Pathol. 12(1):1-10.
Murphy, J., F. Wong, L. Tredway, J.A. Crouch, J. Inguagiato, B. Clarke, T. Hsiang, and
F. Rossi. 2008. Best management practices for anthracnose on annual bluegrass
turf. Golf Course Management 24:93-104.
Murphy, J.A., and P.E. Rieke. 1994. High pressure water injection and core cultivation of
a compacted putting green. Agron. J. 86(4):719-724.
Murphy, J.A., P.E. Rieke, and A.E. Erickson. 1993. Core cultivation of a putting green
with hollow and solid tines. Agron. J. 85(1):1-9.
Raisch, T. 2003. Anthracnose: One club's three-year battle. Golf Course Manage.
71(11):76-78,80,82,84.
Roberts, J.A. 2009. Impact of cultural management on anthracnose severity of annual
bluegrass putting green turf. M.S. Thesis: Rutgers Univ.
Roberts, J.A., J.C. Inguagiato, B.B. Clarke, and J.A. Murphy. 2011. Irrigation Quantity
Effects on Anthracnose Disease of Annual Bluegrass. Crop Sci. 51(3):1244-1252.
DOI: 10.2135/cropsci2010.07.0444.
Samaranayake, H., T.J. Lawson, and J.A. Murphy. 2008. Traffic Stress Effects on
Bentgrass Putting Green and Fairway Turf. Crop Sci. 48(3):1193-1202. DOI:
10.2135/cropsci2006.09.0613.
Schery, R.W. 1966. Remarkable Kentucky bluegrass. Southern California Turfgrass
Culture. 8:30-31.
Settle, D.M., A.D. Martinez-Espinoza, and L.L. Burpee. 2006. Anthracnose of Turfgrass.
The Plant Health Instructor [Online]:[1-6]. DOI: DOI:10.1094/PHI-I-2006-1205-
01.
Smiley, R.W., P.H. Dernoeden, and B.B. Clarke. 2005. Compendium of turfgrass
diseases. APS press, St. Paul, MN.
158
Stier, J.C., and A.B. Hollman. 2003. Cultivation and topdressing requirements for thatch
management in A and G bentgrasses and creeping bluegrass. HortScience
38(6):1227-1231.
Tisserat, N.A., and J. Fry. 1997. Cultural practices to reduce spring dead spot
(Ophiosphaerella herpotricha) severity in Cynodon dactylon. Int. Turf. Soc. Res.
J. 8:931-936.
Towers, G., K. Green, E. Weibel, P. Majumdar, and B.B. Clarke. 2003. Evaluation of
fungicides for the control of anthracnose basal rot on annual bluegrass. Fungicide
and Nematicide Tests 58:T017.
Turgeon, A.J. 2011. Turfgrass Management, Prentice Hall, Upper Saddle River, NJ.
Uddin, W., M. Soika, and D. Livingston. 2008. Vertical mowing and mowing height
affect anthracnose basal rot. Golf Course Manage. 76:84-87.
Unruh, J.B., S.D. Davis, P.F. Colbaugh, B.J. Brecke, and D.O. Stephenson. 2005. Impact
of various chemical and nutrient inputs and cultural treatments on 'Tifeagle
bermudagrass (Cynodon dactylon x C. transvaalensis). Int. Turfgrass Soc. Res. J.
10(1):455-461.
Vargas, J., and A. Turgeon. 2004. Poa annua: physiology, culture, and control of annual
bluegrass, John Wiley & Sons, Inc, Hoboken, New Jersey.
Vermeulen, P.H. 2003. Maybe it's time for a change. U.S Golf Assoc. Green Section
Record 41:28.
White, R.H., and R. Dickens. 1984. Thatch Accumulation in Bermudagrass as Influenced
by Cultural Practices. Agron. J. 76(1):19-22. DOI:
10.2134/agronj1984.00021962007600010006x.
Wong, F.P., K.A. de la Cerda, R. Hernandez-Martinez, and S.L. Midland. 2008.
Detection and characterization of benzimidazole resistance in California
populations of Colletotrichum cereale. Plant Dis. 92(2):239-246.
Wong, F.P., and S.L. Midland. 2007. Sensitivity distributions of California populations of
Colletotrichum cereale to the DMI fungicides propiconazole, myclobutanil,
tebuconazole, and triadimefon. Plant Dis. 91(12):1547-1555.
159
Wong, F.P., S.L. Midland, and K.A. de la Cerda. 2007. Occurrence and distribution of
QoI-resistant isolates of Colletotrichum cereale from annual bluegrass in
California. Plant Dis. 91(12):1536-1546.
Young, J.R., M. Tomaso-Peterson, K. de la Cerda, and F.P. Wong. 2010a. Two mutations
in β-tubulin 2 gene associated with thiophanate-methyl resistance in
Colletotrichum cereale isolates from creeping bentgrass in Mississippi and
Alabama. Plant Dis. 94(2):207-212.
Young, J.R., M. Tomaso-Peterson, L.P. Tredway, and K. de la Cerda. 2010b. Occurrence
and molecular identification of azoxystrobin-resistant Colletotrichum cereale
isolates from golf course putting greens in the Southern United States. Plant Dis.
94(6):751-757.
Zontek, S.J. 2004. Have we gone too far? The grass is talking to you. Are you listening?
U.S Golf Assoc. Green Section Record 48:28.
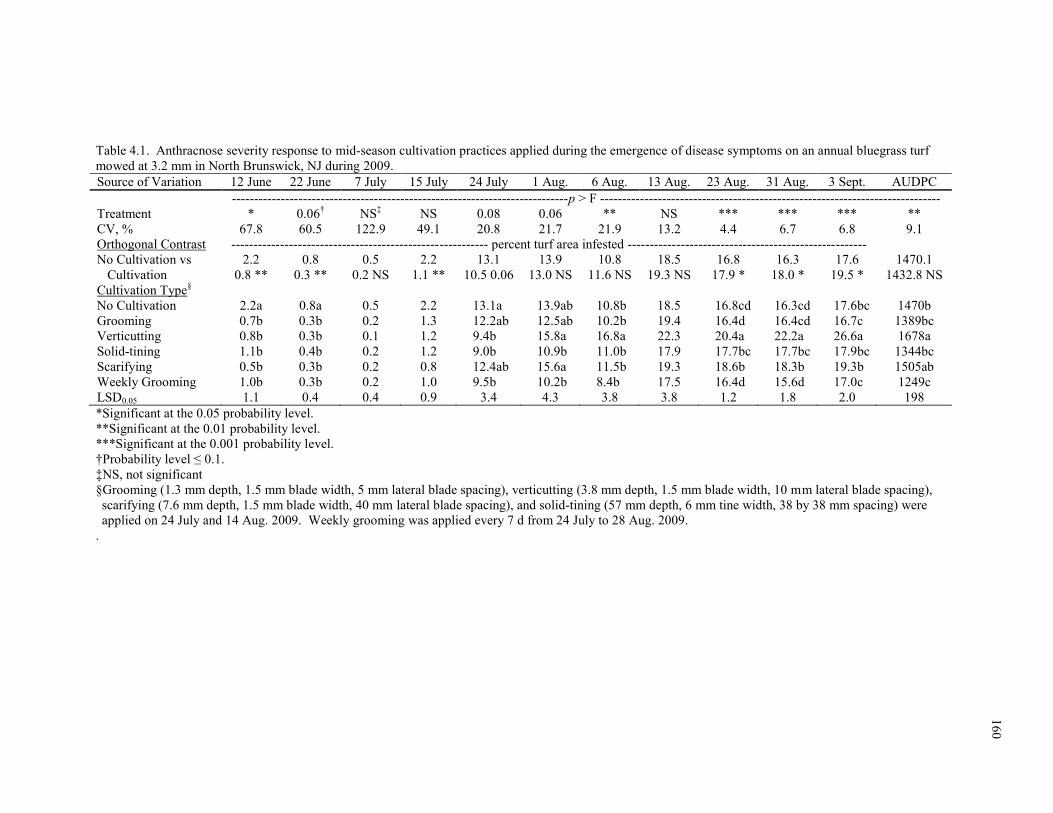
16
0
Table 4.1. Anthracnose severity response to mid-season cultivation practices applied during the emergence of disease symptoms on an annual bluegrass turf
mowed at 3.2 mm in North Brunswick, NJ during 2009.
Source of Variation 12 June 22 June 7 July 15 July 24 July 1 Aug. 6 Aug. 13 Aug. 23 Aug. 31 Aug. 3 Sept. AUDPC
----------------------------------------------------------------------------p > F -----------------------------------------------------------------------------
Treatment * 0.06† NS
‡ NS 0.08 0.06 ** NS *** *** *** **
CV, % 67.8 60.5 122.9 49.1 20.8 21.7 21.9 13.2 4.4 6.7 6.8 9.1
Orthogonal Contrast ---------------------------------------------------------- percent turf area infested ------------------------------------------------------
No Cultivation vs 2.2 0.8 0.5 2.2 13.1 13.9 10.8 18.5 16.8 16.3 17.6 1470.1
Cultivation 0.8 ** 0.3 ** 0.2 NS 1.1 ** 10.5 0.06 13.0 NS 11.6 NS 19.3 NS 17.9 * 18.0 * 19.5 * 1432.8 NS
Cultivation Type§
No Cultivation 2.2a 0.8a 0.5 2.2 13.1a 13.9ab 10.8b 18.5 16.8cd 16.3cd 17.6bc 1470b
Grooming 0.7b 0.3b 0.2 1.3 12.2ab 12.5ab 10.2b 19.4 16.4d 16.4cd 16.7c 1389bc
Verticutting 0.8b 0.3b 0.1 1.2 9.4b 15.8a 16.8a 22.3 20.4a 22.2a 26.6a 1678a
Solid-tining 1.1b 0.4b 0.2 1.2 9.0b 10.9b 11.0b 17.9 17.7bc 17.7bc 17.9bc 1344bc
Scarifying 0.5b 0.3b 0.2 0.8 12.4ab 15.6a 11.5b 19.3 18.6b 18.3b 19.3b 1505ab
Weekly Grooming 1.0b 0.3b 0.2 1.0 9.5b 10.2b 8.4b 17.5 16.4d 15.6d 17.0c 1249c
LSD0.05 1.1 0.4 0.4 0.9 3.4 4.3 3.8 3.8 1.2 1.8 2.0 198
*Significant at the 0.05 probability level.
**Significant at the 0.01 probability level.
***Significant at the 0.001 probability level.
†Probability level ≤ 0.1.
‡NS, not significant
§Grooming (1.3 mm depth, 1.5 mm blade width, 5 mm lateral blade spacing), verticutting (3.8 mm depth, 1.5 mm blade width, 10 mm lateral blade spacing),
scarifying (7.6 mm depth, 1.5 mm blade width, 40 mm lateral blade spacing), and solid-tining (57 mm depth, 6 mm tine width, 38 by 38 mm spacing) were
applied on 24 July and 14 Aug. 2009. Weekly grooming was applied every 7 d from 24 July to 28 Aug. 2009.
.

161
16
1
Figure 4.1. Anthracnose severity response to mid-season cultivation practices applied during the
emergence of disease symptoms on an annual bluegrass turf mowed at 3.2 mm in North Brunswick, NJ
during 2009. Grooming (1.3 mm depth, 1.5 mm blade width, 5 mm lateral blade spacing), verticutting (3.8
mm depth, 1.5 mm blade width, 10 mm lateral blade spacing), scarifying (7.6 mm depth, 1.5 mm blade
width, 40 mm lateral blade spacing), and solid-tining (57 mm depth, 6 mm tine width, 38 by 38 mm
spacing) were applied on 24 July and 14 Aug. 2009. Weekly grooming was applied every 7 d from 24 July
to 28 Aug. 2009. Error bar indicates Fisher’s protected LSD at α = 0.05 for treatment comparison on a
specific rating date; no error bar indicates the date is not significant.
0
10
20
30
40
50
60
70
Pe
rce
nt
turf
are
a in
fest
ed
No Cultivation
Grooming
Verticutting
Solid-tining
Scarifying
Weekly Grooming
6 June 26 June 16 July 5 Aug. 25 Aug.
2009
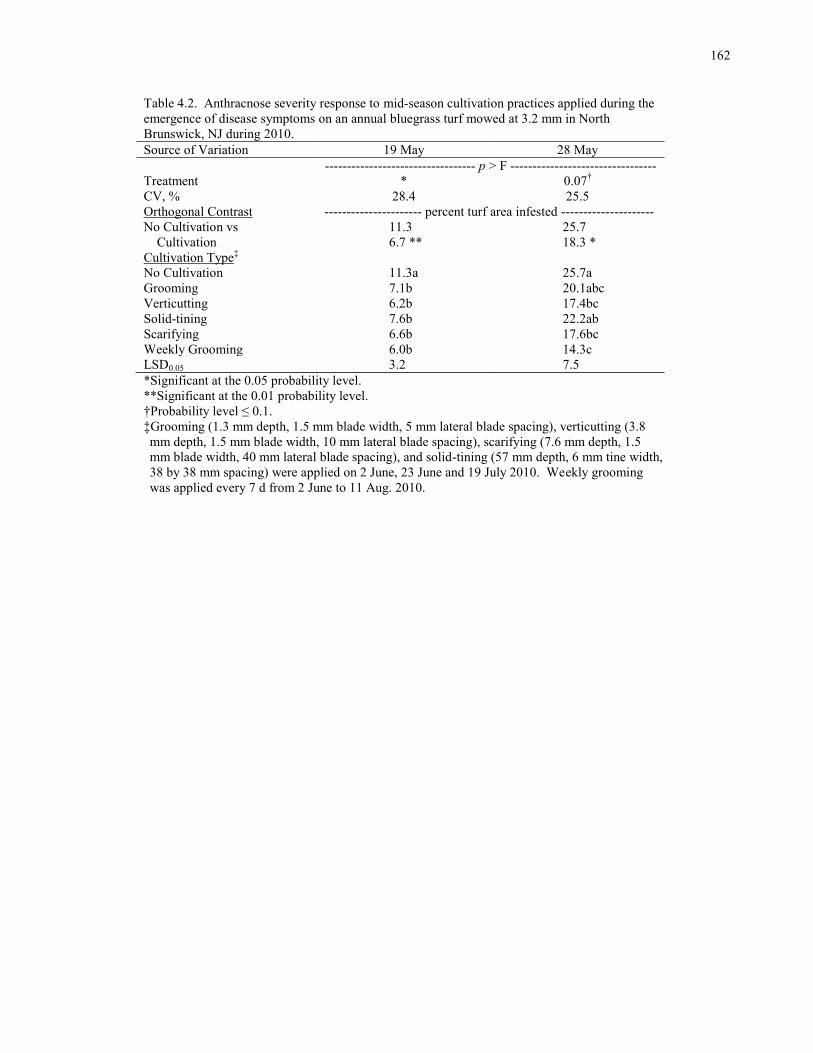
162
16
2
Table 4.2. Anthracnose severity response to mid-season cultivation practices applied during the
emergence of disease symptoms on an annual bluegrass turf mowed at 3.2 mm in North
Brunswick, NJ during 2010.
Source of Variation 19 May 28 May
---------------------------------- p > F ---------------------------------
Treatment * 0.07†
CV, % 28.4 25.5
Orthogonal Contrast ---------------------- percent turf area infested ---------------------
No Cultivation vs 11.3 25.7
Cultivation 6.7 ** 18.3 *
Cultivation Type‡
No Cultivation 11.3a 25.7a
Grooming 7.1b 20.1abc
Verticutting 6.2b 17.4bc
Solid-tining 7.6b 22.2ab
Scarifying 6.6b 17.6bc
Weekly Grooming 6.0b 14.3c
LSD0.05 3.2 7.5
*Significant at the 0.05 probability level.
**Significant at the 0.01 probability level.
†Probability level ≤ 0.1.
‡Grooming (1.3 mm depth, 1.5 mm blade width, 5 mm lateral blade spacing), verticutting (3.8
mm depth, 1.5 mm blade width, 10 mm lateral blade spacing), scarifying (7.6 mm depth, 1.5
mm blade width, 40 mm lateral blade spacing), and solid-tining (57 mm depth, 6 mm tine width,
38 by 38 mm spacing) were applied on 2 June, 23 June and 19 July 2010. Weekly grooming
was applied every 7 d from 2 June to 11 Aug. 2010.
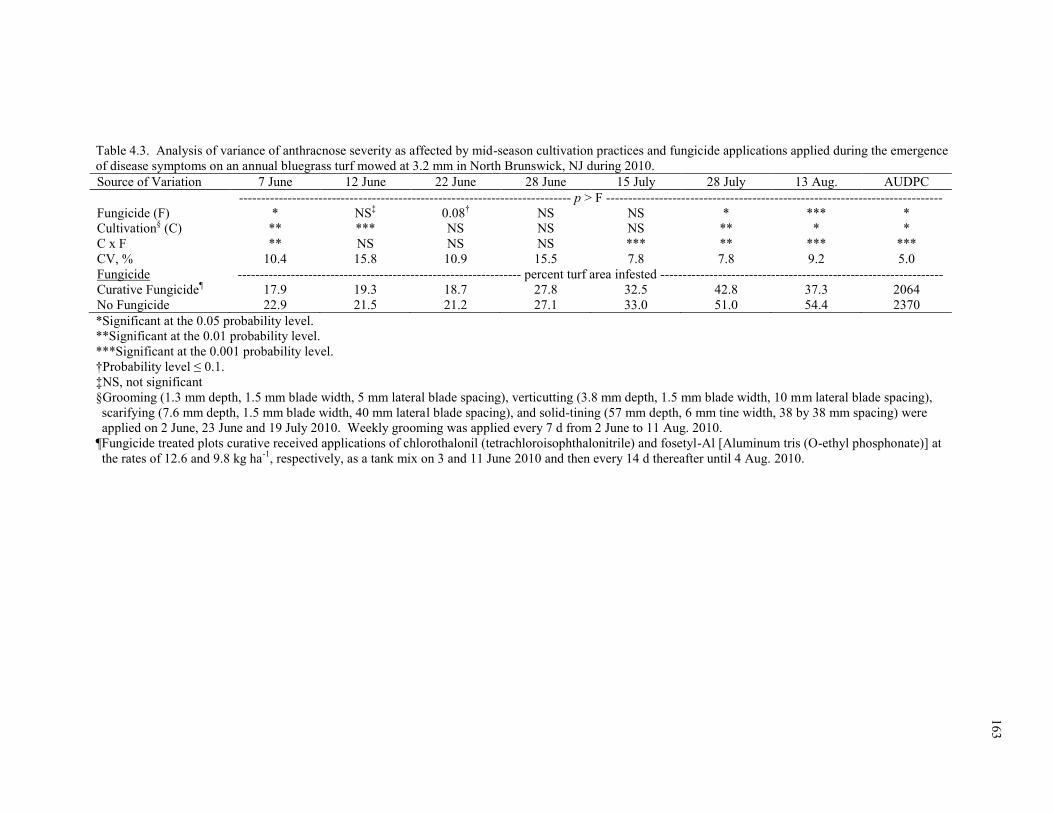
16
3
Table 4.3. Analysis of variance of anthracnose severity as affected by mid-season cultivation practices and fungicide applications applied during the emergence
of disease symptoms on an annual bluegrass turf mowed at 3.2 mm in North Brunswick, NJ during 2010.
Source of Variation 7 June 12 June 22 June 28 June 15 July 28 July 13 Aug. AUDPC
--------------------------------------------------------------------------- p > F ----------------------------------------------------------------------------
Fungicide (F) * NS‡ 0.08
† NS NS * *** *
Cultivation§ (C) ** *** NS NS NS ** * *
C x F ** NS NS NS *** ** *** ***
CV, % 10.4 15.8 10.9 15.5 7.8 7.8 9.2 5.0
Fungicide ---------------------------------------------------------------- percent turf area infested ----------------------------------------------------------------
Curative Fungicide¶ 17.9 19.3 18.7 27.8 32.5 42.8 37.3 2064
No Fungicide 22.9 21.5 21.2 27.1 33.0 51.0 54.4 2370
*Significant at the 0.05 probability level.
**Significant at the 0.01 probability level.
***Significant at the 0.001 probability level.
†Probability level ≤ 0.1.
‡NS, not significant
§Grooming (1.3 mm depth, 1.5 mm blade width, 5 mm lateral blade spacing), verticutting (3.8 mm depth, 1.5 mm blade width, 10 mm lateral blade spacing),
scarifying (7.6 mm depth, 1.5 mm blade width, 40 mm lateral blade spacing), and solid-tining (57 mm depth, 6 mm tine width, 38 by 38 mm spacing) were
applied on 2 June, 23 June and 19 July 2010. Weekly grooming was applied every 7 d from 2 June to 11 Aug. 2010.
¶Fungicide treated plots curative received applications of chlorothalonil (tetrachloroisophthalonitrile) and fosetyl-Al [Aluminum tris (O-ethyl phosphonate)] at
the rates of 12.6 and 9.8 kg ha-1
, respectively, as a tank mix on 3 and 11 June 2010 and then every 14 d thereafter until 4 Aug. 2010.
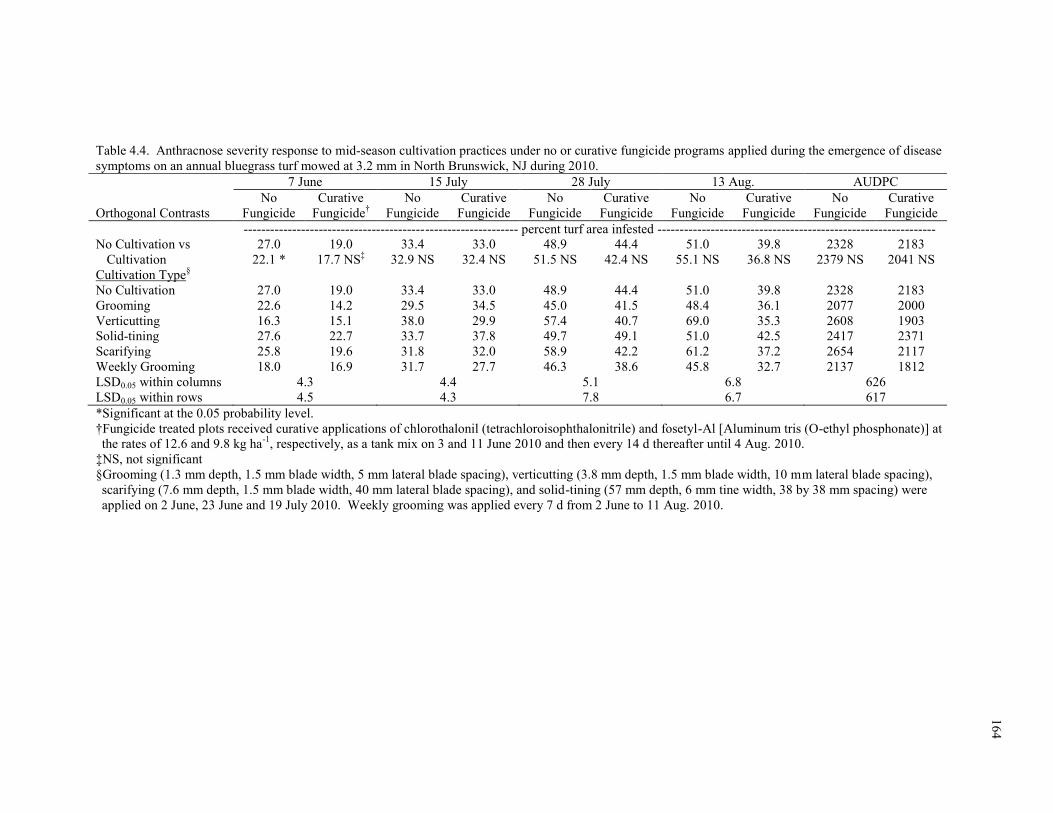
16
4
Table 4.4. Anthracnose severity response to mid-season cultivation practices under no or curative fungicide programs applied during the emergence of disease
symptoms on an annual bluegrass turf mowed at 3.2 mm in North Brunswick, NJ during 2010.
7 June 15 July 28 July 13 Aug. AUDPC
No Curative No Curative No Curative No Curative No Curative
Orthogonal Contrasts Fungicide Fungicide†
Fungicide Fungicide Fungicide Fungicide Fungicide Fungicide Fungicide Fungicide
-------------------------------------------------------------- percent turf area infested ---------------------------------------------------------------
No Cultivation vs 27.0 19.0 33.4 33.0 48.9 44.4 51.0 39.8 2328 2183
Cultivation 22.1 * 17.7 NS‡ 32.9 NS 32.4 NS 51.5 NS 42.4 NS 55.1 NS 36.8 NS 2379 NS 2041 NS
Cultivation Type§
No Cultivation 27.0 19.0 33.4 33.0 48.9 44.4 51.0 39.8 2328 2183
Grooming 22.6 14.2 29.5 34.5 45.0 41.5 48.4 36.1 2077 2000
Verticutting 16.3 15.1 38.0 29.9 57.4 40.7 69.0 35.3 2608 1903
Solid-tining 27.6 22.7 33.7 37.8 49.7 49.1 51.0 42.5 2417 2371
Scarifying 25.8 19.6 31.8 32.0 58.9 42.2 61.2 37.2 2654 2117
Weekly Grooming 18.0 16.9 31.7 27.7 46.3 38.6 45.8 32.7 2137 1812
LSD0.05 within columns 4.3 4.4 5.1 6.8 626
LSD0.05 within rows 4.5 4.3 7.8 6.7 617
*Significant at the 0.05 probability level.
†Fungicide treated plots received curative applications of chlorothalonil (tetrachloroisophthalonitrile) and fosetyl-Al [Aluminum tris (O-ethyl phosphonate)] at
the rates of 12.6 and 9.8 kg ha-1
, respectively, as a tank mix on 3 and 11 June 2010 and then every 14 d thereafter until 4 Aug. 2010.
‡NS, not significant
§Grooming (1.3 mm depth, 1.5 mm blade width, 5 mm lateral blade spacing), verticutting (3.8 mm depth, 1.5 mm blade width, 10 mm lateral blade spacing),
scarifying (7.6 mm depth, 1.5 mm blade width, 40 mm lateral blade spacing), and solid-tining (57 mm depth, 6 mm tine width, 38 by 38 mm spacing) were
applied on 2 June, 23 June and 19 July 2010. Weekly grooming was applied every 7 d from 2 June to 11 Aug. 2010.
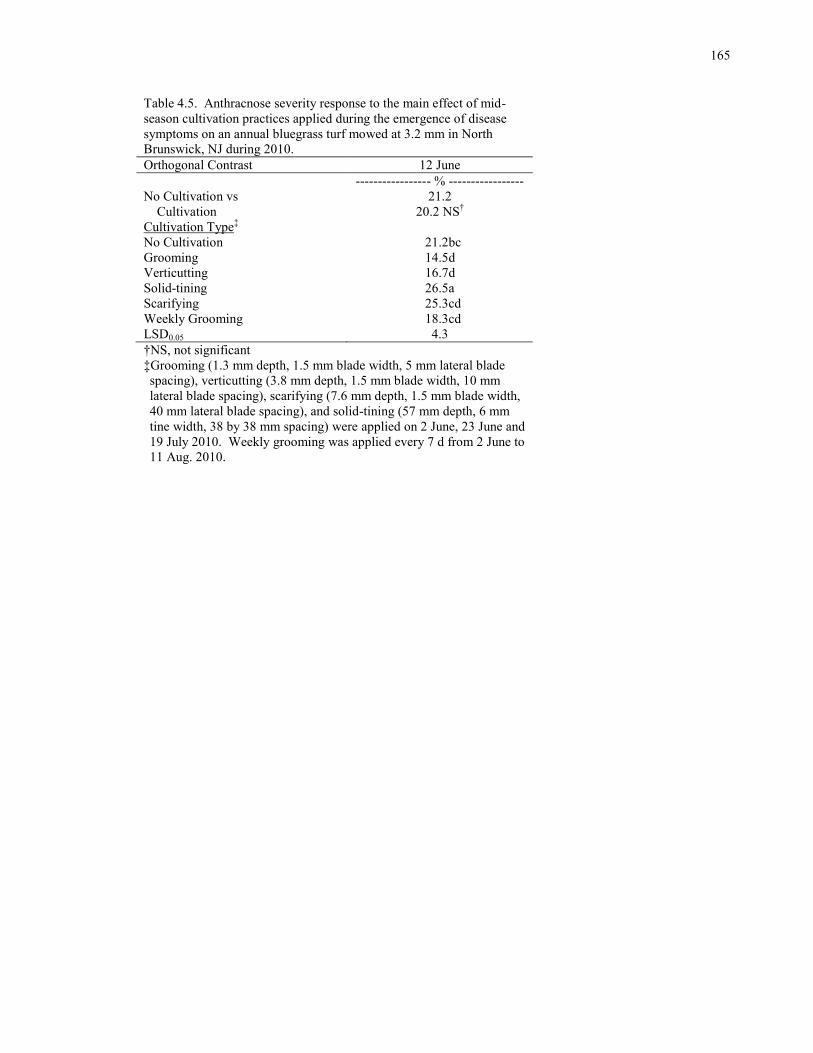
165
16
5
Table 4.5. Anthracnose severity response to the main effect of mid-
season cultivation practices applied during the emergence of disease
symptoms on an annual bluegrass turf mowed at 3.2 mm in North
Brunswick, NJ during 2010.
Orthogonal Contrast 12 June
----------------- % -----------------
No Cultivation vs 21.2
Cultivation 20.2 NS†
Cultivation Type‡
No Cultivation 21.2bc
Grooming 14.5d
Verticutting 16.7d
Solid-tining 26.5a
Scarifying 25.3cd
Weekly Grooming 18.3cd
LSD0.05 4.3
†NS, not significant
‡Grooming (1.3 mm depth, 1.5 mm blade width, 5 mm lateral blade
spacing), verticutting (3.8 mm depth, 1.5 mm blade width, 10 mm
lateral blade spacing), scarifying (7.6 mm depth, 1.5 mm blade width,
40 mm lateral blade spacing), and solid-tining (57 mm depth, 6 mm
tine width, 38 by 38 mm spacing) were applied on 2 June, 23 June and
19 July 2010. Weekly grooming was applied every 7 d from 2 June to
11 Aug. 2010.
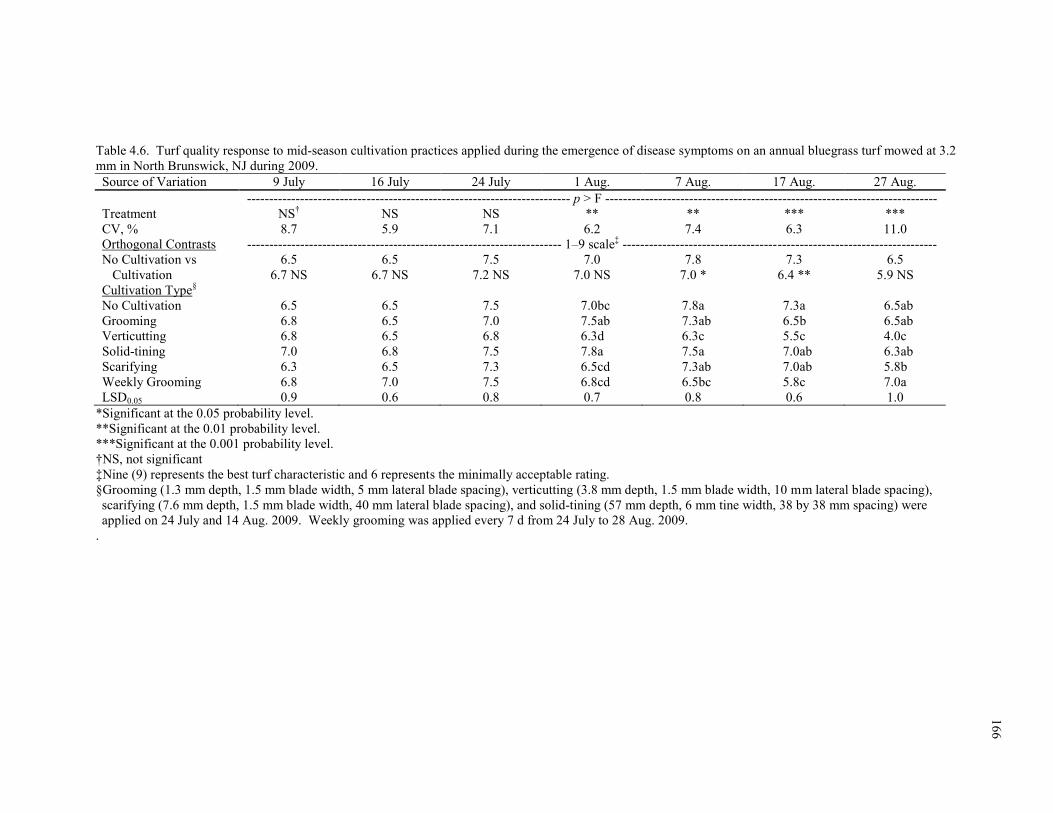
16
6
Table 4.6. Turf quality response to mid-season cultivation practices applied during the emergence of disease symptoms on an annual bluegrass turf mowed at 3.2
mm in North Brunswick, NJ during 2009.
Source of Variation 9 July 16 July 24 July 1 Aug. 7 Aug. 17 Aug. 27 Aug.
------------------------------------------------------------------------- p > F ---------------------------------------------------------------------------
Treatment NS† NS NS ** ** *** ***
CV, % 8.7 5.9 7.1 6.2 7.4 6.3 11.0
Orthogonal Contrasts ----------------------------------------------------------------------- 1–9 scale‡ -----------------------------------------------------------------------
No Cultivation vs 6.5 6.5 7.5 7.0 7.8 7.3 6.5
Cultivation 6.7 NS 6.7 NS 7.2 NS 7.0 NS 7.0 * 6.4 ** 5.9 NS
Cultivation Type§
No Cultivation 6.5 6.5 7.5 7.0bc 7.8a 7.3a 6.5ab
Grooming 6.8 6.5 7.0 7.5ab 7.3ab 6.5b 6.5ab
Verticutting 6.8 6.5 6.8 6.3d 6.3c 5.5c 4.0c
Solid-tining 7.0 6.8 7.5 7.8a 7.5a 7.0ab 6.3ab
Scarifying 6.3 6.5 7.3 6.5cd 7.3ab 7.0ab 5.8b
Weekly Grooming 6.8 7.0 7.5 6.8cd 6.5bc 5.8c 7.0a
LSD0.05 0.9 0.6 0.8 0.7 0.8 0.6 1.0
*Significant at the 0.05 probability level.
**Significant at the 0.01 probability level.
***Significant at the 0.001 probability level.
†NS, not significant
‡Nine (9) represents the best turf characteristic and 6 represents the minimally acceptable rating.
§Grooming (1.3 mm depth, 1.5 mm blade width, 5 mm lateral blade spacing), verticutting (3.8 mm depth, 1.5 mm blade width, 10 mm lateral blade spacing),
scarifying (7.6 mm depth, 1.5 mm blade width, 40 mm lateral blade spacing), and solid-tining (57 mm depth, 6 mm tine width, 38 by 38 mm spacing) were
applied on 24 July and 14 Aug. 2009. Weekly grooming was applied every 7 d from 24 July to 28 Aug. 2009.
.

167
16
7
Table 4.7. Turf quality response to mid-season cultivation practices applied during the
emergence of disease symptoms on an annual bluegrass turf mowed at 3.2 mm in North
Brunswick, NJ during 2010.
Source of Variation 19 May 28 May
---------------------------------- p > F ---------------------------------
Treatment NS† NS
CV, % 11.0 13.5
Orthogonal Contrast ------------------------------- 1–9 scale‡ ------------------------------
No Cultivation vs 5.0 5.0
Cultivation 5.9 * 6.1 *
Cultivation Type§
No Cultivation 5.0 5.0
Grooming 5.8 6.0
Verticutting 6.0 6.0
Solid-tining 6.0 5.8
Scarifying 6.0 6.3
Weekly Grooming 5.8 6.3
LSD0.05 1.0 1.2
*Significant at the 0.05 probability level.
†NS, not significant
‡Nine (9) represents the best turf characteristic and 6 represents the minimally acceptable rating.
§Grooming (1.3 mm depth, 1.5 mm blade width, 5 mm lateral blade spacing), verticutting (3.8
mm depth, 1.5 mm blade width, 10 mm lateral blade spacing), scarifying (7.6 mm depth, 1.5
mm blade width, 40 mm lateral blade spacing), and solid-tining (57 mm depth, 6 mm tine width,
38 by 38 mm spacing) were applied on 2 June, 23 June and 19 July 2010. Weekly grooming
was applied every 7 d from 2 June to 11 Aug. 2010.
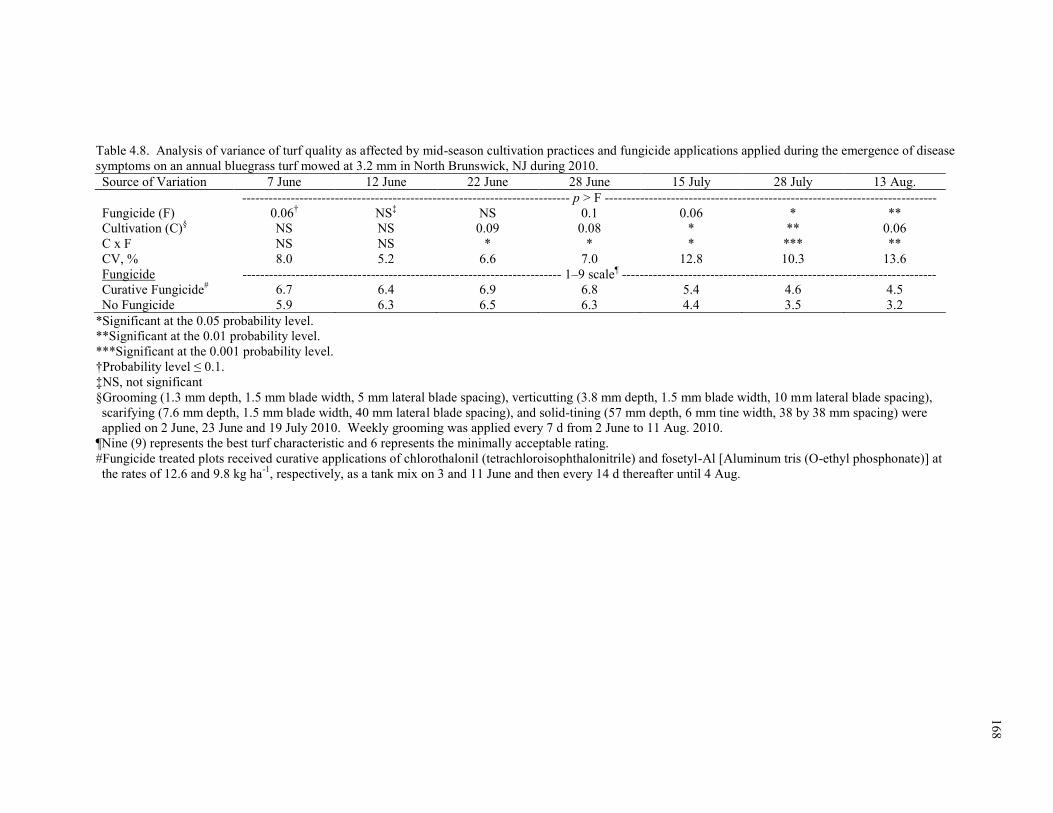
16
8
Table 4.8. Analysis of variance of turf quality as affected by mid-season cultivation practices and fungicide applications applied during the emergence of disease
symptoms on an annual bluegrass turf mowed at 3.2 mm in North Brunswick, NJ during 2010.
Source of Variation 7 June 12 June 22 June 28 June 15 July 28 July 13 Aug.
-------------------------------------------------------------------------- p > F ---------------------------------------------------------------------------
Fungicide (F) 0.06† NS
‡ NS 0.1 0.06 * **
Cultivation (C)§ NS NS 0.09 0.08 * ** 0.06
C x F NS NS * * * *** **
CV, % 8.0 5.2 6.6 7.0 12.8 10.3 13.6
Fungicide ------------------------------------------------------------------------ 1–9 scale¶ -----------------------------------------------------------------------
Curative Fungicide# 6.7 6.4 6.9 6.8 5.4 4.6 4.5
No Fungicide 5.9 6.3 6.5 6.3 4.4 3.5 3.2
*Significant at the 0.05 probability level.
**Significant at the 0.01 probability level.
***Significant at the 0.001 probability level.
†Probability level ≤ 0.1.
‡NS, not significant
§Grooming (1.3 mm depth, 1.5 mm blade width, 5 mm lateral blade spacing), verticutting (3.8 mm depth, 1.5 mm blade width, 10 mm lateral blade spacing),
scarifying (7.6 mm depth, 1.5 mm blade width, 40 mm lateral blade spacing), and solid-tining (57 mm depth, 6 mm tine width, 38 by 38 mm spacing) were
applied on 2 June, 23 June and 19 July 2010. Weekly grooming was applied every 7 d from 2 June to 11 Aug. 2010.
¶Nine (9) represents the best turf characteristic and 6 represents the minimally acceptable rating.
#Fungicide treated plots received curative applications of chlorothalonil (tetrachloroisophthalonitrile) and fosetyl-Al [Aluminum tris (O-ethyl phosphonate)] at
the rates of 12.6 and 9.8 kg ha-1
, respectively, as a tank mix on 3 and 11 June and then every 14 d thereafter until 4 Aug.
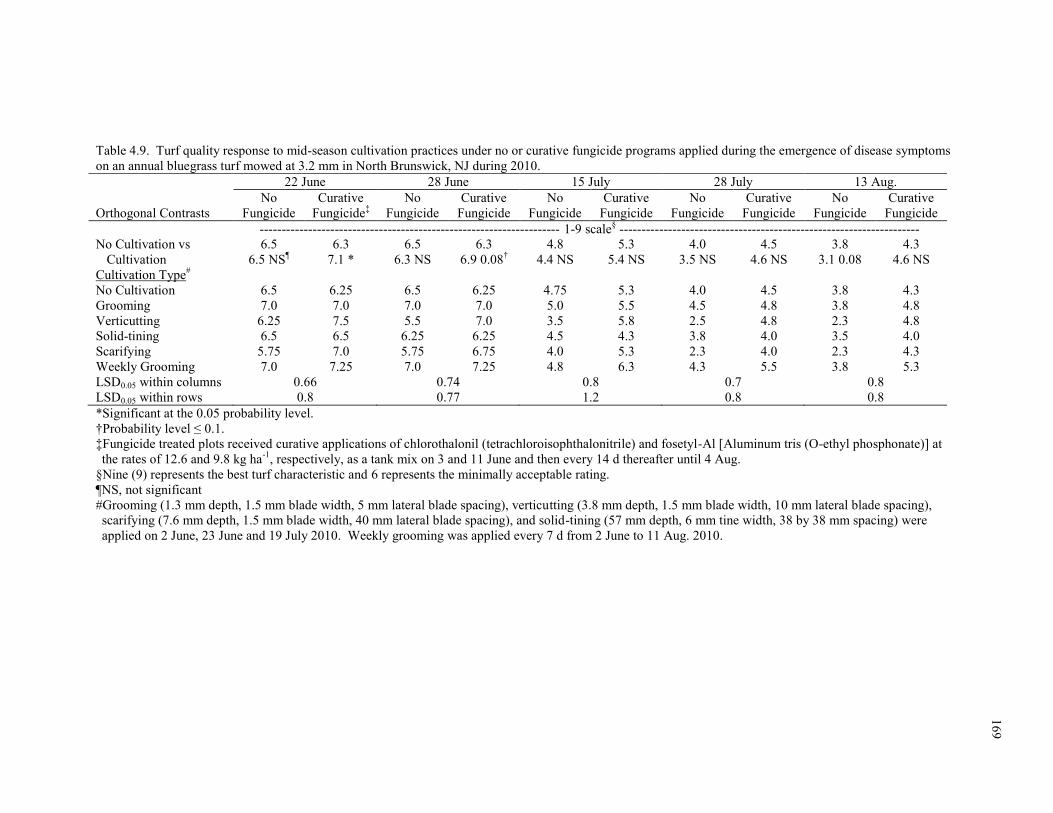
16
9
Table 4.9. Turf quality response to mid-season cultivation practices under no or curative fungicide programs applied during the emergence of disease symptoms
on an annual bluegrass turf mowed at 3.2 mm in North Brunswick, NJ during 2010.
22 June 28 June 15 July 28 July 13 Aug.
No Curative No Curative No Curative No Curative No Curative
Orthogonal Contrasts Fungicide Fungicide‡ Fungicide Fungicide Fungicide Fungicide Fungicide Fungicide Fungicide Fungicide
-------------------------------------------------------------------- 1-9 scale
§ --------------------------------------------------------------------
No Cultivation vs 6.5 6.3 6.5 6.3 4.8 5.3 4.0 4.5 3.8 4.3
Cultivation 6.5 NS¶ 7.1 * 6.3 NS 6.9 0.08
† 4.4 NS 5.4 NS 3.5 NS 4.6 NS 3.1 0.08 4.6 NS
Cultivation Type#
No Cultivation 6.5 6.25 6.5 6.25 4.75 5.3 4.0 4.5 3.8 4.3
Grooming 7.0 7.0 7.0 7.0 5.0 5.5 4.5 4.8 3.8 4.8
Verticutting 6.25 7.5 5.5 7.0 3.5 5.8 2.5 4.8 2.3 4.8
Solid-tining 6.5 6.5 6.25 6.25 4.5 4.3 3.8 4.0 3.5 4.0
Scarifying 5.75 7.0 5.75 6.75 4.0 5.3 2.3 4.0 2.3 4.3
Weekly Grooming 7.0 7.25 7.0 7.25 4.8 6.3 4.3 5.5 3.8 5.3
LSD0.05 within columns 0.66 0.74 0.8 0.7 0.8
LSD0.05 within rows 0.8 0.77 1.2 0.8 0.8
*Significant at the 0.05 probability level.
†Probability level ≤ 0.1.
‡Fungicide treated plots received curative applications of chlorothalonil (tetrachloroisophthalonitrile) and fosetyl-Al [Aluminum tris (O-ethyl phosphonate)] at
the rates of 12.6 and 9.8 kg ha-1
, respectively, as a tank mix on 3 and 11 June and then every 14 d thereafter until 4 Aug.
§Nine (9) represents the best turf characteristic and 6 represents the minimally acceptable rating.
¶NS, not significant
#Grooming (1.3 mm depth, 1.5 mm blade width, 5 mm lateral blade spacing), verticutting (3.8 mm depth, 1.5 mm blade width, 10 mm lateral blade spacing),
scarifying (7.6 mm depth, 1.5 mm blade width, 40 mm lateral blade spacing), and solid-tining (57 mm depth, 6 mm tine width, 38 by 38 mm spacing) were
applied on 2 June, 23 June and 19 July 2010. Weekly grooming was applied every 7 d from 2 June to 11 Aug. 2010.
170
CHAPTER 5. Vertical Cutting Depth Effects on Anthracnose Severity of Annual
Bluegrass Putting Green Turf
ABSTRACT
Wounding of annual bluegrass [Poa annua L. f. reptans (Hausskn) T. Koyama]
(ABG) turf has produced varying responses to anthracnose disease (caused by the fungus
Colletotrichum cereale Manns sensu lato Crouch, Clarke, and Hillman). A field study
was conducted to evaluate the effect of vertical cutting depth on anthracnose severity of
ABG turf mowed at 3.2-mm in North Brunswick, NJ. Treatments included vertical
cutting (VC) to 1.3- and 7.6-mm depths, shallow and deep, respectively. An untreated
control was also included. Treatments were applied once at the initiation of each of three
trial runs on 23 July 2010, 6 July 2011 and 3 Aug. 2011 using a VC reel having 1.5-mm
wide blades spaced 40 mm laterally. Treatments were arranged in a RCBD with ten
replications. Disease was assessed at intervals no greater than 5-d apart at the same 10
positions along each of three 25-cm transects for a total of 30 observations within each
plot. The three transects were established directly over VC channels in treated plots and
randomly positioned over turf in the untreated plots. Deep VC produced a 4% increase in
disease relative to the control and a 5% increase in disease severity relative to shallow
VC on 2 of 32 observation dates in 2010 and 2011. Shallow VC produced small,
marginally significant reductions in disease severity on 1 to 3 rating dates per trial run (5
of 32 total rating dates). The subtle, short-lived increases caused by deep VC during one
trial run indicated that deep VC may play a minor role in enhancing disease development;
whereas, shallow VC appears to either have no effect or slightly reduce disease severity.
171
17
1
INTRODUCTION
Anthracnose of annual bluegrass [Poa annua L. forma reptans (Hausskn.) T.
Koyama] (ABG) is caused by the fungus Colletotrichum cereale Manns sensu lato
Crouch, Clarke, and Hillman (Crouch et al., 2006). Symptoms of infected turf appear as
either a foliar blight, which occurs during hot, humid summer periods of mid-summer or
a basal rot that can occur year-round (Smiley et al., 2005). The disease thins turf and
causes severe losses to ABG putting greens in temperate climates throughout the United
States, Canada, Western Europe, South America, Southeast Asia, New Zealand, and
Australia (Crouch and Beirn, 2009).
Stressful conditions can increase susceptibility of ABG putting greens to infection
by C. cereale (Smiley et al., 2005). Increased occurrence and severity of the disease
during the last two decades have been directly linked to management practices that
increase putting green playability (ball roll distance or “green speed”) but decrease plant
vigor, such as low mowing height, low N fertility, and limited irrigation (Inguagiato et
al., 2008; Inguagiato et al., 2009; Roberts et al., 2011).
Vertical cutting (VC) is a cultivation practice that involves slicing into a turf
surface for the purpose of removing excess thatch, controlling turf grain and reducing
canopy biomass (Beard and Beard, 2005). This practice can be performed with a variety
of mechanical devices equipped with vertically rotating blades that cut into a turf surface
at varying depths (0 to 40 mm), blade spacings (5 to 40 mm), and blade thicknesses (1 to
3 mm) (Landreth et al., 2008; Lockyer, 2009; Moore, 2005). Vertical cutting to a shallow
depth is often performed to create a smoother putting surface by reducing puffiness
caused by the high shoot density of ABG (Vargas and Turgeon, 2004). Shallow VC is

172
also used for thatch removal, particularly when combined with sand topdressing (Beard,
2002; Christians, 2011; Gaussoin et al., 2013). Deep VC can be used to prepare turf
surfaces for renovation, remove thatch, and alleviate compaction of the surface soil
(Beard, 2002; Turgeon, 2011). Research suggests that deep VC is the most effective
option for thatch removal if the target area is within the first 40 mm depth of the surface
(Landreth et al., 2008; Lockyer, 2009).
Excess thatch accumulation and poor soil conditions predispose turf to disease
(Beard, 1973; Smiley et al., 2005). Thus, cultivation practices such as VC are often
recommended for disease management (Smiley et al., 2005). A combination of aeration
plus VC (7 mm depth) performed twice each year was moderately effective in reducing
spring dead spot (caused by Ophiosphaerella herpotricha (Fr.:Fr.) J. Walker) of
‘Midlawn’ bermudagrass turf [Cynodon dactylon (L.) Pers. X C. transvaalensis Burtt-
Davy] maintained at a 13 mm mowing height (Tisserat and Fry, 1997). Mechanical
thatch removal by VC (unknown depth) reduced dollar spot disease (caused by
Sclerotinia homoeocarpa F.T. Bennett) of ‘Merion’ Kentucky bluegrass (Poa pratensis
L.) turf maintained at 38 mm (Halisky et al., 1981). However, VC can also create
wounds and enhance plant stress, both of which are thought to facilitate pathogen
invasion (Agrios, 2005; Smiley et al., 2005). Dollar spot was increased by coring and
VC to a depth just above the soil surface on ‘Tifway’ bermudagrass turf maintained at 19
mm (Carrow et al., 1987). Vertical cutting (2 mm depth) also increased dollar spot in
‘Tifeagle’ bermudagrass maintained at 2.8 or 3.6 mm (Unruh et al., 2005). In a
laboratory study, dollar spot developed more rapidly in wounded leaves of creeping
bentgrass (Agrostis stolonifera L.) than unwounded leaves (Orshinsky et al., 2012).

173
Work on the effect of VC on anthracnose has produced conflicting results.
Biweekly VC (3 mm depth) of an ABG maintained at 3.2 mm had little effect on
anthracnose severity; however, on one rating date, VC increased disease when applied to
plots treated with the plant growth regulators trinexapac-ethyl or mefluidide or decreased
disease when applied to plots treated with low N fertility (Inguagiato et al., 2008). Spring
or autumn VC (unknown depth) applied alone or in conjunction with coring did not affect
anthracnose of ABG fairway turf (Burpee and Goulty, 1984). Conversely, increased
depth (0, 3.3 and 5.1 mm) of weekly VC caused a linear increase in anthracnose severity
of a mixed stand ABG and creeping bentgrass turf inoculated with C. cereale and
maintained at 2.0, 3.0 and 4.3 mm mowing heights (Uddin et al., 2008).
Although wounding is not required for C. cereale to infect ABG tissue (Bruehl
and Dickson, 1950; Smith, 1954), results from a greenhouse experiment showed that
wounding (puncture or abrasion) of ABG crown tissue immediately prior to inoculation
resulted in more rapid disease development of anthracnose basal rot symptoms compared
to unwounded, inoculated ABG plants (Landschoot and Hoyland, 1995). Similarly,
inoculation of wounded maize (Zea mays L.) tissue with the closely related pathogen C.
graminicola resulted in more rapid and efficient anthracnose disease development
compared to unwounded, inoculated maize tissue (Venard and Vaillancourt, 2007). In
contrast, disease did not develop any faster when wounds were made to ABG leaf tissue
prior to inoculation by C. cereale (Landschoot and Hoyland, 1995). Therefore,
researchers have suggested that VC to a depth that injures crown tissue may increase
disease severity; whereas, shallow VC should not influence disease because it only
affects leaf tissue (Inguagiato et al., 2008). However, no field studies examining VC

174
depth alone have tested this hypothesis. Therefore, the objective of this study was to
evaluate the effect of depth of VC on anthracnose severity of ABG putting green turf.
175
MATERIALS AND METHODS
Experimental Design and Treatments
This field research study was conducted in one location in 2010 and repeated
twice in different locations in 2011 at Horticultural Farm No. 2 in North Brunswick, NJ
(40°28’ N, 74°25’ W). The experimental area was an established greens-type ABG turf
grown on a sand topdressing layer (50 to 60 mm deep) overlaying a Nixon sandy loam
(fine-loamy, mixed, semiactive, mesic Typic Hapludults, in some areas altered to fine-
loamy, mixed, semiactive, mesic Ultic Udarents). Treatments were arranged in a
randomized complete block design with ten replications. Plots were 0.5 by 1.5 m in size.
Treatments included a control, shallow VC (1.3 mm depth), and deep VC (7.6 mm
depth). Vertical cutting was applied once per trial run (23 July 2010, 6 July 2011 and 3
Aug 2011) between 1300 and 1600 hr when the turf canopy was dry using one gang of a
triplex mower (model 3150, Toro Co., Bloomington, MN). The gang was a specialized
reel-chassis (model TA3TORO Thatch-Away Supa-System, Turfline Inc., Moscow Mills,
MO) equipped with a reel-cassette (model TA3CAS SCATORO, Turfline Inc., Moscow
Mills, MO) that had 1.5 mm wide blades spaced 40 mm laterally and a total working
width of 455 mm. Disease severity averaged 5% of the trial area infested with C. cereale
when treatments were applied during the first and second trial runs and 27% during the
third trial run.
Field Maintenance
Mowing was performed 6 times wk-1
with a triplex greens mower (model 3150,
Toro Co., Bloomington,, MN) set at a bench mowing height setting of 3.2 mm and
clippings were removed. Soil water content was maintained similar to a golf course

176
putting green (moderately-dry conditions) by applying irrigation to avoid wilt stress and
water-in fertilizer. Topdressing (medium-coarse, subangular silica sand; “310” U.S.
Silica, Co., Mauricetown, NJ) was applied biweekly at 0.18 L m-2
and incorporated with a
cocoa mat drag (Ace Equipment and Supply Co., Henderson, CO) from April to Oct. in
2010 and May to Oct. 2011. Before treatments were initiated, N was applied at 53.7,
29.3, and 48.8 kg ha-1
from 12 Apr to 7 July 2010, 8 Apr. to 3 June 2011, and 8 Apr. to
25 July 2011 for trial runs 1, 2, and 3, respectively. Biweekly applications at 4.9 kg ha-1
of N totaled 14.7, 19.5, and 9.8 kg ha-1
for trial runs 1, 2, and 3, respectively, during the
period that disease evaluations were performed. After disease observations ended, N was
applied at 169, 107, and 119 kg ha-1
from 6 Sept. to 12 Nov. 2010, 13 Aug. to 14 Oct.
2011, and 3 Sept. to 14 Oct. 2011 at the end of trial runs 1, 2, and 3, respectively.
Phosphorus was applied at 53.8, 6.4, and 4.3 kg ha-1
and K was applied at 45.2, 41.0, and
106.7 kg ha-1
during late-summer or early-autumn for trial runs 1, 2, and 3, respectively,
based on soil test results. Plant growth regulators were applied similar to golf course
practices: ethephon [(2-chloroethyl) phosphonic acid] was applied at 3.81 kg a.i. ha-1
on
19 Mar., 2 Apr., and 23 April 2010 and 22 Mar., and 6 and 20 Apr. 2011 to regulate ABG
inflorescence expression and trinexapac-ethyl [4-(cyclopropyl-α-hydroxy-methylene)-
3,5-dioxocyclohexanecarboxylic acid ethylester)] was applied biweekly at 0.05 kg a.i. ha-
1 from 19 Mar. to 2 Oct. 2010 and 22 Mar. to 26 Oct. 2011 to regulate vegetative growth.
Biweekly applications of the fungicides boscalid {3-pyridinecarboximide, 2-
chloro-N-[4’chloro(1,1’-biphenyl)yl]} at 0.38 kg a.i. ha-1
or vinclozolin [3-(3,5-
dichlorophenyl)-5-ethenyl-5-methyl-2,4-oxazolidinedione] at 1.52 kg a.i. ha-1
were made
to preventatively control dollar spot disease from 14 May to 28 Aug. 2010 and 14 Apr. to

177
1 Sept. 2011. Patch diseases caused by Magnaporthe poae Landschoot & Jackson and
Rhizoctonia solani Kühn were controlled using a biweekly rotation of the fungicides
azoxystrobin (Methyl(E)-2-{2-[6-(2-cyanophenoxy)pyrimidin-4-yloxy]phenyl}-3-
methoxyacrylate)} at 0.61 kg a.i. ha-1
, flutolanil {N-[3-(1-methylethoxy)phenyl]-2-
(trifluoromethyl)benzamide} at 6.41 kg a.i. ha-1
, and fluoxastrobin [(1E)-[2-[[6-(2-
Chlorophenoxy)-5-fluoro-4-pyrimidinyl]oxy]phenyl](5,6-dihydro-1,4,2-dioxazin-3-yl)
methanone-O-methyloxime] at 0.55 kg a.i. ha-1
from 25 Mar to 28 Aug 2010 and 6 May
to 1 Sept. 2011. These fungicides have not been shown to affect anthracnose isolates
from this research location (Towers et al., 2003). Chlorothalonil
(tetrachloroisophthalonitrile) was applied at 12.6 kg a.i. ha-1
to arrest anthracnose disease
progress at the end of trial runs 1, 2, and 3 on 18 Sept. 2010, 6 Aug. 2011, and 21 Sept.
2011, respectively. Annual bluegrass weevils [Listronotus maculicollis (Kirby)] were
controlled with the insecticide chlorantraniliprole (3-Bromo-N-[4-chloro-2-methyl-6-
[(methylamino)carbonyl]phenyl]-1-(3-chloro-2-pyridinyl)-1H-pyrazole-5-carboxamide)
applied at 0.18 kg a.i. ha-1
on 30 April 2010 and 3 May 2011. Algal growth was
suppressed as needed using mancozeb (ethylenebisdithiocarbamate) applied at rates
ranging from 20.1 to 30.5 kg a.i. ha-1
during 2010. Creeping bentgrass was controlled
with fluazifop-P-butyl {Butyl (R)-2-[4-[[5-(trifluoromethyl)-2-
pyridinyl]oxy]phenoxy]propanoate} applied at 0.21 kg a.i. ha-1
on 20 Sept. 2010.
Data Collection and Analysis
Anthracnose severity was evaluated every 0 to 5 d after VC was applied from 23
July to 31 Aug. 2010, 6 July to 1 Aug. 2011, and 4 Aug. to 2 Sept. 2011 for trial runs 1,
2, and 3, respectively. Disease development was monitored at 10 positions along each of
178
three 25 cm transects within each plot (30 observations per plot). Transects directly
overlaid the VC channels of treated plots and were randomly positioned over turf in non-
scarified plots. Ends of each transect were marked so that disease observations could be
performed at the same transect-positions (every 2.5 cm) by aligning the ends of a
measuring ruler with the ends of the transect. A count of transect-positions where
acervuli were present on ABG leaf, stolon or crown tissue was recorded for each plot and
transformed to a percentage using the following equation:
(n/30) x 100;
where n represented the count of transect positions that contained acervuli.
Turfgrass quality was assessed during the second and third runs of the trial on a 1 to 9
scale where 9 represented the best quality and 6 was the minimally acceptable rating.
Turf density, turf uniformity, turf color, anthracnose disease severity, and the healing of
VC channels were considered when turf quality was evaluated. Data were subjected to
analysis of variance using the General Linear Model procedure (PROC GLM) in the
Statistical Analysis System software v. 9.3 (SAS Institute, Cary, NC). Means were
separated using Fisher’s protected least significant difference at the 0.05 probability
level.
179
17
9
RESULTS
Anthracnose Severity
Anthracnose severity was low (≤ 8%) for the first three rating dates during trial
run 1 (Table 5.1 and Fig. 5.1). The disease progressed steadily until reaching peak levels
(57 to 58%) on 31 Aug. 2010. Disease severity was similarly low (≤ 8%) during the first
three rating dates of trial run 2; higher peak levels (66 to 71%) were reached during late-
Aug. (Table 5.2 and Fig. 5.2). Trial run 3 was initiated when disease severity was
moderate (23 to 31%) (Table 5.3 and Fig. 5.3). However, disease severity did not change
greatly throughout the duration of trial run 3, and peak levels reached only 27 to 34% by
2 Sept. 2011.
Deep VC slightly increased (4%) disease severity compared to shallow VC and
the control on 31 July 2010 (8 d after VC was applied); however, the effect was no longer
apparent on 3 Aug. 2010 (Table 5.1 and Fig. 5.1). Deep VC increased disease (5%)
compared to shallow VC on 7 Aug. 2010, but neither VC treatment was different than the
control. In contrast, shallow VC produced a marginally significant (pr > F = 0.08)
disease reduction (5%) compared to the control on 11 Aug., which continued as a non-
significant trend until 20 Aug. 2010.
Deep VC did not affect disease severity on any of the 13 rating dates during trial
run 2; whereas, shallow VC produced a marginally significant (pr > F = 0.09) reduction
(4%) in disease severity compared to no VC on 8 July 2011, and a similar but non-
significant response was apparent on 14 July, 16 July, and 1 Aug. 2011 (Table 5.2 and
Fig. 5.2).
180
Similarly, deep VC had no effect on disease severity during trial run 3. However,
shallow VC produced a marginally significant (pr > F = 0.08, 0.09, and 0.06) disease
reduction compared to no VC on 4, 15 and 17 Aug. 2011, respectively, which appeared
as a non-significant trend on all other rating dates during this trial run. (Table 5.3 and Fig.
5.3)
Turf Quality
In general, the control and shallow VC treatments had acceptable turf quality (≤
6) on all dates; whereas, the surface disruption caused by deep VC produced
unacceptable turf quality for 12 to 3 d after VC during trial runs 2 and 3, respectively
(Tables 5.4 and 5.5).
Deep VC reduced turf quality compared to all other treatments from 6 to 22 July
and on 27 July 2011 during trial run 2 (Table 5.4). Shallow VC immediately decreased
turf quality compared to the control on 6 July 2011 (0 d after VC); however, these plots
were not different than the control for remainder of trial run 2. Turf quality was not
affected by VC on 24 July or 1 Aug. 2011.
Deep VC plots had lower turf quality than other treatments from 4 to 8 Aug. 2011
during trial run 3 and continued to have marginally significant (pr > F = 0.06 and 0.09)
lower turf quality compared to the control on 11 and 15 Aug 2011 (Table 5.5). This
effect was also evident when deep VC plots had lower turf quality compared to all other
treatments on 25 Aug. and 2 Sept. 2011 (pr > F = 0.06), respectively. Shallow VC
briefly reduced turf quality compared to the control for 1 and 3 d after VC was applied on
3 Aug. 2011 during trial run 3.
181
18
1
DISCUSSION
The results of this study indicated that VC depth may play a role in disease
development, albeit subtle and inconsistent. Additionally, deep and shallow VC appeared
to have contrasting effects. Deep VC (7.6 mm) produced small, transitory increases in
disease severity (4 to 5%) compared to other treatments on 2 of 10 rating dates during the
first trial-run but did not affect disease severity on any of the remaining 22 rating dates
during the second and third trial-runs; whereas, shallow VC (1.3 mm) appeared to
occasionally reduce anthracnose severity in our study. Uddin et al. (2008) reported that
5.1 mm deep VC increased anthracnose disease severity more than 3.3 mm deep VC. In
the greenhouse, anthracnose basal rot developed in inoculated ABG tillers that were
wounded at the crown, but not in those tillers wounded above the crown (Landschoot and
Hoyland, 1995). Thus, Inguagiato et al. (2008) hypothesized that deep VC may increase
anthracnose severity because it wounds crowns; whereas, shallow VC may not because
only leaf and sheath tissues are wounded.
Increased disease severity caused by crown wounding may be due to the location
and function of crown tissue in ABG plants. Environmental conditions are probably
more favorable for anthracnose disease development near the crown due to the humid and
shaded microenvironment produced by the upper turf canopy (Smiley et al., 2005).
Additionally, more inoculum may be present near the crown due to the persistence of C.
cereale on decayed plant debris in thatch (Crouch and Beirn, 2009; Settle et al., 2006).
Crowns are the major meristematic organ of grass plants. Infestation of crown tissue by
C. cereale may cause greater reductions in plant vigor than infection of leaf tissue due to
the vital role that crown tissue plays in the tiller, stem and root vascular systems of ABG
182
(Beard, 1973). Upon ingress of ABG crown tissue, C. cereale can produce secondary
hyphae which enter vascular tissue, cut off nutrient supply and, ultimately, kill the plant
(Smith, 1954; Smith et al., 1989).
Recent research has shown that the hemibiotroph C. graminicola switched from a
biotrophic phase to a necrotrophic phase when plant defense responses were synthesizing
reactive oxygen species (ROS) and abscisic acid (ABA) at peak levels in maize (Zea
mays L.) (Vargas et al., 2012). Mechanical wounding causes plant responses similar to
pathogen invasion, including the upregulation of ROS and ABA synthesis (Bostock and
Stermer, 1989). Therefore, plant responses to wounding caused by deep VC may trigger
C. cereale to switch from a nonlethal, biotrophic relationship to a destructive
necrotrophic phase within the ABG plant. Transciptomic, histological and biochemical
studies are needed to test this hypothesis.
Shallow VC in the current study was less likely to wound crowns and did not
increase anthracnose severity similar to the findings of Inguagiato et al. (2008).
Surprisingly, shallow VC reduced (p ≤ 0.1) disease severity on 5 of 32 disease
assessments during the current study. The removal of canopy biomass by shallow VC
may have increased airflow and decreased wetness and humidity in the turf canopy
ultimately causing conditions to be less conducive for disease development. Shallow VC
may also have stimulated new shoot growth (Schery, 1966), which possibly improved
plant vigor and made ABG less susceptible to C. cereale. Furthermore, the healing of
wounds caused by shallow VC may have increased ABG resistance to infection by C.
cereale. Wound healing in maize and chili pepper (Capsicum annuum cv. Nokkwang)
provided resistance to infection by C. graminicola and C. acutatum, respectively; disease
183
severity of wounded plants was not increased when inoculation occurred immediately
after re-wounding (Kim, 2008; Muimba-Kankolongo and Bergstrom, 1990). Wound
healing in maize is thought to involve the synthesis of defense chemicals and a heavily
lignified papillum that hinder ingress by C. graminicola (Bergstrom and Nicholson,
1999; Mims and Vaillancourt, 2002). Similar responses confer host resistance to fungal
invasion in several other pathosystems (Bostock and Stermer, 1989; Lipetz, 1970).
Vertical cutting produced contrasting results among the current and previous
studies, which was not unexpected due to differences in methodology. Our results and
those reported by Inguagiato et al. (2008) indicated that shallow VC to a depth that was
not likely to injure crowns usually did not enhance anthracnose disease severity; whereas,
Uddin et al. (2008) reported that VC to a depth of 3.3 mm increased disease severity even
when the height of cut was 4.3 mm and crowns were less likely to be injured. Such
increases in the severity of anthracnose may be attributed to the greater frequency (every
7 d) of VC used by Uddin et al. (2008) compared to the single application of VC made by
the current authors and biweekly VC by Inguagiato et al. (2008). Additionally, the blade
width and blade spacing on the VC equipment used by Uddin et al. (2008) caused 16% of
the turf surface area to be affected by VC; whereas, the VC equipment used in the current
study and in the study conducted by Inguagiato et al. (2008) affected 4 and 8% of the turf
surface, respectively. Increased VC frequency and increased turf area affected by VC
probably resulted in more extensive defoliation of plants, which may have increased
stress and predisposed plants to anthracnose. Maize anthracnose severity was increased
when plants were defoliated (Dodd, 1980; Mortimore and Ward, 1964), and low mowing
(i.e., increased defoliation) of ABG can also increase disease severity (Backman et al.,

184
2002; Inguagiato et al., 2009). Moreover, the shallow VC (3.3 mm deep) treatment used
by Uddin et al. (2008) was applied to heights of cut (2.0 and 3.0 mm) that were less than
the depth of VC, probably wounding crowns in addition to leaves and sheaths.
Wounding cannot make plants more susceptible to disease unless a virulent
pathogen and conducive environmental conditions are present (Agrios, 2005). Plots in
the study of Uddin et al. (2008) were inoculated with C. cereale only hours after VC
treatments (Michael Soika, personal communication) and VC increased disease severity
on 100% of rating dates. However, on uninoculated turf in the current study or when
inoculation was delayed 7 d after VC treatments (Inguagiato et al., 2008), disease severity
was increased by VC on only 6 and 8% of rating dates, respectively. In the greenhouse,
anthracnose basal rot was increased when wounded crowns of ABG tillers were
inoculated with C. cereale (reported as C. graminicola) up to 12 h after wounding
(Hoyland and Landschoot, 1994). Similarly, inoculating potato (Solanum tuberosum L.)
plants on the same day of wounding significantly increased infection by C. coccodes
(Wallr.) S. J. Hughes (causal agent of black dot of potato); however, delaying inoculation
by 3 d resulted in similar levels of disease in wounded and unwounded tissue (Johnson
and Miliczky, 1993). When inoculation of wounded of maize stalks with C. graminicola
was delayed by as little as 1 to 2 h, wounded tissue was almost as tolerant of anthracnose
stalk rot as unwounded tissue (Muimba-Kankolongo and Bergstrom, 1990). Therefore, a
lack or low level of inoculum at the time of VC or shortly thereafter in the current study
may explain why crown wounding caused by deep VC did not consistently increase
disease severity.

185
Anthracnose epidemics on maize and turf are commonly associated with periods
of high temperature, high humidity and prolonged leaf wetness; spore formation and
transport is also enhanced during wet conditions (Bergstrom and Nicholson, 1999;
Danneberger et al., 1984; Vargas et al., 1992). Vertical cutting in the current study was
performed when the turf canopy was dry, as commonly practiced (Beard, 2002). Thus,
the timing of VC treatments during our study probably occurred when environmental
conditions were not extremely conducive for infection by C. cereale.
In summary, our findings that deep VC slightly increased disease severity on few
rating dates and shallow VC, which wounded mostly leaves, produced subtle reductions
in disease severity suggest that VC depth may be a factor that influences anthracnose
disease development. It is plausible that environmental conditions controlling disease
development and the abundance of viable C. cereale inoculum at the time of VC may be
determining factors in the likelihood for deep VC to increase disease severity. Therefore,
VC should not be performed at depths that injure crowns when disease pressure is high.
Moreover, timing of deep VC should coincide with periods of low temperature, low
humidity and adequate sunlight whenever possible to avoid the risk of increasing disease
severity. Shallow VC appears to not exacerbate anthracnose disease probably because it
causes less stress to ABG and less exposure to inoculum and microenvironments
favorable for infection by C. cereale.

186
18
6
REFERENCES
Agrios, G.N. 2005. Plant Pathology. Elsevier Inc., San Diego, CA.
Backman, P., G. Stahnke, and E. Miltner. 2002. Anthracnose update: Cultural practices
affect spread of disease in northwest. Turfgrass Trends 11:T1-T2, T4.
Beard, J.B. 1973. Turfgrass: Science and culture. Prentice Hall, Englewood Cliffs, NJ.
Beard, J.B. 2002. Turf management for golf courses. 2nd ed. Ann Arbor Press, Chelsea,
MI.
Beard, J.B., and H.J. Beard. 2005. Beard's turfgrass encyclopedia for golf courses,
grounds, lawns, sports fields. Michigan State Univ. Press, East Lansing, MI.
Bergstrom, G.C., and R.L. Nicholson. 1999. The biology of corn anthracnose: knowledge
to exploit for improved management. Plant Dis. 83(7):596-608.
Bostock, R.M., and B.A. Stermer. 1989. Perspectives on Wound Healing in Resistance to
Pathogens. Annu. Rev. Phytopathol. 27(1):343-371. DOI:
doi:10.1146/annurev.py.27.090189.002015.
Bruehl, G.W., and J.G. Dickson. 1950. Anthracnose of cereals and grasses. USDA Tech.
Bull. 1005:1-37.
Burpee, L.L., and L.G. Goulty. 1984. Influence of cultivation practices and fungicides on
the development of anthracnose in a golf course fairway. Univ. of Guelph
Turfgrass Res. Rep.:8-10.
Carrow, R.N., B.J. Johnson, and R.E. Burns. 1987. Thatch and Quality of Tifway
Bermudagrass Turf in Relation to Fertility and Cultivation. Agron. J. 79(3):524-
530. DOI: 10.2134/agronj1987.00021962007900030025x.
Christians, N. 2011. Fundamentals of turfgrass management. John Wiley & Sons, Inc.,
Hoboken, NJ.
187
Crouch, J.A., and L.A. Beirn. 2009. Anthracnose of cereals and grasses. Fungal Diversity
39:19.
Crouch, J.A., B.B. Clarke, and B.I. Hillman. 2006. Unraveling Evolutionary
Relationships Among the Divergent Lineages of Colletotrichum Causing
Anthracnose Disease in Turfgrass and Corn. Phytopathology 96(1):46-60. DOI:
10.1094/PHYTO-96-0046.
Danneberger, T., J. Vargas Jr, and A. Jones. 1984. A model for weather-based forecasting
of anthracnose on annual bluegrass. Phytopathology 74(4):448-451.
Dodd, J.L. 1980. Grain sink size and predisposition of Zea mays to stalk rot.
Phytopathology 70:534-535.
Gaussoin, R.E., W.L. Berndt, C.A. Dockrell, and R.A. Drijber. 2013. Characterization,
development, and management of organic matter in turfgrass systems, In: J. C.
Stier, Horgan, Brian P., Bonos, Stacy A., and Schmitt, Gail K. (Ed.), Turfgrass:
Biology, Use, and Management, ASA, CSSA, & SSSA Inc., Madison, WI. pp.
1328.
Halisky, P.M., R.F. Myers, and R.E. Wagner. 1981. Relationship of thatch to nematodes,
dollar spot and fungicides in Kentucky bluegrass turf. Proc. Int. Turf. Res. Conf.
4:415-420.
Hoyland, B.F., and P.J. Landschoot. 1994. Wound predisposition of Poa annua to
anthracnose basal rot. ASA-CSSA-SSSA Annu. Meet., Seattle, WA, Agron.
Abstr. 86:183.
Inguagiato, J.C., J.A. Murphy, and B.B. Clarke. 2008. Anthracnose Severity on Annual
Bluegrass Influenced by Nitrogen Fertilization, Growth Regulators, and
Verticutting. Crop Sci. 48(4):1595-1607. DOI: 10.2135/cropsci2007.06.0343.
Inguagiato, J.C., J.A. Murphy, and B.B. Clarke. 2009. Anthracnose Disease and Annual
Bluegrass Putting Green Performance Affected by Mowing Practices and
Lightweight Rolling. Crop Sci. 49(4):1454-1462. DOI:
10.2135/cropsci2008.07.0435.
Johnson, D.A., and E.R. Miliczky. 1993. Effects of wounding and wetting duration on
infection of potato foliage by Colletotrichum coccodes. Plant Dis. 77(1):13-17.
188
Kim, Y.H. 2008. Effect of delayed inoculation after wounding on the development of
anthracnose disease caused by Colletotrichum acutatum on chili pepper fruit. The
Plant Pathol. J. 24(4):392-399.
Landreth, J., D. Karcher, and M. Richardson. 2008. Cultivating to manage organic matter
in sand-based putting greens: University of Arkansas researchers provide
important insight for managing organic buildup on putting greens. U.S. Golf
Assoc. Green Section Record 46(1):16-19.
Landschoot, P., and B. Hoyland. 1995. Shedding some light on anthracnose basal rot.
Golf Course Manage 11:52-55.
Lipetz, J. 1970. Wound healing in higher plants. Int. Rev. Cytol 27(1):1-28.
Lockyer, J. 2009. Successful fine turf organic matter management. Int. Turfgrass Bull.
244:9-11.
Mims, C.W., and L.J. Vaillancourt. 2002. Ultrastructural characterization of infection and
colonization of maize leaves by Colletotrichum graminicola, and by a C.
graminicola pathogenicity mutant. Phytopathology 92(7):803-812.
Moore, D. 2005. The supa greens maintenance cassette system. Int. Turfgrass Bull.
228:21, 23.
Mortimore, C.G., and G.M. Ward. 1964. Root and stalk rot of corn in southwestern
Ontario: III. sugar levels as a measure of plant vigor and resistance. Can. J. Plant
Sci. 44:451-457.
Muimba-Kankolongo, A., and G.C. Bergstrom. 1990. Transitory wound predisposition of
maize to Anthracnose stalk rot. Can. J. Plant Pathol. 12(1):1-10.
Orshinsky, A.M., M.J. Boehm, and G.J. Boland. 2012. Plant wounding and Ophiostoma
mitovirus 3a (OMV3a) influence infection of creeping bentgrass by Sclerotinia
homoeocarpa. Can. J. Plant Pathol. 34:493.
Roberts, J.A., J.C. Inguagiato, B.B. Clarke, and J.A. Murphy. 2011. Irrigation Quantity
Effects on Anthracnose Disease of Annual Bluegrass. Crop Sci. 51(3):1244-1252.
DOI: 10.2135/cropsci2010.07.0444.
189
Schery, R.W. 1966. Remarkable Kentucky bluegrass. Southern California Turfgrass
Culture. 8:30-31.
Settle, D.M., A.D. Martinez-Espinoza, and L.L. Burpee. 2006. Anthracnose of Turfgrass.
The Plant Health Instructor [Online]:[1-6]. DOI: DOI:10.1094/PHI-I-2006-1205-
01.
Smiley, R.W., P.H. Dernoeden, and B.B. Clarke. 2005. Compendium of turfgrass
diseases. APS press, St. Paul, MN.
Smith, J.D. 1954. A disease of Poa annua. J. Sports Turf Res. Inst. 8:344-353.
Smith, J.D., N. Jackson, and A.R. Woolhouse. 1989. Fungal diseases of amenity turf
grasses. E. & FN Spon, New York, NY.
Tisserat, N.A., and J. Fry. 1997. Cultural practices to reduce spring dead spot
(Ophiosphaerella herpotricha) severity in Cynodon dactylon. Int. Turf. Soc. Res.
J. 8:931-936.
Towers, G., K. Green, E. Weibel, P. Majumdar, and B.B. Clarke. 2003. Evaluation of
fungicides for the control of anthracnose basal rot on annual bluegrass. Fungicide
and Nematicide Tests 58:T017.
Turgeon, A.J. 2011. Turfgrass Management, Prentice Hall, Upper Saddle River, NJ.
Uddin, W., M. Soika, and D. Livingston. 2008. Vertical mowing and mowing height
affect anthracnose basal rot. Golf Course Manage. 76:84-87.
Unruh, J.B., S.D. Davis, P.F. Colbaugh, B.J. Brecke, and D.O. Stephenson. 2005. Impact
of various chemical and nutrient inputs and cultural treatments on 'Tifeagle
bermudagrass (Cynodon dactylon x C. transvaalensis). Int. Turfgrass Soc. Res. J.
10(1):455-461.
Vargas, J., and A. Turgeon. 2004. Poa annua: physiology, culture, and control of annual
bluegrass, John Wiley & Sons, Inc, Hoboken, New Jersey.
Vargas, J.M., T.K. Danneberger, and A.L. Jones. 1992. Effects of temperature, leaf
wetness duration and inoculum concentration on infection of annual bluegrass by
190
Colletotrichum graminicola. International Turfgrass Society Research Journal
7:324-328.
Vargas, W.A., J.M.S. Martín, G.E. Rech, L.P. Rivera, E.P. Benito, J.M. Díaz-Mínguez,
M.R. Thon, and S.A. Sukno. 2012. Plant defense mechanisms are activated during
biotrophic and necrotrophic development of Colletotricum graminicola in maize.
Plant physiology 158(3):1342-1358.
Venard, C., and L. Vaillancourt. 2007. Penetration and colonization of unwounded maize
tissues by the maize anthracnose pathogen Colletotrichum graminicola and the
related nonpathogen C. sublineolum. Mycologia 99(3):368-377.

19
1
Table 5.1. Anthracnose severity response to depth of vertical cutting on an annual bluegrass turf mowed at 3.2 mm in North Brunswick, NJ during 2010: Trial
run 1.
Vertical Cutting Depth‡ 23 July 25 July 28 July 31 July 3 Aug. 7 Aug. 11 Aug. 14 Aug. 20 Aug. 31 Aug.
mm -------------------------------------------------------- percent turf area infested -------------------------------------------------------
No Vertical Cutting 5.7 7.3 8.0 20.7 25.0 33.3 42.0 47.7 50.7 58.0
1.3 6.7 7.3 7.0 20.0 23.0 30.0 37.0 43.3 45.7 57.7
7.6 6.7 7.3 8.0 24.3 27.0 35.0 41.3 46.3 49.3 57.0
LSD0.05 2.5 2.8 2.5 3.0 4.0 3.9 4.7 7.1 6.1 6.2
Source of Variation ------------------------------------------------------------------- P > F ------------------------------------------------------------------
Treatment NS§ NS NS * NS * 0.08
† NS NS NS
CV, % 41.9 40.1 34.6 14.6 17.1 12.8 12.5 16.4 13.3 11.4
*Significant at the 0.05 probability level.
†Probability level ≤ 0.1.
‡Vertical cutting was applied once on 23 July 2010 using blades that were 1.5 mm thick and spaced 40 mm apart.
§NS, not significant.
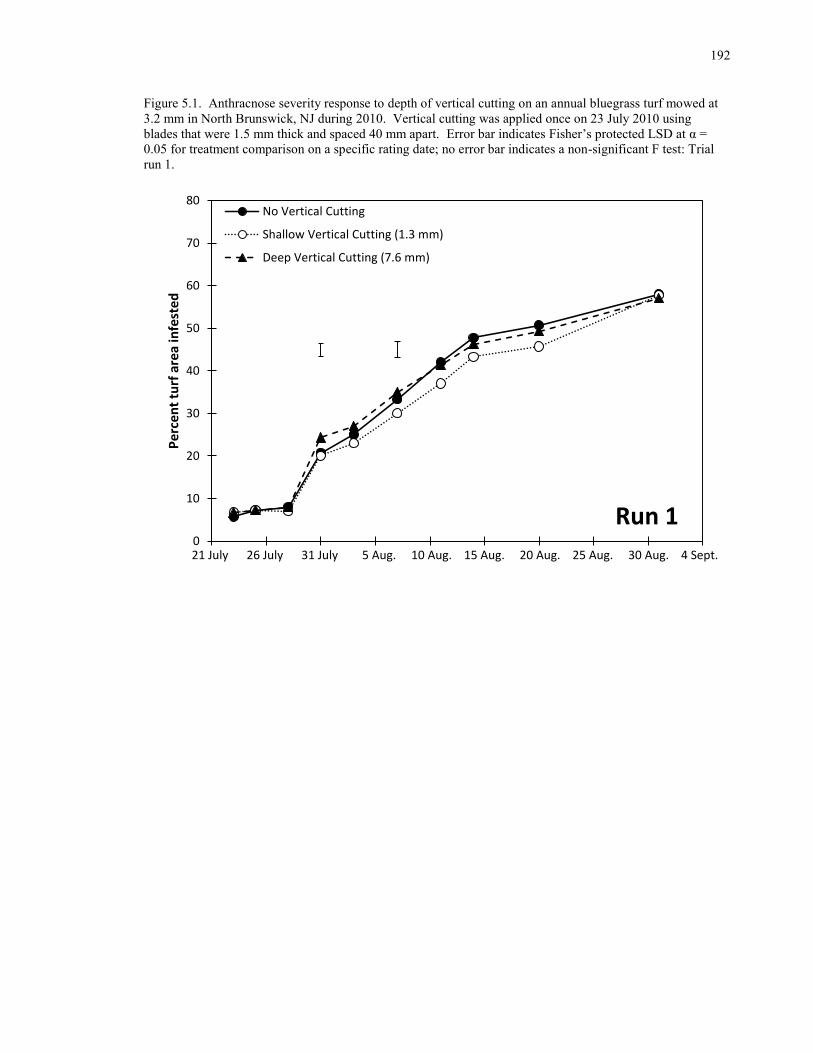
192
19
2
Figure 5.1. Anthracnose severity response to depth of vertical cutting on an annual bluegrass turf mowed at
3.2 mm in North Brunswick, NJ during 2010. Vertical cutting was applied once on 23 July 2010 using
blades that were 1.5 mm thick and spaced 40 mm apart. Error bar indicates Fisher’s protected LSD at α =
0.05 for treatment comparison on a specific rating date; no error bar indicates a non-significant F test: Trial
run 1.
0
10
20
30
40
50
60
70
80
Pe
rce
nt
turf
are
a in
fest
ed
No Vertical Cutting
Shallow Vertical Cutting (1.3 mm)
Deep Vertical Cutting (7.6 mm)
21 July 26 July 31 July 5 Aug. 10 Aug. 15 Aug. 20 Aug. 25 Aug. 30 Aug. 4 Sept.
Run 1

19
3
Table 5.2. Anthracnose severity response to depth of vertical cutting on an annual bluegrass turf mowed at 3.2 mm in North Brunswick, NJ during 2011: Trial
run 2.
Vertical Cutting Depth‡ 6 July 7 July 8 July 10 July 12 July 14 July 16 July 18 July 20 July 22 July 24 July 27 July 1 Aug.
mm --------------------------------------------------------------- percent turf area infested --------------------------------------------------------------
No Vertical Cutting 5.0 7.0 8.3 11.0 12.7 21.3 28.0 26.0 25.3 37.3 46.7 54.0 71.0
1.3 6.0 4.7 4.7 9.3 11.7 15.7 22.7 25.7 26.7 36.0 46.0 52.0 66.3
7.6 6.0 5.0 7.3 10.0 11.0 18.3 28.0 25.0 23.7 32.7 42.7 55.3 71.3
LSD0.05 3.7 3.7 3.4 3.4 3.9 5.6 5.9 6.4 8.6 7.6 8.9 9.7 10.2
Source of Variation -------------------------------------------------------------------------- P > F ---------------------------------------------------------------------------
Treatment NS§ NS 0.09
† NS NS NS NS NS NS NS NS NS NS
CV, % 69.9 70.0 53.0 35.9 35.3 32.1 24.0 26.7 36.5 22.8 21.1 19.1 15.6
†Probability level ≤ 0.1.
‡Vertical cutting was applied once on 6 July 2011 using blades that were 1.5 mm thick and spaced 40 mm apart.
§NS, not significant.
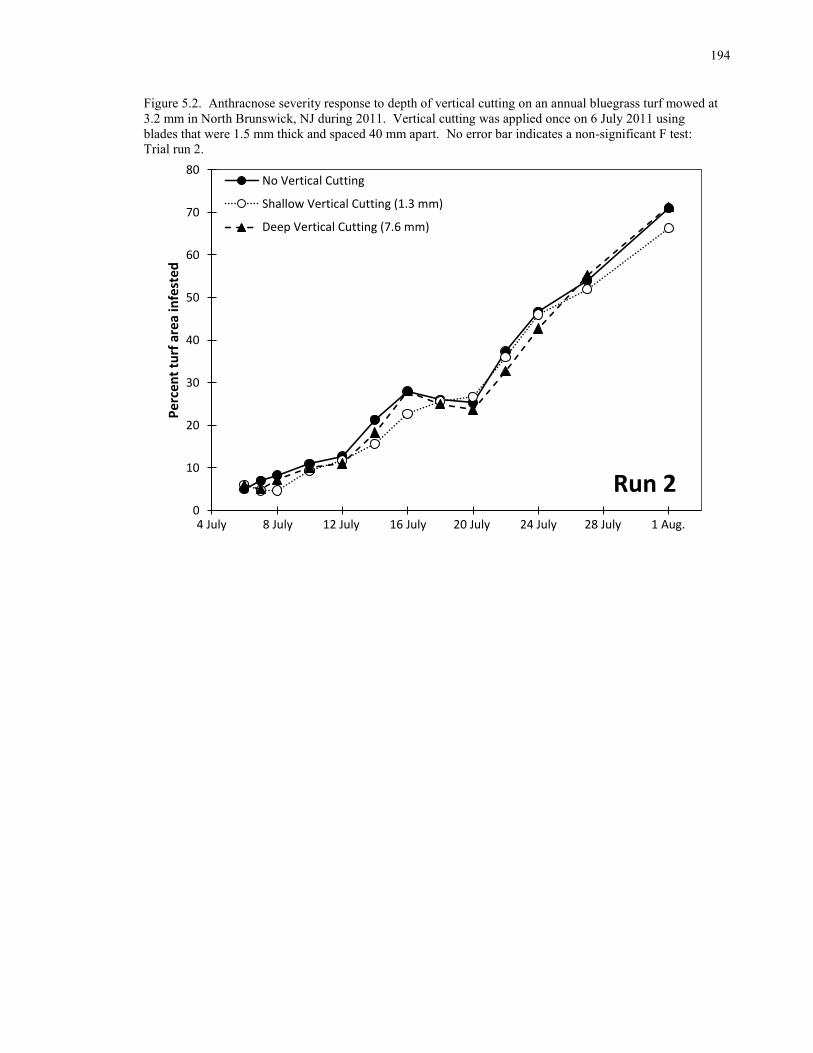
194
19
4
Figure 5.2. Anthracnose severity response to depth of vertical cutting on an annual bluegrass turf mowed at
3.2 mm in North Brunswick, NJ during 2011. Vertical cutting was applied once on 6 July 2011 using
blades that were 1.5 mm thick and spaced 40 mm apart. No error bar indicates a non-significant F test:
Trial run 2.
0
10
20
30
40
50
60
70
80P
erc
en
t tu
rf a
rea
infe
ste
d
No Vertical Cutting
Shallow Vertical Cutting (1.3 mm)
Deep Vertical Cutting (7.6 mm)
4 July 8 July 12 July 16 July 20 July 24 July 28 July 1 Aug.
Run 2

19
5
Table 5.3. Anthracnose severity response to depth of vertical cutting on an annual bluegrass turf mowed at 3.2 mm in North Brunswick, NJ during 2011: Trial
run 3.
Vertical Cutting Depth‡ 4 Aug. 6 Aug. 8 Aug. 11 Aug. 15 Aug. 17 Aug. 19 Aug. 25 Aug. 2 Sept.
mm -------------------------------------------------- percent turf area infested --------------------------------------------------
No Vertical Cutting 31.3 30.3 32.3 30.7 30.7 30.0 28.7 34.3 26.3
1.3 23.3 26.0 27.0 25.7 24.3 23.3 21.3 27.3 23.0
7.6 27.3 29.0 31.7 27.3 26.3 25.3 24.0 34.0 25.3
LSD0.05 7.0 5.4 6.8 6.4 5.7 5.5 7.0 7.5 3.9
Source of Variation -------------------------------------------------------------- P > F --------------------------------------------------------------
Treatment 0.08† NS
§ NS NS 0.09 0.06 NS NS NS
CV, % 27.2 20.1 23.9 24.5 22.5 22.3 30.2 25.2 16.7
†Probability level ≤ 0.1.
‡Vertical cutting was applied once on 3 Aug. 2011 using blades that were 1.5 mm thick and spaced 40 mm apart.
§NS, not significant.

196
19
6
Figure 5.3. Anthracnose severity response to depth of vertical cutting on an annual bluegrass turf mowed at
3.2 mm in North Brunswick, NJ during 2011. Vertical cutting was applied once on 3 Aug. 2011 using
blades that were 1.5 mm thick and spaced 40 mm apart. No error bar indicates a non-significant F test:
Trial run 3.
0
10
20
30
40
50
60
70
80P
erc
en
t tu
rf a
rea
infe
ste
d
No Vertical Cutting
Shallow Vertical Cutting (1.3 mm)
Deep Vertical Cutting (7.6 mm)
1 Aug. 5 Aug. 9 Aug. 13 Aug. 17 Aug. 21 Aug. 25 Aug. 29 Aug. 2 Sept. 6 Sept.
Run 3

19
7
Table 5.4. Turf quality response to depth of vertical cutting on an annual bluegrass turf mowed at 3.2 mm in North Brunswick, NJ during 2011: Trial run 2.
Vertical Cutting Depth† 6 July 7 July 8 July 10 July 12 July 14 July 16 July 18 July 20 July 22 July 24 July 27 July 1 Aug.
mm ------------------------------------------------------------------------ 1-9 scale‡ ------------------------------------------------------------------------
No Vertical Cutting 7.4 7.7 7.7 7.7 7.9 7.9 8.2 8.0 7.7 7.5 7.2 7.5 6.9
1.3 6.7 7.3 7.4 7.4 7.7 8.0 8.2 8.0 7.9 7.6 7.3 7.5 6.7
7.6 4.6 4.5 4.9 5.0 5.2 5.4 5.5 5.7 6.9 6.9 6.8 7.0 6.4
LSD0.05 0.7 0.6 0.5 0.6 0.5 0.6 0.5 0.5 0.5 0.4 0.5 0.4 0.4
Source of Variation -------------------------------------------------------------------------- P > F ---------------------------------------------------------------------------
Treatment *** *** *** *** *** *** *** *** ** ** NS§ * NS
CV, % 11.3 9.7 8.7 8.8 7.2 9.4 7.7 7.6 7.6 5.8 7.6 5.9 7.2
*Significant at the 0.05 probability level.
**Significant at the 0.01 probability level.
***Significant at the 0.001 probability level.
†Vertical cutting was applied once on 6 July 2011 using blades that were 1.5 mm thick and spaced 40 mm apart.
‡Nine (9) represents the best turf characteristic and 6 represents the minimally acceptable rating.
§NS, not significant.
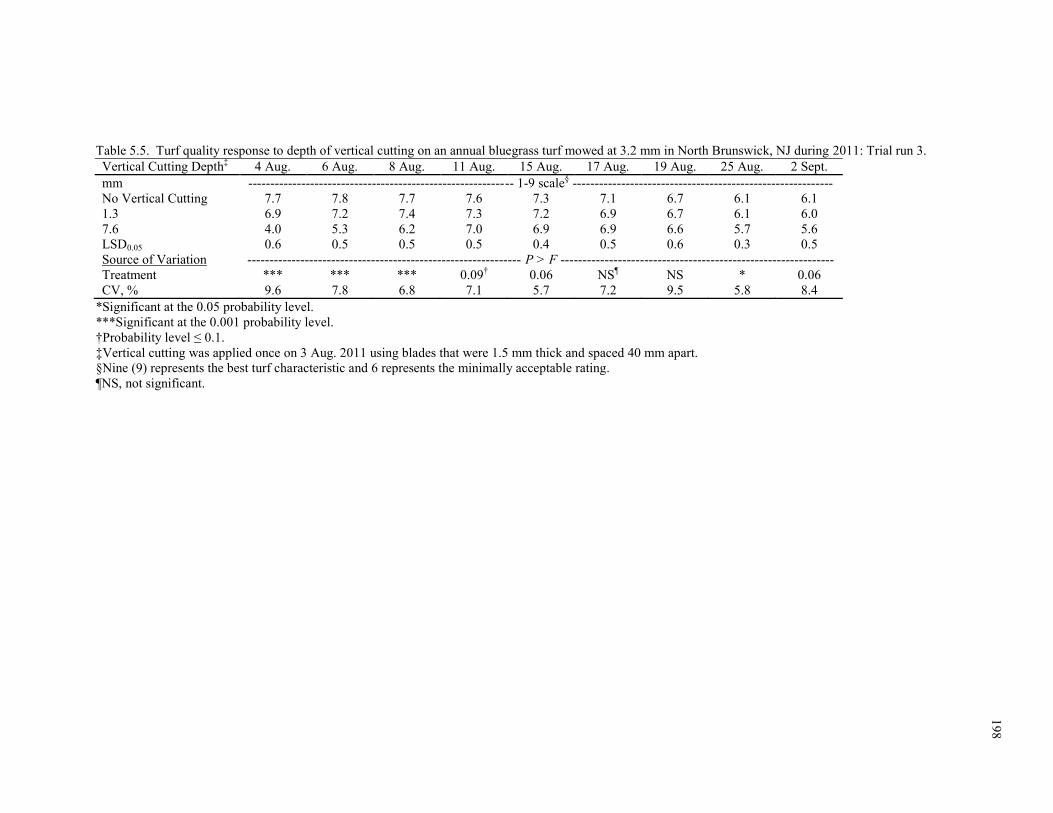
19
8
Table 5.5. Turf quality response to depth of vertical cutting on an annual bluegrass turf mowed at 3.2 mm in North Brunswick, NJ during 2011: Trial run 3.
Vertical Cutting Depth‡ 4 Aug. 6 Aug. 8 Aug. 11 Aug. 15 Aug. 17 Aug. 19 Aug. 25 Aug. 2 Sept.
mm ------------------------------------------------------------ 1-9 scale§ -----------------------------------------------------------
No Vertical Cutting 7.7 7.8 7.7 7.6 7.3 7.1 6.7 6.1 6.1
1.3 6.9 7.2 7.4 7.3 7.2 6.9 6.7 6.1 6.0
7.6 4.0 5.3 6.2 7.0 6.9 6.9 6.6 5.7 5.6
LSD0.05 0.6 0.5 0.5 0.5 0.4 0.5 0.6 0.3 0.5
Source of Variation -------------------------------------------------------------- P > F --------------------------------------------------------------
Treatment *** *** *** 0.09† 0.06 NS
¶ NS * 0.06
CV, % 9.6 7.8 6.8 7.1 5.7 7.2 9.5 5.8 8.4
*Significant at the 0.05 probability level.
***Significant at the 0.001 probability level.
†Probability level ≤ 0.1.
‡Vertical cutting was applied once on 3 Aug. 2011 using blades that were 1.5 mm thick and spaced 40 mm apart.
§Nine (9) represents the best turf characteristic and 6 represents the minimally acceptable rating.
¶NS, not significant.
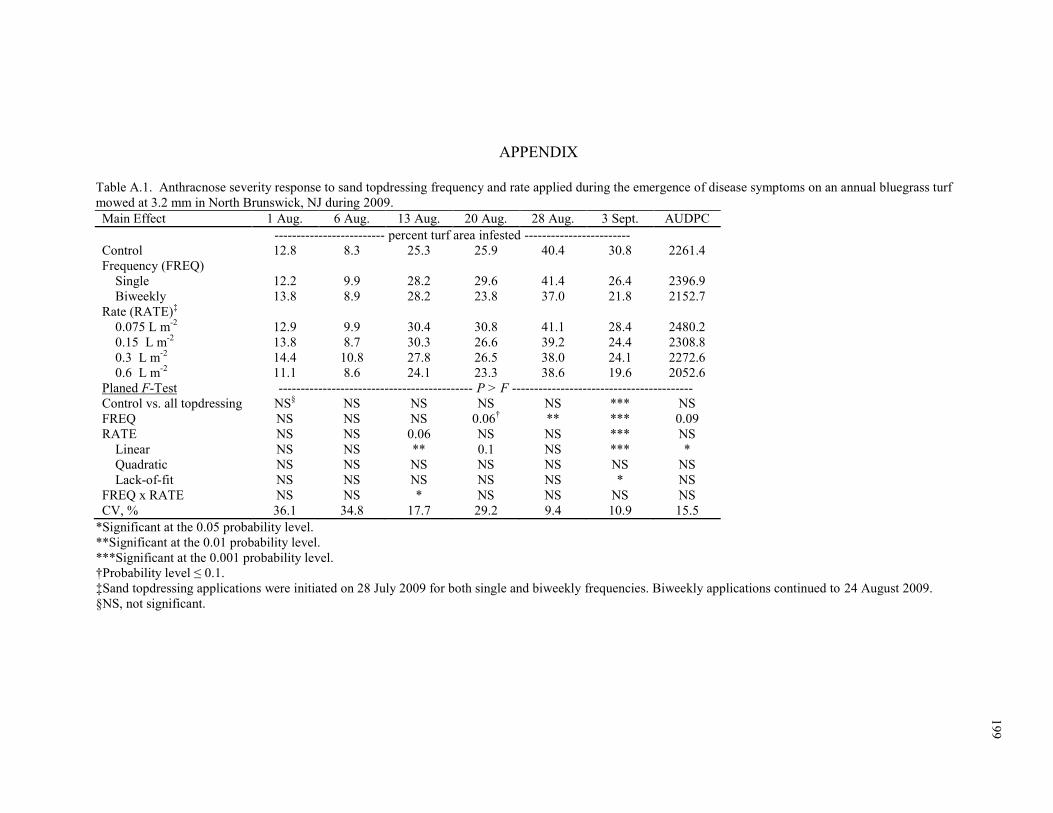
19
9
APPENDIX
Table A.1. Anthracnose severity response to sand topdressing frequency and rate applied during the emergence of disease symptoms on an annual bluegrass turf
mowed at 3.2 mm in North Brunswick, NJ during 2009.
Main Effect 1 Aug. 6 Aug. 13 Aug. 20 Aug. 28 Aug. 3 Sept. AUDPC
------------------------- percent turf area infested ------------------------
Control 12.8 8.3 25.3 25.9 40.4 30.8 2261.4
Frequency (FREQ)
Single 12.2 9.9 28.2 29.6 41.4 26.4 2396.9
Biweekly 13.8 8.9 28.2 23.8 37.0 21.8 2152.7
Rate (RATE)‡
0.075 L m-2
12.9 9.9 30.4 30.8 41.1 28.4 2480.2
0.15 L m-2
13.8 8.7 30.3 26.6 39.2 24.4 2308.8
0.3 L m-2
14.4 10.8 27.8 26.5 38.0 24.1 2272.6
0.6 L m-2
11.1 8.6 24.1 23.3 38.6 19.6 2052.6
Planed F-Test -------------------------------------------- P > F -----------------------------------------
Control vs. all topdressing NS§ NS NS NS NS *** NS
FREQ NS NS NS 0.06† ** *** 0.09
RATE NS NS 0.06 NS NS *** NS
Linear NS NS ** 0.1 NS *** *
Quadratic NS NS NS NS NS NS NS
Lack-of-fit NS NS NS NS NS * NS
FREQ x RATE NS NS * NS NS NS NS
CV, % 36.1 34.8 17.7 29.2 9.4 10.9 15.5
*Significant at the 0.05 probability level.
**Significant at the 0.01 probability level.
***Significant at the 0.001 probability level.
†Probability level ≤ 0.1.
‡Sand topdressing applications were initiated on 28 July 2009 for both single and biweekly frequencies. Biweekly applications continued to 24 August 2009.
§NS, not significant.
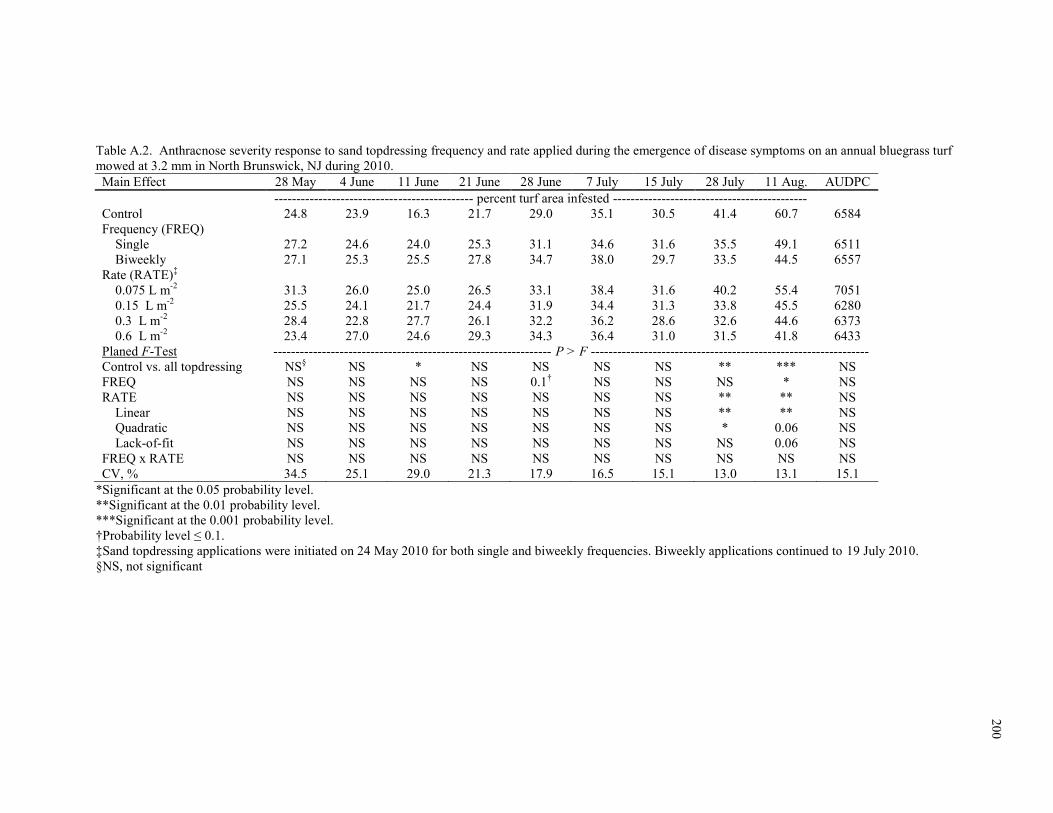
20
0
Table A.2. Anthracnose severity response to sand topdressing frequency and rate applied during the emergence of disease symptoms on an annual bluegrass turf
mowed at 3.2 mm in North Brunswick, NJ during 2010.
Main Effect 28 May 4 June 11 June 21 June 28 June 7 July 15 July 28 July 11 Aug. AUDPC
--------------------------------------------- percent turf area infested --------------------------------------------
Control 24.8 23.9 16.3 21.7 29.0 35.1 30.5 41.4 60.7 6584
Frequency (FREQ)
Single 27.2 24.6 24.0 25.3 31.1 34.6 31.6 35.5 49.1 6511
Biweekly 27.1 25.3 25.5 27.8 34.7 38.0 29.7 33.5 44.5 6557
Rate (RATE)‡
0.075 L m-2
31.3 26.0 25.0 26.5 33.1 38.4 31.6 40.2 55.4 7051
0.15 L m-2
25.5 24.1 21.7 24.4 31.9 34.4 31.3 33.8 45.5 6280
0.3 L m-2
28.4 22.8 27.7 26.1 32.2 36.2 28.6 32.6 44.6 6373
0.6 L m-2
23.4 27.0 24.6 29.3 34.3 36.4 31.0 31.5 41.8 6433
Planed F-Test --------------------------------------------------------------- P > F ---------------------------------------------------------------
Control vs. all topdressing NS§ NS * NS NS NS NS ** *** NS
FREQ NS NS NS NS 0.1† NS NS NS * NS
RATE NS NS NS NS NS NS NS ** ** NS
Linear NS NS NS NS NS NS NS ** ** NS
Quadratic NS NS NS NS NS NS NS * 0.06 NS
Lack-of-fit NS NS NS NS NS NS NS NS 0.06 NS
FREQ x RATE NS NS NS NS NS NS NS NS NS NS
CV, % 34.5 25.1 29.0 21.3 17.9 16.5 15.1 13.0 13.1 15.1
*Significant at the 0.05 probability level.
**Significant at the 0.01 probability level.
***Significant at the 0.001 probability level.
†Probability level ≤ 0.1.
‡Sand topdressing applications were initiated on 24 May 2010 for both single and biweekly frequencies. Biweekly applications continued to 19 July 2010.
§NS, not significant
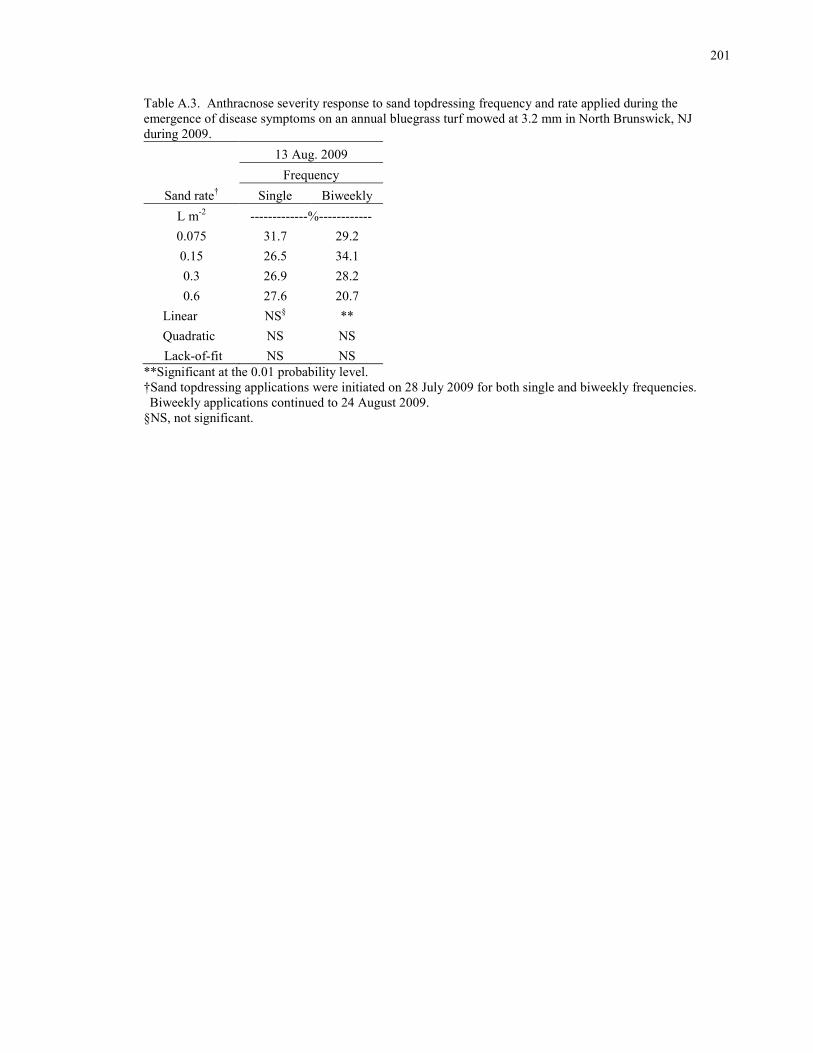
201
20
1
Table A.3. Anthracnose severity response to sand topdressing frequency and rate applied during the
emergence of disease symptoms on an annual bluegrass turf mowed at 3.2 mm in North Brunswick, NJ
during 2009.
13 Aug. 2009
Frequency
Sand rate† Single Biweekly
L m-2
-------------%------------
0.075 31.7 29.2
0.15 26.5 34.1
0.3 26.9 28.2
0.6 27.6 20.7
Linear NS§ **
Quadratic NS NS
Lack-of-fit NS NS
**Significant at the 0.01 probability level.
†Sand topdressing applications were initiated on 28 July 2009 for both single and biweekly frequencies.
Biweekly applications continued to 24 August 2009.
§NS, not significant.
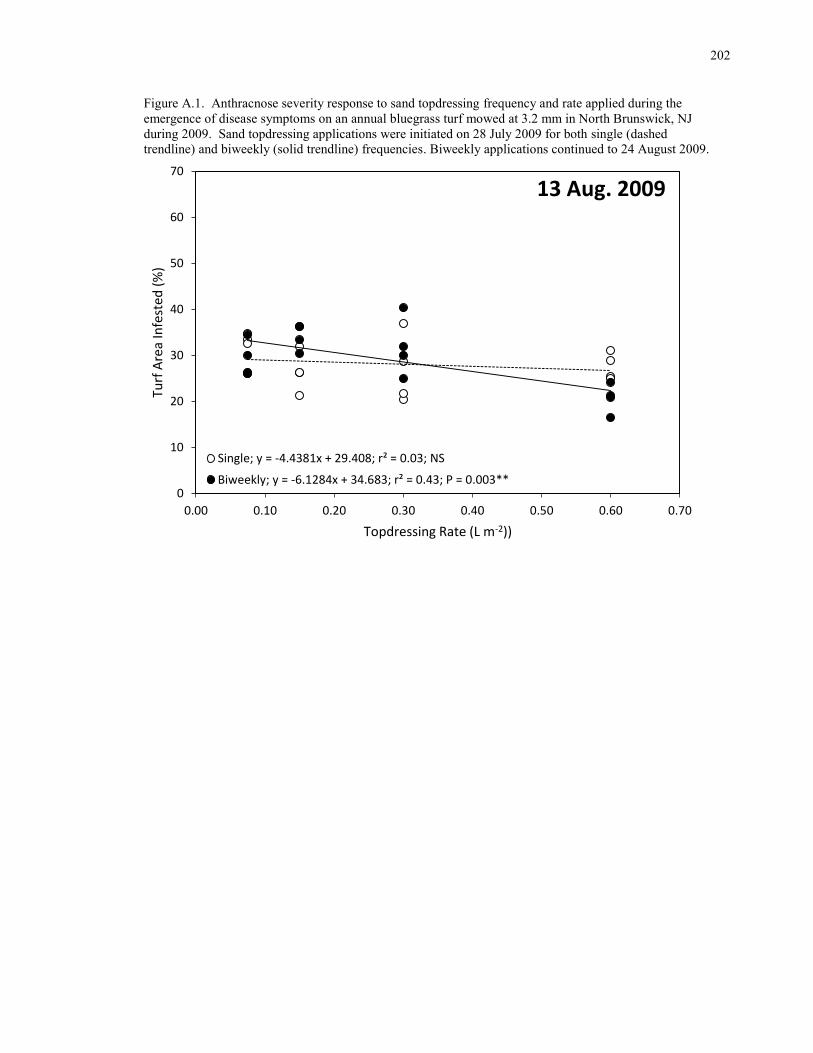
202
20
2
Figure A.1. Anthracnose severity response to sand topdressing frequency and rate applied during the
emergence of disease symptoms on an annual bluegrass turf mowed at 3.2 mm in North Brunswick, NJ
during 2009. Sand topdressing applications were initiated on 28 July 2009 for both single (dashed
trendline) and biweekly (solid trendline) frequencies. Biweekly applications continued to 24 August 2009.
0
10
20
30
40
50
60
70
0.00 0.10 0.20 0.30 0.40 0.50 0.60 0.70
Turf
Are
a In
fest
ed (
%)
Topdressing Rate (L m-2))
13 Aug. 2009
Single; y = -4.4381x + 29.408; r² = 0.03; NS
Biweekly; y = -6.1284x + 34.683; r² = 0.43; P = 0.003**
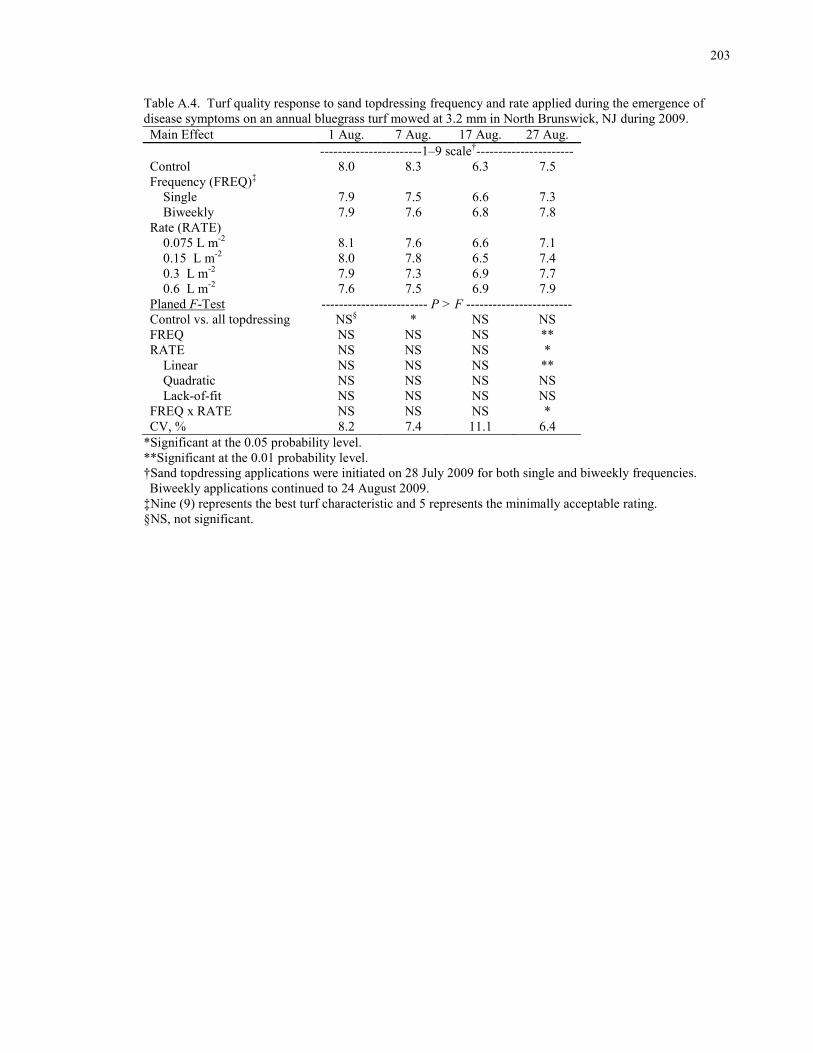
203
20
3
Table A.4. Turf quality response to sand topdressing frequency and rate applied during the emergence of
disease symptoms on an annual bluegrass turf mowed at 3.2 mm in North Brunswick, NJ during 2009.
Main Effect 1 Aug. 7 Aug. 17 Aug. 27 Aug.
-----------------------1–9 scale†----------------------
Control 8.0 8.3 6.3 7.5
Frequency (FREQ)‡
Single 7.9 7.5 6.6 7.3
Biweekly 7.9 7.6 6.8 7.8
Rate (RATE)
0.075 L m-2
8.1 7.6 6.6 7.1
0.15 L m-2
8.0 7.8 6.5 7.4
0.3 L m-2
7.9 7.3 6.9 7.7
0.6 L m-2
7.6 7.5 6.9 7.9
Planed F-Test ------------------------ P > F ------------------------
Control vs. all topdressing NS§ * NS NS
FREQ NS NS NS **
RATE NS NS NS *
Linear NS NS NS **
Quadratic NS NS NS NS
Lack-of-fit NS NS NS NS
FREQ x RATE NS NS NS *
CV, % 8.2 7.4 11.1 6.4
*Significant at the 0.05 probability level.
**Significant at the 0.01 probability level.
†Sand topdressing applications were initiated on 28 July 2009 for both single and biweekly frequencies.
Biweekly applications continued to 24 August 2009.
‡Nine (9) represents the best turf characteristic and 5 represents the minimally acceptable rating.
§NS, not significant.
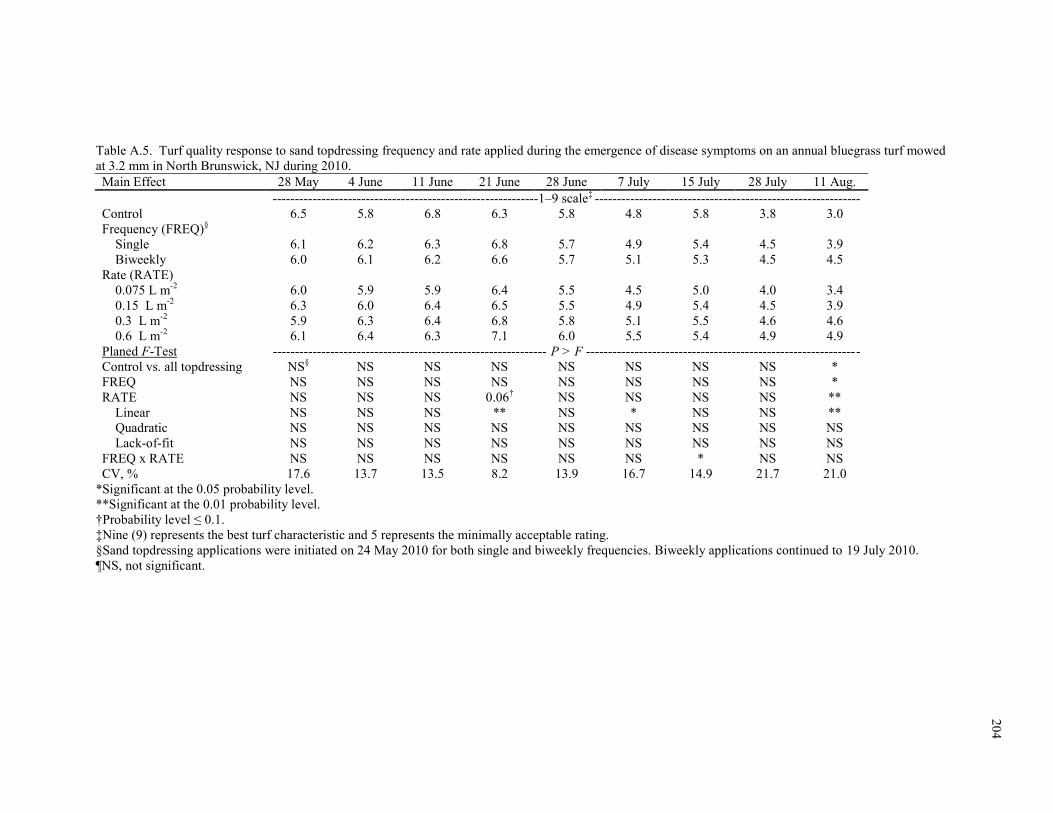
20
4
Table A.5. Turf quality response to sand topdressing frequency and rate applied during the emergence of disease symptoms on an annual bluegrass turf mowed
at 3.2 mm in North Brunswick, NJ during 2010.
Main Effect 28 May 4 June 11 June 21 June 28 June 7 July 15 July 28 July 11 Aug.
------------------------------------------------------------1–9 scale‡ ------------------------------------------------------------
Control 6.5 5.8 6.8 6.3 5.8 4.8 5.8 3.8 3.0
Frequency (FREQ)§
Single 6.1 6.2 6.3 6.8 5.7 4.9 5.4 4.5 3.9
Biweekly 6.0 6.1 6.2 6.6 5.7 5.1 5.3 4.5 4.5
Rate (RATE)
0.075 L m-2
6.0 5.9 5.9 6.4 5.5 4.5 5.0 4.0 3.4
0.15 L m-2
6.3 6.0 6.4 6.5 5.5 4.9 5.4 4.5 3.9
0.3 L m-2
5.9 6.3 6.4 6.8 5.8 5.1 5.5 4.6 4.6
0.6 L m-2
6.1 6.4 6.3 7.1 6.0 5.5 5.4 4.9 4.9
Planed F-Test -------------------------------------------------------------- P > F --------------------------------------------------------------
Control vs. all topdressing NS§ NS NS NS NS NS NS NS *
FREQ NS NS NS NS NS NS NS NS *
RATE NS NS NS 0.06† NS NS NS NS **
Linear NS NS NS ** NS * NS NS **
Quadratic NS NS NS NS NS NS NS NS NS
Lack-of-fit NS NS NS NS NS NS NS NS NS
FREQ x RATE NS NS NS NS NS NS * NS NS
CV, % 17.6 13.7 13.5 8.2 13.9 16.7 14.9 21.7 21.0
*Significant at the 0.05 probability level.
**Significant at the 0.01 probability level.
†Probability level ≤ 0.1.
‡Nine (9) represents the best turf characteristic and 5 represents the minimally acceptable rating.
§Sand topdressing applications were initiated on 24 May 2010 for both single and biweekly frequencies. Biweekly applications continued to 19 July 2010.
¶NS, not significant.

205
Table A.6. Turf quality response to sand topdressing frequency and rate applied during the emergence of
disease symptoms on an annual bluegrass turf mowed at 3.2 mm in North Brunswick, NJ during 2009.
27 Aug. 2009
Frequency†
Rate Single Biweekly
L m-2
--------1–9 scale‡-------
0.075 6.8 7.5
0.15 6.8 8.0
0.3 7.5 8.0
0.6 8.0 7.8
Linear *** NS§
Quadratic NS NS
Lack-of-fit NS NS
***Significant at the 0.01 probability level.
†Sand topdressing applications were initiated on 28 July 2009 for both single and biweekly frequencies.
Biweekly applications continued to 24 August 2009.
‡Nine (9) represents the best turf characteristic and 5 represents the minimally acceptable rating.
§NS, not significant
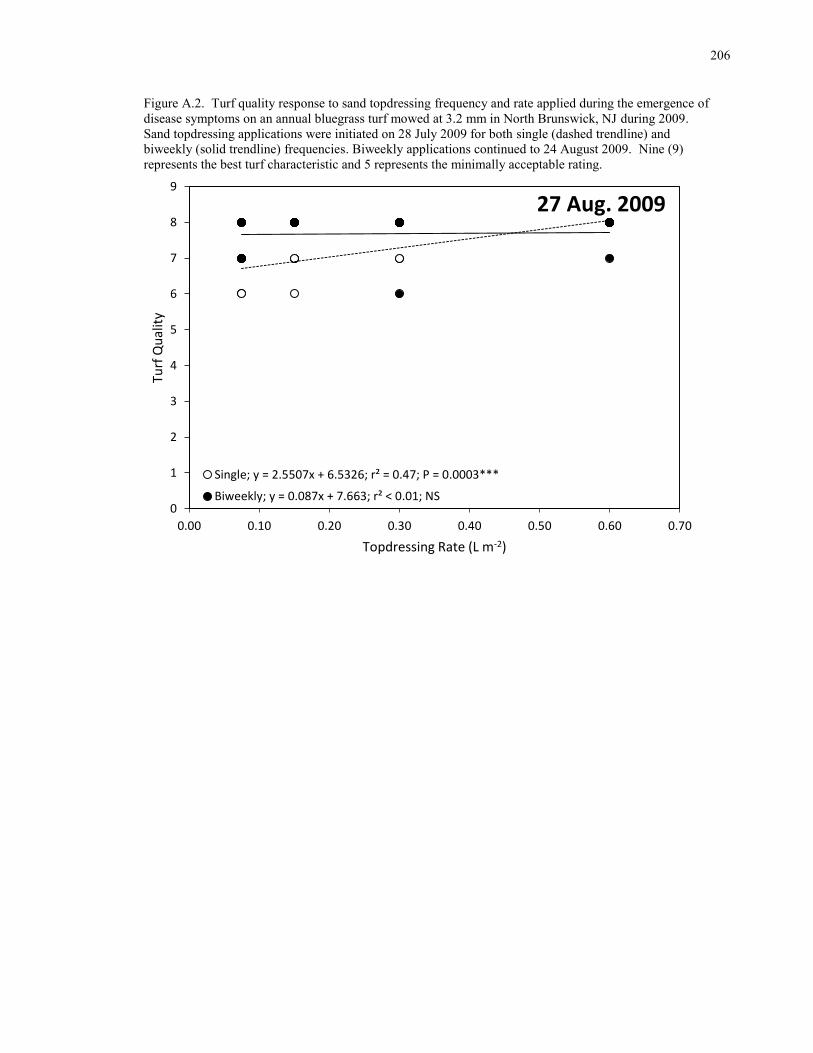
206
Figure A.2. Turf quality response to sand topdressing frequency and rate applied during the emergence of
disease symptoms on an annual bluegrass turf mowed at 3.2 mm in North Brunswick, NJ during 2009.
Sand topdressing applications were initiated on 28 July 2009 for both single (dashed trendline) and
biweekly (solid trendline) frequencies. Biweekly applications continued to 24 August 2009. Nine (9)
represents the best turf characteristic and 5 represents the minimally acceptable rating.
0
1
2
3
4
5
6
7
8
9
0.00 0.10 0.20 0.30 0.40 0.50 0.60 0.70
Turf
Qu
alit
y
Topdressing Rate (L m-2)
27 Aug. 2009
Single; y = 2.5507x + 6.5326; r² = 0.47; P = 0.0003***
Biweekly; y = 0.087x + 7.663; r² < 0.01; NS

207
Table A.7. Turf quality response to sand topdressing frequency and rate applied during the emergence of
disease symptoms on an annual bluegrass turf mowed at 3.2 mm in North Brunswick, NJ during 2010.
15 July 2010
Frequency‡
Rate Single Biweekly
L m-2
--------1–9 scale§-------
0.075 5.0 5.0
0.15 4.8 6.0
0.3 6.0 5.0
0.6 5.8 5.0
Linear 0.08† NS
¶
Quadratic NS NS
Lack-of-fit NS 0.06
†Probability level ≤ 0.1.
‡Sand topdressing applications were initiated on 24 May 2010 for both single and biweekly frequencies.
Biweekly applications continued to 19 July 2010.
§Nine (9) represents the best turf characteristic and 5 represents the minimally acceptable rating.
¶NS, not significant

208
Figure A.3. Turf quality response to sand topdressing frequency and rate applied during the emergence of
disease symptoms on an annual bluegrass turf mowed at 3.2 mm in North Brunswick, NJ during 2010.
Sand topdressing applications were initiated on 24 May 2010 for both single (dashed trendline) and
biweekly (solid trendline) frequencies. Biweekly applications continued to 19 July 2010. Nine (9)
represents the best turf characteristic and 5 represents the minimally acceptable rating.
0
1
2
3
4
5
6
7
8
9
0.00 0.10 0.20 0.30 0.40 0.50 0.60 0.70
Turf
Qu
alit
y
Topdressing Rate (L m-2)
15 July 2010
Single; y = 1.7971x + 4.8696; r² = 0.18; NS (P = 0.08)
Biweekly; y = -0.8116x + 5.4783; r² = 0.03; NS

209
Curriculum Vitae
JAMES WARREN HEMPFLING
Education
B.S. May 2008. Agricultural Sciences and Natural Resources, Spanish (Double Major).
Oklahoma State University.
M.S. Oct. 2013. Plant Biology. Rutgers, The State University of New Jersey.
Occupations
May 2008 to Aug. 2008 Assistant superintendent
Oakwood Country Club
Enid, OK
Aug. 2008 to May 2009 Assistant-in-training
Ridgewood Country Club
Paramus, NJ
May 2009 to present Graduate Assistant
Rutgers, the State University of New Jersey
New Brunswick, NJ
Related Documents