© 2012 Pearson Education, Inc. Q2.1 A. point P. B. point Q. C. point R. D. point S. E. not enough information in the graph to decide This is the x-t graph of the motion of a particle. Of the four points P, Q, R, and S, the velocity v x is greatest (most positive) at

© 2012 Pearson Education, Inc. Q2.1 A. point P.B. point Q.C. point R.D. point S. E. not enough information in the graph to decide This is the x-t graph.
Dec 14, 2015
Welcome message from author
This document is posted to help you gain knowledge. Please leave a comment to let me know what you think about it! Share it to your friends and learn new things together.
Transcript
© 2012 Pearson Education, Inc.
Q2.1
A. point P. B. point Q. C. point R. D. point S.
E. not enough information in the graph to decide
This is the x-t graph of the motion of a particle. Of the four points P, Q, R, and S, the velocity vx is greatest (most positive) at
© 2012 Pearson Education, Inc.
This is the x-t graph of the motion of a particle. Of the four points P, Q, R, and S, the velocity vx is greatest (most positive) at
A. point P. B. point Q. C. point R. D. point S.
E. not enough information in the graph to decide
A2.1

© 2012 Pearson Education, Inc.
Q2.2This is the x-t graph of the motion of a particle. Of the four points P, Q, R, and S, the speed is greatest at
A. point P. B. point Q. C. point R. D. point S.
E. not enough information in the graph to decide

© 2012 Pearson Education, Inc.
This is the x-t graph of the motion of a particle. Of the four points P, Q, R, and S, the speed is greatest at
A2.2
A. point P. B. point Q. C. point R. D. point S.
E. not enough information in the graph to decide

© 2012 Pearson Education, Inc.
Q2.3This is the x-t graph of the motion of a particle. Of the four points P, Q, R, and S, the acceleration ax is greatest (most positive) at
A. point P. B. point Q. C. point R. D. point S.
E. not enough information in the graph to decide

© 2012 Pearson Education, Inc.
This is the x-t graph of the motion of a particle. Of the four points P, Q, R, and S, the acceleration ax is greatest (most positive) at
A2.3
A. point P. B. point Q. C. point R. D. point S.
E. not enough information in the graph to decide

© 2012 Pearson Education, Inc.
You toss a ball straight upward, in the positive direction. The ball falls freely under the influence of gravity.
At the highest point in the ball’s motion,
A. its velocity is zero and its acceleration is zero.
B. its velocity is zero and its acceleration is positive (upward).
C. its velocity is zero and its acceleration is negative (downward).
D. its velocity is positive (upward) and its acceleration is zero.
E. its velocity is positive (upward) and its acceleration is zero.
Q2.4

© 2012 Pearson Education, Inc.
A. its velocity is zero and its acceleration is zero.
B. its velocity is zero and its acceleration is positive (upward).
C. its velocity is zero and its acceleration is negative (downward).
D. its velocity is positive (upward) and its acceleration is zero.
E. its velocity is positive (upward) and its acceleration is zero.
A2.4You toss a ball straight upward, in the positive direction. The ball falls freely under the influence of gravity.
At the highest point in the ball’s motion,

© 2012 Pearson Education, Inc.
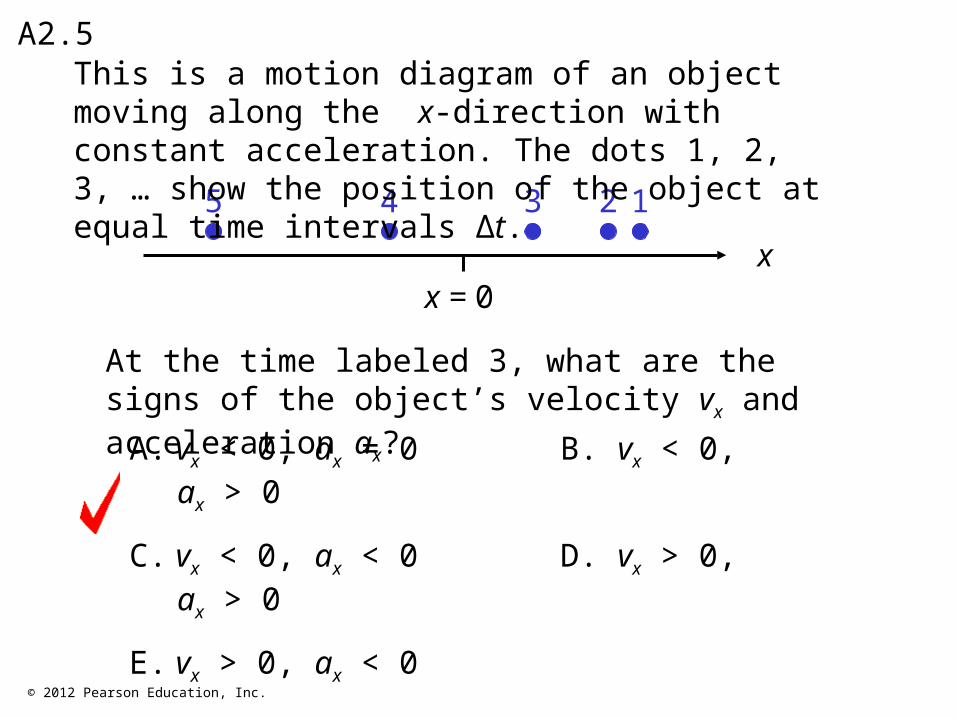
This is a motion diagram of an object moving along the x-direction with constant acceleration. The dots 1, 2, 3, … show the position of the object at equal time intervals ∆t.
Q2.5
xx = 0
5 4 3 2 1
A. vx < 0, ax = 0 B. vx < 0, ax > 0
C. vx < 0, ax < 0 D. vx > 0, ax > 0
E. vx > 0, ax < 0
At the time labeled 3, what are the signs of the object’s velocity vx and acceleration ax?
© 2012 Pearson Education, Inc.
A2.5
xx = 0
5 4 3 2 1
A. vx < 0, ax = 0 B. vx < 0, ax > 0
C. vx < 0, ax < 0 D. vx > 0, ax > 0
E. vx > 0, ax < 0
At the time labeled 3, what are the signs of the object’s velocity vx and acceleration ax?
This is a motion diagram of an object moving along the x-direction with constant acceleration. The dots 1, 2, 3, … show the position of the object at equal time intervals ∆t.

© 2012 Pearson Education, Inc.
This is a motion diagram of an object moving along the x-direction with constant acceleration. The dots 1, 2, 3, … show the position of the object at equal time intervals ∆t.
Which of the following vx-t graphs best matches the motion shown in the motion diagram?
Q2.6
xx = 0
5 4 3 2 1
t
vx
0
A.
t
vx
0
B.
t
vx
0
C.
t
vx
0
D.
t
vx
E.
0

© 2012 Pearson Education, Inc.
This is a motion diagram of an object moving along the x-direction with constant acceleration. The dots 1, 2, 3, … show the position of the object at equal time intervals ∆t.
Which of the following vx-t graphs best matches the motion shown in the motion diagram?
A2.6
xx = 0
5 4 3 2 1
t
vx
0
A.
t
vx
0
B.
t
vx
0
C.
t
vx
0
D.
t
vx
E.
0

© 2012 Pearson Education, Inc.
This is a motion diagram of an object moving along the x-direction with constant acceleration. The dots 1, 2, 3, … show the position of the object at equal time intervals ∆t.
Which of the following ax–t graphs best matches the motion shown in the motion diagram?
Q2.7
xx = 0
5 4 3 2 1
t
ax
0
A.
t
ax
0
B.
t
ax
0
C.
t
ax
0
D.
t
ax
E.
0

© 2012 Pearson Education, Inc.
This is a motion diagram of an object moving along the x-direction with constant acceleration. The dots 1, 2, 3, … show the position of the object at equal time intervals ∆t.
Which of the following ax–t graphs best matches the motion shown in the motion diagram?
A2.7
xx = 0
5 4 3 2 1
t
ax
0
A.
t
ax
0
B.
t
ax
0
C.
t
ax
0
D.
t
ax
E.
0

© 2012 Pearson Education, Inc.
An object moves along the x-axis with constant acceleration. The initial position x0 is positive, the initial velocity is negative, and the acceleration is positive.
Which of the following vx-t graphs best describes this motion?
Q2.8
t
vx
0
A.
t
vx
0
B.
t
vx
0
C.
t
vx
0
D.
t
vx
E.
0
© 2012 Pearson Education, Inc.
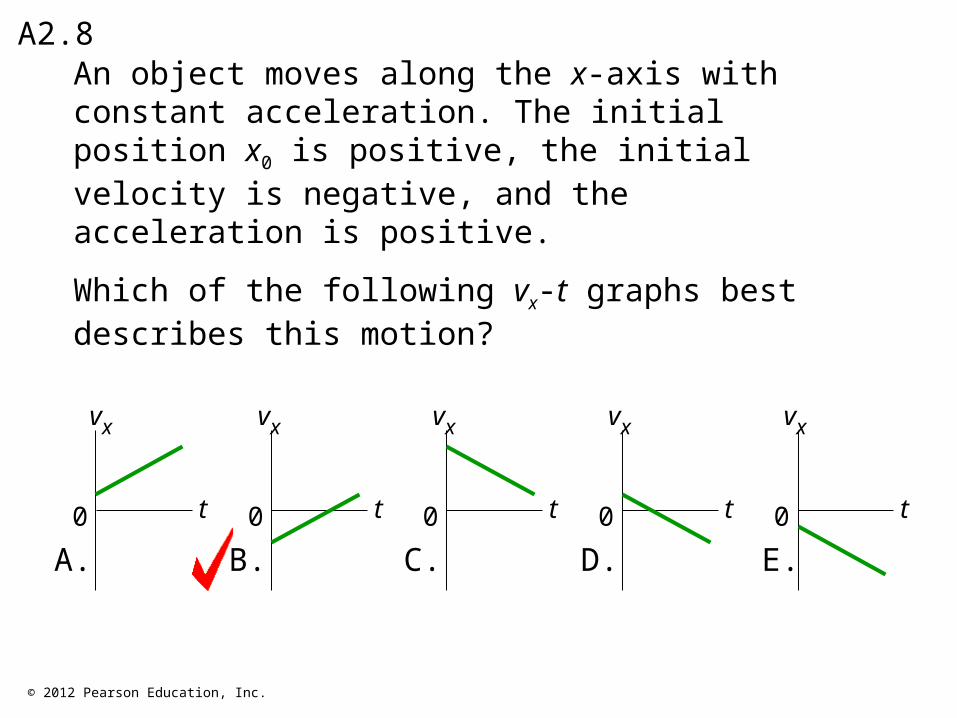
An object moves along the x-axis with constant acceleration. The initial position x0 is positive, the initial velocity is negative, and the acceleration is positive.
Which of the following vx-t graphs best describes this motion?
A2.8
t
vx
0
A.
t
vx
0
B.
t
vx
0
C.
t
vx
0
D.
t
vx
E.
0
© 2012 Pearson Education, Inc.
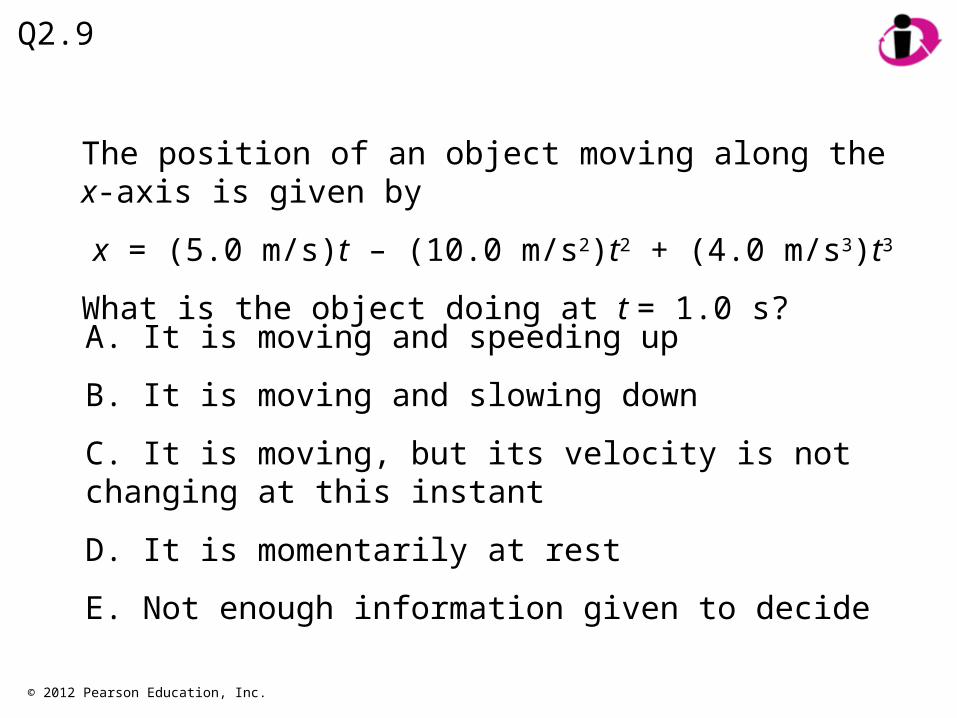
The position of an object moving along the x-axis is given by
x = (5.0 m/s)t – (10.0 m/s2)t2 + (4.0 m/s3)t3
What is the object doing at t = 1.0 s?
Q2.9
A. It is moving and speeding up
B. It is moving and slowing down
C. It is moving, but its velocity is not changing at this instant
D. It is momentarily at rest
E. Not enough information given to decide
© 2012 Pearson Education, Inc.
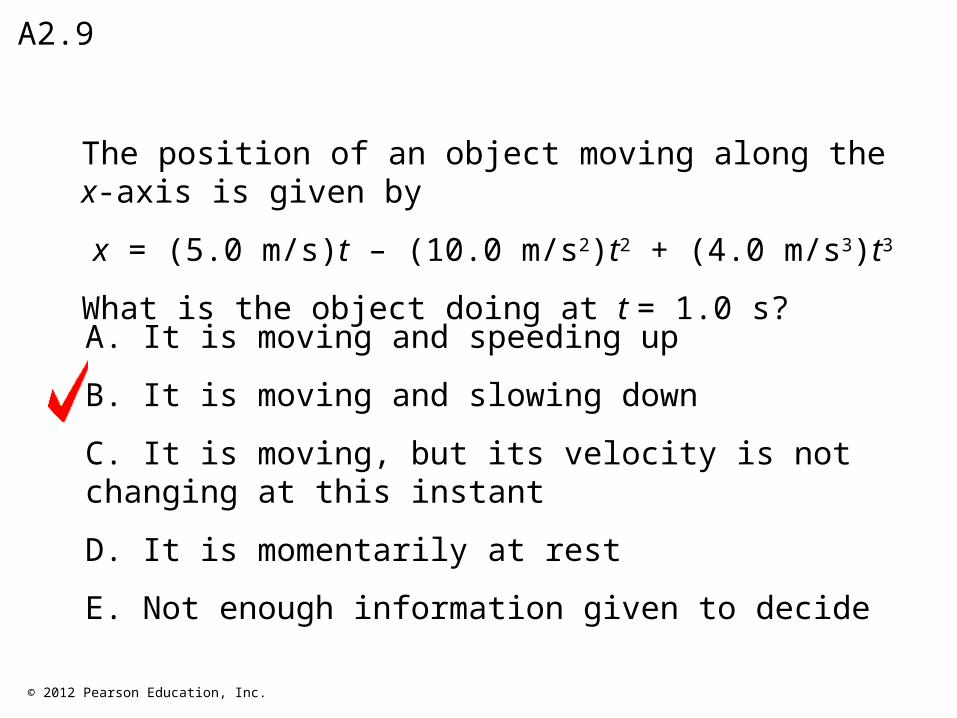
The position of an object moving along the x-axis is given by
x = (5.0 m/s)t – (10.0 m/s2)t2 + (4.0 m/s3)t3
What is the object doing at t = 1.0 s?
A2.9
A. It is moving and speeding up
B. It is moving and slowing down
C. It is moving, but its velocity is not changing at this instant
D. It is momentarily at rest
E. Not enough information given to decide

© 2012 Pearson Education, Inc.
Q2.10
t
ax
0
A.
t
ax
0
B.
t
ax
0
C.
t
ax
0
D.
t
ax
E.
0
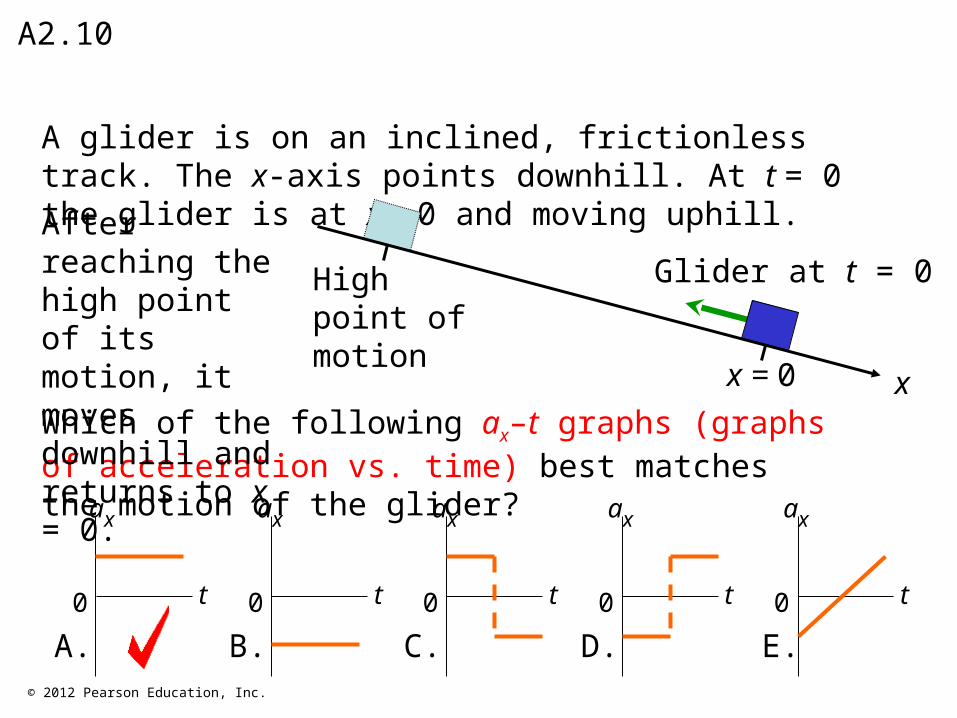
A glider is on an inclined, frictionless track. The x-axis points downhill. At t = 0 the glider is at x = 0 and moving uphill.
Which of the following ax–t graphs (graphs of acceleration vs. time) best matches the motion of the glider?
xx = 0
Glider at t = 0High point of motion
After reaching the high point of its motion, it moves downhill and returns to x = 0.
© 2012 Pearson Education, Inc.
A2.10
t
ax
0
A.
t
ax
0
B.
t
ax
0
C.
t
ax
0
D.
t
ax
E.
0
A glider is on an inclined, frictionless track. The x-axis points downhill. At t = 0 the glider is at x = 0 and moving uphill.
Which of the following ax–t graphs (graphs of acceleration vs. time) best matches the motion of the glider?
xx = 0
Glider at t = 0High point of motion
After reaching the high point of its motion, it moves downhill and returns to x = 0.

© 2012 Pearson Education, Inc.
Q2.11
t
vx
0
A.
t
vx
0
B.
t
vx
0
C.
t
vx
0
D.
t
vx
E.
0
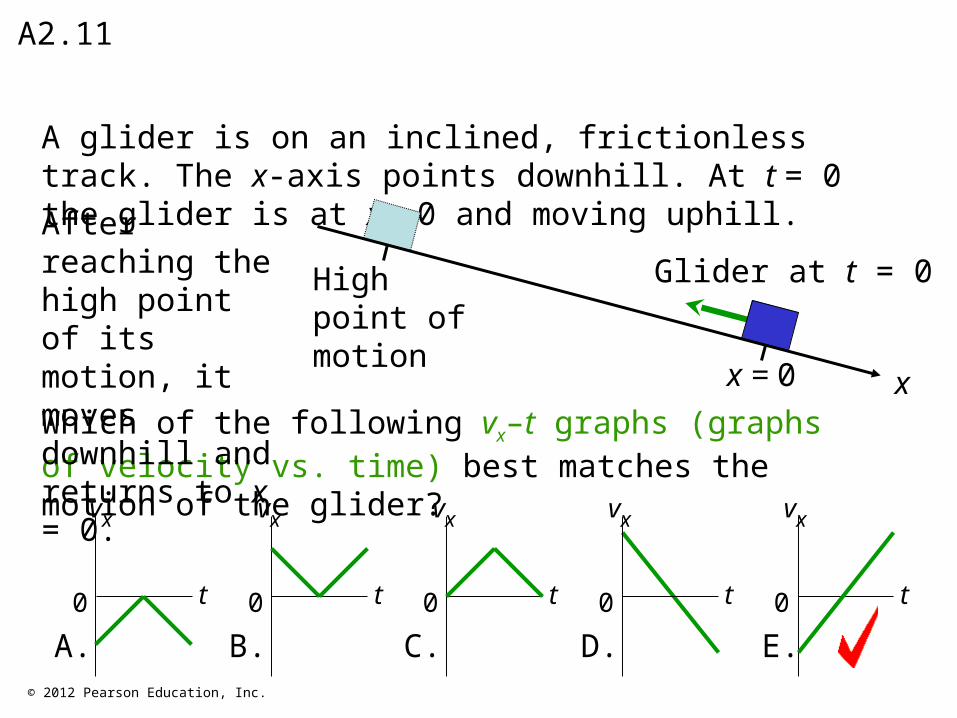
A glider is on an inclined, frictionless track. The x-axis points downhill. At t = 0 the glider is at x = 0 and moving uphill.
Which of the following vx–t graphs (graphs of velocity vs. time) best matches the motion of the glider?
xx = 0
Glider at t = 0High point of motion
After reaching the high point of its motion, it moves downhill and returns to x = 0.
© 2012 Pearson Education, Inc.
A2.11
t
vx
0
A.
t
vx
0
B.
t
vx
0
C.
t
vx
0
D.
t
vx
E.
0
A glider is on an inclined, frictionless track. The x-axis points downhill. At t = 0 the glider is at x = 0 and moving uphill.
Which of the following vx–t graphs (graphs of velocity vs. time) best matches the motion of the glider?
xx = 0
Glider at t = 0High point of motion
After reaching the high point of its motion, it moves downhill and returns to x = 0.
© 2012 Pearson Education, Inc.
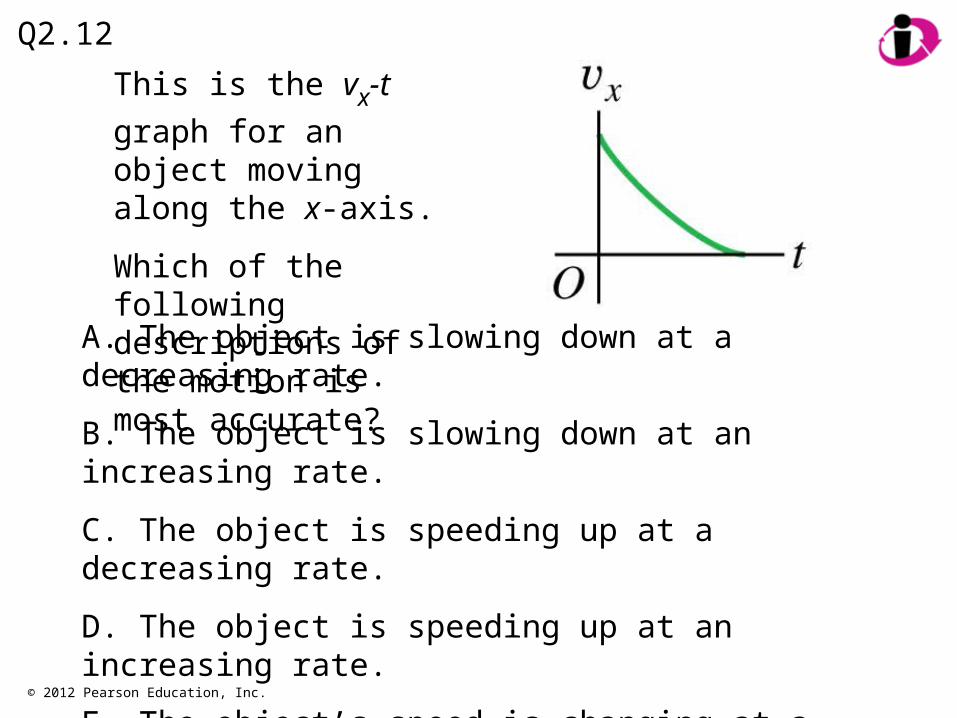
This is the vx-t graph for
an object moving along the x-axis.
Which of the following descriptions of the motion is most accurate?
Q2.12
A. The object is slowing down at a decreasing rate.
B. The object is slowing down at an increasing rate.
C. The object is speeding up at a decreasing rate.
D. The object is speeding up at an increasing rate.
E. The object’s speed is changing at a steady rate.

© 2012 Pearson Education, Inc.
This is the vx-t graph for
an object moving along the x-axis.
Which of the following descriptions of the motion is most accurate?
A2.12
A. The object is slowing down at a decreasing rate.
B. The object is slowing down at an increasing rate.
C. The object is speeding up at a decreasing rate.
D. The object is speeding up at an increasing rate.
E. The object’s speed is changing at a steady rate.

© 2012 Pearson Education, Inc.
You are given the vx-t graph for an object moving along
the x-axis with constant acceleration. Which of the following could you not determine from the information given in this graph alone?
Q2.13
A. the object’s x-acceleration at any time t
B. the object’s x-velocity at any time t
C. the object’s position at any time t
D. more than one of the above
E. misleading question—you could determine
all of these from the vx-t graph alone

© 2012 Pearson Education, Inc.
You are given the vx-t graph for an object moving along
the x-axis with constant acceleration. Which of the following could you not determine from the information given in this graph alone?
A2.13
A. the object’s x-acceleration at any time t
B. the object’s x-velocity at any time t
C. the object’s position at any time t
D. more than one of the above
E. misleading question—you could determine
all of these from the vx-t graph alone
© 2012 Pearson Education, Inc.
Q2.14
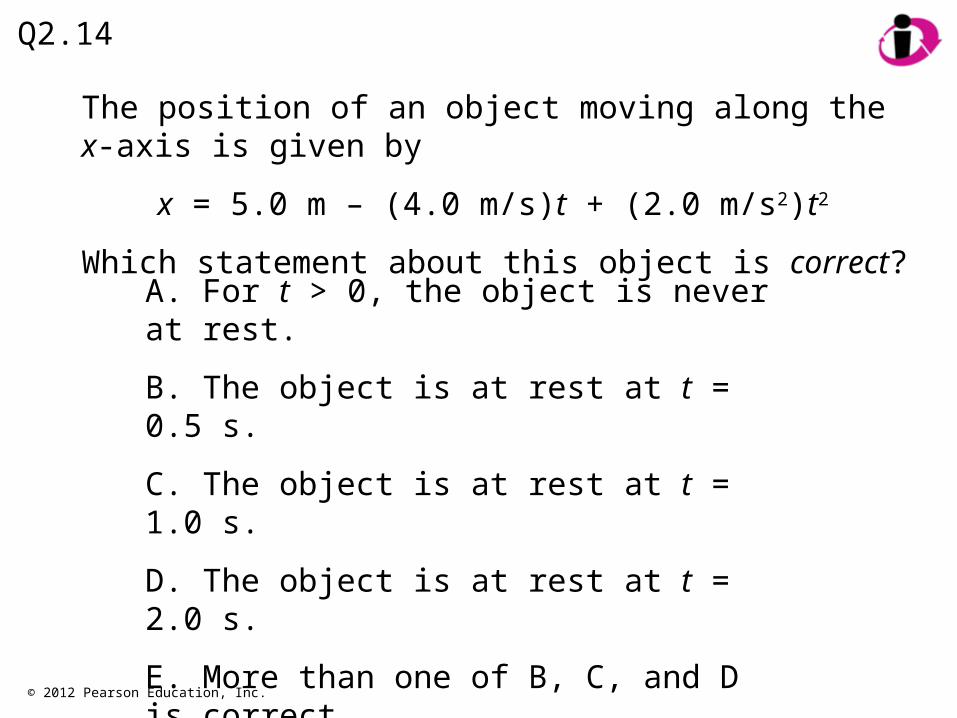
A. For t > 0, the object is never at rest.
B. The object is at rest at t = 0.5 s.
C. The object is at rest at t = 1.0 s.
D. The object is at rest at t = 2.0 s.
E. More than one of B, C, and D is correct.
The position of an object moving along the x-axis is given by
x = 5.0 m – (4.0 m/s)t + (2.0 m/s2)t2
Which statement about this object is correct?
© 2012 Pearson Education, Inc.
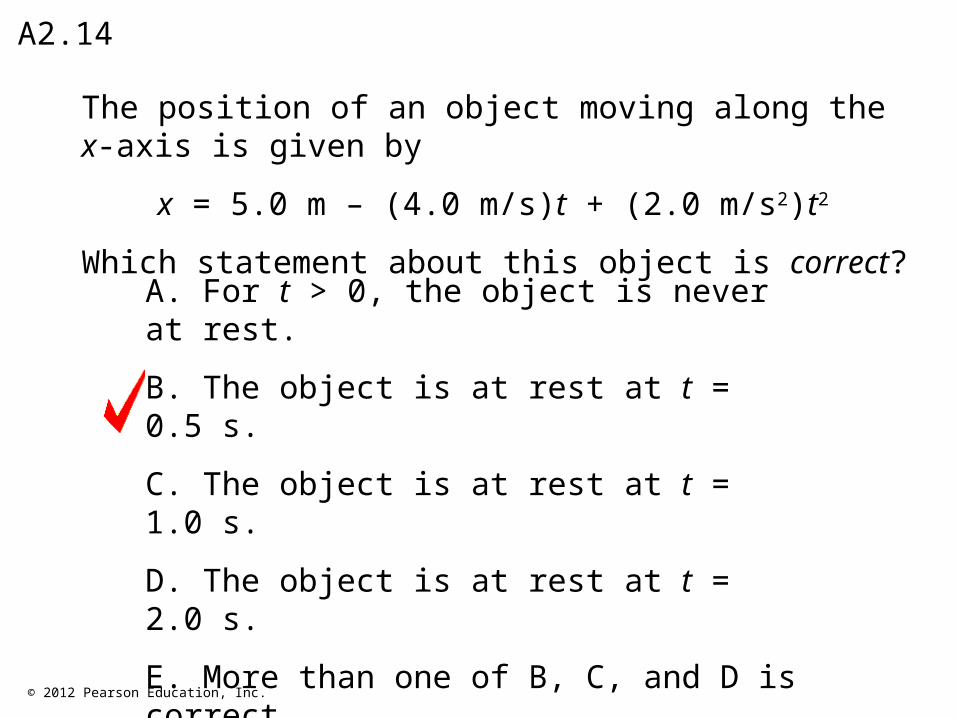
A2.14
A. For t > 0, the object is never at rest.
B. The object is at rest at t = 0.5 s.
C. The object is at rest at t = 1.0 s.
D. The object is at rest at t = 2.0 s.
E. More than one of B, C, and D is correct.
The position of an object moving along the x-axis is given by
x = 5.0 m – (4.0 m/s)t + (2.0 m/s2)t2
Which statement about this object is correct?

© 2012 Pearson Education, Inc.
Q2.15
The position of an object moving along the x-axis is given by
x = 5.0 m – (4.0 m/s)t + (2.0 m/s2)t2
How many times does this object pass through the point x = 0?
A. twice, first moving in the positive x-direction, then moving in the negative x-direction
B. twice, first moving in the negative x-direction, then moving in the positive x-direction
C. only once, moving in the positive x-direction
D. only once, moving in the negative x-direction
E. never
© 2012 Pearson Education, Inc.
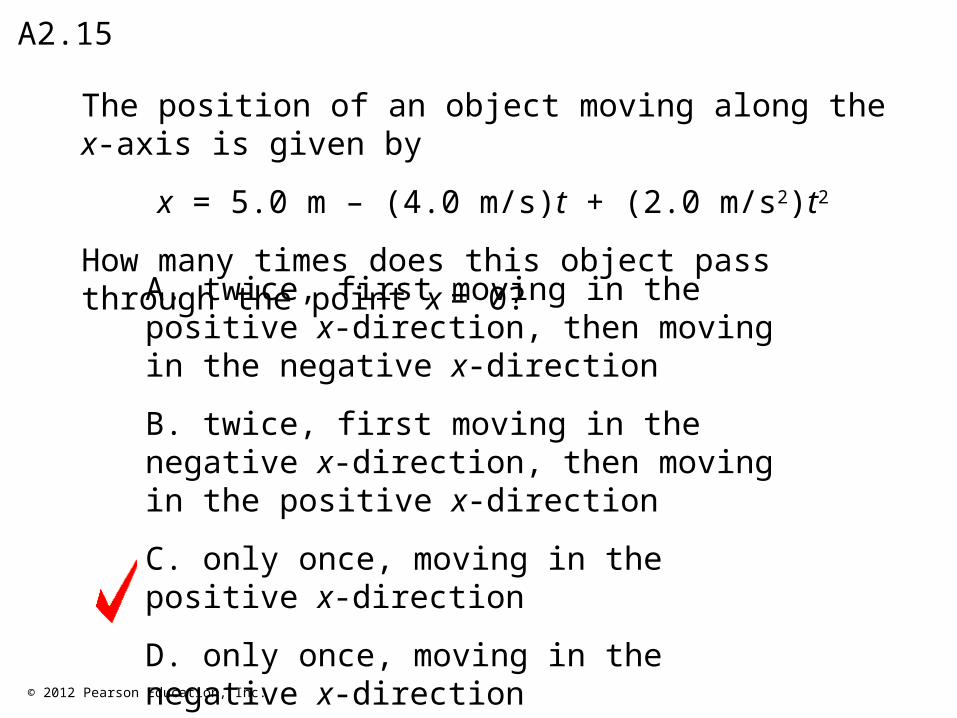
The position of an object moving along the x-axis is given by
x = 5.0 m – (4.0 m/s)t + (2.0 m/s2)t2
How many times does this object pass through the point x = 0?
A2.15
A. twice, first moving in the positive x-direction, then moving in the negative x-direction
B. twice, first moving in the negative x-direction, then moving in the positive x-direction
C. only once, moving in the positive x-direction
D. only once, moving in the negative x-direction
E. never

© 2012 Pearson Education, Inc.
The position of an object moving along the x-axis is given by
x = 5.0 m + (4.0 m/s)t – (2.0 m/s2)t2
Q2.16
Which of the following x–t graphs (graphs of position vs. time) is correct for this motion?
t
x
0
A.
t
x
0
B.
t
x
0
C.
t
x
0
D.
t
x
0
E.
© 2012 Pearson Education, Inc.
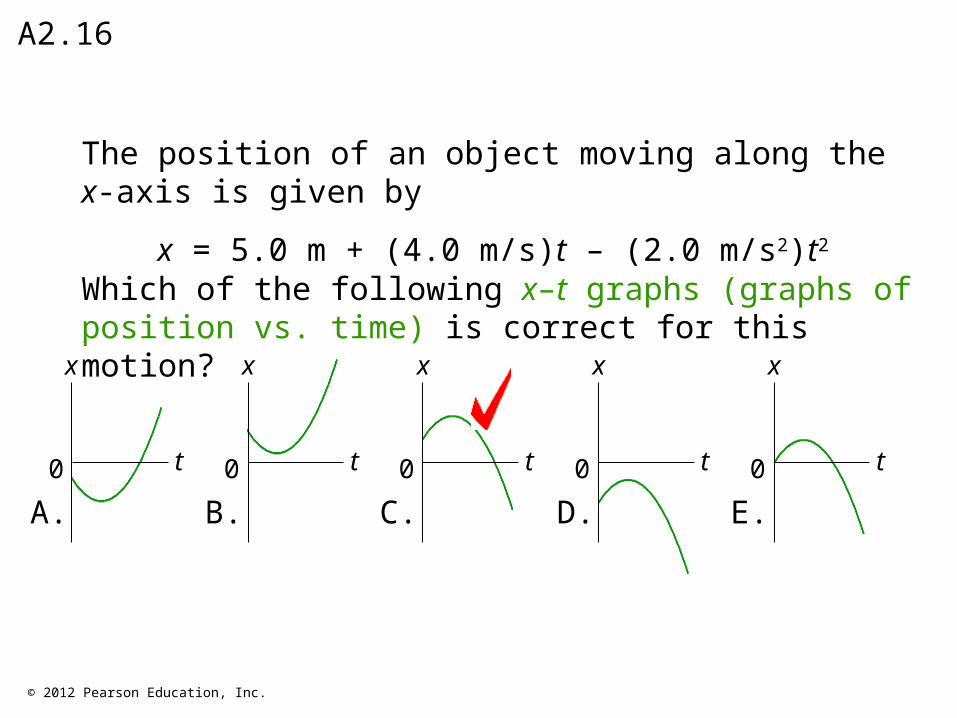
The position of an object moving along the x-axis is given by
x = 5.0 m + (4.0 m/s)t – (2.0 m/s2)t2
A2.16
Which of the following x–t graphs (graphs of position vs. time) is correct for this motion?
t
x
0
A.
t
x
0
B.
t
x
0
C.
t
x
0
D.
t
x
0
E.
© 2012 Pearson Education, Inc.
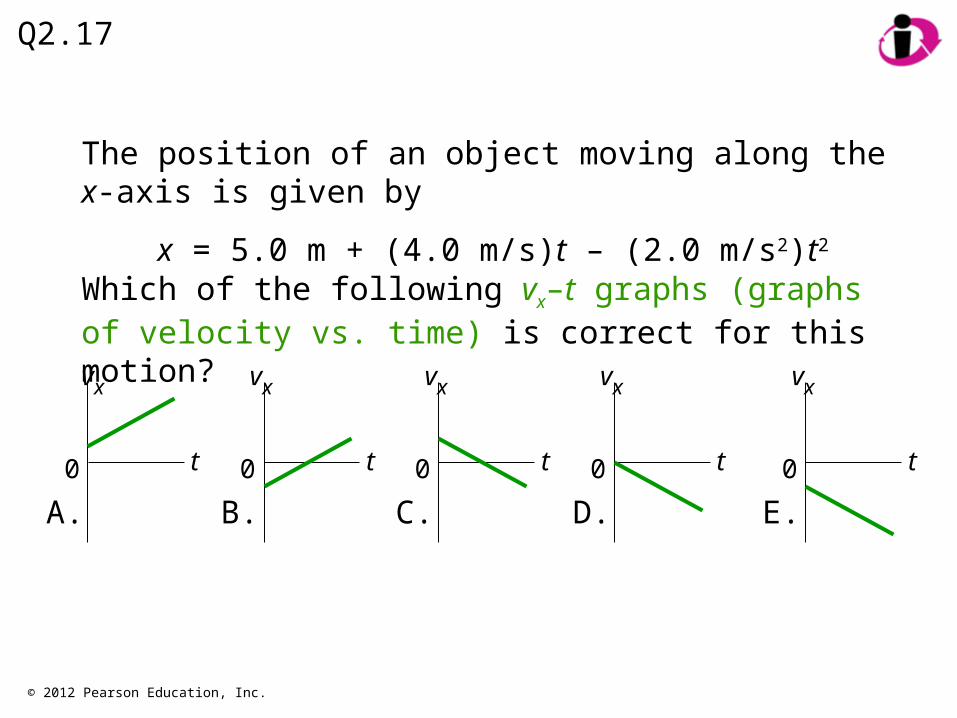
Q2.17
Which of the following vx–t graphs (graphs of velocity vs. time) is correct for this motion?
The position of an object moving along the x-axis is given by
x = 5.0 m + (4.0 m/s)t – (2.0 m/s2)t2
t
vx
0
A.
t
vx
0
B.
t
vx
0
C.
t
vx
0
D.
t
vx
0
E.

© 2012 Pearson Education, Inc.
A2.17
Which of the following vx–t graphs (graphs of velocity vs. time) is correct for this motion?
t
vx
0
A.
t
vx
0
B.
t
vx
0
C.
t
vx
0
D.
The position of an object moving along the x-axis is given by
x = 5.0 m + (4.0 m/s)t – (2.0 m/s2)t2
t
vx
0
E.

© 2012 Pearson Education, Inc.
If you toss a ball upward with a certain initial speed, it falls freely and reaches a maximum height h.By what factor must you increase the initial speed of the ball for it to reach a maximum height 3h?
Q2.18
A.
B. 3
C.
D. 9
E. 27
3
3 3

© 2012 Pearson Education, Inc.
If you toss a ball upward with a certain initial speed, it falls freely and reaches a maximum height h.By what factor must you increase the initial speed of the ball for it to reach a maximum height 3h?
A2.18
A.
B. 3
C.
D. 9
E. 27
3
3 3
Related Documents