© 2012 McGraw-Hill Education (Asia) Segment Reporting, Decentralization, and the Balanced Scorecard Chapter 13

Welcome message from author
This document is posted to help you gain knowledge. Please leave a comment to let me know what you think about it! Share it to your friends and learn new things together.
Transcript

© 2012 McGraw-Hill Education (Asia)
Segment Reporting, Decentralization, and the Balanced Scorecard
Chapter 13

McGraw-Hill Education (Asia) Garrison, Noreen, Brewer, Cheng & Yuen Slide 2
Decentralization in Organizations
Benefits ofDecentralization
Top managementfreed to concentrate
on strategy.
Top managementfreed to concentrate
on strategy.Lower-level managers
gain experience indecision-making.
Lower-level managersgain experience indecision-making. Decision-making
authority leads tojob satisfaction.
Decision-makingauthority leads tojob satisfaction.
Lower-level decisionsoften based on
better information.
Lower-level decisionsoften based on
better information.Lower level managers can respond quickly
to customers.
Lower level managers can respond quickly
to customers.

McGraw-Hill Education (Asia) Garrison, Noreen, Brewer, Cheng & Yuen Slide 3
Decentralization in Organizations
Disadvantages ofDecentralization
Lower-level managersmay make decisionswithout seeing the
“big picture.”
Lower-level managersmay make decisionswithout seeing the
“big picture.”
May be a lack ofcoordination among
autonomousmanagers.
May be a lack ofcoordination among
autonomousmanagers.
Lower-level manager’sobjectives may not
be those of theorganization.
Lower-level manager’sobjectives may not
be those of theorganization.
May be difficult tospread innovative ideas
in the organization.
May be difficult tospread innovative ideas
in the organization.

McGraw-Hill Education (Asia) Garrison, Noreen, Brewer, Cheng & Yuen Slide 4
Cost, Profit, and Investments Centers
ResponsibilityCenter
ResponsibilityCenter
CostCenterCost
CenterProfit
CenterProfit
CenterInvestment
CenterInvestment
Center
Cost, profit,and investmentcenters are allknown asresponsibilitycenters.
McGraw-Hill Education (Asia) Garrison, Noreen, Brewer, Cheng & Yuen Slide 5
Cost Center
A segment whose manager has control over costs, but not over revenues or investment funds.
McGraw-Hill Education (Asia) Garrison, Noreen, Brewer, Cheng & Yuen Slide 6
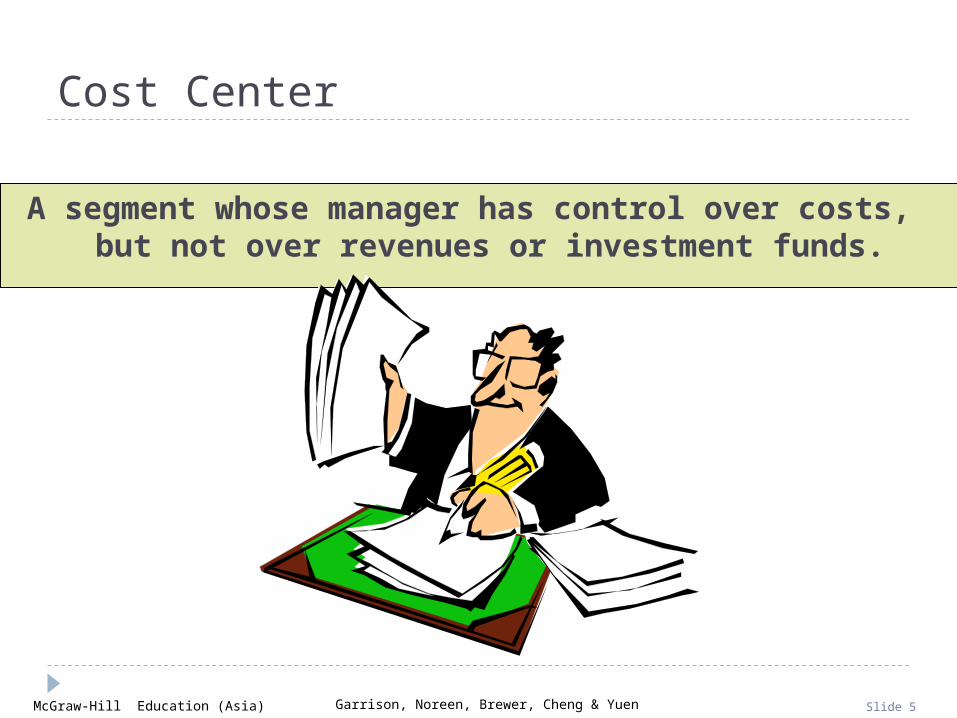
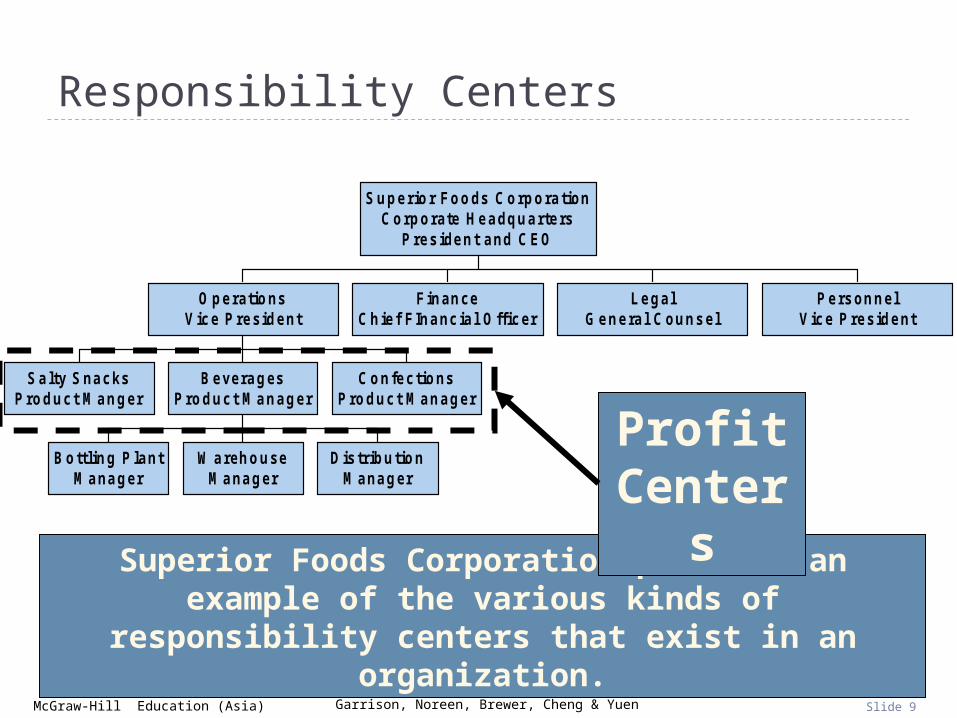
Profit Center
A segment whose manager has control over both costs and
revenues, but no control over
investment funds.
Revenues
Sales
Interest
Other
Costs
Mfg. costs
Commissions
Salaries
Other
McGraw-Hill Education (Asia) Garrison, Noreen, Brewer, Cheng & Yuen Slide 7
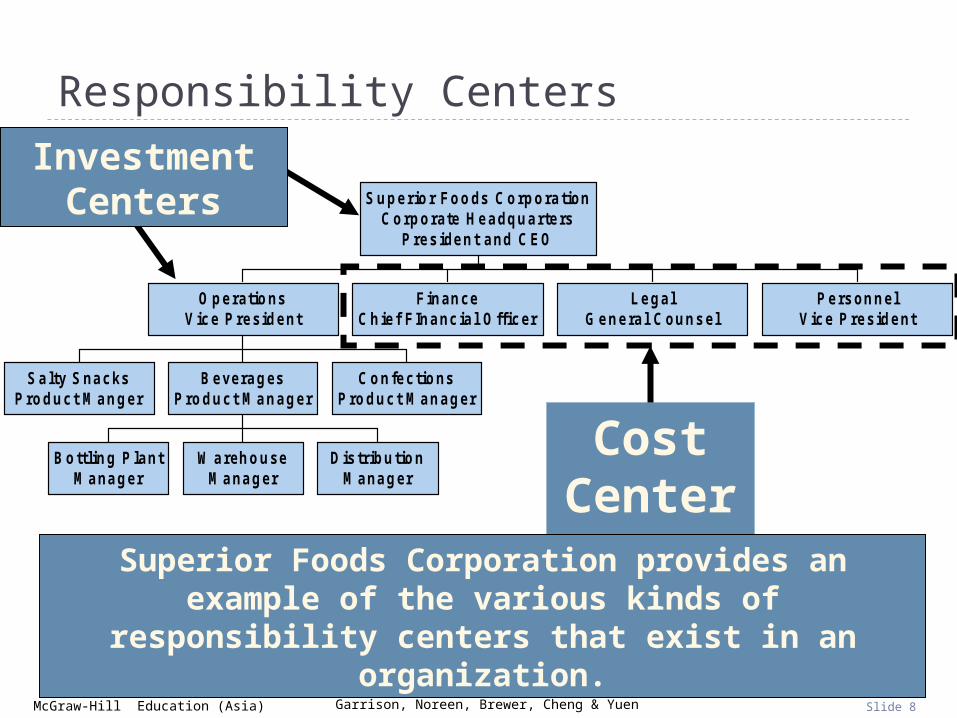
Investment Center
A segment whose manager has control over costs, revenues,
and investments in operating assets.
Corporate Headquarters
McGraw-Hill Education (Asia) Garrison, Noreen, Brewer, Cheng & Yuen Slide 8
Responsibility Centers
Salty SnacksProduct M anger
Bottling P lantM anager
W arehouseM anager
DistributionM anager
BeveragesProduct M anager
ConfectionsProduct M anager
OperationsVice President
FinanceChief FInancial Officer
LegalGeneral Counsel
PersonnelVice President
Superior Foods CorporationCorporate Headquarters
President and CEO
Cost Centers
Investment Centers
Superior Foods Corporation provides an example of the various kinds of responsibility centers that exist in an
organization.
Helen Roybark
Slide 8Moved the bottom textbox upward (below the bottom dotted line).
McGraw-Hill Education (Asia) Garrison, Noreen, Brewer, Cheng & Yuen Slide 9
Responsibility Centers
Salty SnacksProduct M anger
Bottling P lantM anager
W arehouseM anager
DistributionM anager
BeveragesProduct M anager
ConfectionsProduct M anager
OperationsVice President
FinanceChief FInancial Officer
LegalGeneral Counsel
PersonnelVice President
Superior Foods CorporationCorporate Headquarters
President and CEO
Superior Foods Corporation provides an example of the various kinds of responsibility centers that exist in an
organization.
Profit Centers

McGraw-Hill Education (Asia) Garrison, Noreen, Brewer, Cheng & Yuen Slide 10
Responsibility Centers
Salty SnacksProduct M anger
Bottling P lantM anager
W arehouseM anager
DistributionM anager
BeveragesProduct M anager
ConfectionsProduct M anager
OperationsVice President
FinanceChief FInancial Officer
LegalGeneral Counsel
PersonnelVice President
Superior Foods CorporationCorporate Headquarters
President and CEO
Cost Centers
Superior Foods Corporation provides an example of the various kinds of responsibility centers that exist in an
organization.

McGraw-Hill Education (Asia) Garrison, Noreen, Brewer, Cheng & Yuen Slide 11
Learning Objective 1
Prepare a segmented income Prepare a segmented income statement using the statement using the
contribution format, and contribution format, and explain the difference between explain the difference between
traceable fixed costs and traceable fixed costs and common fixed costs.common fixed costs.

McGraw-Hill Education (Asia) Garrison, Noreen, Brewer, Cheng & Yuen Slide 12
Decentralization and Segment Reporting
A segmentsegment is any part or activity of an
organization about which a manager
seeks cost, revenue, or profit data.
Popular FoodsPopular Foods
An Individual Store
A Sales Territory
A Service Center
McGraw-Hill Education (Asia) Garrison, Noreen, Brewer, Cheng & Yuen Slide 13
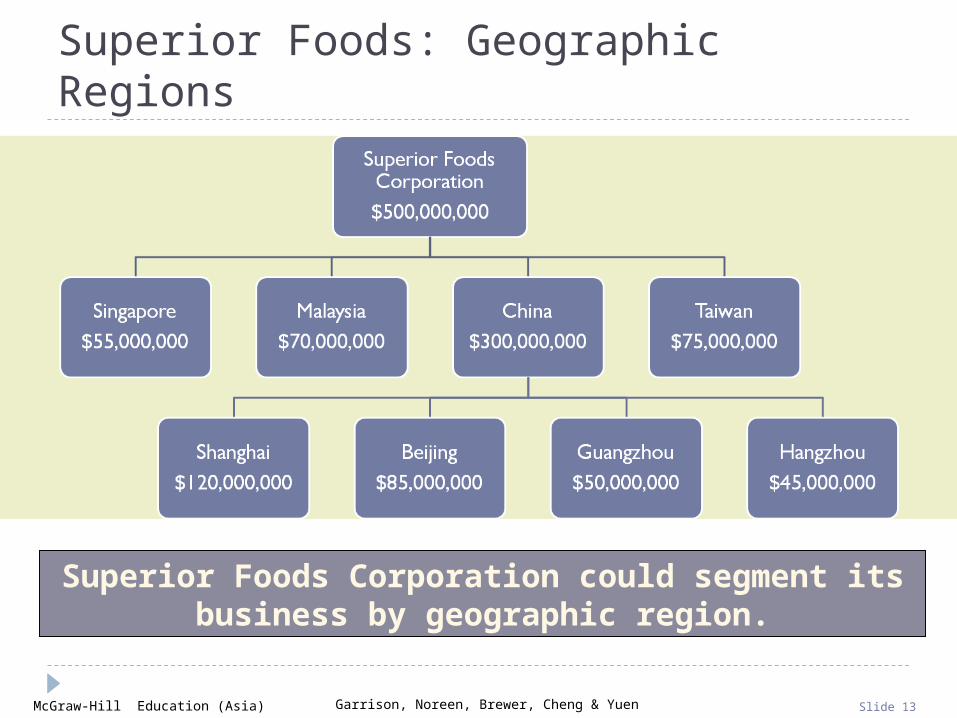
Superior Foods: Geographic Regions
Superior Foods Corporation could segment its business by geographic region.

McGraw-Hill Education (Asia) Garrison, Noreen, Brewer, Cheng & Yuen Slide 14
Superior Foods: Customer Channel
Superior Foods Corporation could segment its business by customer channel.

McGraw-Hill Education (Asia) Garrison, Noreen, Brewer, Cheng & Yuen Slide 15
Keys to Segmented Income Statements
There are two keys to building segmented income statements:
A contribution format should be used because it separates fixed from variable costs
and it enables the calculation of a contribution margin.
Traceable fixed costs should be separated from common fixed costs to enable the
calculation of a segment margin.

McGraw-Hill Education (Asia) Garrison, Noreen, Brewer, Cheng & Yuen Slide 16
Identifying Traceable Fixed Costs
Traceable costs arise because of the existence of a particular segment and would disappear over time if
the segment itself disappeared.
No computer division means . . .
No computerdivision manager.
McGraw-Hill Education (Asia) Garrison, Noreen, Brewer, Cheng & Yuen Slide 17
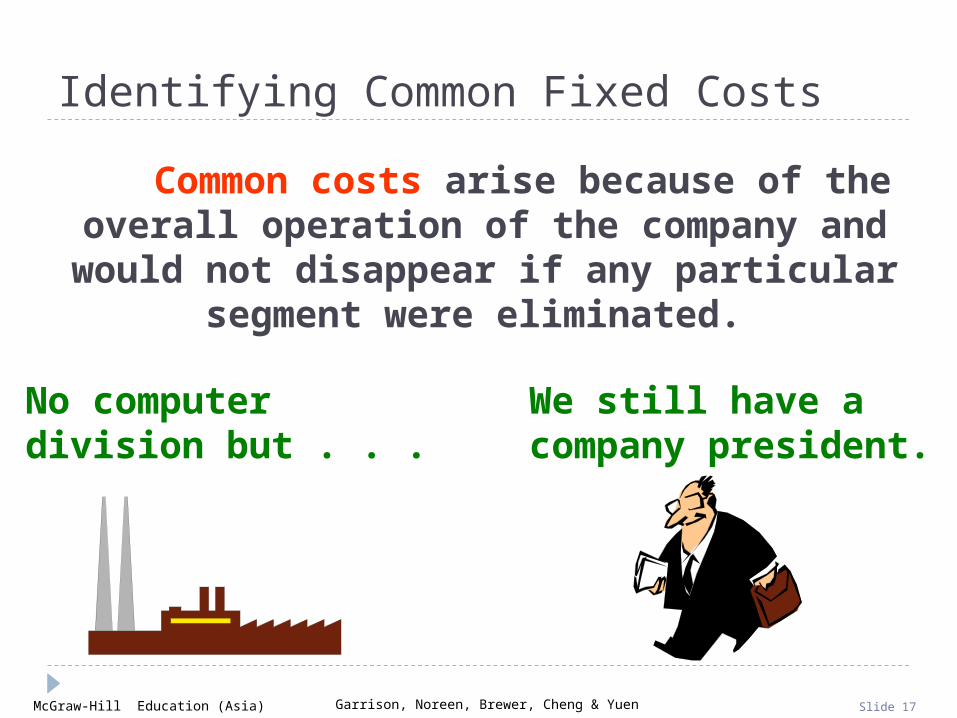
Identifying Common Fixed Costs
Common costs arise because of the overall operation of the company and would not disappear if any particular segment were
eliminated.
No computer division but . . .
We still have acompany president.

McGraw-Hill Education (Asia) Garrison, Noreen, Brewer, Cheng & Yuen Slide 18
Traceable Costs Can Become Common Costs
It is important to realize that the traceable fixed costs of one segment may be a
common fixed cost of another segment.
For example, the landing fee paid to land an airplane at an
airport is traceable to the particular flight, but it is not
traceable to first-class, business-class, and
economy-class passengers.
McGraw-Hill Education (Asia) Garrison, Noreen, Brewer, Cheng & Yuen Slide 19
Segment MarginThe segment margin, which is computed by
subtracting the traceable fixed costs of a segment from its contribution margin, is the best gauge of
the long-run profitability of a segment.
TimeTime
Pro
fits
Pro
fits
McGraw-Hill Education (Asia) Garrison, Noreen, Brewer, Cheng & Yuen Slide 20
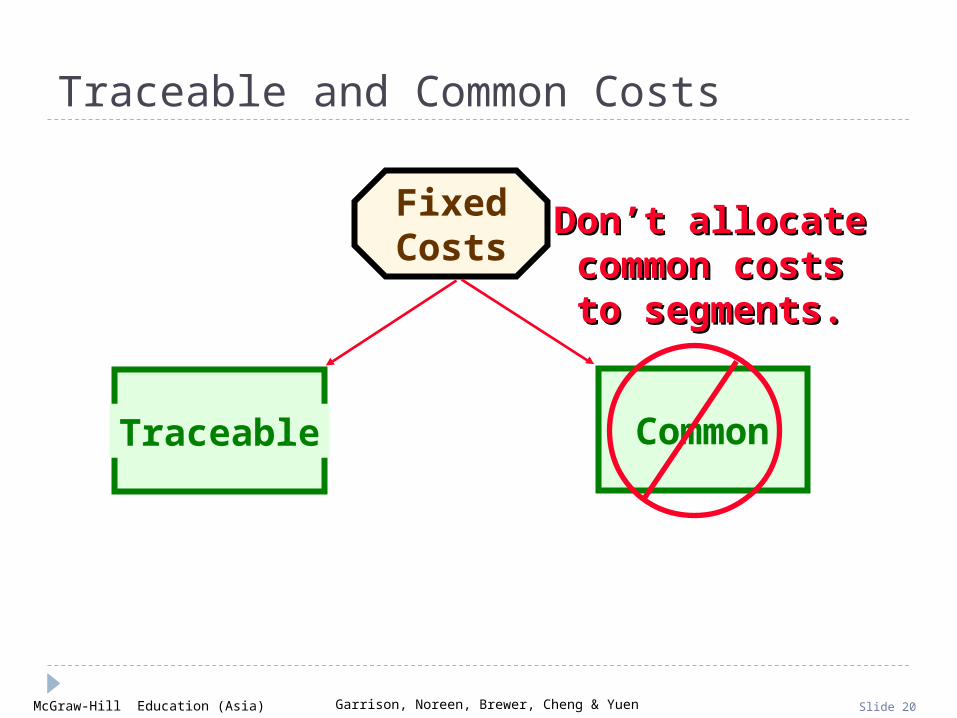
Traceable and Common Costs
FixedCosts
Traceable Common
Don’t allocateDon’t allocatecommon costs to common costs to
segments.segments.

McGraw-Hill Education (Asia) Garrison, Noreen, Brewer, Cheng & Yuen Slide 21
Activity-Based Costing
9-inch 12-inch 18-inch TotalWarehouse sq. ft. 1,000 4,000 5,000 10,000 Lease price per sq. ft. 4$ 4$ 4$ 4$ Total lease cost 4,000$ 16,000$ 20,000$ 40,000$
Pipe Products
Activity-based costing can help identify how costs shared by more than one segment are traceable to
individual segments. Assume that three products, 9-inch, 12-inch, and 18-inch pipe, share 10,000
square feet of warehousing space, which is leased at a price of $4 per square foot.
If the 9-inch, 12-inch, and 18-inch pipes occupy 1,000, 4,000, and 5,000 square feet, respectively, then ABC can be used to trace the warehousing costs to the
three products as shown.
McGraw-Hill Education (Asia) Garrison, Noreen, Brewer, Cheng & Yuen Slide 22
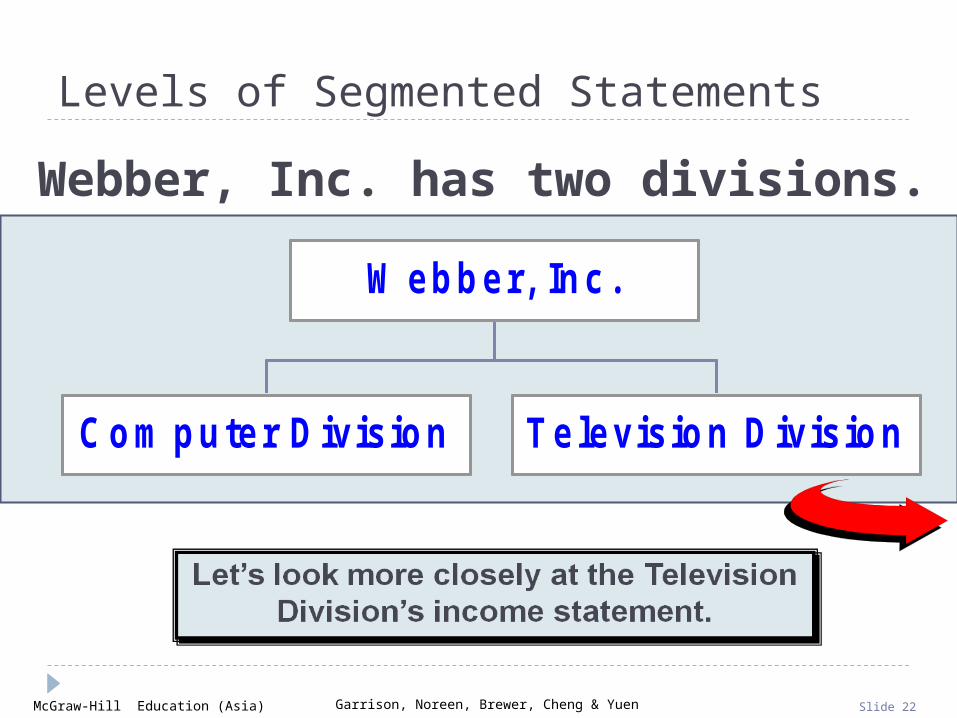
Levels of Segmented Statements
Webber, Inc. has two divisions.
Com puter Division Television Division
W ebber, Inc.

McGraw-Hill Education (Asia) Garrison, Noreen, Brewer, Cheng & Yuen Slide 23
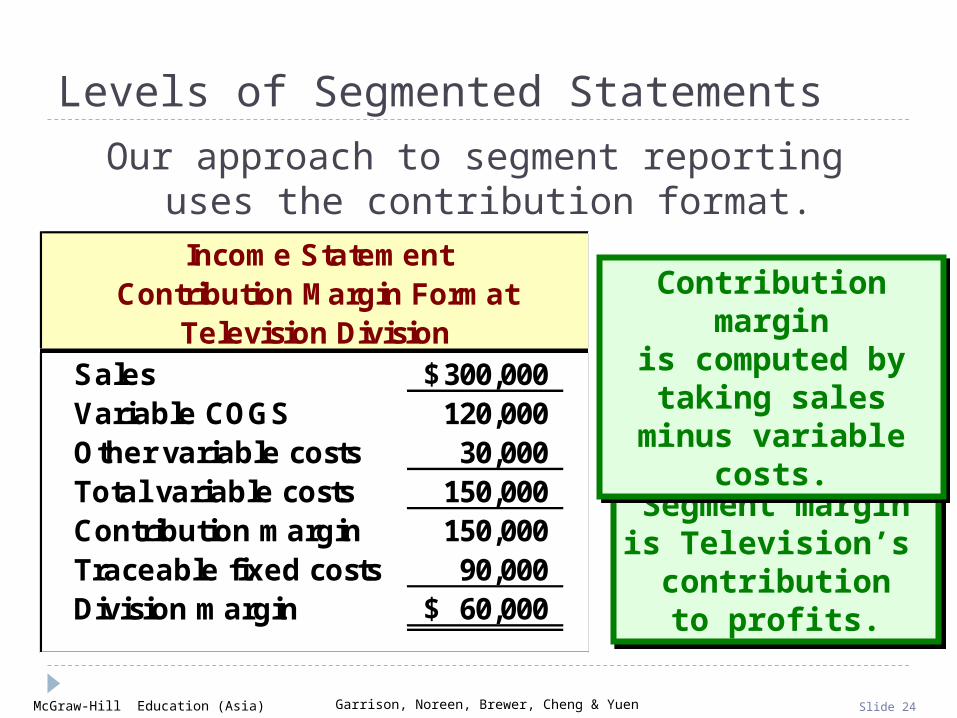
Levels of Segmented Statements
Our approach to segment reporting uses the contribution format.
Income StatementContribution Margin Format
Television DivisionSales 300,000$ Variable COGS 120,000 Other variable costs 30,000 Total variable costs 150,000 Contribution margin 150,000 Traceable fixed costs 90,000 Division margin 60,000$
Cost of goodssold consists of
variable manufacturing
costs.
Cost of goodssold consists of
variable manufacturing
costs.
Fixed andvariable costsare listed in
separatesections.
Fixed andvariable costsare listed in
separatesections.
McGraw-Hill Education (Asia) Garrison, Noreen, Brewer, Cheng & Yuen Slide 24
Levels of Segmented Statements
Segment marginis Television’s
contributionto profits.
Segment marginis Television’s
contributionto profits.
Income StatementContribution Margin Format
Television DivisionSales 300,000$ Variable COGS 120,000 Other variable costs 30,000 Total variable costs 150,000 Contribution margin 150,000 Traceable fixed costs 90,000 Division margin 60,000$
Contribution marginis computed by
taking sales minus variable costs.
Contribution marginis computed by
taking sales minus variable costs.
Our approach to segment reporting uses the contribution format.
McGraw-Hill Education (Asia) Garrison, Noreen, Brewer, Cheng & Yuen Slide 25
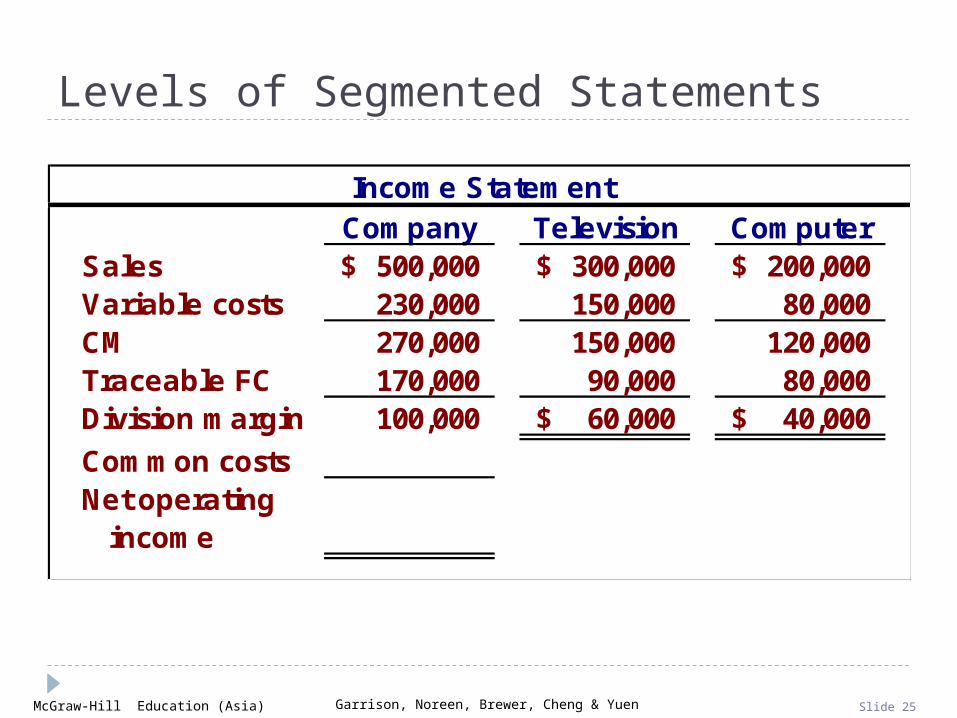
Levels of Segmented Statements
Income StatementCompany Television Computer
Sales 500,000$ 300,000$ 200,000$ Variable costs 230,000 150,000 80,000 CM 270,000 150,000 120,000 Traceable FC 170,000 90,000 80,000 Division margin 100,000 60,000$ 40,000$
Common costsNet operating income
McGraw-Hill Education (Asia) Garrison, Noreen, Brewer, Cheng & Yuen Slide 26
Levels of Segmented Statements
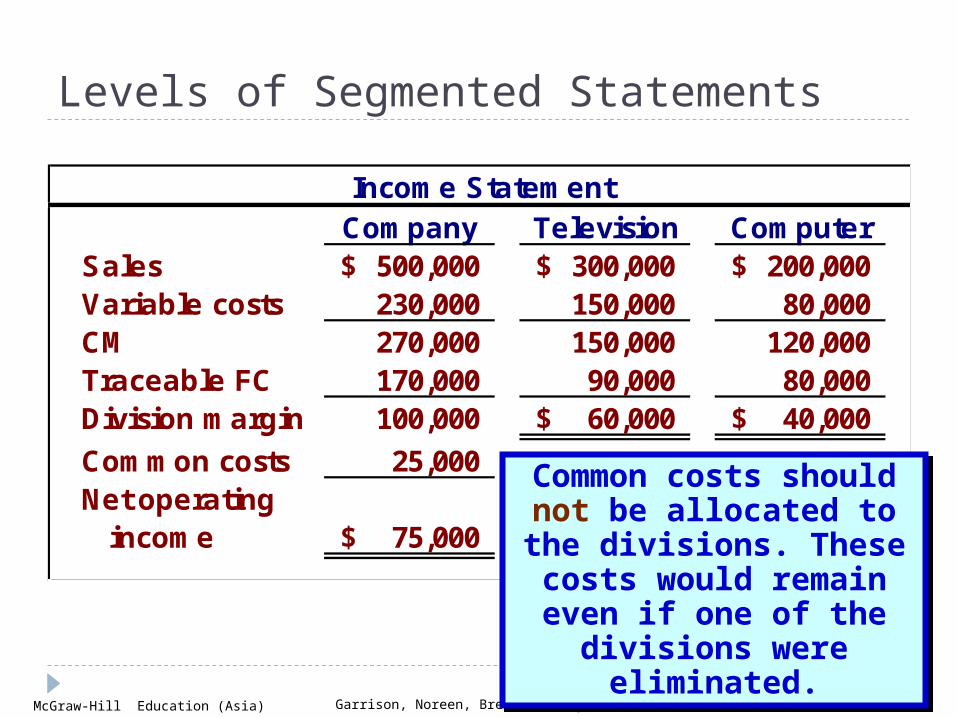
Income StatementCompany Television Computer
Sales 500,000$ 300,000$ 200,000$ Variable costs 230,000 150,000 80,000 CM 270,000 150,000 120,000 Traceable FC 170,000 90,000 80,000 Division margin 100,000 60,000$ 40,000$
Common costs 25,000 Net operating income 75,000$
Common costs should not be allocated to the
divisions. These costs would remain even if one
of the divisions were eliminated.
Common costs should not be allocated to the
divisions. These costs would remain even if one
of the divisions were eliminated.

McGraw-Hill Education (Asia) Garrison, Noreen, Brewer, Cheng & Yuen Slide 27
Traceable Costs Can Become Common Costs
As previously mentioned, fixed costs that are traceable to one segment can become
common if the company is divided into smaller smaller segments.
Let’s see how this works using the Webber, Inc.
example!
McGraw-Hill Education (Asia) Garrison, Noreen, Brewer, Cheng & Yuen Slide 28
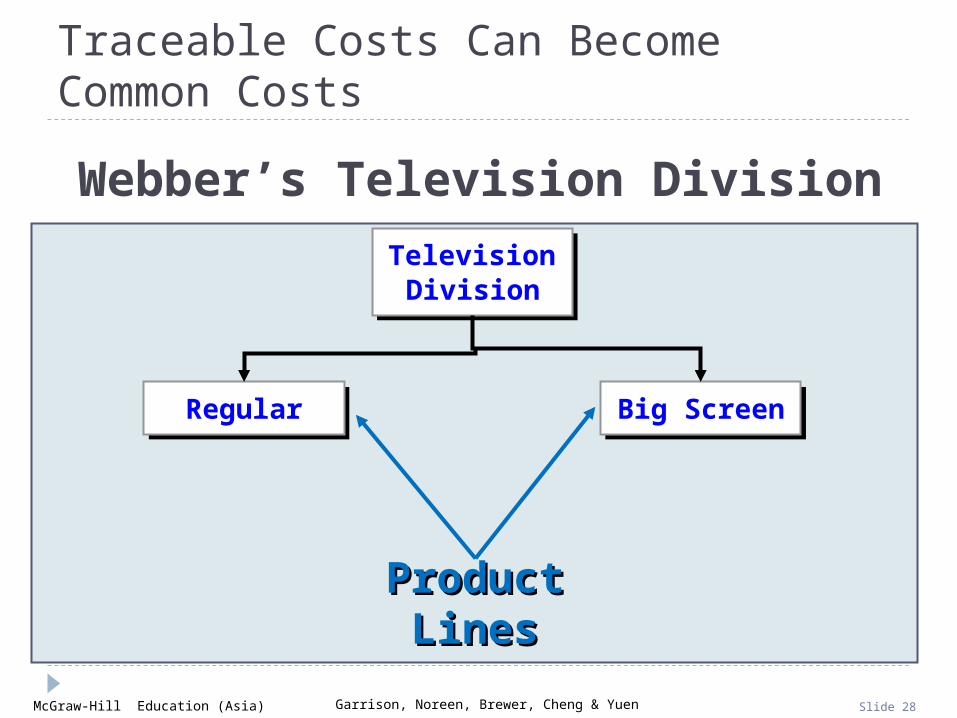
Traceable Costs Can Become Common Costs
ProductProductLinesLines
Regular Big Screen
TelevisionDivision
Webber’s Television Division

McGraw-Hill Education (Asia) Garrison, Noreen, Brewer, Cheng & Yuen Slide 29
Traceable Costs Can Become Common Costs
We obtained the following information fromthe Regular and Big Screen segments.
Income StatementTelevision
Division Regular Big ScreenSales 200,000$ 100,000$ Variable costs 95,000 55,000 CM 105,000 45,000 Traceable FC 45,000 35,000 Product line margin 60,000$ 10,000$
Common costsDivisional margin

McGraw-Hill Education (Asia) Garrison, Noreen, Brewer, Cheng & Yuen Slide 30
Income StatementTelevision
Division Regular Big ScreenSales 300,000$ 200,000$ 100,000$ Variable costs 150,000 95,000 55,000 CM 150,000 105,000 45,000 Traceable FC 80,000 45,000 35,000 Product line margin 70,000 60,000$ 10,000$
Common costs 10,000 Divisional margin 60,000$
Traceable Costs Can Become Common Costs
Fixed costs directly tracedto the Television Division
$80,000 + $10,000 = $90,000
Fixed costs directly tracedto the Television Division
$80,000 + $10,000 = $90,000

McGraw-Hill Education (Asia) Garrison, Noreen, Brewer, Cheng & Yuen Slide 31
External ReportsThe International Financial Reporting Standards (IFRS) and US GAAP require companies to include segmented
financial data in their annual reports.
1. In addition to some compulsory disclosure, companies must report segmented results to shareholders using the same measures to be used by the Chief Operating Decision Maker (CODM) to make decisions
2. Since the contribution approach to segment reporting does not comply with financial reporting standards, it is likely that some managers will choose to construct their segmented financial statements using the absorption approach to comply with GAAP.

McGraw-Hill Education (Asia) Garrison, Noreen, Brewer, Cheng & Yuen Slide 32
Omission of Costs
Costs assigned to a segment should include all costs attributable to that segment from the
company’s entire value chainvalue chain.
Product Customer R&D Design Manufacturing Marketing Distribution Service
Business FunctionsMaking Up The
Value Chain

McGraw-Hill Education (Asia) Garrison, Noreen, Brewer, Cheng & Yuen Slide 33
Inappropriate Methods of Allocating Costs Among Segments
Segment1
Segment3
Segment4
Inappropriateallocation base
Segment2
Failure to tracecosts directly
McGraw-Hill Education (Asia) Garrison, Noreen, Brewer, Cheng & Yuen Slide 34
Common Costs and Segments
Segment1
Segment3
Segment4
Segment2
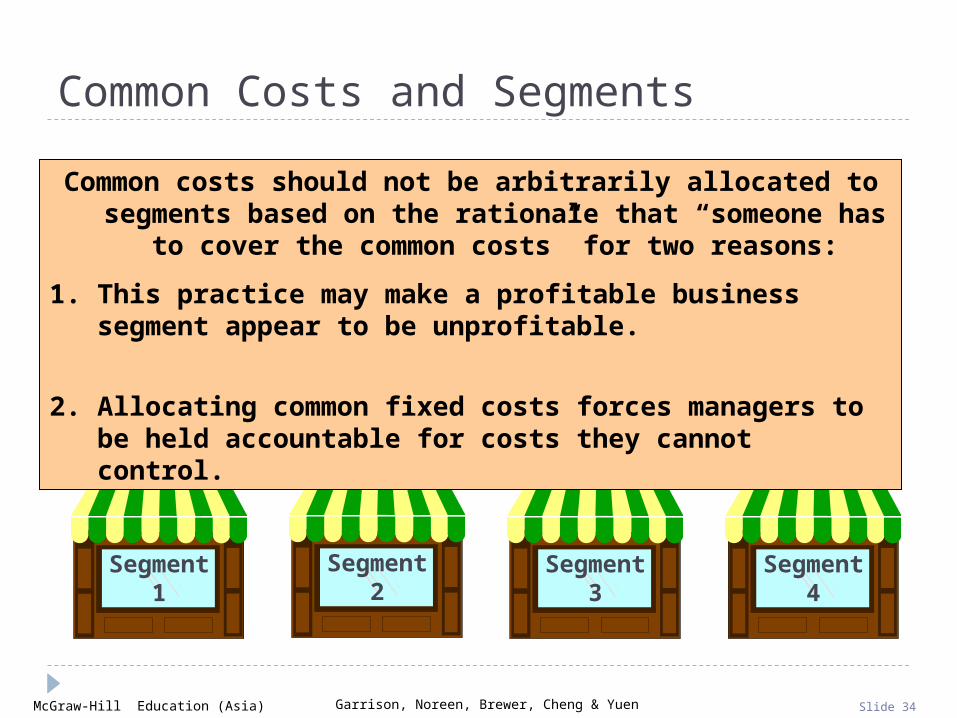
Common costs should not be arbitrarily allocated to segments based on the rationale that “someone has to cover the
common costs” for two reasons:
1. This practice may make a profitable business segment appear to be unprofitable.
2. Allocating common fixed costs forces managers to be held accountable for costs they cannot control.

McGraw-Hill Education (Asia) Garrison, Noreen, Brewer, Cheng & Yuen Slide 35
Income Statement
Hoagland's Lakeshore Bar Restaurant
Sales 800,000$ 100,000$ 700,000$ Variable costs 310,000 60,000 250,000 CM 490,000 40,000 450,000 Traceable FC 246,000 26,000 220,000 Segment margin 244,000 14,000$ 230,000$
Common costs 200,000 Profit 44,000$
Quick Check
Assume that Hoagland's Lakeshore prepared its segmented income statement as shown.
McGraw-Hill Education (Asia) Garrison, Noreen, Brewer, Cheng & Yuen Slide 36
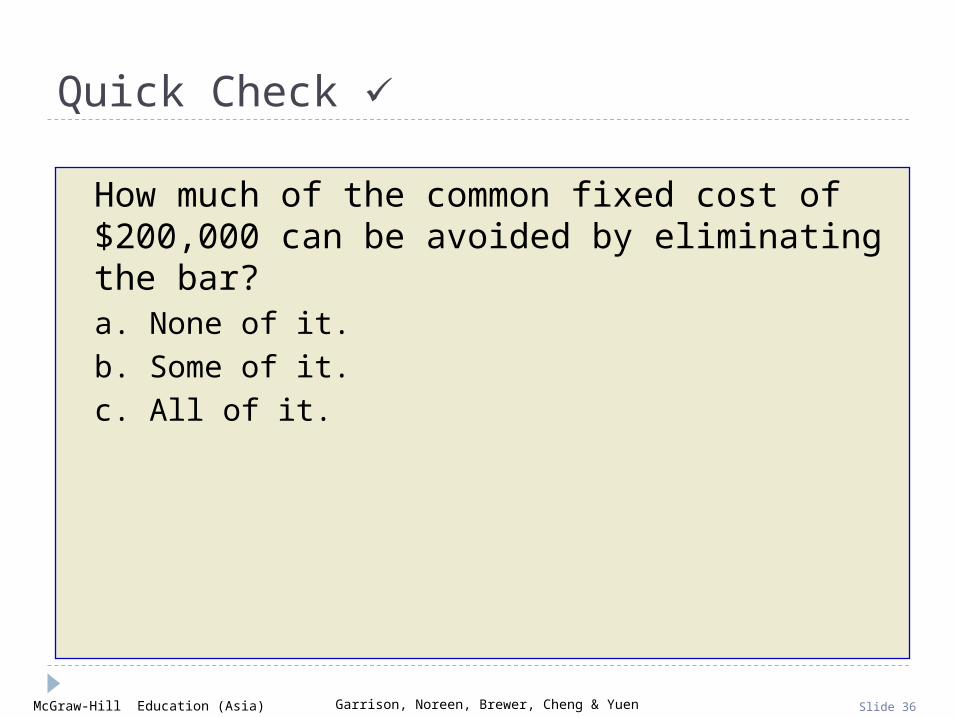
Quick Check
How much of the common fixed cost of $200,000 can be avoided by eliminating the bar?a. None of it.
b. Some of it.
c. All of it.
McGraw-Hill Education (Asia) Garrison, Noreen, Brewer, Cheng & Yuen Slide 37
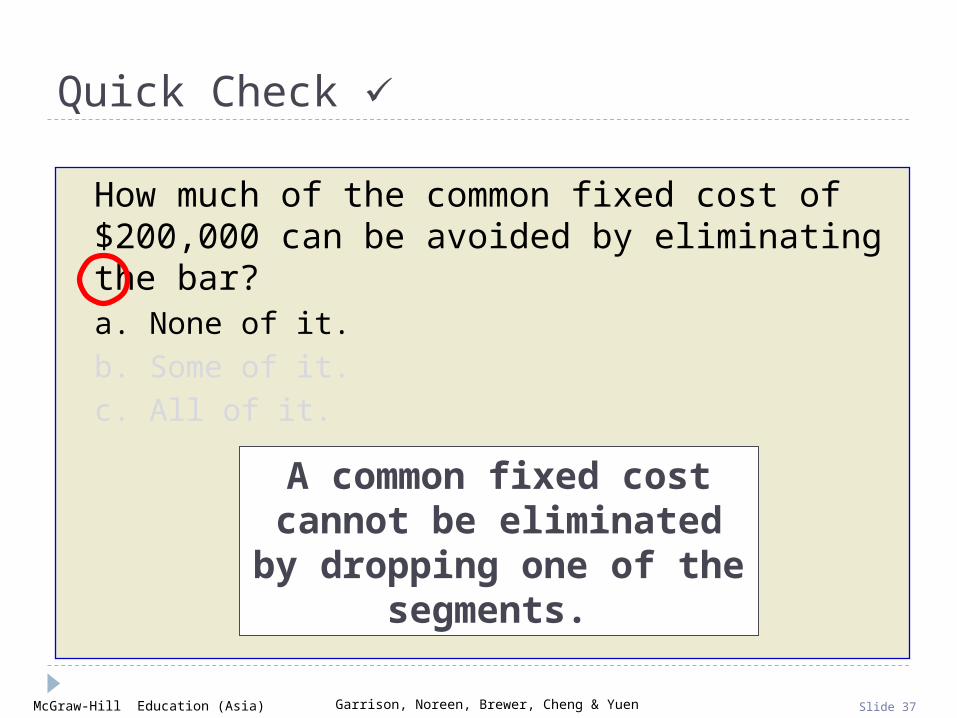
Quick Check
How much of the common fixed cost of $200,000 can be avoided by eliminating the bar?a. None of it.
b. Some of it.
c. All of it.
A common fixed cost cannot be eliminated by
dropping one of the segments.
McGraw-Hill Education (Asia) Garrison, Noreen, Brewer, Cheng & Yuen Slide 38
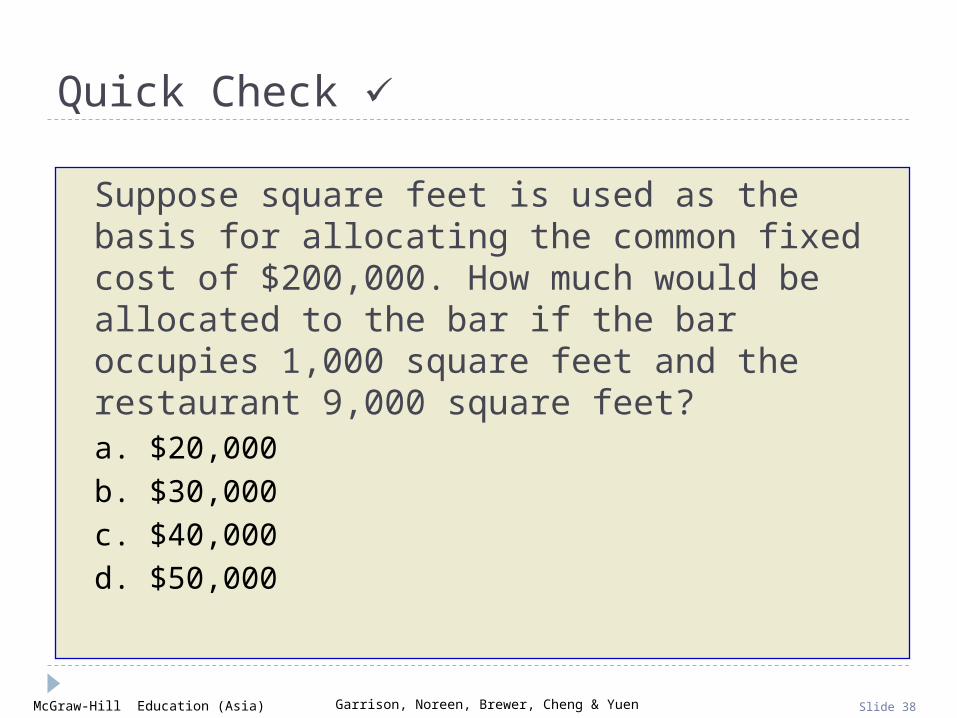
Quick Check
Suppose square feet is used as the basis for allocating the common fixed cost of $200,000. How much would be allocated to the bar if the bar occupies 1,000 square feet and the restaurant 9,000 square feet?a. $20,000
b. $30,000
c. $40,000
d. $50,000
McGraw-Hill Education (Asia) Garrison, Noreen, Brewer, Cheng & Yuen Slide 39
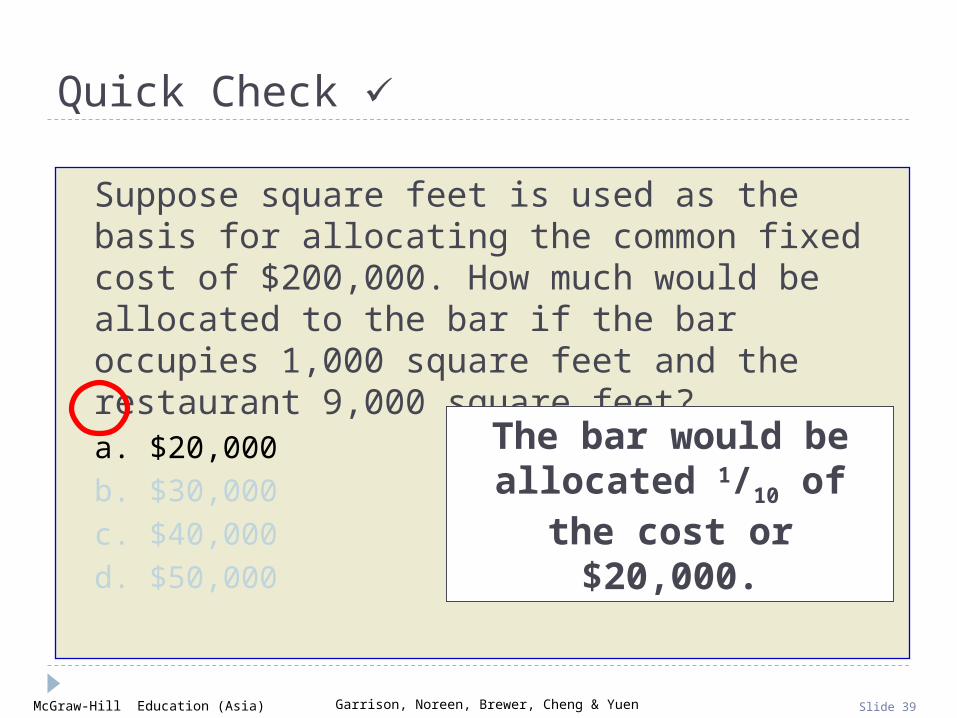
Suppose square feet is used as the basis for allocating the common fixed cost of $200,000. How much would be allocated to the bar if the bar occupies 1,000 square feet and the restaurant 9,000 square feet?a. $20,000
b. $30,000
c. $40,000
d. $50,000
Quick Check
The bar would be allocated 1/10 of the cost
or $20,000.
McGraw-Hill Education (Asia) Garrison, Noreen, Brewer, Cheng & Yuen Slide 40
Quick Check
If Hoagland's allocates its common costs to the bar and the restaurant, what would be the reported profit of
each segment?
McGraw-Hill Education (Asia) Garrison, Noreen, Brewer, Cheng & Yuen Slide 41
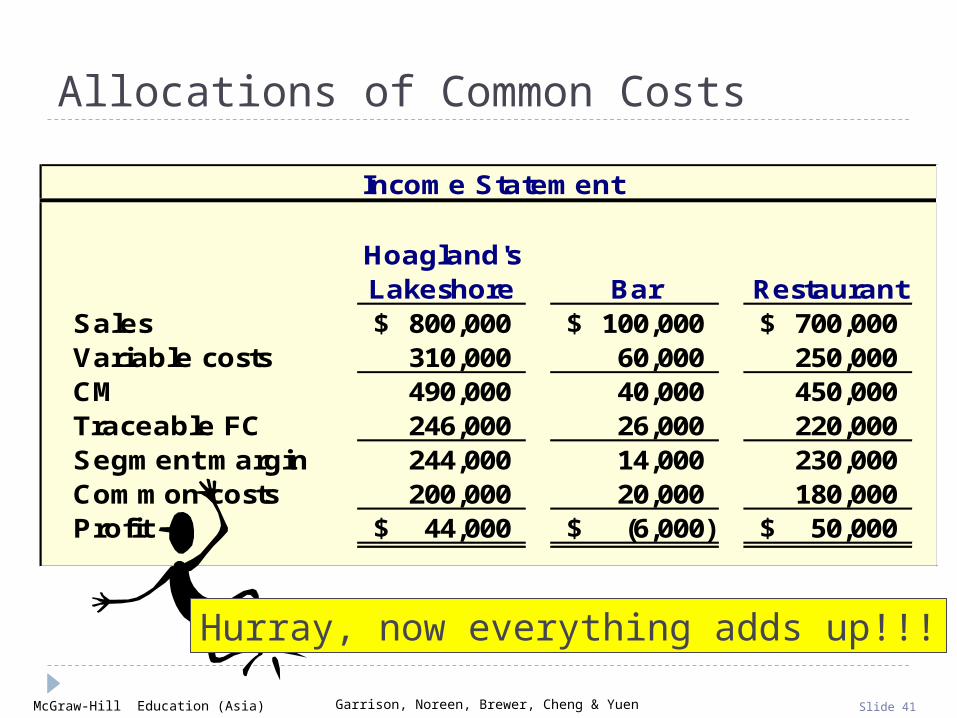
Income Statement
Hoagland's Lakeshore Bar Restaurant
Sales 800,000$ 100,000$ 700,000$ Variable costs 310,000 60,000 250,000 CM 490,000 40,000 450,000 Traceable FC 246,000 26,000 220,000 Segment margin 244,000 14,000 230,000 Common costs 200,000 20,000 180,000 Profit 44,000$ (6,000)$ 50,000$
Allocations of Common Costs
Hurray, now everything adds up!!!

McGraw-Hill Education (Asia) Garrison, Noreen, Brewer, Cheng & Yuen Slide 42
Quick Check
Should the bar be eliminated?a. Yes
b. No

McGraw-Hill Education (Asia) Garrison, Noreen, Brewer, Cheng & Yuen Slide 43
Should the bar be eliminated?a. Yes
b. No
Quick Check
Income Statement
Hoagland's Lakeshore Bar Restaurant
Sales 700,000$ 700,000$ Variable costs 250,000 250,000 CM 450,000 450,000 Traceable FC 220,000 220,000 Segment margin 230,000 230,000 Common costs 200,000 200,000 Profit 30,000$ 30,000$
The profit was $44,000 before eliminating the bar. If we eliminate
the bar, profit drops to $30,000!
McGraw-Hill Education (Asia) Garrison, Noreen, Brewer, Cheng & Yuen Slide 44
Learning Objective 2
Compute return on investment Compute return on investment (ROI) and show how changes in (ROI) and show how changes in
sales, expenses, and assets sales, expenses, and assets affect ROI.affect ROI.

McGraw-Hill Education (Asia) Garrison, Noreen, Brewer, Cheng & Yuen Slide 45
Return on Investment (ROI) Formula
ROI = ROI = Net operating incomeNet operating incomeAverage operating assets Average operating assets
Cash, accounts receivable, inventory,plant and equipment, and other
productive assets.
Cash, accounts receivable, inventory,plant and equipment, and other
productive assets.
Income before interestand taxes (EBIT)
Income before interestand taxes (EBIT)
McGraw-Hill Education (Asia) Garrison, Noreen, Brewer, Cheng & Yuen Slide 46
Net Book Value vs. Gross Cost
Most companies use the net book value of depreciable assets to calculate average
operating assets.
Acquisition costLess: Accumulated depreciationNet book value
McGraw-Hill Education (Asia) Garrison, Noreen, Brewer, Cheng & Yuen Slide 47
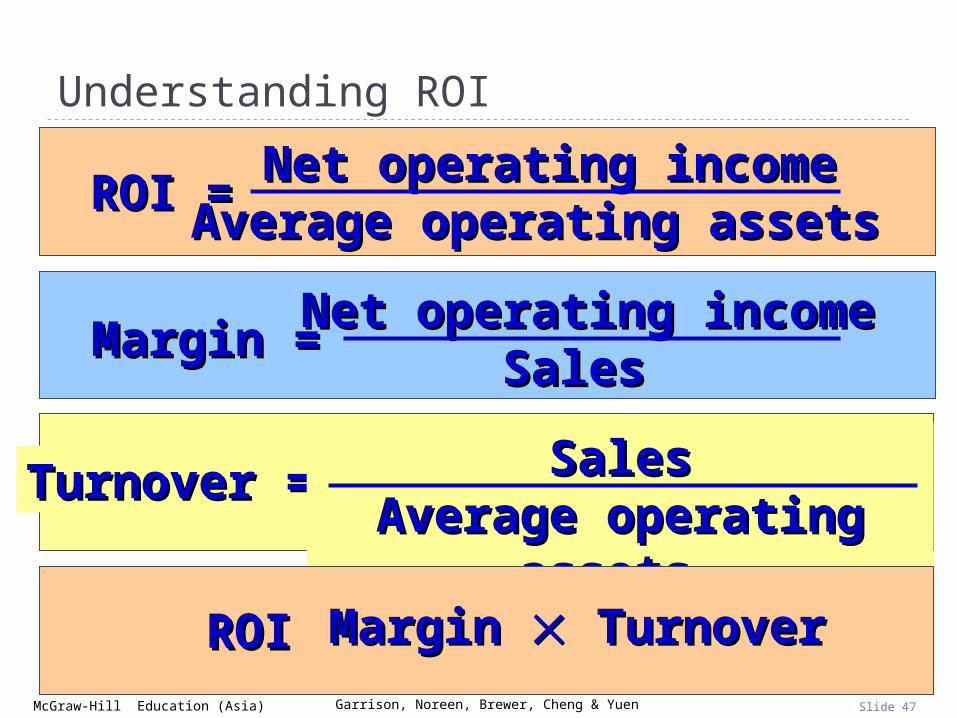
Understanding ROI
ROI = ROI = Net operating incomeNet operating incomeAverage operating assets Average operating assets
Margin = Margin = Net operating incomeNet operating incomeSales Sales
Turnover = Turnover = SalesSalesAverage operating Average operating
assets assets ROI = ROI = Margin Margin Turnover Turnover
McGraw-Hill Education (Asia) Garrison, Noreen, Brewer, Cheng & Yuen Slide 48
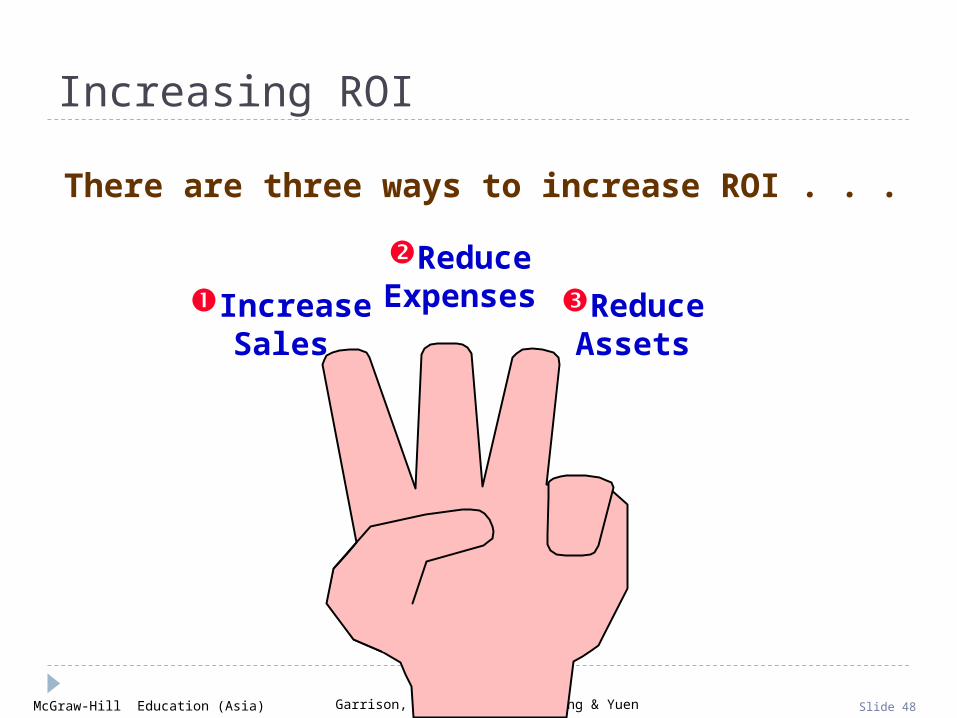
Increasing ROI
There are three ways to increase ROI . . .
IncreaseSales
ReduceExpenses Reduce
Assets

McGraw-Hill Education (Asia) Garrison, Noreen, Brewer, Cheng & Yuen Slide 49
Increasing ROI – An Example
Regal Company reports the following: Net operating income $ 30,000
Average operating assets $ 200,000
Sales $ 500,000
Operating expenses $ 470,000
ROI = ROI = Margin Margin Turnover Turnover Net operating income Sales
Sales Average operating assets×ROI =
What is Regal Company’s ROI?
McGraw-Hill Education (Asia) Garrison, Noreen, Brewer, Cheng & Yuen Slide 50
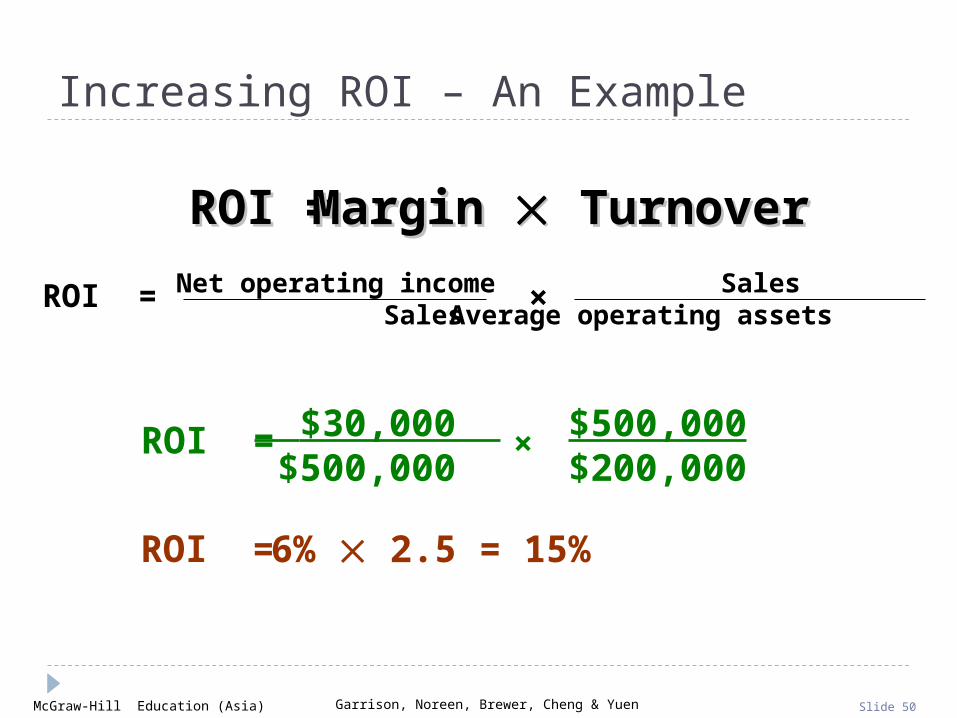
Increasing ROI – An Example
$30,000 $500,000
× $500,000$200,000
ROI =
6% 2.5 = 15%ROI =
ROI = ROI = Margin Margin Turnover Turnover Net operating income Sales
Sales Average operating assets×ROI =

McGraw-Hill Education (Asia) Garrison, Noreen, Brewer, Cheng & Yuen Slide 51
Investing in Operating Assets to Increase Sales
Assume that Regal's manager invests in a $30,000 piece of equipment that increases sales by
$35,000, while increasing operating expenses by $15,000.
Let’s calculate the new ROI.
Regal Company reports the following:
Net operating income $ 50,000
Average operating assets $ 230,000
Sales $ 535,000
Operating expenses $ 485,000
McGraw-Hill Education (Asia) Garrison, Noreen, Brewer, Cheng & Yuen Slide 52
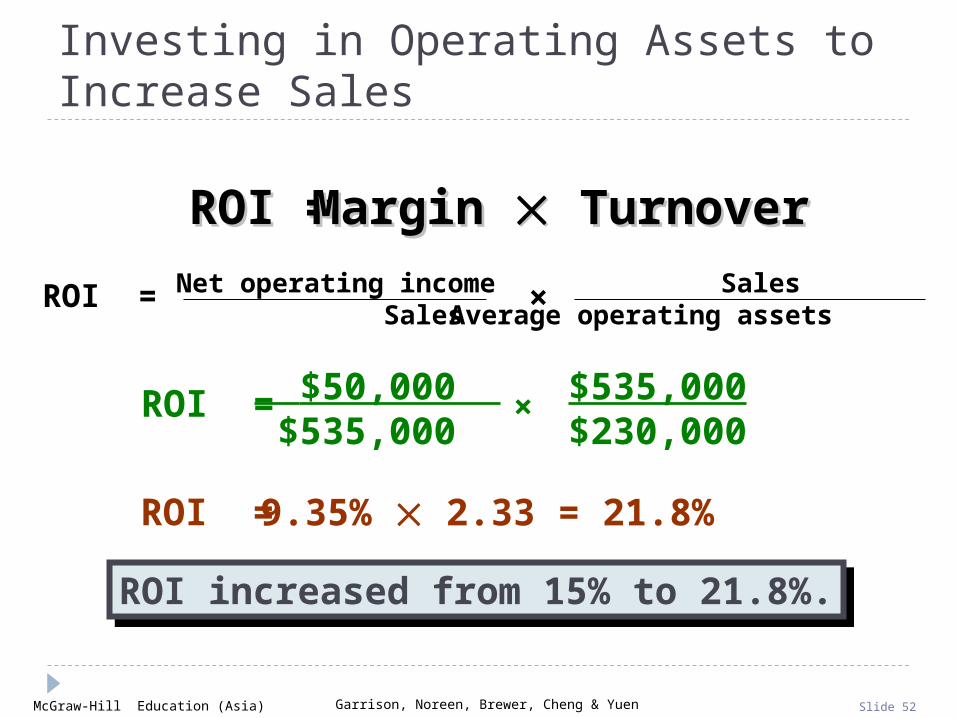
Investing in Operating Assets to Increase Sales
$50,000 $535,000
× $535,000$230,000
ROI =
9.35% 2.33 = 21.8%ROI =
ROI increased from 15% to 21.8%.ROI increased from 15% to 21.8%.
ROI = ROI = Margin Margin Turnover Turnover Net operating income Sales
Sales Average operating assets×ROI =
McGraw-Hill Education (Asia) Garrison, Noreen, Brewer, Cheng & Yuen Slide 53
Criticisms of ROI
In the absence of the balancedscorecard, management may
not know how to increase ROI.
Managers often inherit manycommitted costs over which
they have no control.
Managers evaluated on ROImay reject profitable
investment opportunities.
McGraw-Hill Education (Asia) Garrison, Noreen, Brewer, Cheng & Yuen Slide 54
Learning Objective 3
Compute residual income and Compute residual income and understand its strengths and understand its strengths and
weaknesses.weaknesses.

McGraw-Hill Education (Asia) Garrison, Noreen, Brewer, Cheng & Yuen Slide 55
Residual Income - Another Measure of Performance
Net operating incomeabove some minimum
return on operatingassets
McGraw-Hill Education (Asia) Garrison, Noreen, Brewer, Cheng & Yuen Slide 56
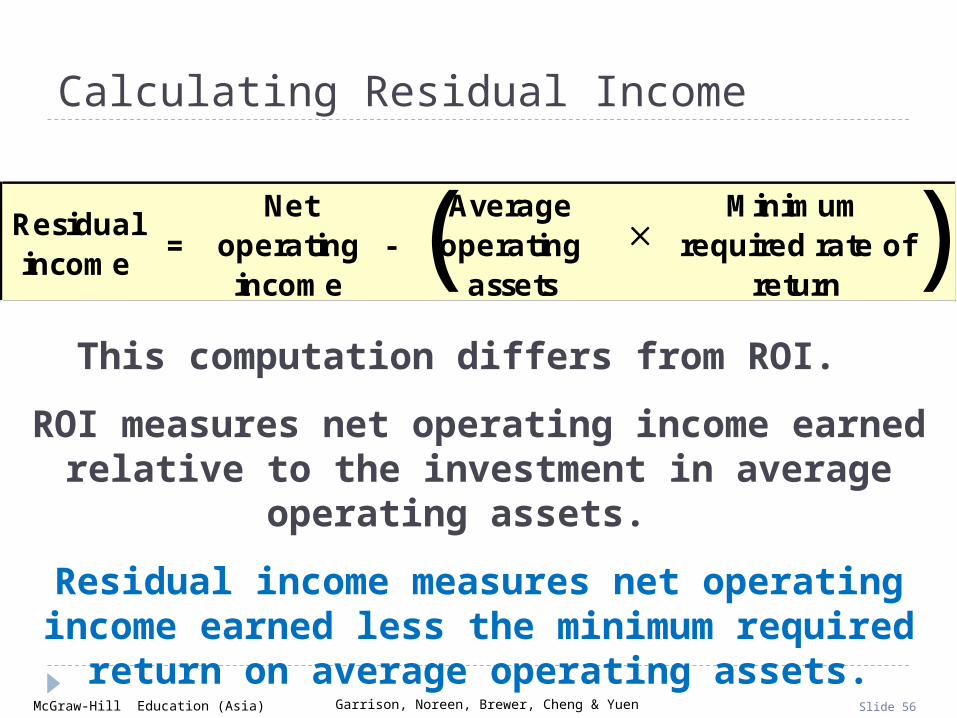
Calculating Residual Income
Residual income
=Net
operating income
-Average
operating assets
Minimum
required rate of return
( )This computation differs from ROI.
ROI measures net operating income earned relative to the investment in average operating assets.
Residual income measures net operating income earned less the minimum required return on average
operating assets.

McGraw-Hill Education (Asia) Garrison, Noreen, Brewer, Cheng & Yuen Slide 57
Residual Income – An Example
The Retail Division of Zephyr, Inc. has average operating assets of $100,000 and is required to earn a return of 20% on these assets.
In the current period, the division earns $30,000.
The Retail Division of Zephyr, Inc. has average operating assets of $100,000 and is required to earn a return of 20% on these assets.
In the current period, the division earns $30,000.
Let’s calculate residual income.

McGraw-Hill Education (Asia) Garrison, Noreen, Brewer, Cheng & Yuen Slide 58
Residual Income – An Example
Operating assets 100,000$ Required rate of return × 20%Minimum required return 20,000$
Operating assets 100,000$ Required rate of return × 20%Minimum required return 20,000$
Actual income 30,000$ Minimum required return (20,000) Residual income 10,000$
Actual income 30,000$ Minimum required return (20,000) Residual income 10,000$
McGraw-Hill Education (Asia) Garrison, Noreen, Brewer, Cheng & Yuen Slide 59
Motivation and Residual Income
Residual income encourages managers to make profitable investments that would
be rejected by managers using ROI.
McGraw-Hill Education (Asia) Garrison, Noreen, Brewer, Cheng & Yuen Slide 60
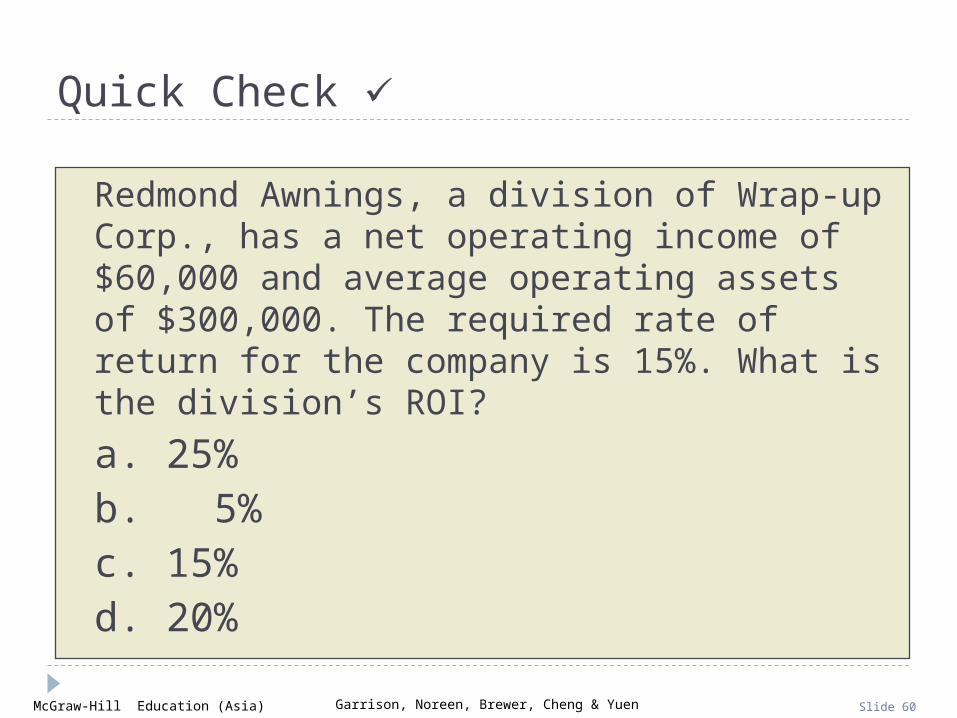
Quick Check
Redmond Awnings, a division of Wrap-up Corp., has a net operating income of $60,000 and average operating assets of $300,000. The required rate of return for the company is 15%. What is the division’s ROI?
a. 25%b. 5%c. 15%d. 20%
McGraw-Hill Education (Asia) Garrison, Noreen, Brewer, Cheng & Yuen Slide 61
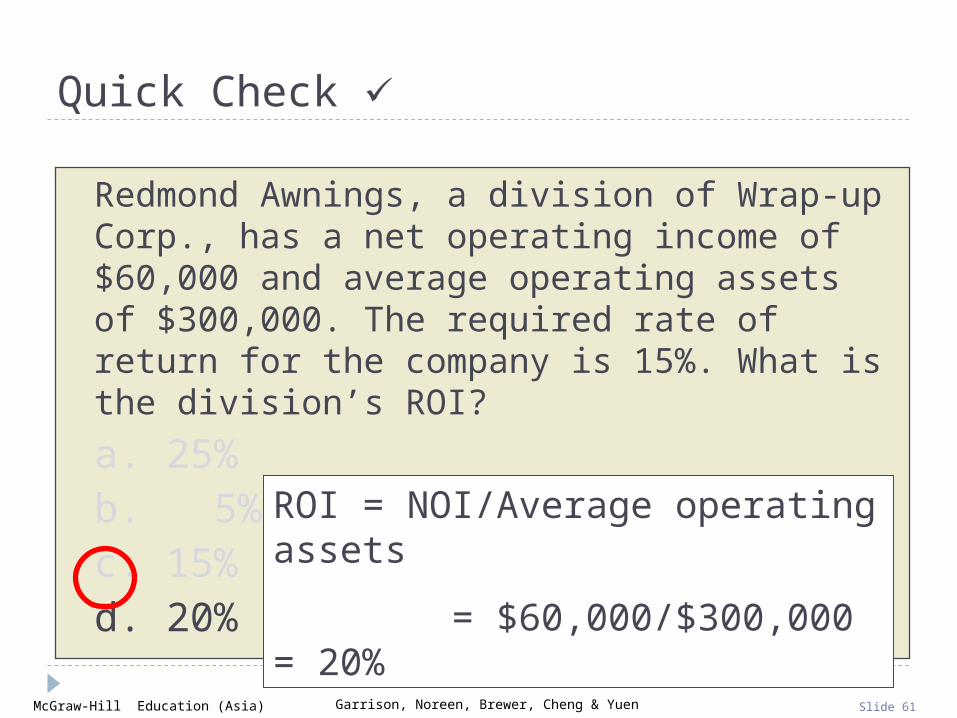
Quick Check
Redmond Awnings, a division of Wrap-up Corp., has a net operating income of $60,000 and average operating assets of $300,000. The required rate of return for the company is 15%. What is the division’s ROI?
a. 25%b. 5%c. 15%d. 20%
ROI = NOI/Average operating assets
= $60,000/$300,000 = 20%

McGraw-Hill Education (Asia) Garrison, Noreen, Brewer, Cheng & Yuen Slide 62
Quick Check
Redmond Awnings, a division of Wrap-up Corp., has a net operating income of $60,000 and average operating assets of $300,000. If the manager of the division is evaluated based on ROI, will she want to make an investment of $100,000 that would generate additional net operating income of $18,000 per year?a. Yes
b. No
McGraw-Hill Education (Asia) Garrison, Noreen, Brewer, Cheng & Yuen Slide 63
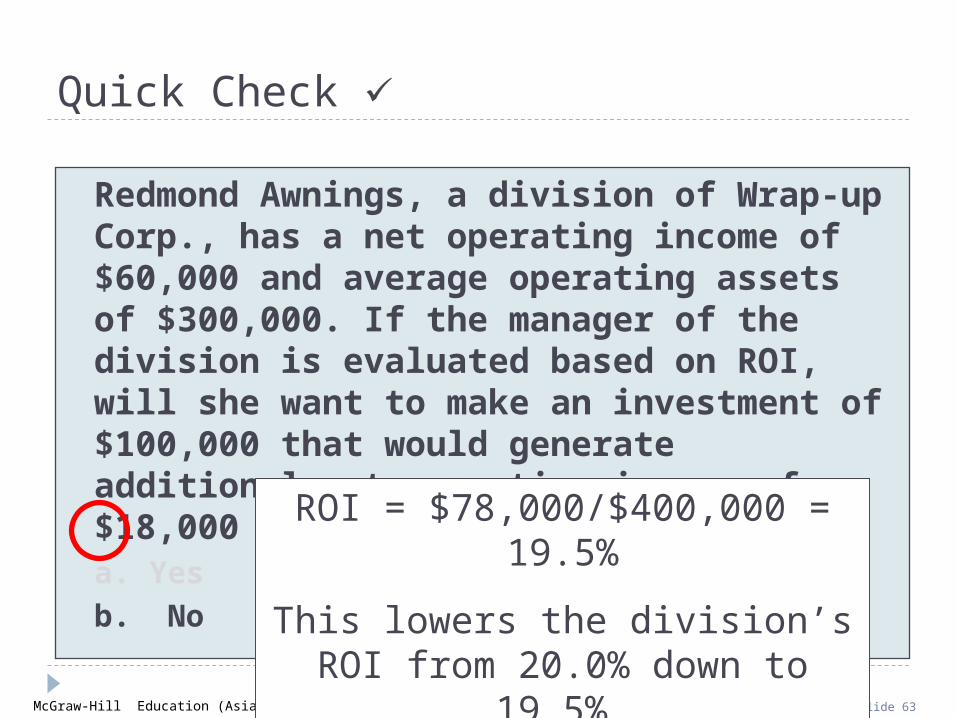
Quick Check
Redmond Awnings, a division of Wrap-up Corp., has a net operating income of $60,000 and average operating assets of $300,000. If the manager of the division is evaluated based on ROI, will she want to make an investment of $100,000 that would generate additional net operating income of $18,000 per year?a. Yes
b. NoROI = $78,000/$400,000 = 19.5%
This lowers the division’s ROI from 20.0% down to 19.5%.

McGraw-Hill Education (Asia) Garrison, Noreen, Brewer, Cheng & Yuen Slide 64
Quick Check
The company’s required rate of return is 15%. Would the company want the manager of the Redmond Awnings division to make an investment of $100,000 that would generate additional net operating income of $18,000 per year?a. Yes
b. No
McGraw-Hill Education (Asia) Garrison, Noreen, Brewer, Cheng & Yuen Slide 65
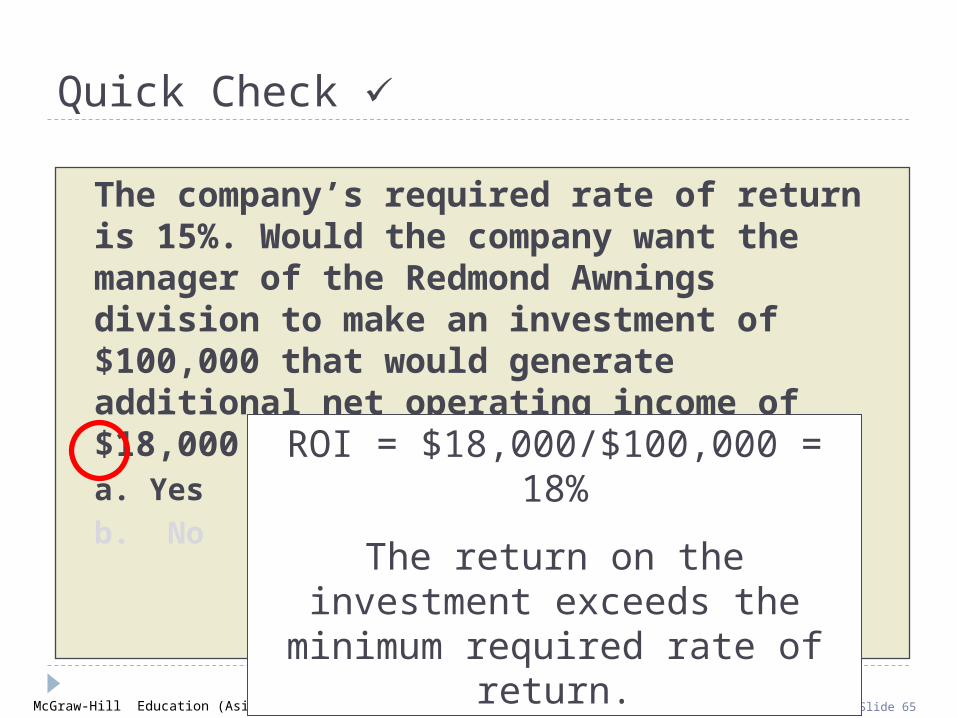
Quick Check
The company’s required rate of return is 15%. Would the company want the manager of the Redmond Awnings division to make an investment of $100,000 that would generate additional net operating income of $18,000 per year?a. Yes
b. No
ROI = $18,000/$100,000 = 18%
The return on the investment exceeds the minimum required rate
of return.
McGraw-Hill Education (Asia) Garrison, Noreen, Brewer, Cheng & Yuen Slide 66
Quick Check
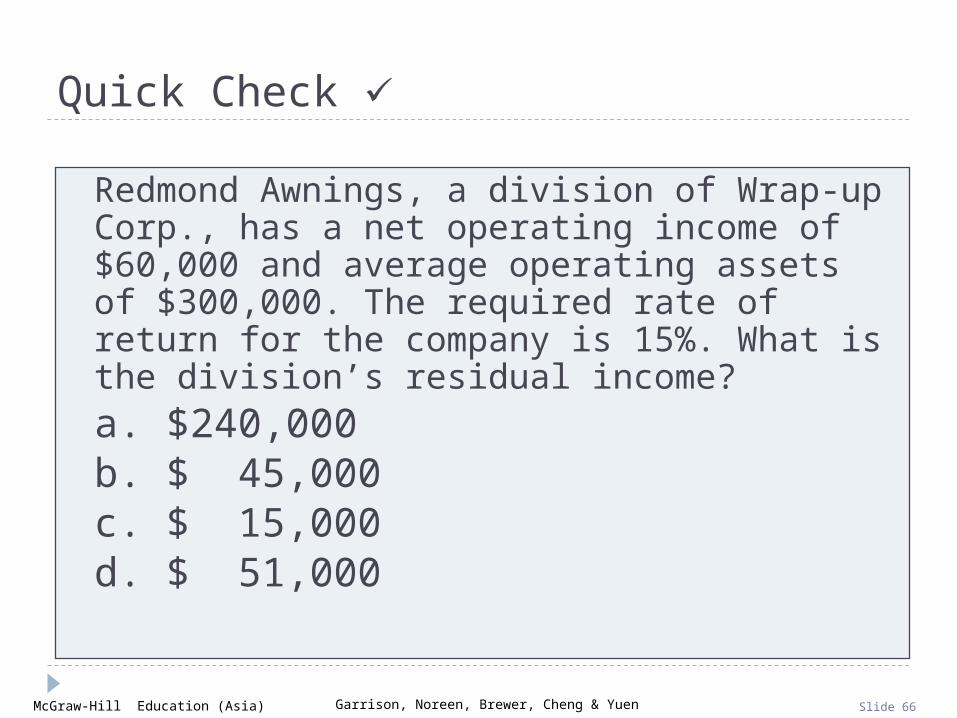
Redmond Awnings, a division of Wrap-up Corp., has a net operating income of $60,000 and average operating assets of $300,000. The required rate of return for the company is 15%. What is the division’s residual income?
a. $240,000b. $ 45,000c. $ 15,000d. $ 51,000

McGraw-Hill Education (Asia) Garrison, Noreen, Brewer, Cheng & Yuen Slide 67
Quick Check
Redmond Awnings, a division of Wrap-up Corp., has a net operating income of $60,000 and average operating assets of $300,000. The required rate of return for the company is 15%. What is the division’s residual income?
a. $240,000b. $ 45,000c. $ 15,000d. $ 51,000
Net operating income $60,000Required return (15% of $300,000) (45,000)Residual income $15,000
McGraw-Hill Education (Asia) Garrison, Noreen, Brewer, Cheng & Yuen Slide 68
Quick Check
If the manager of the Redmond Awnings division is evaluated based on residual income, will she want to make an investment of $100,000 that would generate additional net operating income of $18,000 per year?a. Yes
b. No
McGraw-Hill Education (Asia) Garrison, Noreen, Brewer, Cheng & Yuen Slide 69
Quick Check
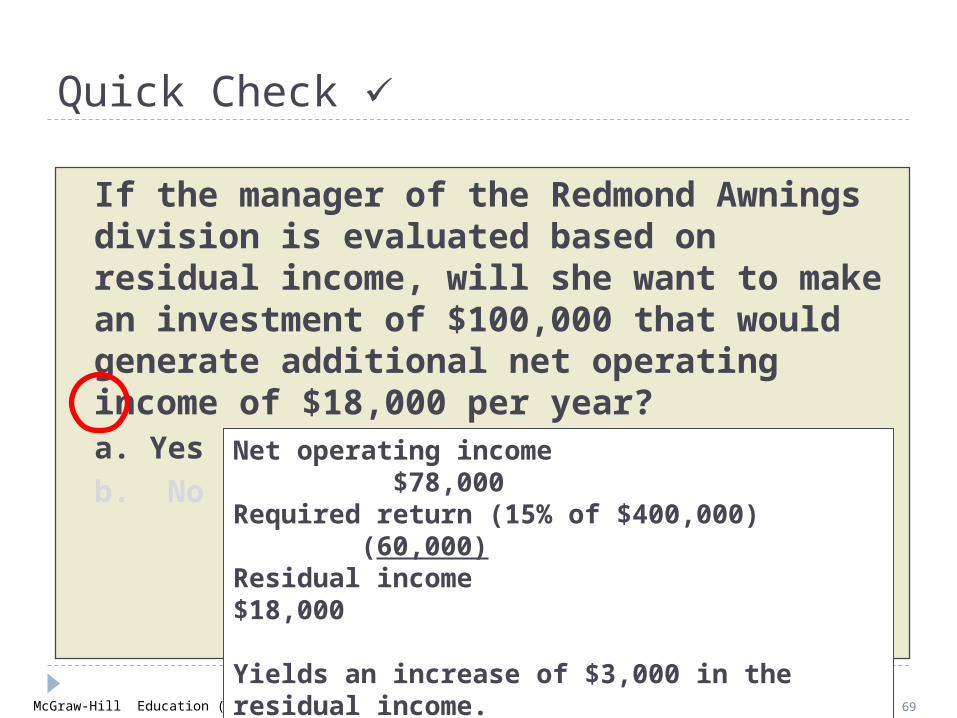
If the manager of the Redmond Awnings division is evaluated based on residual income, will she want to make an investment of $100,000 that would generate additional net operating income of $18,000 per year?a. Yes
b. No Net operating income $78,000Required return (15% of $400,000) (60,000)Residual income $18,000
Yields an increase of $3,000 in the residual income.
McGraw-Hill Education (Asia) Garrison, Noreen, Brewer, Cheng & Yuen Slide 70
Divisional Comparisons and Residual Income
The residual income approach
has one major disadvantage.
It cannot be used to compare the performance of
divisions of different sizes.
McGraw-Hill Education (Asia) Garrison, Noreen, Brewer, Cheng & Yuen Slide 71
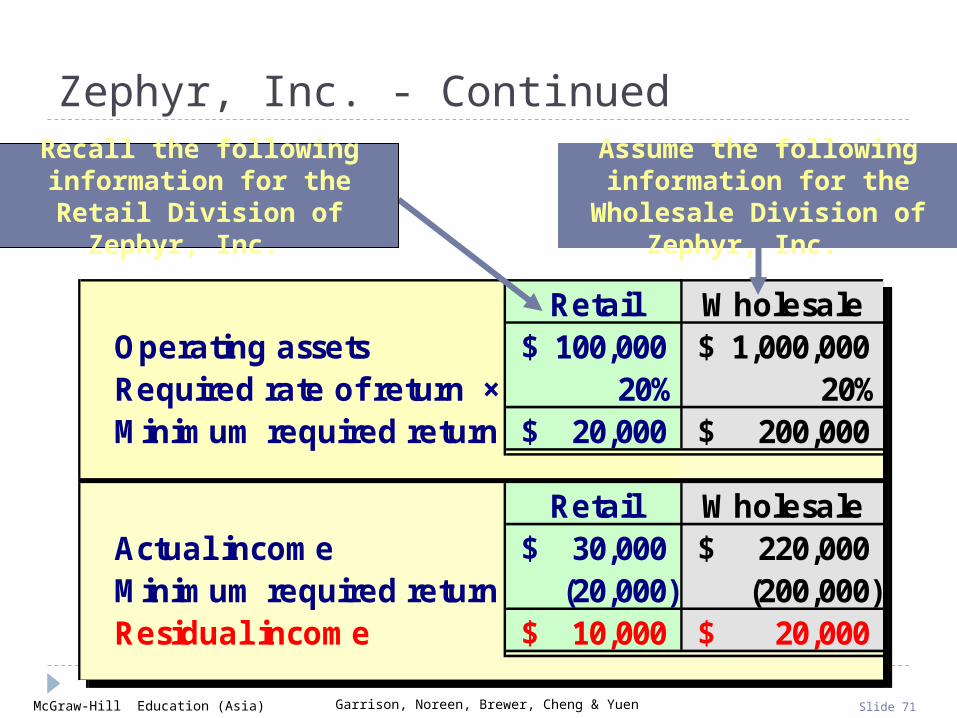
Zephyr, Inc. - Continued
Retail WholesaleOperating assets 100,000$ 1,000,000$ Required rate of return × 20% 20%Minimum required return 20,000$ 200,000$
Retail WholesaleActual income 30,000$ 220,000$ Minimum required return (20,000) (200,000) Residual income 10,000$ 20,000$
Retail WholesaleOperating assets 100,000$ 1,000,000$ Required rate of return × 20% 20%Minimum required return 20,000$ 200,000$
Retail WholesaleActual income 30,000$ 220,000$ Minimum required return (20,000) (200,000) Residual income 10,000$ 20,000$
Recall the following information for the Retail Division of Zephyr, Inc.
Assume the following information for the Wholesale
Division of Zephyr, Inc.

McGraw-Hill Education (Asia) Garrison, Noreen, Brewer, Cheng & Yuen Slide 72
Zephyr, Inc. - Continued
Retail WholesaleOperating assets 100,000$ 1,000,000$ Required rate of return × 20% 20%Minimum required return 20,000$ 200,000$
Retail WholesaleActual income 30,000$ 220,000$ Minimum required return (20,000) (200,000) Residual income 10,000$ 20,000$
Retail WholesaleOperating assets 100,000$ 1,000,000$ Required rate of return × 20% 20%Minimum required return 20,000$ 200,000$
Retail WholesaleActual income 30,000$ 220,000$ Minimum required return (20,000) (200,000) Residual income 10,000$ 20,000$
The residual income numbers suggest that the Wholesale Division outperformed the Retail Division because its residual income is $10,000 higher. However, the
Retail Division earned an ROI of 30% compared to an ROI of 22% for the Wholesale Division. The Wholesale Division’s residual income is larger than the
Retail Division simply because it is a bigger division.

McGraw-Hill Education (Asia) Garrison, Noreen, Brewer, Cheng & Yuen Slide 73
Learning Objective 4
Understand how to construct Understand how to construct and use a balanced scorecard.and use a balanced scorecard.

McGraw-Hill Education (Asia) Garrison, Noreen, Brewer, Cheng & Yuen Slide 74
The Balanced Scorecard
Management translates its strategy into performance measures that employees
understand and influence.
Management translates its strategy into performance measures that employees
understand and influence.
Performancemeasures
Customers
Learningand growth
Internalbusiness
processes
Financial

McGraw-Hill Education (Asia) Garrison, Noreen, Brewer, Cheng & Yuen Slide 75
The Balanced Scorecard: FromStrategy to Performance Measures
FinancialHas our financial
performance improved?
CustomerDo customers recognize that
we are delivering more value?
Internal Business ProcessesHave we improved key business processes so that we can deliver
more value to customers?
Learning and GrowthAre we maintaining our ability
to change and improve?
Performance Measures
What are ourfinancial goals?
What customers dowe want to serve andhow are we going towin and retain them?
What internal busi-ness processes arecritical to providing
value to customers?
Vision and
Strategy

McGraw-Hill Education (Asia) Garrison, Noreen, Brewer, Cheng & Yuen Slide 76
The Balanced Scorecard: Non-financial Measures
The balanced scorecard relies on non-financial measures in addition to financial measures for two reasons:
Financial measures are lag indicators that summarize the results of past actions. Non-financial measures are leading indicators of future financial performance.
Financial measures are lag indicators that summarize the results of past actions. Non-financial measures are leading indicators of future financial performance.
Top managers are ordinarily responsible for financial performance measures – not lower level managers. Non-financial measures are more likely to be understood and controlled by lower level managers.
Top managers are ordinarily responsible for financial performance measures – not lower level managers. Non-financial measures are more likely to be understood and controlled by lower level managers.
McGraw-Hill Education (Asia) Garrison, Noreen, Brewer, Cheng & Yuen Slide 77
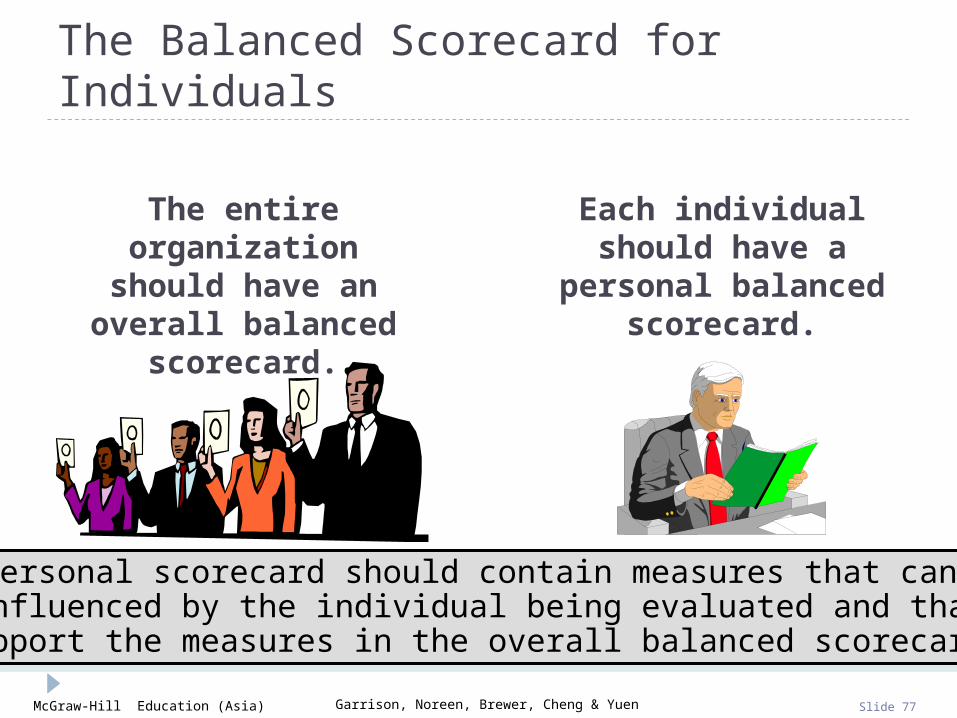
The Balanced Scorecard for Individuals
A personal scorecard should contain measures that can beinfluenced by the individual being evaluated and that
support the measures in the overall balanced scorecard.
A personal scorecard should contain measures that can beinfluenced by the individual being evaluated and that
support the measures in the overall balanced scorecard.
The entire organization should have an overall
balanced scorecard.
Each individual should have a personal
balanced scorecard.
McGraw-Hill Education (Asia) Garrison, Noreen, Brewer, Cheng & Yuen Slide 78
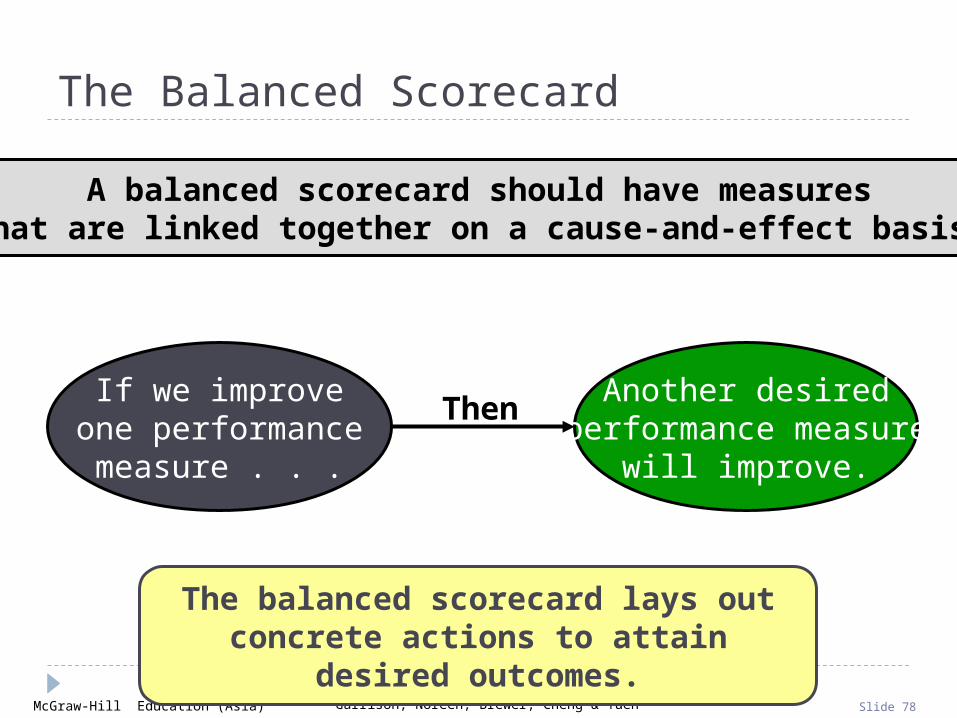
The balanced scorecard lays out concrete actions to attain desired outcomes.
A balanced scorecard should have measuresthat are linked together on a cause-and-effect basis.
If we improveone performance
measure . . .
Another desiredperformance measure
will improve.
The Balanced Scorecard
Then
McGraw-Hill Education (Asia) Garrison, Noreen, Brewer, Cheng & Yuen Slide 79
The Balanced Scorecard and Compensation
Incentive compensation should be linked to balanced scorecard performance
measures.
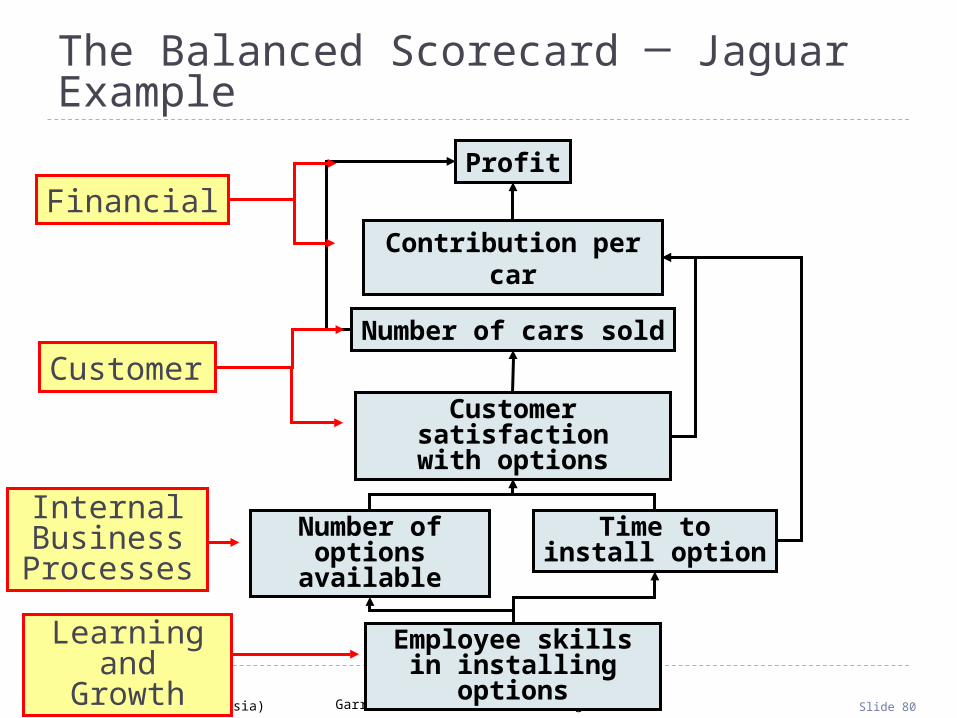
McGraw-Hill Education (Asia) Garrison, Noreen, Brewer, Cheng & Yuen Slide 80
Employee skills in installing options
Number ofoptions available
Time toinstall option
Customer satisfactionwith options
Number of cars sold
Contribution per car
Profit
Learningand Growth
Internal Business
Processes
Customer
Financial
The Balanced Scorecard ─ Jaguar Example

McGraw-Hill Education (Asia) Garrison, Noreen, Brewer, Cheng & Yuen Slide 81
Employee skills in installing options
Number ofoptions available
Time toinstall option
Customer satisfactionwith options
Number of cars sold
Contribution per car
Profit
Increase Options Time
Decreases
Strategies
Satisfaction Increases
Increase Skills
Results
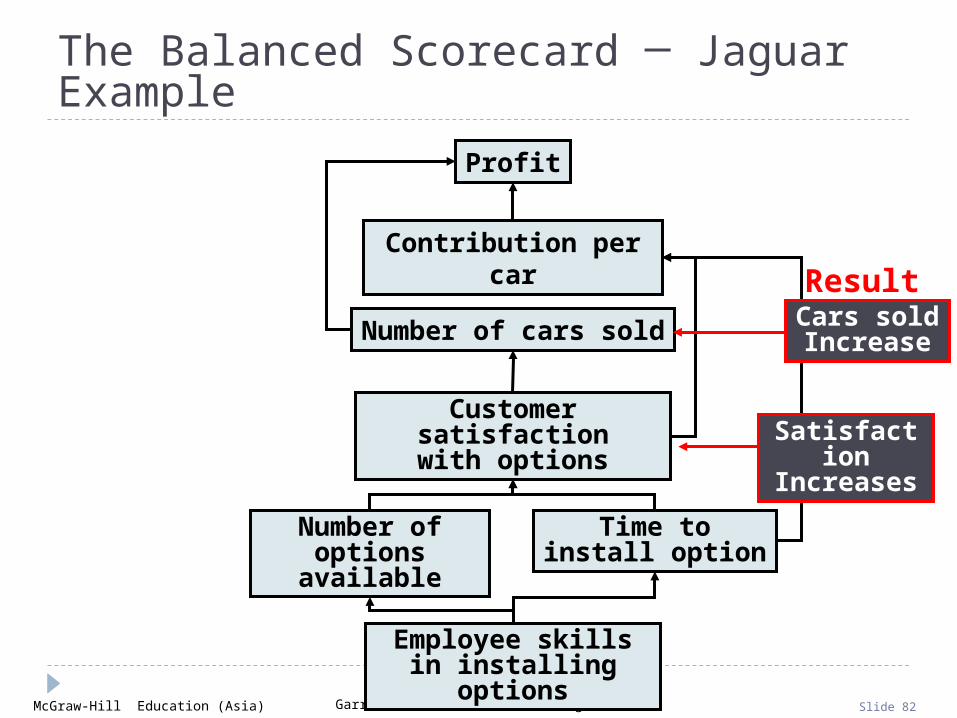
The Balanced Scorecard ─ Jaguar Example
McGraw-Hill Education (Asia) Garrison, Noreen, Brewer, Cheng & Yuen Slide 82
Employee skills in installing options
Number ofoptions available
Time toinstall option
Customer satisfactionwith options
Number of cars sold
Contribution per car
Profit
Satisfaction Increases
ResultsCars sold Increase
The Balanced Scorecard ─ Jaguar Example

McGraw-Hill Education (Asia) Garrison, Noreen, Brewer, Cheng & Yuen Slide 83
Employee skills in installing options
Number ofoptions available
Time toinstall option
Customer satisfactionwith options
Number of cars sold
Contribution per car
ProfitResults
TimeDecreases
ContributionIncreases
Satisfaction Increases
The Balanced Scorecard ─ Jaguar Example

McGraw-Hill Education (Asia) Garrison, Noreen, Brewer, Cheng & Yuen Slide 84
The Balanced Scorecard ─ Jaguar Example
Employee skills in installing options
Number ofoptions available
Time toinstall option
Customer satisfactionwith options
Number of cars sold
Contribution per car
ProfitResults
ContributionIncreases
ProfitsIncrease
If numberof cars sold
and contributionper car increase,
profits increase.
Cars Sold Increases
McGraw-Hill Education (Asia) Garrison, Noreen, Brewer, Cheng & Yuen Slide 85
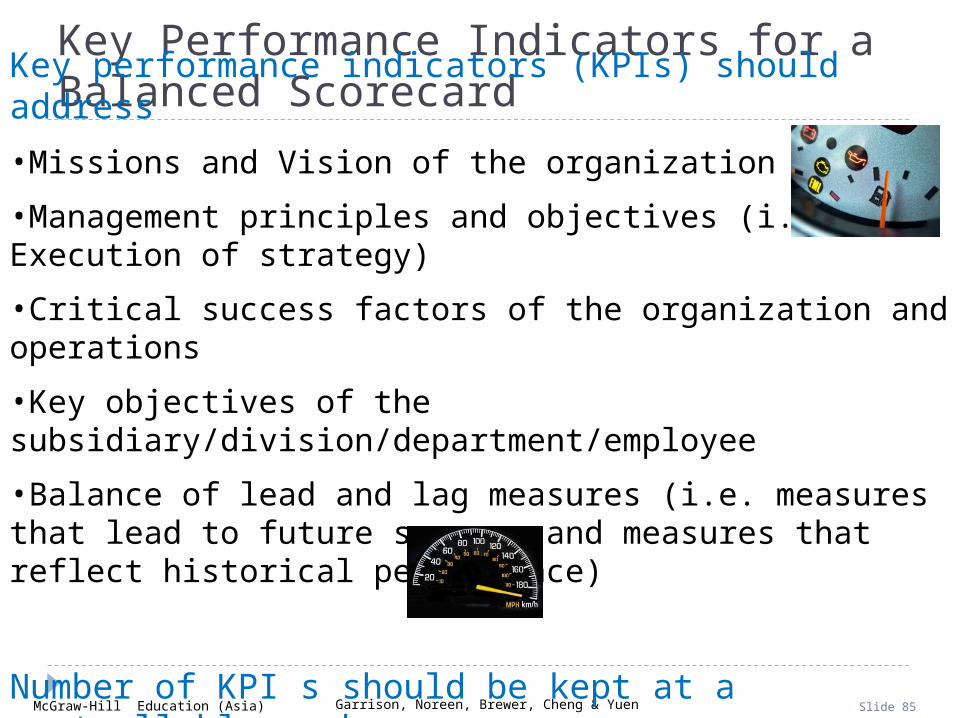
Key Performance Indicators for a Balanced Scorecard
Key performance indicators (KPIs) should address
•Missions and Vision of the organization
•Management principles and objectives (i.e. Execution of strategy)
•Critical success factors of the organization and operations
•Key objectives of the subsidiary/division/department/employee
•Balance of lead and lag measures (i.e. measures that lead to future success and measures that reflect historical performance)
Number of KPI s should be kept at a controllable number.

McGraw-Hill Education (Asia) Garrison, Noreen, Brewer, Cheng & Yuen Slide 86
Summary of the Measures and Their Purposes Financial Customer
Internal Business Process
Learning & Growth
Performance Measures F1 F2 C1 C2 IBP1 IBP2 LG1 LG2 Objectives / Critical Success Factors
Mis
sion
s &
Vis
ion Employee Satisfaction **
Customer Satisfaction **
Man
agem
ent
Pri
ncip
les
Innovative Products **
Profitable Growth
Focus on delivery of quality products to valued customers
Responsibilities to Society
Cri
tica
l F
acto
rs Quality
Response Time
Cost
Div
isio
n’s
Obj
ecti
ve
Sales Growth **
** = Also a critical success factor F1 = residual income (or EVATM) Improvement IBP1 = production defect rate F2 = sales growth IBP2 = percentage goods returned to sales C1 = turnover percentage from key customers LG1 = employee productivity C2 = percentage of delivery accuracy LG2 = employee satisfaction index

McGraw-Hill Education (Asia) Garrison, Noreen, Brewer, Cheng & Yuen Slide 87
Insert to Ch.13 p.538
A Balanced Scorecard Example for a Business Division of a Media Product Manufacturer
Measures Targets Review Frequency
Objectives
Financial
F1 EVA improvement This year’s EVA – Previous year′s EVAPrevious year′s EVA 15%
Annually Profitability and effective use of funds
F2 Sales growth This year’s sales dollar – Previous year′sales dollarPrevious year′sales dollar 15%
Annually Sales growth
Customer
C1 Turnover percentage from key customers
Loss of number of customers with annual revenue of more than $10m.
0% Frequently (Minimum Quarterly)
Quality of products and services
Customer satisfaction
Sales and marketing effort
C2 Delivery accuracy On-time delivery per order 100% Frequently (Minimum Quarterly)
Customer satisfaction
Coordinating effort
Internal Business Process
IBP1 Defects per million units
Defects per million units
3 Monthly Quality Cost
IBP2 Percentage of goods returned
Actual sales value of goods returned Sales value before goods returns
0.3%
Monthly Production quality
On time delivery
Learning and Growth
LG1 Employee productivity
Sales dollar per man-hour $300 per man-hour
Annually Employee training and productivity
Employee satisfaction
LG2 Employee satisfaction index
Survey’s index score Index score 85
Six months Employee satisfaction
Strategic Linkage between measures and perspectives

© 2012 McGraw-Hill Education (Asia)
Transfer Pricing
Appendix 13A
McGraw-Hill Education (Asia) Garrison, Noreen, Brewer, Cheng & Yuen Slide 89
Key Concepts/Definitions
A transfer price is the price charged when one segment of a company provides goods or
services to another segment of the company.
The fundamental objective in setting transfer prices is to
motivate managers to act in the best interests of the overall
company.
McGraw-Hill Education (Asia) Garrison, Noreen, Brewer, Cheng & Yuen Slide 90
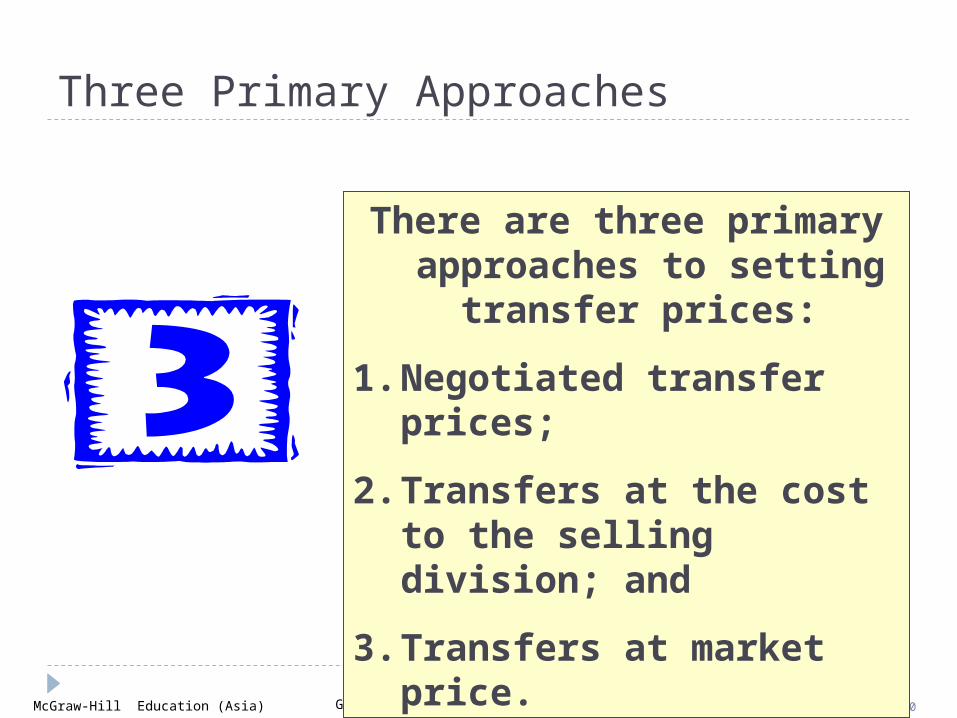
Three Primary Approaches
There are three primary approaches to setting
transfer prices:
1. Negotiated transfer prices;
2. Transfers at the cost to the selling division; and
3. Transfers at market price.
McGraw-Hill Education (Asia) Garrison, Noreen, Brewer, Cheng & Yuen Slide 91
Learning Objective 5
Determine the range, if any, Determine the range, if any, within which a negotiated within which a negotiated transfer price should fall.transfer price should fall.

McGraw-Hill Education (Asia) Garrison, Noreen, Brewer, Cheng & Yuen Slide 92
Negotiated Transfer Prices
A negotiated transfer price results from discussions between the selling and buying divisions.
Advantages of negotiated transfer prices:
1. They preserve the autonomy of the divisions, which is consistent with the spirit of decentralization.
2. The managers negotiating the transfer price are likely to have much better information about the potential costs and benefits of the transfer than others in the company.
Upper limit is determined by the buying division.
Lower limit is determined by the selling division.
Range of Acceptable Transfer Prices
McGraw-Hill Education (Asia) Garrison, Noreen, Brewer, Cheng & Yuen Slide 93
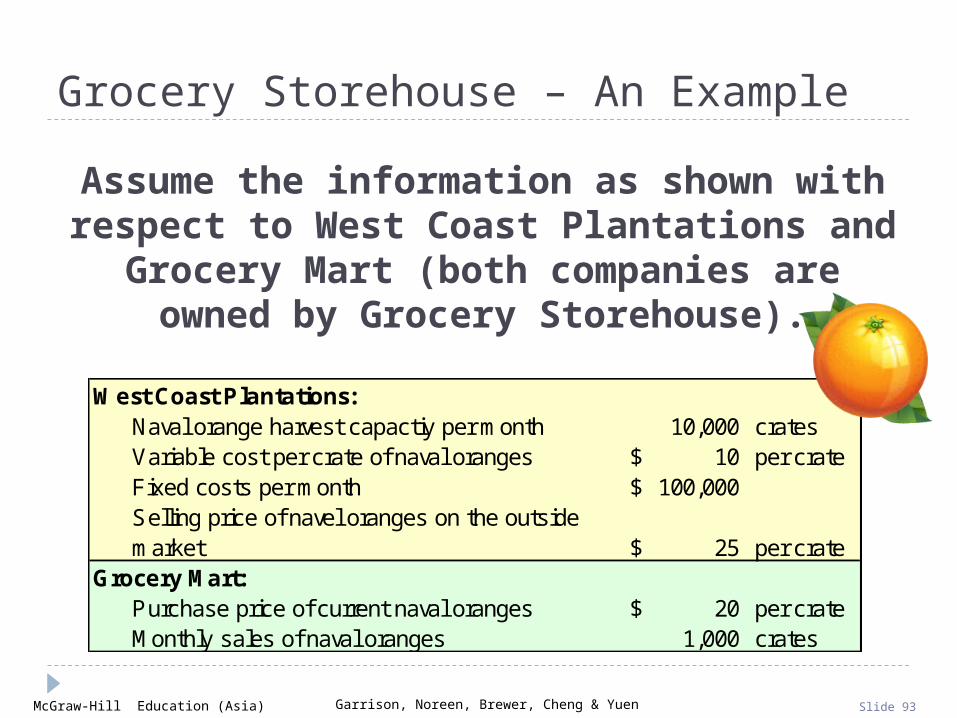
Grocery Storehouse – An Example
West Coast Plantations:Naval orange harvest capactiy per month 10,000 cratesVariable cost per crate of naval oranges 10$ per crateFixed costs per month 100,000$ Selling price of navel oranges on the outside market 25$ per crate
Grocery Mart:Purchase price of current naval oranges 20$ per crateMonthly sales of naval oranges 1,000 crates
Assume the information as shown with respect to West Coast Plantations and Grocery Mart
(both companies are owned by Grocery Storehouse).
McGraw-Hill Education (Asia) Garrison, Noreen, Brewer, Cheng & Yuen Slide 94
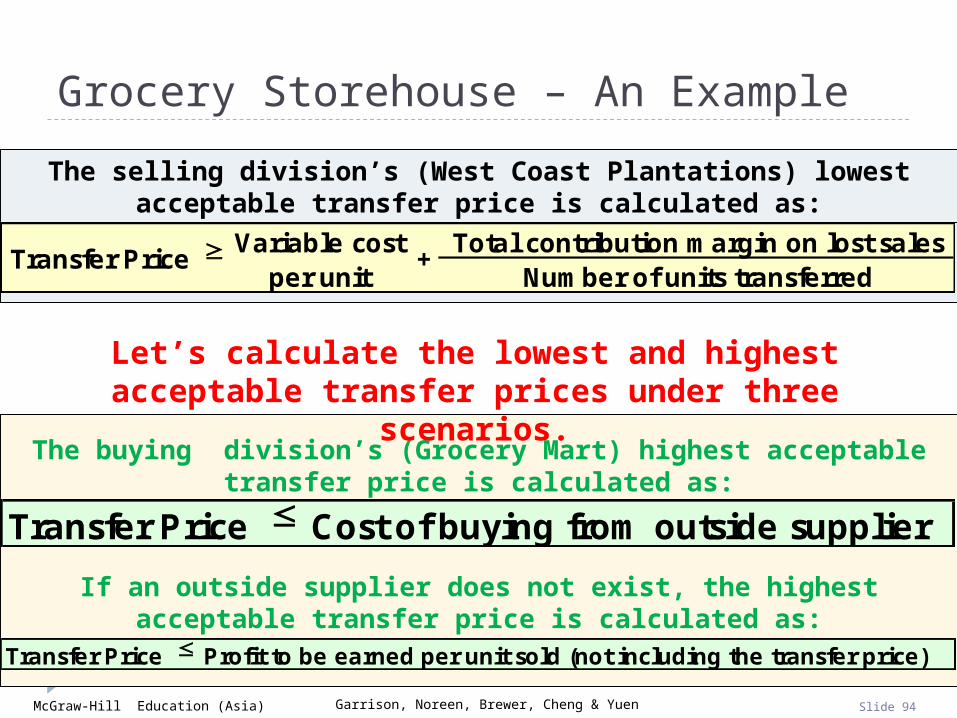
Grocery Storehouse – An Example
The selling division’s (West Coast Plantations) lowest acceptable transfer price is calculated as:
Variable cost Total contribution margin on lost salesper unit Number of units transferred
Transfer Price +
Transfer Price Cost of buying from outside supplier
The buying division’s (Grocery Mart) highest acceptable transfer price is calculated as:
Let’s calculate the lowest and highest acceptable transfer prices under three scenarios.
Transfer Price Profit to be earned per unit sold (not including the transfer price)
If an outside supplier does not exist, the highest acceptable transfer price is calculated as:

McGraw-Hill Education (Asia) Garrison, Noreen, Brewer, Cheng & Yuen Slide 95
Grocery Storehouse – An Example
If West Coast Plantations has sufficient idle capacity (3,000 crates) to satisfy Grocery Mart’s demands (1,000 crates), without sacrificing
sales to other customers, then the lowest and highest possible transfer prices are computed as follows:
-$ 1,000
= 10$ Transfer Price +10$
Selling division’s lowest possible transfer price:
Transfer Price Cost of buying from outside supplier = 20$
Buying division’s highest possible transfer price:
Therefore, the range of acceptable transfer prices is $10 – $20.

McGraw-Hill Education (Asia) Garrison, Noreen, Brewer, Cheng & Yuen Slide 96
Grocery Storehouse – An Example
If West Coast Plantations has no idle capacity (0 crates) and must sacrifice other customer orders (1,000 crates) to meet Grocery Mart’s demands (1,000 crates), then the lowest and highest possible transfer
prices are computed as follows:
( $25 - $10) × 1,0001,000
= 25$ Transfer Price +10$
Selling division’s lowest possible transfer price:
Transfer Price Cost of buying from outside supplier = 20$ Buying division’s highest possible transfer price:
Therefore, there is no range of acceptable transfer prices.
McGraw-Hill Education (Asia) Garrison, Noreen, Brewer, Cheng & Yuen Slide 97
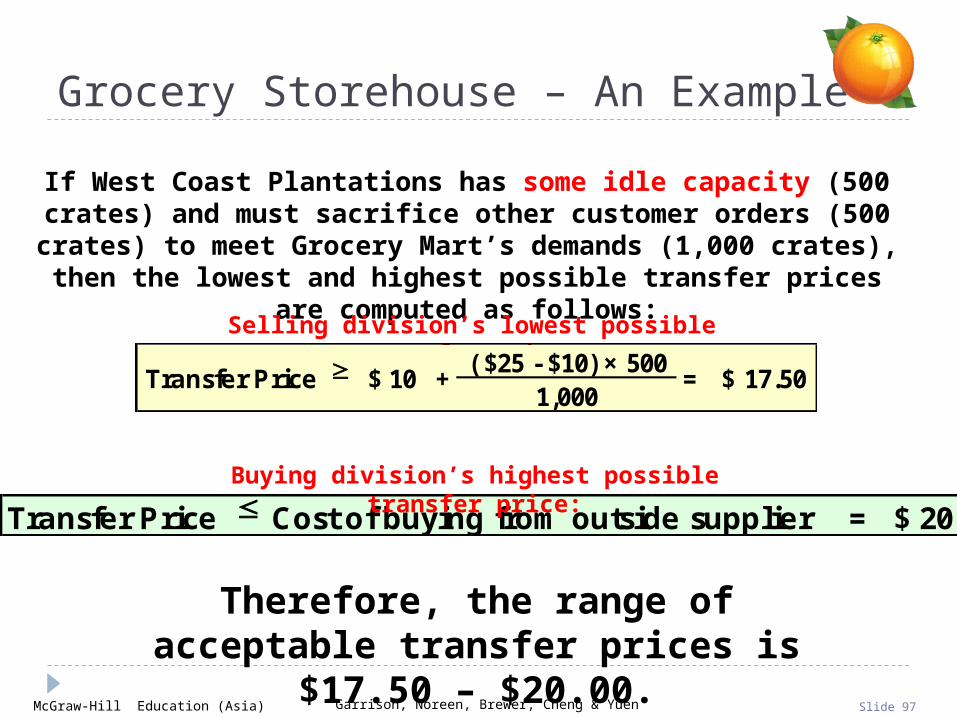
Grocery Storehouse – An Example
If West Coast Plantations has some idle capacity (500 crates) and must sacrifice other customer orders (500 crates) to meet Grocery
Mart’s demands (1,000 crates), then the lowest and highest possible transfer prices are computed as follows:
Transfer Price Cost of buying from outside supplier = 20$ Buying division’s highest possible transfer price:
Therefore, the range of acceptable transfer prices is $17.50 – $20.00.
Selling division’s lowest possible transfer price:
( $25 - $10) × 5001,000
= 17.50$ Transfer Price +10$

McGraw-Hill Education (Asia) Garrison, Noreen, Brewer, Cheng & Yuen Slide 98
Evaluation of Negotiated Transfer Prices
If a transfer within a company would result in higher overall profits for the company, there is always a range of transfer prices within which
both the selling and buying divisions would have higher profits if they agree to the transfer.
If managers are pitted against each other rather than against their past performance or
reasonable benchmarks, a noncooperative atmosphere is almost guaranteed.
Given the disputes that often accompany the negotiation process, most companies rely on some other means of setting transfer prices.
McGraw-Hill Education (Asia) Garrison, Noreen, Brewer, Cheng & Yuen Slide 99
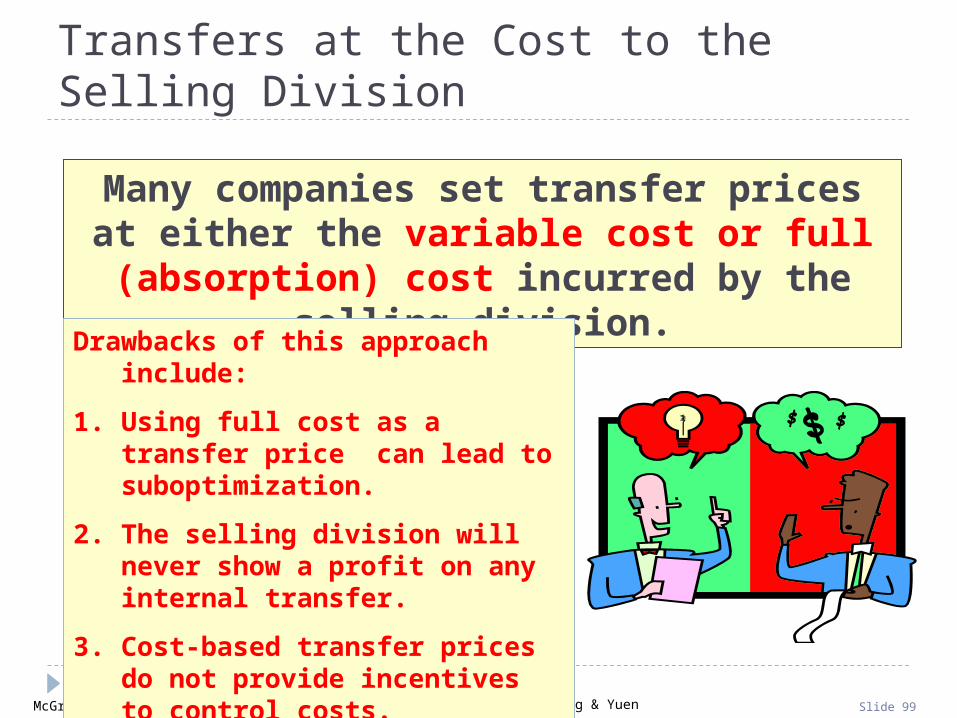
Transfers at the Cost to the Selling Division
Many companies set transfer prices at either the variable cost or full (absorption) cost
incurred by the selling division.
Drawbacks of this approach include:
1. Using full cost as a transfer price can lead to suboptimization.
2. The selling division will never show a profit on any internal transfer.
3. Cost-based transfer prices do not provide incentives to control costs.
McGraw-Hill Education (Asia) Garrison, Noreen, Brewer, Cheng & Yuen Slide 100
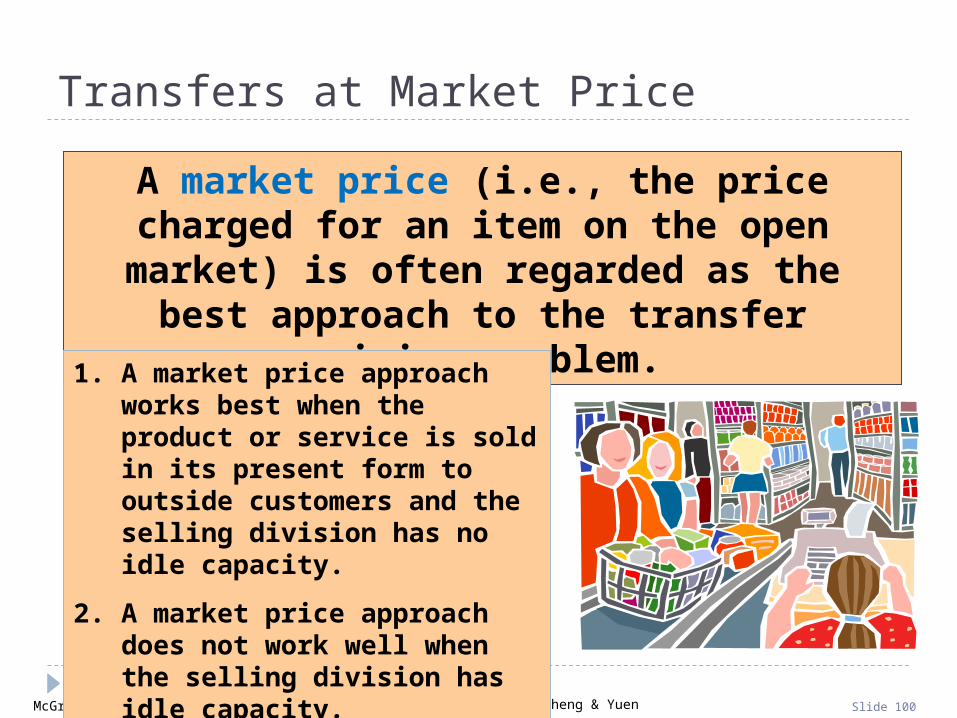
Transfers at Market Price
A market price (i.e., the price charged for an item on the open market) is often regarded as
the best approach to the transfer pricing problem.
1. A market price approach works best when the product or service is sold in its present form to outside customers and the selling division has no idle capacity.
2. A market price approach does not work well when the selling division has idle capacity.

McGraw-Hill Education (Asia) Garrison, Noreen, Brewer, Cheng & Yuen Slide 101
Divisional Autonomy and Suboptimization
The principles of decentralization suggest that companies should
grant managers autonomy to set transfer prices and to decide whether to sell internally or externally,
even if this may occasionally result in
suboptimal decisions.
This way top management allows subordinates to
control their own destiny.

McGraw-Hill Education (Asia) Garrison, Noreen, Brewer, Cheng & Yuen Slide 102
End of Chapter 13
Related Documents