© 2011 Pearson Education, Inc. Where do people live and how did they get there?

Welcome message from author
This document is posted to help you gain knowledge. Please leave a comment to let me know what you think about it! Share it to your friends and learn new things together.
Transcript

© 2011 Pearson Education, Inc.
Where do people live and how did they get there?

© 2011 Pearson Education, Inc.
Chapter 2 looks at Population◦ Demography: Geographic word for defining where people
live and how are they distributed according to age, gender, occupation, fertility, health, etc.
Chapter 3 focuses on Relocation diffusion◦ Migration is a specific kind of relocation diffusion where
people move permanently from one place to another Why are these topics crucial and relevant?
◦ 1 More people are alive at this time than at any other point in history (over 7 Billion)
◦ The greatest population growth is happening in LDCs (Less Developed Countries)
◦ The changing scale generated by modern transportation systems makes migration more feasible than in the past
◦ MDCs (More Developed Countries) are experiencing increased rates of immigrants, both legal and illegal

© 2011 Pearson Education, Inc.
Population ConcentrationsSparsely Populated RegionsPopulation Density
© 2011 Pearson Education, Inc.
Population concentrations◦ Two-thirds of the world’s population are in four regions:
1. East Asia: ¼ of the World’s Population live here – 5/6s of the people in this concentration live in China, the most populous country.
2. South Asia: Nearly ¼ of the world’s population live here as well, in India, Pakistan, Bangladesh, and Sri Lanka. India has 3/4s of the population in this concentration
3. Europe: Including Russia, this is the 3rd largest concentration of people in 4 dozen countries
4. Southeast Asia: World’s 4th largest concentration with 6 million people on the various islands between the Indian Ocean and the Pacific

© 2011 Pearson Education, Inc.
Figure 2-2

© 2011 Pearson Education, Inc.
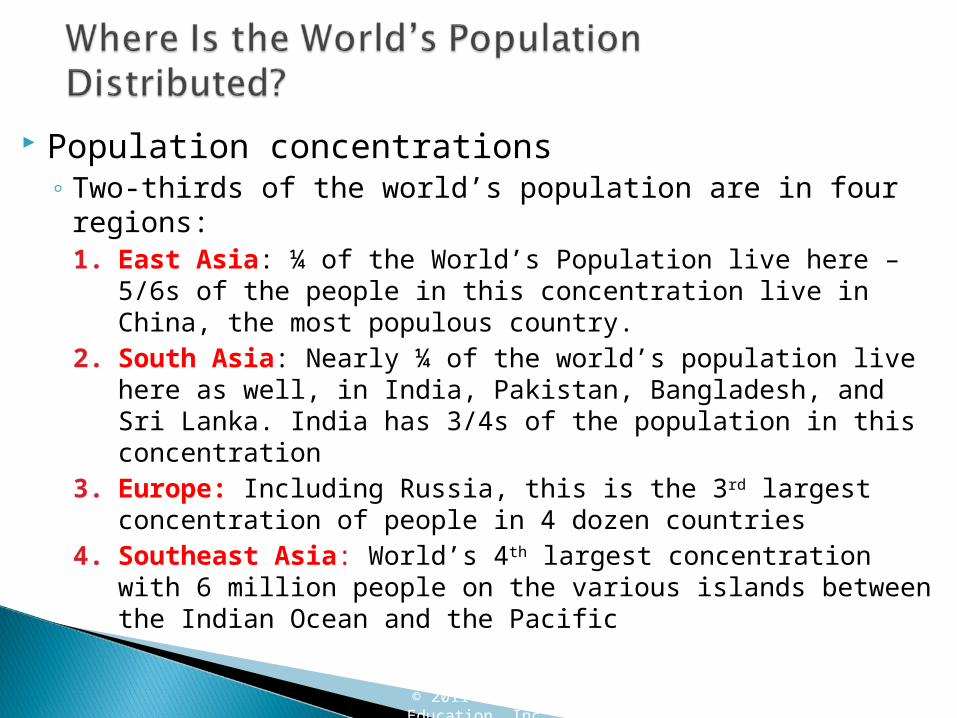
The Ecumene◦ From the Greek: “The inhabited Universe”◦ Today’s usage: Environments where World
Civilizations have settled Sparsely populated regions
◦ People generally avoid: Dry lands Wet lands Cold lands High lands
© 2011 Pearson Education, Inc.
The Portion of the earth occupied by permanent human settlement
It has expanded from the Middle East and East Asia to encompass most of the world’s land area
Figure 2-4

© 2011 Pearson Education, Inc.
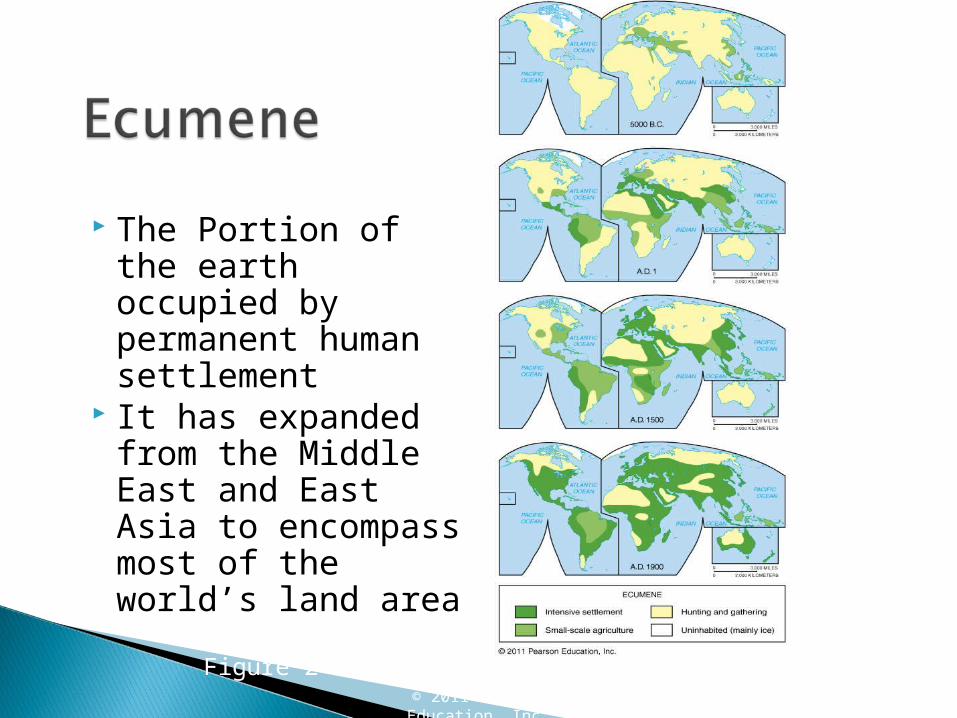
Population density◦ Arithmetic density: total number of objects in
an area (Ch. 1) also: Total number of people divided by land area (Ch. 2)
◦ Physiological density : regionally, total number of people supported by a unit of arable land
◦ Agricultural density: ratio of numbers of farmers to the amount of arable land
© 2011 Pearson Education, Inc.
Table 2-1
© 2011 Pearson Education, Inc.
Natural IncreaseFertilityMortality
© 2011 Pearson Education, Inc.
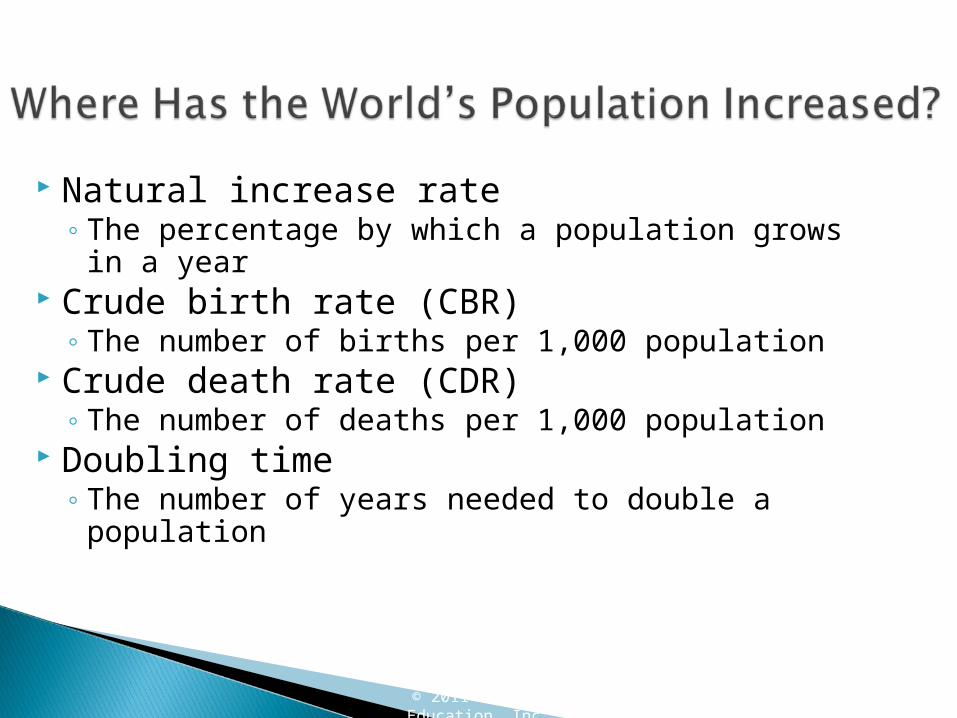
Natural increase rate◦ The percentage by which a population grows in
a year Crude birth rate (CBR)
◦ The number of births per 1,000 population Crude death rate (CDR)
◦ The number of deaths per 1,000 population Doubling time
◦ The number of years needed to double a population

© 2011 Pearson Education, Inc.
Figure 2-8

© 2011 Pearson Education, Inc.
Fertility◦ Total fertility rate (TFR) measures the total births in
a society. (Average number of children a woman will have through her childbearing years, 15-49)
Mortality◦ Infant mortality rate (IMR) measures the annual
number of deaths of infants under 1 year of age, compared to live births.
◦ Life expectancy measures the average number of years a newborn can expect to live at current mortality levels.

© 2011 Pearson Education, Inc.
• Notice that places with high TFRs tend to have high IMRs and that places with low TFRs have low IMRs.
Figure 2-13
Figure 2-14

© 2011 Pearson Education, Inc.
• The Demographic Transition• Population Pyramids• Countries in different stages of
the demographic transition• Demographic Transition and
world population growth
© 2011 Pearson Education, Inc.
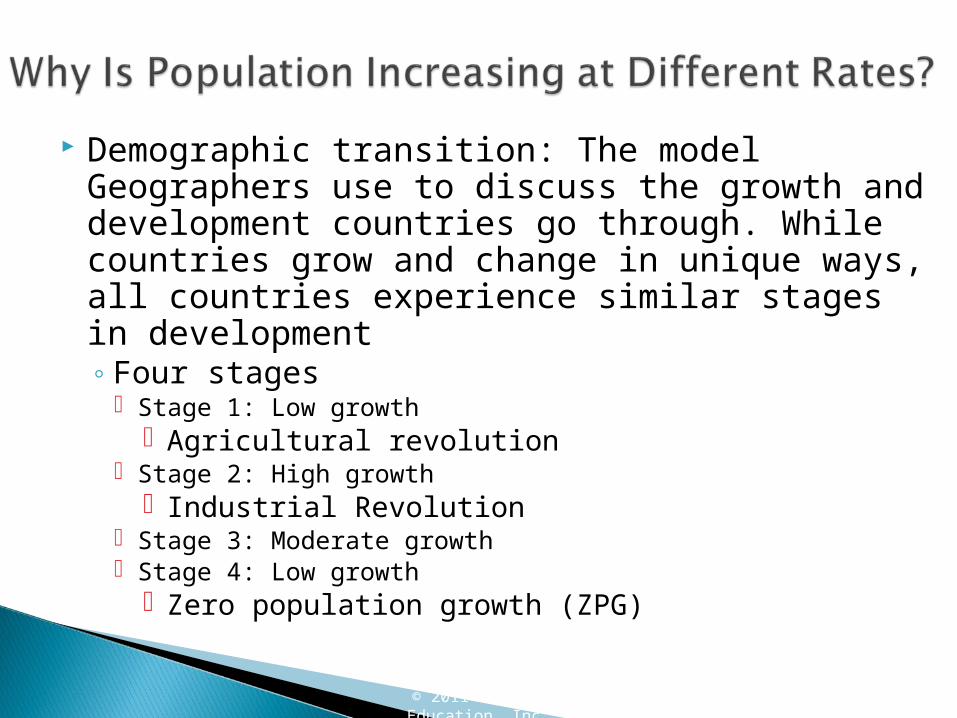
Demographic transition: The model Geographers use to discuss the growth and development countries go through. While countries grow and change in unique ways, all countries experience similar stages in development◦ Four stages
Stage 1: Low growth Agricultural revolution
Stage 2: High growth Industrial Revolution
Stage 3: Moderate growth Stage 4: Low growth
Zero population growth (ZPG)

© 2011 Pearson Education, Inc.
Figure 2-15

© 2011 Pearson Education, Inc.
Population pyramids◦ A bar graph showing a place’s age and sex
composition◦ Shape of the pyramid is determined mainly
by the CBR◦ Age distribution
Dependency ratio: people too young or old to work
◦ Sex distribution Sex ratio: Number of males per hundred females

© 2011 Pearson Education, Inc.
Figure 2-19
© 2011 Pearson Education, Inc.
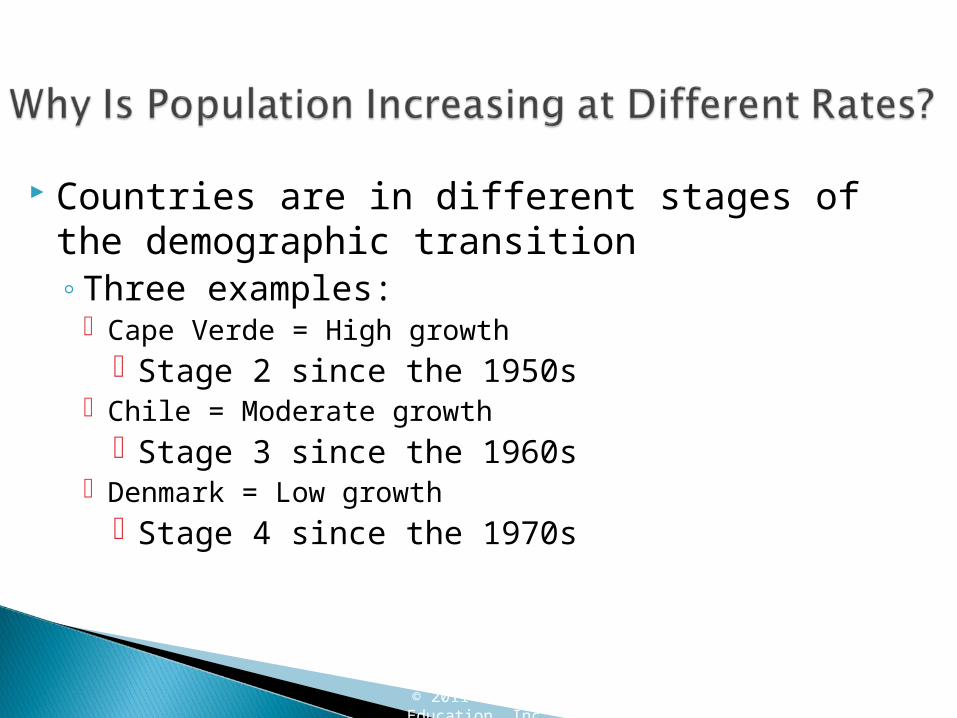
Countries are in different stages of the demographic transition◦Three examples:
Cape Verde = High growth Stage 2 since the 1950s
Chile = Moderate growth Stage 3 since the 1960s
Denmark = Low growth Stage 4 since the 1970s

© 2011 Pearson Education, Inc.
Demographic transition & world population growth◦Most countries = stage 2 or stage 3 of
the Demographic Transition Stages 2 and 3 are characterized by significant
population growth◦No country is in stage 1 of the
demographic transition◦It is easier to cause a drop in the CDR
than in the CBR

© 2011 Pearson Education, Inc.
• Malthus on Overpopulation
• Declining Birth Rates• World Health Threats

© 2011 Pearson Education, Inc.
Malthus on overpopulation◦ An Essay on the Principle of Population
(1798): Population grows geometrically while food supply grows arithmetically: People are increasing faster than the food supply
◦ Criticism of Malthus includes the following: Pessimistic viewpoint: the idea that the world’s
resources is fixed rather than expanding (possiblism)
Failure to consider technological innovation More people means more brains for developing
good ideas Marxist critique: Poverty, hunger, and other social
welfare problems are a result of unjust social and economic institutions, not population growth

© 2011 Pearson Education, Inc.
Figure 2-25

© 2011 Pearson Education, Inc.
Declining birth rates◦ Reasons for declining birth rates
Reliance on economic development: wealthier communities tend to spend money on education and healthcare
Distribution of contraceptives Women tend to attend school and stay in school
longer resulting in more economic control, and more reproductive choices
Reducing birth rates with contraceptionRapid diffusion of contraceptive methods

© 2011 Pearson Education, Inc.
Figure 2-30
© 2011 Pearson Education, Inc.
World health threats◦ The epidemiologic transition focuses on distinctive
causes of death in each stage of the demographic transition. Epidemiology: the study of distribution, incidence and control of diseases prevalent among populations at specific times that are not natural to the environment (Example: The 1918 Spanish Flu)
The epidemiologic transition Stage 1: Characterized by pandemics brought about by
infectious and parasitic diseases Malthus referred to these as “natural checks” for growth of the human population The Black Plague or The Bubonic Plague: fleas and rats from
trading ships during the late Middle Ages/early Renaissance
© 2011 Pearson Education, Inc.
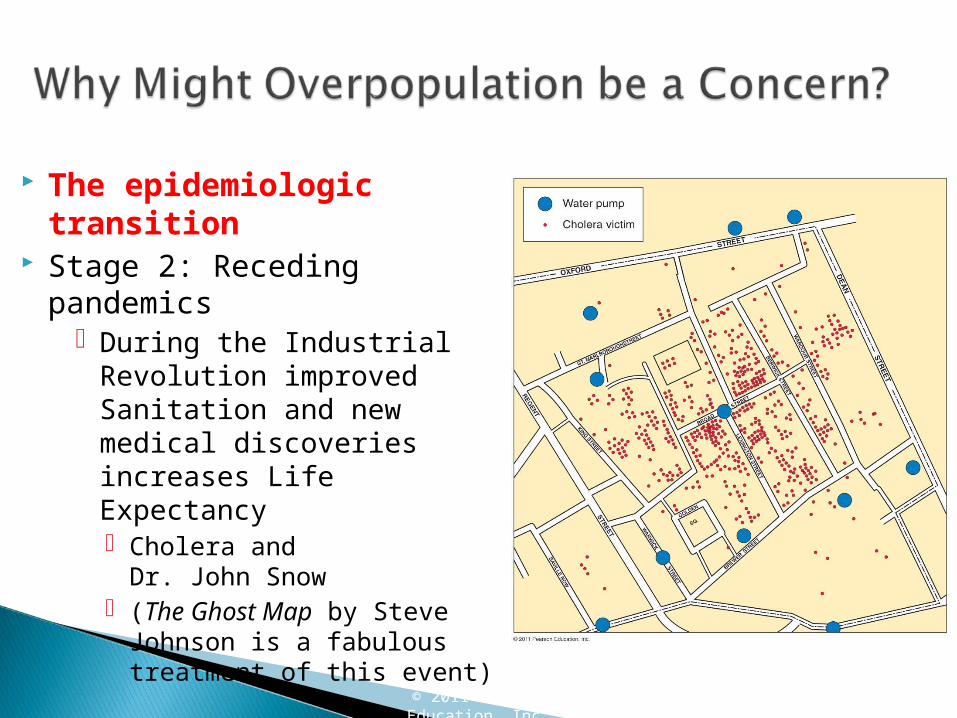
The epidemiologic transition
Stage 2: Receding pandemics During the Industrial
Revolution improved Sanitation and new medical discoveries increases Life Expectancy Cholera and
Dr. John Snow (The Ghost Map by Steve
Johnson is a fabulous treatment of this event)
Figure 2-31

© 2011 Pearson Education, Inc.
The epidemiologic transition Stage 3: Degenerative and human created diseases
Decreased deaths from infectious diseases Increased deaths from chronic disorders associated with
aging Higher instance of man made diseases: diabetes, cancer
Stage 4: Delayed degenerative diseases Medical advances prolong life
Most significant: Heart disease and cancer People still die from disease but due to medical advancements
they can live longer or be cured all together Increasing health and longevity is also a result of behavioral
changes in human populations Better diet and exercise Reduced use of alcohol and tobacco products

© 2011 Pearson Education, Inc.
The epidemiologic transition A possible stage 5: Reemergence of infectious diseases?
A set back in a long process of controlling infectious diseases Three reasons why it might be happening:
Evolution: Infectious disease microbes have evolved and changed in response to environmental pressures by developing resistance to drugs and medicines (Ex. Malaria vs. disease resistant mosquitos)
Poverty: In LDCs high instances of poverty usher in the renewal of illnesses related to poverty and industrialization. (Ex. T.B.)
Improved travel: People traveling world wide and bringing new diseases home have seen a huge increase in the rapidity with which new diseases spread around the globe (Ex. Swine Flu)

© 2011 Pearson Education, Inc.
Figure 2-33

© 2011 Pearson Education, Inc.
Up next: MigrationFigure 3-1
Related Documents


![Live Migration with AMD-V Extended Migration Technologydeveloper.amd.com/.../2012/10/...Machine-Migration-on-AMD-processors.pdf · Instruction Set Architecture (ISA)[1,2] did not](https://static.cupdf.com/doc/110x72/5e72a66d2887ad35820f6197/live-migration-with-amd-v-extended-migration-instruction-set-architecture-isa12.jpg)