© 2011 Pearson Education, Inc. H4/12/12 Distribution of Services (Ch. 12.3 – pp. 387-394)

© 2011 Pearson Education, Inc. H4/12/12 Distribution of Services (Ch. 12.3 – pp. 387-394)
Dec 13, 2015
Welcome message from author
This document is posted to help you gain knowledge. Please leave a comment to let me know what you think about it! Share it to your friends and learn new things together.
Transcript

© 2011 Pearson Education, Inc.
H4/12/12
Distribution of Services
(Ch. 12.3 – pp. 387-394)
© 2011 Pearson Education, Inc.
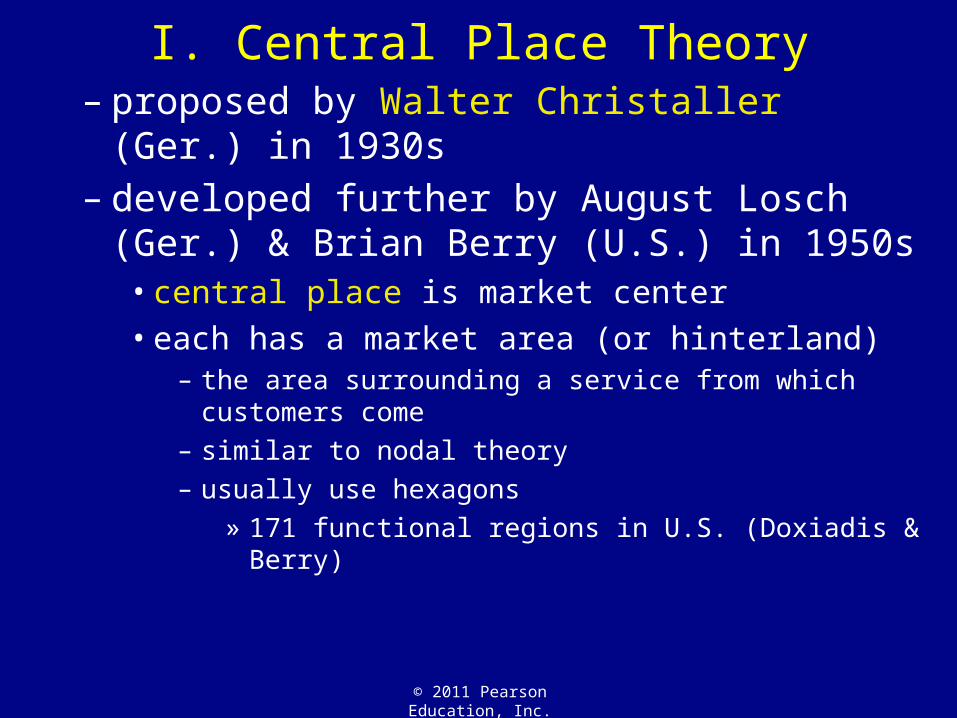
I. Central Place Theory– proposed by Walter Christaller (Ger.) in 1930s– developed further by August Losch (Ger.) &
Brian Berry (U.S.) in 1950s• central place is market center• each has a market area (or hinterland)
– the area surrounding a service from which customers come– similar to nodal theory– usually use hexagons
» 171 functional regions in U.S. (Doxiadis & Berry)

© 2011 Pearson Education, Inc.
Central Place Theory
Figure 12-17

© 2011 Pearson Education, Inc.
“Daily Urban Systems”
Figure 12-16
© 2011 Pearson Education, Inc.
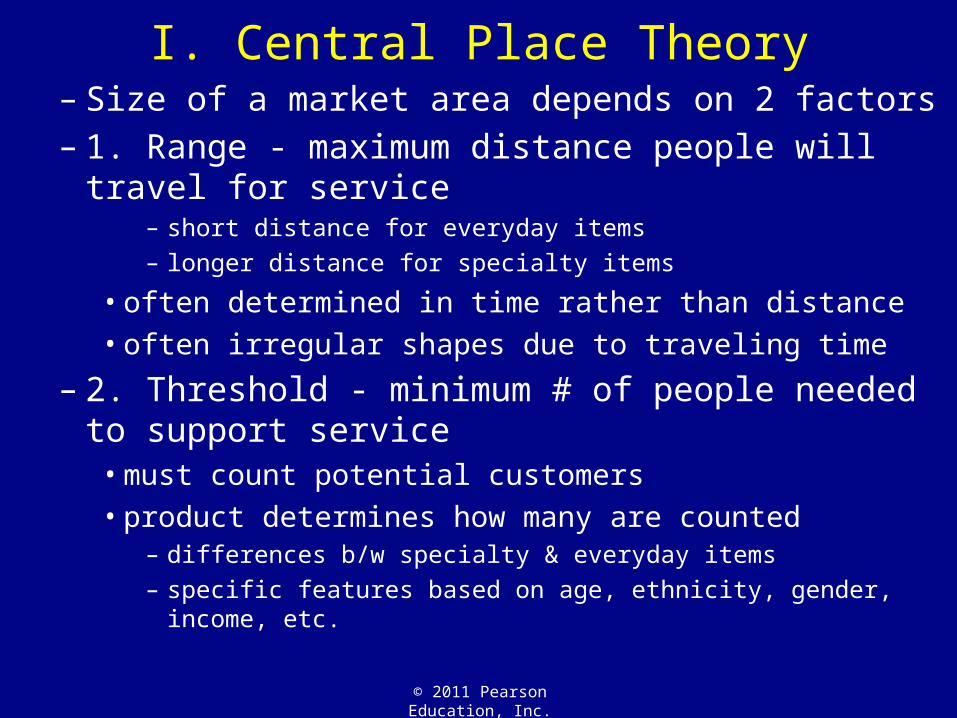
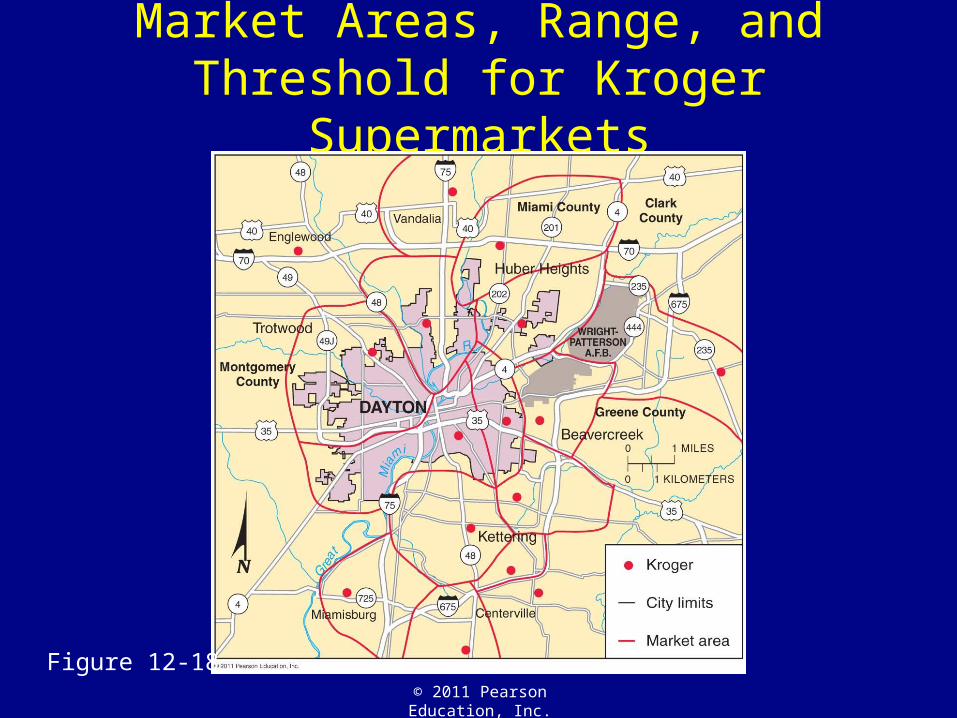
I. Central Place Theory– Size of a market area depends on 2 factors– 1. Range - maximum distance people will travel for
service– short distance for everyday items– longer distance for specialty items
• often determined in time rather than distance• often irregular shapes due to traveling time
– 2. Threshold - minimum # of people needed to support service
• must count potential customers• product determines how many are counted
– differences b/w specialty & everyday items– specific features based on age, ethnicity, gender, income, etc.
© 2011 Pearson Education, Inc.
Market Areas, Range, and Threshold for Kroger Supermarkets
Figure 12-18

© 2011 Pearson Education, Inc.
II. Market-Area Analysis– A. Profitability of a Location
• Compute the range• Compute the threshold• Draw the market area
– B. Optimal Location within a Market• minimize distance to service for largest # of people
– Best location in a linear settlement» gravity model - optimal location related to # of
people in area & inversely related to distance one must travel
» must factor in apartment buildings– Best location in a nonlinear settlement
» must try several options and run numbers

© 2011 Pearson Education, Inc.
Optimal Location for a Pizza-Delivery Service - Linear Settlement
Figure 12-20

© 2011 Pearson Education, Inc.
III. Hierarchy of Services and Settlements– Overview
• larger settlements provide more services - why?• will only travel far for specialty items & or great sales
– A. Nesting• Market areas in MDCs = a series of hexagons of
various sizes– variations based on different market sizes– Christaller noted regular patterns – Berry found similar patterns in U.S. Midwest
• scale of services produces separate ranges, thresholds

© 2011 Pearson Education, Inc.
Central Place Theory
Figure 12-21

11© 2011 Pearson Education, Inc.
11
© 2011 Pearson Education, Inc.
III. Hierarchy of Services and Settlements– B. Rank-size Distribution of Settlements
• 1. rank-size rule - each city is smaller than largest by degrees (nth largest is 1/n pop. of rank-size city)
– ex: L.A. 1/2 size of NYC, Chi. 1/3 size of NYC, etc.
• rank size often relates to more even distribution of wealth and is more common in MDCs
• 2. primate city rule - no regular pattern, largest city is more than 2x bigger than 2nd largest city
– ex: Denmark, U.K., Romania
• often occurs in LDCs w/ extremely large cities w/ services separated from rural areas & smaller cities

© 2011 Pearson Education, Inc.
Rank-Size Distribution in theUnited States and Indonesia
Figure 12-23

© 2011 Pearson Education, Inc.
III. Hierarchy of Services and Settlements– C. Periodic markets
• more common w/ lower end services• often collection of services together• will move around areas• more common in urban LDCs or rural MDCs
– sometimes related to specialty items» ex: flea markets, farmers’ market
• often follow local religious or cultural customs– ex: Muslim (rotate w/ rest on Friday), China (10 day lunar),
Korea (15-day lunar), Africa (local ethnic rules)

1515
Related Documents