© 2010 Pearson Prentice Hall. All rights reserved Scatterplots and Correlation Coefficient

© 2010 Pearson Prentice Hall. All rights reserved Scatterplots and Correlation Coefficient.
Dec 19, 2015
Welcome message from author
This document is posted to help you gain knowledge. Please leave a comment to let me know what you think about it! Share it to your friends and learn new things together.
Transcript

© 2010 Pearson Prentice Hall. All rights reserved
Scatterplots and Correlation Coefficient

4-2© 2010 Pearson Prentice Hall. All rights reserved

4-33© 2010 Pearson Prentice Hall. All rights reserved

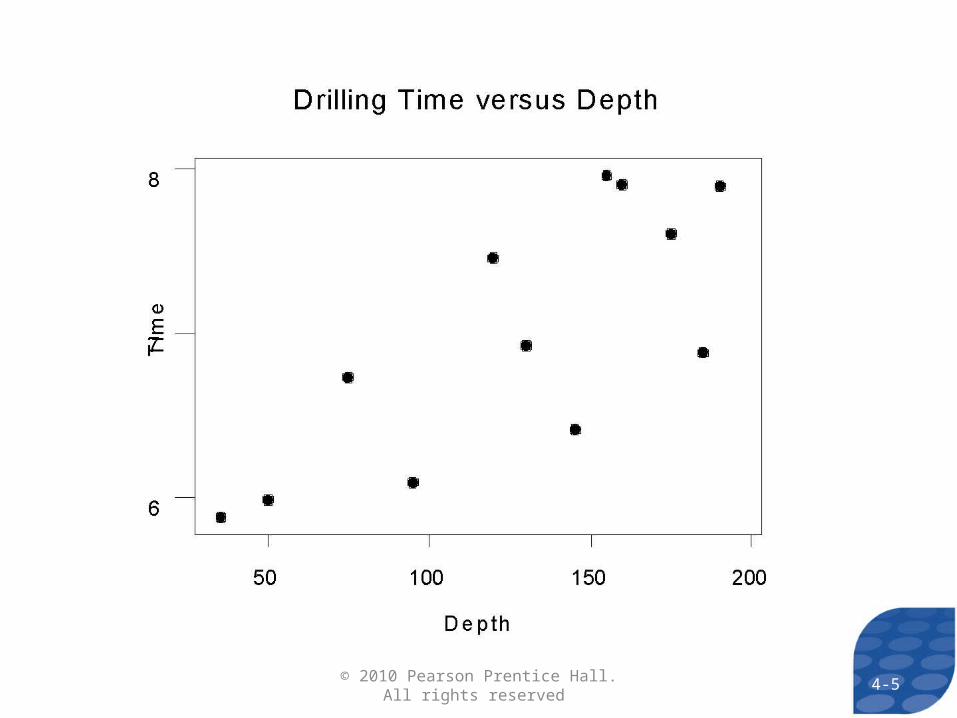
EXAMPLE Drawing and Interpreting a Scatter Diagram
The data shown to the right are based on a study for drilling rock. The researchers wanted to determine whether the time it takes to dry drill a distance of 5 feet in rock increases with the depth at which the drilling begins. So, depth at which drilling begins is the explanatory variable, x, and time (in minutes) to drill five feet is the response variable, y. Draw a scatter diagram of the data.Source: Penner, R., and Watts, D.G. “Mining Information.” The American Statistician, Vol. 45, No. 1, Feb. 1991, p. 6.
4-4© 2010 Pearson Prentice Hall. All rights reserved
4-5© 2010 Pearson Prentice Hall. All rights reserved

Various Types of Relations in a Scatter Diagram
4-6© 2010 Pearson Prentice Hall. All rights reserved

4-7© 2010 Pearson Prentice Hall. All rights reserved
4-8© 2010 Pearson Prentice Hall. All rights reserved

4-9© 2010 Pearson Prentice Hall. All rights reserved

4-10© 2010 Pearson Prentice Hall. All rights reserved
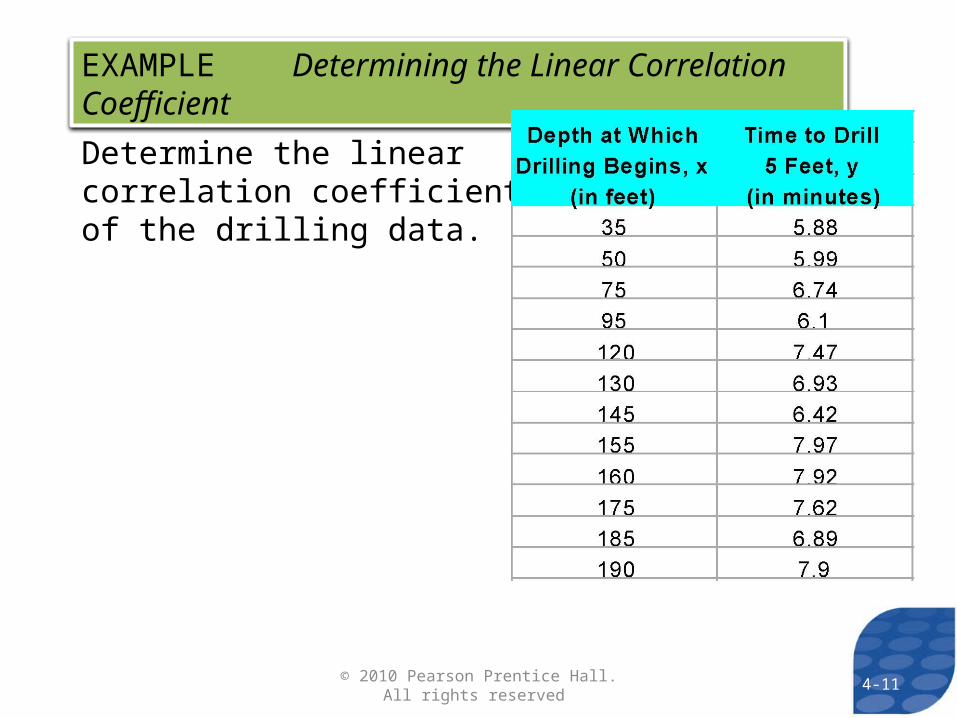
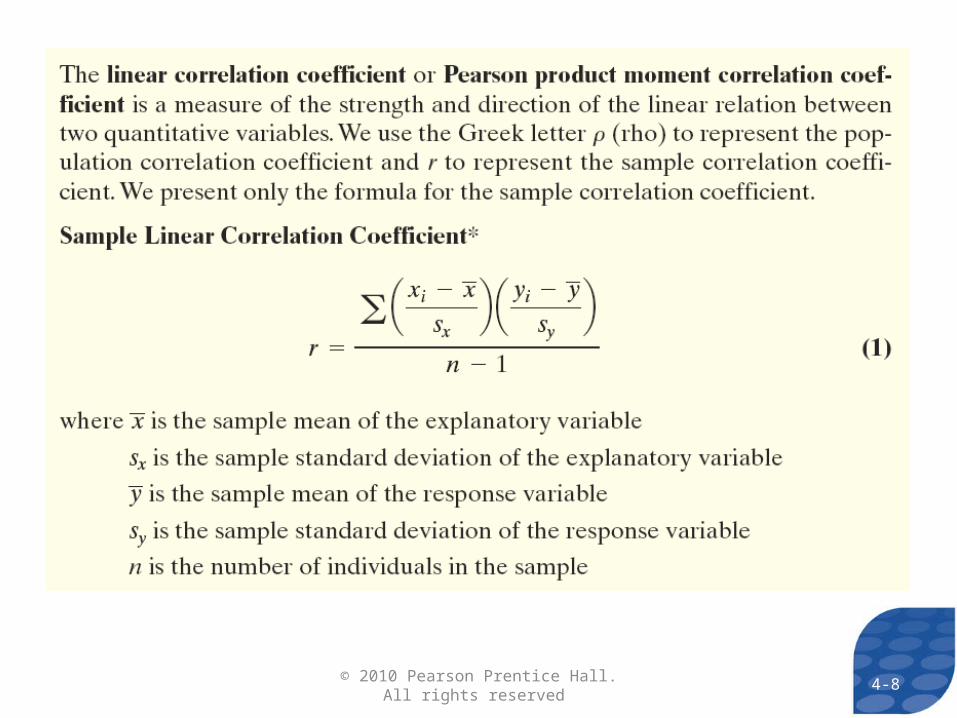
EXAMPLE Determining the Linear Correlation Coefficient
Determine the linear correlation coefficient of the drilling data.
4-11© 2010 Pearson Prentice Hall. All rights reserved

4-12© 2010 Pearson Prentice Hall. All rights reserved
xz yz ))(( yx zz

13
18.501037
12 10.773
i i
x y
x x y y
s sr
n
4-13© 2010 Pearson Prentice Hall. All rights reserved
The correlation coefficient of 0.773 indicates there is a moderate positive linear relationship between the variables
Related Documents