© 2008 Pearson Addison-Wesley. All rights reserved 8-4-1 Chapter 1 Section 8-4 An Introduction to Functions: Linear Functions, Applications, and Models

© 2008 Pearson Addison-Wesley. All rights reserved 8-4-1 Chapter 1 Section 8-4 An Introduction to Functions: Linear Functions, Applications, and Models.
Dec 25, 2015
Welcome message from author
This document is posted to help you gain knowledge. Please leave a comment to let me know what you think about it! Share it to your friends and learn new things together.
Transcript

© 2008 Pearson Addison-Wesley. All rights reserved
8-4-1
Chapter 1
Section 8-4An Introduction to Functions: Linear Functions, Applications, and Models
© 2008 Pearson Addison-Wesley. All rights reserved
8-4-2
An Introduction to Functions: Linear Functions, Applications, and Models
• Relations and Functions• Domain and Range• Graphs of Relations• Graphs of Functions• Function Notation• Linear Functions• Modeling with Linear Functions
© 2008 Pearson Addison-Wesley. All rights reserved
8-4-3
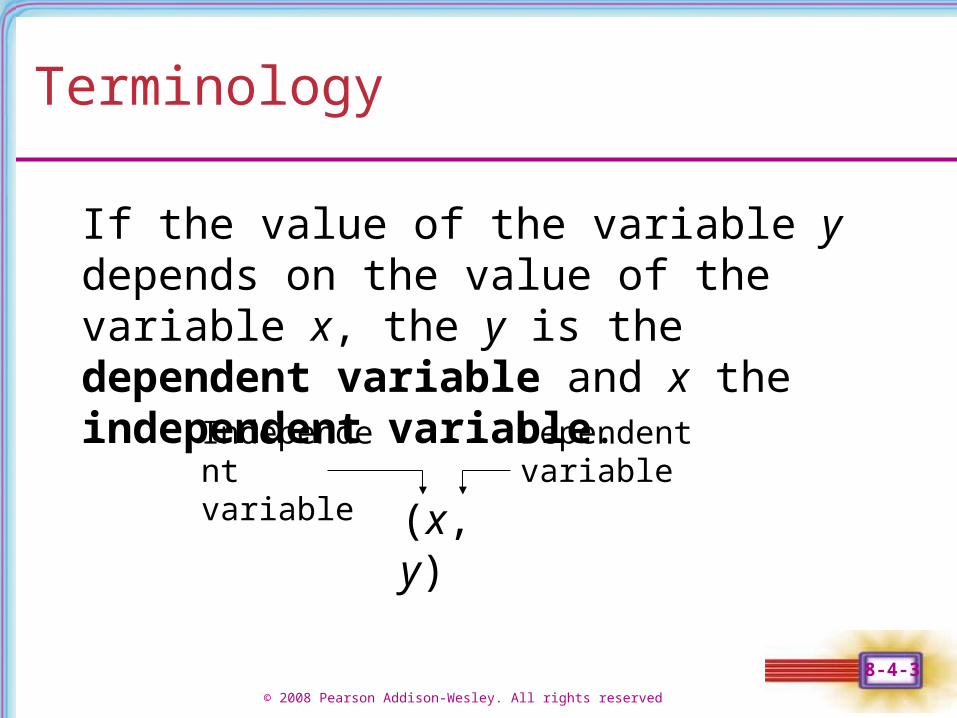
Terminology
If the value of the variable y depends on the value of the variable x, the y is the dependent variable and x the independent variable.
(x, y)
Independent variable
Dependent variable
© 2008 Pearson Addison-Wesley. All rights reserved
8-4-4
Relation
A relation is a set of ordered pairs.
For example, the sets
F = {(1, 2), (–1, 5), (4, 3)} and
G = {(1, 5), (9, 0), (9, 8)} are both relations.
© 2008 Pearson Addison-Wesley. All rights reserved
8-4-5
Function
A function is a relation in which for each value of the first component of the ordered pairs there is exactly one value of the second component.
Of the two sets,F = {(1, 2), (–1, 5), (4, 3)} and G = {(1, 5), (9, 0), (9, 8)}, only F is a function.
© 2008 Pearson Addison-Wesley. All rights reserved
8-4-6
Example: Determining Independent and Dependent Variables
Determine the independent and dependent variables for the following. The procedure by which someone uses a calculator that finds square roots.
Solution
The independent variable (input) is a nonnegative real number. The dependent variable (output) is the nonnegative square root. For example (81, 9) belongs to this function.

© 2008 Pearson Addison-Wesley. All rights reserved
8-4-7
Domain and Range
In a relation, the set of all values of the independent variable (x) is the domain. The set of all values of the dependent variable (y) is the range.
© 2008 Pearson Addison-Wesley. All rights reserved
8-4-8
Example: Determining Domain and Range
Give the domain and range of the square root function from the previous slide.
Solution
The domain is restricted to the nonnegative numbers:
The range also is
0, .
0, .
© 2008 Pearson Addison-Wesley. All rights reserved
8-4-9
Graphs of Relations
The graph of a relation is the graph of its ordered pairs. The graph gives a picture of the relation, which can be used to determine its domain and range.

© 2008 Pearson Addison-Wesley. All rights reserved
8-4-10
Example: Determining Domain and Range
y
x
y
x
Domain {-3, -2, 0, 1}
Range {-2, -1, 2, 3}
Domain [-1, 1]
Range [-3, 3]
© 2008 Pearson Addison-Wesley. All rights reserved
8-4-11
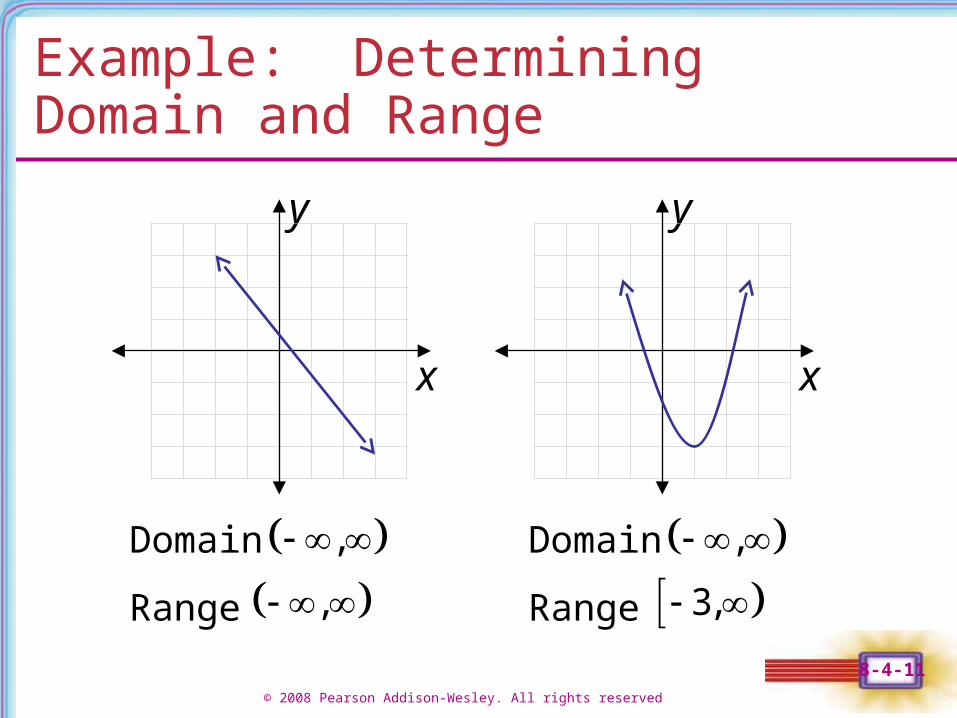
Example: Determining Domain and Range
y
x
y
x
Domain
Range
,
,
Domain
Range
,
3,
© 2008 Pearson Addison-Wesley. All rights reserved
8-4-12
Agreement on Domain
The domain of a relation is assumed to be all real numbers that produce real numbers when substituted for the independent variable.
© 2008 Pearson Addison-Wesley. All rights reserved
8-4-13
Graphs of Functions
In a function each value of x leads to only one value of y, so any vertical line drawn through the graph of a function must intersect the graph in at most one point. This is called the vertical line test for a function.

© 2008 Pearson Addison-Wesley. All rights reserved
8-4-14
Vertical Line Test
If a vertical line intersects the graph of a relation in more than one point, then the relation is not a function.

© 2008 Pearson Addison-Wesley. All rights reserved
8-4-15
Example: Vertical Line Test
y
x
y
x
Not a function – the same x-value corresponds to multiple y-values
Function – each x-value corresponds to only one y-value
© 2008 Pearson Addison-Wesley. All rights reserved
8-4-16
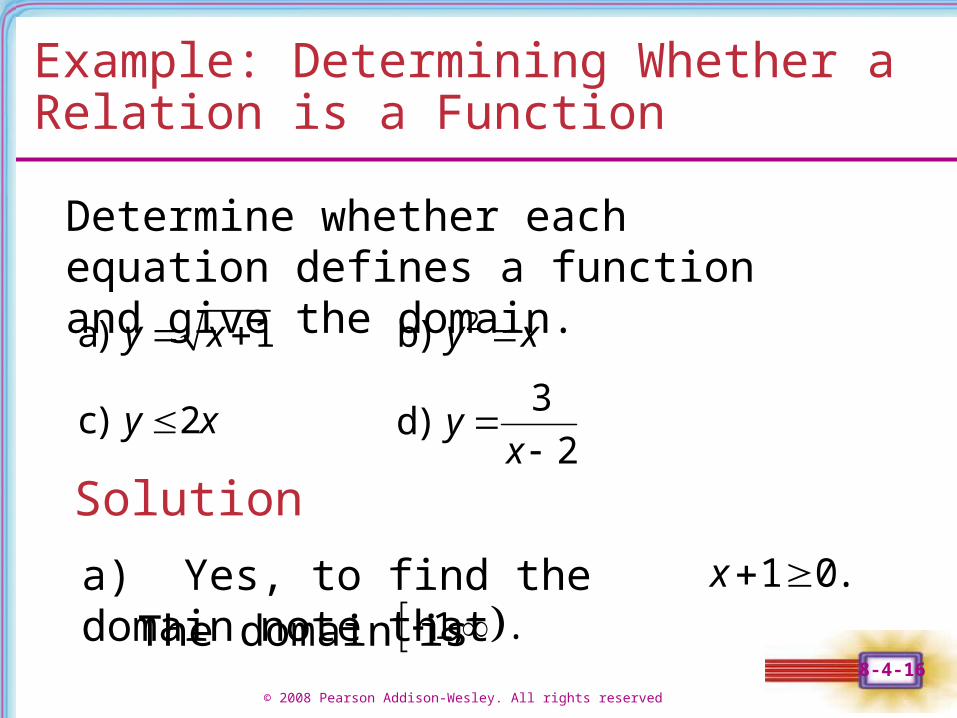
Example: Determining Whether a Relation is a Function
Determine whether each equation defines a function and give the domain.
a) 1y x 2b) y x
c) 2y x 3d)
2y
x
Solution
a) Yes, to find the domain note that The domain is
1 0.x 1, .
© 2008 Pearson Addison-Wesley. All rights reserved
8-4-17
Example: Determining Whether a Relation is a Function
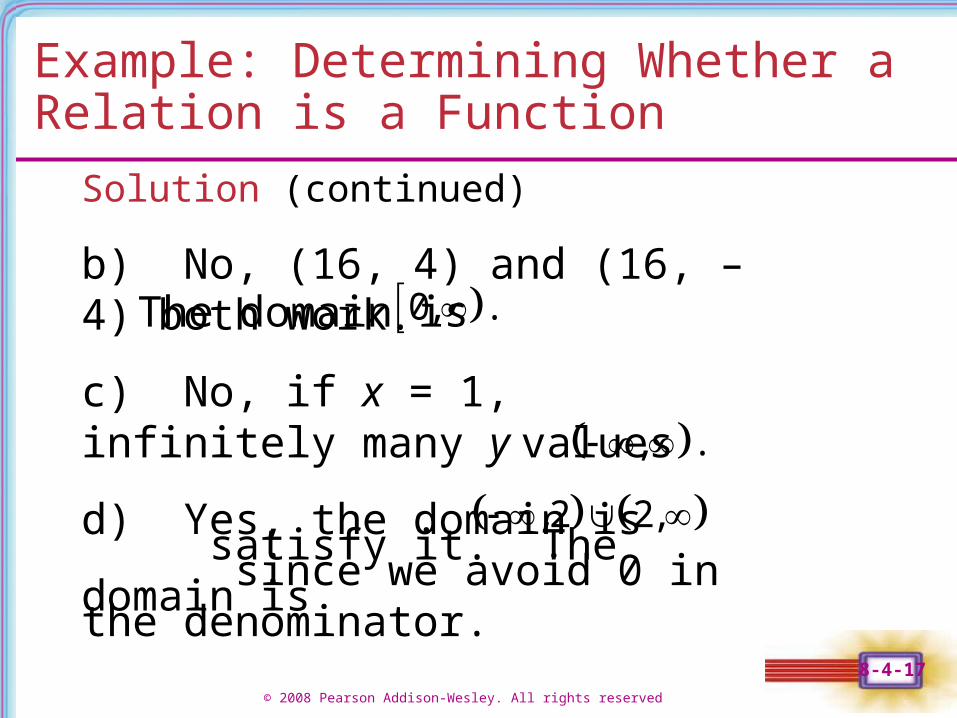
Solution (continued)
b) No, (16, 4) and (16, –4) both work. The domain is 0, .
c) No, if x = 1, infinitely many y values satisfy it. The domain is
, .
d) Yes, the domain is since we avoid 0 in the denominator.
, 2 2,

© 2008 Pearson Addison-Wesley. All rights reserved
8-4-18
Variations of the Definition of Function
1. A function is a relation in which for each value of the first component of the ordered pairs there is exactly one value of the
second component.
2. A function is a set of distinct ordered pairs in which no first component is repeated.
3. A function is a rule or correspondence that assigns exactly one range value to each domain value.
© 2008 Pearson Addison-Wesley. All rights reserved
8-4-19
Function Notation
When a function f is defined with a rule or an equation using x and y for the independent and dependent variables, we say “y is a function of x” to emphasize that y depends on x. We use the notation
y = f (x),
called function notation, to express this and read f (x) as “f of x.” For example if y = 3x + 1, we write f (x) = 3x + 1.

© 2008 Pearson Addison-Wesley. All rights reserved
8-4-20
Function Notation
Note that f (x) is just another name for the dependent variable y. If f (x) = 3x + 1, we find f (2) by replacing x with 2,
f (2) = 3(2) + 1 = 7
Read f (2) as “f of 2” or “f at 2.”

© 2008 Pearson Addison-Wesley. All rights reserved
8-4-21
Example: Using Function Notation
Let f (x) = x 2 + 3x – 1. Find the following.
a) f (2) b) f (0) c) f (2x)
Solutiona) f (2) = 2
2 + 3(2) – 1 = 9
b) f (0) = 0 + 0 – 1 = –1
c) f (2x) = (2x) 2 + 3(2x) – 1 = 4x
2 + 6x – 1

© 2008 Pearson Addison-Wesley. All rights reserved
8-4-22
Linear Functions
A function that can be written in the form
f (x) = mx + b
for real numbers m and b is a linear function.

© 2008 Pearson Addison-Wesley. All rights reserved
8-4-23
Example: Graphing Linear Functions
y
x
y
x
Graph each linear function.a) f (x) = –2x + 1 b) f (x) = 2
Solution

© 2008 Pearson Addison-Wesley. All rights reserved
8-4-24
Example: Modeling with Linear Functions
A company produces DVDs of live concerts. The company pays $200 for advertising the DVDs. Each DVD costs $12 to produce and the company charges $20 per disk.
a) Express the cost C as a function of x, the number of DVDs produced.b) Express the revenue R as a function of x, the number of DVDs sold.c) When will the company break-even? That is, for what value of x does revenue equal cost?
© 2008 Pearson Addison-Wesley. All rights reserved
8-4-25
Example: Modeling with Linear Functions
a) The fixed cost is $200 and for each DVD produced, the variable cost is $12. The cost C can be expressed as a function of x, the number of DVDs produced: C(x) = 12x + 200.
b) Each DVD sells for $20, so revenue R is given by: R(x) = 20x.
Solution
© 2008 Pearson Addison-Wesley. All rights reserved
8-4-26
Example: Modeling with Linear Functions
c) The company will just break even (no profit and no loss) as long as revenue just equals cost, or C(x) = R(x). This is true whenever
12x + 200 = 20x 200 = 8x
25 = x. If 25 DVDs are produced and sold, the company will break even.
Solution (continued)
Related Documents