© 2007 Wiley Chapter 3 – Product Design & Process Selection Operations Management by R. Dan Reid & Nada R. Sanders 3 rd Edition © Wiley 2007

Welcome message from author
This document is posted to help you gain knowledge. Please leave a comment to let me know what you think about it! Share it to your friends and learn new things together.
Transcript

© 2007 Wiley
Chapter 3 – Product Design & Process
Selection
Operations Managementby
R. Dan Reid & Nada R. Sanders3rd Edition © Wiley 2007
© 2007 Wiley
Learning Objectives Define product design and its strategic impact on
organization Describe steps to develop a product design Using break-even analysis as a tool in selecting between
product alternatives Identity production process differences and their
characteristics Understand how to use a process flowchart Understand how to use process performance metrics Understand current technology advancements and how they
impact process design Understand issues impacting the design of service
operations

© 2007 Wiley
Product & Service Design Product design – the process of deciding the
companies product/service unique characteristics and features
Product design must support the business strategy Product design defines a product’s characteristics
- Appearance, materials, dimensions, tolerances, performance standards
Service industries must define both the service and concept
- Physical elements, aesthetic & psychological benefits e.g. promptness, friendliness, ambiance
Product and service design must match the needs and preferences of the targeted customer group
© 2007 Wiley
Product & Service Design Steps
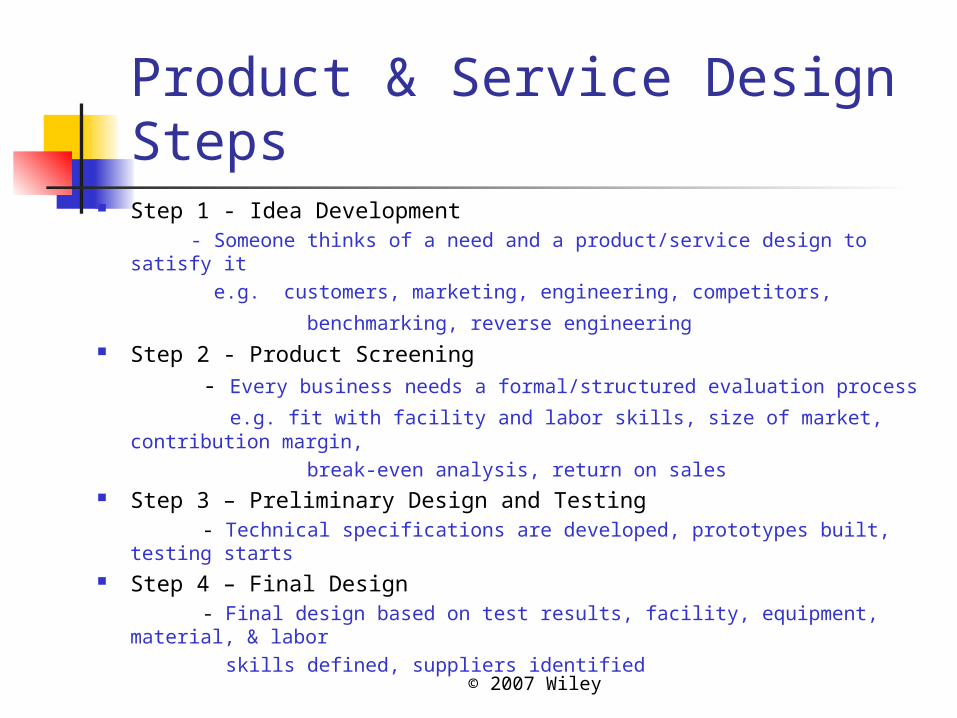
Step 1 - Idea Development - Someone thinks of a need and a product/service design to satisfy it e.g. customers, marketing, engineering, competitors,
benchmarking, reverse engineering Step 2 - Product Screening - Every business needs a formal/structured evaluation process
e.g. fit with facility and labor skills, size of market, contribution margin,
break-even analysis, return on sales Step 3 – Preliminary Design and Testing - Technical specifications are developed, prototypes built, testing starts Step 4 – Final Design - Final design based on test results, facility, equipment, material, &
labor skills defined, suppliers identified
© 2007 Wiley
Break-Even Analysis: Graphical Approach
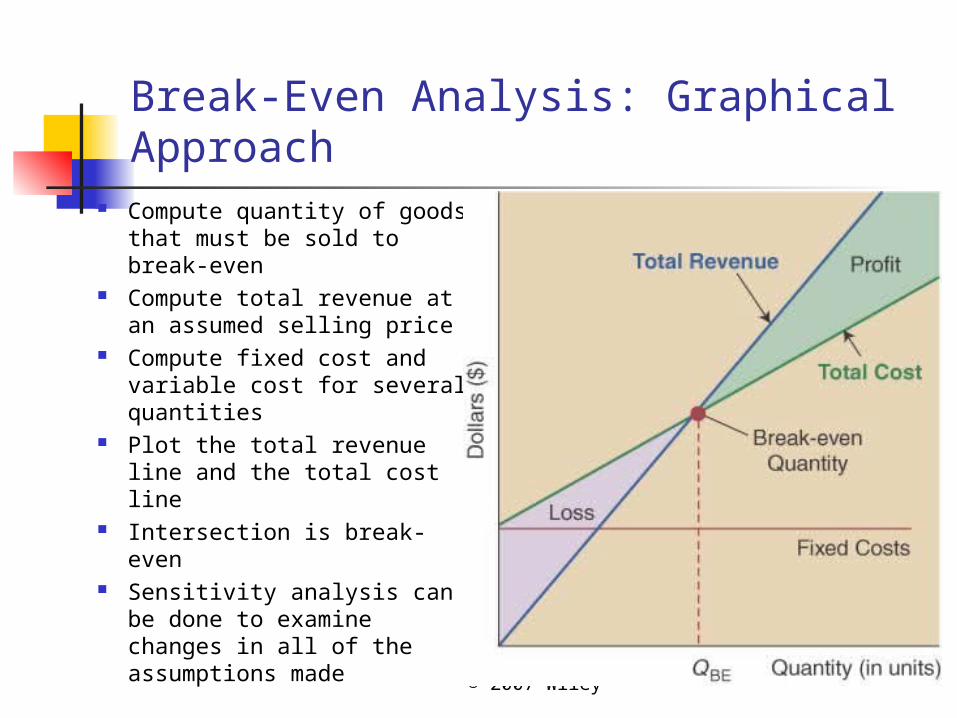
Compute quantity of goods that must be sold to break-even
Compute total revenue at an assumed selling price
Compute fixed cost and variable cost for several quantities
Plot the total revenue line and the total cost line
Intersection is break-even Sensitivity analysis can
be done to examine changes in all of the assumptions made

© 2007 Wiley
Break-Even Analysis Total cost = fixed costs + variable costs (quantity):
Revenue = selling price (quantity)
Break-even point is where total costs = revenue:
QVCFTC
QSPR
VCSP
FQor
QSPQVCForRTC
© 2007 Wiley
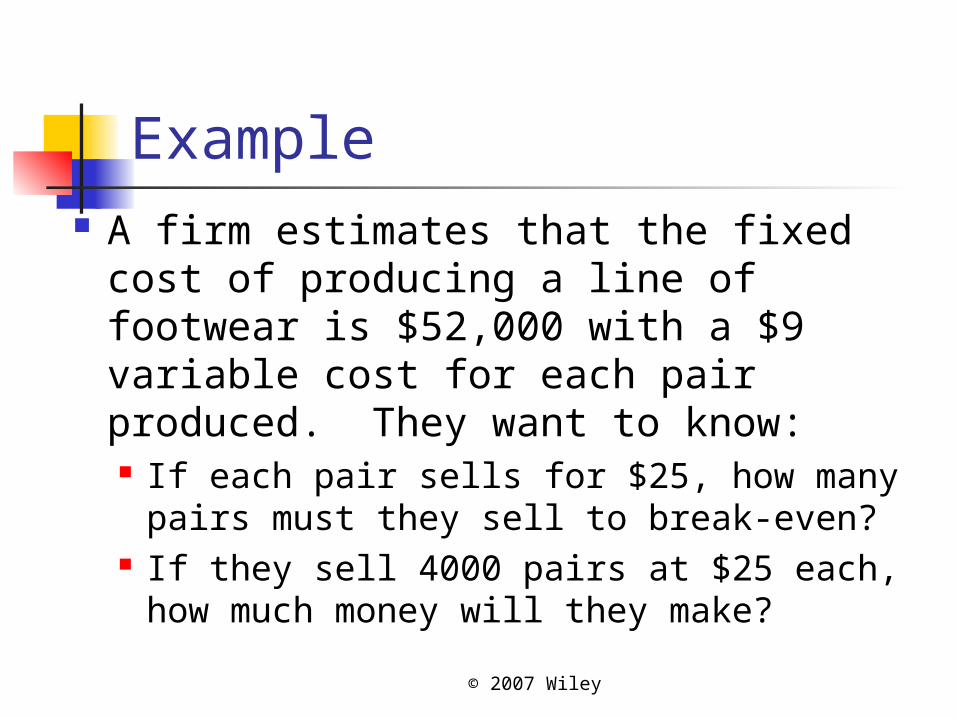
Example A firm estimates that the fixed cost
of producing a line of footwear is $52,000 with a $9 variable cost for each pair produced. They want to know: If each pair sells for $25, how many
pairs must they sell to break-even? If they sell 4000 pairs at $25 each, how
much money will they make?
© 2007 Wiley
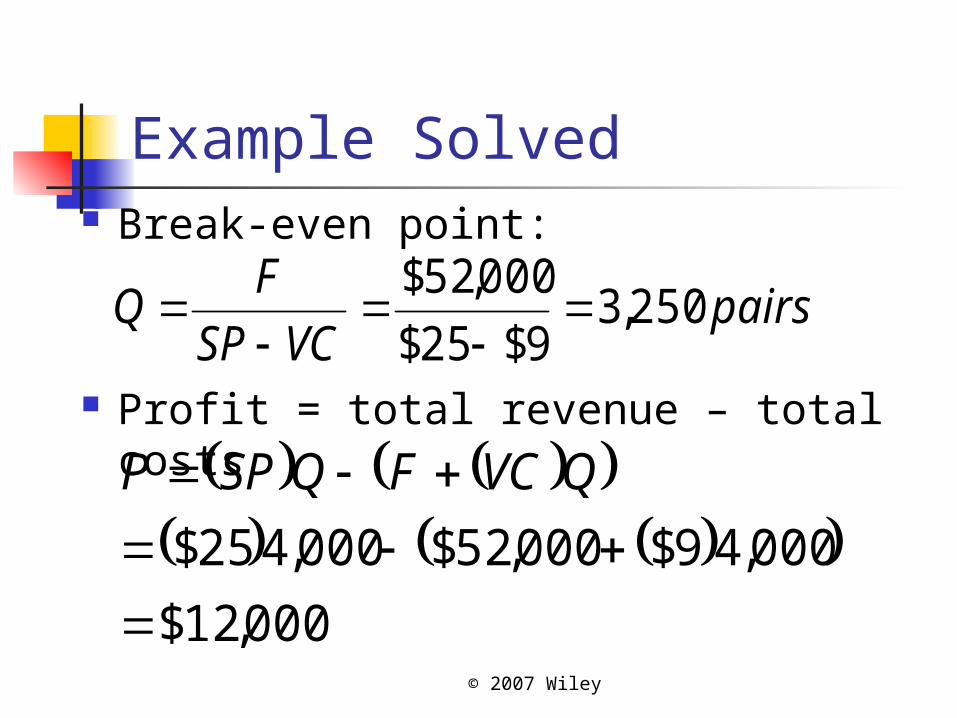
Example Solved Break-even point:
Profit = total revenue – total costs
pairsVCSP
FQ 250,3
9$25$
000,52$
000,12$
000,49$000,52$000,425$
QVCFQSPP
© 2007 Wiley
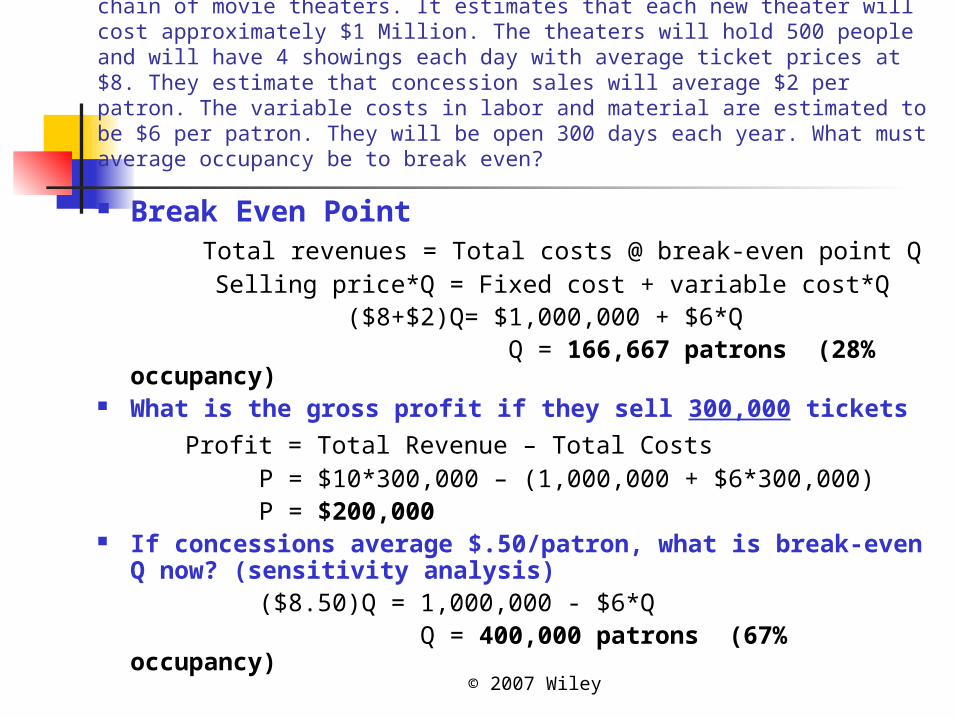
Break-even calculation: A company is planning to establish a chain of movie theaters. It estimates that each new theater will cost approximately $1 Million. The theaters will hold 500 people and will have 4 showings each day with average ticket prices at $8. They estimate that concession sales will average $2 per patron. The variable costs in labor and material are estimated to be $6 per patron. They will be open 300 days each year. What must average occupancy be to break even?
Break Even Point Total revenues = Total costs @ break-even point Q Selling price*Q = Fixed cost + variable cost*Q ($8+$2)Q= $1,000,000 + $6*Q Q = 166,667 patrons (28% occupancy) What is the gross profit if they sell 300,000 tickets
Profit = Total Revenue – Total Costs P = $10*300,000 – (1,000,000 + $6*300,000) P = $200,000 If concessions average $.50/patron, what is break-
even Q now? (sensitivity analysis) ($8.50)Q = 1,000,000 - $6*Q Q = 400,000 patrons (67% occupancy)
© 2007 Wiley
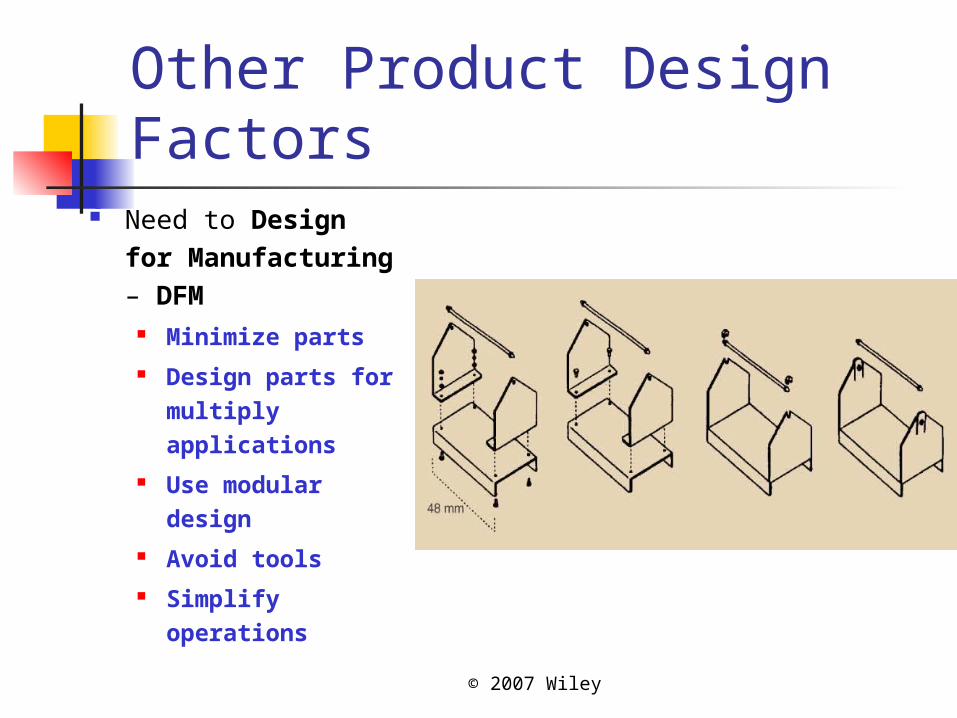
Other Product Design Factors
Need to Design for Manufacturing – DFM
Minimize parts Design parts for
multiply applications
Use modular design
Avoid tools Simplify
operations
© 2007 Wiley
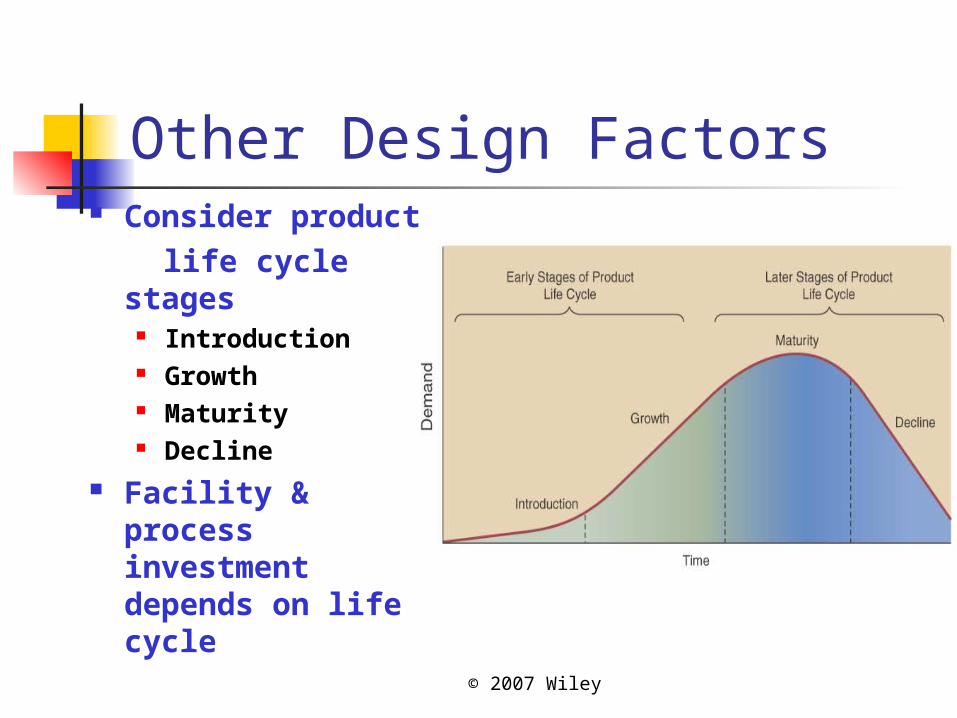
Other Design Factors Consider
product life cycle stages
Introduction Growth Maturity Decline
Facility & process investment depends on life cycle

© 2007 Wiley
Other Design factors Old “over-the –wall”
sequential design process should not be used
Each function did its work and
passed it to the next function
Replace with a Concurrent Engineering process
All functions form a design
team working together to
develop specifications,
involve customers early,
solve potential problems,
reduce costs, & shorten time
to market
© 2007 Wiley
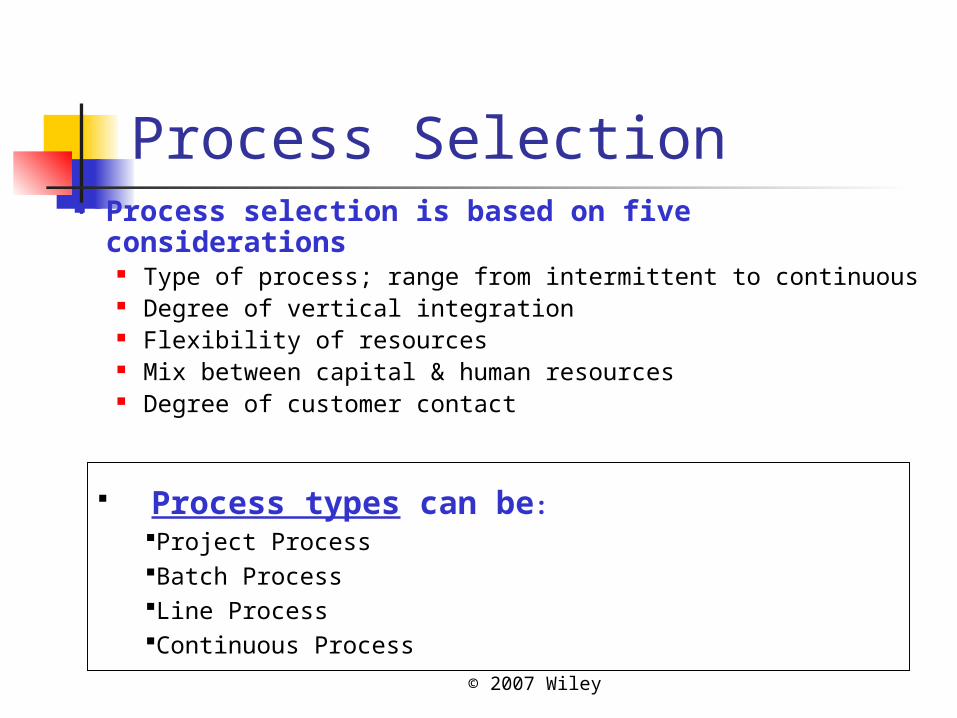
Process Selection Process selection is based on five
considerations Type of process; range from intermittent to continuous Degree of vertical integration Flexibility of resources Mix between capital & human resources Degree of customer contact
Process types can be:Project ProcessBatch ProcessLine ProcessContinuous Process
© 2007 Wiley
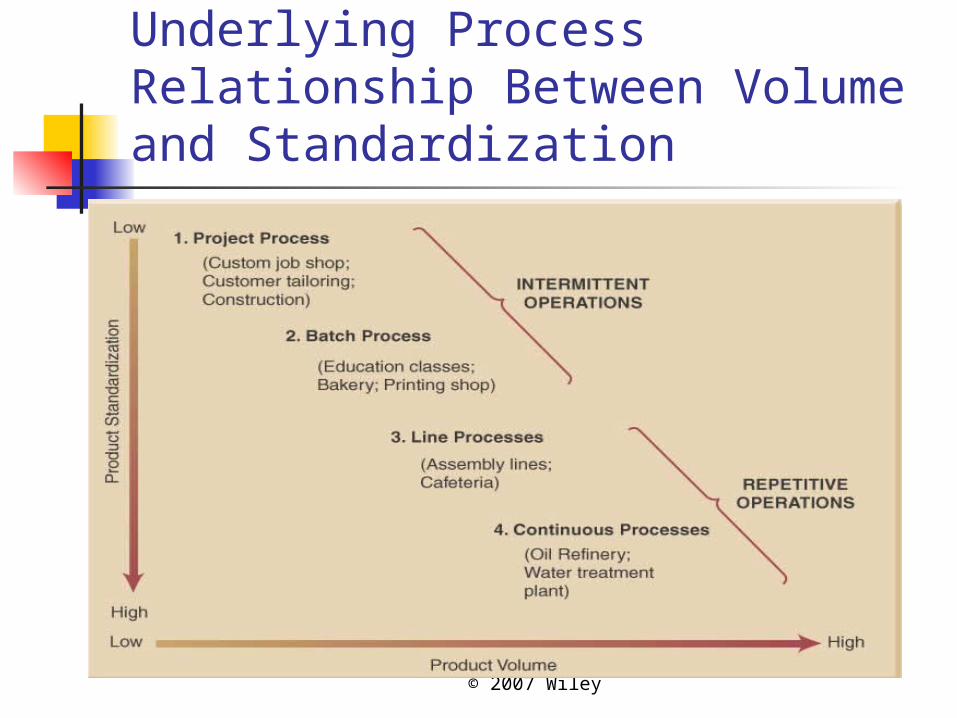
Underlying Process Relationship Between Volume and Standardization
© 2007 Wiley
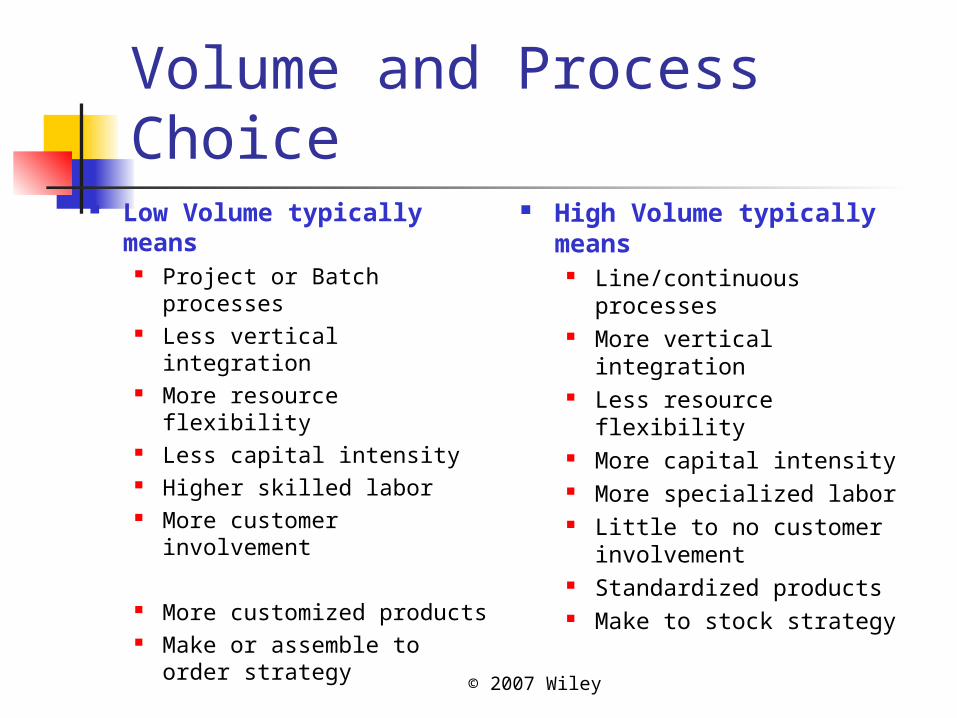
Volume and Process Choice
Low Volume typically means
Project or Batch processes Less vertical integration More resource flexibility Less capital intensity Higher skilled labor More customer
involvement
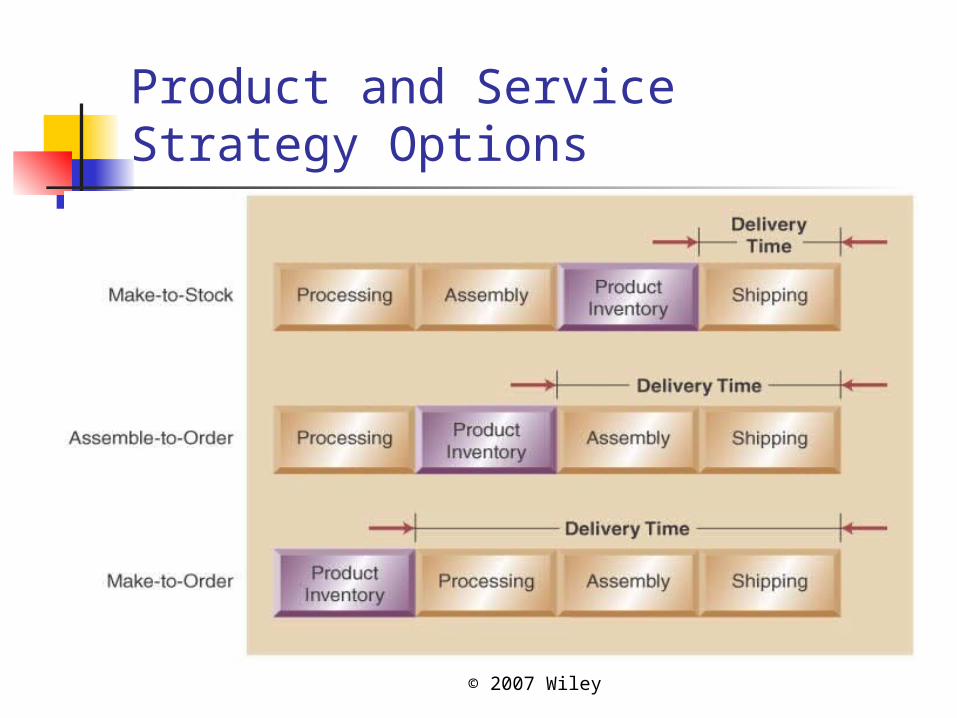
More customized products Make or assemble to order
strategy
High Volume typically means
Line/continuous processes
More vertical integration Less resource flexibility More capital intensity More specialized labor Little to no customer
involvement Standardized products Make to stock strategy
© 2007 Wiley
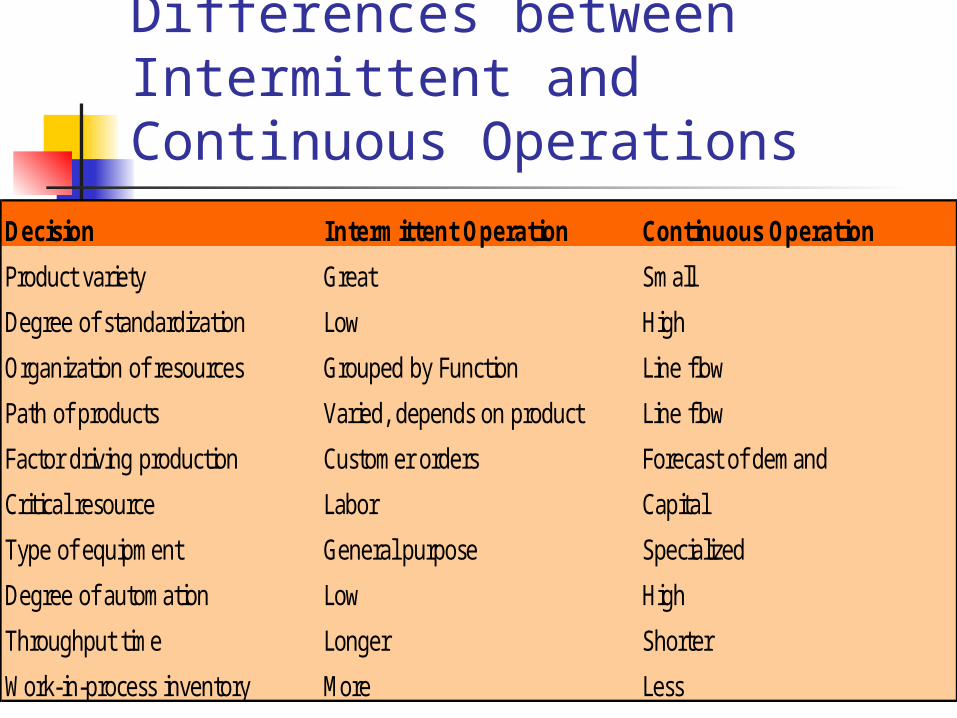
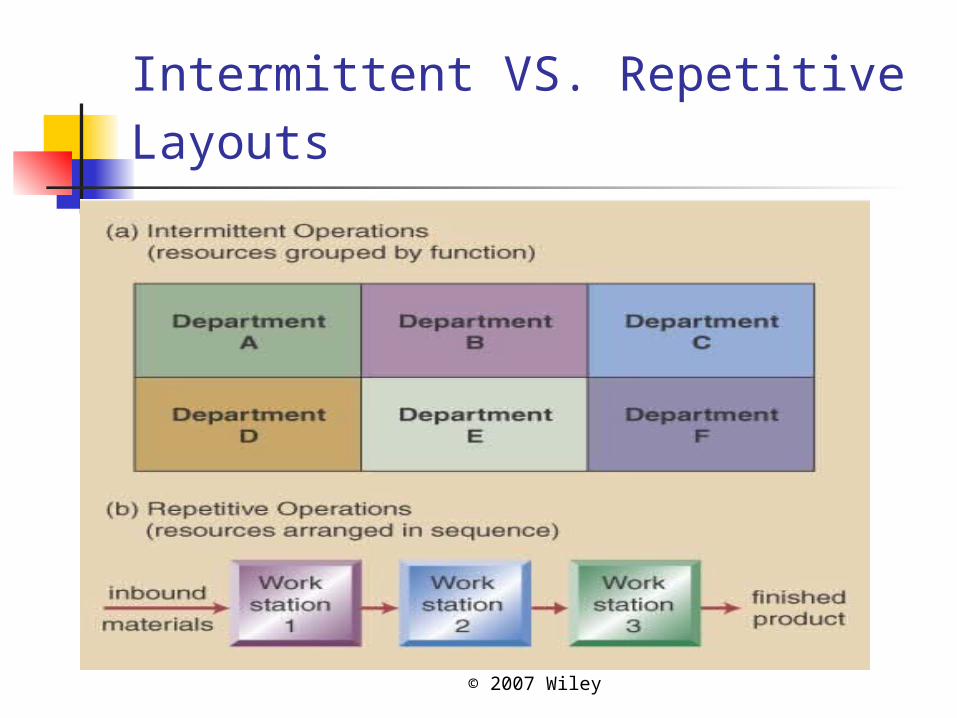
Differences between Intermittent and Continuous Operations
Decision Intermittent Operation Continuous Operation
Product variety Great Small
Degree of standardization Low High
Organization of resources Grouped by Function Line flow
Path of products Varied, depends on product Line flow
Factor driving production Customer orders Forecast of demand
Critical resource Labor Capital
Type of equipment General purpose Specialized
Degree of automation Low High
Throughput time Longer Shorter
Work-in-process inventory More Less
© 2007 Wiley
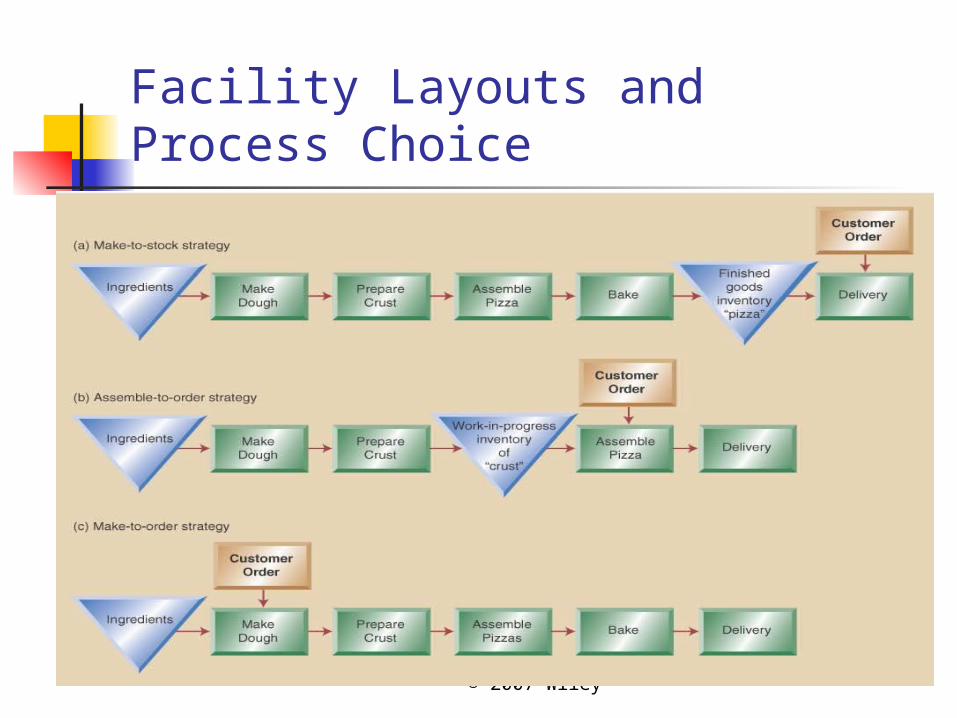
Facility Layouts and Process Choice
© 2007 Wiley
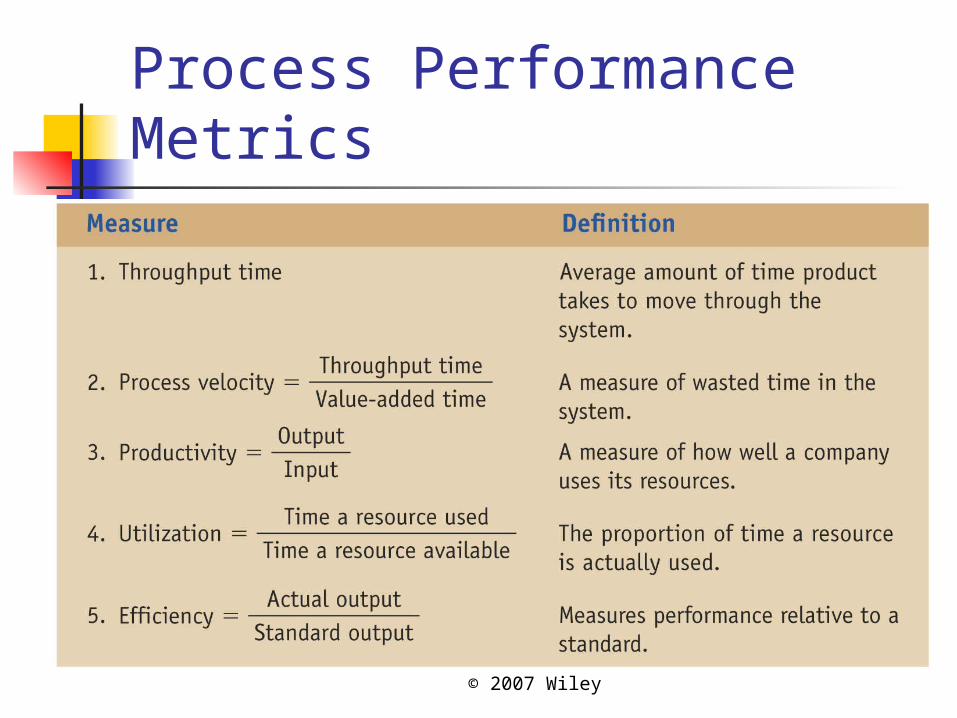
Process Performance Metrics
© 2007 Wiley
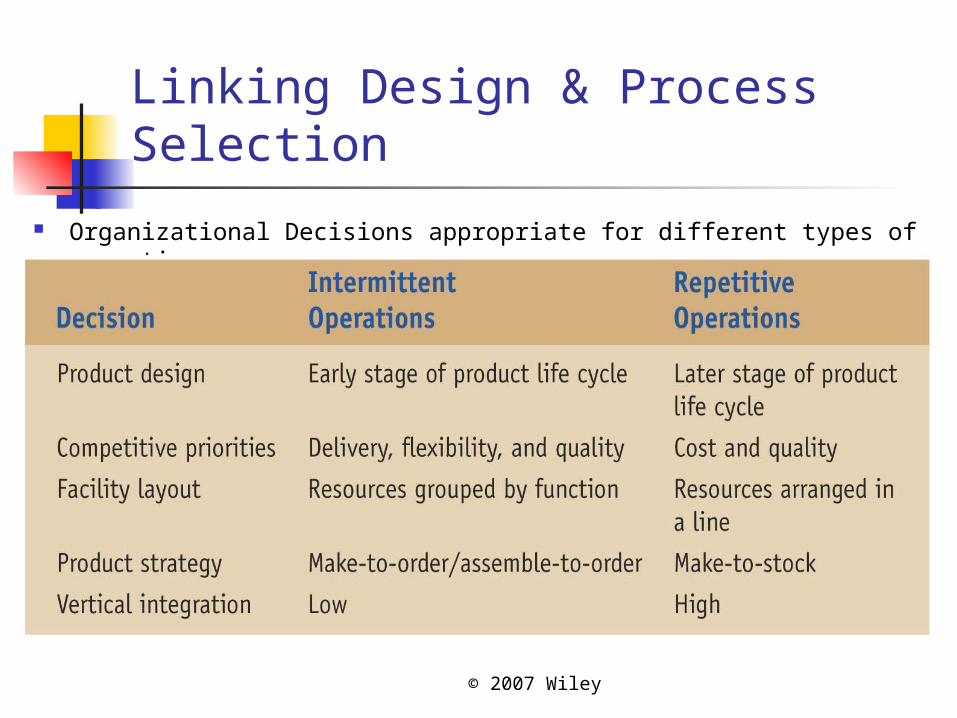
Linking Design & Process Selection
Organizational Decisions appropriate for different types of operations
© 2007 Wiley
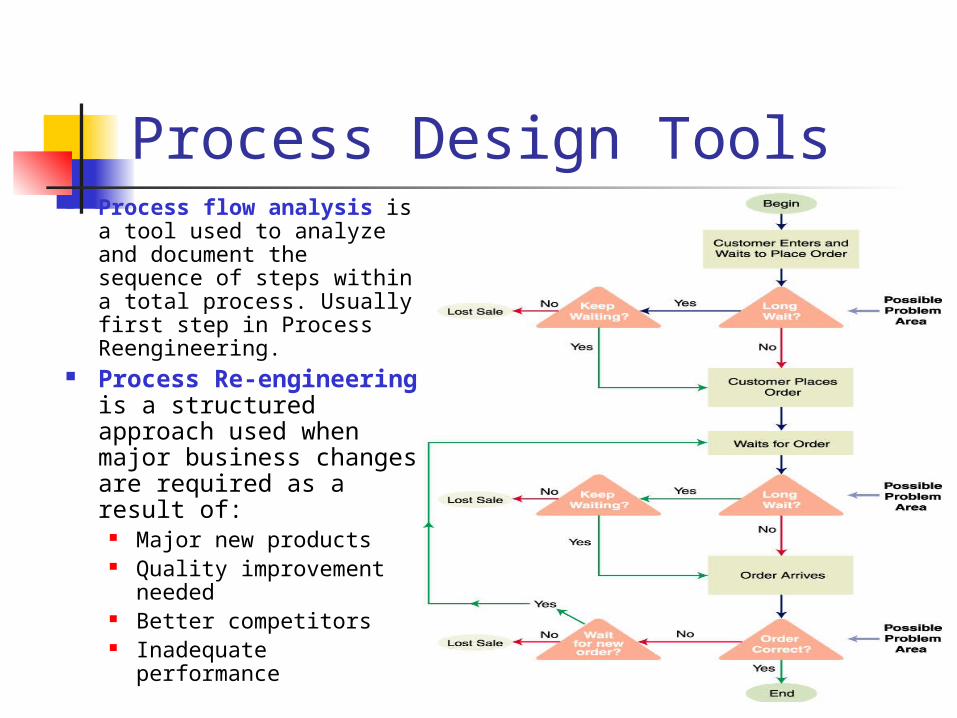
Process Design Tools Process flow analysis is
a tool used to analyze and document the sequence of steps within a total process. Usually first step in Process Reengineering.
Process Re-engineering is a structured approach used when major business changes are required as a result of:
Major new products Quality improvement
needed Better competitors Inadequate
performance
© 2007 Wiley
Intermittent VS. Repetitive Layouts
© 2007 Wiley
Product and Service Strategy Options
© 2007 Wiley
Process Decisions-Vertical Integration & Make or Buy
Vertical integration refers to the degree a firm chooses to do processes itself- raw material to sales
Backward Integration means moving closer to primary operations
Forward Integration means moving closer to customers
A firm’s Make-or-Buy choices should be based on the following considerations:
Strategic impact Available capacity Expertise Quality considerations Speed Cost (fixed cost + variable cost)make = (fixed cost + Variable
cost)buy Business are trending toward less backward integration,
more outsourcing

© 2007 Wiley
Manufacturing Technology Decisions
Simplify first then apply appropriate technology
Automation Automated Material Handling:
Automated guided vehicles (AGV) Automated storage & retrieval systems (AS/RS)
Computer-Aided Design (CAD) software Robotics & Numerically-Controlled (NC) equipment Flexible Manufacturing Systems (FMS) Computer-Integrated Manufacturing (CIM)
© 2007 Wiley
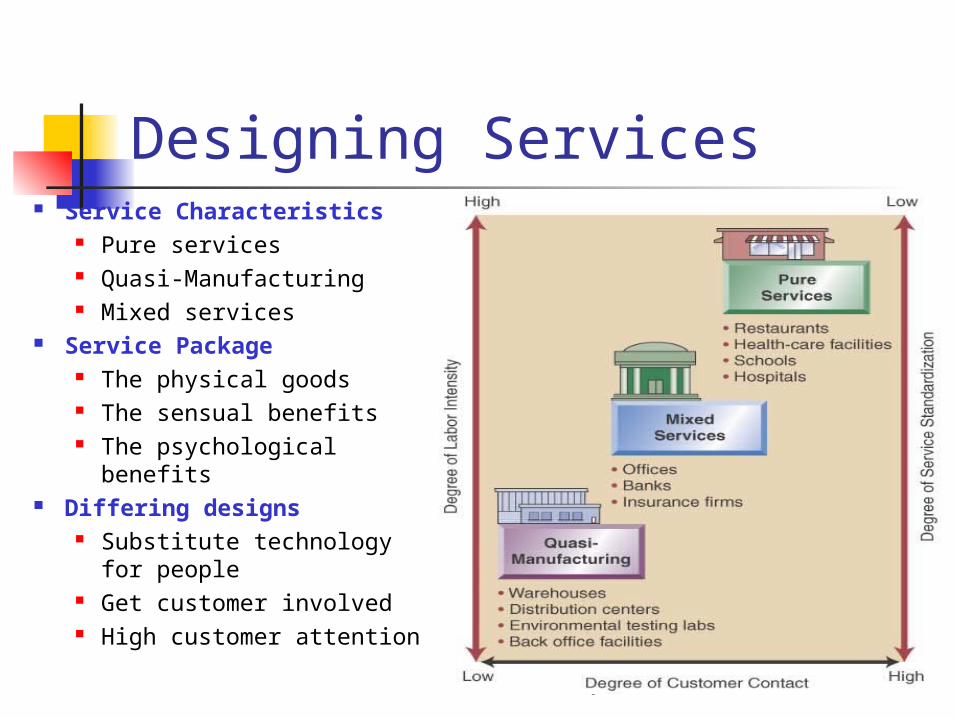
Designing Services Service Characteristics
Pure services Quasi-Manufacturing Mixed services
Service Package The physical goods The sensual benefits The psychological
benefits Differing designs
Substitute technology for people
Get customer involved High customer attention
© 2007 Wiley
Chapter 3 Highlights Product and process design must support business and
operation strategy Product steps include idea generation, product screening,
preliminary design and testing, and final design Break-even analysis is a tool used to screen processes Process designs range from project to batch to line to
continuous Product design and process selection decisions are linked Process flow charts can be a useful tool in process re-
design Product and process design can be significantly enhanced
by proper application of new technology Designing service processes produce intangible products
with more customer contact
© 2007 Wiley
Chapter 3 Homework Hints 4.a. Calculate break-even point.
b. Primarily decisions at the company’s plant(s).
8.a. Calculate/graph break-even point. b. Calculate profit given revenue and
cost data. c. Compare profits given sales estimate
differences based on the 2 prices. d. Primarily factors at the company’s
plant(s).
Related Documents


