© 2007 The Williams Companies, Inc. All rights reserved. Building Critical Energy Infrastructure… A Global Challenge Phil Wright, Williams Gas Pipeline 27 th USAEE/IAEE North American Conference September 17th, 2007

© 2007 The Williams Companies, Inc. All rights reserved. Building Critical Energy Infrastructure… A Global Challenge Phil Wright, Williams Gas Pipeline.
Dec 17, 2015
Welcome message from author
This document is posted to help you gain knowledge. Please leave a comment to let me know what you think about it! Share it to your friends and learn new things together.
Transcript
© 2007 The Williams Companies, Inc. All rights reserved.
Building Critical Energy Infrastructure… A Global ChallengePhil Wright, Williams Gas Pipeline27th USAEE/IAEE North American ConferenceSeptember 17th, 2007
© 2007 The Williams Companies, Inc. All rights reserved. 2
Oil
Coal
Gas
BiomassNuclear
Other renewables
0
2 000
4 000
6 000
8 000
10 000
12 000
14 000
16 000
18 000
1970 1980 1990 2000 2010 2020 2030
*Mto
e
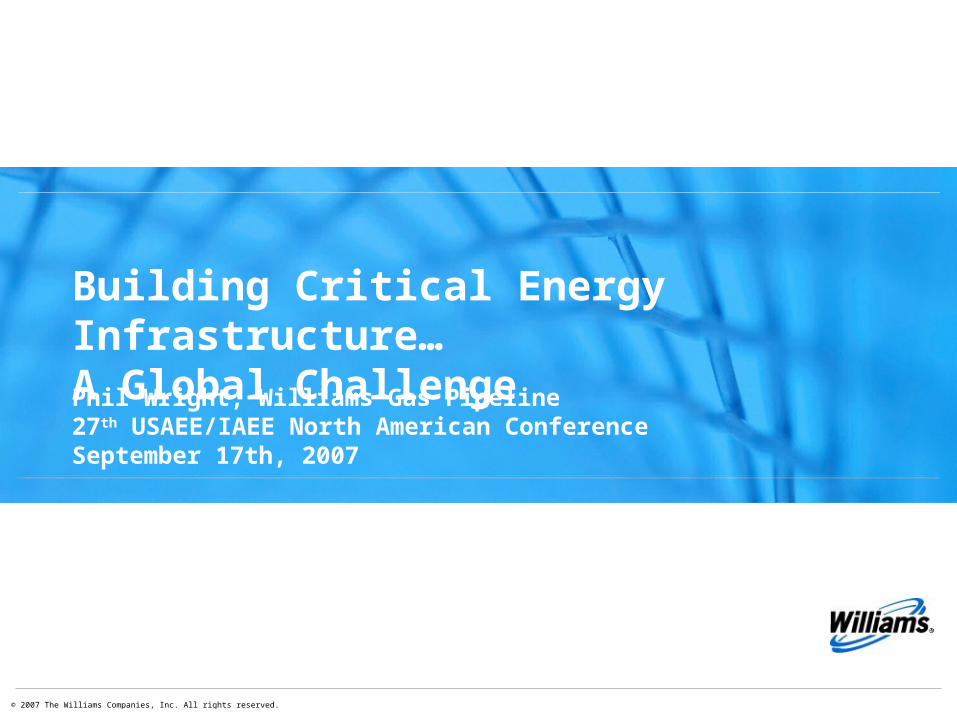
World Primary Energy Demand Forecast by IEA
Source: International Energy Agency (IEA) World Energy Outlook 2006*Million Tonnes of Oil Equivalent
© 2007 The Williams Companies, Inc. All rights reserved. 3
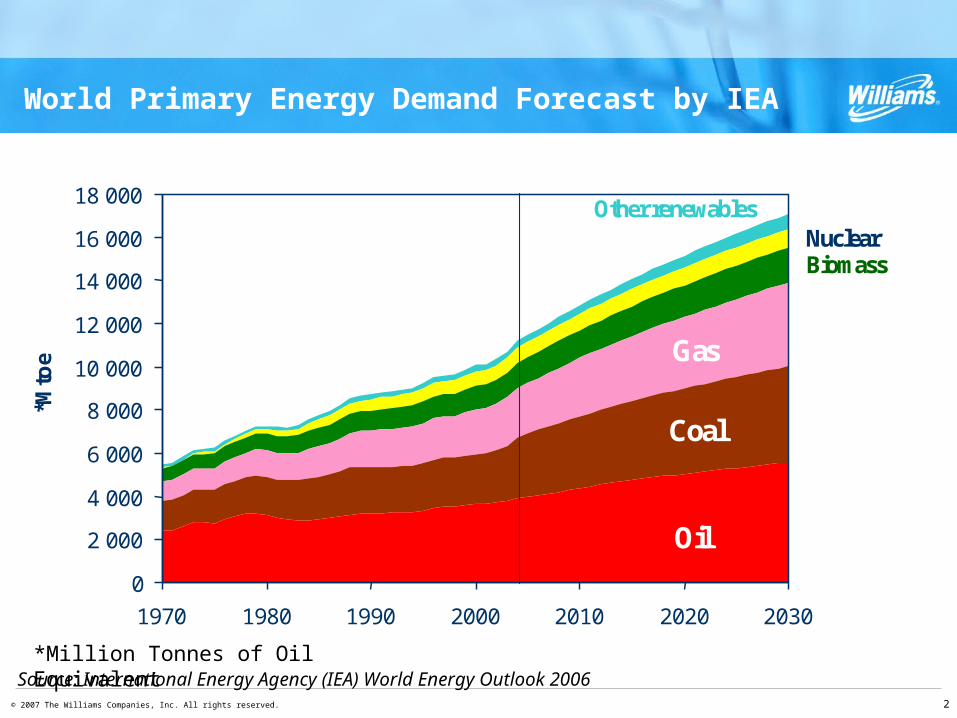
Total Energy Infrastructure Investment Needed from 2005-2030
Source: IEA World Energy Outlook 2006
© 2007 The Williams Companies, Inc. All rights reserved. 4
Natural Gas Infrastructure Needs
> Large amount of infrastructure work
> Large capital commitments for expansion as well as maintaining current infrastructure – and stable and fair regulatory climate to attract capital
> Increased demand for labor, materials and engineering services to put the infrastructure into place
> Land Use, Right of Way Access (ROW), and Regulatory affects
© 2007 The Williams Companies, Inc. All rights reserved. 5
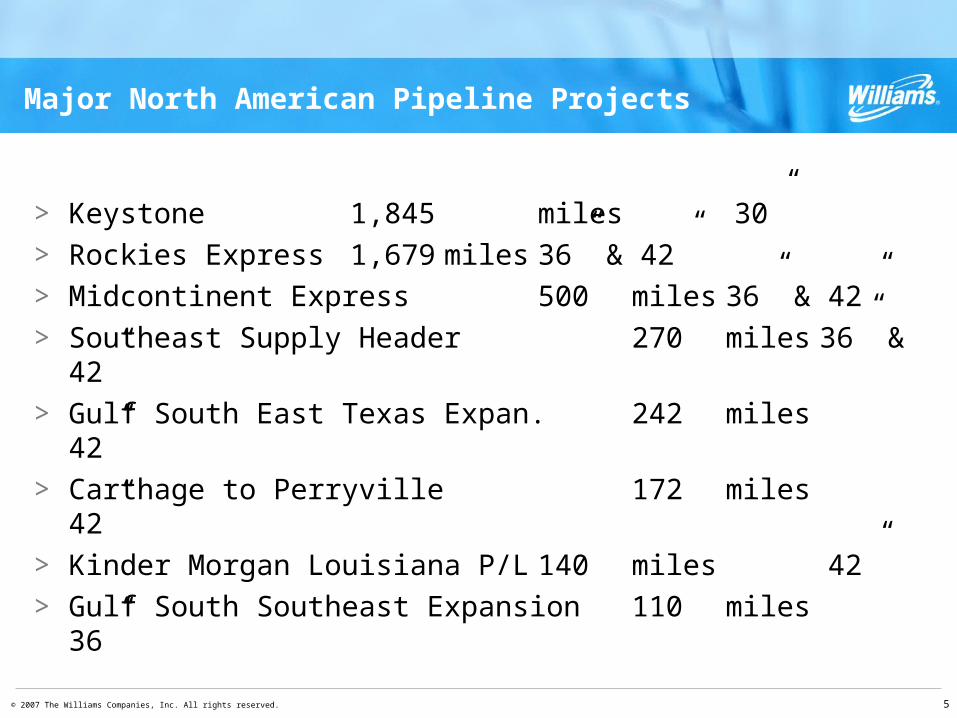
Major North American Pipeline Projects
> Keystone 1,845 miles 30”
> Rockies Express 1,679 miles 36” & 42”
> Midcontinent Express 500 miles 36” & 42”
> Southeast Supply Header 270 miles 36” & 42”
> Gulf South East Texas Expan. 242 miles 42”
> Carthage to Perryville 172 miles 42”
> Kinder Morgan Louisiana P/L 140 miles 42”
> Gulf South Southeast Expansion 110 miles 36”
© 2007 The Williams Companies, Inc. All rights reserved. 6
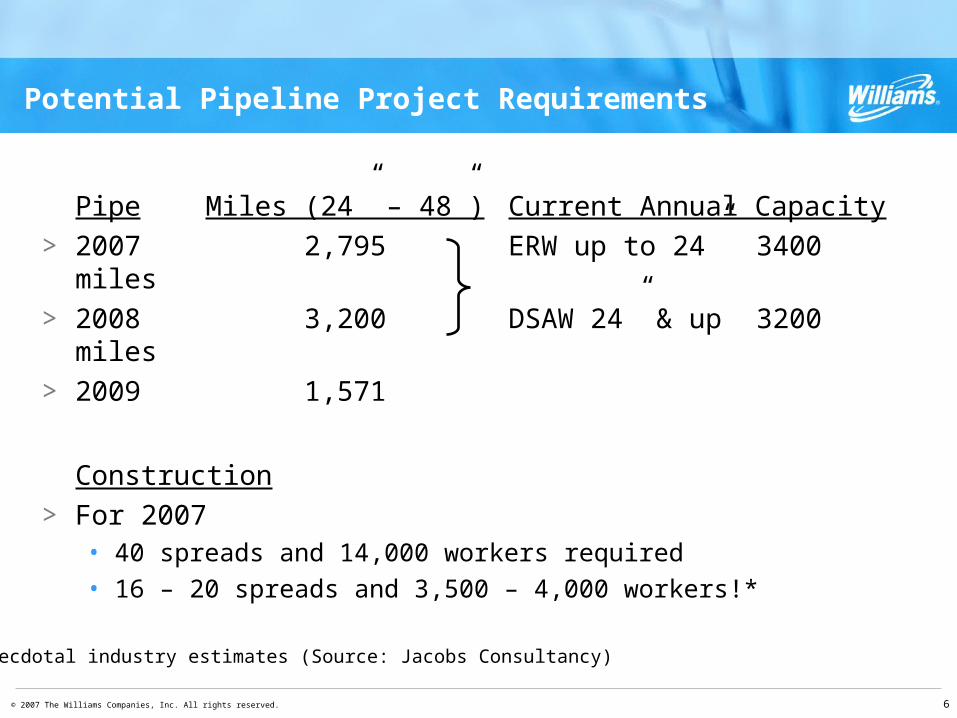
Potential Pipeline Project Requirements
Pipe Miles (24” – 48”) Current Annual Capacity
> 2007 2,795 ERW up to 24” 3400 miles
> 2008 3,200 DSAW 24” & up 3200 miles
> 2009 1,571
Construction
> For 2007 • 40 spreads and 14,000 workers required • 16 – 20 spreads and 3,500 – 4,000 workers!*
*Anecdotal industry estimates (Source: Jacobs Consultancy)
© 2007 The Williams Companies, Inc. All rights reserved. 7
Hurdles to Building Critical Infrastructure
> Costs have risen significantly in recent years for labor, materials and services
© 2007 The Williams Companies, Inc. All rights reserved. 8
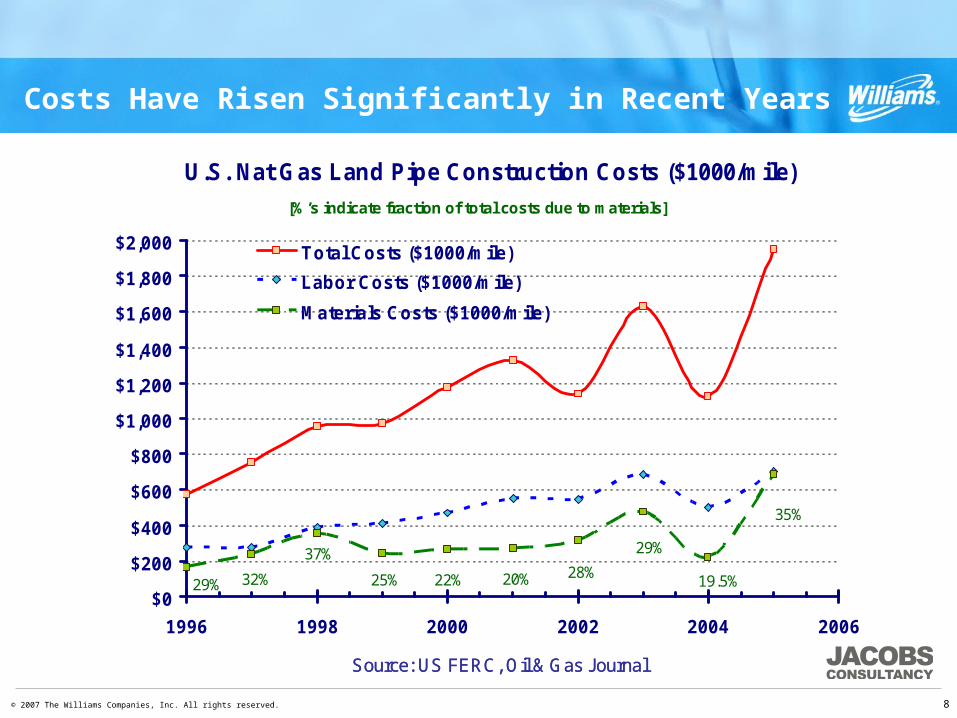
Costs Have Risen Significantly in Recent Years
U.S. Nat Gas Land Pipe Construction Costs ($1000/mile)
$0
$200
$400
$600
$800
$1,000
$1,200
$1,400
$1,600
$1,800
$2,000
1996 1998 2000 2002 2004 2006
Total Costs ($1000/mile)
Labor Costs ($1000/mile)
Materials Costs ($1000/mile)
37%
29% 25% 22% 20% 28%
29%
19.5%
35%
32%
[%’s indicate fraction of total costs due to materials]
Source: US FERC, Oil & Gas Journal
© 2007 The Williams Companies, Inc. All rights reserved. 9
Hurdles to Building Critical Infrastructure
> Costs have risen significantly in recent years for labor, materials and services
> Strain on qualified technical and construction talent
© 2007 The Williams Companies, Inc. All rights reserved. 10
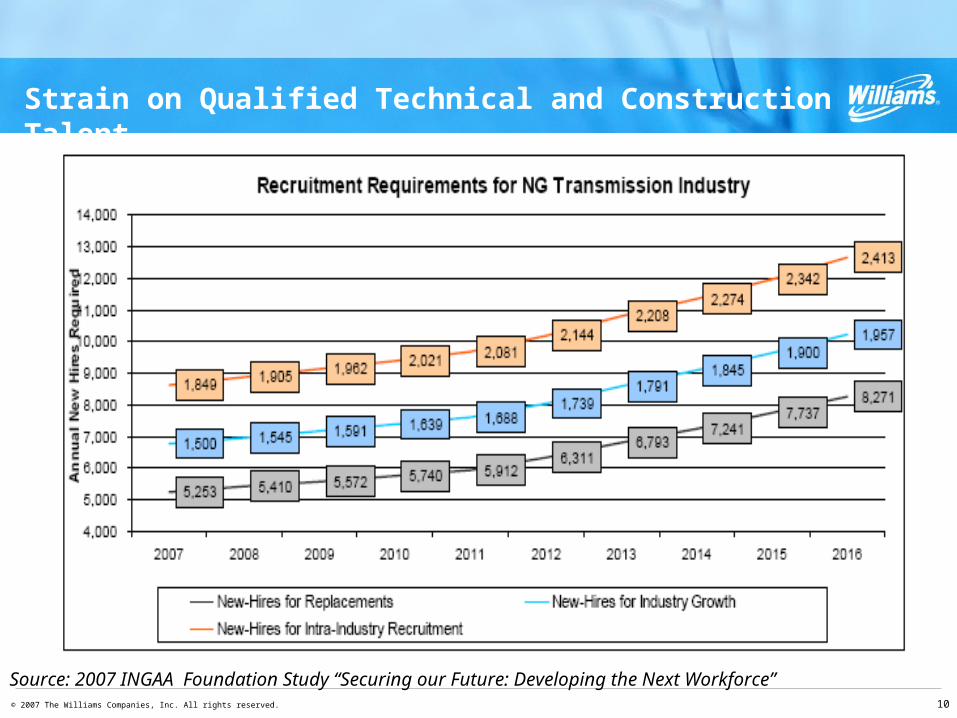
Strain on Qualified Technical and Construction Talent
Source: 2007 INGAA Foundation Study “Securing our Future: Developing the Next Workforce”
© 2007 The Williams Companies, Inc. All rights reserved. 11
Hurdles to Building Critical Infrastructure
> Costs have risen significantly in recent years for labor, materials and services
> Strain on qualified technical and construction talent
> Competition globally for materials and services
© 2007 The Williams Companies, Inc. All rights reserved. 12
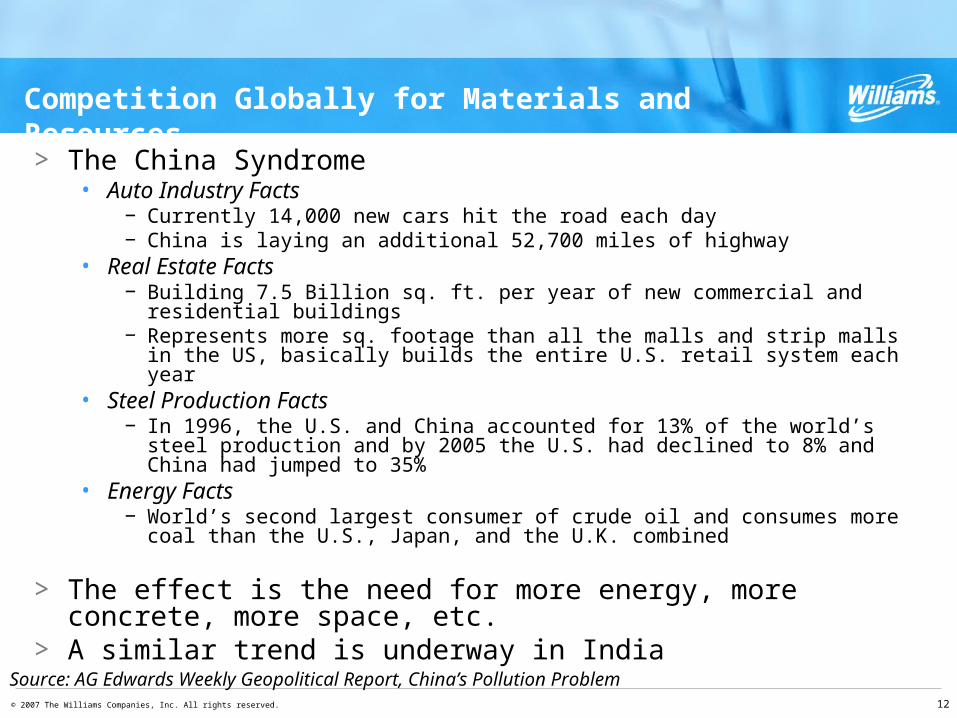
Competition Globally for Materials and Resources
> The China Syndrome• Auto Industry Facts
− Currently 14,000 new cars hit the road each day− China is laying an additional 52,700 miles of highway
• Real Estate Facts− Building 7.5 Billion sq. ft. per year of new commercial and residential buildings− Represents more sq. footage than all the malls and strip malls in the US, basically
builds the entire U.S. retail system each year• Steel Production Facts
− In 1996, the U.S. and China accounted for 13% of the world’s steel production and by 2005 the U.S. had declined to 8% and China had jumped to 35%
• Energy Facts− World’s second largest consumer of crude oil and consumes more coal than the
U.S., Japan, and the U.K. combined
> The effect is the need for more energy, more concrete, more space, etc.
> A similar trend is underway in India
Source: AG Edwards Weekly Geopolitical Report, China’s Pollution Problem
© 2007 The Williams Companies, Inc. All rights reserved. 13
Hurdles to Building Critical Infrastructure
> Costs have risen significantly in recent years for labor, materials and services
> Strain on qualified technical and construction talent
> Competition globally for materials and services
> Land use and ROW restrictions
© 2007 The Williams Companies, Inc. All rights reserved. 14
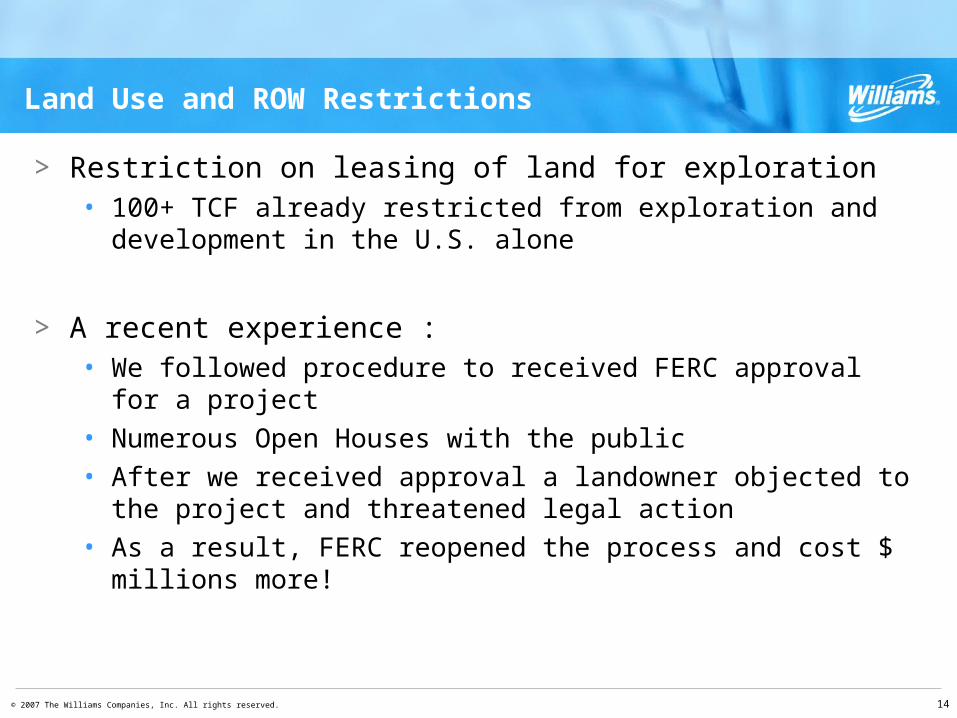
Land Use and ROW Restrictions
> Restriction on leasing of land for exploration • 100+ TCF already restricted from exploration and development in
the U.S. alone
> A recent experience :• We followed procedure to received FERC approval for a project• Numerous Open Houses with the public• After we received approval a landowner objected to the project and
threatened legal action• As a result, FERC reopened the process and cost $ millions more!
© 2007 The Williams Companies, Inc. All rights reserved. 15
We can lower these hurdles by…
> In the interim• Leverage global markets to supplement domestic resources ( e.g.
sunset of protective tariffs on pipe)• Encourage students not interested in four year colleges to pursue
technical school degrees / career path – joint industry / academic effort initiative
− IPAA and Houston Area High School Technology Program
• Open dialog between state and local governments and special interest groups regarding land and ROW access
• Engender sense of urgency
© 2007 The Williams Companies, Inc. All rights reserved. 16
We can lower these hurdles by…
> Long Term• Supporting efforts to encourage enrollment in engineering and
science at the university level and promoting our industry to future workforce
• Educating government that all out effort is essential for maintaining affordable energy
− Efficiency
− Renewables
− Clean coal technology
− And a lot of gas and oil
© 2007 The Williams Companies, Inc. All rights reserved. 17
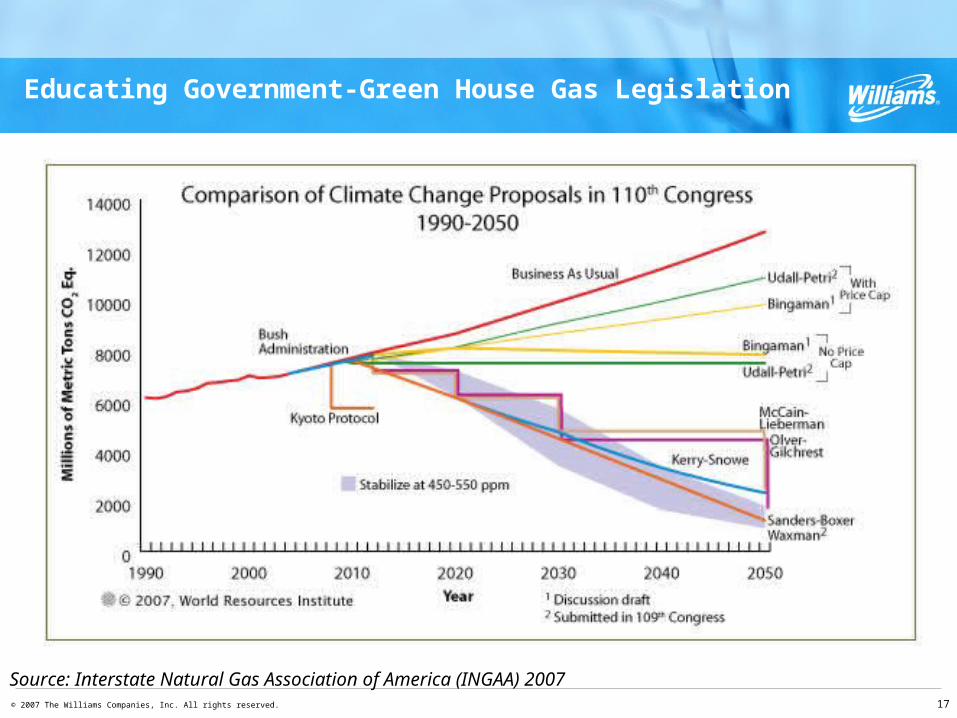
Educating Government-Green House Gas Legislation
Source: Interstate Natural Gas Association of America (INGAA) 2007
© 2007 The Williams Companies, Inc. All rights reserved. 18
Conclusions
> Projected demand growth for energy calls for $20 trillion cumulative global infrastructure investment through 2030
> Significant incremental talent required to execute the largest build out since post- WWII era expansion
> Excessive hurdles complicate building necessary infrastructure
> Overcoming these hurdles will require creativity and efficient resource management
Related Documents


![Walter Wright - Mitchell Williams · Walter Wright From: Kendra Akin Jones [kendra.jones©arkansasag.gov] Sent: Thursday, December 01, 2011 3:12 PM To: Walter Wright Subject: FW:](https://static.cupdf.com/doc/110x72/5b301fc77f8b9ac06e8dee02/walter-wright-mitchell-walter-wright-from-kendra-akin-jones-kendrajonesarkansasaggov.jpg)