© 2 0 0 3 b y T h e E d u c a t i o n T r u s t , I n c . Accountability Accountability System System Using Data to Drive Using Data to Drive School Counseling School Counseling Activities Activities Mark Kuranz Mark Kuranz , , [email protected] [email protected]

© 2003 by The Education Trust, Inc. Accountability System Using Data to Drive School Counseling Activities Mark Kuranz, [email protected].
Dec 23, 2015
Welcome message from author
This document is posted to help you gain knowledge. Please leave a comment to let me know what you think about it! Share it to your friends and learn new things together.
Transcript

© 2003 by T
he Education T
rust, Inc.
Accountability Accountability SystemSystem
Using Data to Drive School Using Data to Drive School Counseling ActivitiesCounseling Activities
Mark KuranzMark Kuranz, ,
[email protected]@wi.rr.com
© 2003 by T
he Education T
rust, Inc.
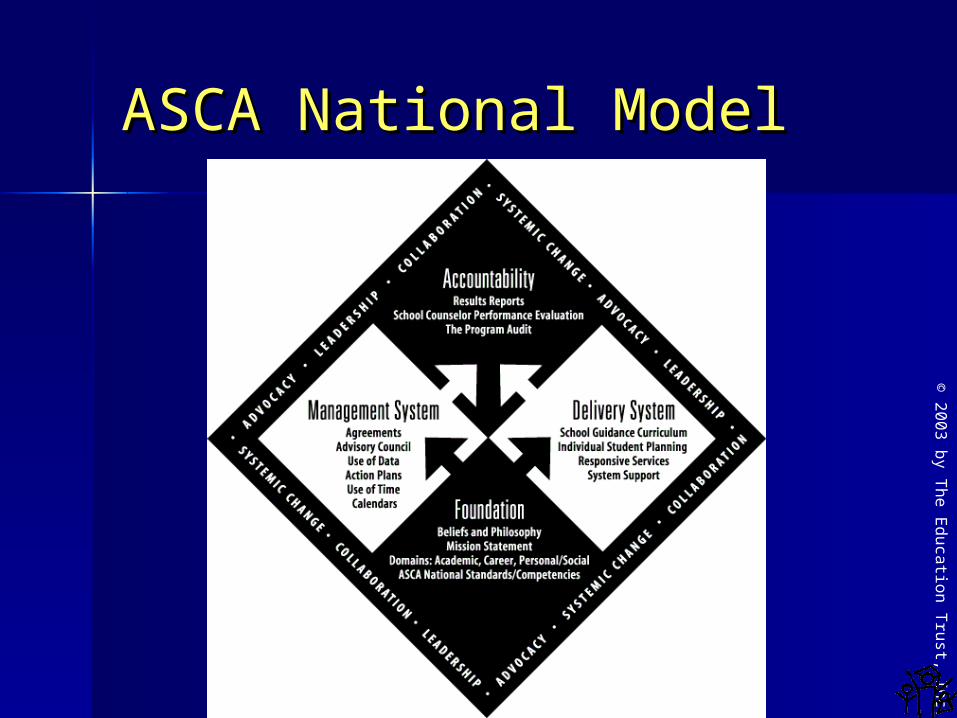
ASCA National ModelASCA National Model

© 2003 by T
he Education T
rust, Inc.
Accountability SystemAccountability System
Results Report – Results Report – – ProgramProgram– Guidance Curriculum Guidance Curriculum – Closing the Gap Closing the Gap – Impact Over TimeImpact Over Time
School Counselor Performance School Counselor Performance StandardsStandards
The Program AuditThe Program Audit
© 2003 by T
he Education T
rust, Inc.How are students different How are students different
as a RESULT of what you as a RESULT of what you do?do?
Results Report – Results Report – – ProgramProgram– Guidance Curriculum Guidance Curriculum – Closing the Gap Closing the Gap – Impact Over TimeImpact Over Time

© 2003 by T
he Education T
rust, Inc.
What Is Your What Is Your Relationship with Relationship with Education Data?Education Data?
Nonexistent?Nonexistent?
Reactive?Reactive?
Proactive?Proactive?

© 2003 by T
he Education T
rust, Inc.
The Power of DataThe Power of Data
Provide objective snapshots of the Provide objective snapshots of the students, school, communitystudents, school, community
Surface evidence of access or Surface evidence of access or equity issuesequity issues
Break old myths – eliminate denialBreak old myths – eliminate denial Create urgency/energy for changeCreate urgency/energy for change Provide direction – data driven Provide direction – data driven
decisionsdecisions

© 2003 by T
he Education T
rust, Inc.
The Power of DataThe Power of Data
Challenge existing behavior, Challenge existing behavior, funding patterns, programs, funding patterns, programs, & policies& policies
Use as an accountability toolUse as an accountability tool Focuses resources where they Focuses resources where they
are most needed are most needed Supports grant writing effortsSupports grant writing efforts

© 2003 by T
he Education T
rust, Inc.
Using Data to Spur Using Data to Spur Systemic ChangeSystemic Change
School Counselors must be proficient in: School Counselors must be proficient in: – Accessing data Accessing data – Analyzing data Analyzing data – Interpreting data Interpreting data – Presenting data Presenting data
School Counselors must use data to:School Counselors must use data to: - - Recognize barriers to learningRecognize barriers to learning– Point out the system inequitiesPoint out the system inequities– Advocate for system changeAdvocate for system change– Create urgency for change Create urgency for change

© 2003 by T
he Education T
rust, Inc.
How Not to Use DataHow Not to Use Data
To place blameTo place blame
To focus on the pastTo focus on the past
To maintain the status quoTo maintain the status quo

© 2003 by T
he Education T
rust, Inc.
What Data Should What Data Should You CollectYou Collect
Data has many gap closing and Data has many gap closing and diagnostic uses and can be diagnostic uses and can be
categorized differentlycategorized differently

© 2003 by T
he Education T
rust, Inc.
Demographic DataDemographic DataWhat do you want to What do you want to
know?know?Student demographics: what are the
characteristics of our students? GenderGender EthnicityEthnicity Socio-economic status Socio-economic status
(free/reduced lunch)(free/reduced lunch) Limited English ProficiencyLimited English Proficiency Family configurationFamily configuration MobilityMobility

© 2003 by T
he Education T
rust, Inc.
Rhode Island Shifts in Rhode Island Shifts in Student DemographicsStudent Demographics
77.2 75.4 73.4
7.5 7.7 8.1
1 1 1
13.1 14.8
43.23.2
11.5
0%
10%
20%
30%
40%
50%
60%
70%
80%
90%
100%
1997 1999 2001
Hispanic
American Indian,non-Hispanic
Asian and PacificI slander, non-HispanicBlack, non-Hispanic
White, non-Hispanic
Source: US Census Bureau, Population Projections, in Education Week, September 27, 2000.

© 2003 by T
he Education T
rust, Inc.
Portland PS Portland PS Demographics TodayDemographics Today
60
17
10
11
2
0%
10%
20%
30%
40%
50%
60%
70%
80%
90%
100%
2003
American Indian
Asian and PacificI slander
Hispanic
Black
White

© 2003 by T
he Education T
rust, Inc.
0
5
10
15
20
25
3096-9
7
00-0
1
03-0
4% Free Lunch
Student DemographicsStudent Demographics
Pike High SchoolIndianapolis, IN

© 2003 by T
he Education T
rust, Inc.
Attainment DataAttainment DataWhat do you want to What do you want to
know?know?Attainment: How many make it to - and
beyond key points in the system? Advance to next grade Transition from middle school to high
school Graduation rate Type of high school diploma Matriculation to an institution of
higher education Persistence beyond freshman year Earning a college diploma

© 2003 by T
he Education T
rust, Inc.Highest Educational Highest Educational Attainment Attainment for Every 100 for Every 100 KindergartnersKindergartners African
Americans Asians Latinos Whites
Graduate from High School
87
90
63
93
Complete at Least Some College
50
74
32
65
Obtain at Least a Bachelor’s Degree
18
51
11
33
Source: US Department of Commerce, Bureau of the Census. March Current Population Survey, 1971-2001, In The Condition of Education 2002
(Age 25-29)

© 2003 by T
he Education T
rust, Inc.
Get Local GraduatesGet Local Graduates
Public K-12Public K-12 Enrollment Enrollment GraduatesGraduates
African AmericanAfrican American 8.1%8.1% 6.3%6.3%AsianAsian 3.2% 3.2% 3.2% 3.2%
HispanicHispanic 14.8%14.8% 8.9%8.9%Native AmericanNative American 1.0%1.0% .4%.4%WhiteWhite 73.4%73.4% 81.1%81.1%
Totals Totals 158,046 158,046 8,603 8,603
2001-02 NCES Data

© 2003 by T
he Education T
rust, Inc.
J EFFERSON COUNTY SCHOOLS 2001 2002
ATHERTON HIGH 29.75% 15.45%BALLARD HIGH 13.47% 9.09%CENTRAL HIGH 32.26% 8.73%DOSS HIGH 21.85% 20.56%EASTERN HIGH 18.16% 8.67%FAIRDALE HIGH 24.54% 12.57%FERN CREEK TRADITIONAL HIGH 26.61% 31.18%IROQUOIS HIGH 49.28% 38.99%J EFFERSONTOWN HIGH 36.09% 21.34%MOORE TRADITIONAL HIGH 36.97% 35.51%PLEASURE RIDGE PARK HIGH 26.04% 21.16%SENECA HIGH 20.20% 11.67%SHAWNEE HIGH 34.68% 25.33%SOUTH PARK TAPP 67.74% 41.18%SOUTHERN HIGH 22.66% 20.29%WAGGENER TRADITIONAL HIGH 36.20% 29.58%WESTERN HIGH 43.10% 22.31%
Ninth Grade Retention Rate Reduction as a Result of School Counselor Interventions

© 2003 by T
he Education T
rust, Inc.
0
10
20
30
40
50
60
70Ath
ert
on
Ballard
Centr
al
Doss
East
ern
Fair
dale
Fern
Iroquois
Jeff
Moore
Ple
asu
re
Seneca
Shaw
nee
S. Park
South
ern
Waggener
West
ern
20012002
Ninth Grade Retention Rate Reduction as a Result of School Counselor Interventions

© 2003 by T
he Education T
rust, Inc.
Achievement DataAchievement DataWhat do you want to What do you want to
know?know?Achievement: What does achievement look like at
different levels and with different groups of students?
Overall AchievementOverall Achievement– Grade point averageGrade point average– Standardized test scores, SAT, ACT, State Standardized test scores, SAT, ACT, State
teststests– Passing all subjectsPassing all subjects
Periodic assessmentPeriodic assessment– Semester gradesSemester grades– End of course testsEnd of course tests
Ongoing classroom assessmentOngoing classroom assessment– Class assignment gradesClass assignment grades– TestsTests

© 2003 by T
he Education T
rust, Inc.
Achievement-Related Achievement-Related DataData
Course enrollment patternsCourse enrollment patterns Discipline referralsDiscipline referrals Suspension ratesSuspension rates Alcohol, tobacco and other drug Alcohol, tobacco and other drug
violationsviolations Attendance ratesAttendance rates Parent involvementParent involvement Extracurricular activitiesExtracurricular activities

© 2003 by T
he Education T
rust, Inc.
MPS Grade 9 ReadingMPS Grade 9 Reading
MBST Grade 9 Passing Reading
020406080
Henry
Edison
North
Roose
velt
South
South
west
Was
hbur
n
Broad
way
MBST Grade 9Passing Reading
© 2003 by T
he Education T
rust, Inc.
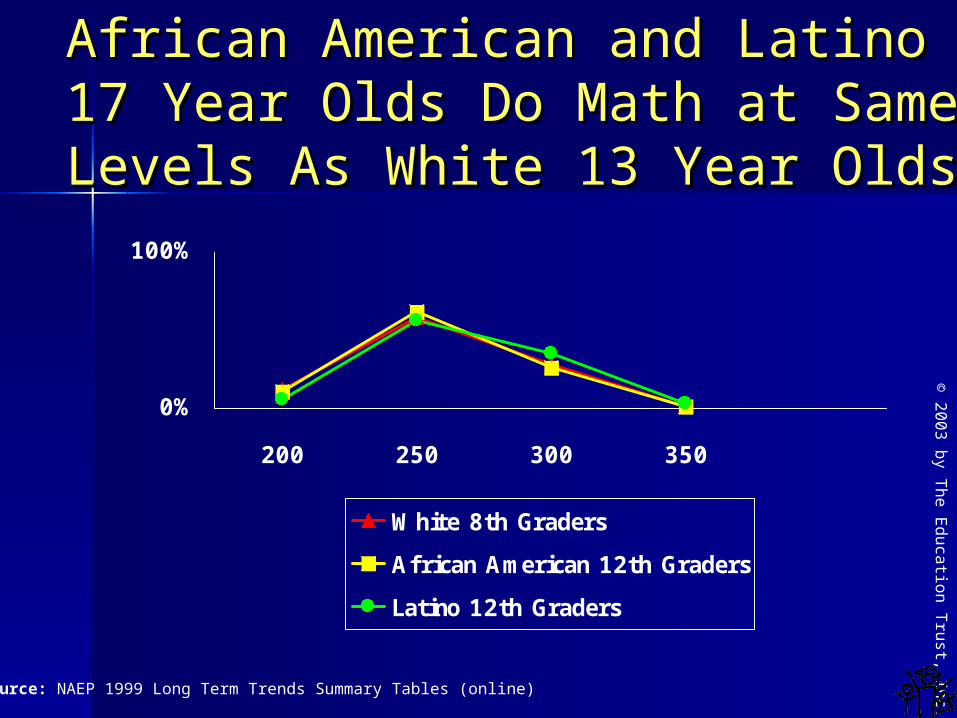
African American and Latino African American and Latino 17 Year Olds Do Math at Same 17 Year Olds Do Math at Same Levels As White 13 Year OldsLevels As White 13 Year Olds
0%
100%
200 250 300 350
White 8th Graders
African American 12th Graders
Latino 12th Graders
Source: NAEP 1999 Long Term Trends Summary Tables (online)

© 2003 by T
he Education T
rust, Inc.
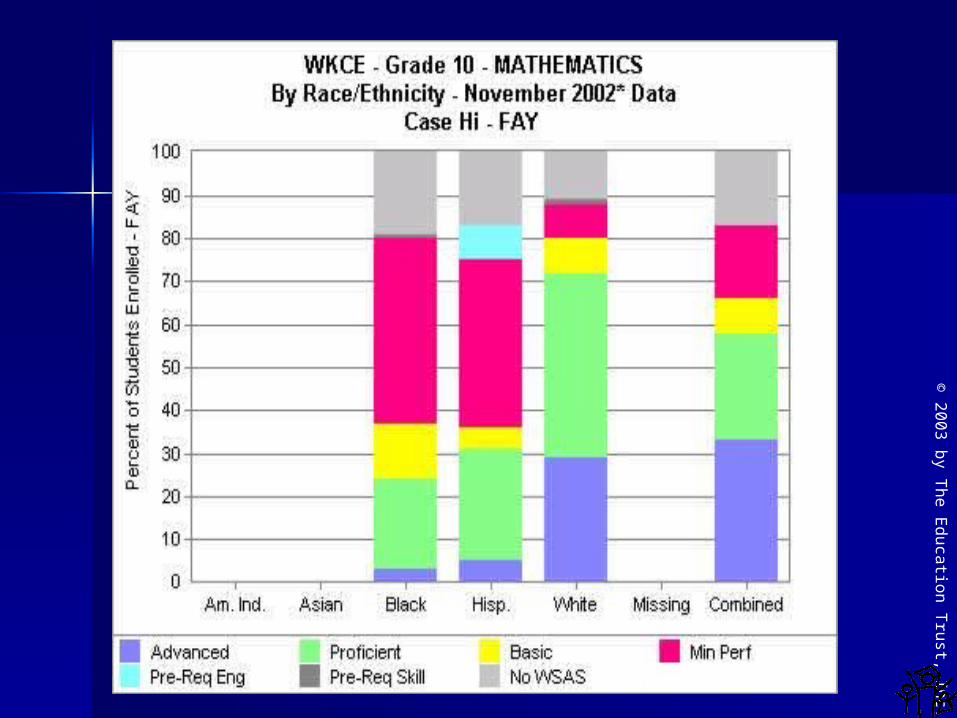
State DataState Data
Black eight-graders and white Black eight-graders and white fourth-graders had almost fourth-graders had almost identical scores in math on a identical scores in math on a national standardized test in national standardized test in 2003.2003.
Milwaukee Journal Sentinel, May 23, 2004Milwaukee Journal Sentinel, May 23, 2004

© 2003 by T
he Education T
rust, Inc.
Student Behavior DataStudent Behavior DataWhat do you want to What do you want to
know?know?Student Behavior Choices: What are
students doing? Attendance Discipline referrals Classroom behavior Homework completion Enrollment patterns
– Algebra in 9th grade– Upper level math and science– Honors, AP, college credit

© 2003 by T
he Education T
rust, Inc.
Low-Income Students are Less Low-Income Students are Less Likely to be Enrolled in a College Likely to be Enrolled in a College
Prep. TrackPrep. Track
28.3
48.8
65.1
20
90
Socio-Economic Status
Per
cen
t E
nro
lled
Low Medium High
Source: US Department of Education, National Center for Education Statistics. National Education Longitudinal Study of 1988: Second Follow-Up, 1992 in: A Profile of the American High School Senior in 1992. (p. 36) Washington, DC: US Department of Education, June 1995.

© 2003 by T
he Education T
rust, Inc.
Even Low Achieving Even Low Achieving Students Go On To Students Go On To PostsecondaryPostsecondary
Eighth Grade Achievement Level
% Entering Postsecondary*
Low 58%
Middle 75%
High 93%
Overall 76%
Source: USDOE, NCES. Coming of Age in the 1990s: The Eighth-Grade Class of 1988 12 Years Later, NCES 2002-321. Washington, DC:2002.
* Postsecondary includes any college, university, vocational, or technical education entered by 2000.

© 2003 by T
he Education T
rust, Inc.
Opportunity Gaps: Are some students Are some students provided more opportunities than provided more opportunities than others?others?
Access to rigorous curriculum Access to quality teachers School policies and climate Special Education Screening
and Placement Participation in Support Services
– Tutoring, Mentoring
Opportunity Gap DataOpportunity Gap DataWhat do you want to What do you want to
know?know?

© 2003 by T
he Education T
rust, Inc.
Equity?Equity?

© 2003 by T
he Education T
rust, Inc.
Program Evaluation Data Program Evaluation Data What do you want to What do you want to
know?know? Process dataProcess dataPerception dataPerception dataResults dataResults data

© 2003 by T
he Education T
rust, Inc.
Process dataProcess data What do you want to What do you want to
know?know? ““What you did for whom”What you did for whom” Evidence that event occurredEvidence that event occurred How activity was conductedHow activity was conducted Did the program follow the Did the program follow the
prescribed practice? prescribed practice?

© 2003 by T
he Education T
rust, Inc.
Process Data - ExamplesProcess Data - Examples
Weekly (32) academic support groups Weekly (32) academic support groups with 12 students each were held with 12 students each were held
586 9586 9thth grade students received the grade students received the “The Four Year Plan” guidance “The Four Year Plan” guidance lessonslessons
All 4All 4thth and 5 and 5th th (112) grade students (112) grade students participated in the “bus buddy” (4) participated in the “bus buddy” (4) guidance lessonsguidance lessons

© 2003 by T
he Education T
rust, Inc.
Adding Process DataAdding Process Data
ActivityActivity Process Process DataData
Perception DataPerception Data Results DataResults Data
Question or Question or DemonstrationDemonstration
PrePre PostPostHow will How will student student behavior behavior change?change?
PrePre PostPost
DDaattee
## %%
DDaattee
## %%
DDaattee
## %%
DDaattee
## %%

© 2003 by T
he Education T
rust, Inc.
Perception DataPerception Data What do you want to What do you want to
know?know? ““What others think, know or What others think, know or demonstrate” data.demonstrate” data.
Measures competency achieved, Measures competency achieved, knowledge gained or attitudes beliefs of knowledge gained or attitudes beliefs of students students – Pre-postPre-post– Competency achievementCompetency achievement– SurveysSurveys– EvaluationsEvaluations
Measures what students are perceived to Measures what students are perceived to have gained in knowledgehave gained in knowledge
© 2003 by T
he Education T
rust, Inc.
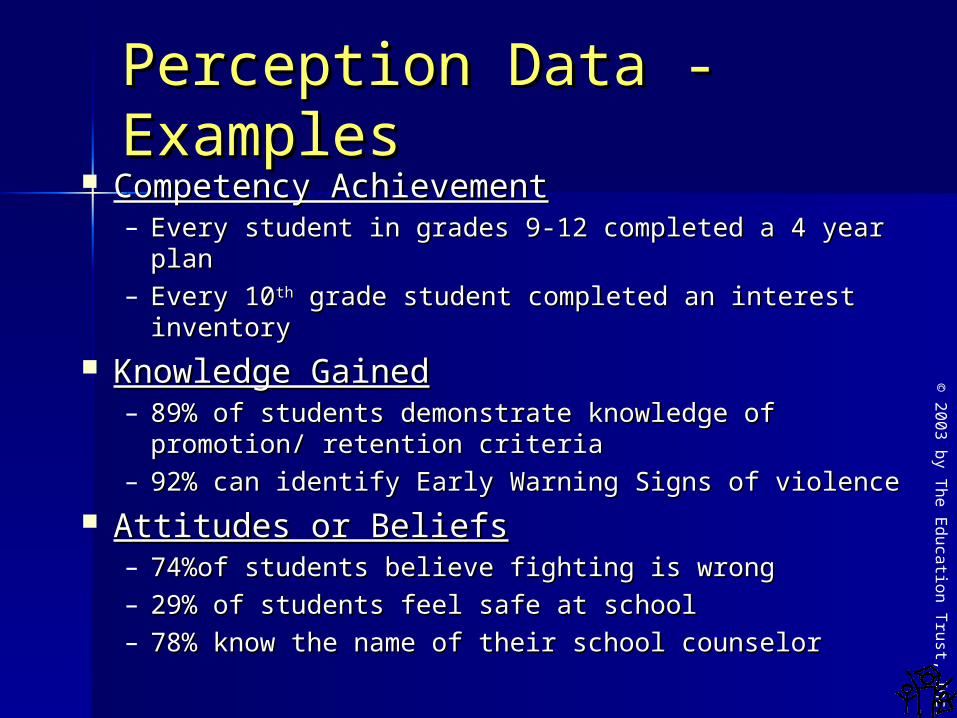
Perception Data - Perception Data - ExamplesExamples
Competency AchievementCompetency Achievement– Every student in grades 9-12 completed a 4 year plan Every student in grades 9-12 completed a 4 year plan – Every 10Every 10thth grade student completed an interest grade student completed an interest
inventoryinventory
Knowledge GainedKnowledge Gained– 89% of students demonstrate knowledge of 89% of students demonstrate knowledge of
promotion/ retention criteriapromotion/ retention criteria– 92% can identify Early Warning Signs of violence92% can identify Early Warning Signs of violence
Attitudes or BeliefsAttitudes or Beliefs– 74%of students believe fighting is wrong74%of students believe fighting is wrong– 29% of students feel safe at school29% of students feel safe at school– 78% know the name of their school counselor78% know the name of their school counselor
© 2003 by T
he Education T
rust, Inc.
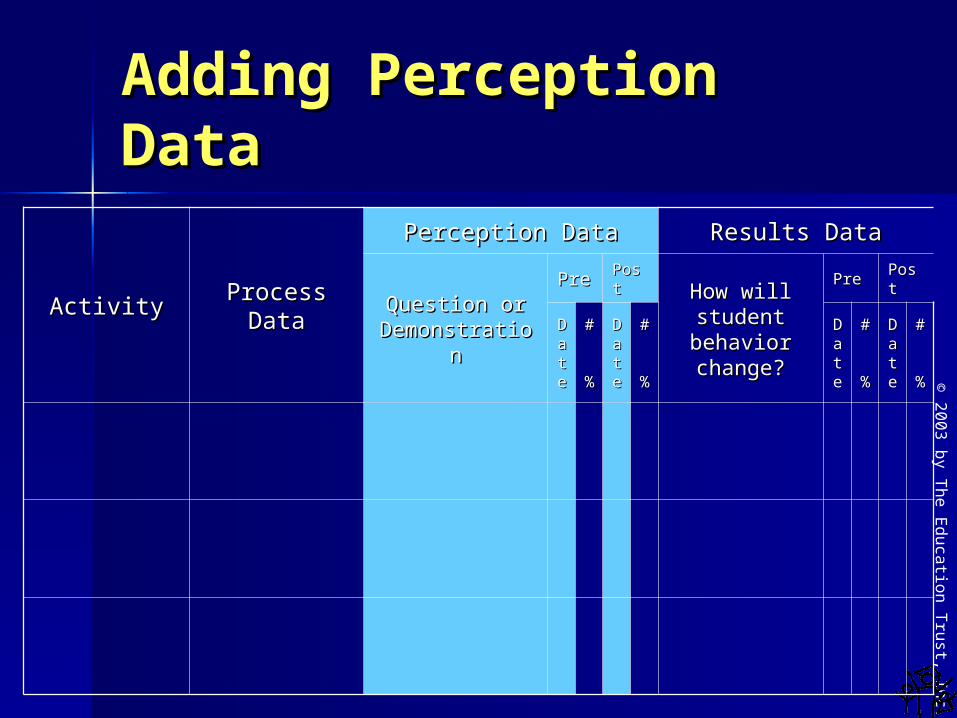
Adding Perception Adding Perception DataData
ActivityActivity Process Process DataData
Perception DataPerception Data Results DataResults Data
Question or Question or DemonstrationDemonstration
PrePre PostPostHow will How will student student behavior behavior change?change?
PrePre PostPost
DDaattee
## %%
DDaattee
## %%
DDaattee
## %%
DDaattee
## %%

© 2003 by T
he Education T
rust, Inc.
Results DataResults Data What do you want to What do you want to
know?know? ““So WHAT” dataSo WHAT” data Hard dataHard data Application dataApplication data Proof your program has (or has not) Proof your program has (or has not)
positively impacted students ability to positively impacted students ability to utilizeutilize the knowledge, attitudes and the knowledge, attitudes and skills to effect behaviorskills to effect behavior– AttendanceAttendance– BehaviorBehavior– Academic achievementAcademic achievement

© 2003 by T
he Education T
rust, Inc.
Results Data - ExamplesResults Data - Examples
42 students avoided retention42 students avoided retention
Graduation rates improved 14% Graduation rates improved 14% over three yearsover three years
Attendance improved among 9Attendance improved among 9thth grade males by 49%grade males by 49%

© 2003 by T
he Education T
rust, Inc.
Adding Results DataAdding Results Data
ActivityActivity Process Process DataData
Perception DataPerception Data Results DataResults Data
Question or Question or DemonstrationDemonstration
PrePre PostPostHow will How will student student behavior behavior change?change?
PrePre PostPost
DDaattee
## %%
DDaattee
## %%
DDaattee
## %%
DDaattee
## %%
© 2003 by T
he Education T
rust, Inc.
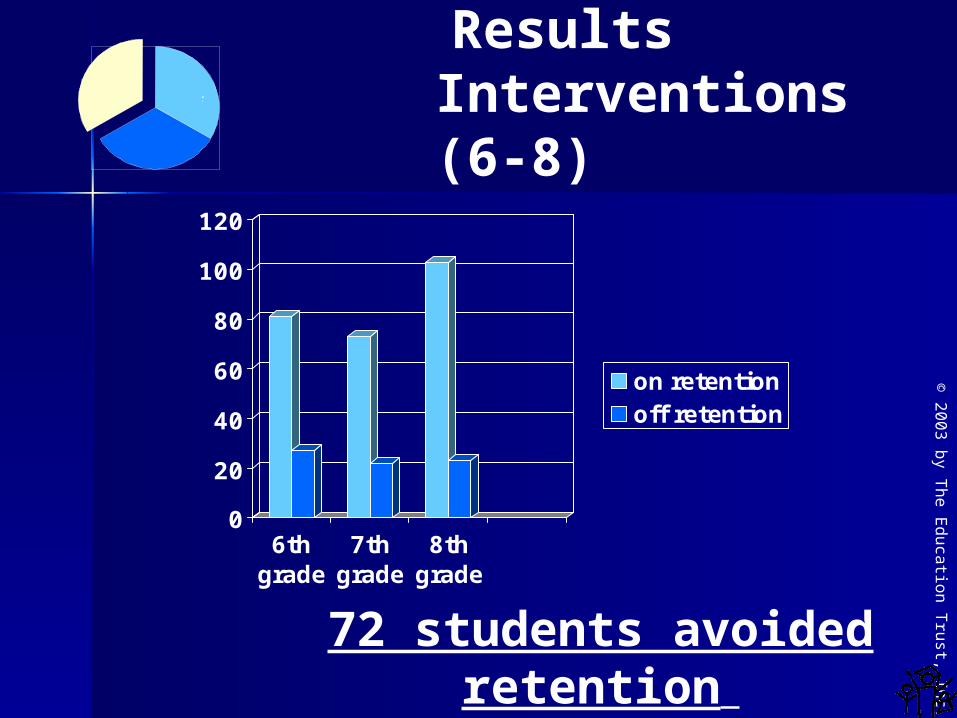
Academic Results Interventions (6-8)
72 students avoided retention
ACADEMICCareer
Personal/ Social
0
20
40
60
80
100
120
6thgrade
7thgrade
8thgrade
on retentionoff retention

© 2003 by T
he Education T
rust, Inc.
Possibilities…Possibilities…
There are schools that show things can be different? Find schools like yours that have:
Closed the opportunity gaps Closed the achievement gap
© 2003 by T
he Education T
rust, Inc.
ResourcesResources
American School Counselor American School Counselor Association – Association – www.schoolcounselor.orgwww.schoolcounselor.org
Education Trust web Site -Education Trust web Site -www.edtrust.orgwww.edtrust.org
State Department of EducationState Department of Education Local School DistrictsLocal School Districts No Excuses - No Excuses - Heritage Foundation Heritage Foundation
www.noexcuses.org www.noexcuses.org National Center for Educational National Center for Educational
Statistics – nces.ed.govStatistics – nces.ed.gov
© 2003 by T
he Education T
rust, Inc.
Learn to Analyze Learn to Analyze and Interpret Dataand Interpret Data

© 2003 by T
he Education T
rust, Inc.
Data Analysis: Data Analysis: Keep It SimpleKeep It Simple
Descriptive DataDescriptive Data PowerfulPowerful Numbers and percentagesNumbers and percentages
Rationale for UseRationale for Use The benchmark is ALL The benchmark is ALL Usually working with entire populationUsually working with entire population Easier for educators and public to Easier for educators and public to
understandunderstand

© 2003 by T
he Education T
rust, Inc.
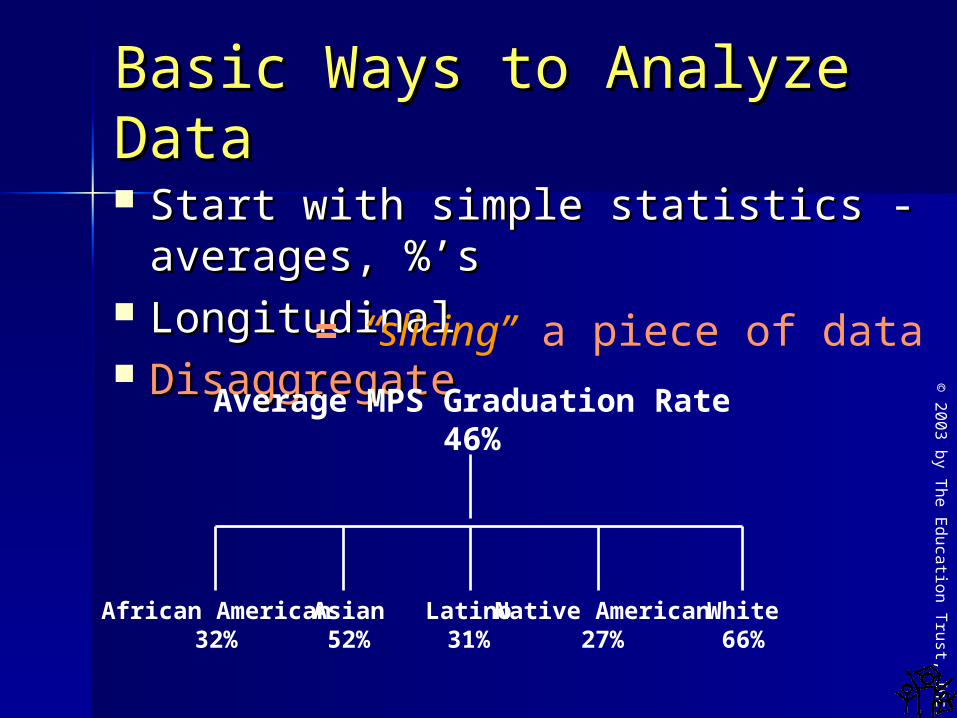
Basic Ways to Analyze Basic Ways to Analyze DataData
Start with simple statistics - averages, Start with simple statistics - averages, %’s%’s
0102030405060708090
100
02-03
MathEng/ LA
Spencer Owen School Corporation ISTEP Tests

© 2003 by T
he Education T
rust, Inc.
Basic Ways to Analyze Basic Ways to Analyze DataData
0%10%20%30%40%50%60%70%
Nat
ive
Am
eric
an
Bla
ck
Asi
anH
ispan
ic
White
StudentStaff

© 2003 by T
he Education T
rust, Inc.
Data Over Time Data Over Time What do you want to What do you want to
know?know?
ImmediateImmediate IntermediateIntermediateLong range Long range (Impact Over (Impact Over
Time) Time)

© 2003 by T
he Education T
rust, Inc.
Data Over Time - Data Over Time - ExamplesExamples
ImmediateImmediate – data measures – data measures the immediate impactthe immediate impact - pre-post test, p.70-71- pre-post test, p.70-71
IntermediateIntermediate – data collected – data collected over a short period of timeover a short period of time - improved grades after - improved grades after counseling group, p. 72-73counseling group, p. 72-73
Long-rangeLong-range – Longitudinal – Longitudinal
- data “stretch over time”, p.73- data “stretch over time”, p.73

© 2003 by T
he Education T
rust, Inc.
Basic Ways to Analyze Basic Ways to Analyze DataData
Start with simple statistics - averages, Start with simple statistics - averages, %’s%’s
LongitudinalLongitudinal= “stretching” data out over time
0102030405060708090
100
98-99 99-00 00-01 01-02 02-03
MathEnglish
Spencer Owen School Corporation ISTEP Tests

© 2003 by T
he Education T
rust, Inc.
Bus Buddy Program Bus Buddy Program ResultsResults
0102030405060708090
100
97-98 98-99 99-00 00-01 01-02 02-03
Bus Referrals

© 2003 by T
he Education T
rust, Inc.
Basic Ways to Analyze Basic Ways to Analyze DataData Start with simple statistics - averages, Start with simple statistics - averages,
%’s%’s Longitudinal Longitudinal DisaggregateDisaggregate
= “slicing” a piece of dataThe Power of Disaggregated DataThe Power of Disaggregated Data
Disaggregation is not a problem-solving strategy. It is a
problem-finding strategy--Victoria Bernhardt
© 2003 by T
he Education T
rust, Inc.
Basic Ways to Analyze Basic Ways to Analyze DataData Start with simple statistics - averages, Start with simple statistics - averages,
%’s%’s Longitudinal Longitudinal DisaggregateDisaggregateAverage MPS Graduation Rate
46%
African American32%
Asian52%
Latino31%
Native American27%
White66%
= “slicing” a piece of data

© 2003 by T
he Education T
rust, Inc.
Basic Ways to Analyze Basic Ways to Analyze DataData DisaggregateDisaggregate
0%
10%
20%
30%
40%
50%
60%
70%
Native Am
erican
Asian
Hispan
ic
Afric
an A
mer
ican
Whi
te
GraduationRate
© 2003 by T
he Education T
rust, Inc.

© 2003 by T
he Education T
rust, Inc.
Examples of Data to Examples of Data to ExamineExamineTest Scores
AchievementStateNational
Enrollment Honors/AP Classes College Track Special Education LEP
Graduation Rate By Gender By Ethnicity By SES
Attendance Absences Tardies By Grade Level
Discipline By Classroom Types of Problems Gender
GPA/Class Rank By Gender By Ethnicity By SES
Retention Rates By Subject Area By Grade Level By Gender, Ethnicity Post Secondary Plans
Special Education By Gender By Ethnicity By SES
Dropout Rate Grade Levels Gender, Ethnicity… Reasons Why

© 2003 by T
he Education T
rust, Inc.
Data InterpretationData InterpretationLook for:Look for:
Pictures Patterns GapsPictures Patterns Gaps
Questions:Questions: What problems or needs What problems or needs
surface?surface? What achievement gaps exist?What achievement gaps exist? What opportunity gaps do the What opportunity gaps do the
data suggest?data suggest?

© 2003 by T
he Education T
rust, Inc.
Uncovering the Uncovering the Opportunity GapsOpportunity Gaps Access to challenging coursesAccess to challenging courses Access to support servicesAccess to support services Access to resourcesAccess to resources Percentage of high quality Percentage of high quality
teachers in schoolteachers in school Distribution of teacher talentDistribution of teacher talent

© 2003 by T
he Education T
rust, Inc.
Percentage of High Scoring Students Placed in Algebra in One Southern California School District
51%
16%
100%83%
42%
11%
88%
50%
0%
100%
Top Quartile CTBS Second Quartile CTBS
African American Asian Latino White
Source: The Achievement Council, Inc. Los Angeles, CA. Unpublished. 1991

© 2003 by T
he Education T
rust, Inc.
Equity?Equity?
© 2003 by T
he Education T
rust, Inc.
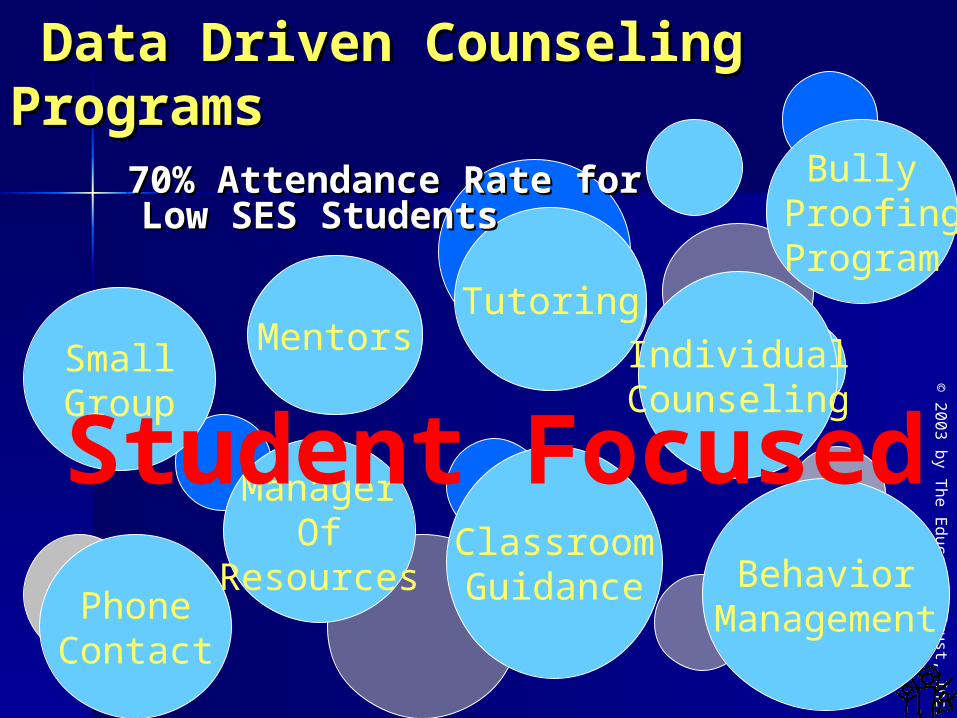
Mentors
PhoneContact
ManagerOf
Resources
SmallGroup
ClassroomGuidance Behavior
Management
Bully ProofingProgram
Tutoring
70% Attendance Rate for 70% Attendance Rate for Low SES StudentsLow SES Students
Data Driven Counseling Data Driven Counseling ProgramsPrograms
IndividualCounseling
Student Focused
© 2003 by T
he Education T
rust, Inc.
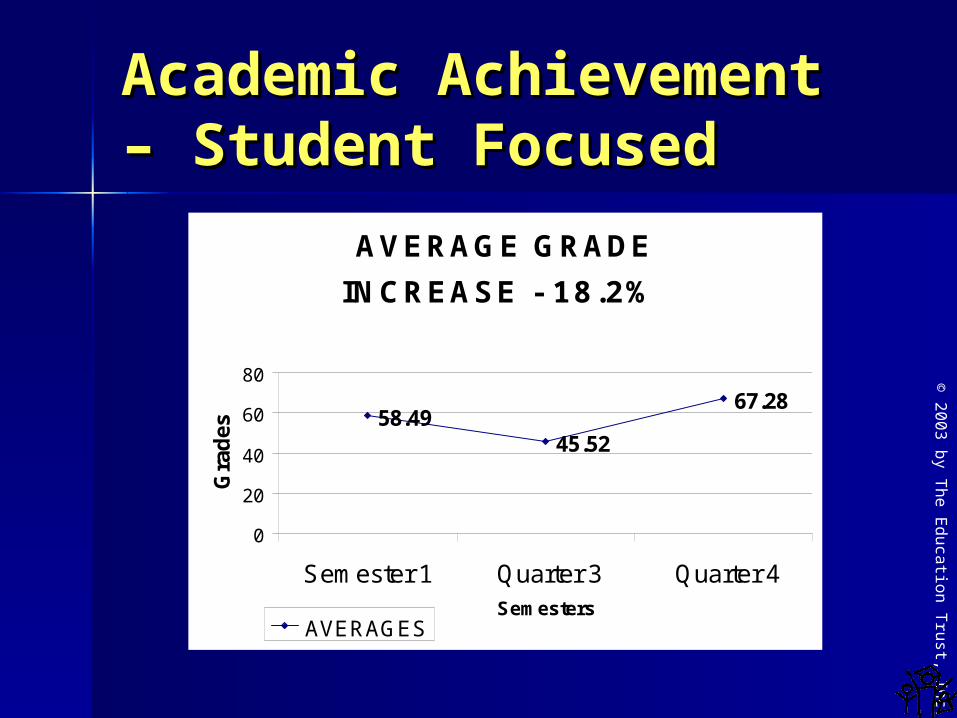
Academic Achievement Academic Achievement – Student Focused– Student Focused
AVERAGE GRADE
INCREASE - 18.2%
58.4945.52
67.28
0
20
40
60
80
Semester 1 Quarter 3 Quarter 4Semesters
Gra
des
AVERAGES
© 2003 by T
he Education T
rust, Inc.
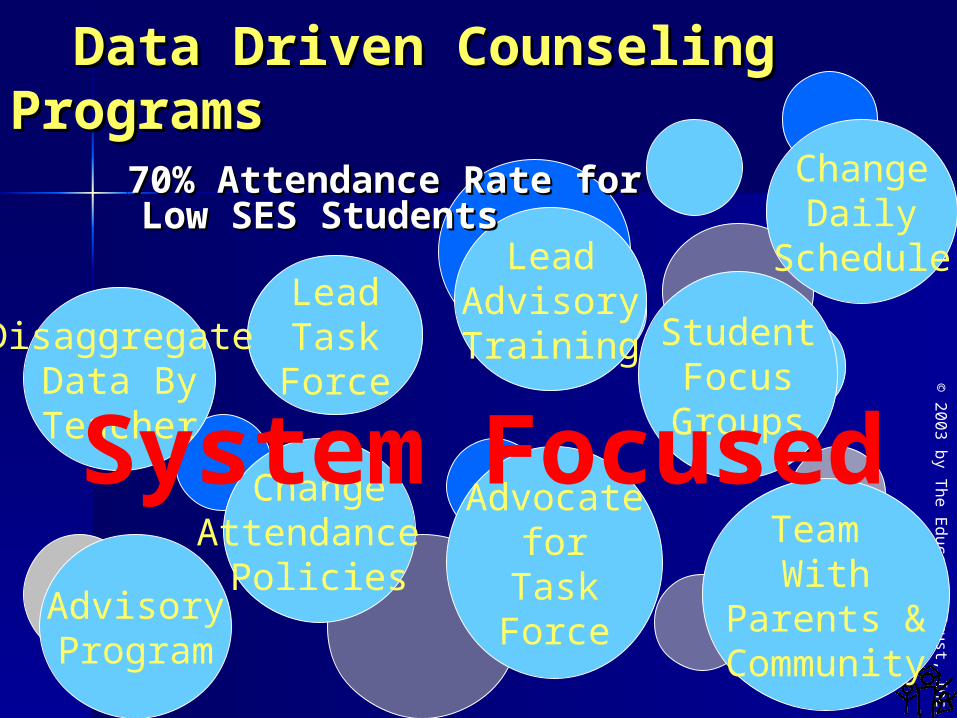
LeadTaskForce
AdvisoryProgram
ChangeAttendance
Policies
DisaggregateData ByTeacher
Advocatefor
TaskForce
Team With
Parents &Community
ChangeDaily
ScheduleLeadAdvisoryTraining
70% Attendance Rate for 70% Attendance Rate for Low SES StudentsLow SES Students
Data Driven Counseling Data Driven Counseling ProgramsPrograms
StudentFocus
GroupsSystem Focused

© 2003 by T
he Education T
rust, Inc.
Highlights of Highlights of AchievementAchievement
Student to counselor ratio at Student to counselor ratio at CLEAR schools was reduced from CLEAR schools was reduced from 641/1 to 354/1. 641/1 to 354/1.
The Protective Schools model was The Protective Schools model was implemented at all eight schools.implemented at all eight schools.
CCBG program was implemented in CCBG program was implemented in every school every school

© 2003 by T
he Education T
rust, Inc.
Longitudinal StudyLongitudinal Study
QuestionsQuestions
1) Will the use of the Protective School’s Model 1) Will the use of the Protective School’s Model have any impact on academic progress and have any impact on academic progress and attendance for the participating students?attendance for the participating students?
2) Will lowering the student to counselor ratio 2) Will lowering the student to counselor ratio and fully implementing the CCBG program have and fully implementing the CCBG program have an an
increase on academic progress and attendance increase on academic progress and attendance for the students? for the students?

© 2003 by T
he Education T
rust, Inc.
Reading
4445464748495051525354
2000-01 2001-02 2002-03
districtproject students
2000-01 – 3rd grade, 2001-02 – 4th grade, 2002-03 – 5th grade
© 2003 by T
he Education T
rust, Inc.
40
42
44
46
48
50
52
54
56
2000-01 2001-02 2002-03
districtproject students
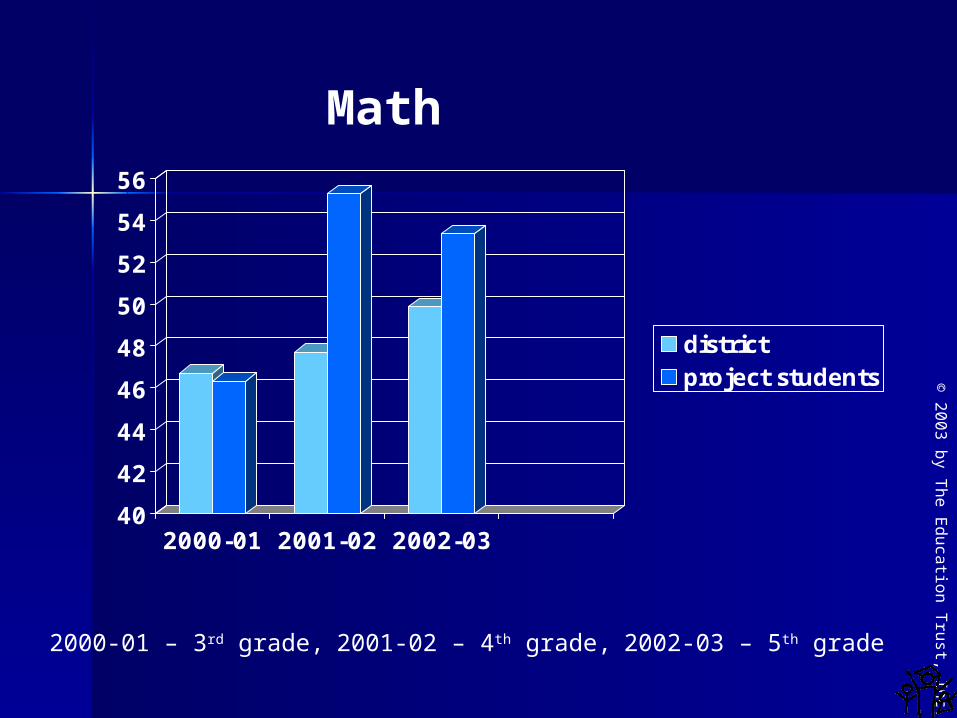
Math
2000-01 – 3rd grade, 2001-02 – 4th grade, 2002-03 – 5th grade

© 2003 by T
he Education T
rust, Inc.
40
42
44
46
48
50
52
54
56
2000-01 2001-02 2002-03
districtproject students
Math
2000-01 – 3rd grade, 2001-02 – 4th grade, 2002-03 – 5th grade

© 2003 by T
he Education T
rust, Inc.
92
93
93
94
94
95
95
96
96
97
2000-01 2001-02 2002-03
districtproject students
Attendance
2000-01 – 3rd grade, 2001-02 – 4th grade, 2002-03 – 5th grade

© 2003 by T
he Education T
rust, Inc.
School Climate ResultsSchool Climate Results
Examples of preliminary gains are as Examples of preliminary gains are as follows:follows:
Teachers reported an increase in Teachers reported an increase in student safety at the project schools. student safety at the project schools. (Source: TUSD School Quality Survey)(Source: TUSD School Quality Survey)
Students responded that students of Students responded that students of different races & ethnic backgrounds different races & ethnic backgrounds are getting along better at their are getting along better at their school. (school. (Source: TUSD School Quality Survey)Source: TUSD School Quality Survey)

© 2003 by T
he Education T
rust, Inc.
Parents indicated an increase in Parents indicated an increase in satisfaction with their school. satisfaction with their school. (Source: (Source: TUSD School Quality Survey)TUSD School Quality Survey)
All Principals indicated increased All Principals indicated increased contact with students and a more contact with students and a more consistent program (in classrooms, consistent program (in classrooms, groups and interventions) with groups and interventions) with increased counseling staff. increased counseling staff. Principals consider the counselor Principals consider the counselor indispensable. indispensable. (Source:(Source: PrincipalPrincipal interviews interviews – March and April 2003)– March and April 2003)

© 2003 by T
he Education T
rust, Inc.
55thth grade students reveal that they grade students reveal that they see positive school changes, have see positive school changes, have gained many academic and personal gained many academic and personal skills from their counselor and have skills from their counselor and have a personal vision that includes a personal vision that includes continuing their education. (continuing their education. (Source: Source: Focus groups conducted in March and April at each Focus groups conducted in March and April at each school2003) school2003) my/03my/03

© 2003 by T
he Education T
rust, Inc.
Principal CommentsPrincipal Comments
Principals saw counselor as the Principals saw counselor as the primary change agent for the school primary change agent for the school
Principals understood how the Principals understood how the counselor can contribute to student counselor can contribute to student achievement achievement
Principals acknowledge that the Principals acknowledge that the school counselor knows every school counselor knows every student and is the soul or heart of the student and is the soul or heart of the school.school.

© 2003 by T
he Education T
rust, Inc.
Minority AP Enrollment in One Minority AP Enrollment in One Jefferson County High School - Jefferson County High School - System FocusedSystem Focused

© 2003 by T
he Education T
rust, Inc.
Results ReportResults Report
How are students different How are students different
as a RESULT of what you do?as a RESULT of what you do?
What does the data tell you?What does the data tell you? Was the program successful?Was the program successful? What worked?What worked? What did NOT work? What did NOT work? What needs to be changed?What needs to be changed?
© 2003 by T
he Education T
rust, Inc.
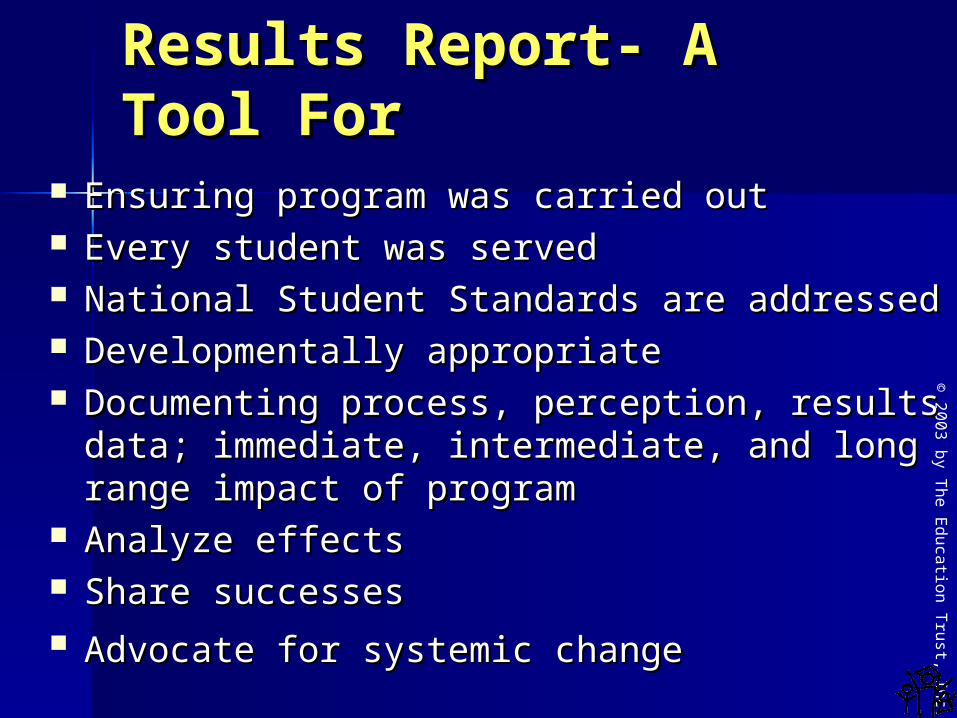
Results Report- A Tool Results Report- A Tool ForFor
Ensuring program was carried outEnsuring program was carried out Every student was servedEvery student was served National Student Standards are addressedNational Student Standards are addressed Developmentally appropriateDevelopmentally appropriate Documenting process, perception, results Documenting process, perception, results
data; immediate, intermediate, and long data; immediate, intermediate, and long range impact of programrange impact of program
Analyze effectsAnalyze effects Share successesShare successes Advocate for systemic changeAdvocate for systemic change

© 2003 by T
he Education T
rust, Inc.
Results Report Results Report ExamplesExamples Guidance Curriculum Results Guidance Curriculum Results
Report, p.118Report, p.118
Closing the Gap Results Report, p. Closing the Gap Results Report, p. 117117

© 2003 by T
he Education T
rust, Inc.
Accountability …Accountability …Getting StartedGetting Started
Use what you are already Use what you are already doing (e.g., small group or doing (e.g., small group or one classroom).one classroom).
Use data that are already Use data that are already being collected such as being collected such as attendance, behavior, grades, attendance, behavior, grades, or other scores.or other scores.
Keep it simple – percent Keep it simple – percent change, pre to post changes.change, pre to post changes.

© 2003 by T
he Education T
rust, Inc.
Accountability …Accountability …Getting StartedGetting Started Show several years of growthShow several years of growth Connect to student standardsConnect to student standards Don’t measure EVERYTHINGDon’t measure EVERYTHING Make decisions based on needs of Make decisions based on needs of
district, site and access to datadistrict, site and access to data Goal is to learn from data, not be Goal is to learn from data, not be
evaluated on dataevaluated on data

© 2003 by T
he Education T
rust, Inc.
We need to “be the change we want to see happen.
We are the leaders we have been waiting for.”
– Gandhi

© 2003 by T
he Education T
rust, Inc.
““Without the possibility Without the possibility of of actionaction, all knowledge , all knowledge comes to one labeled ‘file comes to one labeled ‘file and forget,and forget,
-- Ralph Ellison, -- Ralph Ellison, Invisible ManInvisible Man
and I can neither file nor forget.”

© 2003 by T
he Education T
rust, Inc.
Accountability Accountability SystemSystem
Using Data to Drive School Using Data to Drive School Counseling ActivitiesCounseling Activities
Mark KuranzMark Kuranz, , [email protected]@wi.rr.com
Related Documents