© 2002 Thomson / South-Western Slide 6-1 Chapter 6 Continuous Probabilit y Distributi ons

© 2002 Thomson / South-Western Slide 6-1 Chapter 6 Continuous Probability Distributions.
Dec 23, 2015
Welcome message from author
This document is posted to help you gain knowledge. Please leave a comment to let me know what you think about it! Share it to your friends and learn new things together.
Transcript
© 2002 Thomson / South-Western Slide 6-1
Chapter 6
Continuous Probability
Distributions

© 2002 Thomson / South-Western Slide 6-2
Learning ObjectivesLearning Objectives• Understand concepts of the uniform
distribution.• Appreciate the importance of the normal
distribution.• Recognize normal distribution problems, and
know how to solve them.• Decide when to use the normal distribution to
approximate binomial distribution problems, and know how to work them.
• Decide when to use the exponential distribution to solve problems in business, and know how to work them.
© 2002 Thomson / South-Western Slide 6-3
Uniform DistributionUniform Distribution
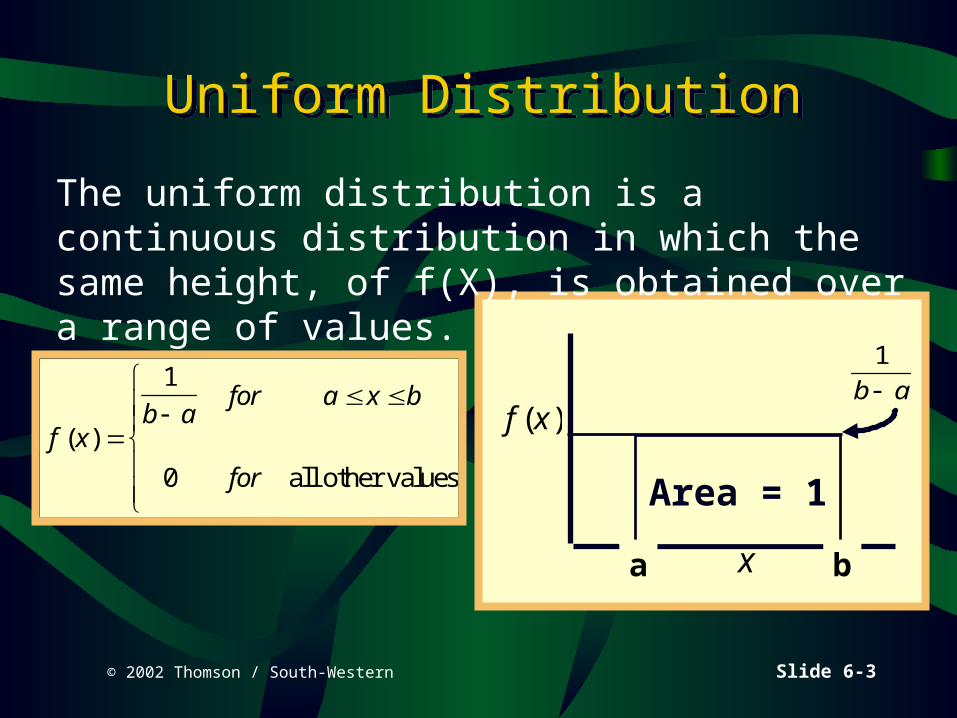
f xb a
for a x b
for
( )
1
0 all other values Area = 1
f x( )
x
1
b a
a b
The uniform distribution is a continuous distribution in which the same height, of f(X), is obtained over a range of values.

© 2002 Thomson / South-Western Slide 6-4
Example: Uniform Distribution of Lot Weights
Example: Uniform Distribution of Lot Weights
f x
for x
for
( )
1
47 4141 47
0 all other values
Area = 1
f x( )
x
1
47 41
1
6
41 47

© 2002 Thomson / South-Western Slide 6-5
Example: Uniform Distribution,continued
Mean and Standard Deviation
Example: Uniform Distribution,continued
Mean and Standard DeviationMean
=+ a b
2
Mean
=+ 41 47
2
88
244
Standard Deviation
b a
12
Standard Deviation
47 41
12
6
3 4641 732
..
© 2002 Thomson / South-Western Slide 6-6
Example: Uniform Distribution Probability, continued
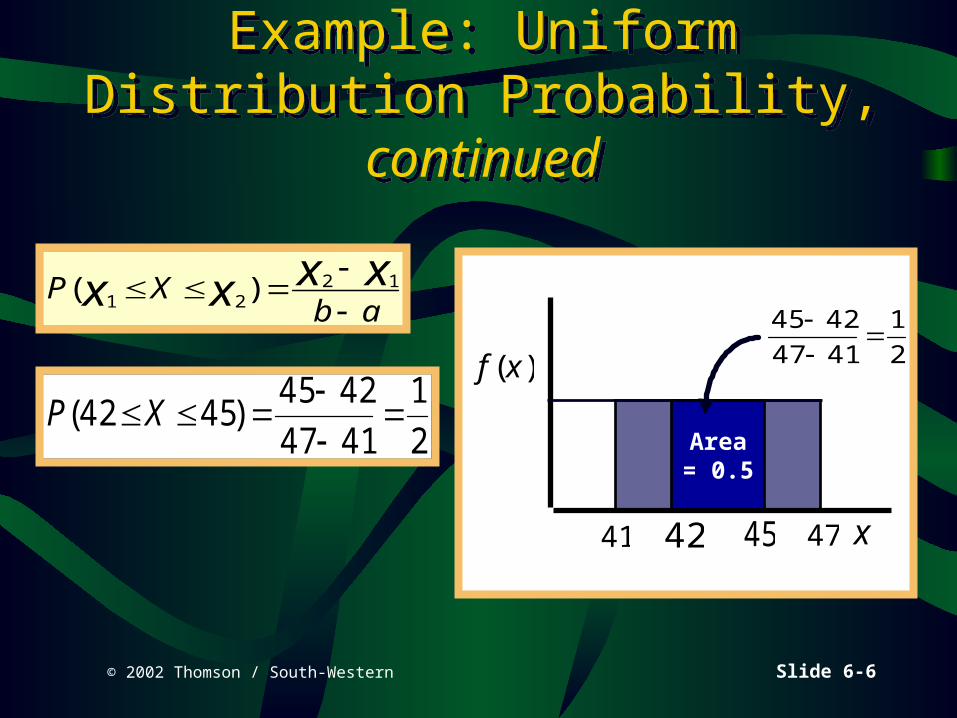
Example: Uniform Distribution Probability, continued
P Xb ax x x x( )1 22 1
f x( )
x41 47
P X( )42 4545 42
47 41
1
2
42 45
45 42
47 41
1
2
Area= 0.5
© 2002 Thomson / South-Western Slide 6-7
The Normal Distribution
• A widely known and much-used distribution that fits the measurements of many human characteristics and most machine-produced items. Many other variable in business and industry are normally distributed.
• The normal distribution and its associated probabilities are an integral part of statistical quality control

© 2002 Thomson / South-Western Slide 6-8
Characteristics of the Normal Distribution
Characteristics of the Normal Distribution
• Continuous distribution• Symmetrical distribution• Asymptotic to the horizontal
axis• Unimodal• A family of curves• Total area under the
curve sums to 1.• Area to right of mean
is 1/2.• Area to left of mean is 1/2.
1/2 1/2
X
© 2002 Thomson / South-Western Slide 6-9
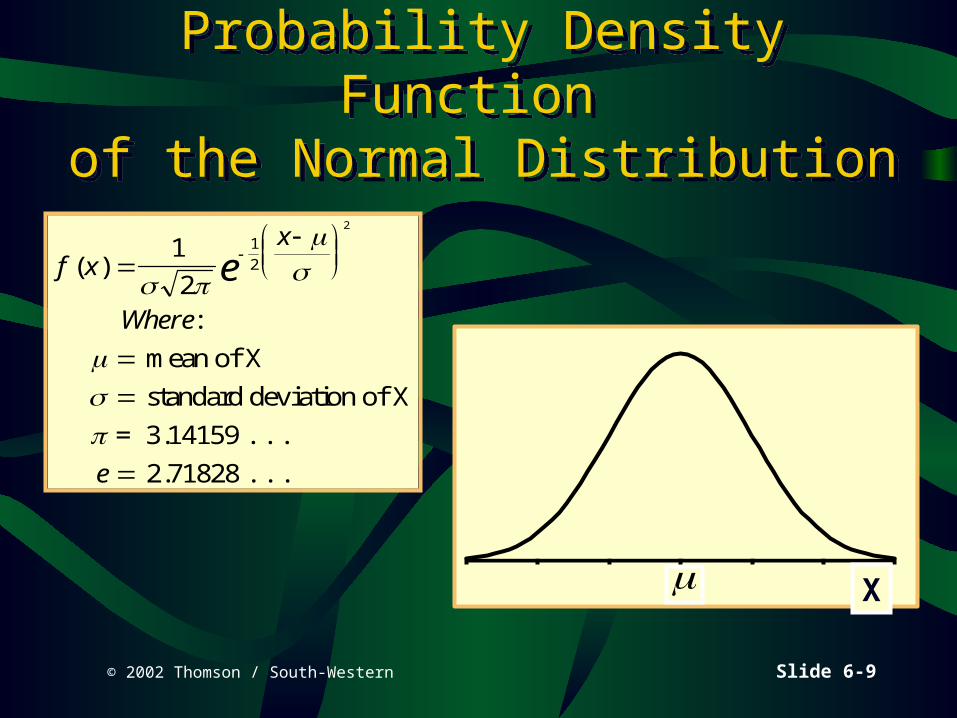
Probability Density Function of the Normal Distribution
Probability Density Function of the Normal Distribution
f xx
Where
e
e( )
:
1
2
1
2
2
mean of X
standard deviation of X
= 3.14159 . . .
2.71828 . . .
X

© 2002 Thomson / South-Western Slide 6-10
Normal Curves for Different Means and Standard Deviations
Normal Curves for Different Means and Standard Deviations
20 30 40 50 60 70 80 90 100 110 120
5 5
10

© 2002 Thomson / South-Western Slide 6-11
Standardized Normal DistributionStandardized Normal Distribution
• A normal distribution with– a mean of zero, and – a standard deviation of
one• Z Formula
– standardizes any normal distribution
• Z Score– computed by the Z
Formula– the number of standard
deviations which a value is away from the mean
ZX
1
0
© 2002 Thomson / South-Western Slide 6-12
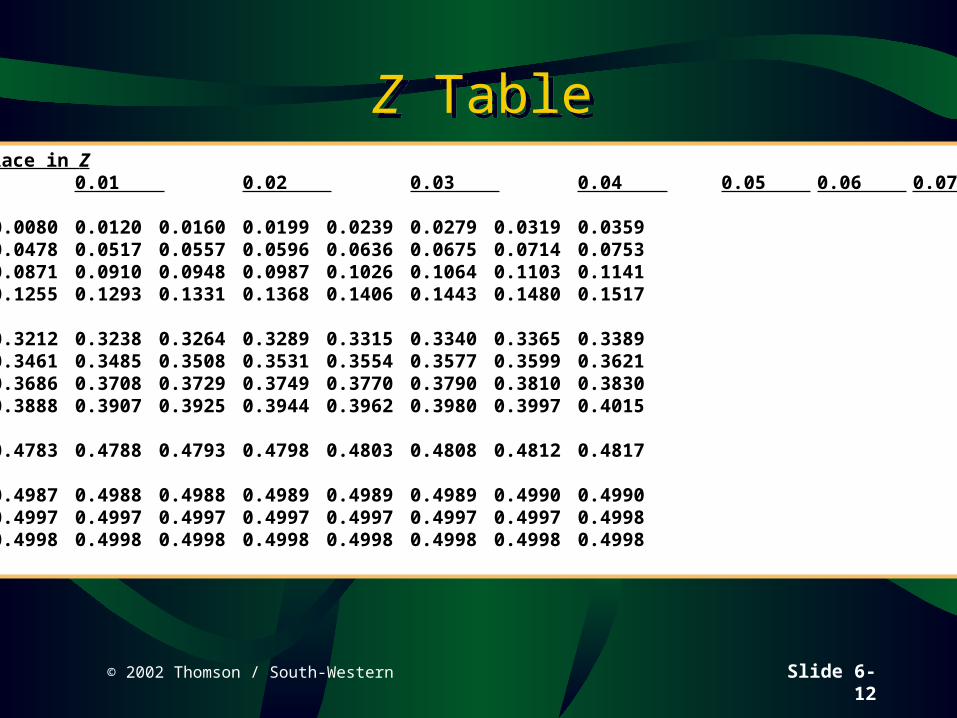
Z TableZ TableSecond Decimal Place in Z
Z 0.00 0.01 0.02 0.03 0.04 0.05 0.06 0.07 0.08 0.09
0.00 0.0000 0.0040 0.0080 0.0120 0.0160 0.0199 0.0239 0.0279 0.0319 0.03590.10 0.0398 0.0438 0.0478 0.0517 0.0557 0.0596 0.0636 0.0675 0.0714 0.07530.20 0.0793 0.0832 0.0871 0.0910 0.0948 0.0987 0.1026 0.1064 0.1103 0.11410.30 0.1179 0.1217 0.1255 0.1293 0.1331 0.1368 0.1406 0.1443 0.1480 0.1517
0.90 0.3159 0.3186 0.3212 0.3238 0.3264 0.3289 0.3315 0.3340 0.3365 0.33891.00 0.3413 0.3438 0.3461 0.3485 0.3508 0.3531 0.3554 0.3577 0.3599 0.36211.10 0.3643 0.3665 0.3686 0.3708 0.3729 0.3749 0.3770 0.3790 0.3810 0.38301.20 0.3849 0.3869 0.3888 0.3907 0.3925 0.3944 0.3962 0.3980 0.3997 0.4015
2.00 0.4772 0.4778 0.4783 0.4788 0.4793 0.4798 0.4803 0.4808 0.4812 0.4817
3.00 0.4987 0.4987 0.4987 0.4988 0.4988 0.4989 0.4989 0.4989 0.4990 0.49903.40 0.4997 0.4997 0.4997 0.4997 0.4997 0.4997 0.4997 0.4997 0.4997 0.49983.50 0.4998 0.4998 0.4998 0.4998 0.4998 0.4998 0.4998 0.4998 0.4998 0.4998
© 2002 Thomson / South-Western Slide 6-13
-3 -2 -1 0 1 2 3
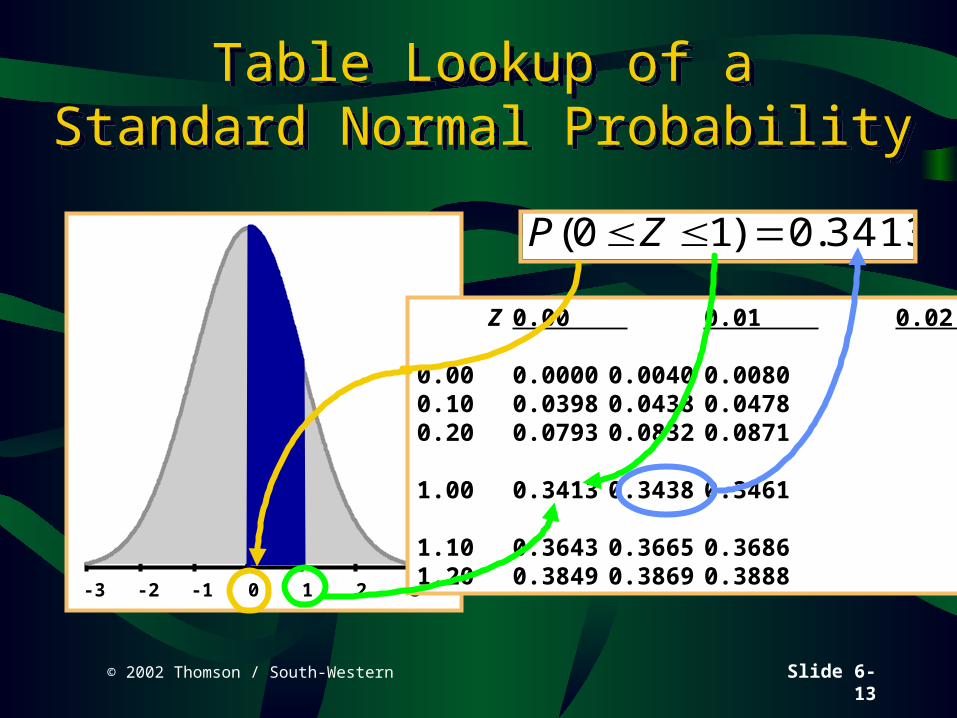
Table Lookup of aStandard Normal Probability
Table Lookup of aStandard Normal Probability
P Z( ) .0 1 0 3413
Z 0.00 0.01 0.02
0.00 0.0000 0.0040 0.00800.10 0.0398 0.0438 0.04780.20 0.0793 0.0832 0.0871
1.00 0.3413 0.3438 0.3461
1.10 0.3643 0.3665 0.36861.20 0.3849 0.3869 0.3888

© 2002 Thomson / South-Western Slide 6-14
Applying the Z Formula: Example, Assume….
Applying the Z Formula: Example, Assume….
X is normally distributed with = 485, and = 105 P X P Z( ) ( . ) .485 600 0 1 10 3643
For X = 485,
Z =X -
485 485
1050
For X = 600,
Z =X -
600 485
1051 10.
Z 0.00 0.01 0.02
0.00 0.0000 0.0040 0.00800.10 0.0398 0.0438 0.0478
1.00 0.3413 0.3438 0.3461
1.10 0.3643 0.3665 0.3686
1.20 0.3849 0.3869 0.3888
© 2002 Thomson / South-Western Slide 6-15
Normal Approximation of the Binomial Distribution
Normal Approximation of the Binomial Distribution
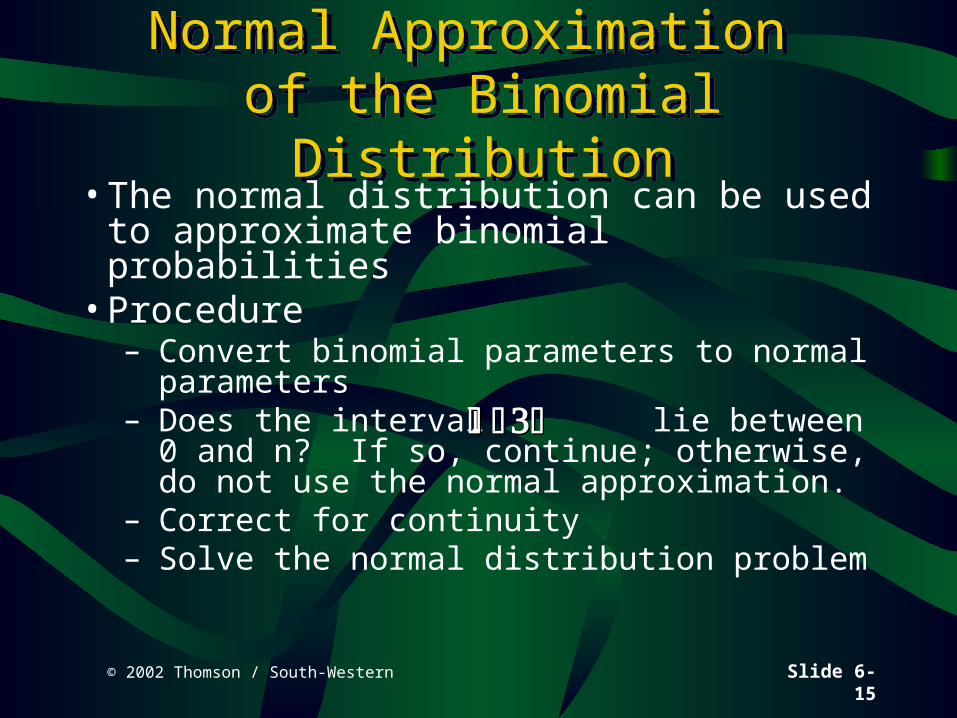
• The normal distribution can be used to approximate binomial probabilities
• Procedure– Convert binomial parameters to normal
parameters– Does the interval lie between 0 and
n? If so, continue; otherwise, do not use the normal approximation.
– Correct for continuity– Solve the normal distribution problem
© 2002 Thomson / South-Western Slide 6-16
Using the Normal Distribution to Work Binomial Distribution Problems
• The normal distribution can be used to approximate the probabilities in binomial distribution problems that involve large values of n.
• To work a binomial problem by the normal distribution requires conversion of the n and p of the binomial distribution to the µ and of the normal distribution.
© 2002 Thomson / South-Western Slide 6-17
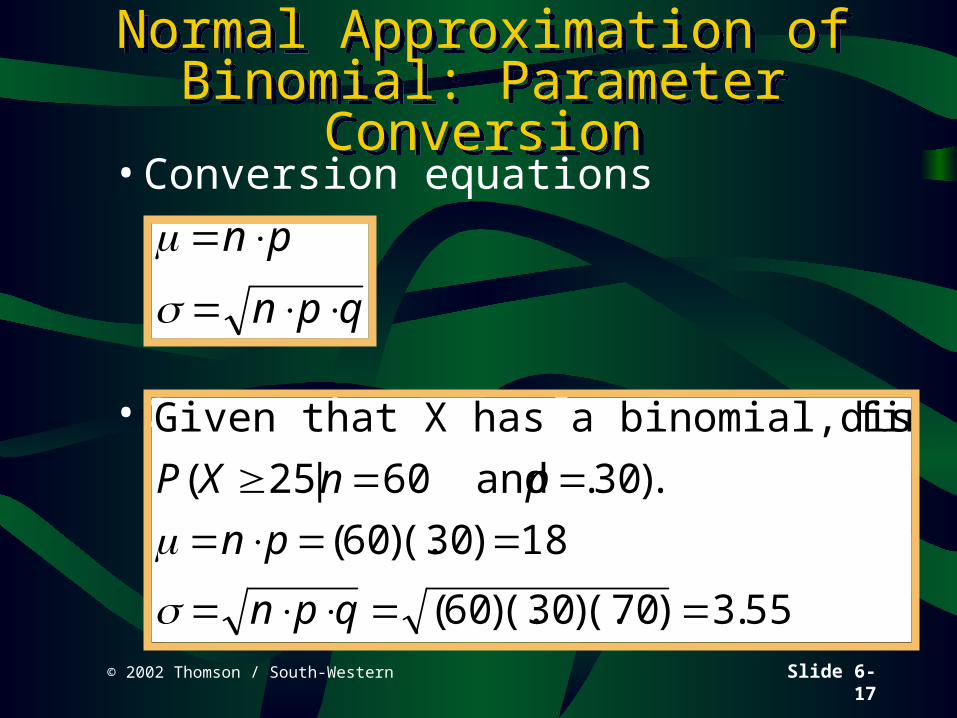
• Conversion equations
• Conversion example:
Normal Approximation of Binomial: Parameter Conversion
Normal Approximation of Binomial: Parameter Conversion
n p
n p q
Given that X has a binomial distribution, find
and P X n p
n p
n p q
( | . ).
( )(. )
( )(. )(. ) .
25 60 30
60 30 18
60 30 70 3 55
© 2002 Thomson / South-Western Slide 6-18
Normal Approximation of Binomial: Interval Check
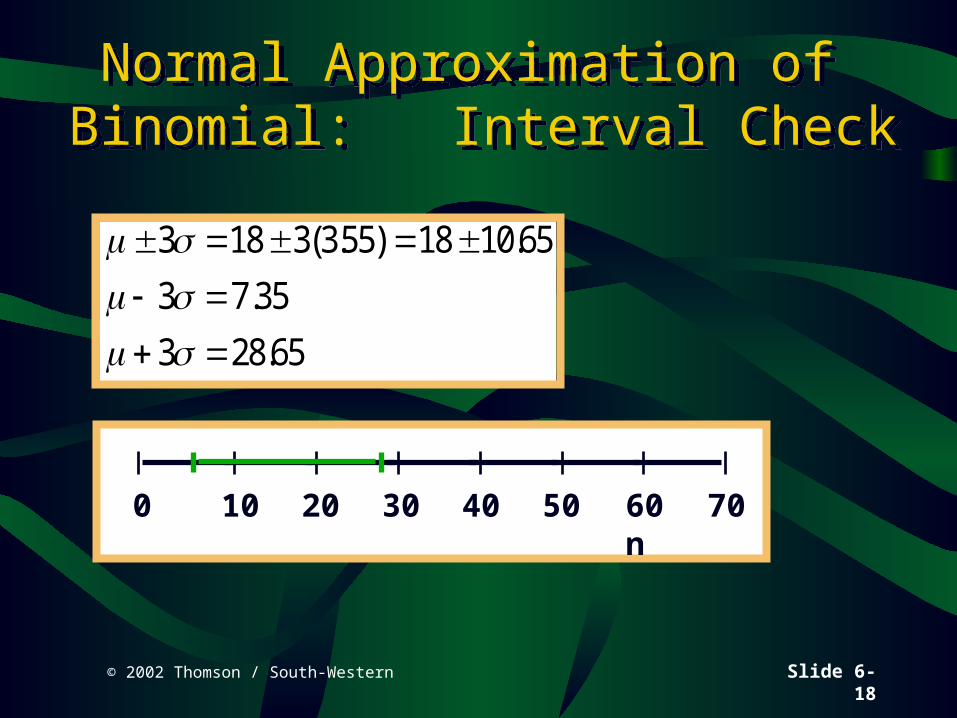
Normal Approximation of Binomial: Interval Check
3 18 3 355 18 10 65
3 7 35
3 28 65
( . ) .
.
.
0 10 20 30 40 50 60n
70

© 2002 Thomson / South-Western Slide 6-19
Normal Approximation of Binomial: Correcting for Continuity
Normal Approximation of Binomial: Correcting for Continuity
Values Being
DeterminedCorrection
XXXXXX
+.50-.50-.50+.05
-.50 and +.50+.50 and -.50
The binomial probability,
and
is approximated by the normal probability
P(X 24.5| and
P X n p( | . )
. ).
25 60 30
18 3 55

© 2002 Thomson / South-Western Slide 6-20
Normal Approximation of Binomial: Graphs
Normal Approximation of Binomial: Graphs
0
0.02
0.04
0.06
0.08
0.10
0.12
6 8 10 12 14 16 18 20 22 24 26 28 30

© 2002 Thomson / South-Western Slide 6-21
Normal Approximation of Binomial: Computations
Normal Approximation of Binomial: Computations
252627282930313233
Total
0.01670.00960.00520.00260.00120.00050.00020.00010.00000.0361
X P(X)
The normal approximation,
P(X 24.5| and
18 355
24 5 18
355
183
5 0 183
5 4664
0336
. )
.
.
( . )
. .
. .
.
P Z
P Z
P Z
© 2002 Thomson / South-Western Slide 6-22
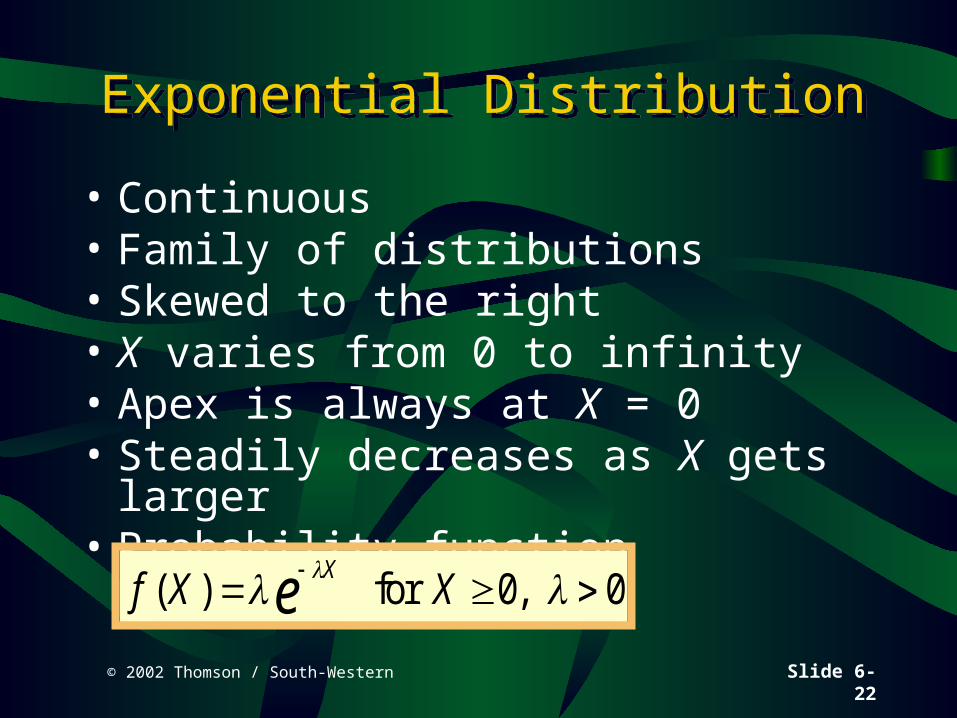
Exponential DistributionExponential Distribution
• Continuous• Family of distributions• Skewed to the right• X varies from 0 to infinity• Apex is always at X = 0• Steadily decreases as X gets larger• Probability function
f X XXe( ) ,
for 0 0

© 2002 Thomson / South-Western Slide 6-23
Graphs of Selected Exponential Distributions
Graphs of Selected Exponential Distributions
0.0
0.2
0.4
0.6
0.8
1.0
1.2
1.4
1.6
1.8
2.0
0 1 2 3 4 5 6 7 8

© 2002 Thomson / South-Western Slide 6-24
Exponential Distribution Example:Probability Computation
Exponential Distribution Example:Probability Computation
0.0
0.2
0.4
0.6
0.8
1.0
1.2
0 1 2 3 4 5
P X X
X
P X
ee
00
2 1212 2
0907
| .( . )( )
.
Related Documents